Article

Macro-Mechanical Property and Microfracture Evolution of Layered Rock Mass: Effects of Confining Pressure and Bedding Direction

1
Sichuan 915 Construction Group Co., Ltd., Meishan 620000, China
2
State Key Laboratory of Deep Earth Exploration and Imaging, College of Construction Engineering, Jilin University, Changchun 130026, China
*
Author to whom correspondence should be addressed.
Appl. Sci. 2025, 15(22), 12178; https://doi.org/10.3390/app152212178
Submission received: 28 September 2025 / Revised: 2 November 2025 / Accepted: 12 November 2025 / Published: 17 November 2025

Abstract

Understanding the mechanical responses of layered rock masses at both macro and micro scales, particularly under diverse confining pressures and bedding directions, is crucial for evaluating their stability and optimizing resource extraction. This study employs PFC2D numerical models, calibrated with laboratory data from Xinjiang Barkol oil shale, to investigate how confining pressure and bedding direction control the mechanical properties of layered rock masses during biaxial compression. The results demonstrate distinct failure modes, shifting from splitting in Per bedding (beddings perpendicular to the loading direction) to shear-tension and shear-slip failures in inclined bedding. A U-shaped distribution of compressive strength across bedding directions is observed, with strength increasing under higher confining pressure. A novel microfracture connection algorithm is proposed to quantify microfracture parameters, such as quantity, length, and angle, shedding light on the complex microfracture evolution mechanisms. Fewer persistent microfractures in Par (i.e., beddings are parallel to the loading direction) and Per beddings explain their higher compressive strength compared to inclined bedding. Additionally, microfracture length evolution demonstrates a shift from brittle to ductile macro-failure as bedding direction changes. Microfractures primarily develop parallel to the loading direction, while confining pressure slightly affects microfracture characteristics. These findings establish a new framework for predicting the behavior of layered rock masses under complex loading, providing theoretical insights and practical guidance for engineering applications.

1. Introduction

Layered rock masses are widely distributed in nature and are characterized by distinct bedding structures that exert strong controls on their mechanical responses and fracture evolution. Among them, oil shale represents a typical example of layered rock mass and has attracted considerable attention as a non-conventional energy resource due to its abundant reserves and substantial oil production potential [1]. In situ conversion mining has emerged as the primary method for oil shale extraction with remarkable advantages in environmental sustainability and cost-effectiveness [2,3]. Efficient in situ conversion mining relies on fractures, which are pathways for fluid migration and product extraction [4]. The pore and fracture systems in oil shale are inadequately formed under natural conditions [5], making it necessary to employ explosion and hydraulic fracturing techniques to create intricate fracture networks [6,7]. The burial depth and bedding directions of layered rock masses, exemplified by oil shale deposits, significantly influence their mechanical behaviors, such as macro-mechanical properties and microfracture evolution. Therefore, systematic investigation of these properties under different confining pressures and bedding directions can provide theoretical foundations for both a fundamental understanding of layered rock masses and the efficient development of oil shale resources.
To investigate the mechanical properties of rock materials, numerous researchers have designed a variety of laboratory experiments, including shear tests, uniaxial/triaxial compression tests, Brazilian splitting tests, and cyclic compression tests [8,9,10,11,12]. These experiments typically employ high-speed cameras or acoustic emission monitoring to observe the deformation and failure processes of rock samples [13,14,15,16]. The two instruments can monitor fracture propagation in the surface of specimens and the damage extent of rock samples, respectively, making them challenging to detect the initiation and growth of internal fractures. Computed Tomography (CT) technology has proven highly effective in addressing the internal fracture monitoring [17] and has been extensively utilized to study fracture dynamics, crack evolution behavior, the probability distribution patterns of fractures, the changes in the microstructure, and the microscopic failure characteristics of rocks [18,19,20,21,22]. A recent study also reported a portable elastomeric touch sensor device that enables surface crack visualization and provides an additional reference for fracture observation methods [23]. However, the mechanical behaviors of layered rock mass are complex, including heterogeneity, anisotropy, and the evolution of microfracture networks, which makes it difficult to fully elucidate their mechanical mechanisms through experimental approaches alone.
Numerical simulations can address the aforementioned challenges by replicating phenomena and processes that are difficult or impossible to observe in laboratory experiments. Therefore, lots of scholars have developed various numerical approaches to simulate rock mechanical behaviors, including continuous medium, discontinuous medium, and combined continuous–discontinuous medium approaches [24,25,26]. Thereinto, a continuous medium approach, such as finite element method (FEM) and finite difference method (FDM), is particularly effective for studying the macro-mechanical properties of rocks [27,28,29]; for example, implementing a 3D ABAQUS model to simulate undrained triaxial test, analyzing the stress–strain response and the impact of temperature on excess pore water pressure. Reference [30] adopted FLAC3D to simulate the true triaxial compression tests, and the result demonstrated that the mechanical property of layered rocks is controlled by a rock matrix and weak surface. Reference [31] established a FLAC3D numerical model with sizes of 70 m × 10 m × 61.5 m, and the stress, displacement, and plastic zone distribution characteristics of rocks were analyzed.
The continuous medium approach faces challenges in accurately representing joints within rocks and often overlooks their substantial influence on the mechanical properties of rock material. Discontinuous medium approach, especially the discrete element method (DEM), is good at simulating the mechanical behaviors of jointed rocks [32,33,34,35]. It can effectively capture crack initiation, propagation, and coalescence and performs well in multi-field analyses, such as seepage and thermo-mechanical coupling [36,37,38]. The aforementioned studies have provided valuable insights into the mechanical properties of jointed rocks. Nevertheless, the majority of research focuses on simplified stress conditions, such as uniaxial compression, and primarily investigate rocks other than oil shale. The role of complex variables, including confining pressure and bedding directions, in shaping the mechanical behavior of oil shale has received limited attention. Moreover, research on microfracture evolution is largely limited to qualitative descriptions [39,40], with insufficient progress in achieving precise quantitative characterization.
This study introduces a method for quantifying microfractures to elucidate their evolution mechanisms in oil shale under different confining pressures and bedding directions. Using Barkol oil shale from Xinjiang as a case study, the physical and mechanical properties were initially analyzed through laboratory experiments. Subsequently, PFC2D was employed to establish a series of biaxial compression models, aimed at examining the macro-mechanical responses of oil shale under various confining pressures and bedding directions. Finally, a Python (Version 3.10.13)-based program was designed to quantitatively characterize key microfracture parameters (including their number, length, and angle) during the compression process, thereby providing insights into the mechanisms governing microfracture initiation and propagation.

2. Material and Testing Results

2.1. Sample Preparation

The tested oil shale, as a typical layered rock mass, was obtained from Barkol mining area in Xinjiang with a seal of paraffin wax. From these samples, rock slices and powder were prepared by cutting and grinding to analyze industrial components, organic elements, oil content, mineral compositions, pyrolysis characteristics, as well as layered structural features. Cylindrical oil shale samples with dimensions of Φ50 × 100 mm were cut along drilling directions parallel (Par) and perpendicular (Per) to beddings for determining uniaxial compressive strength (UCS) and elastic modulus (E). Cubic oil shale samples with dimensions of 100 mm were cut along directions Par to bedding for determining cohesion (c) and internal friction angle (φ).

2.2. Test Results of Physical Properties

The mechanical and physical characteristics of samples are not the primary focus of this paper. Therefore, only the corresponding instruments and results are presented, while specific details regarding the test scheme and process are omitted here.
The GF-8000 Proximate Analyzer (Henan Hebi Wanbo Instrument Co., Ltd., Hebi, China) and the Vario EL Cube Elemental Analyzer (Elementar Analysensysteme GmbH, Frankfurt, Germany) were used to analyze industrial components and organic elements, respectively (Figure 1a,b). The proximate analyzer features a rapid heating rate up to 1000 °C and high automation, ensuring accurate measurements of moisture, ash, and volatiles content. The elemental analyzer allows simultaneous determination of element C, H, N, and S with high precision, even for low organic samples.
The LD-GDW-Q aluminum retort furnace (Henan Hebi Wanbo Instrument Co., Ltd., Hebi, China) was employed to measure physicochemical indicators such as oil content (Figure 1c). The test followed a modified Gray–King retort procedure: samples were air-dried and subsequently heated to 520 °C under oxygen-free conditions, with a temperature-control accuracy within ±5 °C, to determine oil content, total moisture yield, and semi-coke yield.
The Ultima IV X-ray diffractometer (Rigaku Beijing Corp., Beijing, China) was used to determine mineral composition (Figure 1d). The TG 209 F1 Libra thermal analyzer (NETZSCH Gerätebau GmbH, Selb, Germany) was used to investigate pyrolysis characteristics (Figure 1e). The instrument has a maximum temperature of 1100 °C, a balance resolution of 0.1 µg, and a heating-rate range of 0–200 °C/min. The test samples were sieved to <0.2 mm and analyzed from 20 °C to 800 °C.
The results indicated that Barkol oil shale is characterized by high ash, high volatility, and low sulfur and belongs to the high-quality category with an oil content of 11.89% (Table 1). The XRD graph (Figure 2) shows distinct diffraction peaks corresponding to quartz (Q), K-feldspar (Kfs), plagioclase (Pl), pyrite (Py), illite-smectite mixed layer (I/S), kaolinite (K), illite (I), and chlorite (C). The mineral contents were interpreted semi-quantitatively based on the relative peak intensity (counts per second, CPS) of the diffraction spectrum, which is a standard approach for estimating mineral proportions in complex shale samples. The results (Table 1) presented that oil shale is composed of primary minerals (59.8%) and clay minerals (40.2%).
The TG-DTG curve indicates that the pyrolysis process occurs in three phases (Figure 1f): (1) Low-temperature slow mass-loss phase (I, 20~360 °C); (2) medium-temperature severe mass-loss phase (II, 360~530 °C); and (3) high-temperature slow mass-loss phase (III, >530 °C).

2.3. Test Results of Mechanical Properties

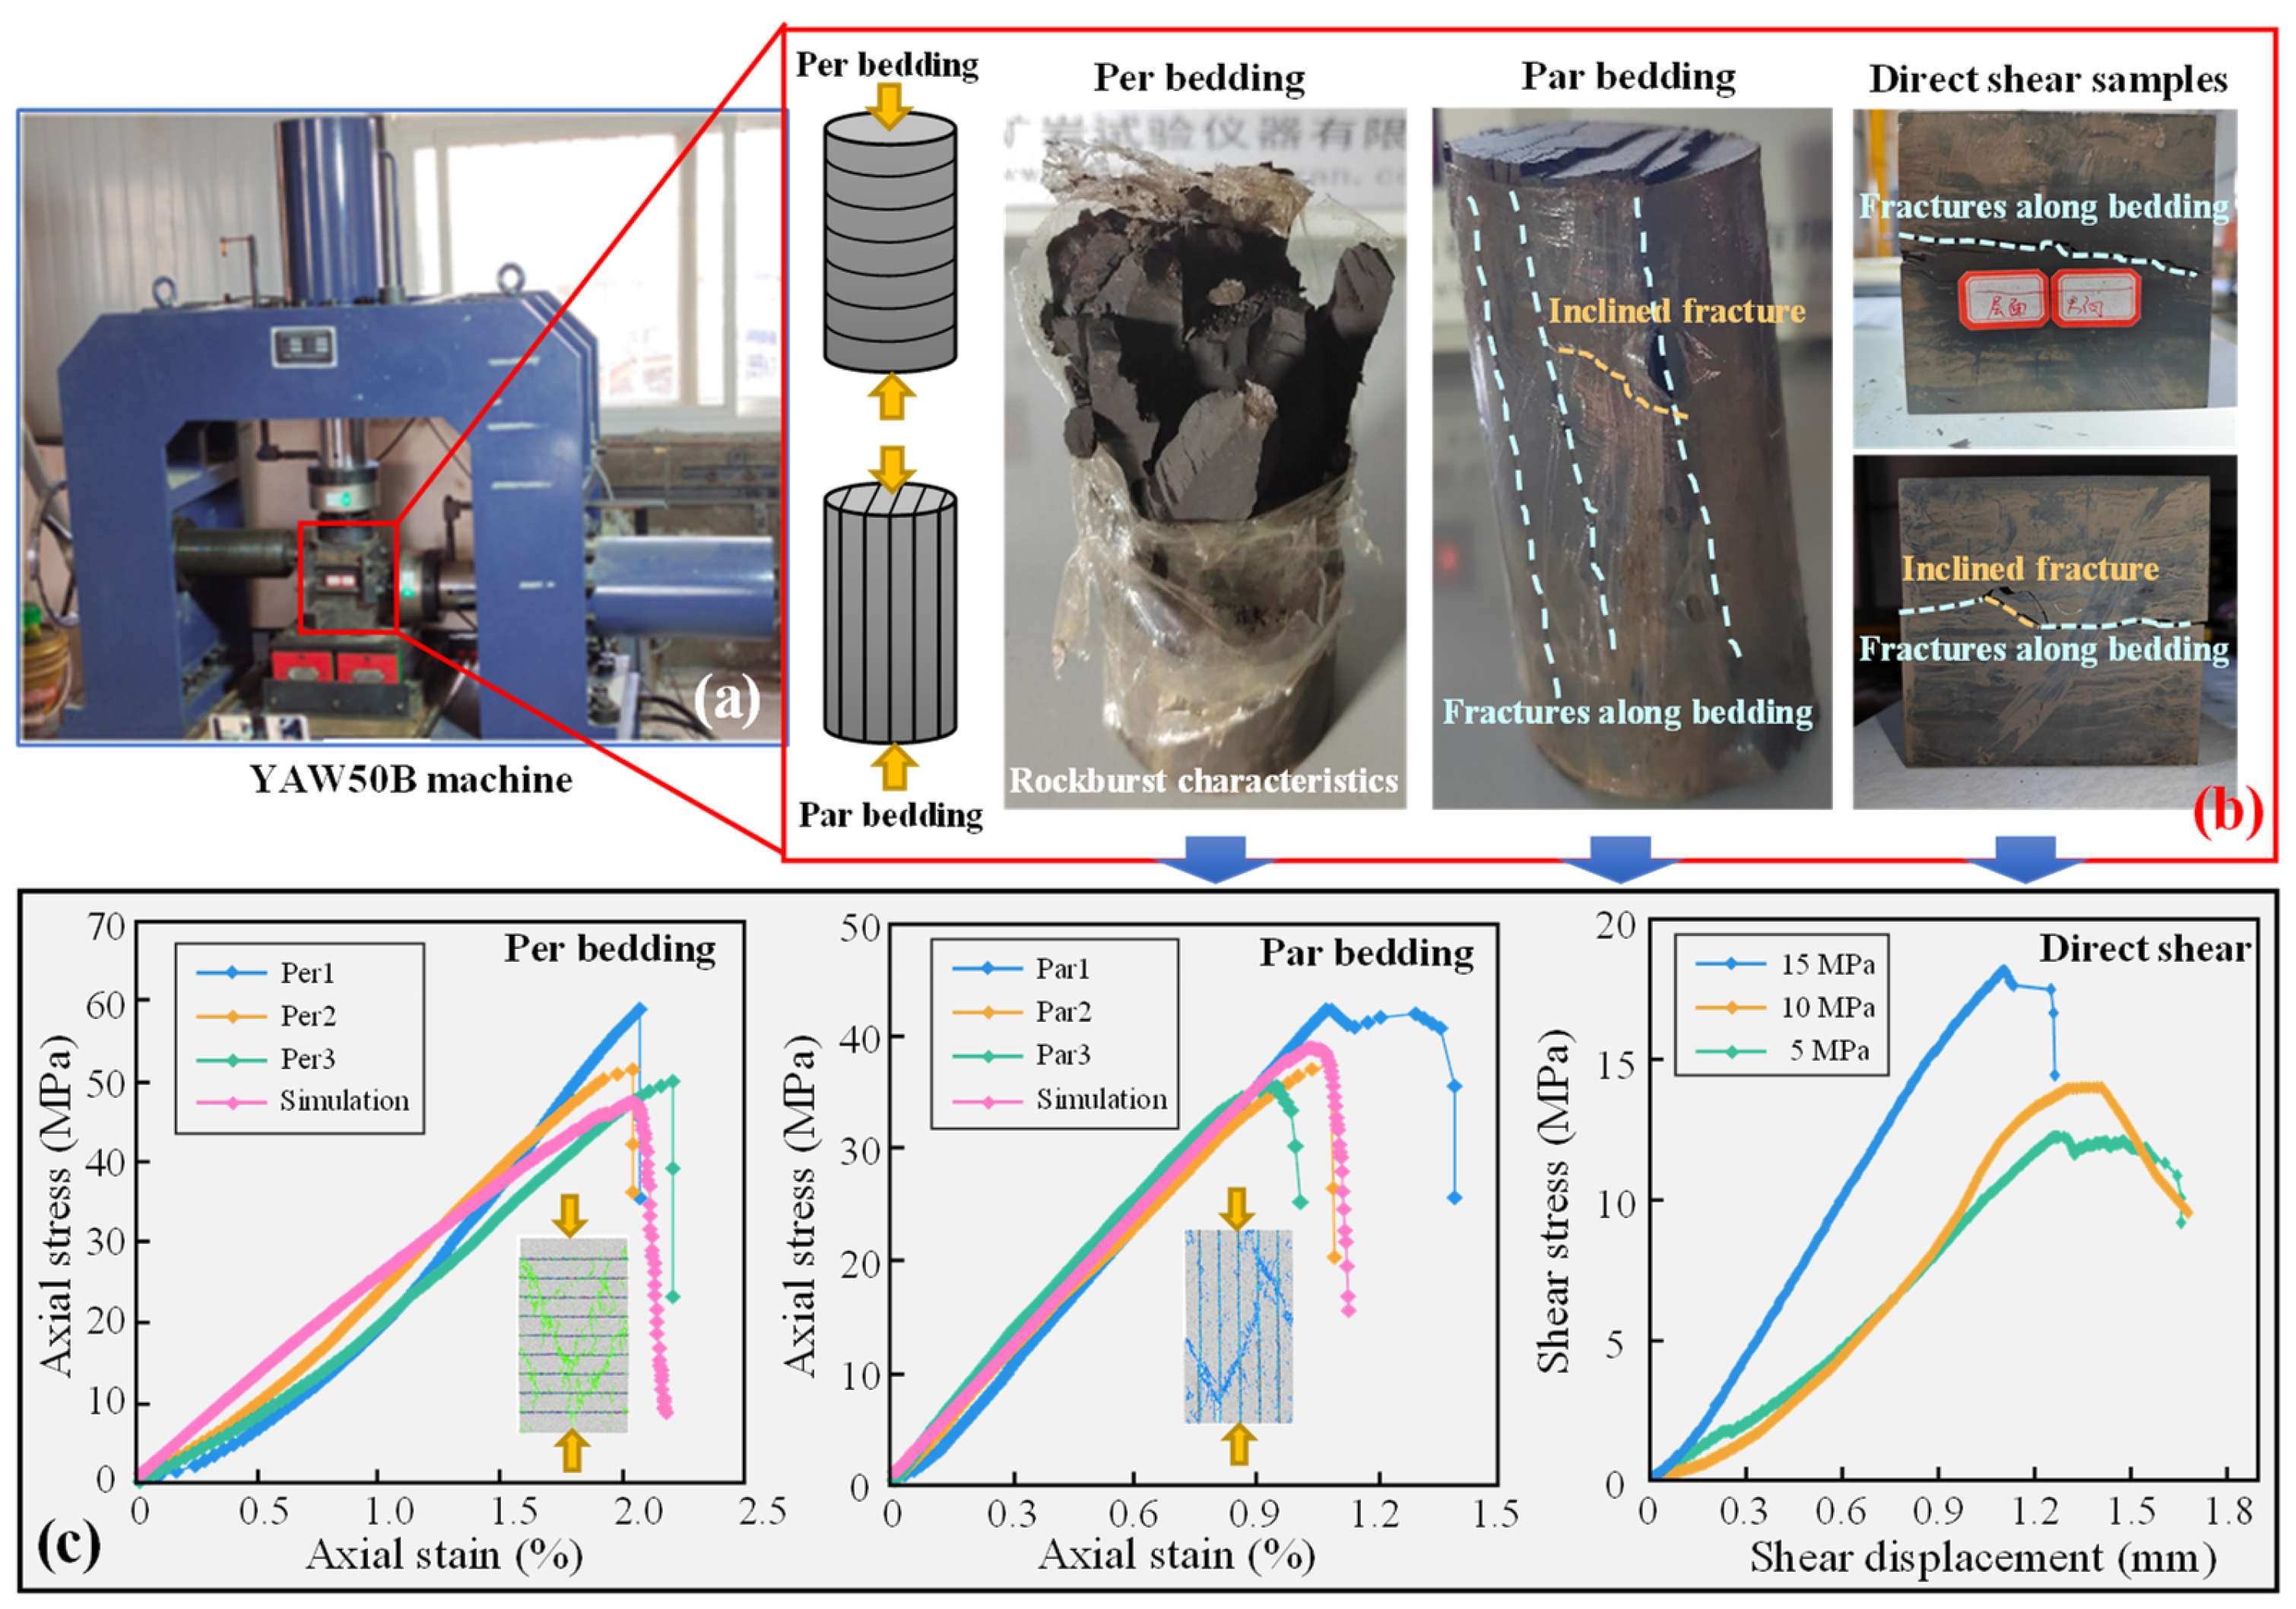
The YAW50B microcomputer-controlled machine (Xiamen Dikun Technology Co., Ltd., Xiamen, China) was employed to carry out the uniaxial compressive and direct shear tests (Figure 3a). The failure of cylindrical samples with loading directions Per to beddings is characterized by rockburst characteristics typical of brittle rocks, involving rapid ejection of numerous fragments (Figure 3b), while samples with loading directions Par to beddings exhibit vertical fractures along bedding direction and inclined fractures intersecting beddings (Figure 3b). Cubic samples experiencing shear failure present irregular fracture propagation, including fractures along beddings and inclined fractures intersecting beddings (Figure 3b).
Figure 3c presents the test curves, and Table 2 summarizes the corresponding mechanical parameters. The results indicated that the UCS of oil shale with Par beddings (38.35 MPa) is considerably lower than that with Per beddings (53.3 MPa), while E presents a contrasting result (3.519 GPa and 2.514 GPa for Par and Per beddings, respectively). According to the Mohr–Coulomb criterion, φ and c of Barkol oil shale is estimated as 30.6° and 8.88 MPa based on the shear stress–displacement curves in Figure 3c.

3. Macro-Mechanical Property of Layered Rock Mass Based on Numerical Simulation

3.1. Layered Rock Mass Model Construction

The efficient in situ pyrolysis extraction relies on the intricate network of seepage channels formed by propagated fractures induced through hydraulic fracturing. Studying the fracture propagation mechanism under varying confining pressures can offer valuable theoretical insights for the environmentally friendly and efficient exploitation of layered rock masses such as oil shale at different depths. Furthermore, weakened bedding planes in layered rock mass enhance the likelihood of fractures propagating along them, as exemplified by the failure observed in the Par bedding of oil shale during the uniaxial compressive test (UCT) in Figure 3b. Therefore, investigating the evolution of macro-mechanical properties and microfracture development under varying confining pressures and bedding directions is essential.
The random distribution of geological flaws makes it challenging to preserve the consistency of drilled layered rock mass samples. Numerical simulation technology thus provides a more appropriate approach, ensuring the identical representation of oil shale models as a typical case of layered rock mass. Specifically, the present study employs PFC2D (Particle Flow Code in Two Dimensions, Version 5.0; Itasca Consulting Group Inc., Minneapolis, MN, USA) software, a 2D DEM program, to construct the layered rock mass model and to investigate its mechanical behaviors.

3.1.1. Parallel Bond Model of Rock Material

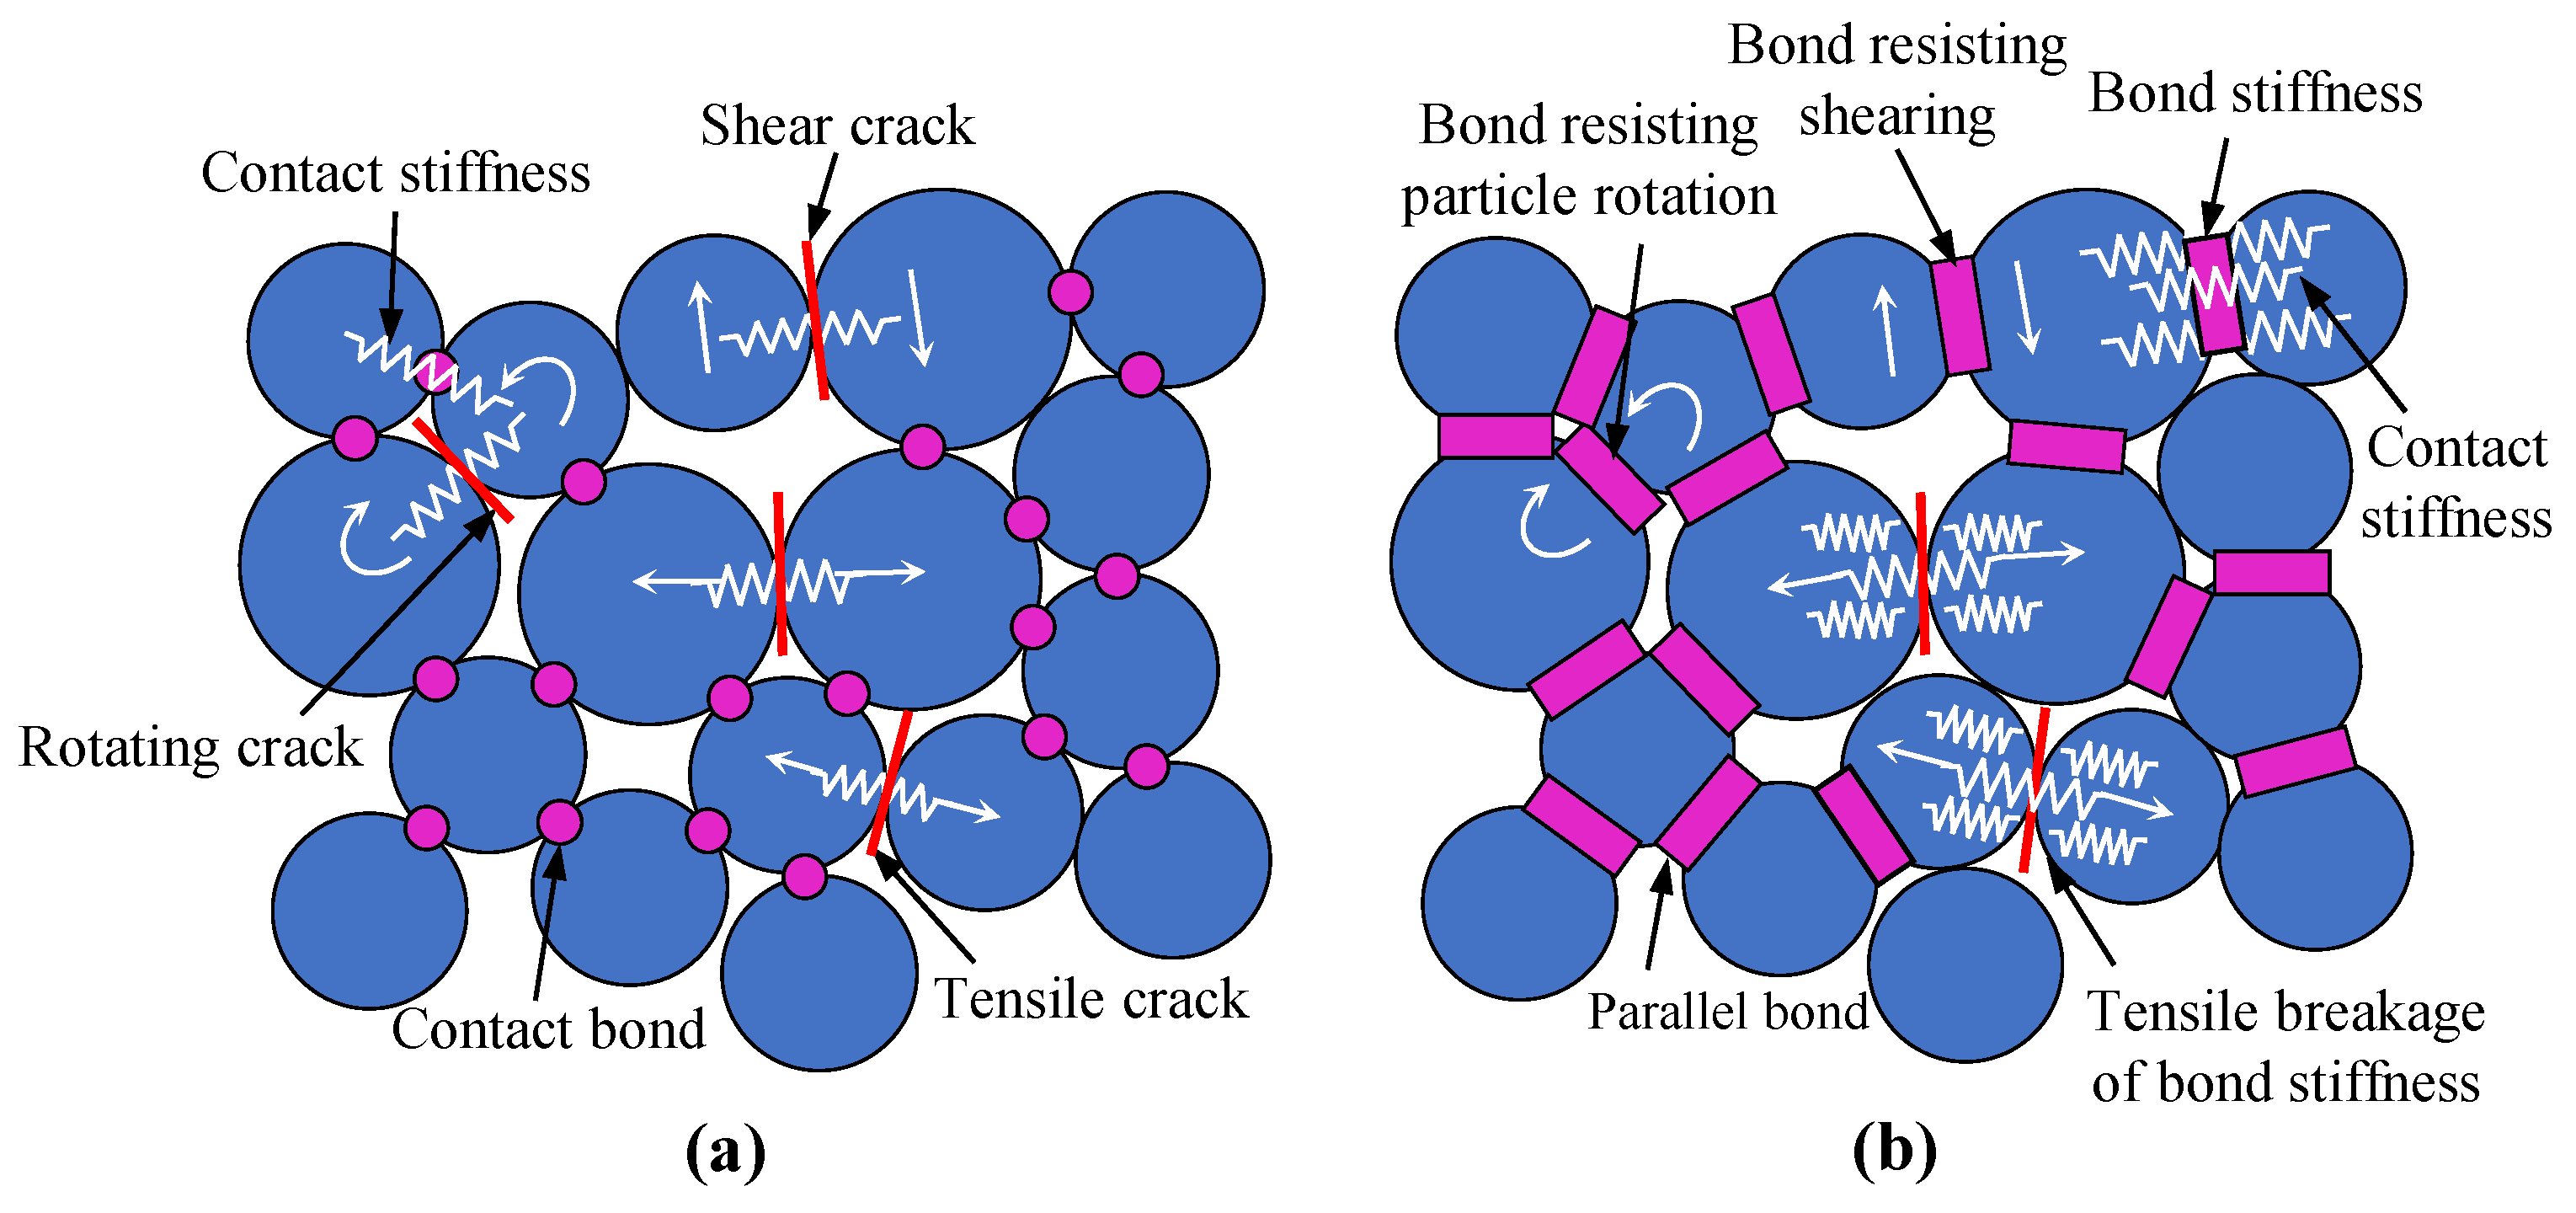
In PFC, a bonded-particle model (BPM) [41] is employed to replicate intact rock behavior, with material failure explicitly characterized by bond rupture between particles. The BPM encompasses two primary models: the contact bond model (CBM, Figure 4a) and the parallel bond model (PBM, Figure 3b) [42,43]. The CBM conceptualizes bonds as linear springs with fixed normal and shear stiffness, whereas the PBM mimics the mechanical behavior of cement-like materials bridging adjacent particles. A key distinction lies in their capacity to resist rotational moments: while CBM lacks such resistance, PBM inherently counteracts moments induced by particle rotation. In CBM, contact stiffness persists despite bond rupture provided that particles remain in contact, resulting in negligible macroscopic stiffness reduction. Conversely, both contact and bond stiffness affect the stiffness of PBM, leading to an immediate decrease in macroscopic stiffness upon bond rupture. From the above differences, PBM more accurately captures the stiffness reduction associated with tensile or shear-induced bond failure in rock materials. Consequently, this study adopted the PBM to construct the rock matrix of layered oil shale.
The PBM is actually the microscopic constitutive model for representing the contact of particles and its parameters, where its micro-parameters critically govern the macro-mechanical responses of the rock matrix. However, these micro-parameters cannot be directly measured through laboratory tests, necessitating an iterative calibration process based on parameter inversion to establish their values. Specifically, the numerical UCTs are designed to encompass both Per and Par bedding of layered rock mass, in accordance with the laboratory tests. Notably, the generation of beddings will be introduced in the next section followed by the calibration process.

3.1.2. Generation of Beddings

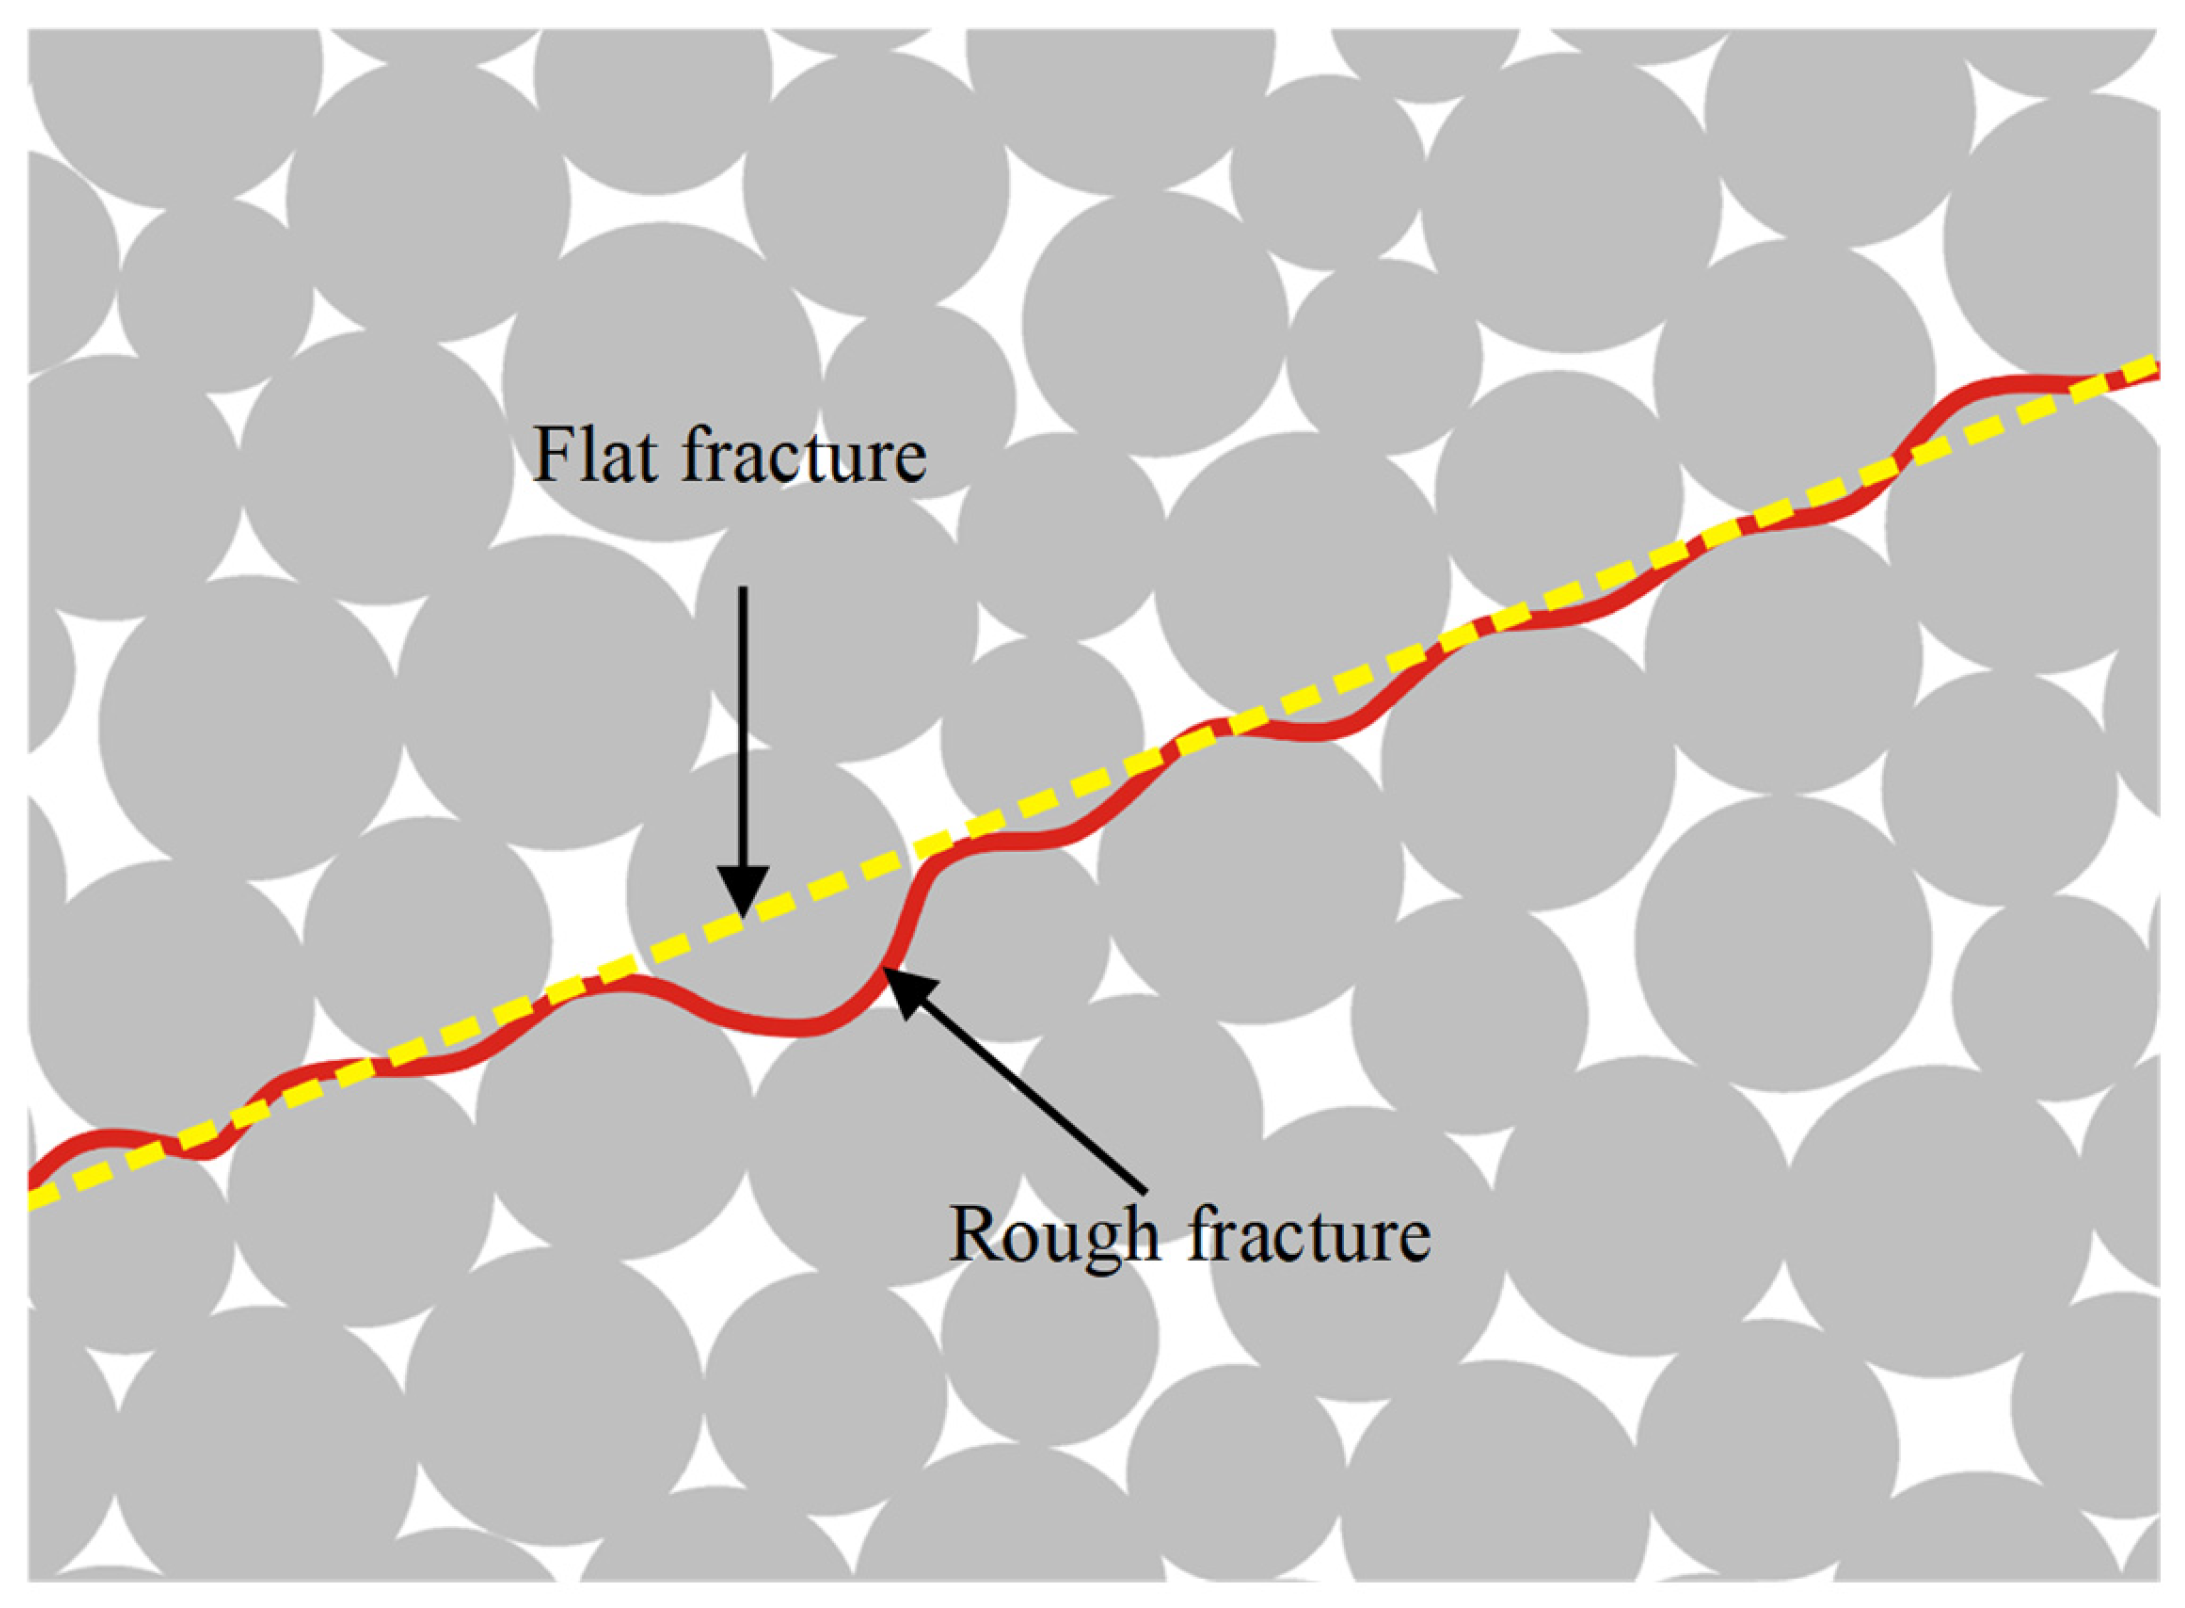
Discontinuities are typically modeled through two approaches. The first involves reducing or eliminating bond strength between particles along the discontinuity plane using a weakened PBM, intentionally creating a zone where bond strength is substantially lower than in the surrounding rock matrix. This strength reduction enables particle sliding and separation along the discontinuity plane. The second approach employs the smooth-joint contact model (SJM), which can pass through particles and allow for particle overlap and sliding across both sides of the discontinuity plane [44,45]. However, SJM is limited in accurately simulating the mechanical behavior of beddings in layered rock masses, since these beddings are formed by layered arrangements of mineral particles rather than a flat discontinuity plane. The SJM allows smooth sliding between particles along a predefined plane, producing an idealized flat fracture surface where particles can overlap and pass through each other. In contrast, the weakened PBM reduces bond strength between contacting particles to form a fracture that propagates around particle edges, resulting in a rougher fracture surface. This roughness may cause slight dilatancy and a minor increase in shear strength but better reflects the natural interparticle characteristics of oil shale beddings. The conceptual distinction between these two models is illustrated in Figure 5. For oil shale, as a typical layered rock mass, this structural characteristic makes direct representation particularly challenging. In contrast, the macroscopic failure pattern and anisotropy characteristics of the numerical model constructed by the weakened PBM are highly consistent with the laboratory test. Thus, employing a weakened PBM to represent the beddings of layered rock masses, exemplified by oil shale, offers a more appropriate approach.
Bedding spacing is a key factor that substantially affects the mechanical behavior of layered rock mass models at both macro and micro scales. However, the actual spacing is extremely small, typically within several millimeters, which exceeds the computational capabilities of PFC2D models. Most PFC2D models can only handle one hundred thousand particles, whose sizes are considerably larger than the actual mineral particles. Consequently, there is an insufficient quantity of particles representing the interbedded regions in these models, leading to simulation distortions and reduced model accuracy. A bedding spacing of 10 mm is considered appropriate for numerical model with dimensions of Φ50 × 100 mm, as it aligns with the typical scale of beddings observed in oil shale formations and ensures a balance between computational efficiency and model accuracy. This choice also matches common laboratory practice for Φ50 × 100 mm layered specimens (e.g., fixed spacings around 10–20 mm), and prior studies show that, within such practical ranges, layer thickness (spacing) has a limited effect on the macroscopic strength trends compared with bedding direction [46,47].
The micro-parameters of both the rock matrix and beddings are calibrated. First, multiple sets of micro-parameters of PBM for rock matrix are assigned, and the stiffness and strength micro-parameters in beddings should be estimated by the reduction of those of PBM. Thereinto, the reduction coefficients for stiffness and strength are set to 0.08 and 0.1, respectively [48]. Then, micro-parameters of PBM are continuously adjusted to ensure a close alignment between numerical simulation data and laboratory test findings. The determined micro-parameters are provided in Table 3, with the corresponding stress–strain relationships and failure characteristics from numerical UCT shown in Figure 3c. The detailed calibration process falls beyond the scope of this study and can be found in other relevant literature [49,50].

3.1.3. Model Setup

To explore the mechanical responses and fracture propagation characteristics of layered rock mass under diverse confining pressures and bedding directions, a series of numerical models are established which apply the aforementioned model and micro-parameters. The dimensions of the model are Φ50 × 100 mm, the same as those of the calibration model. The minimum diameter of rock particles is 0.16 mm, with a maximum-to-minimum particle size ratio fixed at 1.5. Finally, the number of particles reaches 35335, as shown in Figure 6. To ensure repeatability, all numerical models were generated using the same random seed (random 10,001) in PFC2D, with fixed particle size range and density parameters. This guarantees that the particle arrangement and microstructural characteristics of each model are identical across repeated generations. Consequently, the results presented for each condition correspond to a deterministic model configuration, and repeated simulations would yield identical outcomes.
When the bedding spacing was set to 10 mm, both the simulated and experimental results demonstrated a high degree of consistency in mechanical response and failure characteristics (Figure 3b,c). The stress–strain curves obtained from PFC2D closely matched those from laboratory UCTs in terms of slope and peak strength, confirming the reliability of the calibrated micro-parameters. Moreover, the fracture morphology observed in the numerical models reproduced the main fracture traces and orientations identified in laboratory specimens, validating the accuracy of the modeled bedding representation. Therefore, the calibrated parameters were adopted for subsequent simulations of layered rock masses with different bedding directions.
To comprehensively evaluate anisotropy, five bedding directions are analyzed, including Per bedding, 30°, 45°, 60°, and Par bedding (indicated in green in Figure 6). Additionally, five confining pressure conditions, i.e., 0 MPa (uniaxial), 5 MPa, 10 MPa, 15 MPa, and 20 MPa, are systematically investigated. This experimental design generates 25 configurations (5 × 5), with UCTs conducted at 0 MPa and biaxial compression tests performed under the remaining four confining pressures.

3.2. Macro-Mechanical Properties

3.2.1. Macroscopic Failure Pattern

The macroscopic failure of layered rock mass under different confining pressures and bedding directions is displayed in Figure 7. For Per bedding, layered rock mass primarily exhibits splitting failure that penetrates through the bedding (Figure 7a). Under conditions of zero confining pressure (0 MPa), two prominent failure fractures that penetrate through the bedding emerge from the bottom to both sides of the model, displaying a typical V-shaped shear failure. Additionally, the lateral displacement was significant under unconfined conditions. At a confining pressure of 5 MPa, the fracture obliquely penetrates through the bedding from the top and propagates to the bottom, showing the characteristics of conjugated shear failure. After the confining pressure exceeds 10 MPa, the fracture morphology remains basically consistent and always propagates from the top and bottom to the middle. This phenomenon suggests that the development and propagation of the fracture become stable once the confining pressure exceeds a specific threshold.
When the bedding direction is 30°, some fractures develop along the bedding, while others penetrate through them (Figure 7b). Under conditions of zero confining pressure, fractures initiate and propagate along the bedding; concurrently, several splitting fractures that do not penetrate through the bedding develop. When confining pressure is applied, the fracture morphology significantly changes. Besides fractures developing along the bedding, new fractures in the rock matrix also initiate and extend toward the bedding. The initiation points of these fractures vary with confining pressure, while the propagation direction shifts from the loading direction to the direction perpendicular to the bedding.
When the bedding directions are 45° and 60°, fractures predominantly develop along the bedding with only a few fractures developing in the rock matrix (Figure 7c,d). Under conditions of zero confining pressure, fractures develop along the bedding, leading to slip failure with significant displacement. Fractures initiate in the rock matrix after the confining pressure is applied. Thereinto, for a bedding direction of 45°, fractures predominantly concentrate in the central region of the model under low confining pressure (5 MPa and 10 MPa) while fractures penetrating through the bedding develop in the upper left of the model under high confining pressures (15 MPa and 20 MPa). When the bedding direction is 60°, the area between the bedding at the top of the sample exhibits significant fragmentation.
For Par bedding, fractures develop along the bedding and simultaneously penetrate through them. The layered rock mass model consistently exhibits tensile failure characterized by numerous vertical fractures along the bedding and several inclined fractures intersecting the bedding, both with and without confining pressure. With increasing confining pressure, the number of fractures along the bedding decreases, and lateral deformation is relatively minimal, with clear evidence of tensile failure.
From the analysis above, the failure characteristics of layered rock mass are influenced by both bedding directions and confining pressure. For Per bedding, the predominant failure characteristic is splitting, primarily governed by the rock matrix. For bedding directions of 30°, 45°, and 60°, the failure patterns shift to shear-tensile failure and shear-slip failure, which are influenced by both the bedding and rock matrix (30°) or predominantly bedding (45° and 60°). For Par bedding, obvious tensile failure occurs with numerous fractures developing either along or at an angle to the bedding, influenced by both the bedding and rock matrix.

3.2.2. Stress–Strain Characteristics

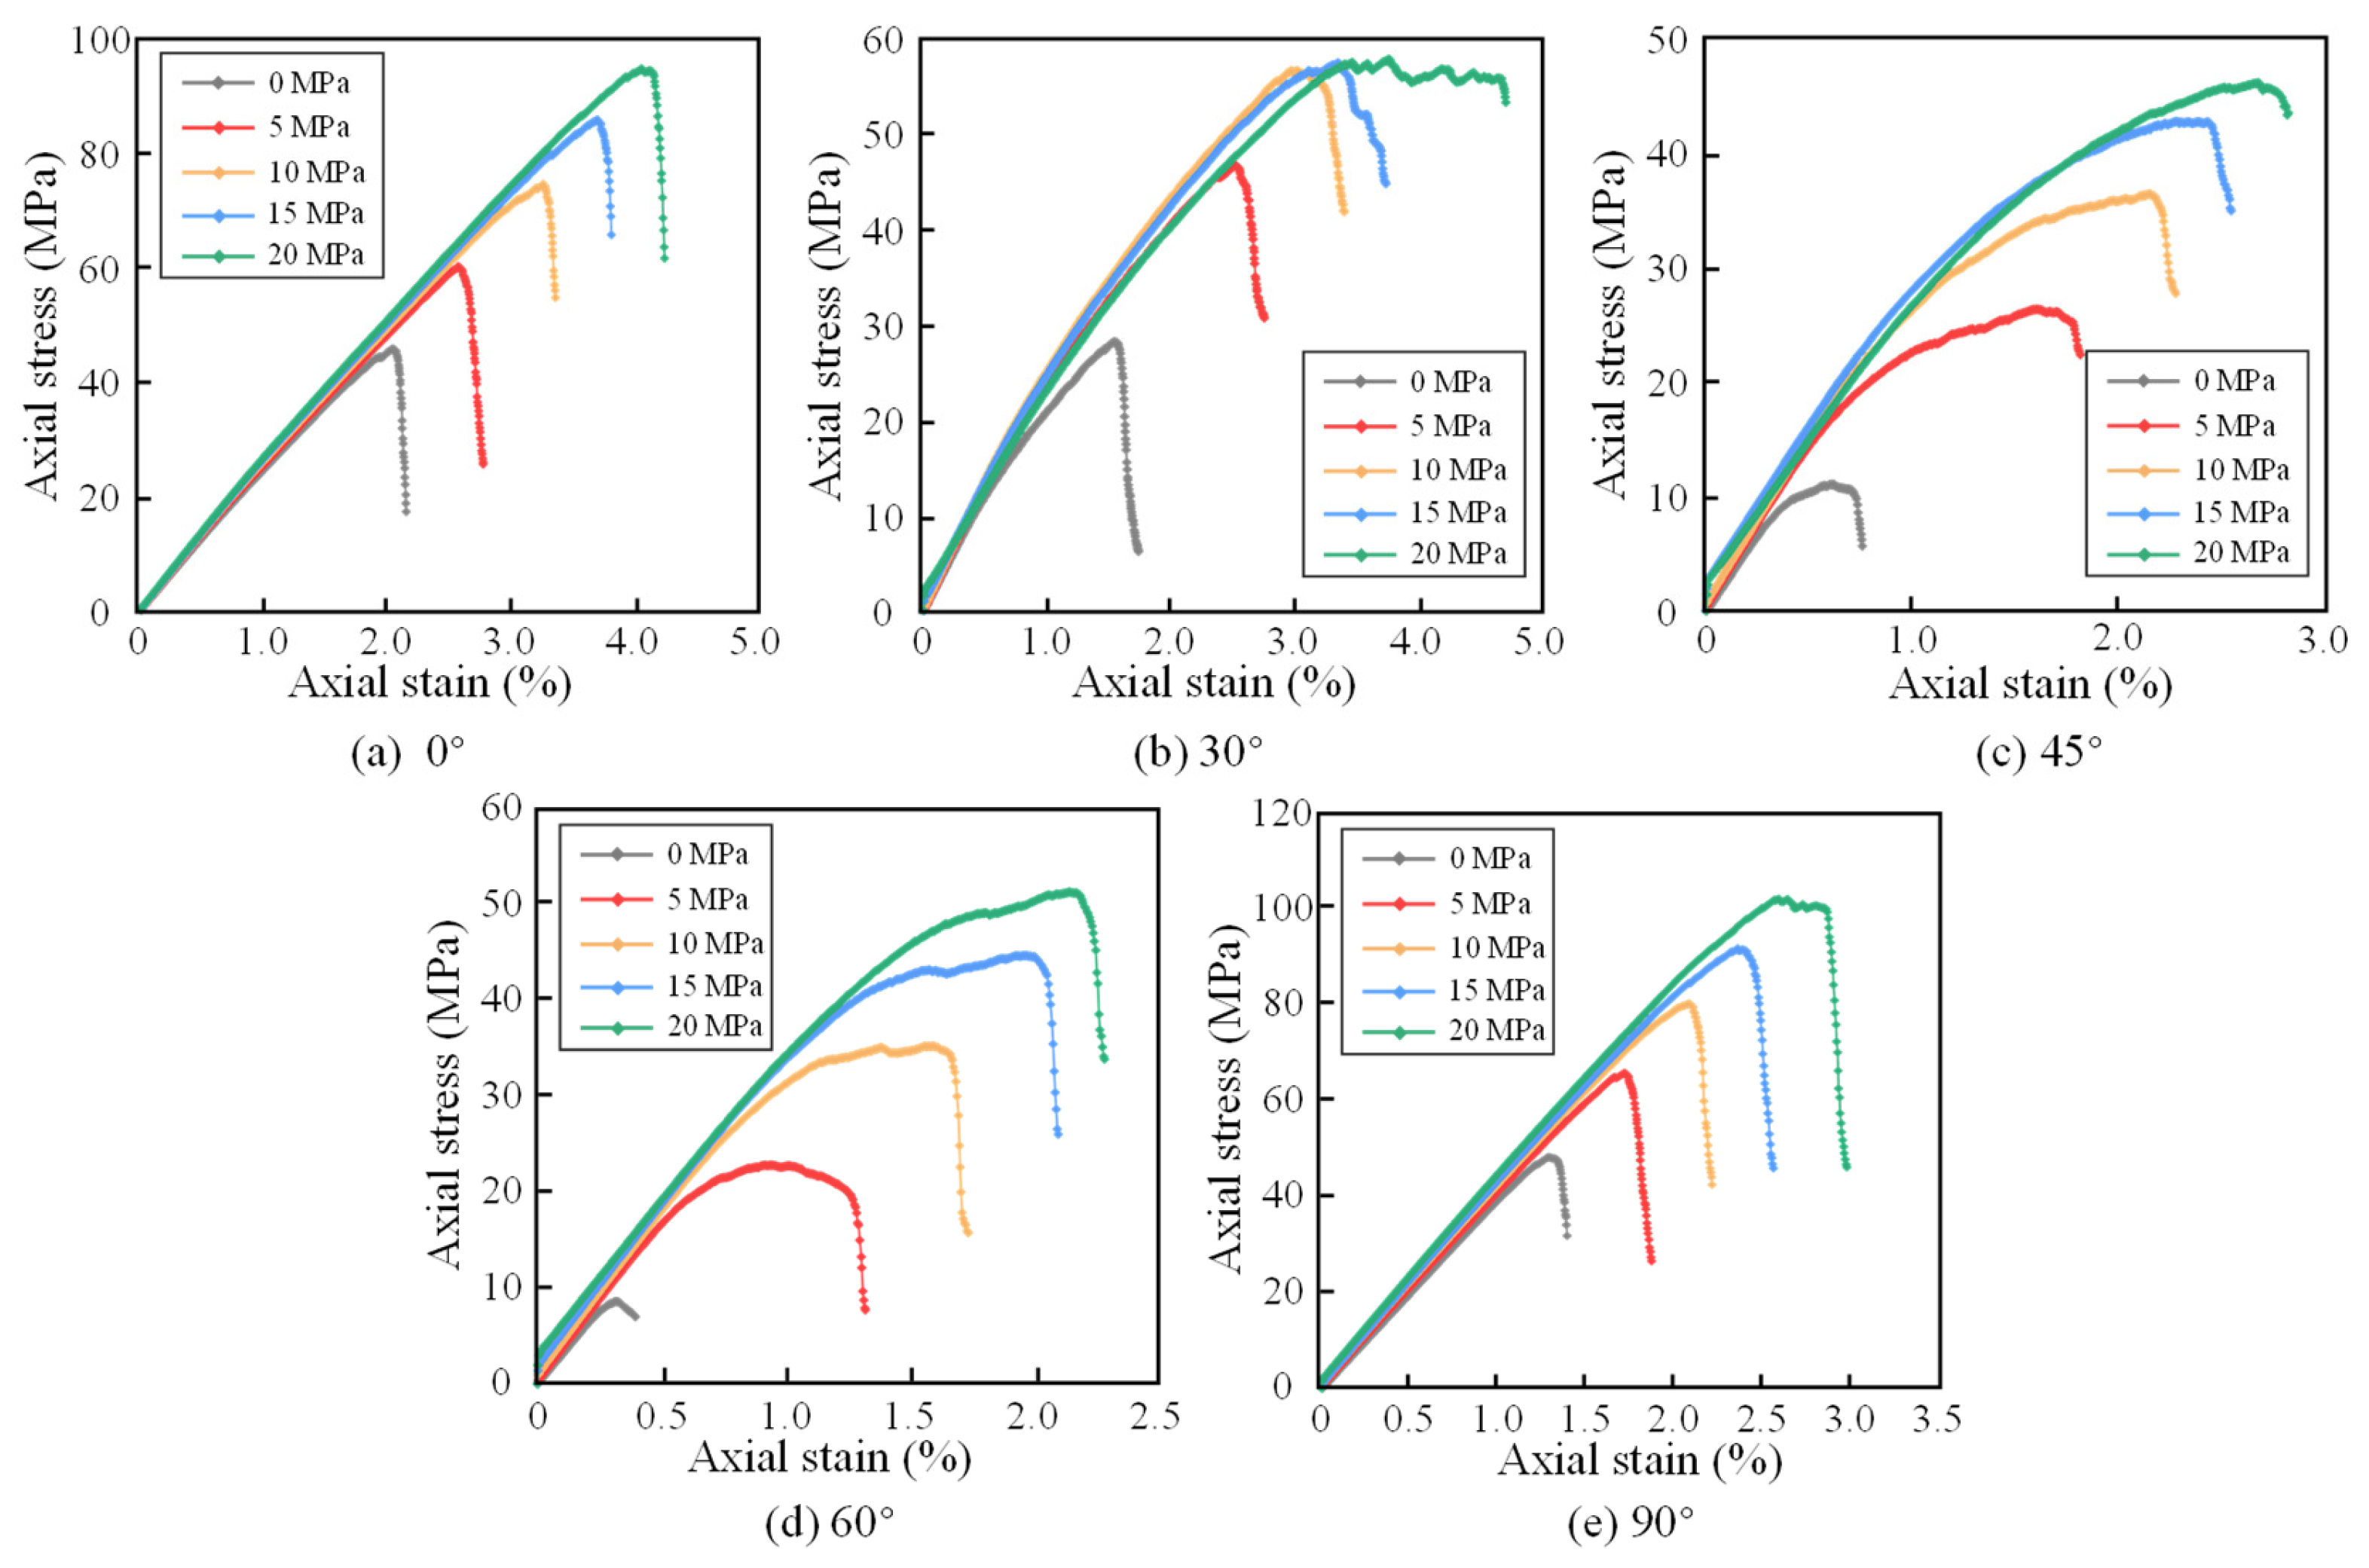
The stress–strain relationships of the layered rock mass models are presented in Figure 8. For Per bedding and Par bedding (Figure 8a,e), the curves are characterized by an approximately linear deformation, and the model will quickly fail after the stress reaches the maximum compressive strength, showing obvious brittle failure characteristics. This phenomenon suggests that the development of microfracture shows relatively stable behavior in terms of fracture propagation rate and distribution throughout the deformation process and layered rock mass exhibits characteristics typical of brittle rock under the confining pressure.
For bedding directions of 30°, 45°, and 60° (Figure 8b–d), the model continues to exhibit residual strength after reaching peak compressive stress, demonstrating ductile failure characteristics. Furthermore, the stress–strain curves exhibit fluctuations prior to failure, suggesting that the rock’s damage does not directly occur. Rather, the global failure of the layered rock mass arises from the cumulative effect of multiple localized failures, which are strongly influenced by bedding structures such as those in oil shale.
Increasing confining pressure induces escalation in peak stress and strain values, though the stress increment rate diminishes progressively, highlighting the weakening control of confinement. Concurrently, the slope of the stress–strain curve generally rises with increasing confining pressure, suggesting an enhancement in the elastic modulus. These phenomena are associated with the progressive closure of microfractures within the model, leading to increased compaction of the layered rock mass.

3.2.3. Compressive Strength and Elastic Modulus

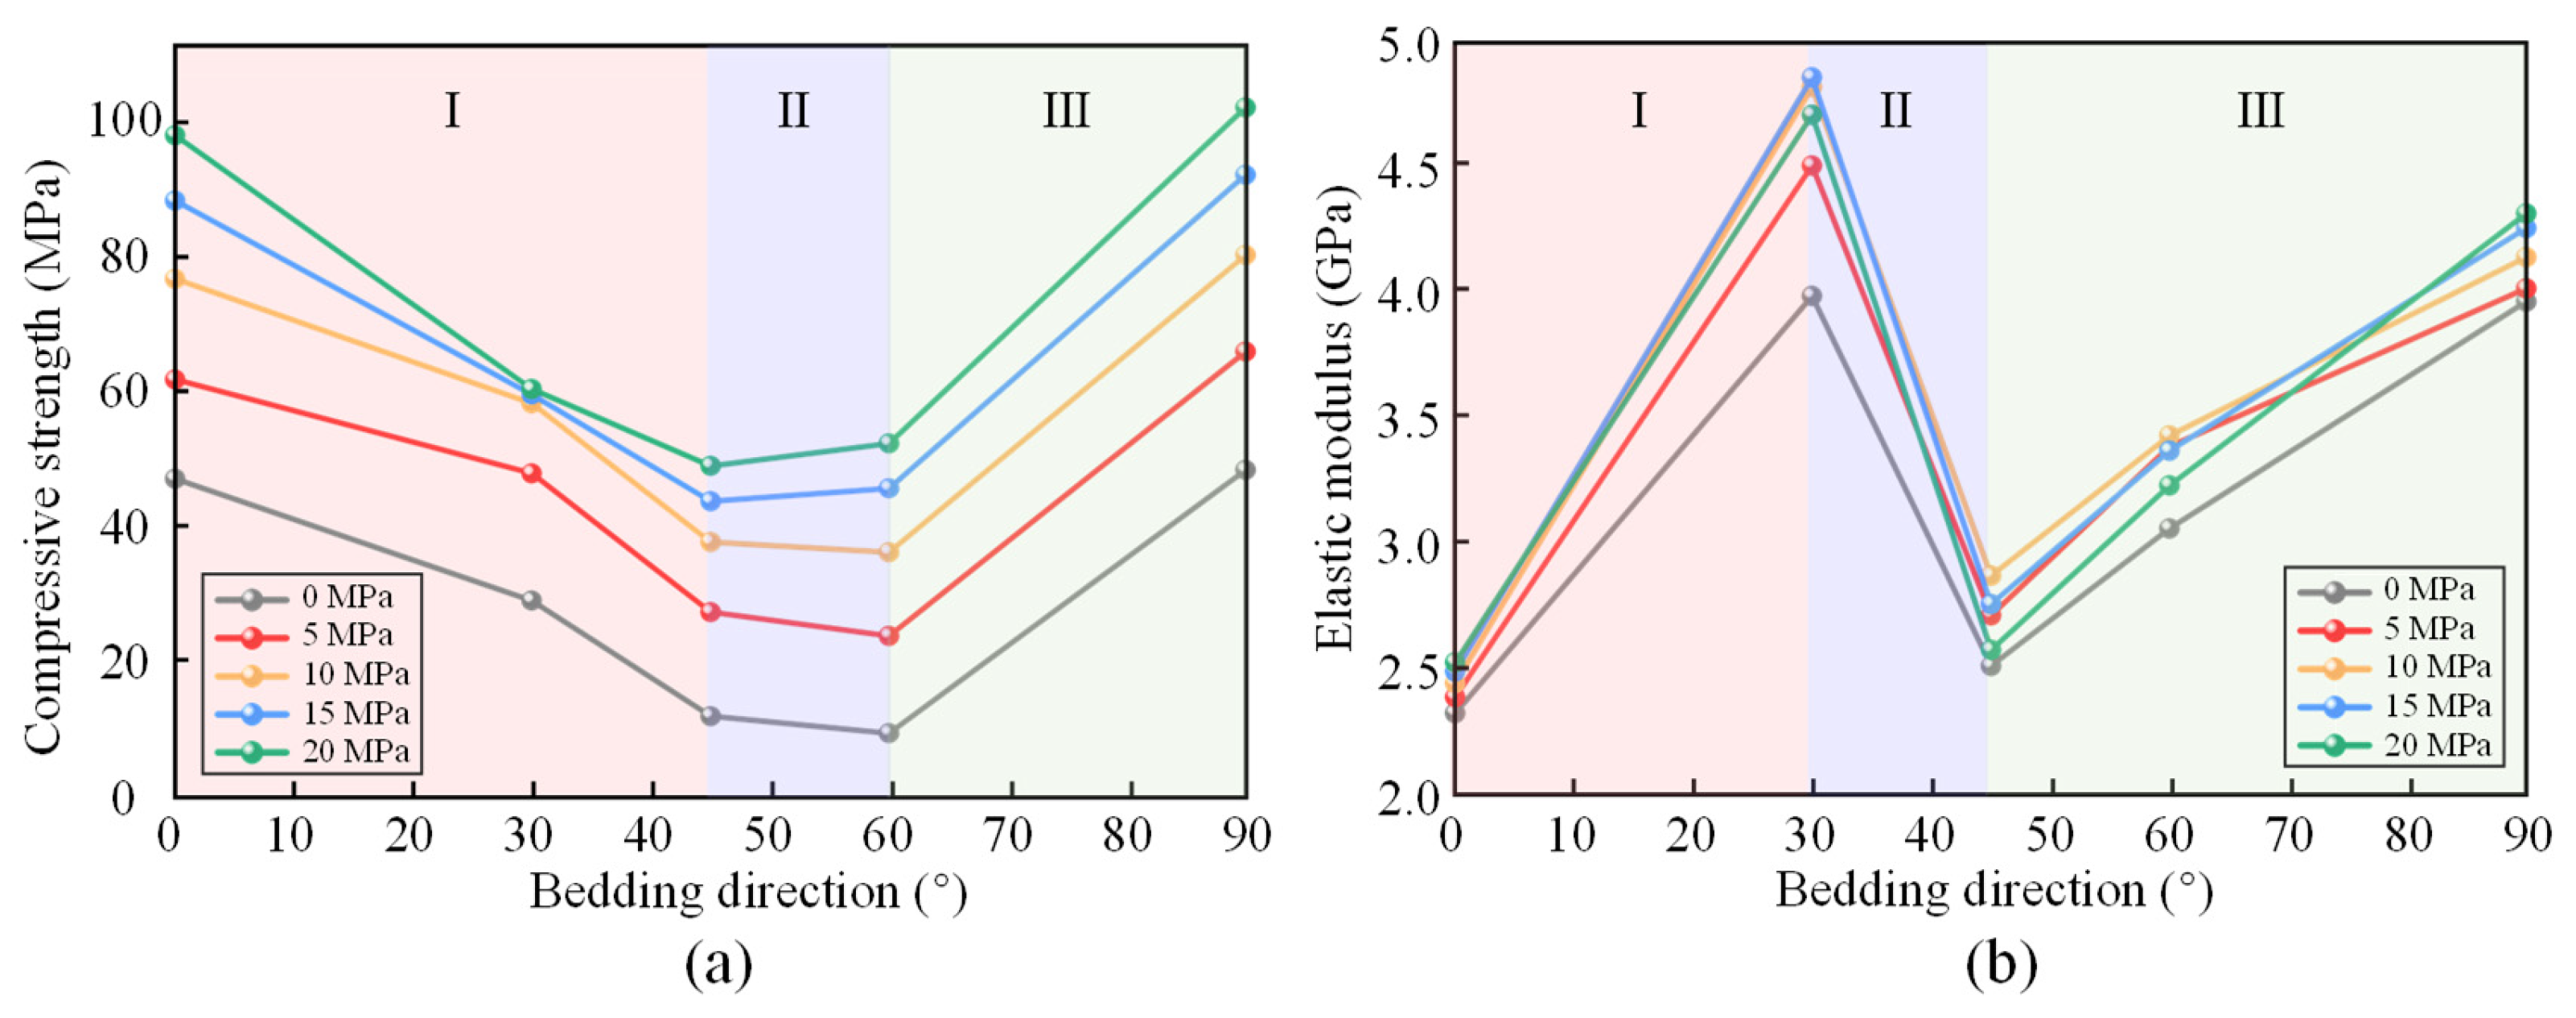
Figure 9a depicts the evolution of compressive strength under diverse confining pressure and bedding directions. The compressive strength exhibits a nonlinear trajectory characterized by an initial decline succeeded by recovery, forming a U-shaped curve with minima at bedding directions of 45° and 60°. This mechanical behavior stems from the anisotropic strength properties inherent to the beddings. At 45° and 60° directions, reduced cohesion along beddings promotes preferential failure through these beddings.
According to the variation trend, the compressive strength is categorized into three phases. Phase I ranges from Per bedding to 45°, during which the compressive strength decreases. The rate of decrease is initially slow but accelerates with increasing bedding direction, except in the case of 20 MPa confinement.
Phase II begins with a bedding direction of 45° and ends at 60°. The variation trends differ across different confinement levels. At lower confining pressures (0~10 MPa), the compressive strength decreases, reaching its lowest value at a bedding direction of 60°. Conversely, under relatively high confining pressures (15~20 MPa), strength increases, with the lowest value occurring at a bedding direction of 45°.
Phase III encompasses 60° to Par bedding, during which a significant strengthening of compressive strength is observed. Notably, the compressive strength at Par bedding marginally exceeds that at Per bedding. The UCS of Par bedding is typically lower than that of Per bedding due to the tendency to slip along the Par bedding under uniaxial loading. Similarly, when confining pressure is applied, Par bedding becomes more compact while Per bedding expands, which increases the compressive strength of Par bedding and diminishes the strength of Per bedding.
As shown in Figure 9b, the evolution of the elastic modulus under diverse confining pressures and bedding directions manifests three characteristic phases. Phase I covers a Per bedding to 30°, during which the elastic modulus rises from approximately 2.4 MPa to 4.5 MPa, reaching its peak value. In Phase II (30° to 45°), the elastic modulus drops to around 2.7 MPa, slightly exceeding the value at Per bedding. Subsequently, the elastic modulus progressively increases from 45° to Par bedding (Phase III) as the bedding becomes more compacted.
From the analysis above, that bedding directions critically governs the mechanical behavior of layered rock mass, particularly in terms of compressive strength and elastic modulus. Layered rock mass with Par bedding generally exhibits higher mechanical parameters, with both strength and modulus exceeding those of other directions. Notably, under high confinement (20 MPa), Par bedding models (Figure 7e) displayed fewest fractures along the beddings. The compaction effect for Par bedding becomes increasingly pronounced with increasing confining pressure, driving an enhancement in both strength and modulus.

4. Microfracture Evolution Mechanism of Layered Rock Mass

4.1. Quantification Method of Microfracture Properties

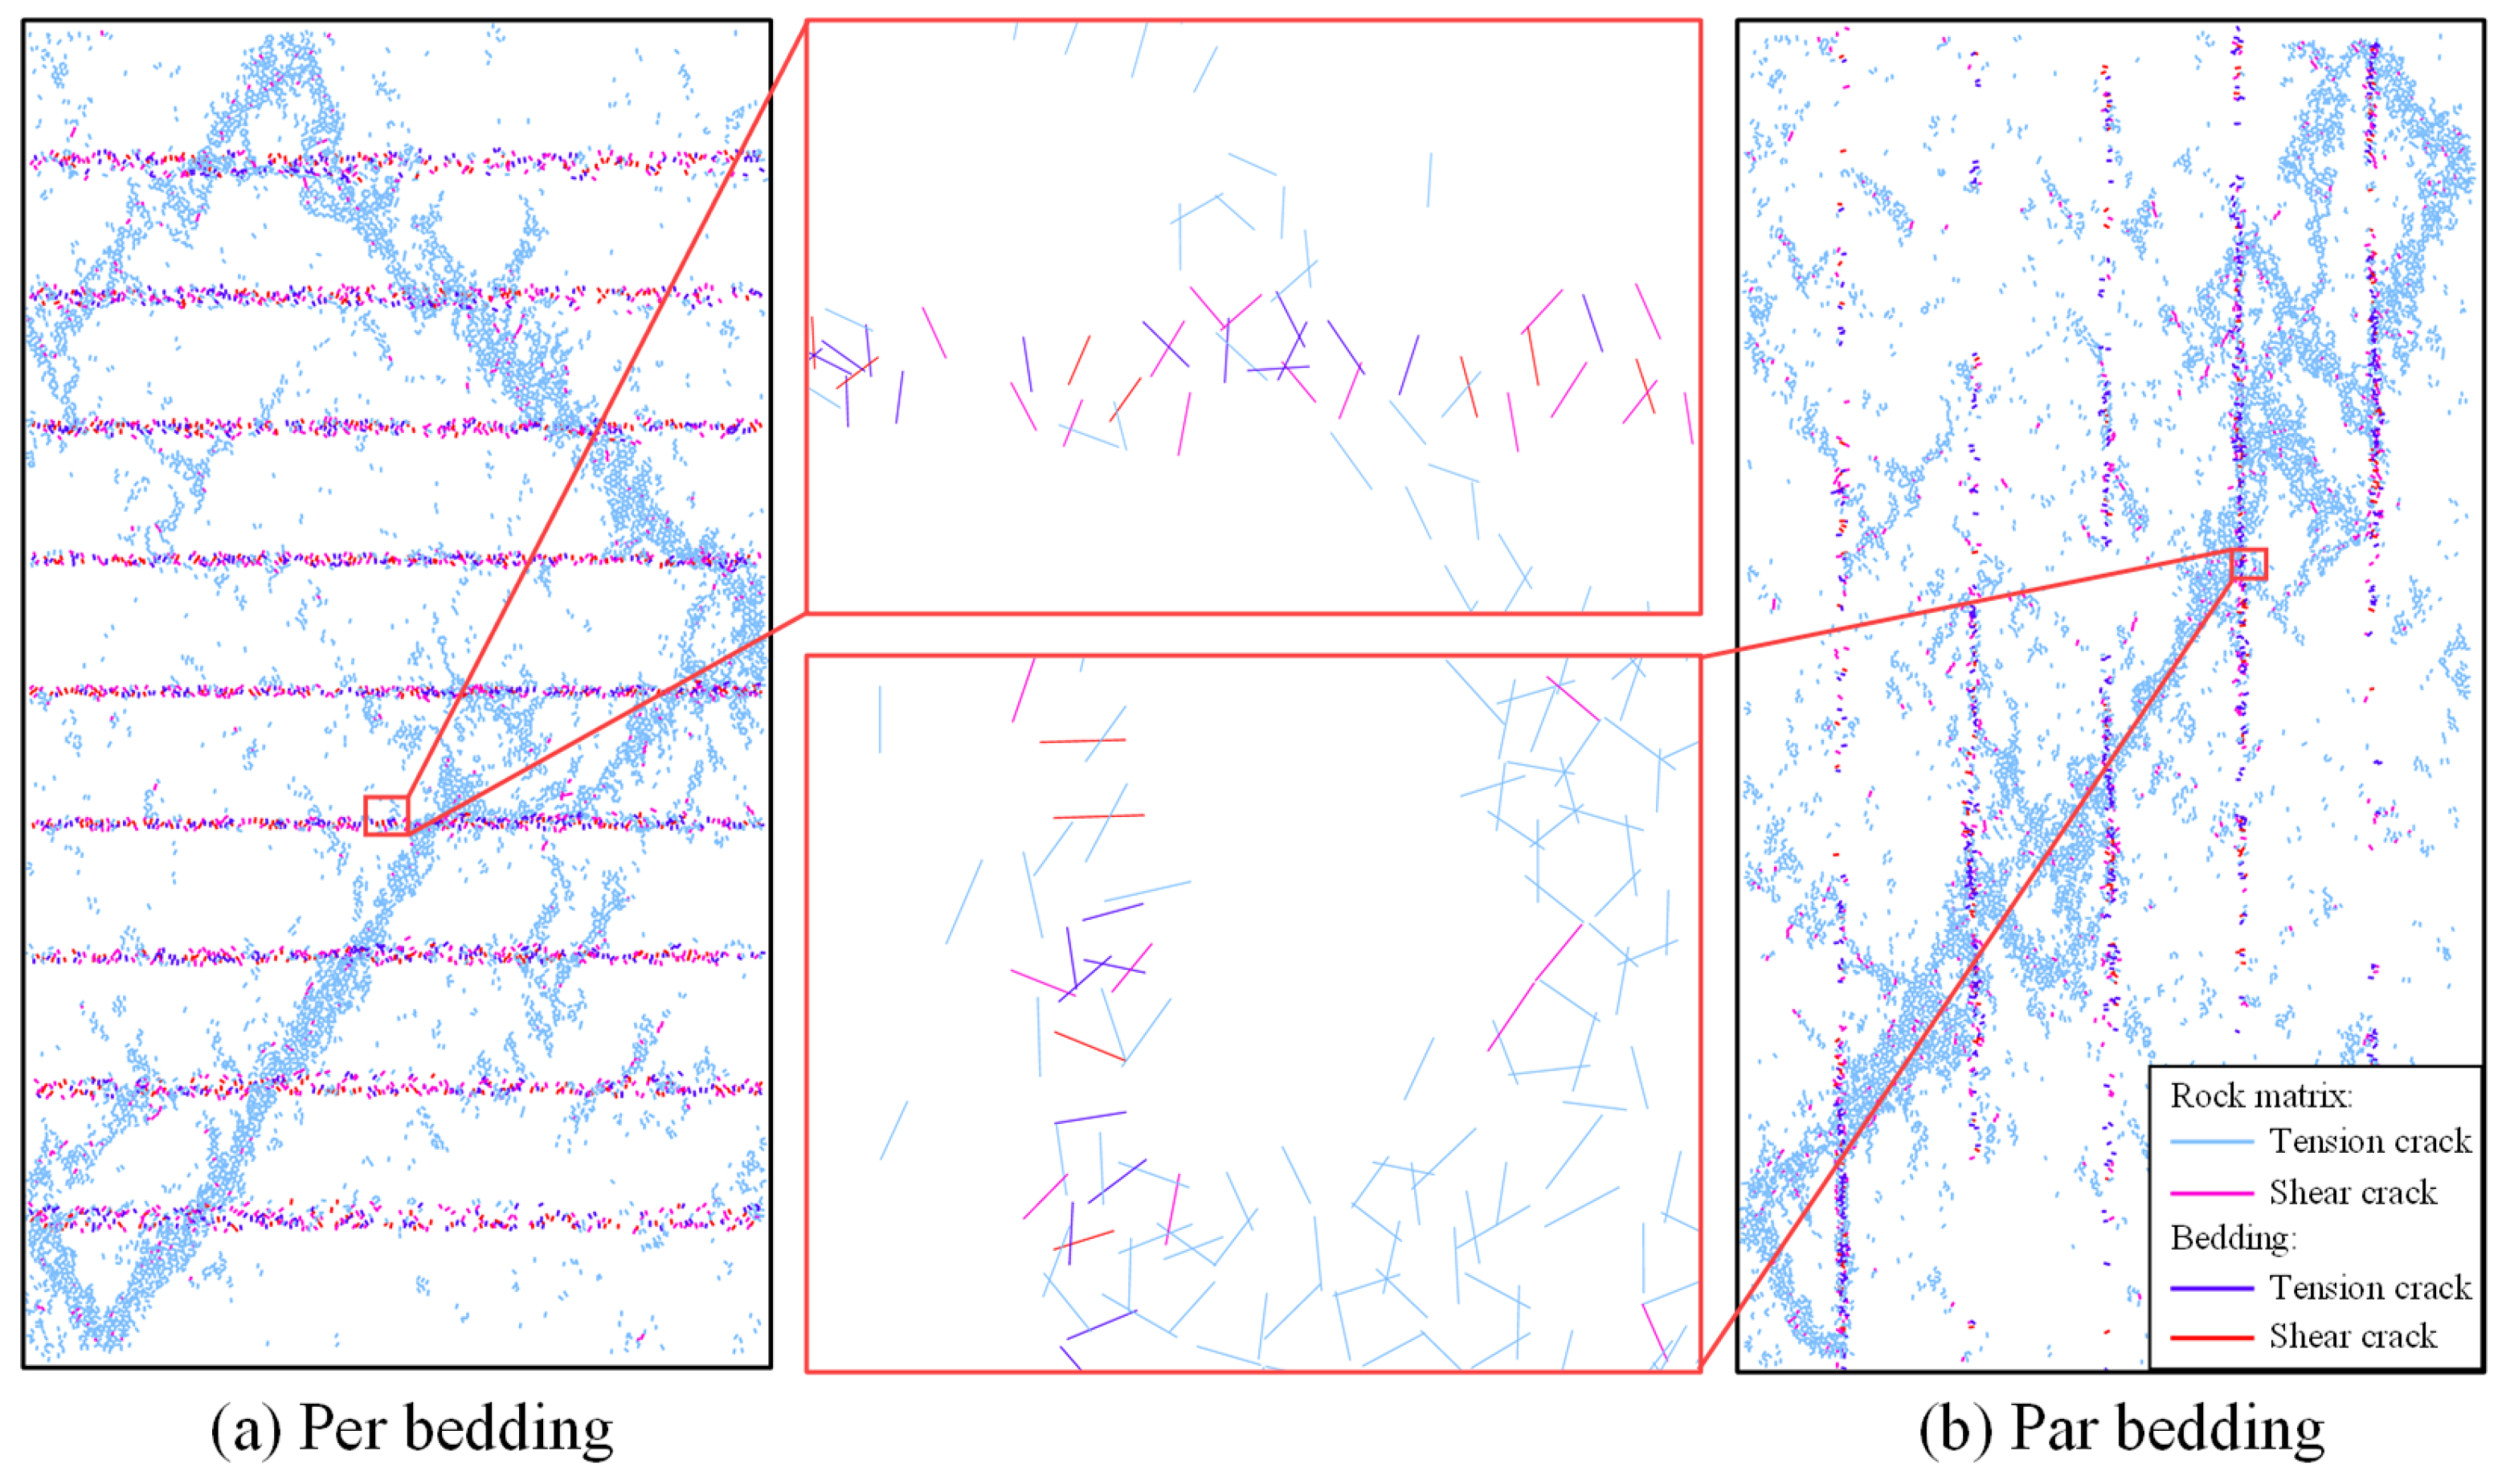
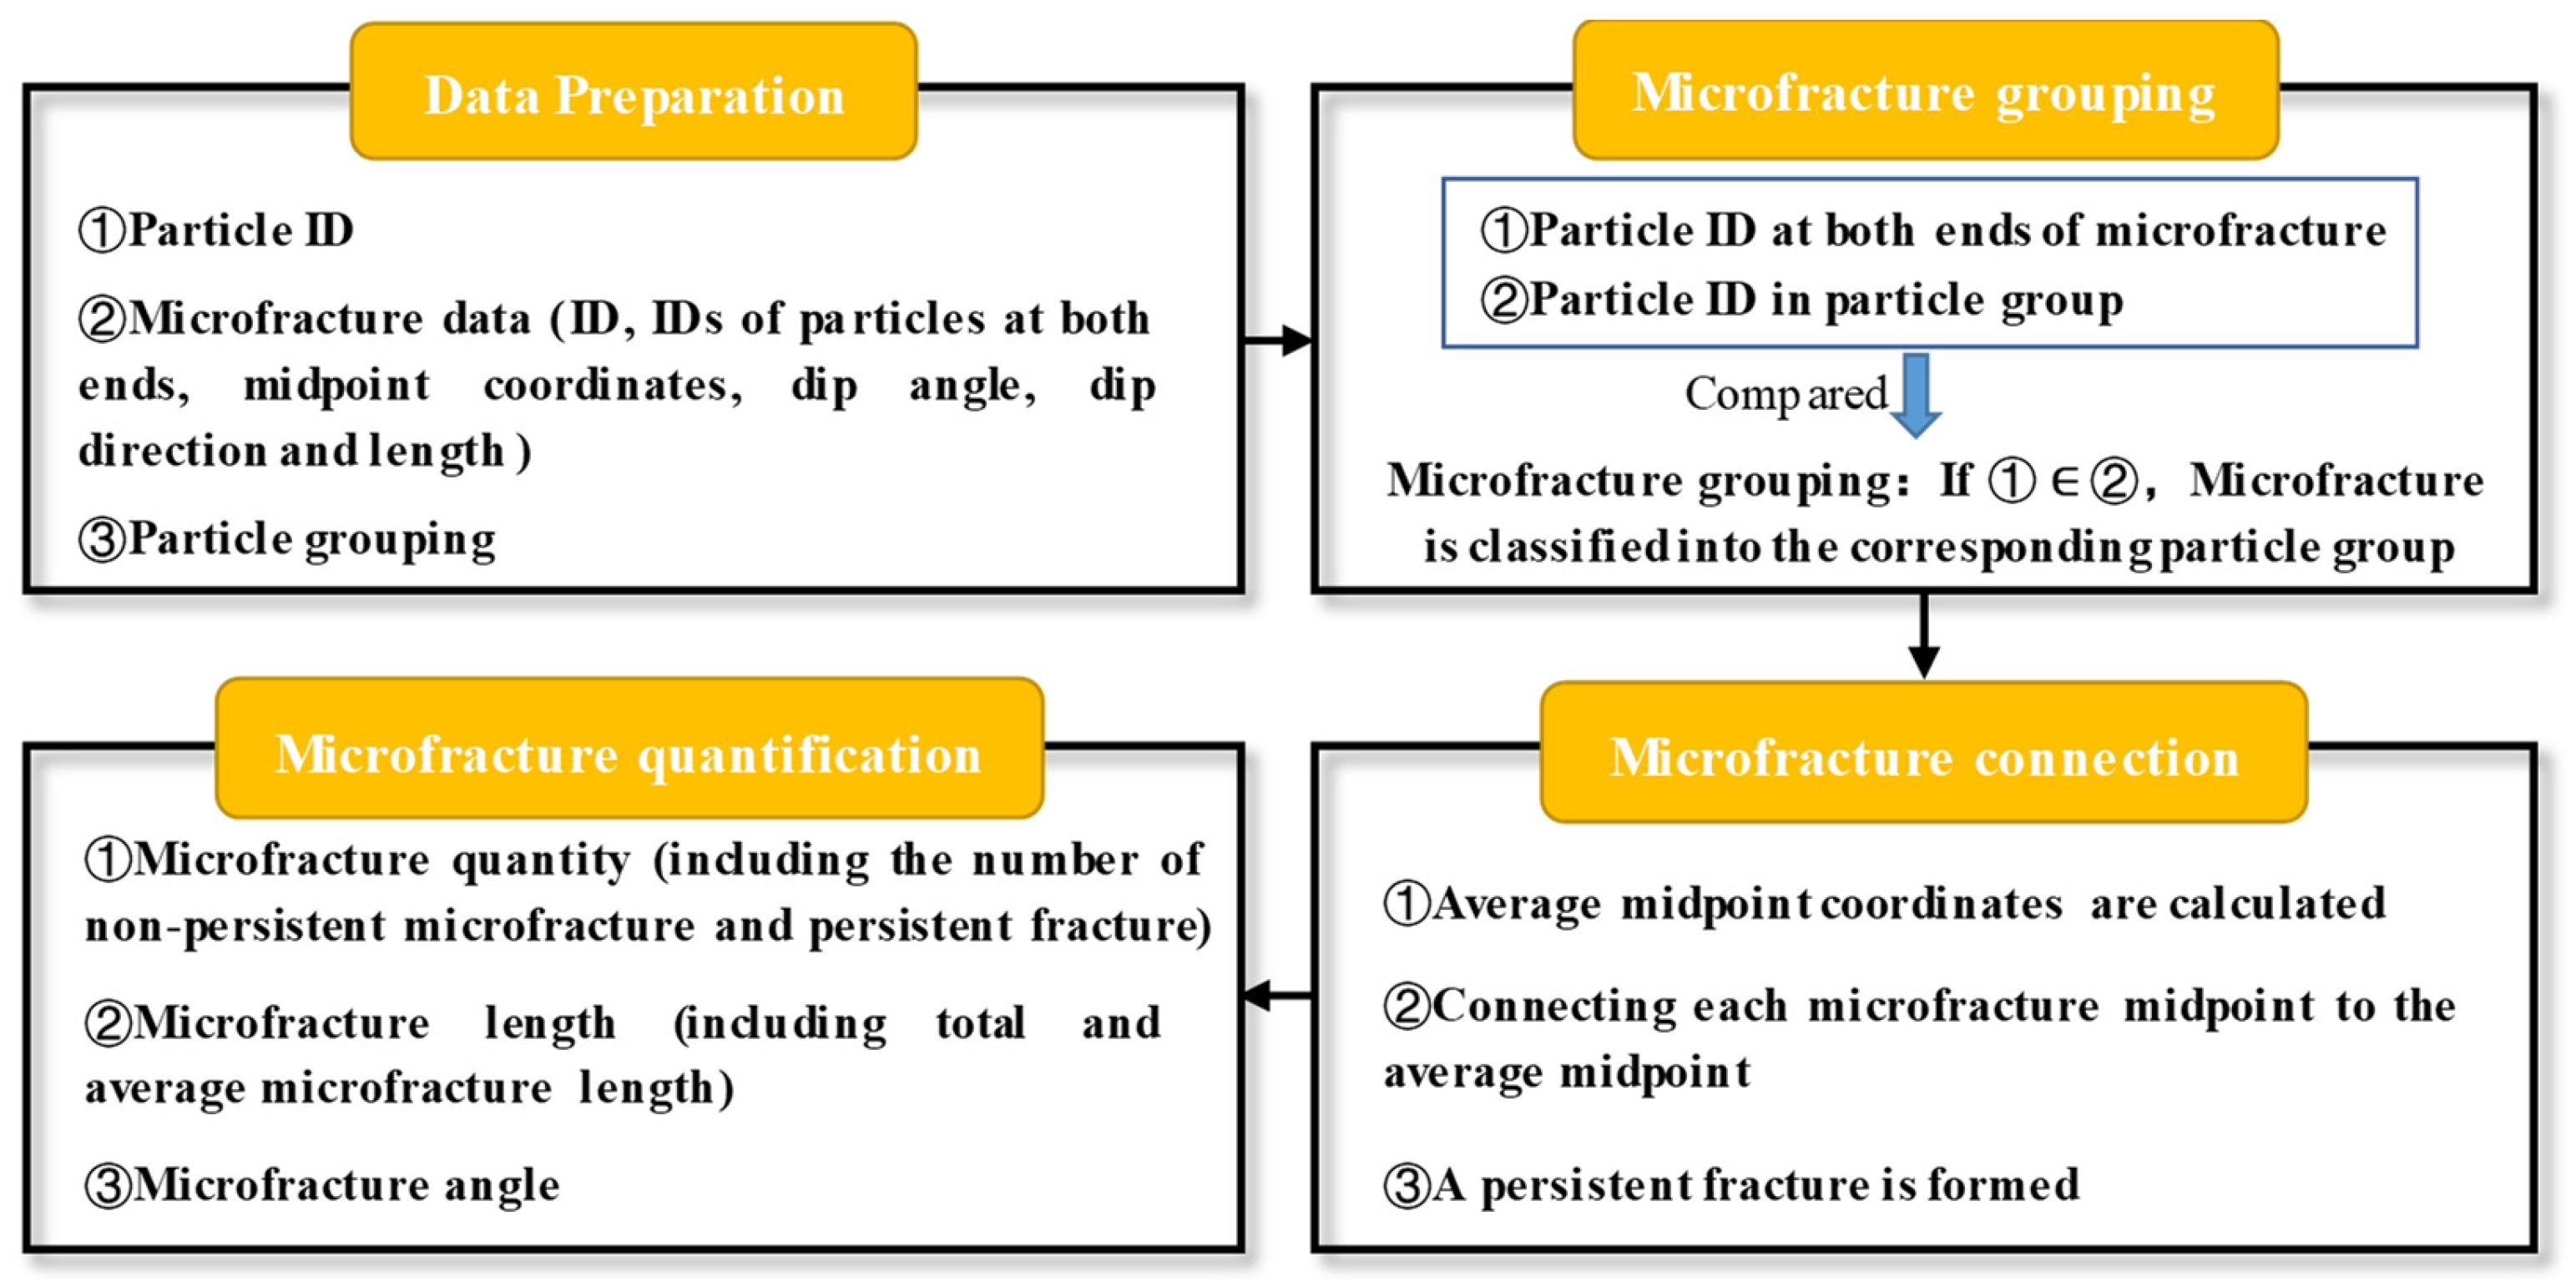
Numerical simulations in PFC can automatically record the patterns of bond breakage. For example, in the event of tensile failure leading to bond breakage, the Bond State Parameter will be updated to 1, and the resulting tension fracture will be both recorded and visualized. In contrast, if bond breakage is caused by shear failure, the Bond State Parameter will be set to 2, with the corresponding shear fracture being recorded and visualized. This facilitates the investigation of microfracture evolution in layered rock mass under different confining pressures and bedding directions. However, the microfractures visualized by PFC are disconnected (Figure 10) as they actually represent the interactions between two adjacent particles. To effectively connect the mutually intersecting microfractures, this study proposes a microfracture connection algorithm implemented in Python (Figure 11). This algorithm enables the quantification of microfracture quantity, length, and angle, thereby enhancing the study of microfracture evolution mechanisms.

4.1.1. Data Preparation

Data such as the ID of particles, the ID of microfractures, the IDs of particles at both ends of microfractures, the midpoint coordinates, and angle and length of microfractures is recorded and exported as a text file through the Fish language build in PFC. Thereinto, the ID serves as the unique identifier for particles or microfractures, allowing for precise location of each individual particle or microfracture. The midpoint coordinates of microfractures refer to the midpoint (x, y) of the microfracture segments within the model. The microfracture angle represents the angle formed by the microfracture segment and the positive x-axis. The microfracture length is determined by the actual length of the microfracture segment, which is equivalent to the mean diameter of particles at the microfracture’s endpoints.
Particles in PFC are interconnected by bonds, forming a “particle group” delineated by a closed polygon with vertices at the particle centers. As illustrated in Figure 12a, particles can be classified into four groups. Particles located at the vertices of each polygon belong to the same group, with each group comprising a minimum of three and a maximum of eight particles, influenced by porosity and bond spacing. Furthermore, a single particle can simultaneously belong to multiple particle groups. Fish language in PFC is employed to classify all particles into separate groups, and the particle IDs in each group are recorded and exported as a text file.

4.1.2. Microfracture Grouping and Connection

The exported data is imported into Python, and some libraries such as Math (standard library module included in Python 3.10.13), Matplotlib (Version 3.7.2), NumPy (Version 1.24.3) and Pandas (Version 2.0.3) are also simultaneously imported into the project. Firstly, the particle IDs at both ends of the microfracture are regarded as one set, while the particle IDs in the particle group are regarded as another set. Subsequently, the two sets are compared. When the former set is a subset of the latter set, it can be considered that the microfracture is generated by two particles in this particle group, and the microfracture is classified into the corresponding particle group. All microfractures are traversed, and microfractures generated by the same particle group are classified into the same array (Figure 12b).
After the aforementioned microfracture grouping is completed, the microfractures within each array should be connected. If an array contains only one microfracture, this indicates that the microfracture is non-persistent, and it can be visualized using the end coordinates derived from the microfracture’s midpoint coordinates, length, and angle. If an array contains more than one microfracture, these microfractures should be connected to form persistent fracture. First, the midpoint coordinates of these microfractures are obtained, and the average midpoint coordinates (average midpoint) are calculated. Subsequently, a line segment is drawn to connect each microfracture midpoint to the average midpoint (Figure 12c). As shown in Figure 12d, all non-persistent microfractures within the same array are linked together through the algorithm, and they are collectively regarded as one persistent fracture. Thus, Figure 12d illustrates a single persistent fracture formed by the interconnection of multiple microfracture segments within one array. This definition also provides the basis for counting the number of persistent fractures in the subsequent analysis.
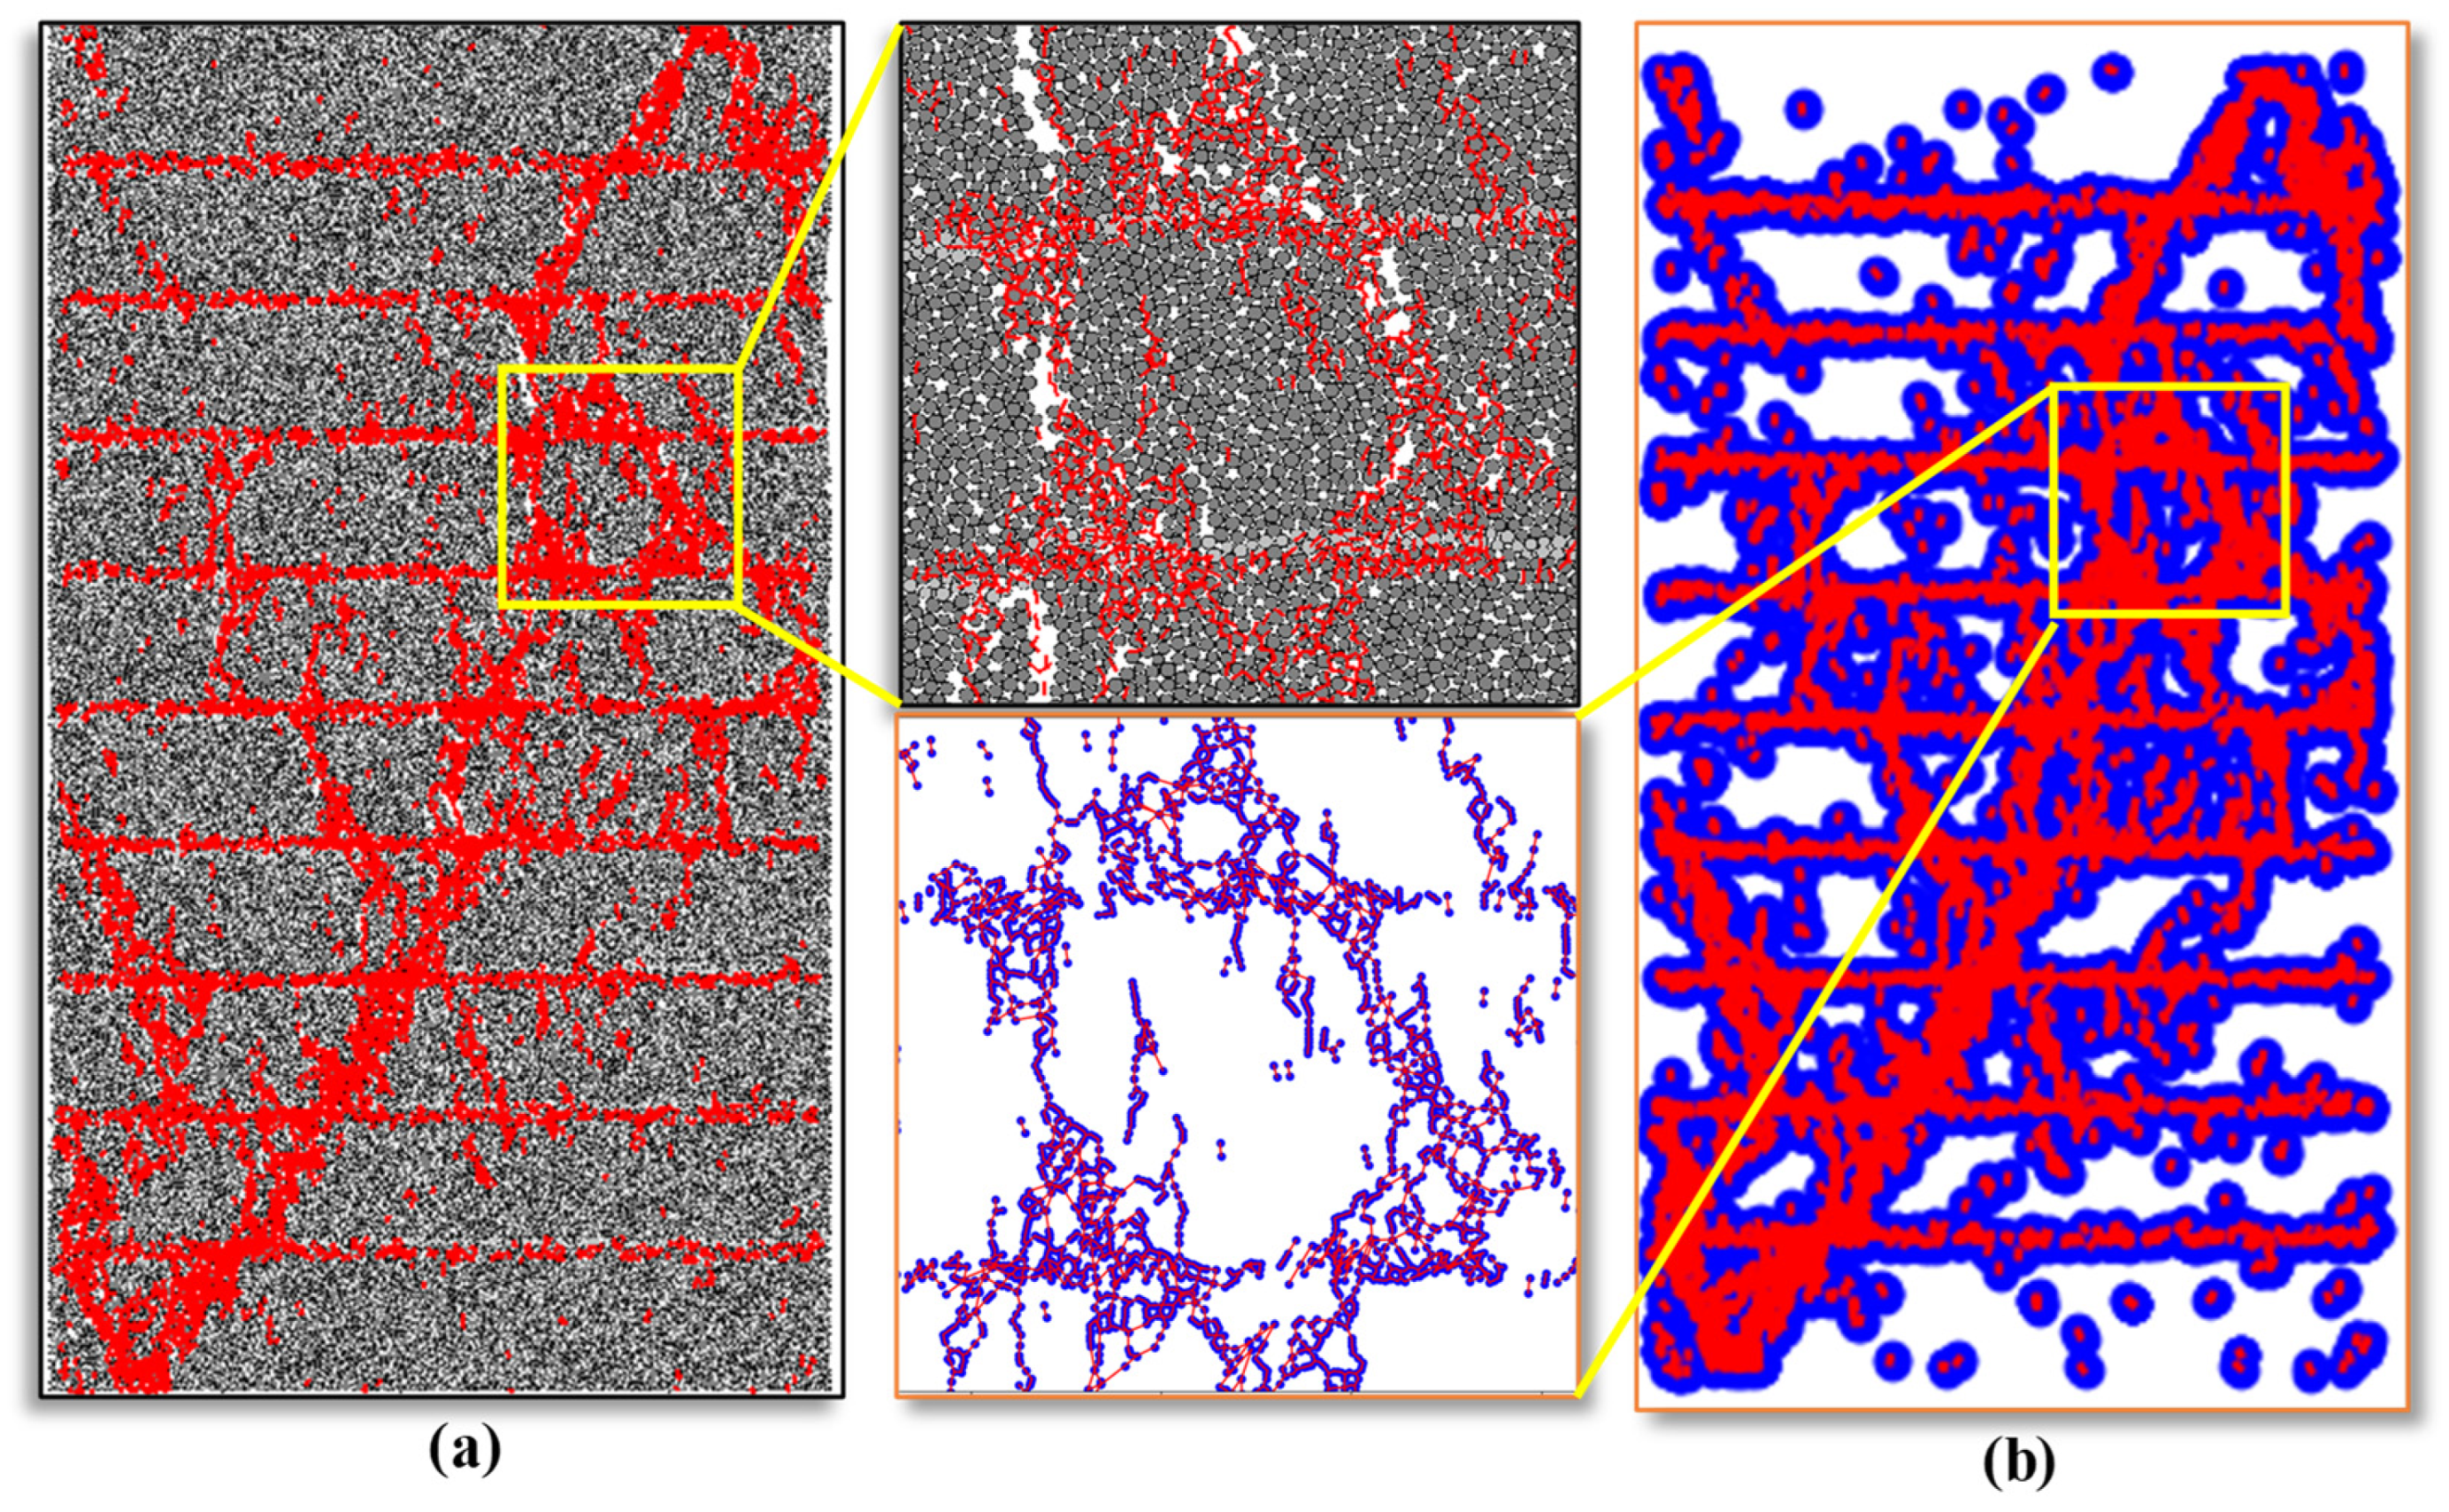
Through the above procedure, the fracture morphology within the model can be clearly visualized, as shown in Figure 13. The connected fracture traces obtained by the algorithm exhibit clear and continuous patterns that are fully consistent with the microfracture distribution generated in the original PFC simulation. Local magnifications further confirm that the algorithm accurately connects mutually intersecting microfractures without distortion or false junctions. This comparison demonstrates that the linkage algorithm can reliably reconstruct the overall fracture geometry and reproduce the physical fracture network characteristics of the simulated rock mass.

4.1.3. Microfracture Quantification

After the microfracture connection is completed, it is crucial to quantify the microfractures for subsequent evolution analysis. In the study of rock fractures, particular attention is given to the quantity, length, and angle of microfractures, as these are key physical characteristics. As discussed in the previous section, persistent fractures are composed of multiple microfractures, and, therefore, the model involves two scales of microfractures that need to be considered separately.
For persistent fractures, their IDs are recorded and stored in an array during the grouping process, and the number of persistent fractures corresponds to the length of this array. The length of each persistent fracture is calculated as the sum of all connected microfracture segments within the same array, while each non-persistent microfracture is counted separately, with its length and angle determined as described previously. This unified definition ensures internal consistency between the algorithmic identification of fractures and the subsequent statistical analysis.

4.2. Evolution of Microfracture Quantity

According to the aforementioned method, the quantity of microfractures is recorded and counted throughout the entire loading process. To evaluate the role of confining pressure and bedding direction in microfracture evolution, representative numerical models are selected for analysis in this study, including cases with different bedding directions at 5 MPa confinement and cases with diverse confining pressures under Per bedding.
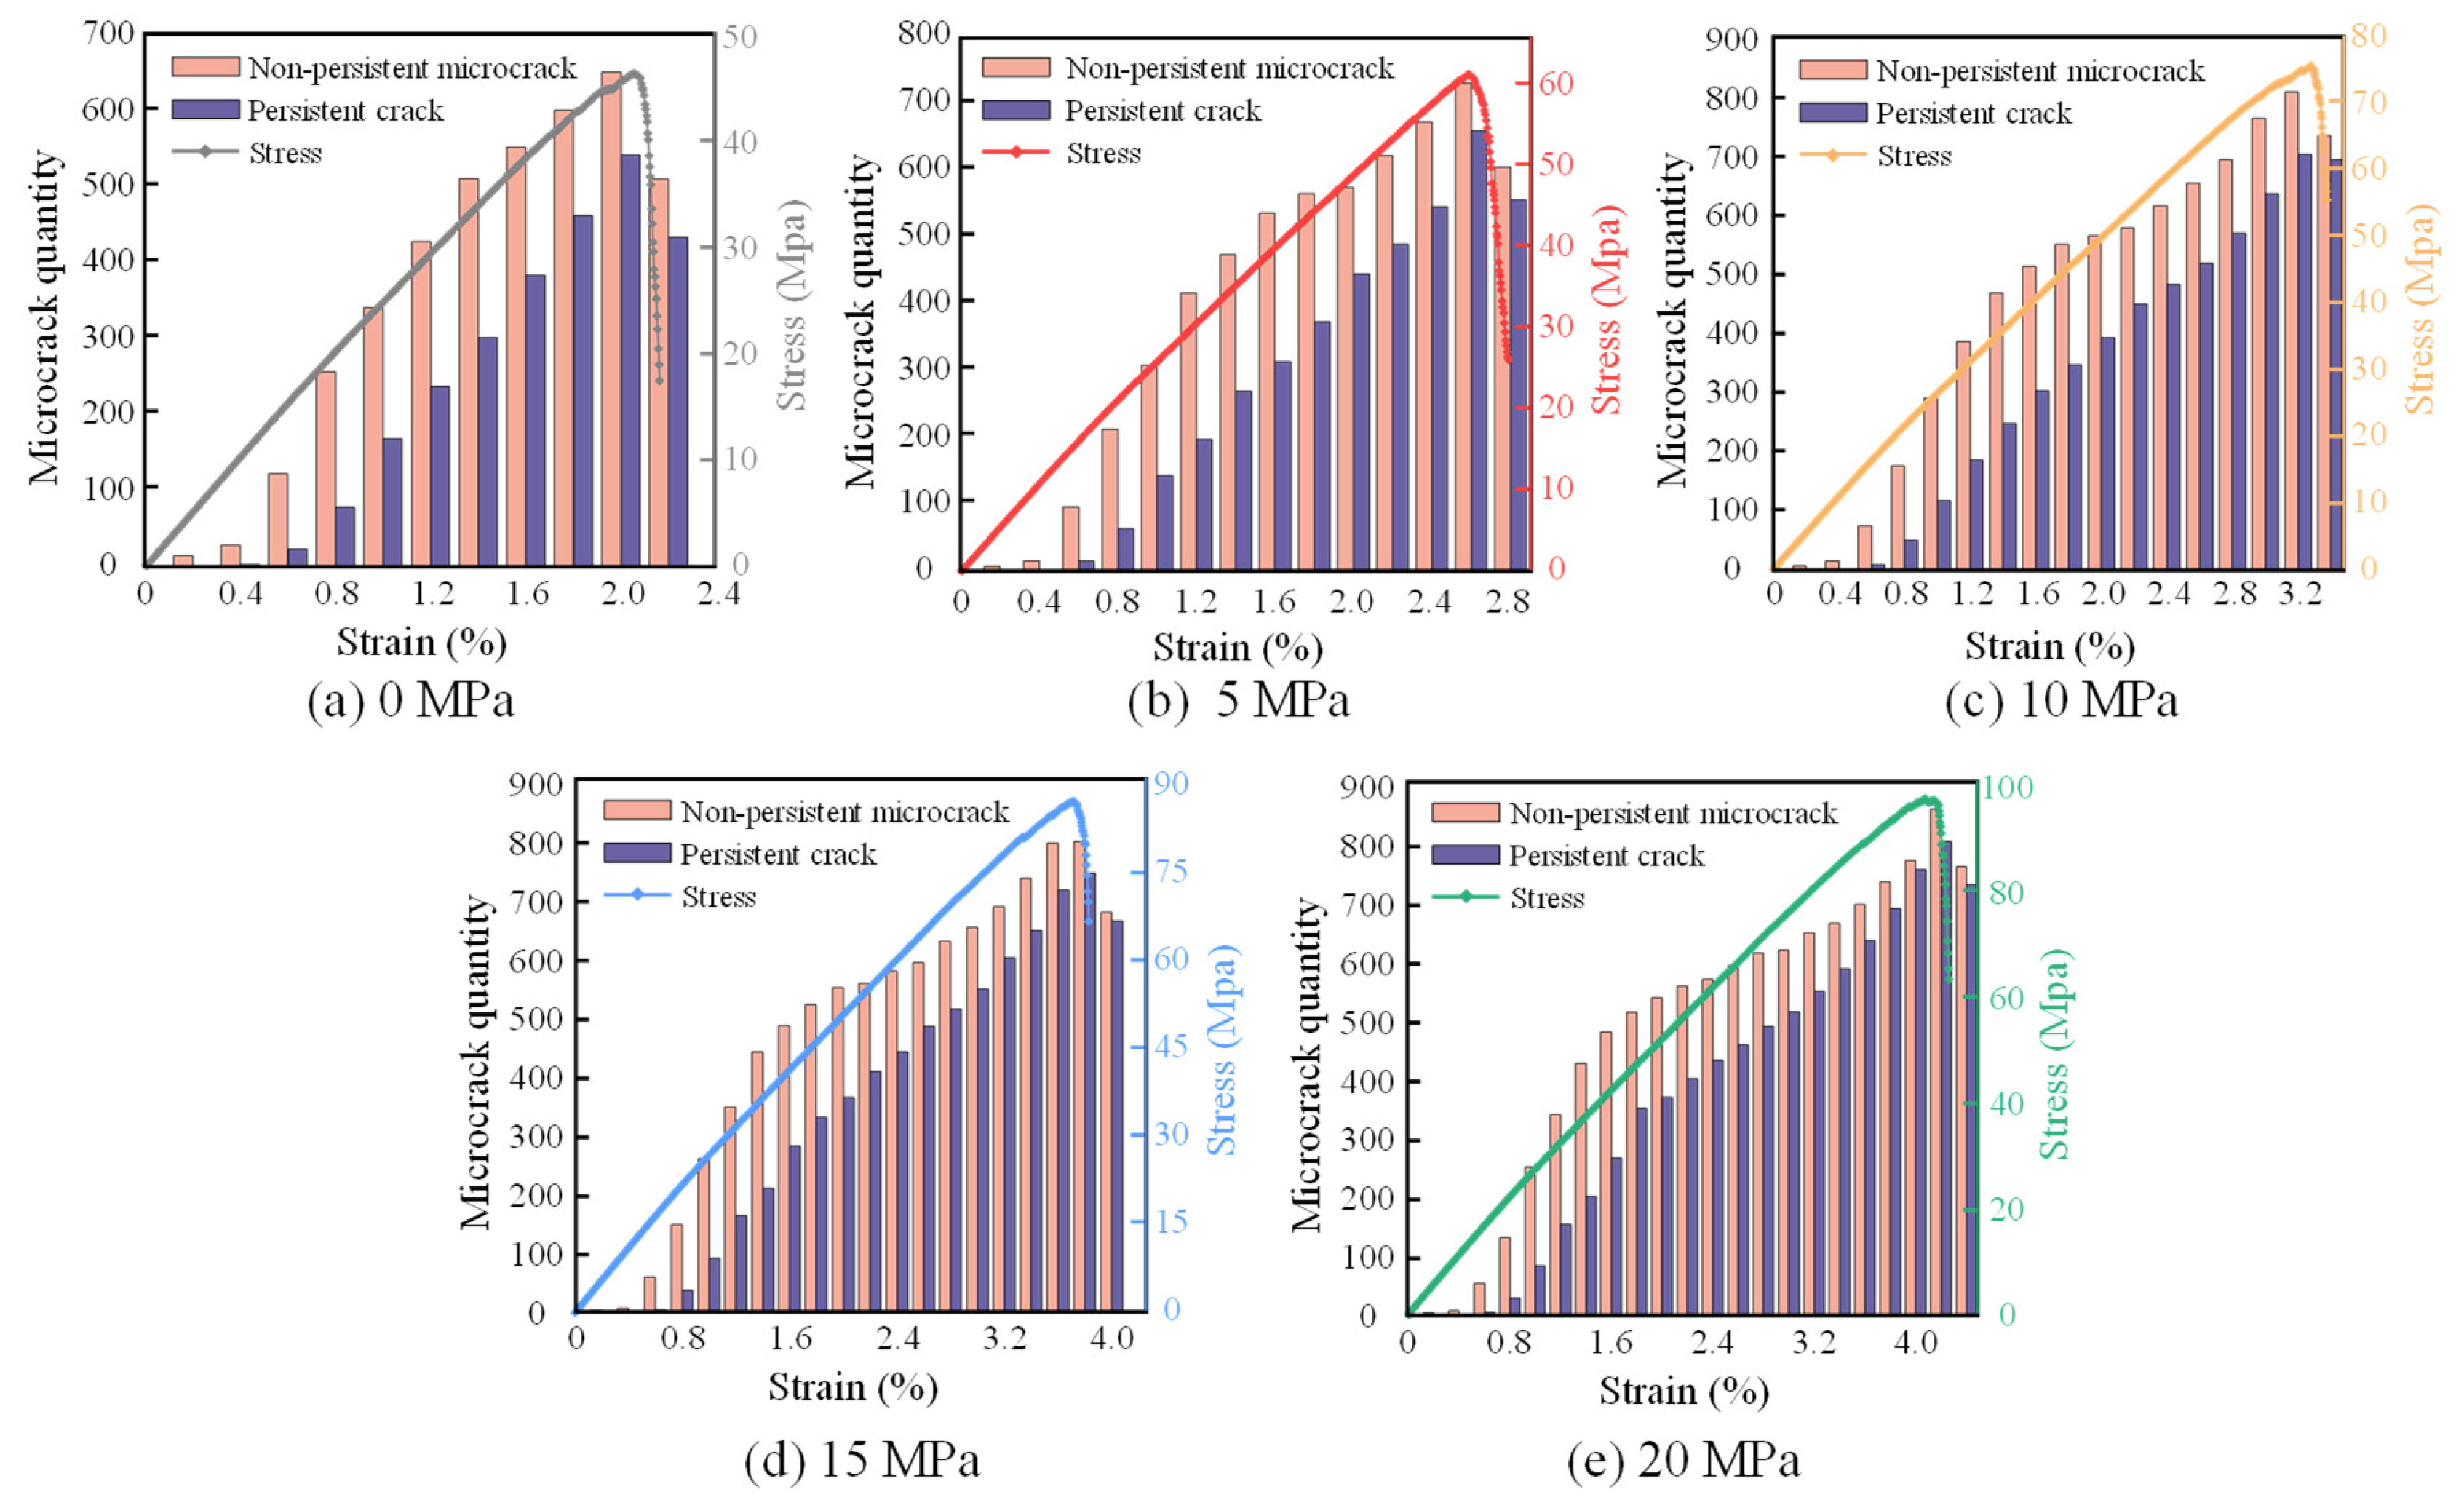
Figure 14 illustrates the relationship between stress–strain curves and microfracture quantities for diverse bedding directions at 5 MPa confinement. For Per bedding (Figure 10a), non-persistent microfractures first occur and keep increasing until they begin to interconnect with each other to form persistent fractures when the strain is approximately 0.6%. Before the strain reaches approximately 1.6%, the evolution rate of non-persistent microfractures exceeds that of persistent fractures; however, this trend reverses beyond this strain level. When the model is damaged, there is a sharp decrease in the quantity of both non-persistent microfractures and persistent fractures.
For a bedding direction of 30°, microfractures occur at a strain of 0.2% and the evolution rates of both non-persistent microfractures and persistent fractures are initially similar. However, when the strain reaches approximately 1.0%, non-persistent microfractures start to decrease, while persistent fractures continue to increase. At a strain of 1.6%, persistent fractures begin to decrease, indicating the interconnection of these fractures. From a strain of 1.2% to 2.8%, the quantity of persistent fractures always exceeds that of non-persistent microfractures, suggesting that the interconnection of microfractures is predominant at this stage.
For bedding directions of 45° and 60°, the evolution rate of microfractures sharply increases at the stain of 0.4%. The quantity of non-persistent microfractures peaks before that of persistent fractures. After the stain reaches 0.8%, the quantity of persistent fractures is consistently greater than that of non-persistent microfractures. For Par bedding, microfractures occur until the strain is approximately 0.8%. The development rate of non-persistent microfractures is higher than that of persistent fractures, and the quantity of non-persistent microfractures consistently exceeds that of persistent fractures.
From the analysis above, the interconnection of microfractures may be a contributing factor to the failure of layered rock mass. For bedding directions of 30°, 45°, and 60°, the evolution rate of persistent fractures is notably higher than that of non-persistent microfractures. Furthermore, the quantity of persistent fractures consistently surpasses that of non-persistent microfractures from the initial stages of adjacent failure through the post-failure phase. This explains why the compressive strength for bedding directions of 30°, 45°, and 60° is lower than that of Par or Per beddings where persistent fractures do not dominate.
The quantity of microfractures under different confining pressures for Per beddings exhibits a similar evolutionary pattern (Figure 15). When the strain is below 0.4%, the evolution rates of both persistent fractures and non-persistent microfractures are relatively slow. Subsequently, the evolution rate of non-persistent microfractures becomes significantly higher than that of persistent fractures. Upon damage to the layered rock mass, the quantities of both types of microfractures decrease sharply. Notably, the quantity of non-persistent microfractures consistently surpasses that of persistent fractures. However, the quantity of non-persistent microfractures undergoes a gradually slow evolution with increasing confining pressure, resulting in a downward concave shape in the bar chart representing non-persistent microfracture quantity. This suggests that the interconnection of microfractures plays a dominant role during the fracture propagation stage, and this phenomenon becomes more pronounced with higher confining pressures. Furthermore, higher confining pressures lead to an increase in microfracture quantity at the moment of model failure.

4.3. Evolution of Microfracture Length

The evolution of total microfracture length (the total length of non-persistent microfractures and persistent fractures) with strain for different bedding directions at 5 MPa confining pressure is illustrated in Figure 16a. Initially, the total microfracture length is relatively short. As the strain increases to 0.4%, the total microfracture length starts to grow, and the rate of total microfracture length evolution progressively increases from Per bedding to 60°. However, the total microfracture length evolves most slowly for Par bedding. When the model is damaged, the total microfracture length increases significantly for both Per and Par beddings. However, this trend is less pronounced for the 30° bedding direction due to the model’s failure mode transitioning between brittle and ductile behavior. When the bedding directions are 45° and 60°, this phenomenon is not evident, suggesting that the layered rock mass model primarily exhibits ductile failure.
The average microfracture length, calculated as the total microfracture length divided by their count (including non-persistent microfractures and persistent fractures), is further determined, and its relationship with strain is illustrated in Figure 16b. During the initial loading phase, the average microfracture length rises gradually with values similar to those of non-persistent microfractures. As loading progresses, the average microfracture length continues to increase gradually for Per bedding, 30°, and Par bedding, suggesting the gradual coalescence of microfractures. Upon damage, the average microfracture length exhibits a sharp increase, indicating rapid coalescence and a significant rise in the length of persistent fractures, which is characteristic of splitting behavior. For a bedding direction of 45°, the average microfracture length follows an S-shaped curve with strain. The average microfracture length exhibits a significant increase before damage initiation, while it remains relatively stable after damage, suggesting shear-slip failure. When the bedding dip angle is 60°, the average microfracture length shows a consistently high growth rate until the model fails.
Figure 16c illustrates the relationship between total microfracture length and strain under different confining pressures for Per bedding. Total microfracture length evolution remains stable and shows uniformity across all tested confining pressures. During the loading process, the total microfracture length progressively increases and exhibits a sharp rise at the point of model failure. As confining pressure increases, the total microfracture length at the same strain decreases. Similarly, the relationship between average microfracture length and strain (Figure 16d) shows that the average microfracture length initially grows slowly and then sharply increases at time of the model’s failure. When the model fails, the average microfracture length also consistently diminishes with higher confining pressure.

4.4. Evolution of Microfracture Angle

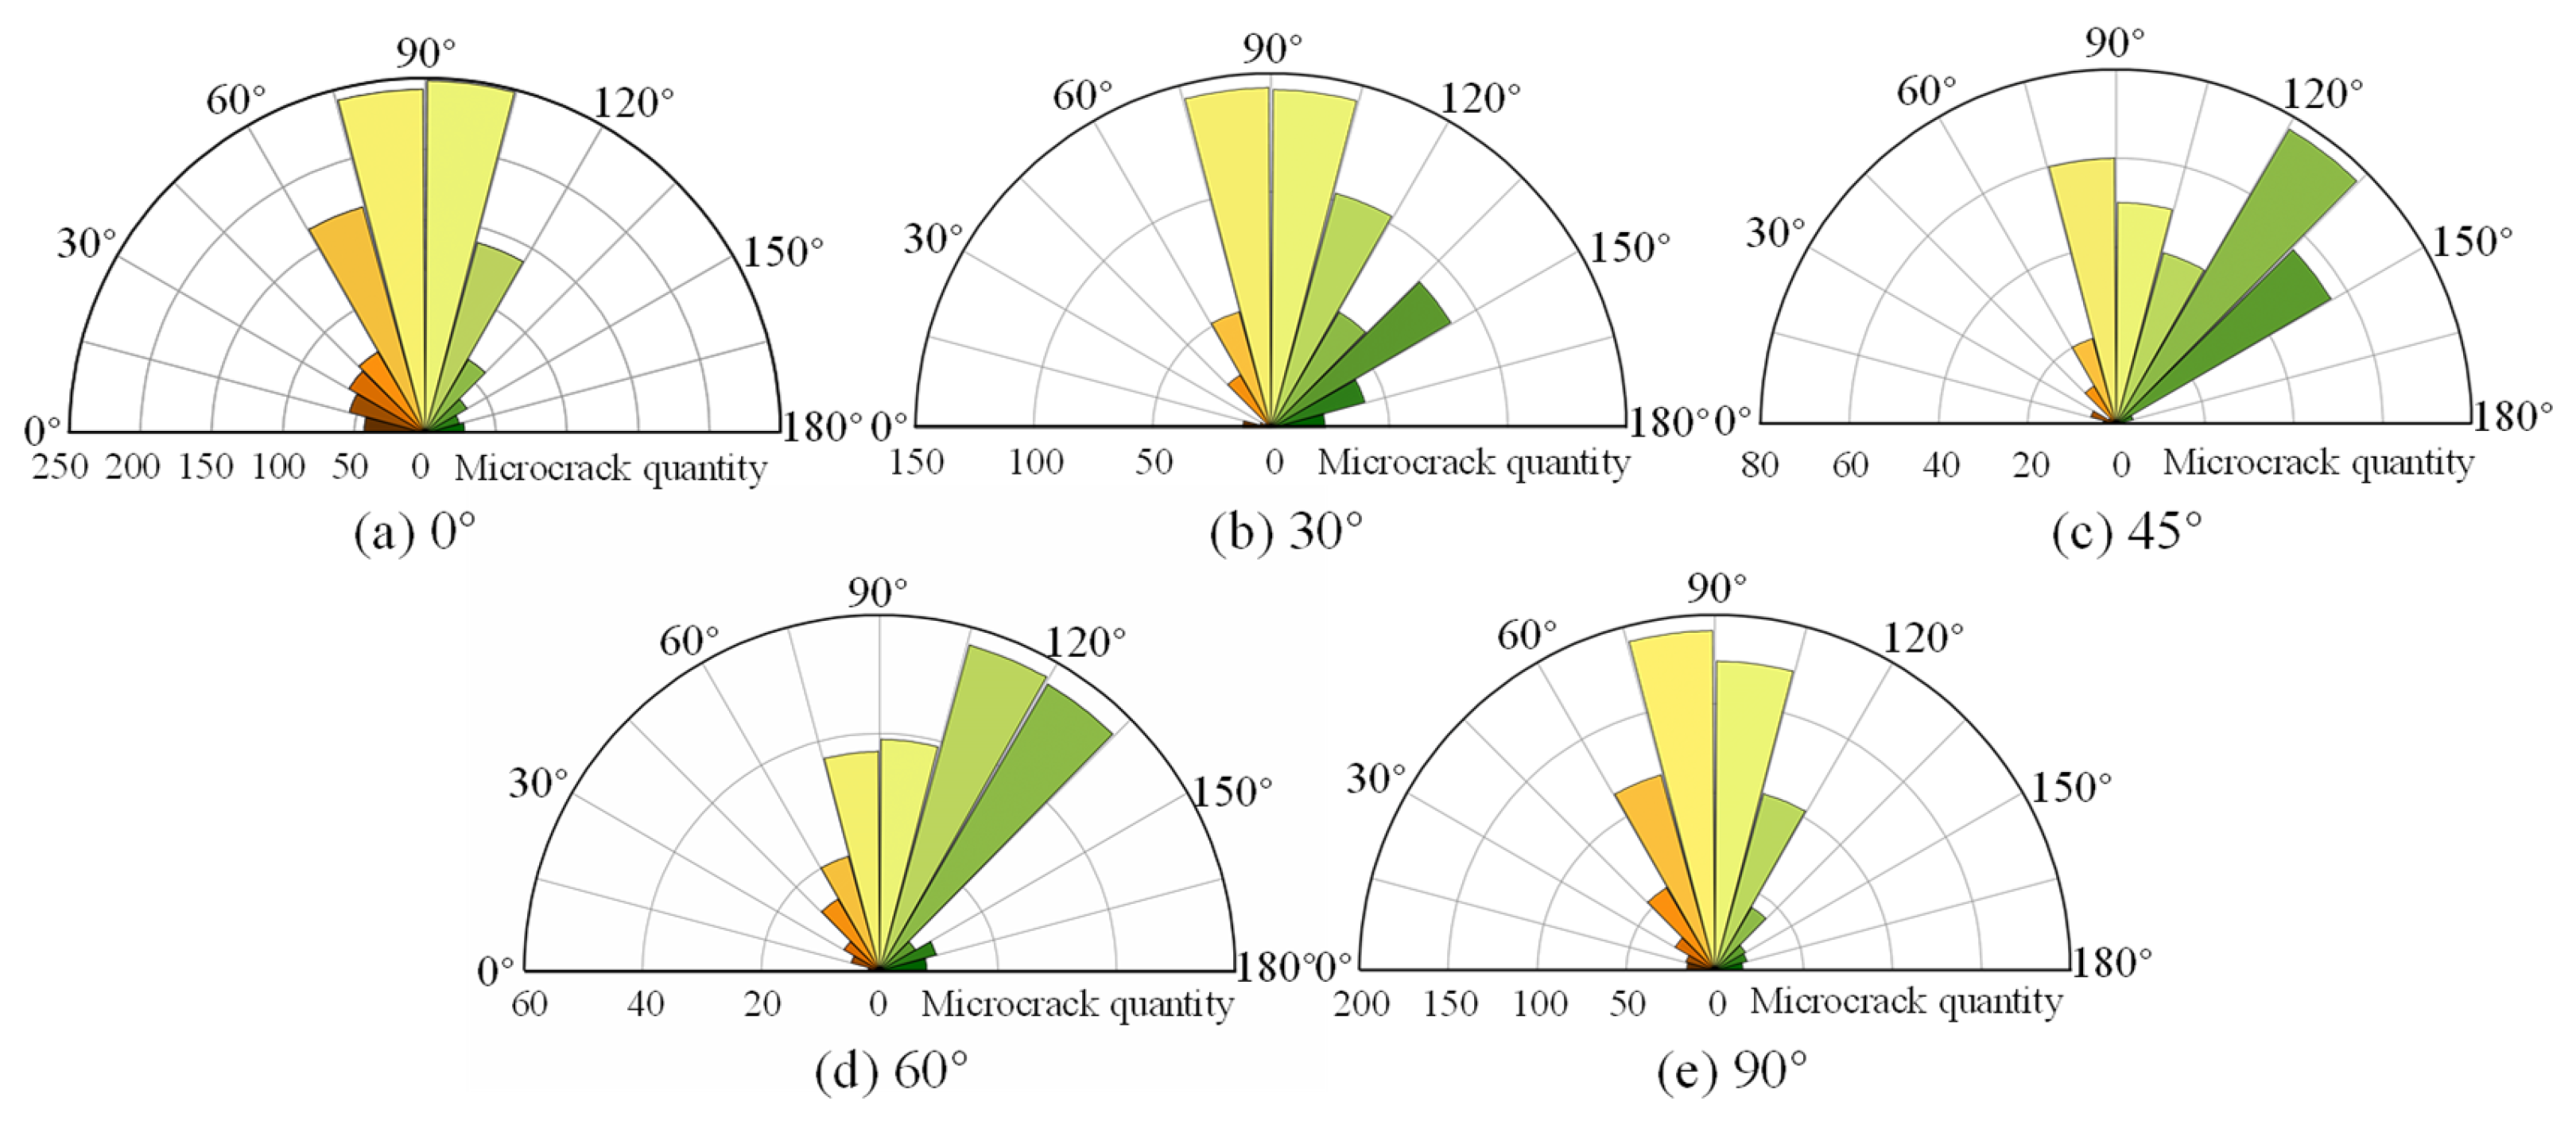
Figure 17 displays the rose diagrams depicting microfracture angle distribution across various bedding directions at 5 MPa confinement. For Per bedding, microfractures exhibit symmetrical distribution along the loading direction, predominantly within the range of 60° to 120°. When the bedding direction is 30°, microfractures are mainly concentrated between 75° and 120°, with a significant number also developing between 135° and 150°. At a bedding direction of 45°, microfractures primarily develop between 75° and 150°, particularly prominent in the range of 120° to 150°, which aligns with the bedding direction. When the bedding direction is 60°, microfractures mainly develop between 75° and 135°, with a notable concentration between 105° and 135° along the bedding direction. For Par bedding, microfractures are predominantly found between 60° and 120°, symmetrically distributed along the loading direction. Overall, regardless of bedding direction, numerous vertical microfractures develop in the layered rock mass models, with many microfractures aligning parallel to the bedding direction, except for Per bedding.
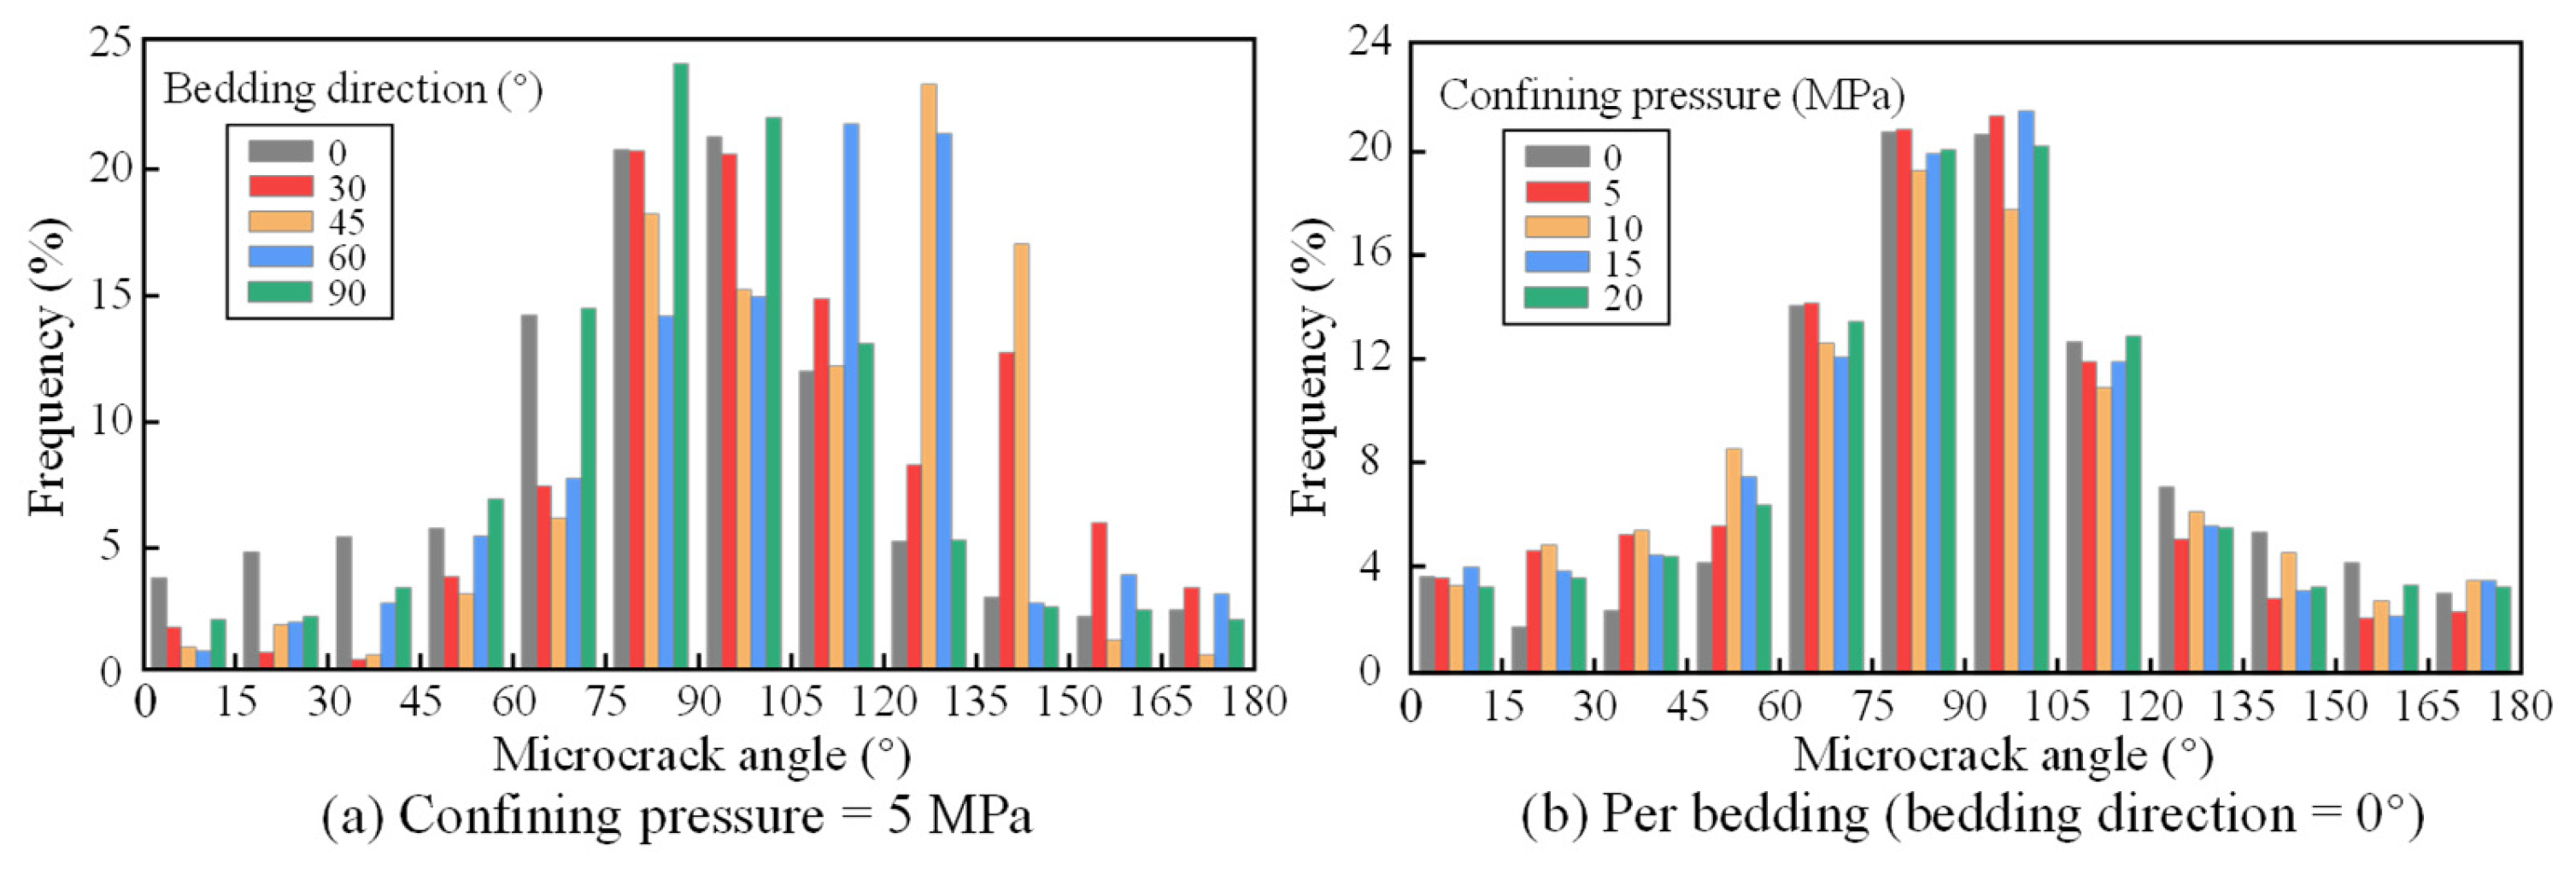
The frequency distribution of microfracture angles for different bedding directions (Figure 18a) is further analyzed, revealing a complex pattern. For Per and Par beddings, the frequency of microfracture angles below 105° is higher than that for bedding directions of 30°, 45°, and 60°. Specifically, when the bedding direction is 30°, the microfracture angles exhibit a bimodal distribution with peaks at 75° to 90° and 135° to 150°, and the frequency above 150° is relatively the highest. When the bedding direction is 45°, the microfracture angles exhibit a bimodal distribution with peaks at 75° to 90° and 120° to 135°, with the highest frequency occurring between 120° and 150°. For a bedding dip angle of 60°, the peak frequency is observed between 105° and 120°. These observations indicate that bedding direction significantly influences the propagation direction of microfractures.
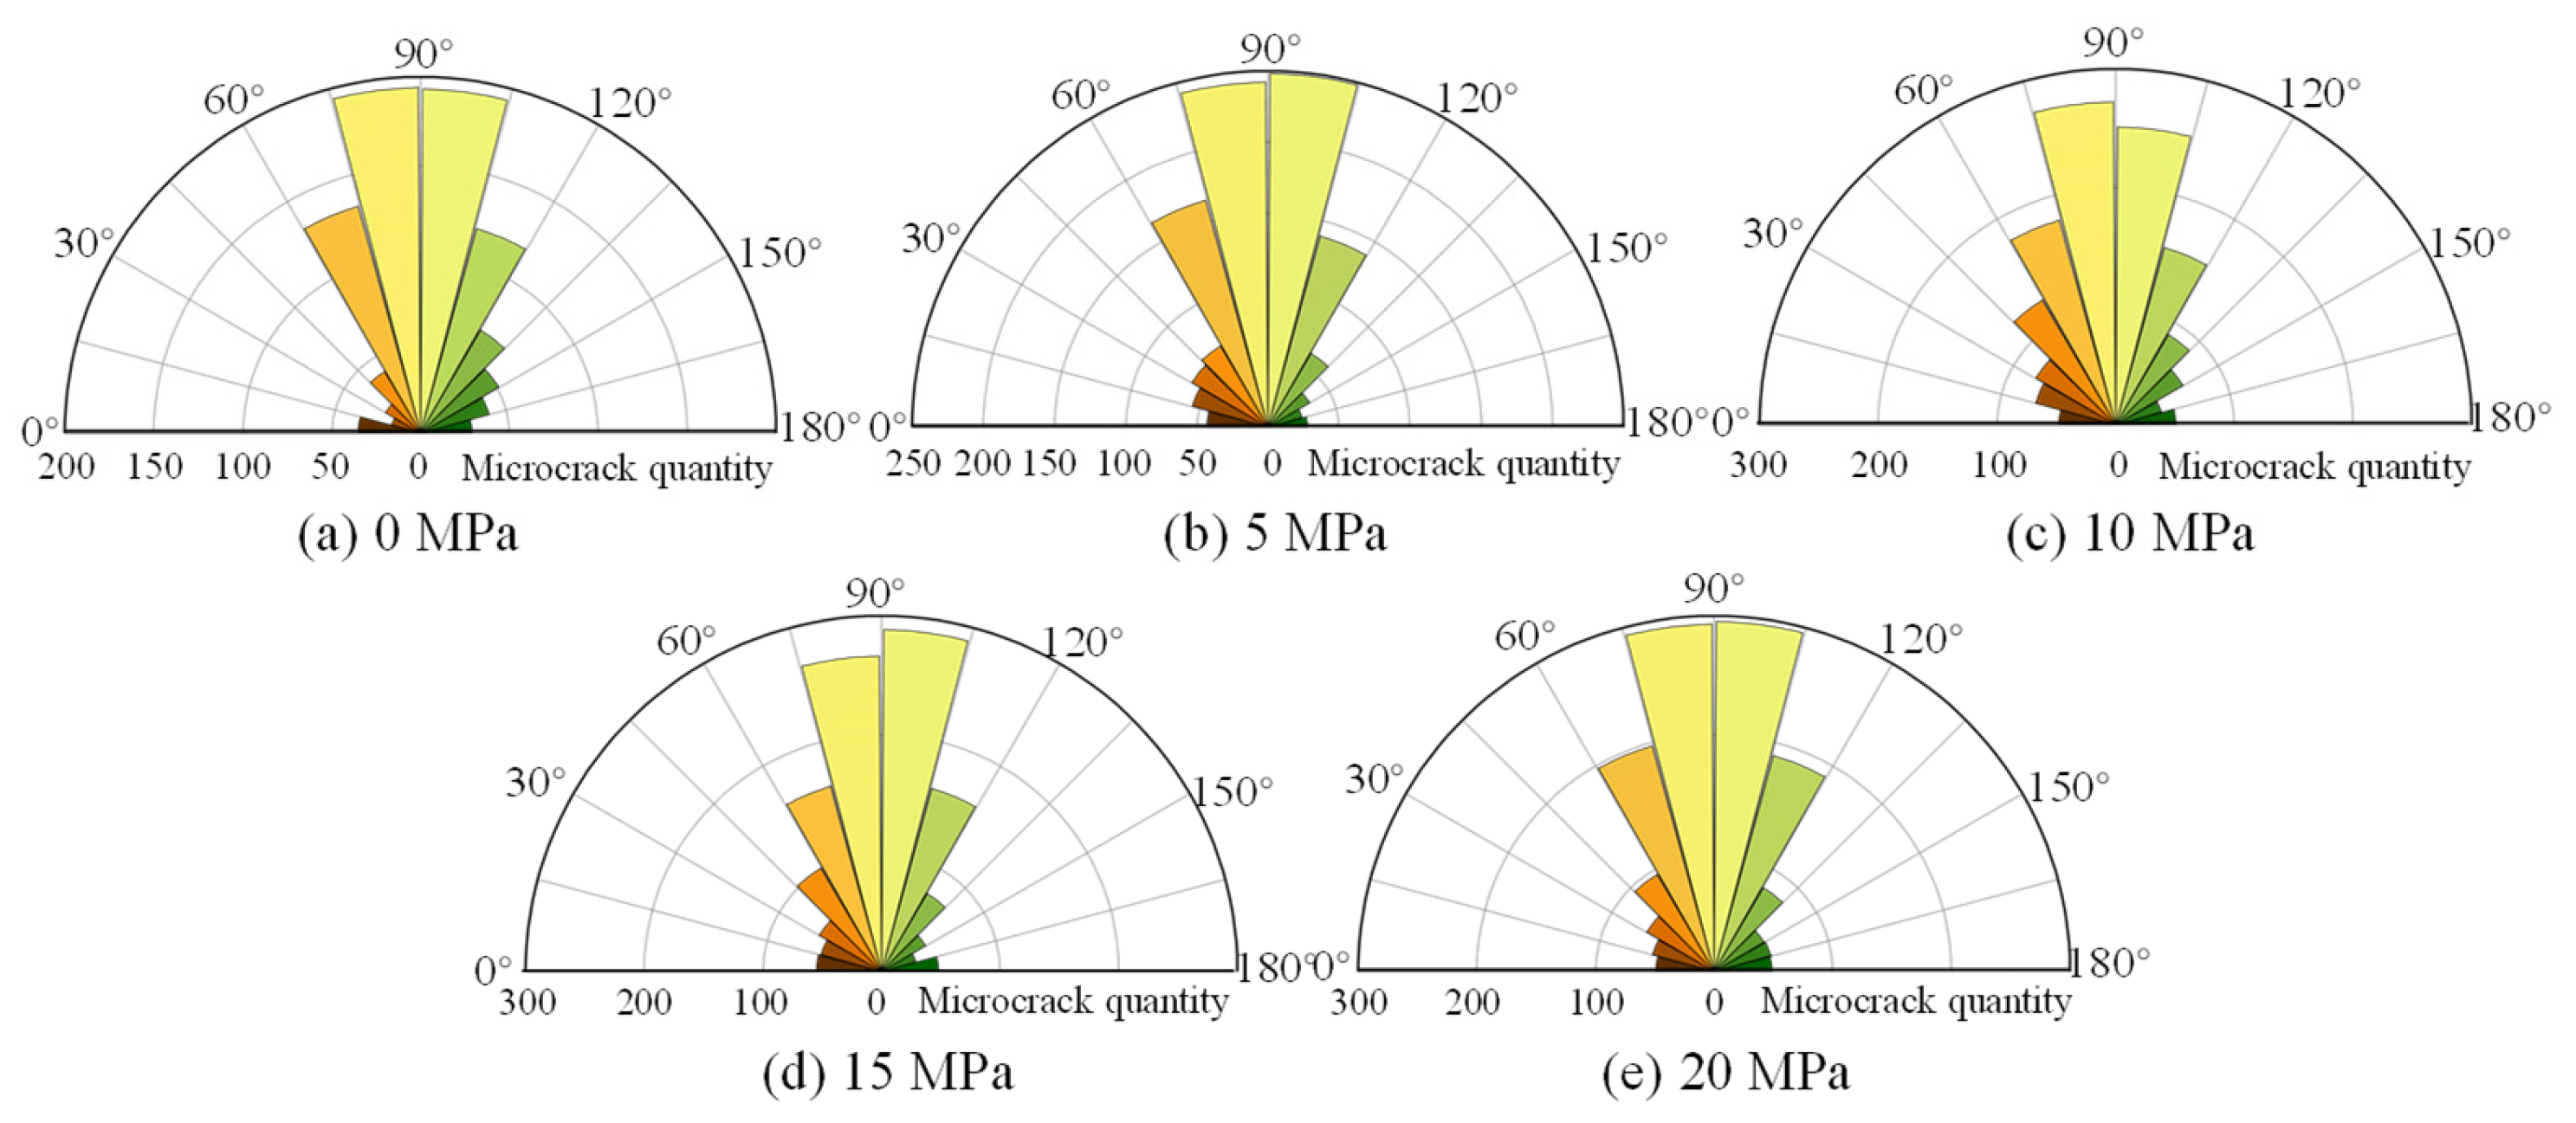
For Per bedding, Figure 19 presents the rose diagrams of microfracture angle distribution across various confining pressures. Confining pressure exerts a relatively minor influence on the microfracture angles, which are symmetrically distributed around the loading direction. As indicated in Figure 14b, the frequency distribution of microfracture angles under diverse confining pressures exhibits an Ω-shaped pattern. Most microfractures are inclined within the range of 60° to 120°, with only a few being nearly horizontal.
The results of microfracture evolution demonstrate that the patterns of microfracture quantity, length, and angle are predominantly influenced by bedding direction. Confining pressure primarily affects the rate of microfracture development and propagation but has a relatively minor impact on microfracture angle. Consequently, investigating the microfracture evolution mechanism of layered rock masses at various bedding directions is of paramount importance, as exemplified by oil shale. Such studies can enhance the efficiency and effectiveness of fracturing operations in oil shale reservoirs.

5. Conclusions

This study employed DEM to establish a series of biaxial compression numerical models for layered rock mass, incorporating the physical and mechanical parameters obtained from laboratory tests on Xinjiang Barkol oil shale. Subsequently, the evolution of macroscopic mechanical properties under different confining pressures and bedding directions was systematically analyzed. Furthermore, an innovative method for quantifying microfracture parameters was introduced, elucidating the microfracture evolution mechanism. The key findings are summarized as follows:
(1)
The macroscopic failure patterns of layered rock masses are governed by both bedding direction and confining pressure. Per bedding primarily exhibits splitting failure, while inclined beddings (30° to 60°) present combined shear-tension or shear-slip failures. For Par bedding, numerous vertical and intersecting fractures are observed along the loading direction.
(2)
The stress–strain behavior transforms from brittle to ductile as the bedding direction changes, and compressive strength displays a U-shaped variation with bedding direction. The lowest strength occurs at 45° to 60°, and higher confining pressures enhance both compressive strength and deformation capacity. The elastic modulus shows three stages of variation: an increase (Per bedding to 30°), a decrease (30° to 45°), and a re-increase (45° to Par bedding).
(3)
The proposed microfracture connection algorithm effectively links intersecting microfractures, enabling quantitative characterization of microfracture number, length, and orientation. The analysis reveals that inclined beddings contain more persistent and interconnected microfractures, which explains their lower compressive strength compared with Par and Per beddings.
(4)
The evolution of microfracture length reflects the transition from brittle to ductile failure. Under increasing bedding angle, the rate of fracture growth accelerates, while confining pressure mainly promotes microfracture interconnection without significantly altering their orientation.
(5)
This study establishes a multiscale framework that connects microfracture evolution with macroscopic mechanical behavior, providing theoretical support for the stability evaluation of layered rock slopes and practical guidance for optimizing in situ oil shale extraction. The proposed microfracture quantification method represents a novel tool for analyzing fracture mechanics in other layered geological materials.

Author Contributions

Conceptualization, X.L. and S.Z.; methodology, X.L., J.W. and S.Z.; software, H.Y.; validation, S.Z.; formal analysis, J.W., P.W. and H.Y.; investigation, J.C. and X.L.; data curation, X.L.; writing—original draft preparation, J.W.; writing—review and editing, X.L. and P.W.; visualization, H.Y.; supervision, S.Z.; project administration, X.L. and S.Z.; funding acquisition, J.W., S.Z. and J.C. All authors have read and agreed to the published version of the manuscript.

Funding

This work was financially funded by the National Natural Science Foundation of China (No. 42507226), the China Postdoctoral Science Foundation (No. 2025M770460), the Research Project of Sichuan 915 Construction Group Co., Ltd. (No. SC915KY202501), and the Scientific Research Project for the Transportation Power Pilot Program—Jilin Province Border Opening-Up Tourism Corridor (G331) (No. 2025ZDGC-01).

Institutional Review Board Statement

Not applicable.

Informed Consent Statement

Not applicable.

Data Availability Statement

All data that support the findings of this study are available from the corresponding author upon reasonable request.

Conflicts of Interest

Authors Xin Liu and Shuntao Zhang were employed by the company Sichuan 915 Construction Group Co., Ltd. The remaining authors declare that the research was conducted in the absence of any commercial or financial relationships that could be construed as a potential conflict of interest.

Abbreviations

The following abbreviations are used in this manuscript:
CTComputed tomography
UCSUniaxial compressive strength
FEMFinite element method
FDMFinite difference method
DEMDiscrete element method
UCTUniaxial compressive test
BPMBonded-particle model
PBMParallel bond model
CBMContact bond model
SJMSmooth-joint contact model

References

  1. Huang, H.W.; Yu, H.; Xu, W.L.; Lyu, C.S.; Micheal, M.; Xu, H.Y.; Liu, H.; Wu, H.A. A coupled thermo-hydro-mechanical-chemical model for production performance of oil shale reservoirs during in-situ conversion process. Energy 2023, 268, 126700. [Google Scholar] [CrossRef]
  2. Zhang, S.; Song, S.Y.; Zhang, W.; Zhao, J.M.; Cao, D.F.; Ma, W.L.; Chen, Z.J.; Ying, H. Research on the inherent mechanism of rock mass deformation of oil shale in-situ mining under the condition of thermal-fluid-solid coupling. Energy 2023, 280, 128149. [Google Scholar] [CrossRef]
  3. Wang, G.Y.; Liu, S.W.; Yang, D.; Fu, M.X. Numerical study on the in-situ pyrolysis process of steeply dipping oil shale deposits by injecting superheated water steam: A case study on Jimsar oil shale in Xinjiang, China. Energy 2022, 239, 122182. [Google Scholar] [CrossRef]
  4. Pan, Y.; Jia, Y.H.; Zheng, J.B.; Yang, S.C.; Bttina, H. Research progress of fracture development during in-situ cracking of oil shale. J. Anal. Appl. Pyrol. 2023, 174, 106110. [Google Scholar] [CrossRef]
  5. Huang, X.D.; Yang, D.; Wang, G.Y.; Zhang, K.D.; Zhao, J. Evolution patterns and anisotropic connectivity characteristics of pores and fissures in oil shale after steam heating at different temperatures. Nat. Resour. Res. 2025, 34, 409–425. [Google Scholar] [CrossRef]
  6. Wang, Y.; Zhai, C.; Liu, T.; Yu, X.; Xu, J.Z.; Sun, Y.; Cong, Y.Z.; Tang, W.; Zheng, Y.F.; Luo, N. Analysis of fracture network formation mechanisms and main controlling factors of methane explosion fracturing in deep shale reservoir. Rock Mech. Rock Eng. 2024, 57, 7125–7147. [Google Scholar] [CrossRef]
  7. Zhou, J.; Wu, G.A.; Geng, Y.N.; Guo, Y.T.; Chang, X.; Peng, C.Y.; Ai, C.Z. Laboratory study of the factors affecting hydraulic fracturing effect for inter-salt oil shale layers, Qianjiang Depression, China. Petrol. Sci. 2023, 20, 1690–1706. [Google Scholar] [CrossRef]
  8. He, M.C.; Nie, W.; Zhao, Z.Y.; Guo, W. Experimental investigation of bedding plane orientation on the rockburst behavior of sandstone. Rock Mech. Rock Eng. 2012, 45, 311–326. [Google Scholar] [CrossRef]
  9. Liu, Y.; Dai, F.; Feng, P.; Xu, N.W. Mechanical behavior of intermittent jointed rocks under random cyclic compression with different loading parameters. Soil Dyn. Earthq. Eng. 2018, 113, 12–24. [Google Scholar] [CrossRef]
  10. Yin, P.F.; Yang, S.Q. Experimental investigation of the strength and failure behavior of layered sandstone under uniaxial compression and Brazilian testing. Acta Geophys. 2018, 66, 585–605. [Google Scholar] [CrossRef]
  11. Wen, S.; Huang, R.Z.; Zhang, C.S.; Zhao, X.W. Mechanical behavior and failure mechanism of composite layered rocks under dynamic tensile loading. Int. J. Rock Mech. Min. Sci. 2023, 170, 105533. [Google Scholar] [CrossRef]
  12. Xin, J.; Jiang, Q.; Gong, F.Q.; Liu, L.; Liu, C.; Liu, Q.; Yang, Y.; Chen, P.F. Mechanical behaviors of backfill-rock composites: Physical shear test and back-analysis. J. Rock Mech. Geotech. Eng. 2023, 16, 807–827. [Google Scholar] [CrossRef]
  13. Kimberley, J.; Ramesh, K.T.; Barnouin, O.S. Visualization of the failure of quartz under quasi-static and dynamic compression. J. Geophys. Res. 2010, 115, B08207. [Google Scholar] [CrossRef]
  14. Amitrano, D.; Gruber, S.; Girard, L. Evidence of frost-cracking inferred from acoustic emissions in a high-alpine rock-wall. Earth Planet. Sci. Lett. 2012, 341, 86–93. [Google Scholar] [CrossRef]
  15. Kumar, S.; Das, A.; Tiwari, G. A comparative study on the dynamic loading response of heat-treated soft and medium hard rocks. Eng. Fract. Mech. 2023, 292, 109579. [Google Scholar] [CrossRef]
  16. Miguel, C.R.S.; Petropoulos, N.; Yi, C.P.; Johansson, D. Experimental investigation of blast-induced crack propagation based on digital image correlation analysis. Shock Vib. 2024, 1, 4149322. [Google Scholar] [CrossRef]
  17. Okamoto, A.; Tanaka, H.; Watanabe, N.; Saishu, H.; Tsuchiya, N. Fluid pocket generation in response to heterogeneous reactivity of a rock fracture under hydrothermal conditions. Geophys. Res. Lett. 2017, 44, 10306–10315. [Google Scholar] [CrossRef]
  18. Xu, W.J.; Zhang, H.Y. Meso and macroscale mechanical behaviors of soil–rock mixtures. Acta Geotech. 2022, 17, 3765–3782. [Google Scholar] [CrossRef]
  19. Yang, S.Q.; Dong, J.P.; Yang, J.; Yang, Z.; Huang, Y.H. An experimental investigation of failure mechanical behavior in cylindrical granite specimens containing two non-coplanar open fissures under different confining pressures. J. Cent. South Univ. 2022, 29, 1578–1596. [Google Scholar] [CrossRef]
  20. Wang, X.Z.; Jiang, L.S.; Li, Y.Y.; Zhang, L.; Sainoki, A.; Mitri, H.S.; Yang, Y.M.; Peng, X.H. Experimental study on the mechanical behavior and failure characteristics of rock analogs with filled internal fractures: A new method by sand powder 3D printing. Constr. Build. Mater. 2024, 427, 136261. [Google Scholar] [CrossRef]
  21. Xu, J.; Pu, H.; Sha, Z.H. Influence of microstructure on dynamic mechanical behavior and damage evolution of frozen–thawed sandstone using computed tomography. Materials 2022, 16, 119. [Google Scholar] [CrossRef]
  22. Zhang, X.Y.; Guo, P.F.; Gao, X.B.; Zou, C.J.; Wang, K.Y.; Hu, J.Z.; Sun, Y.; Lei, L. Crack and failure behaviors of sandstone subjected to dynamic loads visualized by micro-computed tomography. J. Rock Mech. Geotech. Eng. 2024, 17, 1459–1473. [Google Scholar] [CrossRef]
  23. Peta, K.; Stemp, W.J.; Stocking, T.; Chen, R.; Love, G.; Gleason, M.A.; Houk, B.A.; Brown, C.A. Multiscale geometric characterization and discrimination of dermatoglyphs (fingerprints) on hardened clay—A novel archaeological application of the GelSight Max. Materials 2025, 18, 2939. [Google Scholar] [CrossRef] [PubMed]
  24. Elmo, D.; Stead, D.; Eberhardt, E.; Vyazmensky, A. Applications of finite/discrete element modeling to rock engineering problems. Int. J. Geomech. 2013, 13, 565–580. [Google Scholar] [CrossRef]
  25. Mahabadi, O.K.; Tatone, B.S.A.; Grasselli, G. Influence of microscale heterogeneity and microstructure on the tensile behavior of crystalline rocks. J. Geophys. Res. 2014, 119, 5324–5341. [Google Scholar] [CrossRef]
  26. Gutiérrez-Ch, J.G.; Senent, S.; Melentijevic, S.; Jimenez, R. Distinct element method simulations of rock-concrete interfaces under different boundary conditions. Eng. Geol. 2018, 240, 123–139. [Google Scholar] [CrossRef]
  27. Koyama, T.; Fardin, N.; Jing, L.; Stephansson, O. Numerical simulation of shear-induced flow anisotropy and scale-dependent aperture and transmissivity evolution of rock fracture replicas. Int. J. Rock Mech. Min. Sci. 2006, 43, 89–106. [Google Scholar] [CrossRef]
  28. Zhang, H.H.; Guo, Q.L.; Wang, Y.W.; Tang, S.B.; Li, T.J.; Zhang, Q.; Tang, C.A. Cross-scale analysis on the mechanical behavior of the conglomerate of Yulin Grottoes in China. Int. J. Rock Mech. Min. Sci. 2024, 178, 105750. [Google Scholar] [CrossRef]
  29. Yu, H.D.; Chen, W.Z.; Ma, Y.S.; Gong, Z.; Tian, H.M.; Yuan, J.Q. Thermo-hydro-mechanical behavior of a clayey rock: A constitutive approach and numerical validation. Case Stud. Therm. Eng. 2022, 39, 102424. [Google Scholar] [CrossRef]
  30. Zhuo, X.; Liu, X.J.; Shi, X.C.; Liang, L.X.; Xiong, J. The anisotropic mechanical characteristics of layered rocks under numerical simulation. J. Pet. Explor. Prod. Tech. 2022, 12, 51–62. [Google Scholar] [CrossRef]
  31. Zhang, J.P.; Li, K.S.; Li, Y.; Liu, C.X.; Xu, J.H.; He, J.P. Applying novel micro–nano-siliceous grouting material improves mechanical behaviors of fractured rock masses and microscopic characteristics of slurry–rock interface: Experimental and numerical simulation investigations. Rock Mech. Rock Eng. 2024, 57, 8297–8321. [Google Scholar] [CrossRef]
  32. Jin, L.; Zeng, Y.; Xia, L.; Ye, Y. Experimental and numerical investigation of mechanical behaviors of cemented soil–rock mixture. Geotech. Geol. Eng. 2017, 35, 337–354. [Google Scholar] [CrossRef]
  33. Gong, H.L.; Wang, G.; Luo, Y.; Liu, T.; Li, X.; Liu, X. Shear failure and mechanical behaviors of granite with discontinuous joints under dynamic disturbance: Laboratory tests and numerical simulation. Arch. Civ. Mech. Eng. 2023, 23, 171. [Google Scholar] [CrossRef]
  34. Huang, Y.H.; Yang, S.Q.; Tian, W.L. An experimental and numerical investigation on mechanical behavior of sandstone specimens saturated in brine. Comput. Geotech. 2023, 163, 105740. [Google Scholar] [CrossRef]
  35. Gong, X.; Zhao, C.; Chen, H.G.; Zhang, G.; Zhang, B.Y.; Xing, J.Q. Crack evolution and mechanical behavior of granite with topological flaws under uniaxial compression. Geotech. Geol. Eng. 2024, 43, 19. [Google Scholar] [CrossRef]
  36. Guo, P.Y.; Zhang, P.; Bu, M.H.; Wang, J.M.; Zheng, X.; He, M.C. Microcracking behavior and damage mechanism of granite subjected to high temperature based on CT-GBM numerical simulation. Comput. Geotech. 2023, 159, 105385. [Google Scholar] [CrossRef]
  37. Han, L.L.; Li, X.Z.; Liu, Z.Y.; Guo, W.; Cui, Y.; Qian, C.; Huang, Y.Z. Study on rock mechanics characteristics of deep shale in Luzhou block and the influence on reservoir fracturing. Energy Sci. Eng. 2023, 11, 4–21. [Google Scholar] [CrossRef]
  38. Yuan, W.; Wang, W.; Su, X.B.; Li, J.X.; Li, Z.H.; Wen, L.; Chang, J.F. Numerical study of the impact mechanism of decoupling charge on blasting-enhanced permeability in low-permeability sandstones. Int. J. Rock Mech. Min. Sci. 2018, 106, 300–310. [Google Scholar] [CrossRef]
  39. Han, J.L.; Wang, J.; Dong, W.C.; Wang, S.N.; Sun, Q.; Li, T.Y.; Xu, Z.X.; Zhang, Y.X.; Zhang, W. A new algorithm for high-speed identification of discontinuities on large-scale rock outcrop: A case study in Jinsha River suture zone. J. Rock Mech. Geotech. Eng. 2025, in press. [CrossRef]
  40. Wang, J.; Zhang, W.; Yin, H.; Wang, Y.; Han, J.; Chen, J. Stability analysis of a high-steep slope based on multi-scale structural geological model and 3D fracture connectivity. Landslides 2025, 22, 3081–3094. [Google Scholar] [CrossRef]
  41. Potyondy, D.O.; Cundall, P.A. A bonded-particle model for rock. Int. J. Rock Mech. Min. Sci. 2004, 41, 1239–1364. [Google Scholar] [CrossRef]
  42. Huang, D.; Cen, D.; Ma, G.; Huang, R.Q. Step-path failure of rock slopes with intermittent joints. Landslides 2015, 12, 911–926. [Google Scholar] [CrossRef]
  43. Huang, Y.H.; Yang, S.Q.; Zhao, J. Three-dimensional numerical simulation on triaxial failure mechanical behavior of rock-like specimen containing two unparallel fissures. Rock Mech. Rock Eng. 2016, 49, 4711–4729. [Google Scholar] [CrossRef]
  44. Ivars, D.M.; Pierce, M.E.; Darcel, C.; Reyes-Montes, J.; Potyondy, D.O.; Young, R.P.; Cundall, P.A. The synthetic rock mass approach for jointed rock mass modelling. Int. J. Rock Mech. Min. Sci. 2011, 48, 219–244. [Google Scholar] [CrossRef]
  45. Zhang, Y.L.; Shao, J.F.; Saxcé, G.D.; Shi, C.; Liu, Z.B. Study of deformation and failure in an anisotropic rock with a three-dimensional discrete element model. Int. J. Rock Mech. Min. Sci. 2019, 120, 17–28. [Google Scholar] [CrossRef]
  46. Chen, C.; Wu, A.; Wang, S.; Gong, W.; Sun, W.; Gao, T. Effect of layering characteristics on compressive mechanical properties and damage mechanisms of rocks: Experiments and models. PLoS ONE 2025, 20, e0318603. [Google Scholar] [CrossRef]
  47. Liu, H.; Zuo, J.; Topal, E.; Liu, Y.; Lei, B.; Li, D. A new layered rock constitutive model incorporating confining pressure and bedding angle weights based on orthogonal matrix analysis. Environ. Earth Sci. 2024, 83, 280. [Google Scholar] [CrossRef]
  48. Bian, K.; Chen, Y.A.; Liu, J.; Cui, D.S.; Li, Y.R.; Liang, W.D.; Han, X. The unloading failure characteristics of shale under different water absorption time using the PFC numerical method. Rock Soil Mech. 2020, 41, 355–367. (In Chinese) [Google Scholar] [CrossRef]
  49. Fakhimi, A.; Villegas, T. Application of dimensional analysis in calibration of a discrete element model for rock deformation and fracture. Rock Mech. Rock Eng. 2007, 40, 193–211. [Google Scholar] [CrossRef]
  50. Xu, Z.H.; Wang, Z.Y.; Wang, W.Y.; Lin, P.; Wu, J. An integrated parameter calibration method and sensitivity analysis of microparameters on mechanical behavior of transversely isotropic rocks. Comput. Geotech. 2022, 142, 104573. [Google Scholar] [CrossRef]
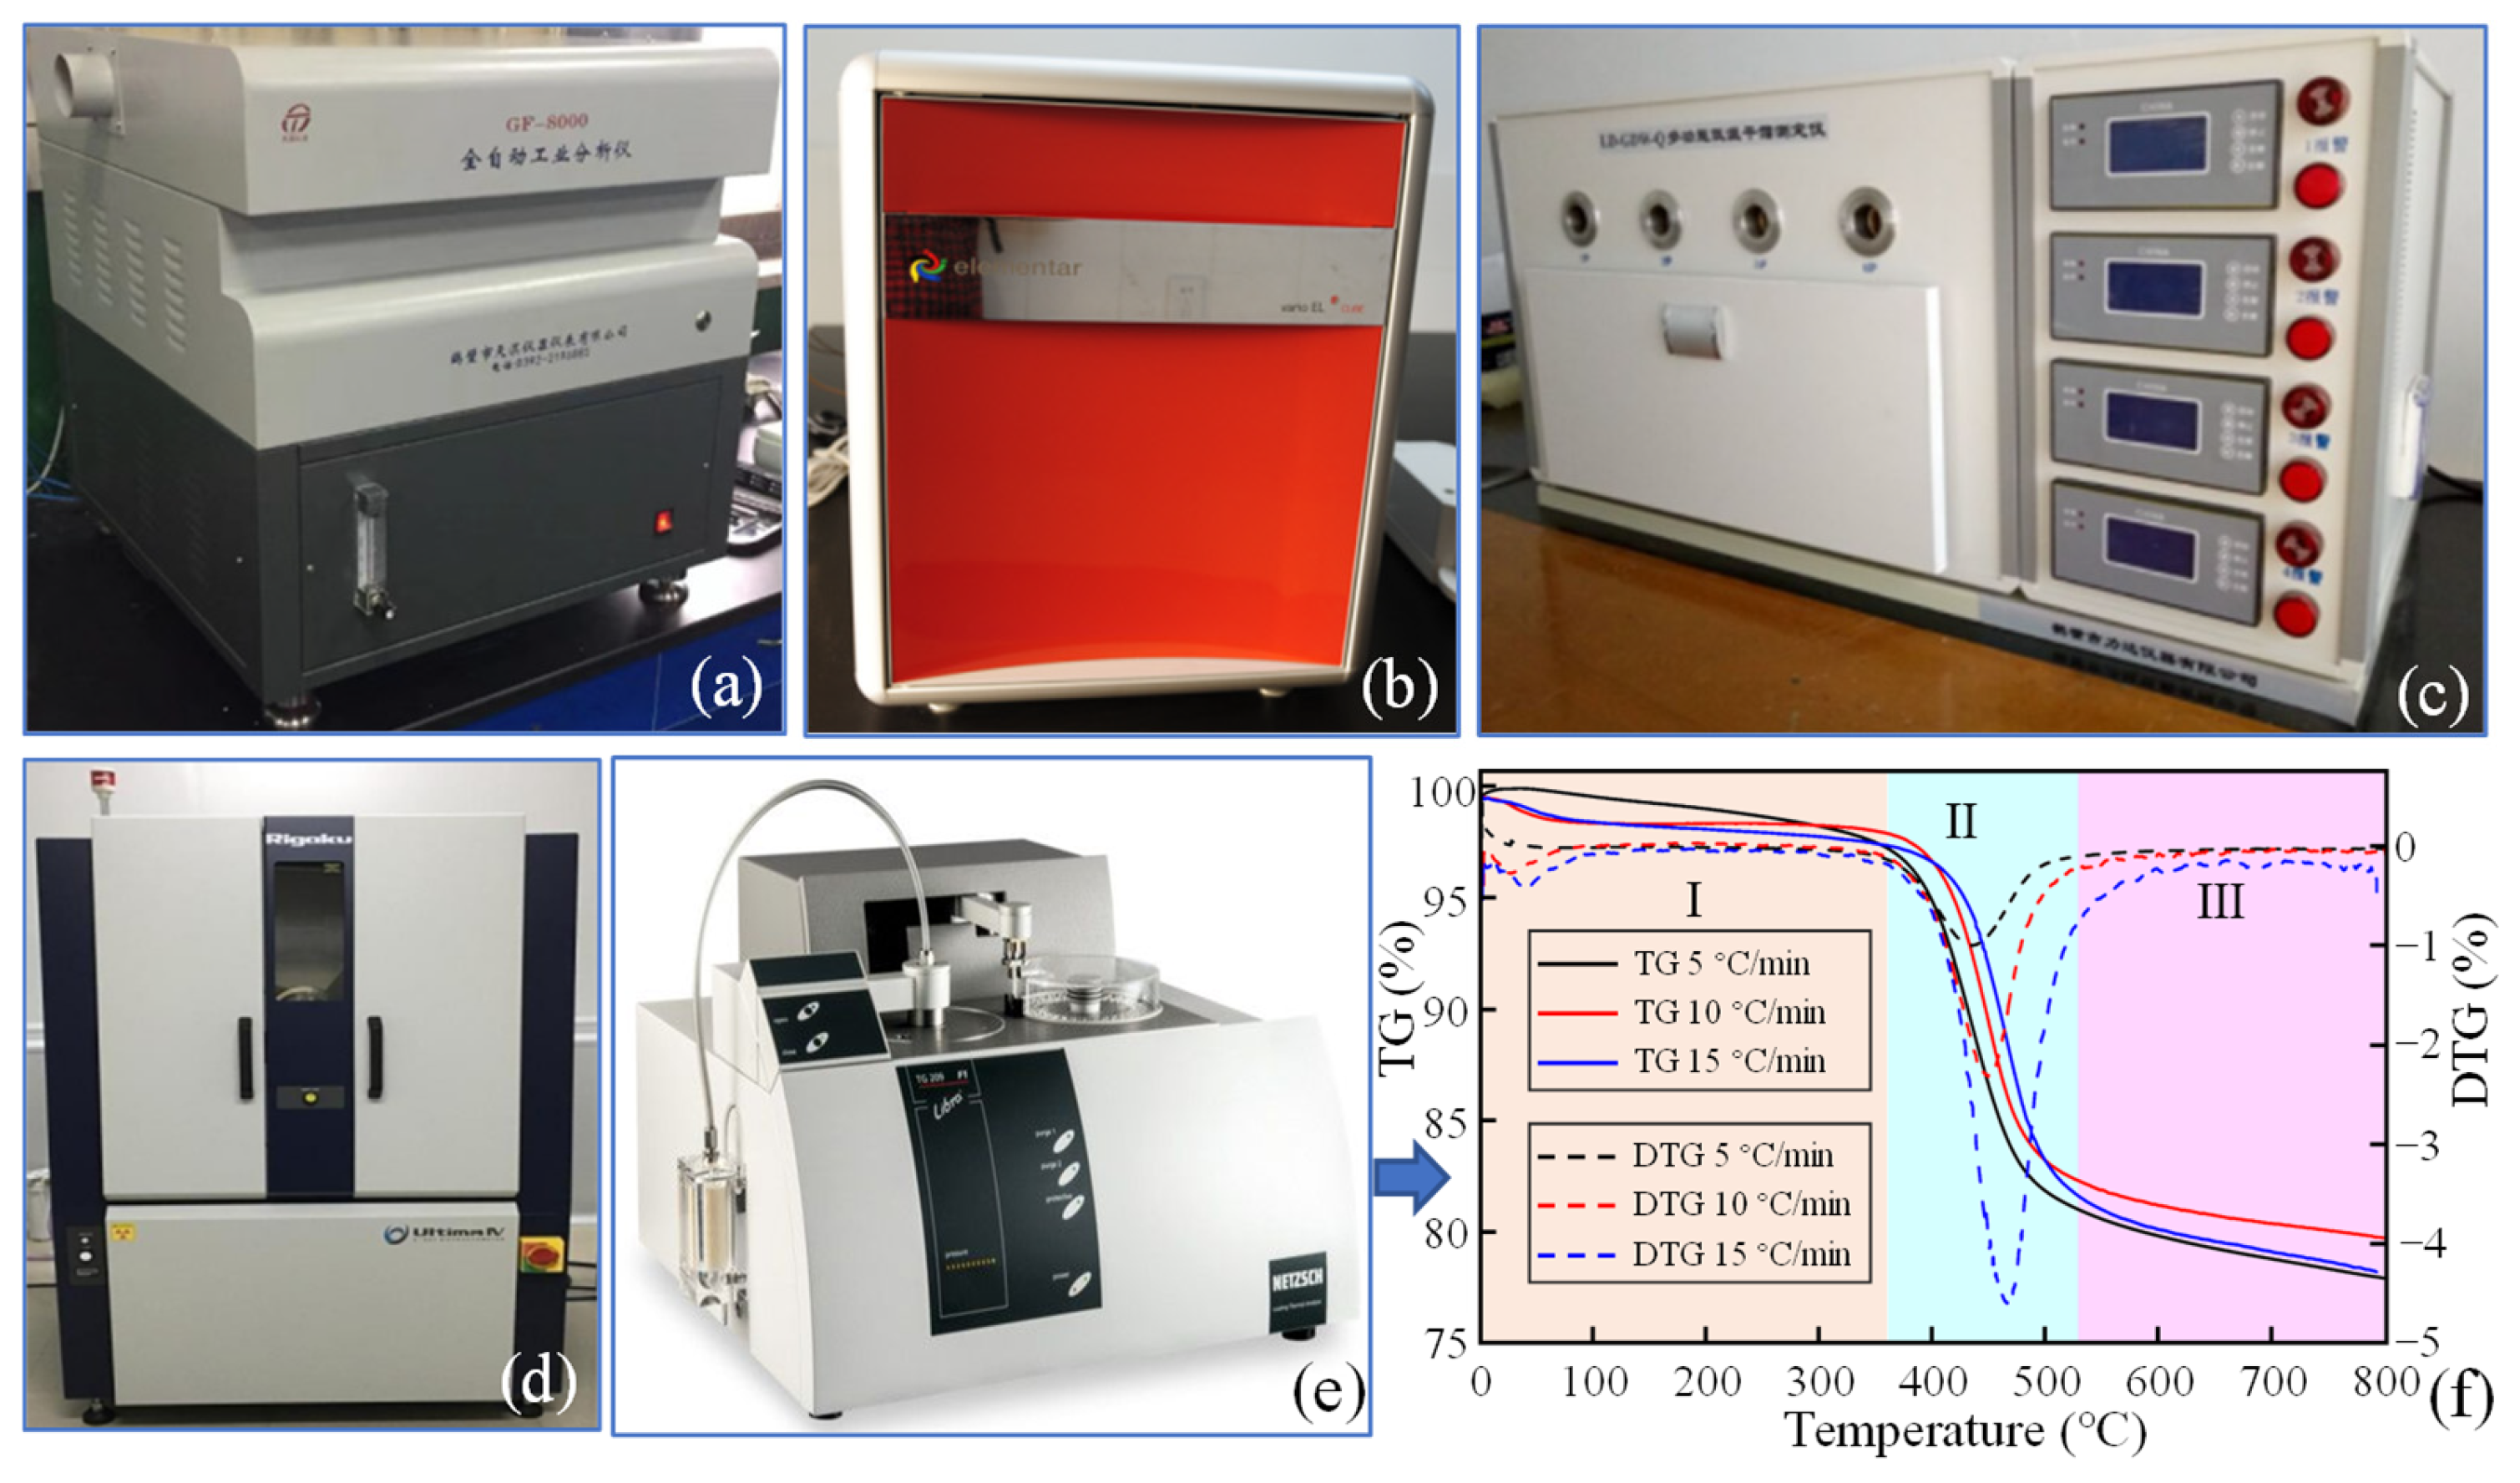
Figure 1. Test instruments and results of physical property. (a) Proximate analysis; (b) element analyzer; (c) aluminum retort furnace; (d) X-ray diffractometer; (e) thermal analyzer; (f) TG-DTG curve.
Applsci 15 12178 g001
Figure 2. The XRD graph of oil shale.
Applsci 15 12178 g002
Figure 3. Test instrument and results of mechanical property. (a) YAW50B microcomputer-controlled machine; (b) sample failure condition; (c) test curves.
Applsci 15 12178 g003
Figure 4. Microscopic constitutive model in PFC. (a) CBM; (b) PBM.
Applsci 15 12178 g004
Figure 5. Flat fracture generated by SJM and rough fracture generated by weakened PBM.
Applsci 15 12178 g005
Figure 6. Layered rock mass models for five different beddings based on DEM (PFC2D).
Applsci 15 12178 g006
Figure 7. Macroscopic failure of layered rock mass models based on DEM (PFC2D). Bedding directions of (a) 0°; (b) 30°; (c) 45°; (d) 60°; (e) 90°.
Applsci 15 12178 g007
Figure 8. Stress–strain relationships under diverse confining pressures and bedding directions.
Applsci 15 12178 g008
Figure 9. Curve of compressive strength and elastic modulus as a function of bedding directions. (a) Curve of compressive strength; (b) curve of elastic modulus.
Applsci 15 12178 g009
Figure 10. Tension and shear microfractures visualized in PFC under confining pressure of 20 MPa.
Applsci 15 12178 g010
Figure 11. Flowchart of the proposed scheme for microfracture connection and quantification.
Applsci 15 12178 g011
Figure 12. Diagram of microfracture grouping and connection. (a) Particle grouping; (b) microfracture grouping; (c) microfracture connection; (d) non-persistent microfracture and persistent crack.
Applsci 15 12178 g012
Figure 13. Comparison between the connected fracture network and the original PFC microfracture distribution. (a) The original PFC microfracture distribution; (b) the connected fracture network.
Applsci 15 12178 g013
Figure 14. Evolution of microfracture quantity under different bedding directions (confining pressure = 5 MPa).
Applsci 15 12178 g014
Figure 15. Evolution of microfracture quantity under different confining pressures (Per bedding).
Applsci 15 12178 g015
Figure 16. Evolution of total and average microfracture length under different bedding directions and confining pressures. Effect of bedding direction under 5 MPa confining pressures: (a) total microfracture length; (b) average microfracture length. Effect of confining pressure for specimens with Per bedding (bedding direction = 0°): (c) total microfracture length; (d) average microfracture length.
Applsci 15 12178 g016
Figure 17. Distribution of microfracture angles under different bedding directions (confining pressure = 5 MPa).
Applsci 15 12178 g017
Figure 18. Frequency of microfracture angles under different bedding directions and confining pressures.
Applsci 15 12178 g018
Figure 19. Distribution of microfracture angle under different confining pressures (Per bedding).
Applsci 15 12178 g019
Table 1. Physical properties of Barkol oil shale.
Industrial Components (%)
AshFixed CarbonWaterVolatiles
70.367.093.1119.44
Organic elements (%)
CNHS
18.1740.7552.4890.936
Physiochemical indicators
Total moisture yield (%)Oil content (%)Semi-coke yield (%)Gas loss rate (%)
4.7511.8980.333.03
Diffraction results
Primary minerals (%)Clay minerals (%)
QKfsPlPyI/SKIC
36.114.27.52.016.011.88.34.1
Table 2. Mechanical properties of Barkol oil shale.
DirectionsNo.UCS (MPa)E (GPa)
Per beddingPer158.822.815
Per251.352.490
Per349.802.236
Average53.342.514
Par beddingPar142.293.265
Par237.323.470
Par335.453.823
Average38.353.519
Table 3. Micro-parameters in PFC.
Micro-ParametersValue
Minimum particle diameter, R m i n (mm)0.16
Particle size ratio, R m a x / R m i n 1.5
Particle density, ρ (kg/m3)2222
Contact normal-to-shear stiffness ratio, k n / k s 1.5
Parallel bond modulus, E c (GPa)2.6
Parallel bond tensile strength, σ c (MPa)32.0
Parallel bond cohesion, C (MPa)48.0
Parallel bond friction angle, (°)32.0
Reduction coefficients of strength0.08
Reduction coefficients of stiffness0.1
Disclaimer/Publisher’s Note: The statements, opinions and data contained in all publications are solely those of the individual author(s) and contributor(s) and not of MDPI and/or the editor(s). MDPI and/or the editor(s) disclaim responsibility for any injury to people or property resulting from any ideas, methods, instructions or products referred to in the content.