Article

Drought Forecasting Using Standard Precipitation Index and Artificial Intelligence Models in the Mediterranean Region of Türkiye

1
Faculty of Technology, Department of Civil Engineering, Fırat University, Elazığ 23200, Türkiye
2
Vocational School of Technical Sciences, Department of Computer Engineering, Fırat University, Elazığ 23200, Türkiye
*
Author to whom correspondence should be addressed.
Appl. Sci. 2025, 15(22), 12172; https://doi.org/10.3390/app152212172
Submission received: 10 October 2025 / Revised: 5 November 2025 / Accepted: 9 November 2025 / Published: 17 November 2025
(This article belongs to the Special Issue Effects of Climate Change on Hydrology)

Abstract

The ongoing drought constitutes a pivotal environmental challenge for the Mediterranean Region of Türkiye, where elevated climatic variability and erratic precipitation patterns result in considerable agricultural and hydrological stress. This study applied two artificial intelligence models—artificial neural network (ANN) and Random Forest (RF)—to forecast meteorological drought using the Standardized Precipitation Index (SPI) derived from nearly a century of monthly precipitation data (1929–2024) across eight provinces: Adana, Antalya, Burdur, Hatay, Isparta, Kahramanmaraş, Mersin, and Osmaniye. The models were evaluated at four accumulation periods (SPI-3, SPI-6, SPI-12, and SPI-24) using multiple statistical indicators. The findings indicated that artificial neural networks (ANNs) attained the highest predictive accuracy at extended timescales (SPI-12 and SPI-24), with R2 values reaching up to 0.94. This outcome signifies the capacity of ANNs to discern nonlinear and persistent drought patterns. The RF model exhibited enhanced stability and responsiveness in short-term forecasts (SPI-3, R2 = 0.89), effectively reproducing rapid fluctuations in rainfall. The comparative findings underscore the complementary strengths of the two models: ANN is better suited for the analysis of long-term drought trends and the study of climate adaptation, while RF offers reliable, low-complexity forecasting for the operational monitoring of drought. Utilizing solely precipitation data, the approach furnishes a cost-effective and transferable framework for data-limited regions. The study proposes a reproducible AI-based methodology that enhances the precision of drought prediction, supports early-warning applications, and strengthens regional water resource management under increasing climatic uncertainty.

1. Introduction

Drought is defined as a natural disaster with the capacity to exert a deleterious effect on agricultural production, the management of water resources, and the equilibrium of ecosystems. It is widely acknowledged that there are four primary classifications of drought: meteorological, agricultural, hydrological and socioeconomic. Meteorological drought is defined as a period of prolonged low precipitation, which forms the foundation for the development of early-warning systems.
A range of methodologies are employed in the analysis of drought. The most prevalent of these is the SPI, which can be utilized to analyze various drought types depending on the timescale under consideration [1].
In recent times, artificial intelligence (AI) methods have become extensively utilized in the endeavor to address climate and environmental issues. It is evident that deep learning and machine learning methods hold considerable potential in the prediction of challenging phenomena, such as drought [2,3].

1.1. Related Studies

Recent studies have demonstrated that artificial intelligence (AI) and machine learning (ML) techniques can significantly improve the accuracy and reliability of drought forecasts, compared with traditional statistical models. These methods are particularly effective when applied across different climatic regions and indices of drought, such as SPI, SPEI, and SSI.
Among the most prevalent models, Long Short-Term Memory (LSTM) neural networks are notable for their ability to capture temporal dependencies in hydrometeorological data. In some studies, the superiority of LSTMs has been demonstrated over conventional neural networks in SPI-based drought forecasting, particularly in scenarios involving multiple steps of prediction [4]. Similarly, in India’s Wardha River Basin, LSTM achieved an R2 greater than 0.92 in SSI-24 forecasting, outperforming multi-layer perceptron (MLP) networks at longer lead times [5]. This was improved by developing the LSTM model with wavelet decomposition in the Konya region of Türkiye [6], achieving near-perfect accuracy (NSE = 0.9941).
Other comparative studies have been conducted to benchmark LSTMs against various AI models. For example, various AI methods were evaluated [7], and it was determined that hybrid models combining neural networks with decomposition techniques, such as wavelet transforms, were more accurate at forecasting discharge time series. Similarly, multiple drought indices were compared across Türkiye, and it was found that the SPI was particularly responsive to meteorological variations and could serve as a reliable input for AI-based modeling.
Support vector regression (SVR) and wavelet-integrated approaches also offer promising results. Another study found that combining wavelet decomposition with SVR and artificial neural networks (ANNs) significantly improved short-term SPI forecasts in Ethiopia [8]. In a similar vein, it has been demonstrated that multiple machine learning (ML) models, including Random Forests and gradient boosting, can accurately forecast SPI values using solely precipitation data [2].
Fuzzy logic methods, such as ANFIS (Adaptive Neuro-Fuzzy Inference System) and fuzzy c-means clustering, remain valuable for addressing uncertainty in drought classification. It was posited [9] that fuzzy frameworks permit more continuous and realistic interpretations of drought severity than threshold-based classification does.
Hybrid models that blend optimization algorithms with machine learning (ML), such as support vector machine (SVM)-partitioned optimal allocation (POA) or artificial neural network (ANN)-M5P, have been implemented in various arid and semi-arid environments. The findings of the study [10] demonstrated that SVM-POA achieved the lowest Root Mean Square Error (RMSE) and the highest normalized skill score (NSE) for agricultural SPI prediction in southern Iran, thus outperforming competing models.
Remote-sensing data, particularly MODIS-based NDVI (Normalized Difference Vegetation Index) and LST (Land Surface Temperature) imagery, has further enhanced the capabilities of drought monitoring. Furthermore, the models CNN, ConvLSTM, and XGBoost were utilized [11] for the purpose of predicting the Vegetation Health Index (VHI). Similar models were implemented [12] in Thrace, Türkiye, and a strong correlation was observed between the SPI and VHI.
From a regional hydrological perspective, the impact of climate variability on river discharge in the Lake Tana Basin was emphasized [13], suggesting that machine learning methods must be adapted to local hydrological behavior. In a similar vein, it was reported [8] that SPI forecasts in the Awash River Basin exhibited enhanced performance when integrating wavelet transforms with machine learning methodologies.
Comprehensive reviews also highlight the increasing prominence of ML methods. For instance, a comprehensive review [14] of 105 studies revealed that ANNs were the most prevalent technique, with RNNs and LSTMs ranking as the second and third most common. Moreover, emphasis was placed on [15] the operational integration of AI in early-warning systems, with particular reference to the necessity for explainability and interpretability in model design.
In certain studies, SARIMA-based stochastic time series models were employed to generate precipitation and temperature projections for Türkiye between 2020 and 2050 [16]. Additionally, drought assessments were conducted using the SPEI index. The results indicated very high accuracy in temperature forecasts (correlation ≈ 0.99, RMSE ≈ 1.46) and moderate accuracy in precipitation forecasts (correlation ≈ 0.66, RMSE ≈ 34.6). Furthermore, drought return intervals and spatial drought maps were produced across a range of timescales (SPEI-3, SPEI-6, SPEI-9, SPEI-12).
A meteorological drought analysis was conducted [17] in the Aras and Coruh Basins of north-eastern Türkiye. The analysis utilized monthly precipitation data from 1969 to 2020 and the SPI. The Crossing Empirical Trend Analysis (CETA) method was introduced, which revealed increasing trends in drought severity at most stations. May, June, and November showed the strongest upward trends, with Ardahan station identified as the most drought-sensitive location.
In a further study [18], precipitation and temperature records from all 81 provinces of Türkiye were examined for the period 1991–2020. The Innovative Trend Pivot Analysis Method (ITPAM) was utilized in this analysis. The findings showed that 67% of monthly average temperature series exhibited increasing trends, while precipitation records were split between increasing (41%), decreasing (41%), and no-trend (18%) categories. The study highlighted ITPAM as a robust tool for detecting climate change impacts at the national scale.
In the Wami River sub-catchment of Tanzania [19], five machine learning algorithms (LSTM, MARS, SVM, ELM, and M5 Tree) were applied to predict SPI-6 and SPI-9 using rainfall data from 1990 to 2022. The results demonstrated that LSTM achieved the best performance, with NSE and correlation values approaching 0.99, confirming its strong predictive capability for drought forecasting. This study highlights the critical role of ML models in developing effective drought early-warning systems in East Africa.
A hybrid “stacked” approach was proposed for integrating convolutional neural networks (CNNs) with machine learning algorithms, including LSTM, RF, SVR, and XGB, with the objective of forecasting the Palmer Drought Severity Index (PDSI) across eight governorates in Upper Egypt [20]. Among these, the CNN-LSTM hybrid performed best, achieving R2 and NSE values of 0.885, followed by CNN-RF. The findings confirm that deep learning hybrid models are particularly effective for long-term drought severity forecasting in arid regions.
In Algeria [21], a hybrid Variational Mode Decomposition–Extreme Learning Machine (VMD-ELM) model was developed for the purpose of forecasting SPI with short lead times (1–3 months). The results indicated that VMD-ELM consistently outperformed standalone ELM, especially in semi-arid regions, demonstrating that decomposition-based hybrid models substantially improve short-term SPI predictability.
In a further study [22], the focus was directed towards the utilization of artificial neural networks (ANNs), support vector machines (SVMs), and XGBoost models for the purpose of forecasting summer precipitation in Xinjiang, China. The ANN model showed superior predictive accuracy during both training and validation, with SHAP analysis revealing that ENSO, Pacific and South China Sea Subtropical High, and AMO indices were key drivers. This study emphasizes the dual contribution of ML in both accurate precipitation prediction and the identification of multi-scale teleconnection influences on regional drought risk.
A recent study [23] examined groundwater drought in the Haouz Aquifer in Morocco. This was achieved by integrating Med-CORDEX regional climate models (RCP 4.5/8.5) with SPI, SPEI, and machine learning algorithms. Random Forest outperformed other models, showing strong sensitivity to climatic and geographical variables. The study projected more severe and prolonged droughts under the RCP 8.5 scenario, providing important insights into aquifer sustainability in semi-arid regions.
A Random Forest (RF) model was employed to predict short-term spatio-temporal drought in New South Wales, Australia [24]. Using long-term climatic variables such as vapor pressure and cloud cover, the study demonstrated RF’s ability to capture nonlinear patterns in drought evolution without relying on remote-sensing or teleconnection indices. Grid-search and random-search techniques were employed for parameter tuning. The model effectively detected historical droughts (e.g., 1937–1945, 2001–2010), with strong agreement between predicted and observed SPEI values. RF’s strengths in handling large datasets and identifying variable importance were highlighted, suggesting its suitability for regional drought early-warning applications.
A previous study [25] compared several machine learning methods, including ANNs, SVR, and RF, for short-term drought forecasting based on the SPI. The results indicated that ensemble-based models such as RF offered stable and interpretable performance, efficiently capturing complex nonlinear dependencies among meteorological inputs. The study emphasized RF’s flexibility, low overfitting tendency, and usefulness in feature-importance analysis for drought prediction.
In conclusion, across varied geographies and methodological approaches, LSTMs, SVRs, Random Forests, fuzzy logic, and hybrid AI models have all demonstrated considerable success in enhancing the accuracy of drought predictions. Integrating satellite data, time series decomposition, and uncertainty modelling further enhances the robustness and reliability of such forecasts.
This study involved performing SPI calculations using long-term precipitation data from the provinces of Adana, Antalya, Burdur, Hatay, Isparta, Kahramanmaraş, Mersin, and Osmaniye and carrying out forward forecasting with ANN and RF models. The strength of this research lies in the use of nearly a century-long precipitation dataset across multiple provinces in Türkiye’s Mediterranean Region and the comparative evaluation of two widely applied AI models. However, its limitations include relying solely on precipitation data without incorporating other meteorological parameters such as temperature and evapotranspiration and restricting the analysis to SPI, which may not fully capture agricultural or hydrological droughts. Despite these constraints, the study provides valuable regional insights into drought predictability and contributes to improving early-warning systems in Türkiye.

1.2. Main Contribution

The main contributions and innovative aspects of this study are summarized as follows:
  • Century-Scale Dataset Utilization: First application of ANN and RF models using nearly 100 years (1929–2024) of continuous precipitation data across eight provinces in Türkiye’s Mediterranean Region.
  • Comprehensive SPI Timescale Forecasting: Simultaneous drought prediction at four SPI accumulation levels (3, 6, 12, and 24 months), providing a multi-temporal understanding of short-, medium-, and long-term drought evolution.
  • Comparative Model Benchmarking: Rigorous comparison of six AI models (ElasticNet, LGBM, XGBoost, LSTM, ANN, RF) using multiple statistical indicators (R2, RMSE, MAE, r), with ANN and RF identified as the most accurate and generalizable.
  • Dual-Model Forecasting Framework: Demonstration of ANN–RF complementarity, where ANN captures deep temporal dependencies and RF ensures robustness against noisy short-term variations—forming a hybridizable prediction system.
  • Region-Specific Drought Characterization: Identification of spatial and temporal drought behavior unique to the Mediterranean provinces, revealing coastal–inland variability and distinct hydrological responses.
  • Operational Relevance: The study provides a practical, low-input drought forecasting framework that can be readily integrated into regional early-warning systems using only precipitation data.
  • Scientific Contribution to AI–Hydrology Integration: The study advances understanding of how neural and ensemble learning algorithms can be tailored for hydroclimatic prediction under limited-data conditions, supporting future hybrid model development.

2. Material and Method

2.1. Study Area

This study uses monthly precipitation data for Türkiye’s Mediterranean Region (Figure 1) between 1929 and 2024. There are approximately 1140 months of data for each province. The data are complete and include precipitation in millimeters for each month.
The SPI was used for the drought analysis. The SPI is an indicator that evaluates precipitation anomalies over a given timescale and is calculated using a z-score. Timescales of 3, 6, 12, and 24 months were used for SPI calculations.

2.2. Data

The dataset used in this study consists of long-term monthly precipitation records obtained from the General Directorate of Meteorology of Türkiye for eight provinces located in the Mediterranean Region (Adana, Antalya, Burdur, Hatay, Isparta, Kahramanmaraş, Mersin, and Osmaniye). The dataset covers the period from 1929 to 2024, providing nearly a century of continuous records. The dataset, which spans a 95-year period and comprises a total of 1140 monthly average precipitation values divided into 12 months, has been divided into two sets: a training set and a test set. The training set comprises 80% of the data, which is equivalent to 912 months. The test set, which constitutes the remaining 20% of the data, is equivalent to 228 months. Preliminary statistical analysis indicates that the mean annual precipitation across the study area ranges between approximately 550 mm (Burdur) and 1200 mm (Antalya). The standard deviation of monthly precipitation values varies between 18 and 65 mm, reflecting both intra- and inter-annual variability. Minimum monthly precipitation values are close to 0 mm during the dry summer months, while maximum monthly totals exceed 300 mm during winter peaks in coastal provinces such as Antalya and Hatay. Overall, the dataset is complete, homogeneous, and suitable for drought index calculation and forecasting analysis.

2.3. Standard Precipitation Index

The SPI is one of the most widely used meteorological drought indicators due to its simplicity, temporal flexibility, and reliance solely on precipitation data. The SPI facilitates drought assessment across a range of temporal scales, enabling the detection of short-, medium-, and long-term moisture anomalies that affect diverse hydrological and agricultural systems [1].
The SPI is calculated by fitting a probability distribution function—typically the gamma distribution—to a long-term monthly precipitation record for a given location. This distribution is then transformed into a standard normal distribution with a mean of zero and a standard deviation of one. The resulting SPI values express the number of standard deviations by which the observed cumulative precipitation deviates from the long-term mean for a specific timescale (e.g., 1 month, 3 months, 6 months, 12 months).
Monthly precipitation data were obtained from long-term historical records (minimum 30 years) for each study site. The datasets were quality-controlled, and missing values, if any, were handled using interpolation techniques.
The gamma distribution was fitted to the aggregated precipitation series at selected timescales (SPI-3, SPI-6, SPI-12, and SPI-24). For months with zero precipitation, a mixed distribution combining a probability mass at zero and a gamma distribution for positive values was applied.
The cumulative probability was transformed into the standard normal distribution using an inverse normal function, resulting in the SPI value (Equation (1)):
S P I = Φ 1 ( F x )
where
Φ−1 is the inverse of the standard normal cumulative distribution function (CDF).
F(x) is the cumulative probability derived from the fitted gamma distribution for a precipitation value x.
SPI values were calculated for four timescales to evaluate both short-term and long-term drought dynamics: SPI-3: Useful for short-term agricultural drought. SPI-6: Intermediate indicator for streamflow and soil moisture. SPI-12 and SPI-24: Suitable for long-term hydrological drought assessment (e.g., reservoir and groundwater levels).
The SPI values were categorized [1] according to the drought severity classes shown in Table 1.
All coding was performed on a laptop with 16GB of RAM, an NVIDIA GeForce GTX 1650ti GPU (NVIDIA, Santa Clara, CA, USA), and an Intel® Core™ i5-10300H 2.50GHz CPU (Intel, Santa Clara, CA, USA). The SPI was computed using the Python (3.11.), Anaconda (2025), Spyder 6.1.0 programming language, with implementation based on the climate-indices or scipy.stats libraries. Visualization and postprocessing were conducted using matplotlib 3.9.2 and pandas 2.2.2.
SPI offers several advantages including standardized comparisons across regions and adaptability to multiple timescales. However, it does not account for evapotranspiration or temperature, which limits its performance in arid and semi-arid regions where water demand is as crucial as precipitation supply.

2.4. Artificial Neural Networks

ANNs are widely used in machine learning thanks to their ability to model complex, nonlinear relationships between inputs and outputs [26,27]. Inspired by the structure of the human brain, ANNs comprise layers of interconnected processing units known as neurons. Each neuron processes input data and transmits the result to the next layer, enabling the network to recognize intricate patterns [28,29].
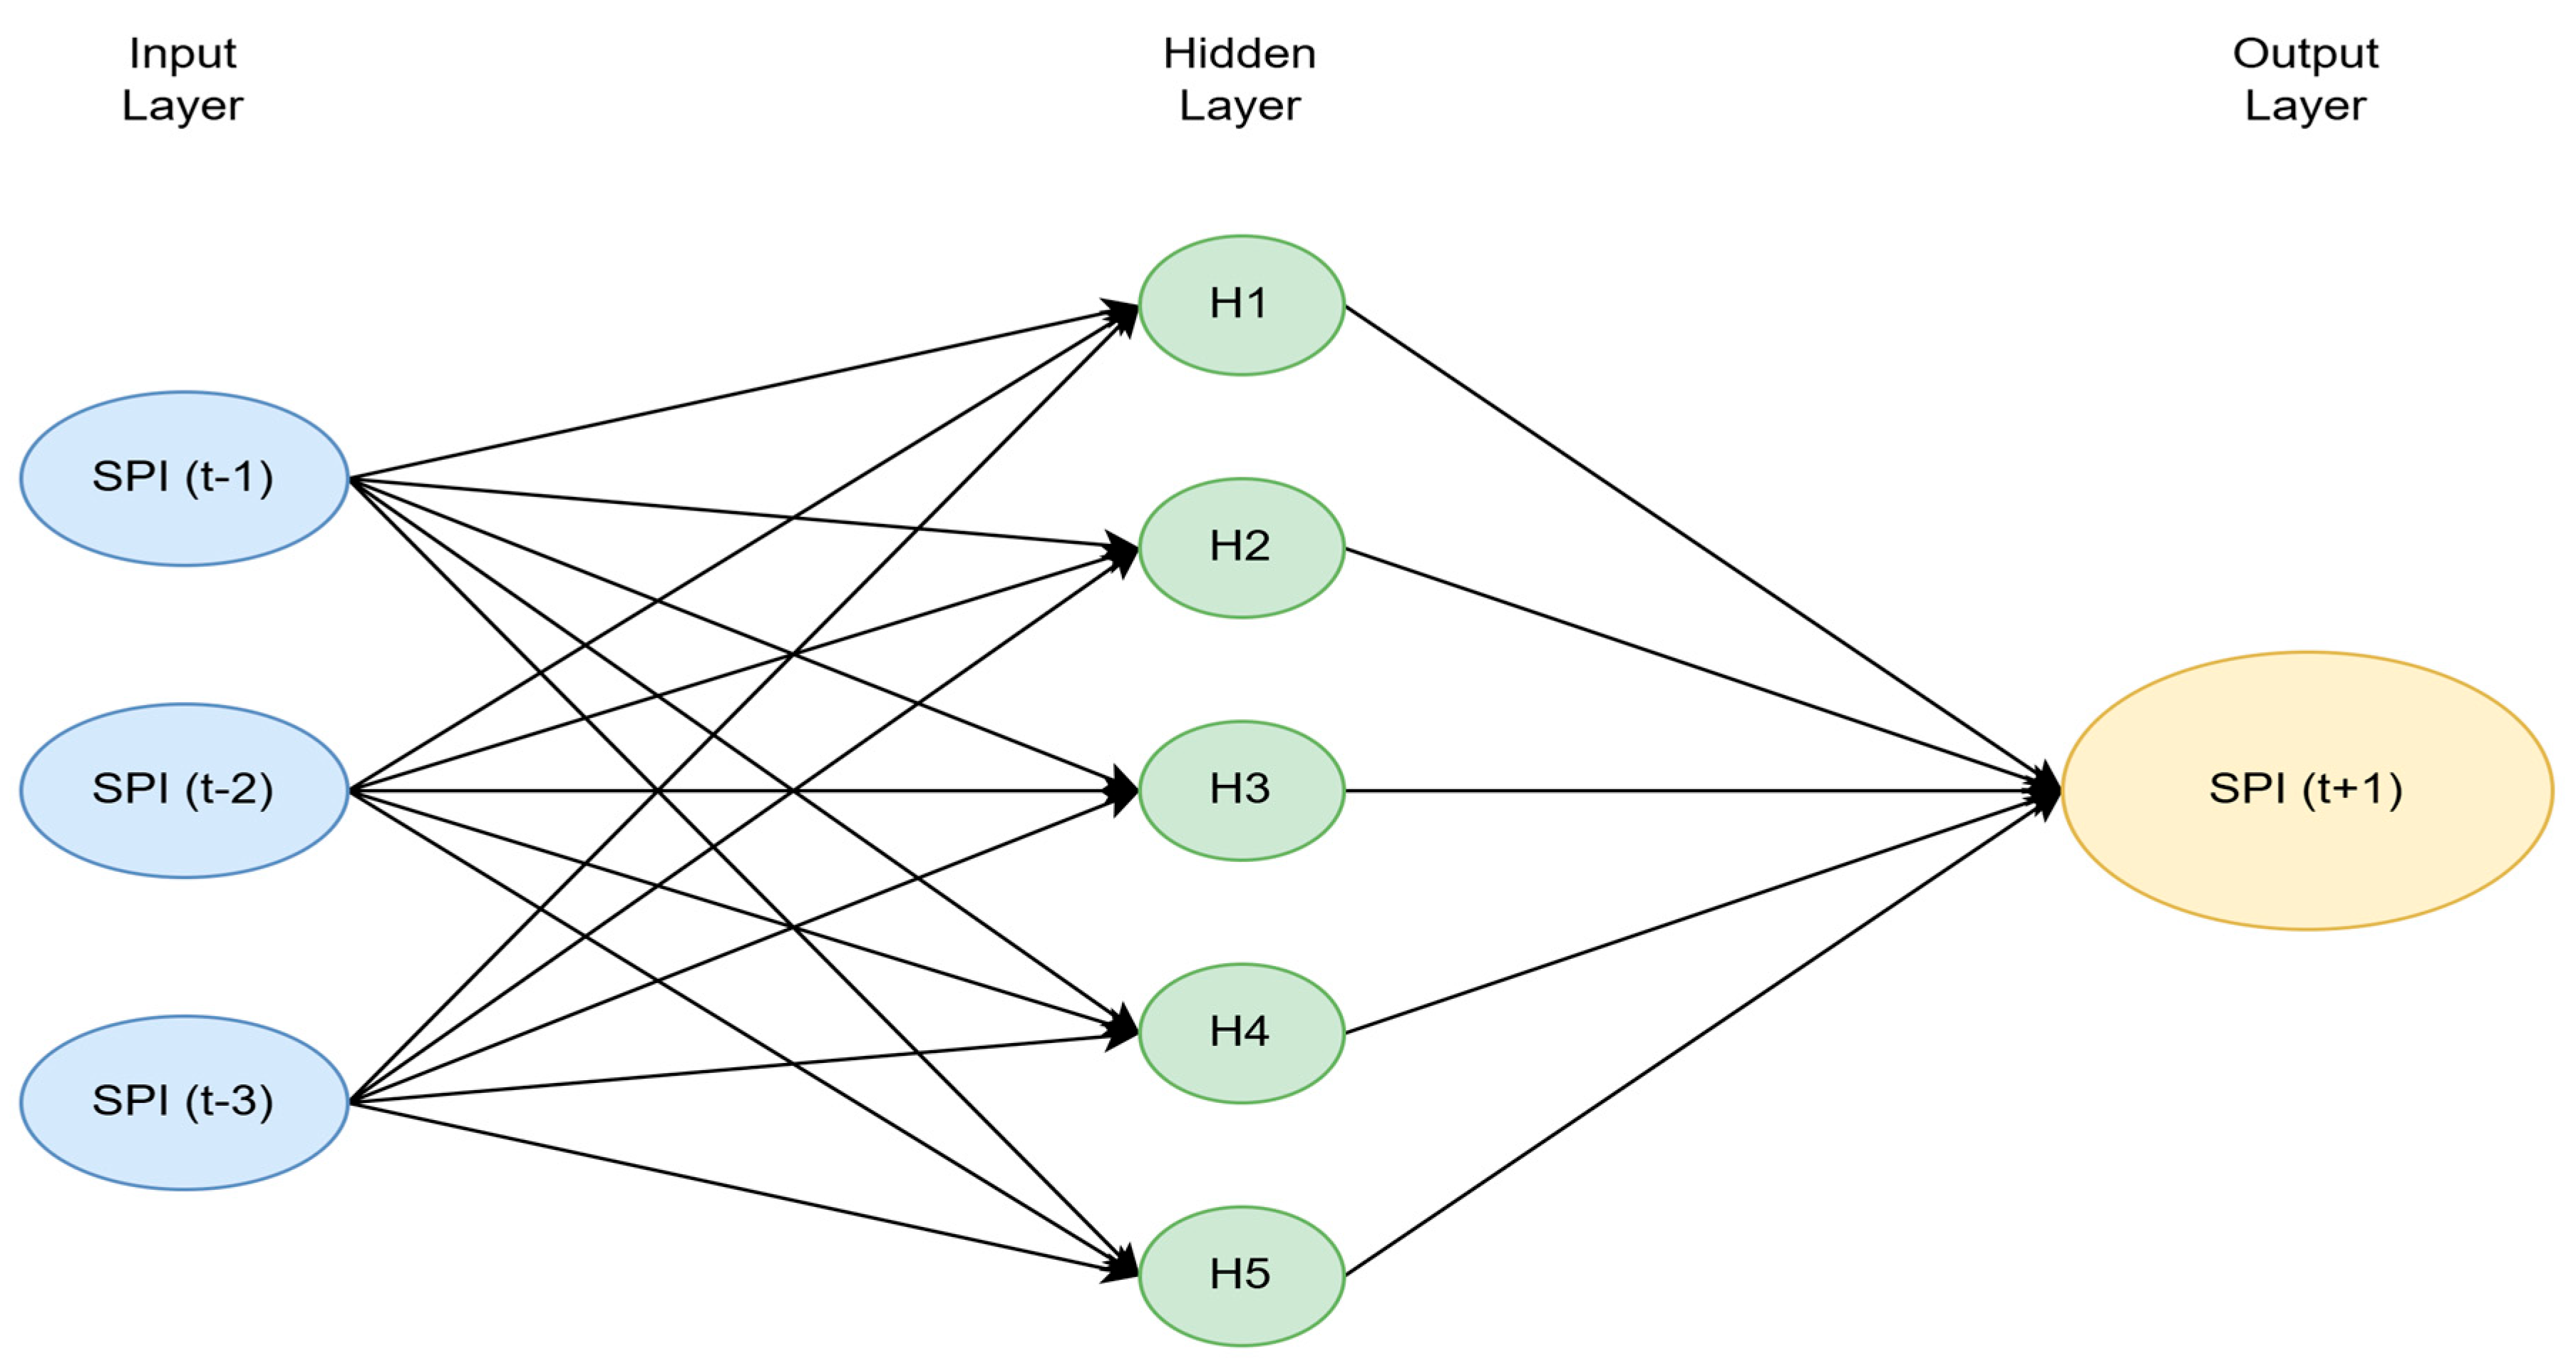
This study involved designing an ANN model to forecast the SPI based on historical SPI values. The model was structured as a feed-forward neural network comprising three main layers: an input layer, a hidden layer, and an output layer (Figure 2).
Model architecture:
Input Layer: It receives time-lagged SPI values. Specifically, the ANN uses SPI values at times t − 1, t – 2, and t − 3 to predict the value at time t + 1. This lag selection captures the temporal dependency in the drought pattern.
Hidden Layer(s): A single hidden layer with a specified number of neurons (e.g., 100) is used. The ReLU (Rectified Linear Unit) activation function is used due to its effectiveness in deep learning tasks and its ability to overcome vanishing gradient problems.
Output Layer: A single neuron with a linear activation function is all that makes up the output layer, and it is this layer that generates the predicted SPI value at time t + 1.
Training process: The dataset under consideration is composed of a total of 1140 monthly average precipitation values, covering a period of 95 years, divided into 12 months. The dataset is divided into two sets: a training set and a test set. The training set is composed of 80% of the data, which is equivalent to 912 months. The test set is composed of the remaining 20% of the data, which is equivalent to 228 months. The model was trained using the Adam optimizer, which is renowned for its effective management of sparse gradients and adaptive learning rates. The loss function used to evaluate prediction error during training was Mean Squared Error (MSE).
The output y ^ of the ANN can be expressed as in Equation (2):
y ^ = f j = 1 n w j · σ i = 1 m v i j · x i + b j + b o
where xi = input SPI features, vij = weights between input and hidden layer, wj = weights between hidden and output layer, bj, bo= bias terms, σ = activation function (ReLU in the hidden layer), and f = identity function in the output layer.
Model Evaluation Metrics:
To evaluate model performance, the following statistical metrics were used: coefficient of determination (R2), Root Mean Square Error (RMSE), and Mean Absolute Error (MAE). Higher R2 values and lower RMSE and MAE values indicated better predictive performance.

2.5. Random Forest

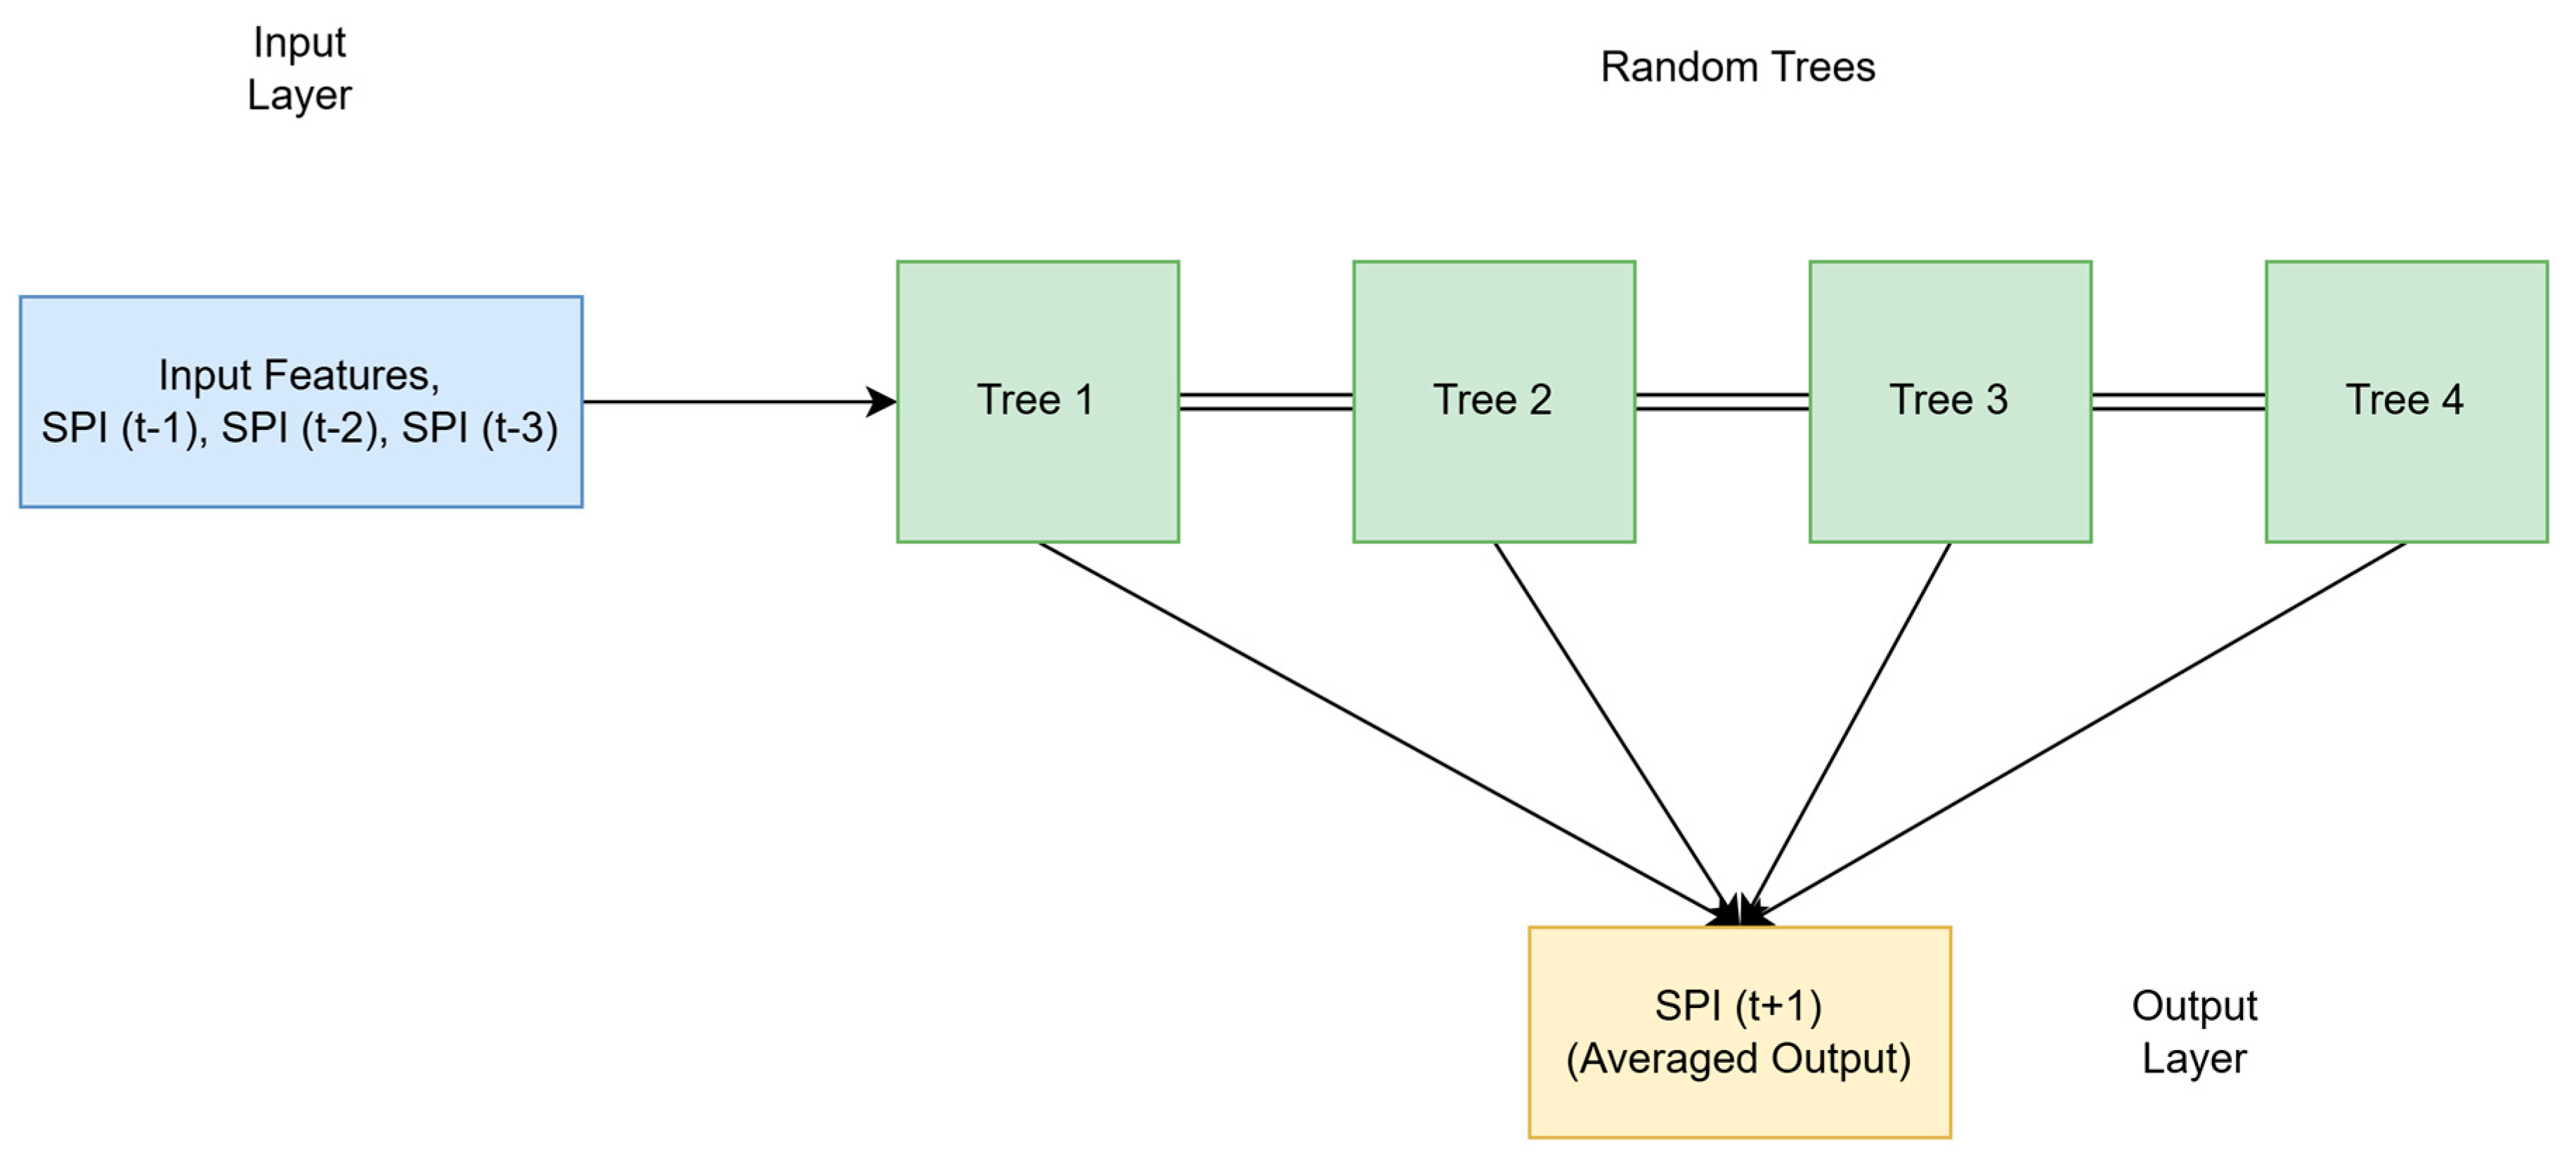
Random Forest (RF) is a robust ensemble learning algorithm widely used for both regression and classification tasks due to its ability to handle nonlinear relationships, reduce overfitting, and improve prediction stability [2]. In this study, RF was employed to forecast the SPI for various provinces in Türkiye’s Mediterranean Region using historical SPI time series (Figure 3).
Model Architecture:
RF operates by constructing multiple independent decision trees during training and then aggregating their outputs to produce a final prediction. A random subset of the training data and features is used to build each tree, which introduces diversity and enhances generalization.
Input Features: The RF model uses the three most recent SPI values—SPI(t − 1), SPI(t − 2), and SPI(t − 3)—as predictors for SPI(t + 1). This lag structure captures temporal dependencies that are critical for modeling drought dynamics.
Output: The model outputs a single continuous value representing the predicted SPI at time t + 1. The final prediction is calculated as the average of all individual tree outputs in the forest.
The dataset under consideration is composed of a total of 1140 monthly average precipitation values, covering a period of 95 years, divided into 12 months. The dataset is divided into two sets: a training set and a test set. The training set is composed of 80% of the data, which is equivalent to 912 months. The test set is composed of the remaining 20% of the data, which is equivalent to 228 months. The model was implemented using the RandomForestRegressor from the scikit-learn library. A grid search with cross-validation was conducted to optimize the following key hyperparameters: n_estimators—100 trees; max_depth—automatically determined; min_samples_split and min_samples_leaf—tuned to reduce overfitting.
The RF model does not require feature scaling, making it computationally efficient for time series tasks with standardized inputs like SPI.
Mathematical Representation:
Let T1, T2, …, Tn denote the individual decision trees in the forest, trained on different bootstrapped samples from the original dataset. For an input vector X = [SPI(t − 1), SPI(t − 2), SPI(t − 3)], the RF prediction ŷ is given in Equation (3):
y ^ = 1 n i = 1 n T i ( X )
where Ti(X) is the prediction from the i-th tree, and n is the total number of trees in the forest
Model Evaluation Metrics:
To assess the performance of the RF model, the following statistical indicators were used: R2, RMSE, MAE, Pearson correlation coefficient (r).

2.6. ElasticNet Regression

ElasticNet is a linear regression method that combines L1 (Lasso) and L2 (Ridge) regularization terms to balance variable selection and coefficient shrinkage [29]. Its loss function is defined as in Equation (4):
m i n β 1 2 n y X β 2 2 + λ 1 β 1 + λ 2 β 2 2
The combination of penalties helps mitigate overfitting and multicollinearity issues that often arise in hydrometeorological datasets. In this study, ElasticNet was used as a baseline model to evaluate the predictive potential of linear hybrid regularization techniques for drought estimation.

2.7. Light Gradient Boosting Machine (LightGBM)

LightGBM is a gradient boosting framework based on decision trees that employs a leaf-wise growth strategy with depth limitation to improve computational efficiency and accuracy [30]. Unlike traditional level-wise tree growth, LightGBM splits the leaf with the largest loss reduction, leading to faster convergence and better performance on large datasets. Model hyperparameters—such as number of leaves, learning rate, and boosting rounds—were optimized through grid search and cross-validation to minimize overfitting and ensure generalization across regions.

2.8. Long Short-Term Memory (LSTM) Network

The LSTM model, a specific type of recurrent neural network (RNN) first introduced in 1997 [31], is particularly well suited for modelling time-dependent sequences such as SPI. LSTM cells incorporate input, output, and forget gates that control the flow of information, enabling the network to capture long-term dependencies in precipitation dynamics.
In this study, the LSTM architecture consisted of an input layer, one or more hidden LSTM layers with ReLU activation, and a dense output layer. The model was trained using the Adam optimizer with early stopping criteria to prevent overfitting. Dropout regularization was also applied to enhance generalization capability.

2.9. Extreme Gradient Boosting (XGBoost)

XGBoost is an optimized distributed gradient boosting library designed to maximize model efficiency and accuracy [32]. It incorporates second-order gradient approximation, regularization terms, and shrinkage techniques, making it robust against overfitting. The objective function is formulated as in Equation (5):
O b j = i l y i , y l ^ + k Ω f k
where l y i ,   y ^ l is the differentiable loss function and Ω f k is a regularization term controlling the complexity of trees.
In this research, XGBoost was tuned via Bayesian optimization to identify the optimal learning rate, maximum depth, and number of estimators. Its ensemble nature and regularization mechanism allow effective modeling of nonlinear precipitation–SPI relationships.
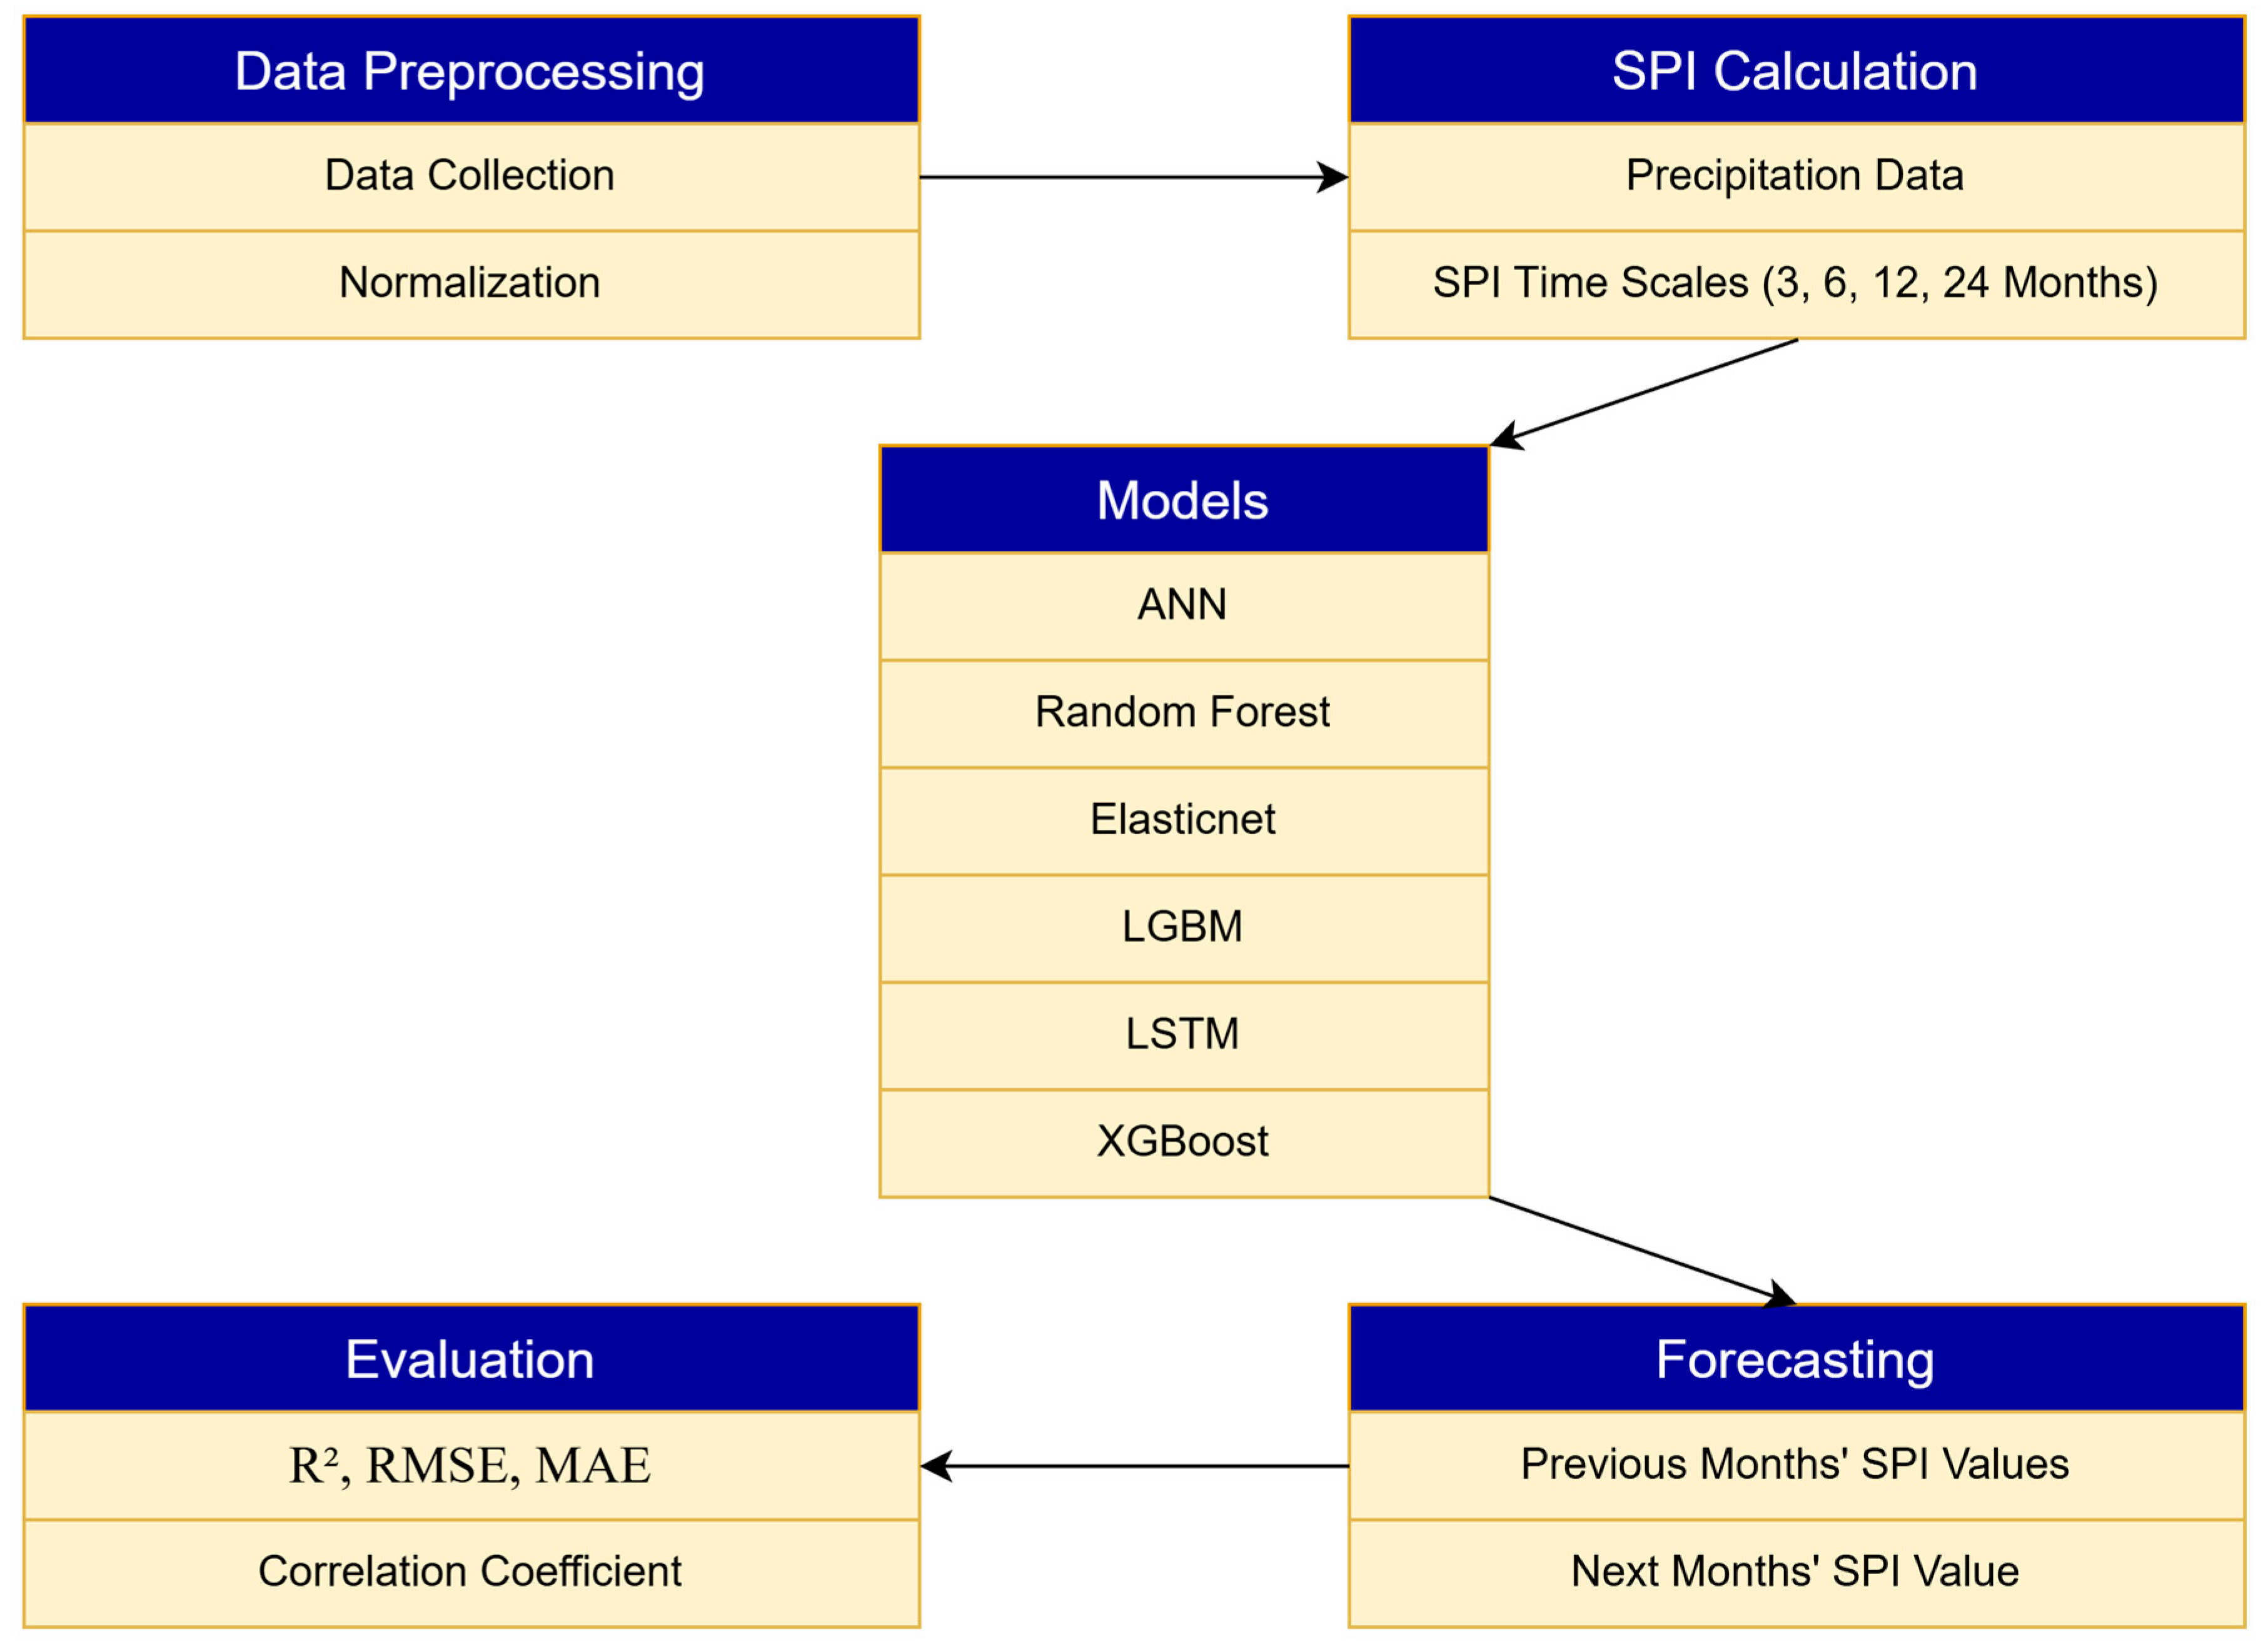
Figure 4 summarizes the general flow of the study. First, data preprocessing and SPI calculations are performed. Then, ANN, RF, Elasticnet, LGBM, LSTM, and XGBoost models are applied, and the results are evaluated using graphs and tables.

3. Results

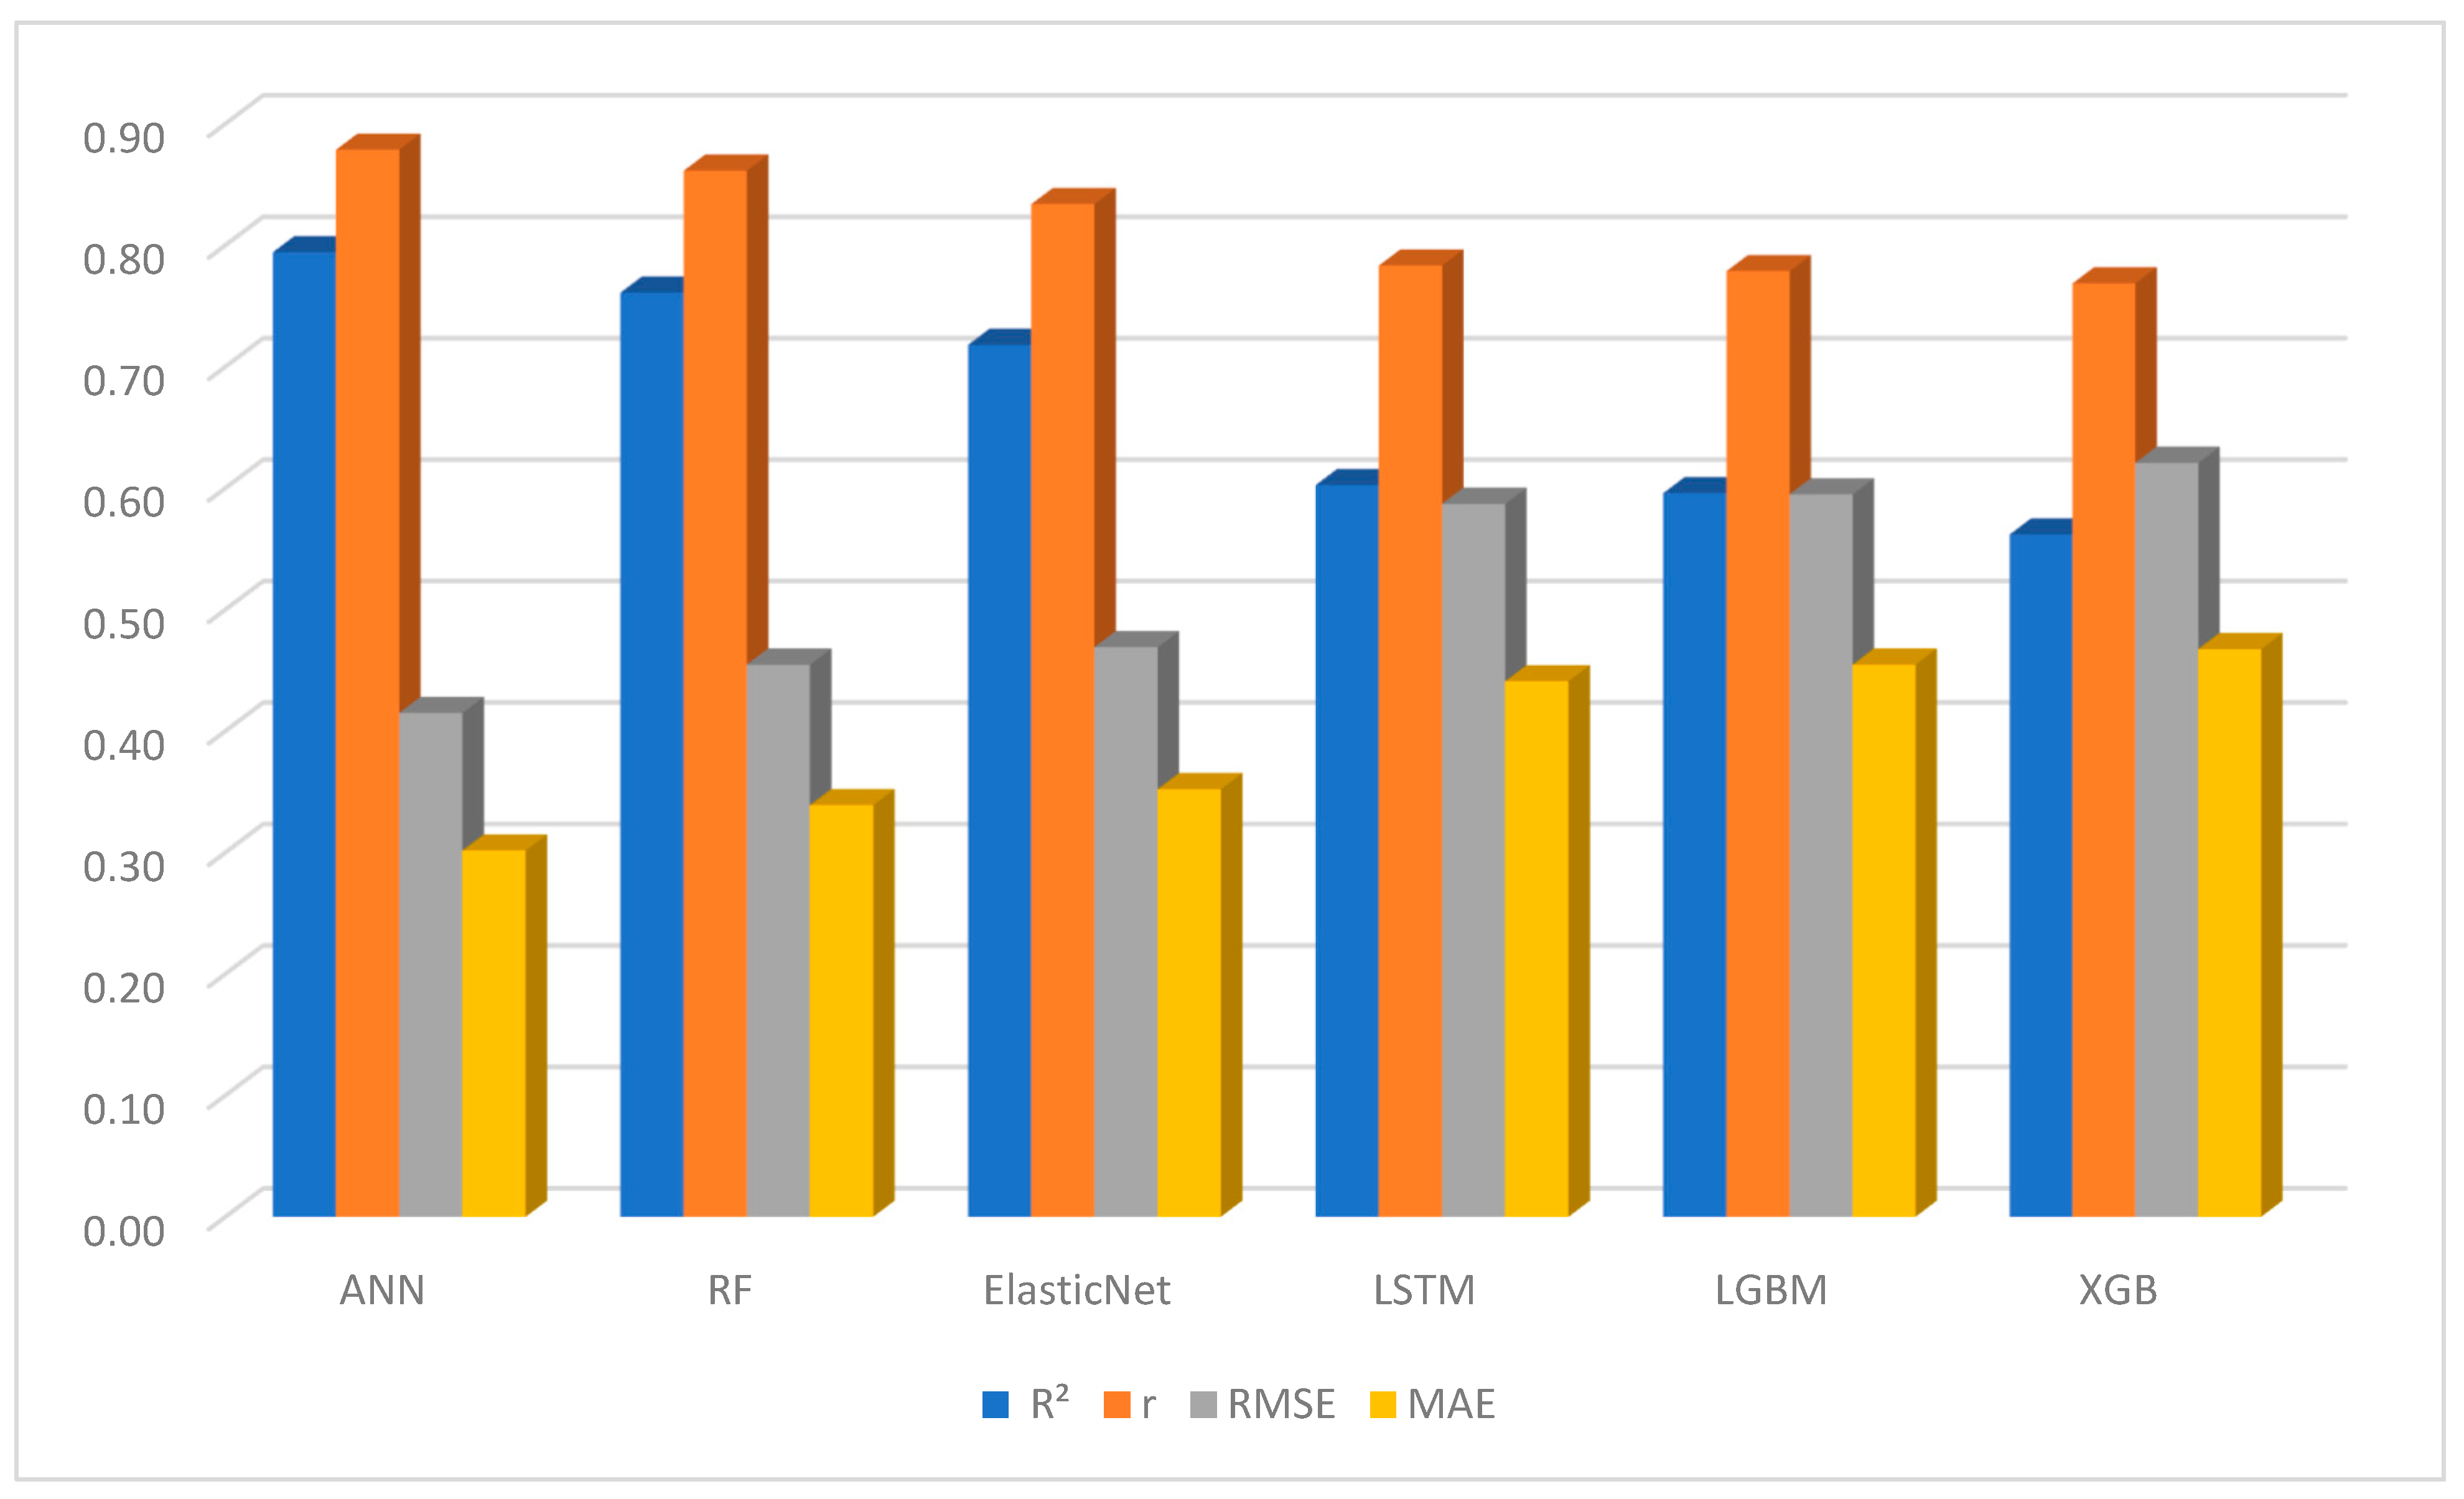
In this section, the performance of the artificial intelligence models utilized in the study is initially compared, and subsequently, the two most successful models are selected. The prediction results obtained for eight provinces at the SPI-3, SPI-6, SPI-12, and SPI-24 timescales are presented in this paper. The performance of the models is evaluated using a number of metrics, including R2, RMSE, MAE, and the correlation coefficient (r). A comparison of the models’ R2, RMSE, MAE, and the correlation coefficient (r) values is presented in Table 2 and Figure 5. The results for each SPI type are presented in graphical form, followed by visual comparisons.

3.1. Model Comparison and Selection

As demonstrated in Table 2 and Figure 5, six machine learning models—ElasticNet, LGBM, XGBoost, ANN and RF—were evaluated for their comparative performance in predicting SPI values across four temporal scales (SPI-3, SPI-6, SPI-12, and SPI-24). The performance of the model was assessed using the coefficient of determination (R2), RMSE, MAE, and the correlation coefficient (r), which reflects the model’s explanatory capability.
Across all SPI aggregation periods (SPI-3, SPI-6, SPI-12, and SPI-24), the artificial neural network (ANN) and Random Forest (RF) models demonstrated a consistent superiority in predictive skill in comparison to the other algorithms. The ANN demonstrated the highest overall performance, with a mean R2 of 0.79, a Root Mean Square Error (RMSE) of 0.41, a Mean Absolute Error (MAE) of 0.30, and a correlation coefficient (CORR) of 0.88. The RF model followed closely, with R2 = 0.76, RMSE = 0.45, MAE = 0.34, and CORR = 0.86.
The significant R2 and CORR values, when considered in conjunction with the comparatively low RMSE and MAE, indicate that both models effectively captured the nonlinear dependencies between precipitation variability and SPI fluctuations.
In contrast, ElasticNet, LGBM, and XGBoost yielded moderate accuracy, while LSTM underperformed, particularly in the context of short-term indices. This underperformance can be attributed to the model’s sensitivity to limited temporal context and its tendency towards overfitting. The comparatively higher Root Mean Square Error (RMSE; >0.6) and Mean Absolute Deviation (MAE; >0.45) values for these models indicate reduced robustness and weaker generalization ability under volatile climatic conditions.

3.2. Model-Specific Interpretation

In short-term drought indicators (SPI-3 and SPI-6), artificial neural networks (ANNs) and Random Forests (RFs) demonstrated strong adaptability to high-frequency rainfall variations. ANN achieved R2 values ranging from 0.72 to 0.81, with RMSE values ranging from 0.44 to 0.51, thus confirming its efficiency in learning short-duration rainfall–drought transitions. The RF model followed closely, providing stable yet marginally smoother predictions (R2 = 0.68–0.77).
At longer accumulation scales (SPI-12 and SPI-24), all models exhibited an improvement in performance due to the temporal smoothing of SPI data. However, the artificial neural network (ANN) and Random Forest (RF) models maintained their superior accuracy, with a Root Mean Square Error (RMSE) exceeding 0.80 and a Mean Squared Error (MSE) below 0.42. The correlation coefficients obtained above 0.85 further indicate a strong alignment with the observed drought dynamics.
It is noteworthy that ElasticNet yielded competitive outcomes in SPI-12 (R2 = 0.88) and SPI-24 (R2 = 0.82), indicating the capacity of linear models to function effectively under stable, low-frequency conditions where drought progression adheres to quasilinear patterns. Conversely, boosting-based algorithms (LGBM and XGBoost) demonstrated comparable moderate performance, suggesting that the integration of an ensemble does not necessarily result in significant enhancement.
LSTM, expected to leverage temporal dependencies, failed to demonstrate superior performance in comparison to simpler models, most likely due to insufficient data volume or sequence complexity for ensuring long-term learning stability.

3.3. Model Selection Justification

It is evident that, when considered collectively, the evidence from all statistical metrics—high R2 and CORR coupled with low RMSE and MAE—indicates that the ANN and RF models are the most accurate, reliable, and generalizable frameworks for SPI prediction.
Their capacity to reproduce both short-term drought fluctuations (as measured by SPI-3 and SPI-6) and long-term hydrological trends (SPI-12 and SPI-24) underscores their dual capability in modelling non-stationary and persistent drought patterns.
Consequently, these two models were selected for the subsequent phases of analysis, including spatial drought mapping and temporal validation, as they provide the most balanced combination of predictive precision, robustness, and interpretability.

3.4. Drought Prediction Performance of ANN and RF Models Across Multiple SPI Timescales

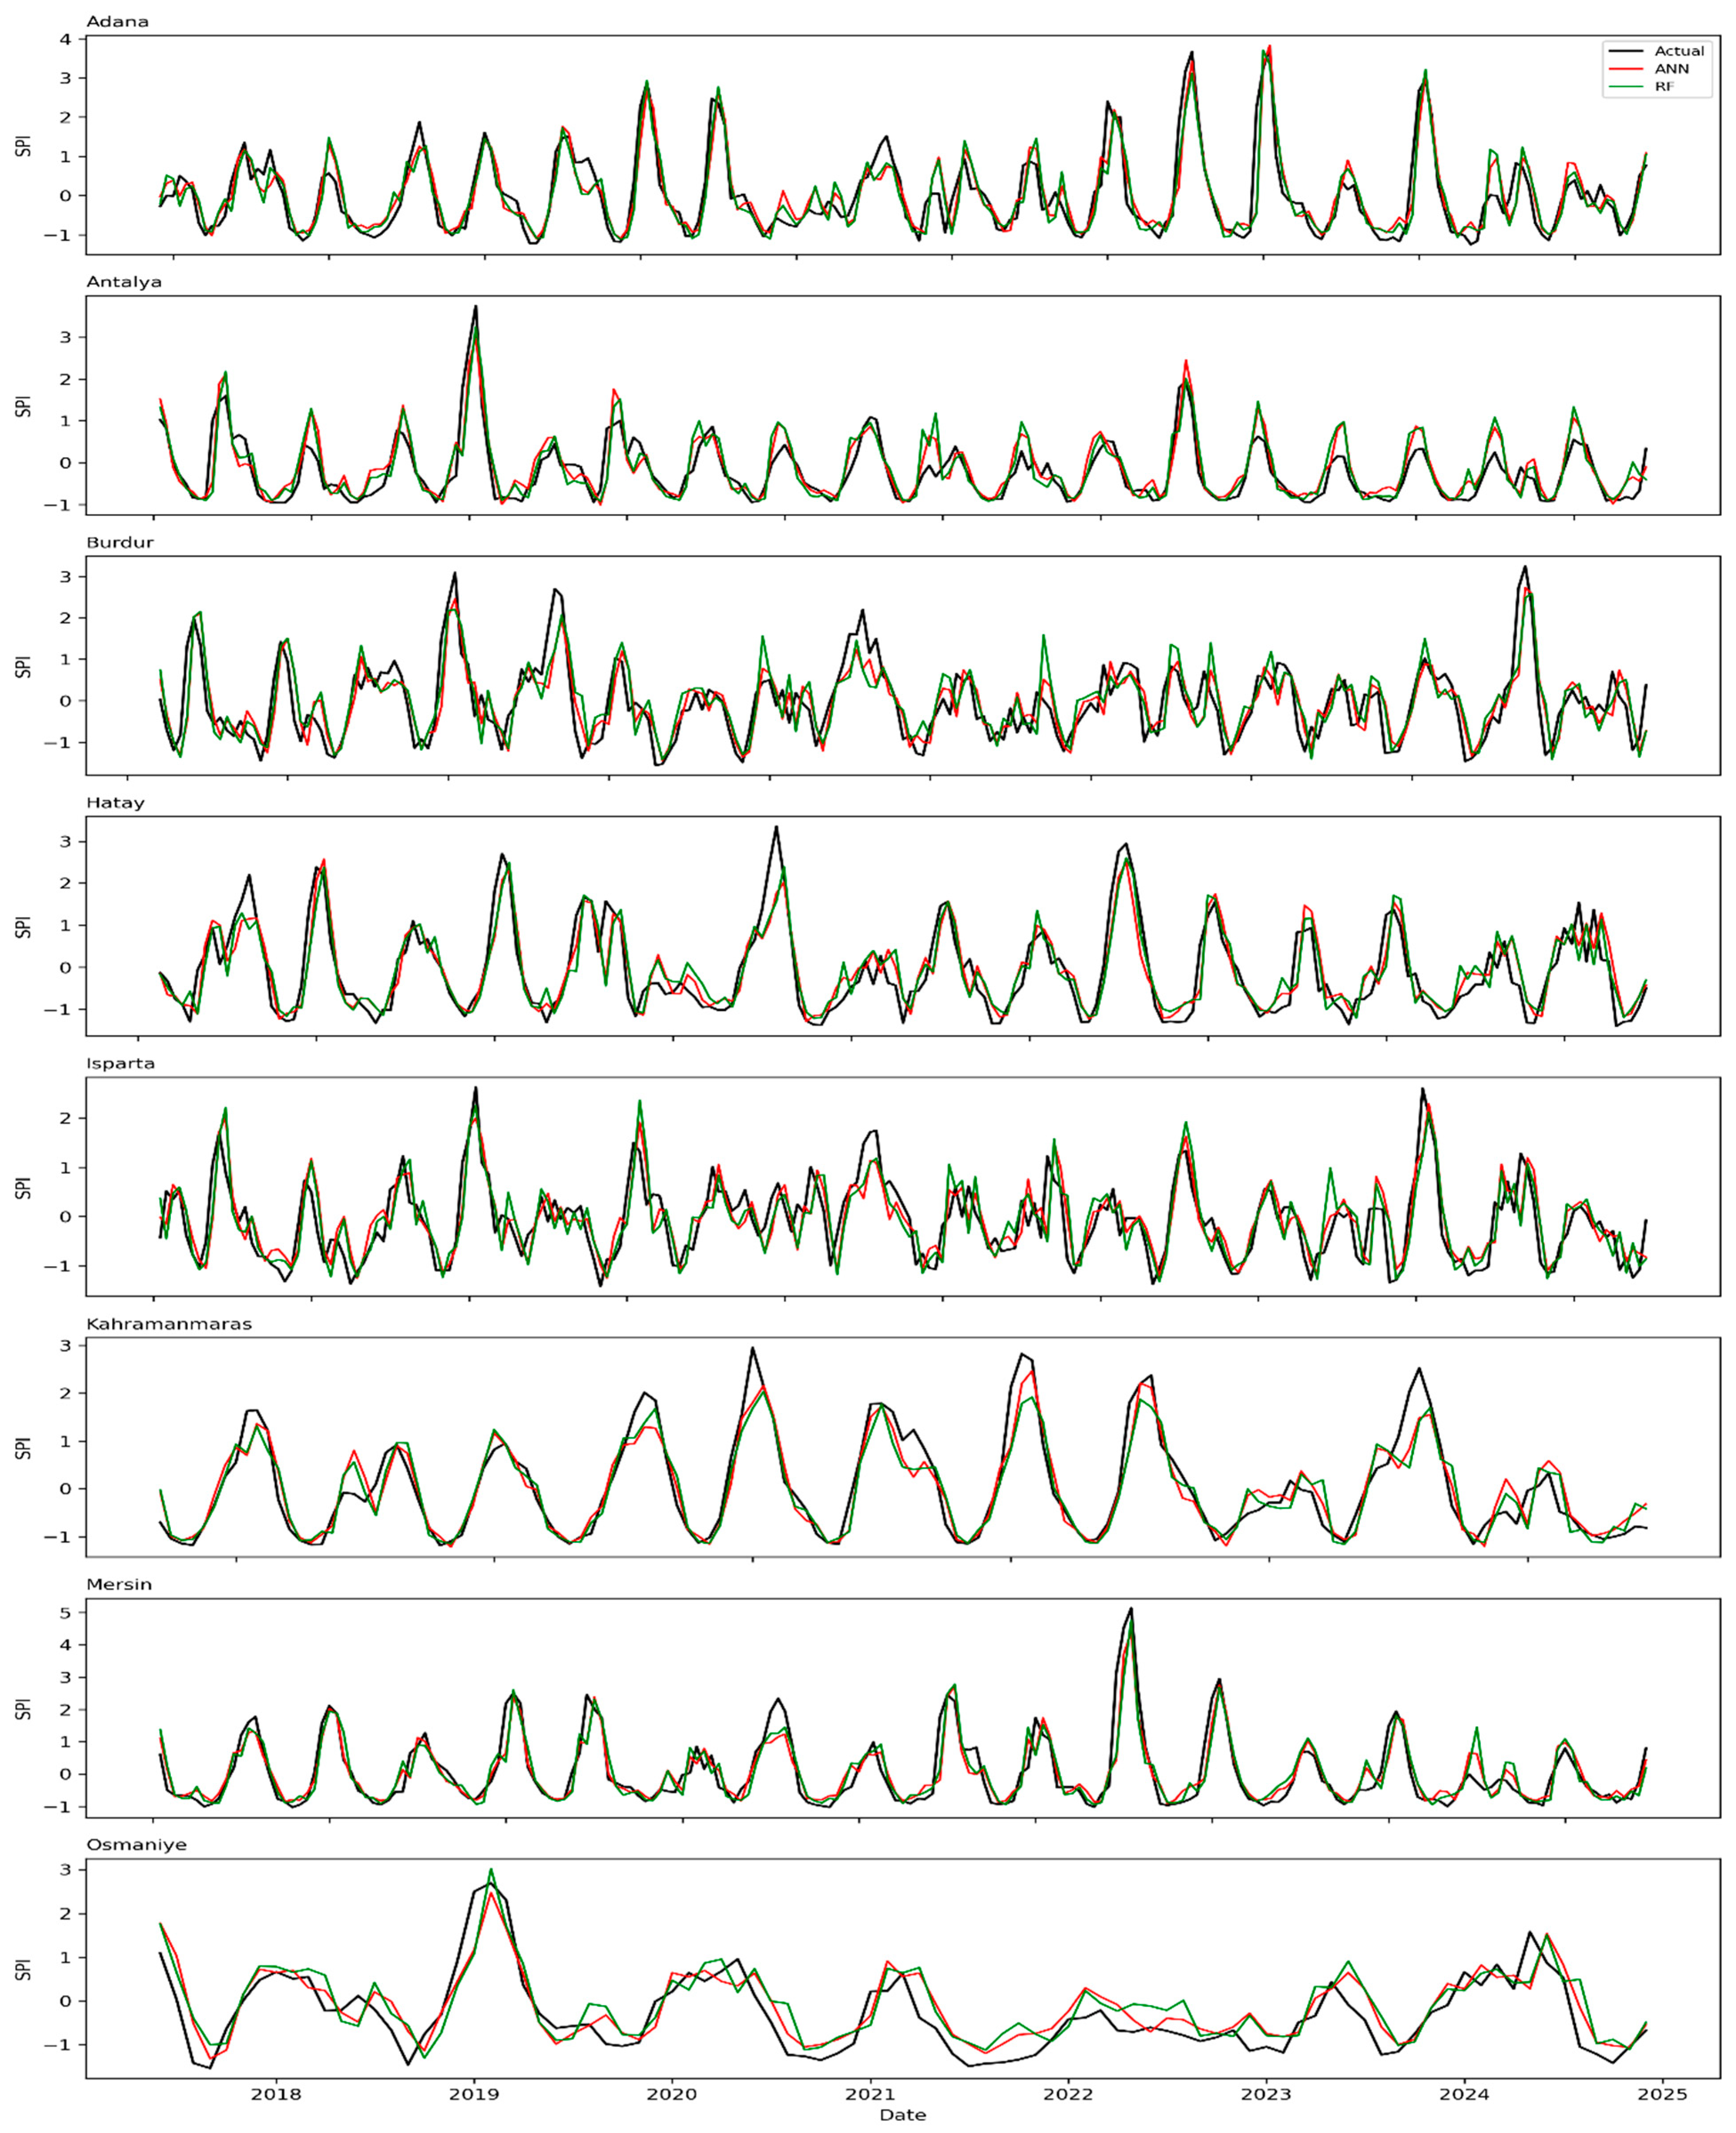
The analysis of SPI-3 (Figure 6) indicates that the studied provinces exhibited distinct short-term precipitation variability and rapid drought–wetness transitions, which are characteristic of Mediterranean climates. Adana, Hatay, Mersin, and Osmaniye experienced frequent short-term drought episodes between 2018 and 2022, characterized by SPI-3 values periodically falling below −1, indicating moderate to severe drought conditions. Following 2022, these provinces demonstrated a gradual transition towards neutral or mildly moist conditions, indicating partial hydrological recovery.
Antalya and Isparta exhibited marked SPI-3 oscillations during the 2018–2020 period, indicative of significant seasonal precipitation contrasts and rapid responses to meteorological anomalies. Following 2021, both cities exhibited relatively stable SPI-3 values, indicative of a decline in short-term drought intensity.
Burdur demonstrated the most significant fluctuations among all provinces, with SPI-3 values ranging from −2 to +3, indicating successive periods of extreme dry and wet conditions. This variability underscores the sensitivity of Burdur’s local hydrological regime to rainfall anomalies. In contrast, Kahramanmaraş exhibited more regular and cyclic drought–wetness patterns with reduced amplitude, reflecting a smoother short-term climate response.
From a modelling standpoint, both artificial neural network (ANN) and Random Forest (RF) models effectively replicated the observed SPI-3 fluctuations. The ANN model demonstrated a higher degree of precision in capturing sudden changes and turning points in the SPI-3 sequence. In contrast, the RF model provided a smoother representation of temporal trends, although it did exhibit minor overshooting during periods of peak wetness. The findings demonstrate a high degree of consistency between the observed and predicted series, thus substantiating the hypothesis that artificial neural networks (ANNs) and Random Forests (RFs) can accurately characterize short-term drought dynamics. The analysis reveals that ANNs demonstrate particular efficacy in the characterization of short-range variability, whilst RFs exhibit superior trend generalization across all provinces.
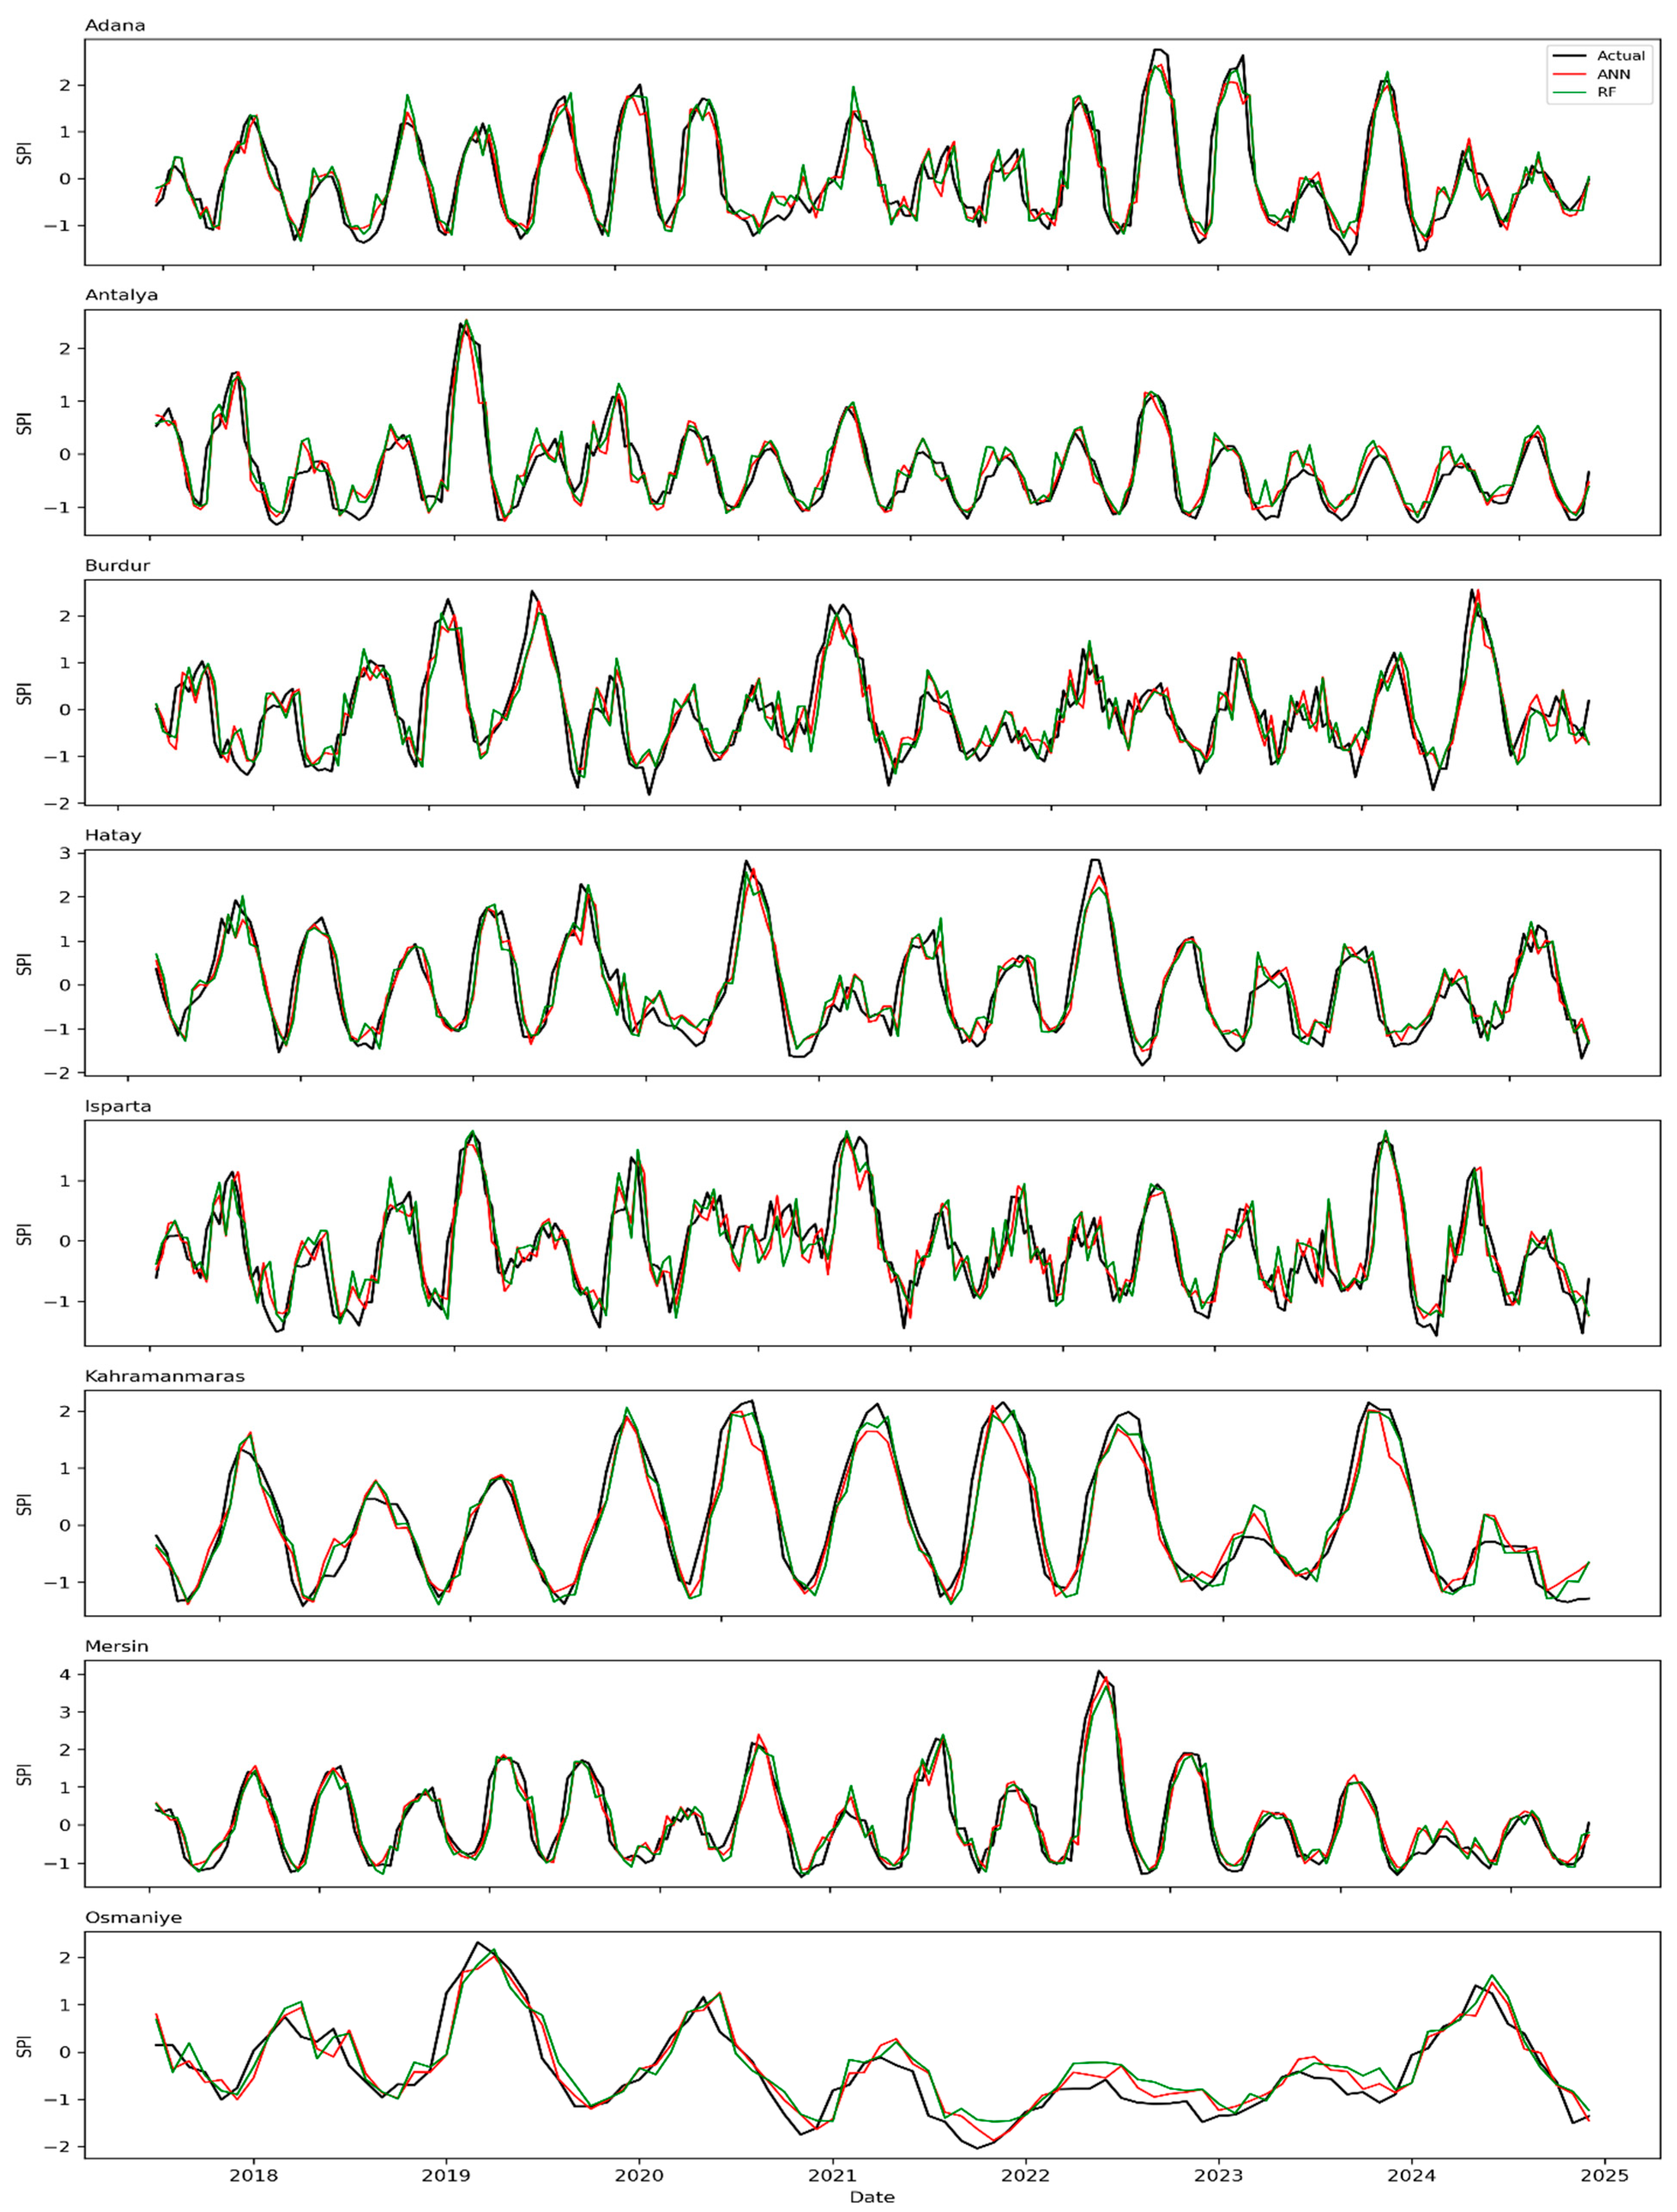
The SPI-6 results (Figure 7) revealed the seasonal and semi-annual drought–wetness dynamics across the Mediterranean provinces, reflecting intermediate-term hydrological behavior between short-term meteorological droughts (SPI-3) and long-term climatic fluctuations (SPI-12 and SPI-24). Adana, Hatay, and Mersin exhibited pronounced cyclic variations, with recurrent drought phases between 2018 and 2021 followed by mild wetness after 2022. These oscillations underscore the pronounced seasonal dependency of precipitation in coastal regions. Antalya and Isparta exhibited more stable SPI-6 profiles, although moderate drought events (SPI < −1) occurred intermittently during 2019–2020, indicating transitional hydrological stress periods.
Burdur displayed the highest SPI-6 variability, alternating between moderate drought (SPI ≈ −1.5) and wetness peaks exceeding +2.0, suggesting high precipitation irregularity in its inland basin. Kahramanmaraş exhibited smoother SPI-6 sequences, characterized by seasonal periodicity, while Osmaniye demonstrated limited yet consistent signals of mild drought conditions from 2020 to 2022, followed by partial recovery.
From a modelling standpoint, both artificial neural network (ANN) and Random Forest (RF) models exhibited strong agreement with the observed SPI-6 series. The artificial neural network (ANN) model demonstrated a high degree of correlation with the precipitation fluctuations, and the recurrent neural network (RNN) model exhibited a slightly more refined trend in its reproduction of the overall patterns. Minor deviations were observed at drought peaks, where RF tended to slightly underestimate extreme negative SPI values. Nevertheless, both models achieved excellent correspondence with actual data, thus confirming their robustness for medium-term drought prediction. Specifically, the artificial neural network (ANN) demonstrated superior performance in replicating phase changes, while the Random Forest (RF) exhibited higher stability in both continuous drought and wet phases. This finding suggests a complementary predictive behavior between the two models across all provinces.
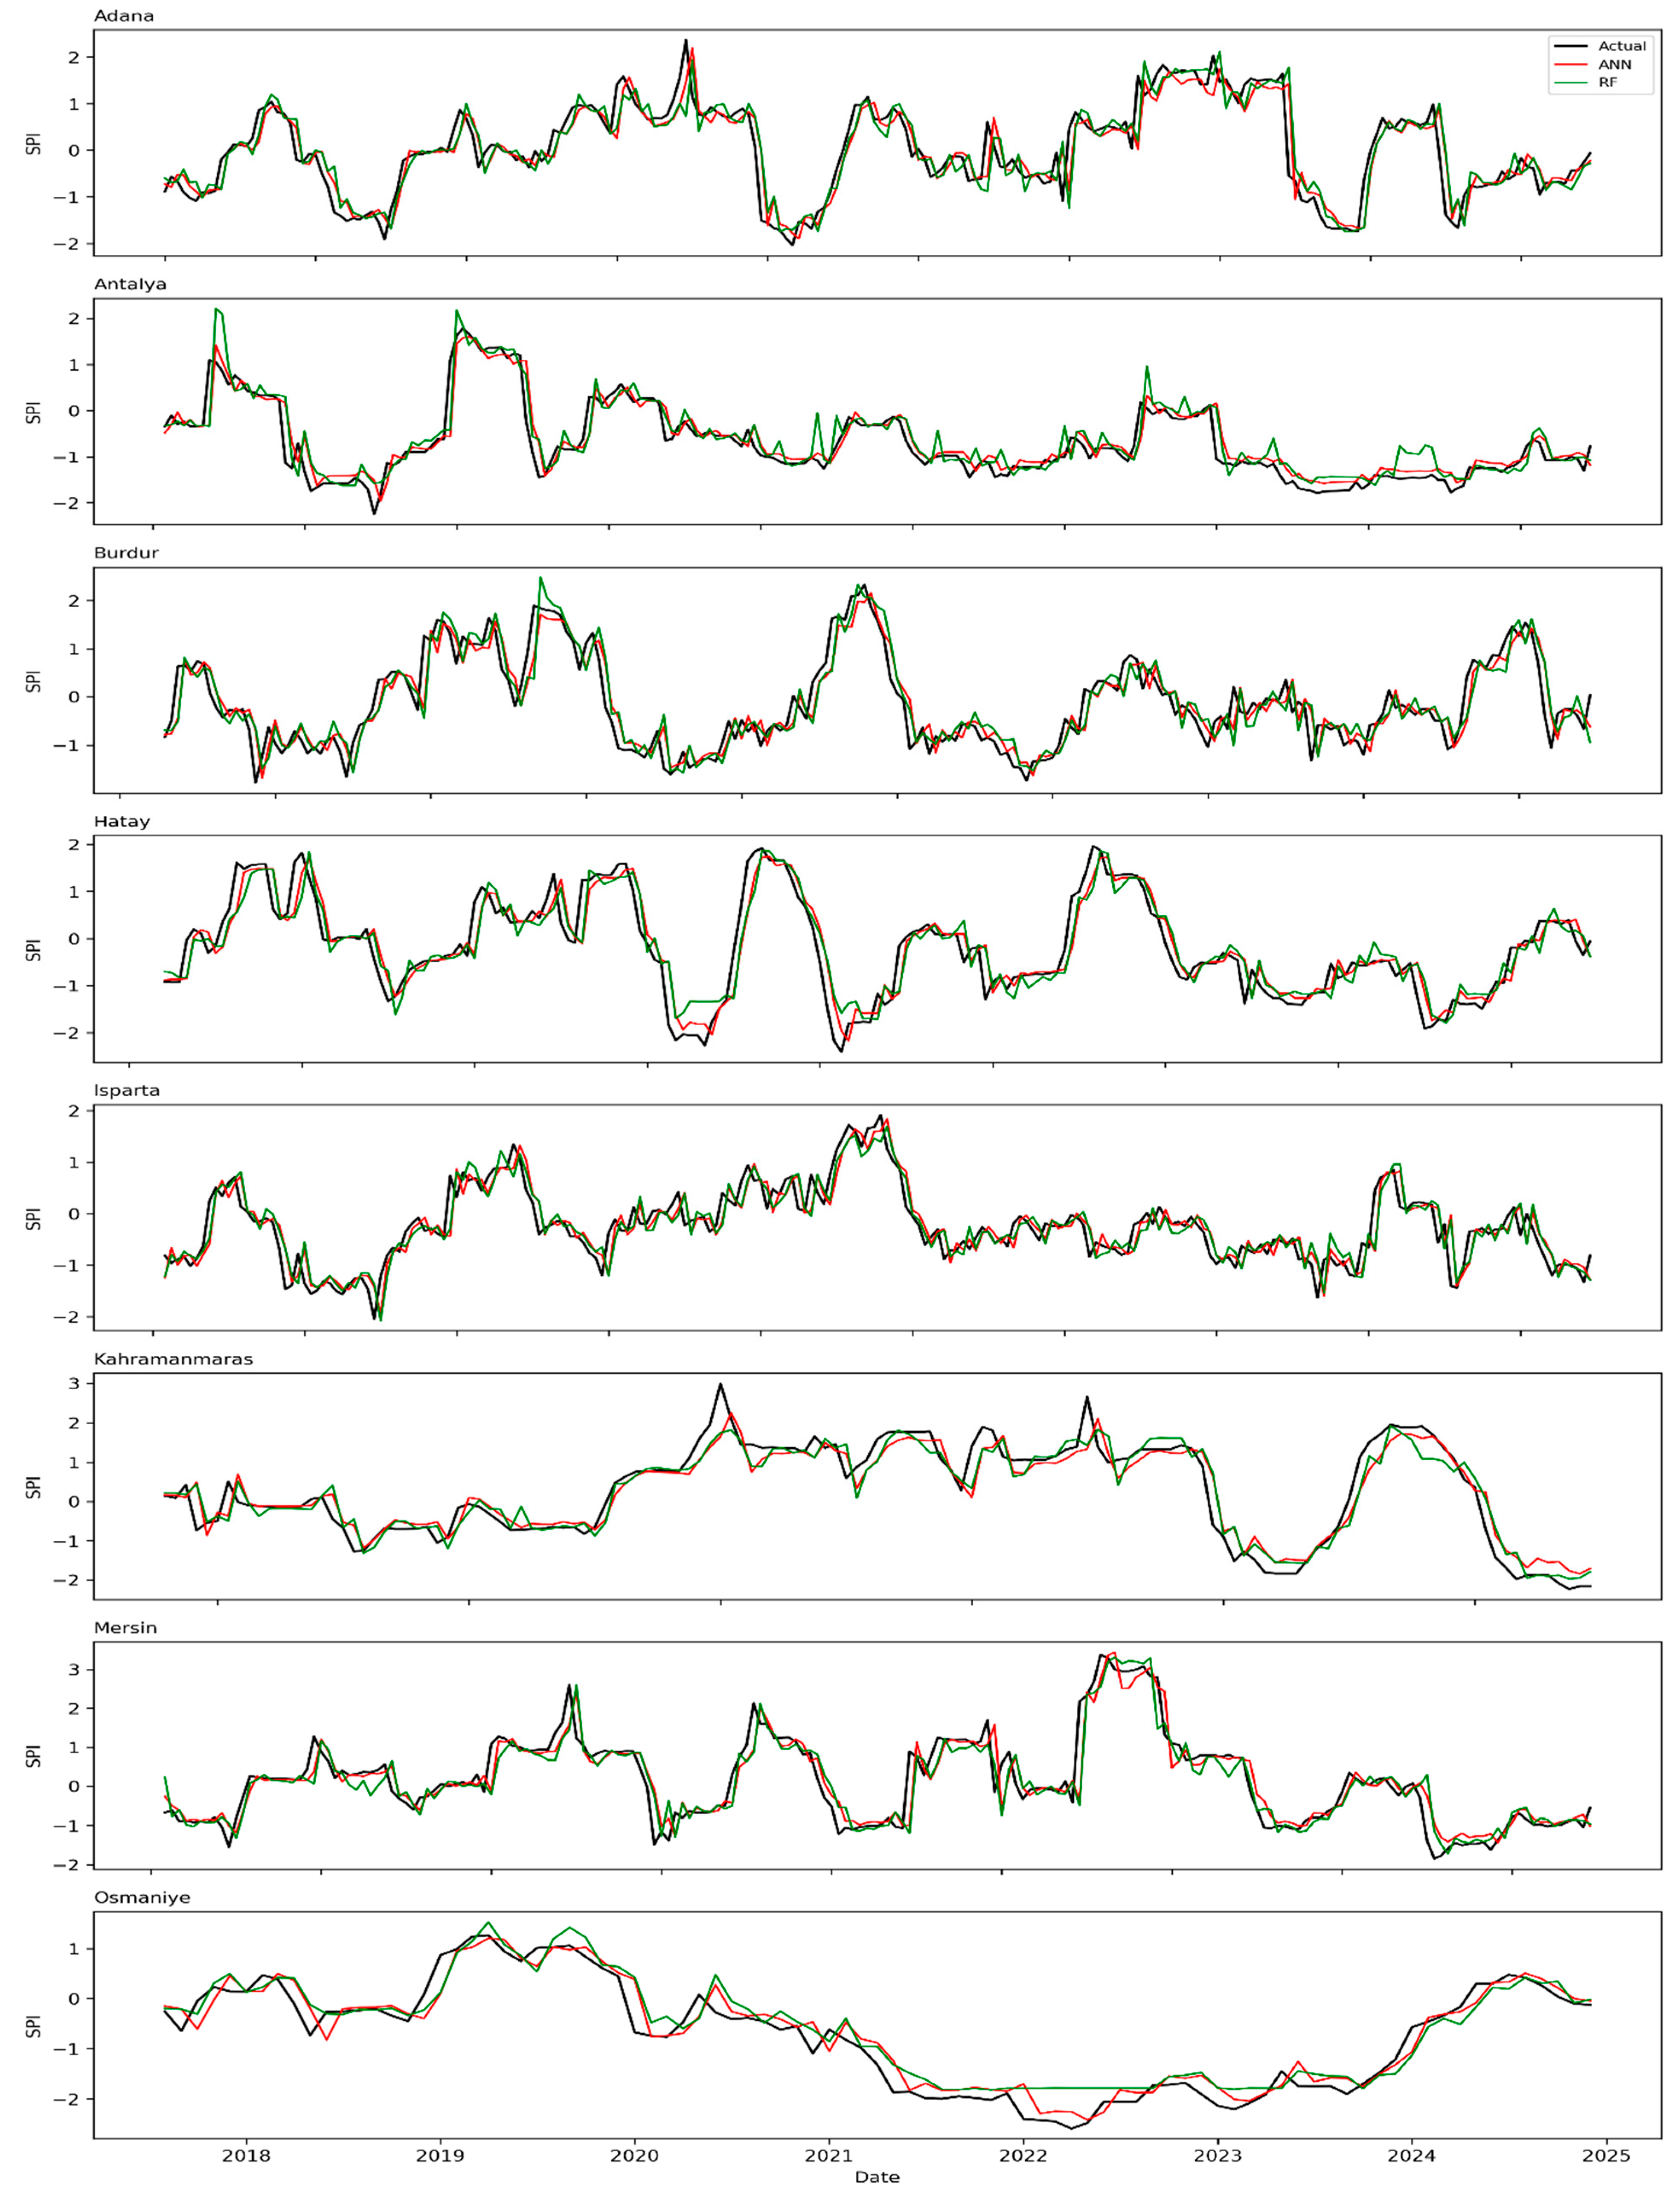
The SPI-12 results (Figure 8) reveal the long-term hydroclimatic trends and the persistence of droughts across the Mediterranean provinces. Adana, Hatay, and Mersin exhibited clear multi-year wet–dry cycles between 2018 and 2024, with SPI-12 values fluctuating between −2 and +2. Antalya and Isparta exhibited comparatively stable long-term variations, with only mild drought conditions (SPI ≈ −1) during 2019–2020 and consistent precipitation patterns after 2022.
Burdur demonstrated heightened drought persistence, characterized by protracted dry phases from 2019 to 2021, followed by a gradual transition towards near-normal conditions after 2023. Kahramanmaraş experienced distinct multi-year cycles with moderate wetness during 2018–2019, followed by long-lasting drought conditions (SPI < −1.5) up to 2022, while Osmaniye presented a shorter SPI-12 record but reflected progressive wetness recovery after 2023.
From a modelling perspective, both artificial neural network (ANN) and Random Forest (RF) models demonstrated an ability to accurately track the observed SPI-12 dynamics. The artificial neural network (ANN) model demonstrated a marginal superiority in its ability to replicate sharp inflection points and year-to-year transitions, while the Random Forest (RF) model exhibited a notable aptitude for capturing the overall multi-year trend continuity. Minor deviations were observed around the onset and termination of major drought periods, where the artificial neural network (ANN) responded more rapidly to reversals, while the Random Forest (RF) model tended to smoothen the transition. Nevertheless, both models yielded highly consistent predictions with the observed data, thus confirming their reliability for long-term drought assessment and prediction across heterogeneous Mediterranean environments.
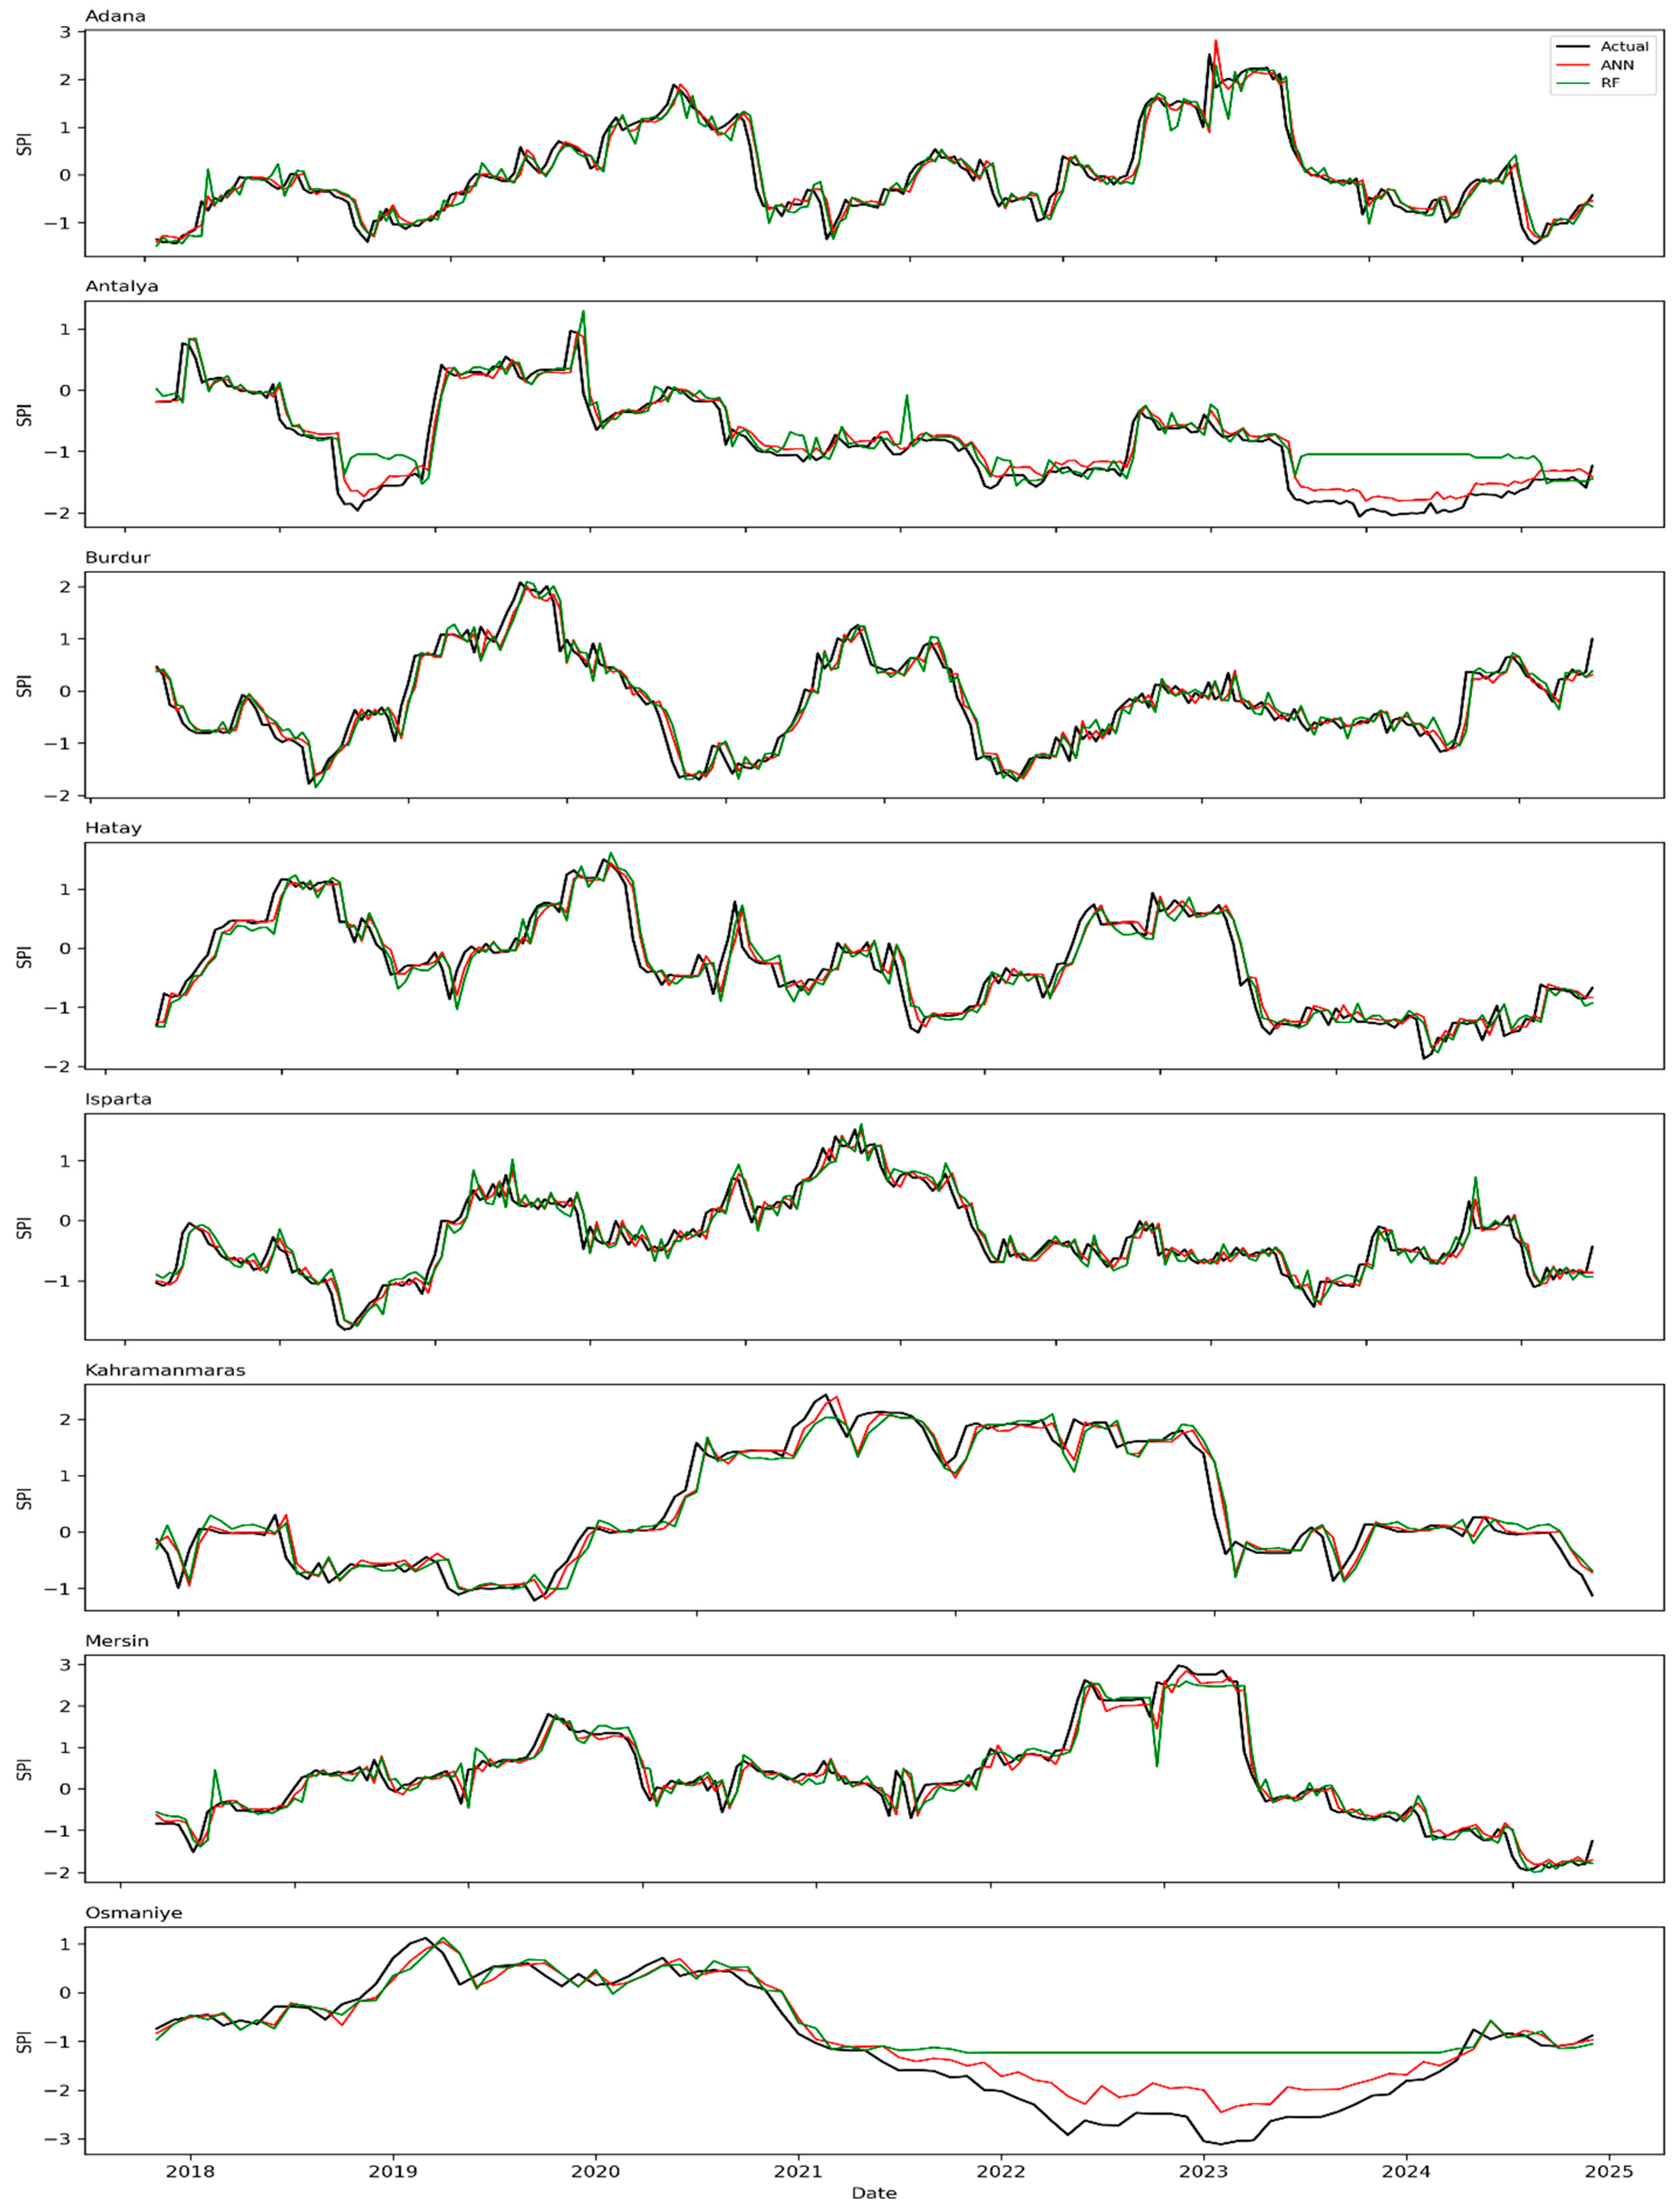
The SPI-24 analysis (Figure 9) provides a comprehensive view of long-term drought persistence and gradual hydroclimatic transitions across the Mediterranean Region. Adana, Hatay, and Mersin exhibited extended wetness trends between 2020 and 2022, followed by a gradual decline toward neutral or slightly dry conditions in 2023–2024. These multi-year fluctuations indicate the strong influence of large-scale atmospheric oscillations and sea-surface temperature variability on coastal rainfall regimes. Antalya and Isparta maintained relatively stable SPI-24 values, suggesting consistent long-term precipitation and limited susceptibility to prolonged drought events.
Burdur and Kahramanmaraş displayed more pronounced long-term anomalies, characterized by alternating wet and dry phases over multi-year periods. Burdur’s SPI-24 series reflects significant hydrological recovery after 2022, while Kahramanmaraş exhibited a transition from moderate wetness in 2020–2021 to persistent dryness until 2023, indicating strong temporal inertia in regional water balance. Osmaniye, though having a shorter observation span, experienced a notable prolonged drought period from late 2021 to early 2023, with SPI-24 values dropping below −2, signifying severe long-term dryness before partial recovery.
From a modelling standpoint, both artificial neural network (ANN) and Random Forest (RF) models performed robustly in reproducing long-term SPI-24 trends. The ANN model effectively captured subtle shifts in the direction of long-term precipitation patterns, while the RF model excelled in maintaining trend continuity and minimizing noise. Minor discrepancies—particularly in the extreme negative SPI phases—were observed, where ANN tended to slightly underestimate prolonged drought intensity, while RF slightly lagged in recovering from transitions to wet conditions. Despite these differences, both models demonstrated strong predictive reliability for multi-year drought characterization, confirming their suitability for long-range drought risk assessment and climatic resilience studies.

4. Discussion

This study employed two artificial intelligence-based methods—artificial neural networks (ANNs) and Random Forests (RFs)—to forecast drought conditions using the Standardized Precipitation Index (SPI) across multiple temporal scales in Türkiye’s Mediterranean Region. The results demonstrate that both models can effectively capture the complex, nonlinear relationships between precipitation variability and drought dynamics, with notable differences in their temporal response characteristics and predictive capacities.
The ANN model produced highly successful results, particularly at the SPI-6, SPI-12, and SPI-24 timescales. Its deep learning structure, composed of interconnected hidden layers and nonlinear activation functions, enabled it to learn the intrinsic temporal dependencies in precipitation data. Consequently, the ANN achieved exceptionally high accuracy, with an R2 of 0.940 in Osmaniye for SPI-24, confirming its capacity to represent long-term drought evolution. This performance is consistent with the findings of earlier studies [4,5], which reported R2 = 0.92 for LSTM networks in China and comparable results for SPI-24 prediction in India. The model’s ability to represent long-term drought persistence demonstrates that deep learning algorithms can capture complex interactions within the hydrological system, including delayed responses between rainfall anomalies and surface water storage. This behavior is consistent with the findings of other studies [9] that employed a hybrid SVM-POA model in Iran and attained R2 = 0.98, underscoring the efficacy of data-driven methodologies in replicating drought continuity under intricate climatic conditions.
In contrast, the RF model provided simpler and more stable predictions, particularly for short-term drought forecasting (SPI-3), where it achieved an R2 of 0.894. Its ensemble-based decision-tree structure effectively reduces variance and mitigates overfitting through bootstrap aggregation, which explains its robustness in capturing short-term precipitation fluctuations. The superior short-term performance of RF is consistent with the findings of other studies [22], which applied RF for groundwater drought prediction in Morocco’s Haouz Aquifer and demonstrated its adaptability under future climate scenarios, including severe drought projections under RCP 8.5. In a similar vein, another study demonstrated that tree-based and hybrid learning models surpass traditional statistical methods in their ability to address complex nonlinear climate–drought relationships, particularly in data-limited regions such as Upper Egypt [19].
From a methodological perspective, the ANN and RF models in this study reveal complementary predictive behavior. While the ANN excels in capturing smooth long-term variability and temporal memory, the RF model provides stability and resistance to local fluctuations in the input data. This complementary relationship supports the hybrid modelling strategies advocated in the literature [6,20], where the integration of decomposition techniques (e.g., wavelet or VMD) with machine learning models significantly enhances SPI forecasting accuracy. The high R2 values (>0.80 for SPI-6 to SPI-24) and strong correlation coefficients (r > 0.85) obtained here further emphasize the robustness of both models for operational drought monitoring.
When placed in a broader scientific context, the present results show convergence with global drought prediction studies (Table 3). For instance, it was demonstrated [33] that wavelet–SVR hybrids achieved R2 = 0.885 for Ethiopian stations, while near-perfect correlations (r ≈ 0.99) were obtained [18] using LSTM for SPI-6 and SPI-9 forecasts in the Wami Basin, Tanzania. In a similar vein, it was demonstrated [21] that artificial neural networks (ANNs) exhibited robust performance in simulating summer precipitation in Xinjiang, China, identifying key teleconnection indices such as El Niño Southern Oscillation (ENSO) and Atlantic Multidecadal Oscillation (AMO) as critical drivers of drought. Within Türkiye, CNN, ConvLSTM, and XGBoost models were employed to link SPI and VHI (Vegetation Health Index) dynamics, obtaining R2 values above 0.89 and confirming the consistency of deep learning methods under the Mediterranean climate’s strong seasonal regime [10,11]. These cross-regional validations highlight that the high performance of ANN and RF in the current study is not an isolated outcome but a reflection of their structural suitability for modeling hydroclimatic complexity.
Another significant finding concerns the temporal sensitivity of the models. ANN consistently outperformed RF as the SPI accumulation period increased, suggesting its superior capability to integrate information over longer lags. This advantage arises from the network’s nonlinear backpropagation mechanism, which preserves temporal dependencies beyond immediate rainfall variations. Conversely, RF responded more accurately to short-term precipitation changes due to its recursive partitioning of decision nodes, which isolates local anomalies. This pattern lends support to the observations that short-lead SPI predictions were more reliable when using ensemble methods, whereas long-term drought persistence was better represented by neural or hybrid approaches [20].
From an applied hydrology standpoint, these findings have substantial practical implications. The RF model’s simplicity, low computational cost, and interpretability make it well suited for real-time drought early-warning systems and operational forecasting in regional meteorological centers. Meanwhile, the ANN model’s superior accuracy and ability to represent multi-year drought cycles make it ideal for long-term drought trend assessment and climate adaptation planning. Together, these models form a dual-framework capable of addressing both immediate management needs and strategic policy design for water resource sustainability. The reproducibility of results across multiple provinces—despite topographical, climatic, and data heterogeneity—also indicates that the methodology can be extended to other semi-arid regions, aligning with the transferability findings [6,19].
Overall, the comparative analysis confirms that both ANN and RF are effective for SPI-based drought prediction, yet their optimal use depends on the forecast horizon and complexity of local drought dynamics. Deep learning approaches such as ANN excel in modeling persistent hydrological memory and complex temporal dependencies, while ensemble-based methods like RF retain strong practical value in fast, short-term forecasting scenarios. These insights contribute to the growing evidence that integrating data-driven models with established drought indices provides a powerful, adaptive framework for regional hydroclimatic resilience and sustainable water management.

5. Conclusions

This research developed and evaluated artificial neural network (ANN) and Random Forest (RF) models for drought prediction in eight provinces of Türkiye’s Mediterranean Region, using nearly a century of monthly precipitation data (1929–2024) and SPI computed at 3-, 6-, 12-, and 24-month timescales.
Model Performance and Timescale Sensitivity: The ANN model achieved the highest overall accuracy, particularly at longer accumulation periods (SPI-12 and SPI-24), with R2 values reaching 0.940 in Osmaniye. The RF model exhibited robust results for short-term SPI-3 forecasts (R2 = 0.894), indicating its ability to model rapid precipitation fluctuations. Both models showed strong correlations (r > 0.85) with observed SPI values, confirming their capacity to represent nonlinear rainfall–drought relationships.
Temporal Behavior and Drought Dynamics: ANN effectively replicated both the magnitude and direction of long-term drought cycles, whereas RF provided smoother but less responsive outputs to abrupt hydroclimatic transitions. The spatial consistency of SPI patterns among coastal provinces (Adana, Hatay, Mersin) and inland basins (Burdur, Isparta) underscores regional climatic coherence and variability.
Comparative and Contextual Insights: The achieved accuracy levels are comparable to or exceed those of international studies employing LSTM, SVR, or hybrid decomposition techniques [9,20]. The exclusive use of precipitation data, without auxiliary inputs (e.g., temperature, evapotranspiration), confirms the robustness of SPI as a drought indicator for AI-based prediction.
Practical and Scientific Implications: ANN and RF can be operationally integrated into regional drought early-warning systems, offering reliable short- and long-term forecasts. The methodology contributes to hydroclimatic risk management by supporting adaptive agricultural planning and water resource allocation. The study establishes a reproducible modelling pipeline applicable to other climatic regions of Türkiye or similar Mediterranean environments.
Limitations and Future Directions: While SPI-based forecasting provides valuable insight into meteorological droughts, future models should incorporate multi-variable indices (e.g., SPEI, SPTI) to account for temperature-driven evapotranspiration effects. Integration of satellite-based indicators (NDVI, soil moisture) and hybrid AI architectures (CNN–LSTM, Wavelet–RF) could further enhance spatial and temporal resolution.
In summary, artificial neural networks demonstrated outstanding skill in modeling complex, long-term precipitation–drought interactions, while Random Forests offered stable and computationally efficient solutions for short-term variability. Their combined application provides a comprehensive framework for drought monitoring and forecasting, strengthening regional preparedness against climate-induced water scarcity and contributing to sustainable hydrological management in the Mediterranean Region of Türkiye.

Author Contributions

R.E.: The hydrological and artificial intelligence sections of the study, as well as writing the majority of the text. D.A.: Contributed to the artificial intelligence part of the study, which involved preparing the codes. A.B.A.: Contributed to the hydrological part of the study, which involved calculating the SPI values. All authors have read and agreed to the published version of the manuscript.

Funding

This research received no external funding.

Data Availability Statement

The data presented in this study are available on request from the corresponding author. The data are not publicly available due to privacy.

Acknowledgments

This paper is based on the ongoing doctoral research of Rojhat Ergüven.

Conflicts of Interest

The authors declare that they have no known competing financial interests or personal relationships that could have appeared to influence the work reported in this paper.

References

  1. McKee, T.B.; Doesken, N.J.; Kleist, J. The relationship of drought frequency and duration to time scales. In Proceedings of the 8th Conference on Applied Climatology, Anaheim, CA, USA, 17–22 January 1993; Volume 17, pp. 179–183. [Google Scholar]
  2. Feng, Q.; Liu, W.; Si, J.; Su, Y.; Zhang, Y. Application of machine learning techniques to drought prediction using SPI. J. Hydrol. 2019, 576, 99–111. [Google Scholar] [CrossRef]
  3. Modarres, R.; da Silva, V.D.P. Rainfall trends in arid and semi-arid regions of Iran. J. Arid Environ. 2007, 70, 344–355. [Google Scholar] [CrossRef]
  4. Zhang, J.; Liu, D.; Zhang, Y.; Zhang, Y. Long short-term memory networks for SPI-based drought forecasting. Water 2020, 12, 144. [Google Scholar] [CrossRef]
  5. Dhanvijay, V.; Panhalkar, S.S. Deep Learning-Based Hydrological Drought Prediction in the Wardha River Basin, India. Nat. Hazards 2023, 117, 543–567. [Google Scholar]
  6. Aydin, M.; Demir, M.; Altun, Y. Comparison of LSTM and SVM methods through wavelet decomposition in drought forecasting. Environ. Model. Softw. 2023, 168, 105565. [Google Scholar]
  7. Wang, W.; Chau, K.W.; Cheng, C.T.; Qiu, L. A comparison of performance of several artificial intelligence methods for forecasting monthly discharge time series. J. Hydrol. 2021, 536, 165–176. [Google Scholar] [CrossRef]
  8. Belayneh, A.; Adamowski, J.; Khalil, B. Short-term SPI drought forecast using wavelet transforms and machine learning models. Hydrol. Earth Syst. Sci. 2014, 18, 4065–4078. [Google Scholar] [CrossRef]
  9. Mishra, A.K.; Singh, V.P. A review of drought concepts. J. Hydrol. 2010, 391, 202–216. [Google Scholar] [CrossRef]
  10. Karami, M.; Hezarkhani, A.; Beiranvand Pour, A. Drought prediction using advanced hybrid machine learning for arid and semi-arid environments. Sci. Total Environ. 2023, 873, 162361. [Google Scholar]
  11. Karaca, F. Derin Öğrenme Yöntemleri ile MODIS Tabanlı NDVI ve LST Zaman Serilerinin Kestirimi ve Kuraklık Şiddetinin Araştırılması. Ph.D. Thesis, İstanbul Teknik Üniversitesi, İstanbul, Türkiye, 2023. [Google Scholar]
  12. Türkmen, S. Yapay Zeka ve Uzaktan Algılama Tabanlı Kuraklık İzlemesi ve Tahmini: Trakya Bölgesi Örneği. Ph.D. Thesis, Namık Kemal Üniversitesi, Tekirdağ, Türkiye, 2023. [Google Scholar]
  13. Dile, Y.T.; Berndtsson, R.; Setegn, S.G. Hydrological response to climate change for Gilgel Abay River, in the Lake Tana Basin—Upper Blue Nile Basin of Ethiopia. PLoS ONE 2016, 11, e0163777. [Google Scholar] [CrossRef] [PubMed]
  14. Ahmad, M.; He, R.; Al-Amin, M.; Tahir, F. Forecasting drought using machine learning: A systematic literature review. Environ. Res. 2023, 232, 116200. [Google Scholar] [CrossRef]
  15. Reichstein, M.; Camps-Valls, G.; Stevens, B.; Jung, M.; Denzler, J.; Carvalhais, N.; Prabhat. Artificial intelligence and climate science. Nature 2019, 566, 29–39. [Google Scholar] [CrossRef]
  16. Ceyhunlu, A.I.; Ceribasi, G. Prediction of precipitation-temperature data and drought assessment of Türkiye with stochastic time series models. Pure Appl. Geophys. 2024, 181, 2913–2933. [Google Scholar] [CrossRef]
  17. Şimşek, O.; Ceyhunlu, A.I.; Ceribasi, G.; Keskiner, A.D. Evaluation of long-term meteorological drought in the Aras and Coruh Basins with Crossing Empirical Trend Analysis. Phys. Chem. Earth 2024, 135, 103611. [Google Scholar] [CrossRef]
  18. Ceyhunlu, A.I.; Ceribasi, G. Changes in precipitation and air temperature over Türkiye using innovative trend pivot analysis method. J. Water Clim. Chang. 2024, 15, 2446–2461. [Google Scholar] [CrossRef]
  19. Lalika, C.S.; Msigwa, M.K.; Li, L.; Komakech, H.C. Machine learning algorithms for the prediction of drought conditions in the Wami River sub-catchment, Tanzania. J. Hydrol. Reg. Stud. 2024, 53, 101794. [Google Scholar] [CrossRef]
  20. Elbeltagi, A.; Srivastava, A.; Ehsan, M.; Sharma, G.; Yu, J.; Khadke, L.; Gautam, V.K.; Awad, A.; Ding, J. Advanced stacked integration method for forecasting long-term drought severity: CNN with machine learning models. J. Hydrol. Reg. Stud. 2024, 53, 101759. [Google Scholar] [CrossRef]
  21. Ladouali, S.; Hamouda, N.; Djebbar, R.; Djebbar, Y. Short lead time Standard Precipitation Index forecasting using extreme learning machine and variational mode decomposition. J. Hydrol. Reg. Stud. 2024, 54, 101861. [Google Scholar] [CrossRef]
  22. Ma, C.; Yao, J.; Mo, Y.; Zhou, G.; Xu, Y.; He, X. Prediction of summer precipitation via machine learning with key climate variables: A case study in Xinjiang, China. J. Hydrol. Reg. Stud. 2024, 56, 101964. [Google Scholar] [CrossRef]
  23. Imane, L.; Lhoussaine, M.; Saida, B. Future groundwater drought analysis under data scarcity using MedCORDEX regional climatic models and machine learning: The case of the Haouz Aquifer. J. Hydrol. Reg. Stud. 2025, 58, 102249. [Google Scholar] [CrossRef]
  24. Dikshit, A.; Pradhan, B.; Alamri, A.M. Short-term spatio-temporal drought forecasting using Random Forests model at New South Wales, Australia. Appl. Sci. 2020, 10, 4254. [Google Scholar] [CrossRef]
  25. Belayneh, B.; Adamowski, J.F. Drought forecasting using new machine learning methods. J. Water Land Dev. 2013, 18, 3–12. [Google Scholar] [CrossRef]
  26. Haykin, S. Neural Networks and Learning Machines, 3rd ed.; Pearson Education: London, UK, 2009. [Google Scholar]
  27. Goodfellow, I.; Bengio, Y.; Courville, A. Deep Learning; MIT Press: Cambridge, MA, USA, 2016. [Google Scholar]
  28. Bishop, C.M. Neural Networks for Pattern Recognition; Oxford University Press: Oxford, UK, 1995. [Google Scholar]
  29. Zou, H.; Hastie, T. Regularization and variable selection via the Elastic Net. J. R. Stat. Soc. Ser. B 2005, 67, 301–320. [Google Scholar] [CrossRef]
  30. Ke, G.; Meng, Q.; Finley, T.; Wang, T.; Chen, W.; Ma, W.; Ye, Q.; Liu, T.-Y. LightGBM: A highly efficient gradient boosting decision tree. Adv. Neural Inf. Process. Syst. 2017, 30, 3146–3154. [Google Scholar]
  31. Hochreiter, S.; Schmidhuber, J. Long Short-Term memory. Neural Comput. 1997, 9, 1735–1780. [Google Scholar] [CrossRef]
  32. Chen, T.; Guestrin, C. XGBoost: A scalable tree boosting system. In Proceedings of the 22nd ACM SIGKDD International Conference on Knowledge Discovery and Data Mining, San Francisco, CA, USA, 13–17 August 2016; pp. 785–794. [Google Scholar]
  33. Coban, H.O.; Sorman, A.U.; Sensoy, A.; Sorman, A.A. drought indices and their performance for monitoring meteorological drought in Türkiye. Meteorol. Appl. 2019, 26, 292–305. [Google Scholar] [CrossRef]
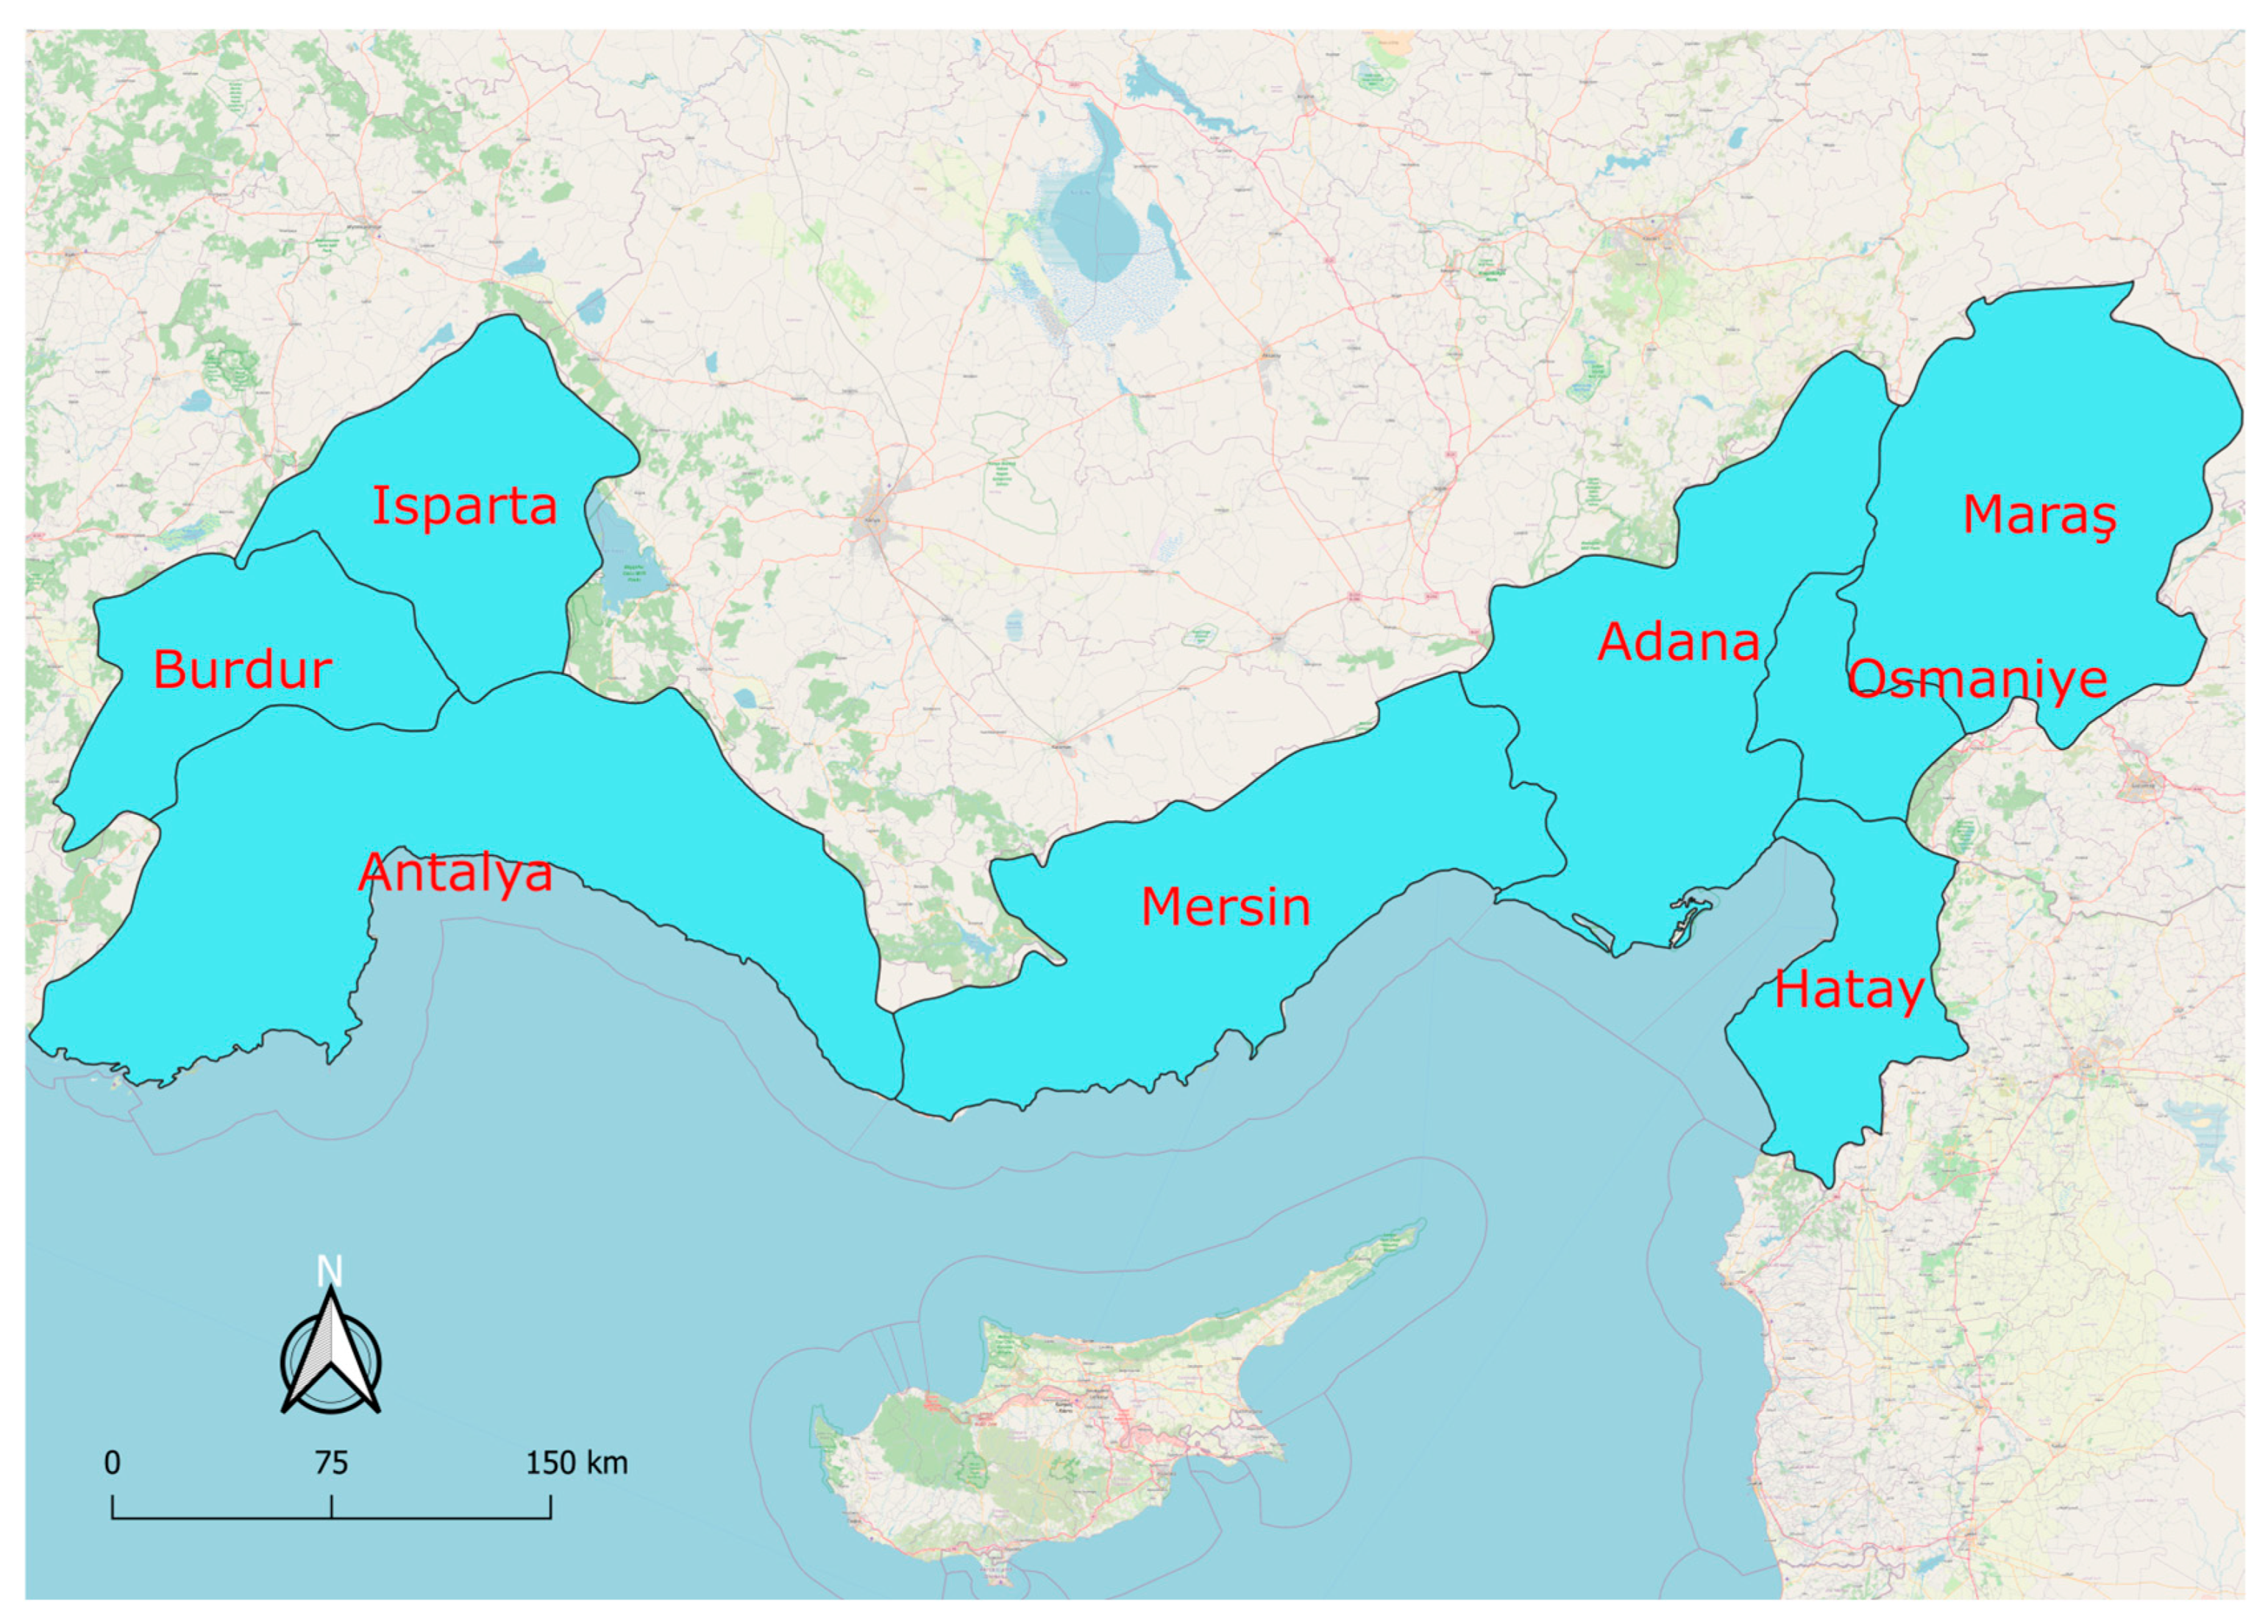
Figure 1. Türkiye Mediterranean Region.
Applsci 15 12172 g001
Figure 2. Structure of the ANN model used for SPI-based drought forecasting.
Applsci 15 12172 g002
Figure 3. Random Forest model structure for SPI-based drought prediction.
Applsci 15 12172 g003
Figure 4. Workflow chart.
Applsci 15 12172 g004
Figure 5. The mean metric values for all SPIs.
Applsci 15 12172 g005
Figure 6. SPI-3 prediction: actual vs. ANN and RF.
Applsci 15 12172 g006
Figure 7. SPI-6 prediction: actual vs. ANN and RF.
Applsci 15 12172 g007
Figure 8. SPI-12 prediction: actual vs. ANN and RF.
Applsci 15 12172 g008
Figure 9. SPI-24 prediction: actual vs. ANN and RF.
Applsci 15 12172 g009
Table 1. Categorization of SPI values.
SPI RangeCategoryDescriptionTypical Drought Condition
≥2.00Extremely WetExceptionally high precipitationFlooding likely; saturated soils
1.50–1.99Very WetSubstantially above normal rainfallWet spell; high river and reservoir inflow
1.00–1.49Moderately WetSlightly above average rainfallMoist conditions; recovery from drought
−0.99–0.99Near NormalNormal rainfall variabilityNo significant drought or wetness
−1.00–−1.49Moderately DryNoticeable rainfall deficitBeginning of agricultural stress
−1.50–−1.99Severely DrySignificant moisture deficitCrop failure risk; reservoir drawdown
≤−2.00Extremely DryExceptional drought intensityMajor hydrological and socioeconomic impacts
Table 2. Comparative performance of six machine learning models in predicting Standardized Precipitation Index (SPI) values across multiple timescales.
ModelsR2rRMSEMAE
SPI-3ANN0.720.850.510.39
RF0.680.830.550.42
ElasticNet0.460.690.750.58
LSTM0.370.620.800.63
LGBM0.360.610.810.64
XGBoost0.370.630.810.63
SPI-6ANN0.810.900.440.33
RF0.770.880.480.36
ElasticNet0.710.850.550.41
LSTM0.620.800.630.49
LGBM0.570.780.680.52
XGBoost0.570.780.680.52
SPI1-2ANN0.840.920.420.29
RF0.800.900.470.34
ElasticNet0.880.940.350.25
LSTM0.730.890.520.37
LGBM0.750.900.510.38
XGBoost0.670.870.570.41
SPI-24ANN0.810.850.290.20
RF0.790.840.330.24
ElasticNet0.820.850.230.17
LSTM0.680.820.390.27
LGBM0.680.820.400.29
XGBoost0.630.800.430.31
Mean SPIANN0.790.880.410.30
RF0.760.860.450.34
ElasticNet0.720.830.470.35
LSTM0.600.780.590.44
LGBM0.600.780.590.45
XGBoost0.560.770.620.47
Table 3. Comparison of the results obtained in this study with other studies in the literature.
StudyModelRegionMain Result
This Study—ANN (SPI-24)ANNOsmaniye (TR)R2 = 0.940
This Study—RF (SPI-24)RFOsmaniye (TR)R2 = 0.894
Zhang et al. [4]LSTMChinaR2 = 0.920
Karami et al. [10]SVM-POAIranR2 = 0.980
Dhanvijay & Panhalkar [5]LSTMIndiaR2 = 0.920
Aydin et al. [6]LSTM-WaveletTürkiyeR2 = 0.994
Belayneh et al. [8]Wavelet + SVREthiopiaR2 = 0.885
Karaca [11]CNN/ConvLSTMTürkiyeR2 = 0.890
Türkmen [12]ConvLSTM/XGBoostTürkiyeR2 = 0.910
Lalika et al. [19]LSTMTanzania (Wami Basin)NSE/R ≈ 0.99 (SPI-6/9)
Elbeltagi et al. [20]CNN-LSTM HybridUpper EgyptR2 = 0.885 (PDSI)
Ladouali et al. [21]VMD-ELMAlgeriaImproved SPI forecasts (short lead times)
Ma et al. [22]ANNXinjiang, ChinaRobust accuracy; key teleconnections (ENSO, AMO)
Imane et al. [23]RF + SPI/SPEIHaouz Aquifer, MoroccoRF best; severe droughts under RCP 8.5
Disclaimer/Publisher’s Note: The statements, opinions and data contained in all publications are solely those of the individual author(s) and contributor(s) and not of MDPI and/or the editor(s). MDPI and/or the editor(s) disclaim responsibility for any injury to people or property resulting from any ideas, methods, instructions or products referred to in the content.