1. Introduction
Polyurethane foam (Pu) piles have been recently used in many geotechnical applications, especially in slope stability protection and in emergency and disaster relief scenarios [
1]. Extensive studies have been conducted on Pu as a soil improvement. The improvement mechanism of Pu-Foam piles is formed by creating a partial volumetric replacement of the soft clay soil with a lightweight material possessing relatively high strength properties. This partial volume replacement reduces the overall unit weight of the composite ground, limits settlement under embankment loads, and increases the shear resistance of the improved soil zone. Consequently, the Pu-Foam piles can provide both stability improvement and settlement reduction without the need for preloading. Because of these distinct characteristics, Pu-Foam piles can be particularly beneficial in situations where time-dependent consolidation is critical or where construction must proceed rapidly. As investigated in [
2], the structure and the expanding characteristics of Pu make it effective as a foundation remedial. They found that the structural heterogeneity reduced the clay compressive strength, while the hydraulic conductivity was increased within the typical range of clay soil. In a subsequent study, the long-term swelling potential of resin–clay composite on Maryland clay was examined [
3]. They fossund that the propagation of resin is unpredictable without any significant enhancement of the swelling potential. The long-term soil rehydration could not be prevented, but, at most, it can be delayed. It was found that Pu micro-pile is useful in improving the substructure performance of shallow foundations, railway or motorway embankments, and airstrips [
4]. The effect of grout injection on E-Kaolin soil specimens prepared at different over-consolidation ratios ranging from 1 to 10. They used two different grouting methods: fracture grouting and compaction grouting. They found that better soil improvement from compaction grout is more efficient compared to fracture grouting [
5].
Pu grout injection in high plasticity clay was experimentally investigated, and the results of pressure meter tests and cone penetration tests were compared before and after the injection of Pu [
6]. Their results revealed that there was a significant increase in pressure limit and soil resistance along depths close to the injection point. The study also noted that non-simultaneous injections resulted in a large stress concentration around the injection point, leading to larger soil consolidation. Similarly, ref. [
7] evaluated the performance of Pu injection for piles and slab in comparison with lightweight concrete for ground improvement using Plaxis software ver. 8. The results showed that the Pu soil improvement significantly reduced the expected settlement due to the lightweight nature of the material and its ability to fill the void between the soil particles.
A bio-based Pu was investigated [
8] as an eco-friendly alternative to ordinary petroleum-based Pu. They found that the optimal polyol-to-isocyanate ratio of 0.75:1 for producing a rigid Pu is suitable for different geotechnical applications. Several case studies of rapid remediation using Pu grout in Malaysia were collected and investigated by [
9], concluding that utilizing Pu was effective in all documented cases of soil improvement projects. Lat et al. (2019) [
10] extended their work and presented a study using finite element modeling with PLAXIS 2D ver. 8 in order to simulate the behavior of marine clay treated with Pu-Foam slabs of varying thicknesses under different loading conditions. Their results show that Pu foam significantly reduced settlement and deformation. It was also found that Pu prevented water from penetrating the soil below it and softened it. However, using Pu-Foam slabs with excessive thickness can lead to uplift pressure due to buoyancy because the foam is lighter than water. The use of polyurethane (Pu) columns to enhance the bearing capacity of marine clay was also investigated [
11]. Pu columns were formed to create a 12.6% area improvement ratio. Load tests conducted one day after installation showed increases in bearing capacity up to 220% for end bearing columns. The effect of Pu soil improvement in roads for mitigating flood damage based on the results of California Bearing Ratio (CBR) tests was studied by [
12]. His results indicated that the Pu layer can enhance or preserve the strength of subgrade soil exposed to inundation. Additionally, a case study on road maintenance was presented using Pu-Foam injection, and their findings illustrated that the ground improvement was significantly improved as a result of the strong expansion of the injection process, which caused significant compaction of the surrounding soil [
13].
The effect of utilizing the soil injection using expandable polyurethane (Pu) resin to reduce the soil settlement problems under foundations was studied [
14]. Dynamic cone penetration test results before and after soil improvement were compared to evaluate the effect of the injection process. It was found that the injection process of Pu into non-cohesive sandy soil significantly increased the soil stiffness and therefore reduced the soil settlements. In a subsequent study [
15], plate loading tests were conducted on Pu improved sand soil to evaluate the ultimate bearing capacity. The study showed that there was a significant improvement in soil bearing capacity by 67% at a depth of 0.4 m and 125% at 1.1 m. Similarly, the deformation modulus increased by 55% and 203% at these depths, respectively. A laboratory program was also conducted [
16] to determine the strength–density relationship of polyurethane resin based on its volumetric expansion nature.
The slope stability protection using Pu micro piles, using a 3D model, was investigated by [
1]. Various embedment depths and pile positions were studied to evaluate their effectiveness. Their results showed a significant enhancement in slope safety and landslide resistance. They also found that increasing pile depth improves slope stability, and the best pile position is at 55–65% of the slope length from the crest.
The strength improvement of sand soil by adding different ratios of polyurethane resin was explored [
17]. Cylindrical samples were extracted from the improved soil for unconfined compressive strength and shear strength tests. Additionally, plate load tests were conducted before and after injection to evaluate changes in settlement, bearing capacity, and deformation modulus. It was found that using Pu as a soil improvement technique significantly increased the deformation modulus up to 58% and the settlement decreased with ratios up to 52%. The ultimate bearing capacity reached about 1000 kPa due to such improvement.
Laboratory and field tests were conducted on Pu-treated silty sand to evaluate the mechanical characteristics [
18]. The results demonstrated significant improvements in unconfined compressive strength, tensile and shear strengths, along with reduced permeability and enhanced water retention. Pu-treated soil was found to provide erosion resistance and also increased resistance to rainfall and runoff.
Numerical simulations were presented [
19], to investigate the effect of Pu foam as a soil improvement technique for enhancing the mechanical strength of both sand and clay soils. The study found that using Pu piles, especially with larger diameters and closer spacing or as sheet inclusions, increased the slope safety factor for both clay and medium dense sand slopes. The greater enhancement was observed in sandy soils.
A laboratory program was conducted in order to investigate the use of Pu foam to improve the performance of collapsible soil under footings [
20]. Their study showed that adding 3% polyurethane foam significantly reduced volumetric strain and collapse potential, with a considerable increase in the ultimate bearing capacity depending on the depth of the effective treatment zone.
A soil stabilization method using polyurethane foam sealants for roads was introduced [
21]. The presented method demonstrated strength improvements in the road subgrade. It was also found that using polyurethane reduced pavement layer thickness, stabilized thermal and moisture conditions, and prevented frost heave.
A series of laboratory tests for determining the soil erosion resistance for three types of polyurethane-treated soil was conducted [
22]. These polymers were applied to sand–clay mixtures with weight ratios of 1:1, 1:3, and 1:5, and tested at various concentrations. It was found that all three polyurethanes significantly enhanced soil strength and erosion resistance, making them suitable for slope protection and roadway stabilization applications. The improvement was attributed to physicochemical interactions between the polyurethane macro-molecules and the soil’s clay content.
Researchers have focused on evaluating and modeling soil slopes to accurately assess their stability and selecting the safest and most economical stabilization methods for endangered slopes. Several methods were conducted to accurately assess the slope safety factor, taking into consideration the stress analyses of the slope body. The most common slope stability analysis theories are limit equilibrium methods, limit analysis methods, and strength reduction analysis. The limit equilibrium method is considered the most common slope stability analysis due to its simplicity [
23]. This method can identify the slope safety factor considering the equilibrium for the entire mass of soil bounded beneath by an assumed slip surface or by dividing the slope into slices [
24]. The limit analysis treats the soil as a perfectly plastic material that follows an associated flow rule. The limit analysis technique relies on two fundamental theorems—the lower and upper bound theorems—which are derived from static and kinematic principles, respectively [
25].
As mentioned in several studies, such as [
26], the Strength Reduction Method (SRM) was initially introduced by Zienkiewicz et al. (1975) [
27]. This method has since gained attention from many researchers [
28,
29,
30]. The strength reduction technique, based on reducing the cohesion (c) and soil angle of shearing resistance (ϕ) by a factor N until failure, was observed. The results obtained using SRM were found to closely align with those derived from traditional limit equilibrium methods.
The finite element method (FEM) is considered a reliable and effective method to evaluate slope stability using an elastic-plastic Mohr–Coulomb model [
31]. One of the main strengths of FEM is that it does not require the definition of any pre-failure mechanism. Since their study, more advanced numerical approaches combining FEM with strength reduction techniques have become common, providing a better understanding of slope stability analysis [
23].
The slope safety factor in the philosophy of strength reduction analysis is defined as the critical reduction factor that is applied to soil shear strength parameters at which the slope model becomes unstable (non-convergent state). Through model iterations of strength reduction factors, the finite element solver tries to find a solution until it cannot find a stable stress solution. In finite element tools, the slope shows excessive displacement if deformations exceed 5–10% of the slope height, which is considered a high value. While in normal embankment design, the acceptable deformation ranges are from 0.50 to 1%, according to the Bureau of Reclamation [
32].
There are three major criteria that govern the convergence of slope analysis: the convergence of the finite element calculation, the sudden change in the strain and displacement, and the entire penetration of the plastic zone. However, using the definition of non-convergence based on the three failure criteria can be affected by many human factors, such as the choice of mesh quality and density, step size, iteration limits, tolerance values, and solver type. The first criterion to evaluate slope stability based on SRM defines slope failure based on the non-convergence of numerical iterations [
28,
29,
30]. This method does not take into consideration the actual behavior of the slope soil and the stress–strain relationships. The second criterion evaluates the slope safety by defining sudden changes in displacement at certain points, such as the slope crest, toe, midpoint, and the point of maximum displacement [
33]. However, the accuracy of this method is limited by the selection of these points. In the case of soft soil, the displacement curves are relatively smooth, making it very difficult to identify the limit at which the slope is considered “unsafe”. The last method considers the formation of a continuous plastic zone from the slope toe to its crest as a sign of failure. However, this method can be unreliable for gentle slopes or in cases where the numerical model fails to form such a zone before convergence occurs [
31,
34].
In order to have a more realistic slope evaluation, new failure criteria were proposed based on energy changes during the failure process [
35]. They compared their proposed criteria with the three conventional criteria mentioned above and found that the proposed method could offer a clearer physical meaning. However, the proposed method required integration over the entire computational domain and manual identification of the energy mutation point, which required high computational effort. An improvement technique of the traditional Bisection Method was proposed to minimize the computation time for shear strength reduction in finite element slope stability analysis [
36]. They introduced the False Position Method as an alternative method that significantly reduced the number of solver iterations to determine the slope safety factor. This improvement is designed by incorporating weighting factors based on nodal displacement or iteration count. The proposed method was found to be an effective way to reduce computation time. It was also discovered that hybrid approaches combining bracketing and incrementation increased the enhancement performance, with savings of up to 50% in total solver iterations.
A double-strength reduction method was also proposed in [
37], aiming to improve the assessment of nonhomogeneous slope stability. This approach was developed to overcome the limitations of traditional single-coefficient reduction techniques, which often ignore the varying contributions of mechanical parameters during slope failure. Their findings revealed that parameters like elasticity modulus, Poisson’s ratio, and unit weight had little impact on the factor of safety (FS), whereas cohesion and internal friction angle played a much more significant role. The researchers found that the results were in good agreement with conventional methods. However, there were some limitations in the proposed method related to the use of a two-dimensional model and the assumption of uniform strength reduction.
Many kinds of finite element software, such as Abaqus software ver. 2023 [
38], do not provide a straightforward means for determining the slope safety factor. This means that many failure criteria could be implemented in different ways in the slope model in order to provide a more accurate evaluation of the slope failure mechanism. In Abaqus software, the slope failure governing criteria is defined as follows: in the case of soil with relatively high shear strength parameters or soil exists above the groundwater table, the point of failure is defined using the plastic strain magnitude as it is the point at which the shear strength reduction remains constant with the increasing of slope displacement at the crest, toe, or middle point of the slope. If the soil is weak (saturated soft clay), the shear strength reduction increases at a slow rate with the increase in slope displacement due to the dissipation of pore water pressure, and the point of slope failure cannot be defined.
Previous studies have not investigated the use of Pu-Foam piles as a partial vertical replacement within soft clay layers to reduce the consolidation of the embankment body. In the present study, we address this gap by performing a comprehensive slope stability analysis for sand embankments over soft clay using finite-element modeling in Abaqus software. We have also examined several key parameters that significantly influence slope behavior and developed practical design charts accordingly. The presented approach introduces a more integrated evaluation of the slope safety factor by focusing on slope settlements and soil shear strength parameters, aiming to reduce the influence of subjective human factors in the numerical modeling process. A key aspect of the research involves examining the effectiveness of polyurethane (Pu) foam piles as a ground improvement technique. These lightweight, expandable columns are assessed for their ability to enhance slope stability, particularly in soft clay layers. The analysis also considers the critical design variables such as pile length, diameter, and the percentage of the improved area, and pile arrangement, recognizing their impact on the overall efficiency of the improvement technique. This approach not only advances the understanding of soil improvement techniques but also contributes to more objective slope stability assessments. Furthermore, a distinctive outcome of our research is the development of practical design charts based on the comprehensive analysis of all modeled cases. These charts are intended to assist engineers in evaluating the safety factors of improved slope systems under similar conditions, offering a user-friendly reference for future design and decision-making.
2. Numerical Modeling
A 3D model was developed with Abaqus software Ver. 2023 to simulate the construction of a 3.0 m high and 25 m wide sand embankment over weak soft clay soil strata in the New Damietta area. The soil profile mainly consists of 6.0 m of saturated soft clay soil followed by 4 m of stiff clay soil. The generation of pore water pressure and excessive settlement due to sand embankment will cause slope instability and bearing capacity failure. The presented study investigates the possibility of using square and triangular Pu-Foam piles with different geometrical properties and improvement ratios for increasing the slope safety factor. The calculation of the safety factor for a sand embankment constructed over saturated clay soils is performed by means of the shear strength reduction method.
The Mohr–Coulomb (MC) failure analysis is adapted as the constitutive model for the numerical analyses. As previously mentioned, there are three major criteria that govern the convergence of slope analysis. The conventional slope safety factor (FS) is defined as the soil shear strength parameters by which the original shear strength parameters must be divided to make the slope reach a state of failure. The slope safety factor in terms of shear strength parameters is given by Equations (1) and (2) as follows:
where C and ϕ are soil shear strength parameters, and C
m and ϕ
m are the soil strength parameters at which the slope reaches the mobilizing point.
The slope safety factor is evaluated in [
39,
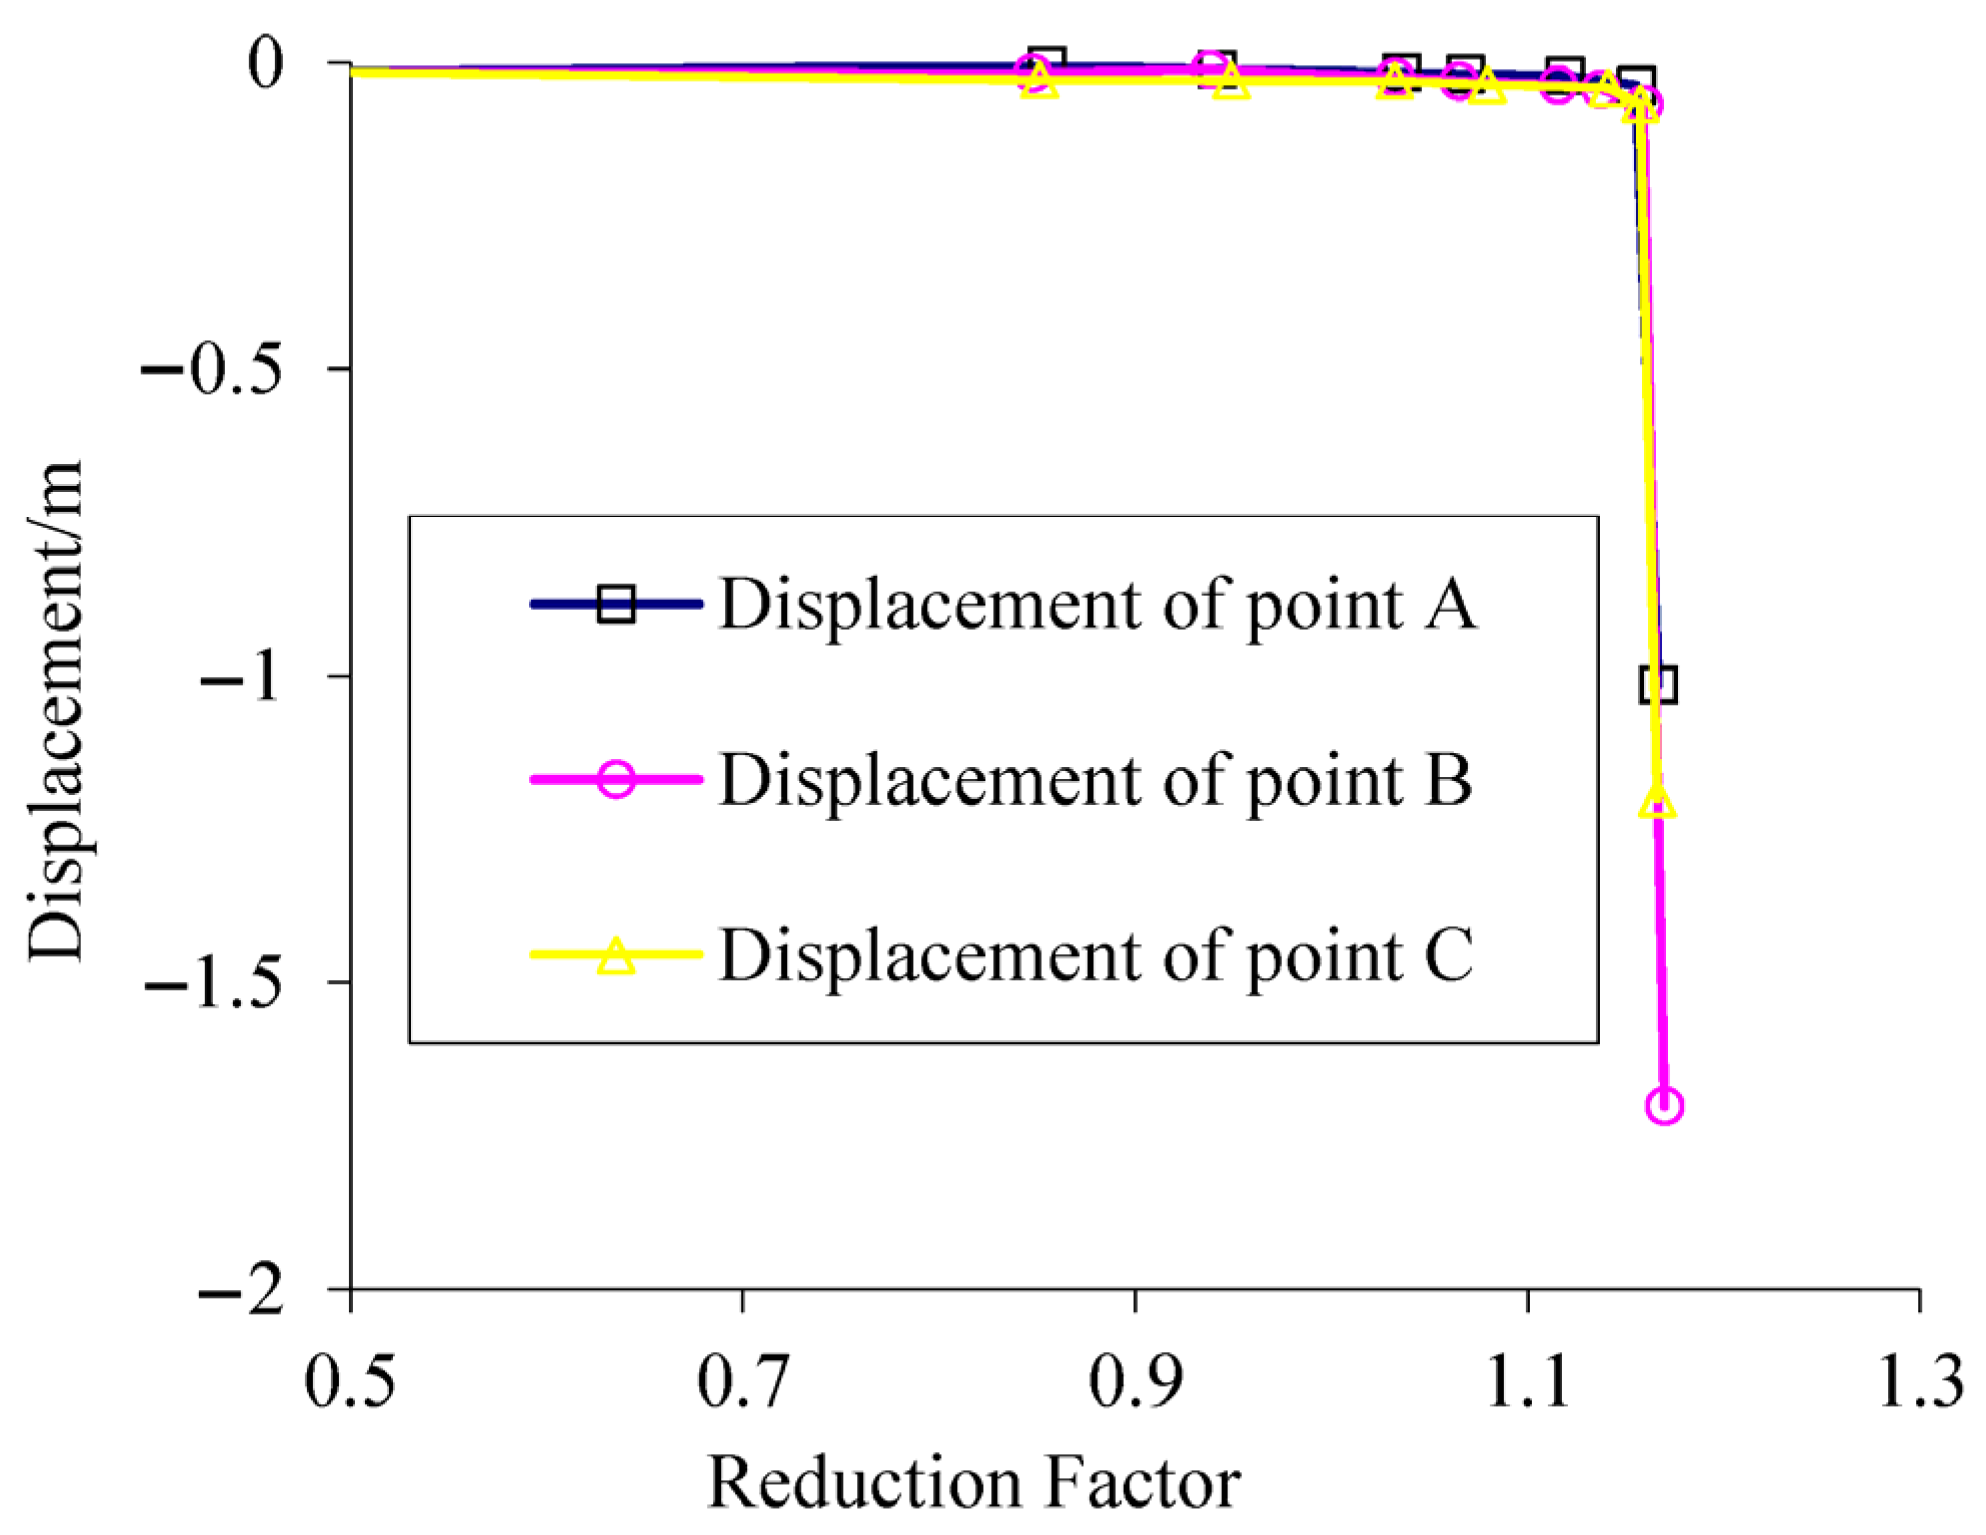
40] by analyzing the relationship between the slope displacement and the corresponding reduction factors. In the strength reduction method, the slope safety factor is identified as the curve turning point where slope settlement begins to increase significantly while the reduction factor remains constant, as illustrated in
Figure 1 and
Figure 2. However, applying this method to soft clay soil will be considered a little bit more difficult, as this soil type tends to continuously settle with time without a distinct turning point at which the slope safety factor could be estimated. To overcome this point, finite element software commonly estimates the slope safety factor in the case of soft clay soil at large settlement values. This approach may lead to an overestimation of the actual slope safety factor due to the high deformation values considered.
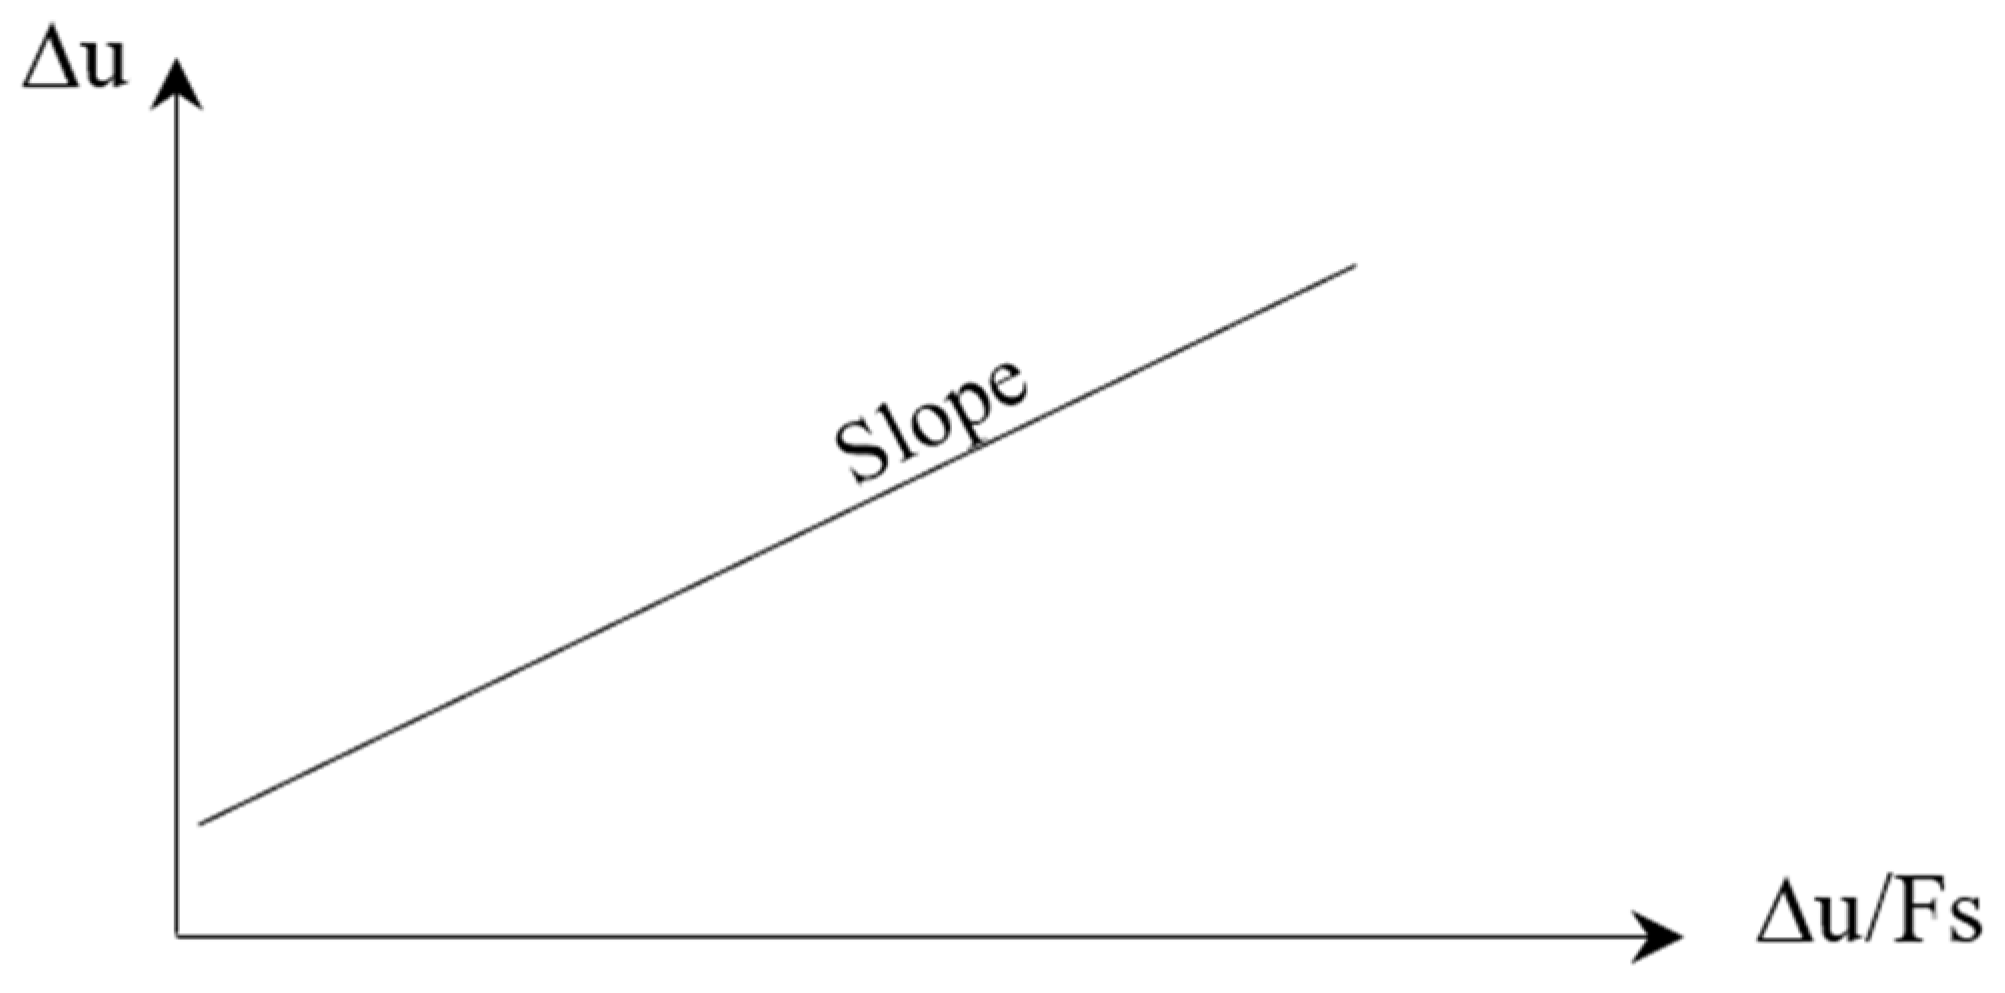
This study conducts a more comprehensive approach in slope stability analysis for sand embankments constructed over soft clay soil using the finite element analysis and Abaqus software. The slope safety factor is determined by analyzing the relationship between the slope maximum displacement (Δu) and the maximum displacement per corresponding reduction factor (Δu/FS) as shown in
Figure 3. This relationship typically yields a straight line, whose slope represents the actual safety factor of the slope. The settlement results used to plot this relationship are controlled by eight conditions.
To define the point of failure for a sandy soil embankment constructed above the saturated soft clay in Abaqus software, the failure point can be defined as the point at which the magnitude of the maximum plastic strain (PEMAG) does not exceed 20%. Before reaching the PEMAG from the numerical results data, the relation must be defined between the difference in total displacement at the top of the slope of each consequence of shear strength reduction increments and those values per shear strength reduction value. The relation is considered a linear relation, and the slope of the line is considered the slope factor of safety (FS). The eight controlling conditions are as follows:
After applying all these conditions, the relationship between the slope maximum displacement (Δu) and the ratio of slope displacement at the corresponding safety factor (Δu/F.S.) is plotted and the slope safety factor is determined considering “
an eighth conditions” which states that plastic strain magnitude (PEMAG), which is equal to the equivalent plastic strain (PEEQ) at the slope safety factor, should not exceed 20%. To describe the full contact between the soft clay soil and Pu-Foam pile, the Pu-Foam pile is modeled by embedded region constraints, the soft clay is defined as the host region, while the Pu-Foam pile is an embedded region with the capability to implement Abaqus/standard [
38].
3. Numerical Results
Despite the simplicity of using Limit Equilibrium Methods (LEMs) in determining the slope safety factor, there are several limitations that may reduce the accuracy and efficiency of these methods. These methods require a predefined failure surface, which may not accurately represent the true failure mechanism, especially in slope cases with complex loading and geometric conditions. LEMs do not consider the soil stress–strain behavior, deformation characteristics, or the slope construction sequence. Finite element analysis can easily overcome these limitations, especially when using software like Abaqus, which is capable of simulating a wide range of geotechnical problems while considering the nonlinear soil behavior and slope deformation characteristics.
3.1. Model Validation
The main objective of the presented study is to investigate the behavior of Pu-Foam piles in a soft clay layer under a loose sand embankment. The effect of pile lengths and arrangement on the slope safety factor, settlement, and stresses is numerically simulated using the finite element technique (Abaqus software). Despite the Abaqus software’s capability to solve a wide range of geotechnical engineering problems, the slope safety factors cannot be determined directly from the software. The slope analysis results of the study presented by Cheng et al. (2021) [
39] are used to validate the technique that is presented herein to determine the slope safety factor. The slope safety factor analysis is also validated using Slide-6 software, which is considered a specialized software for slope stability that uses various limit equilibrium methods to determine the slope safety factor.
As previously mentioned, the slope safety factor was calculated in [
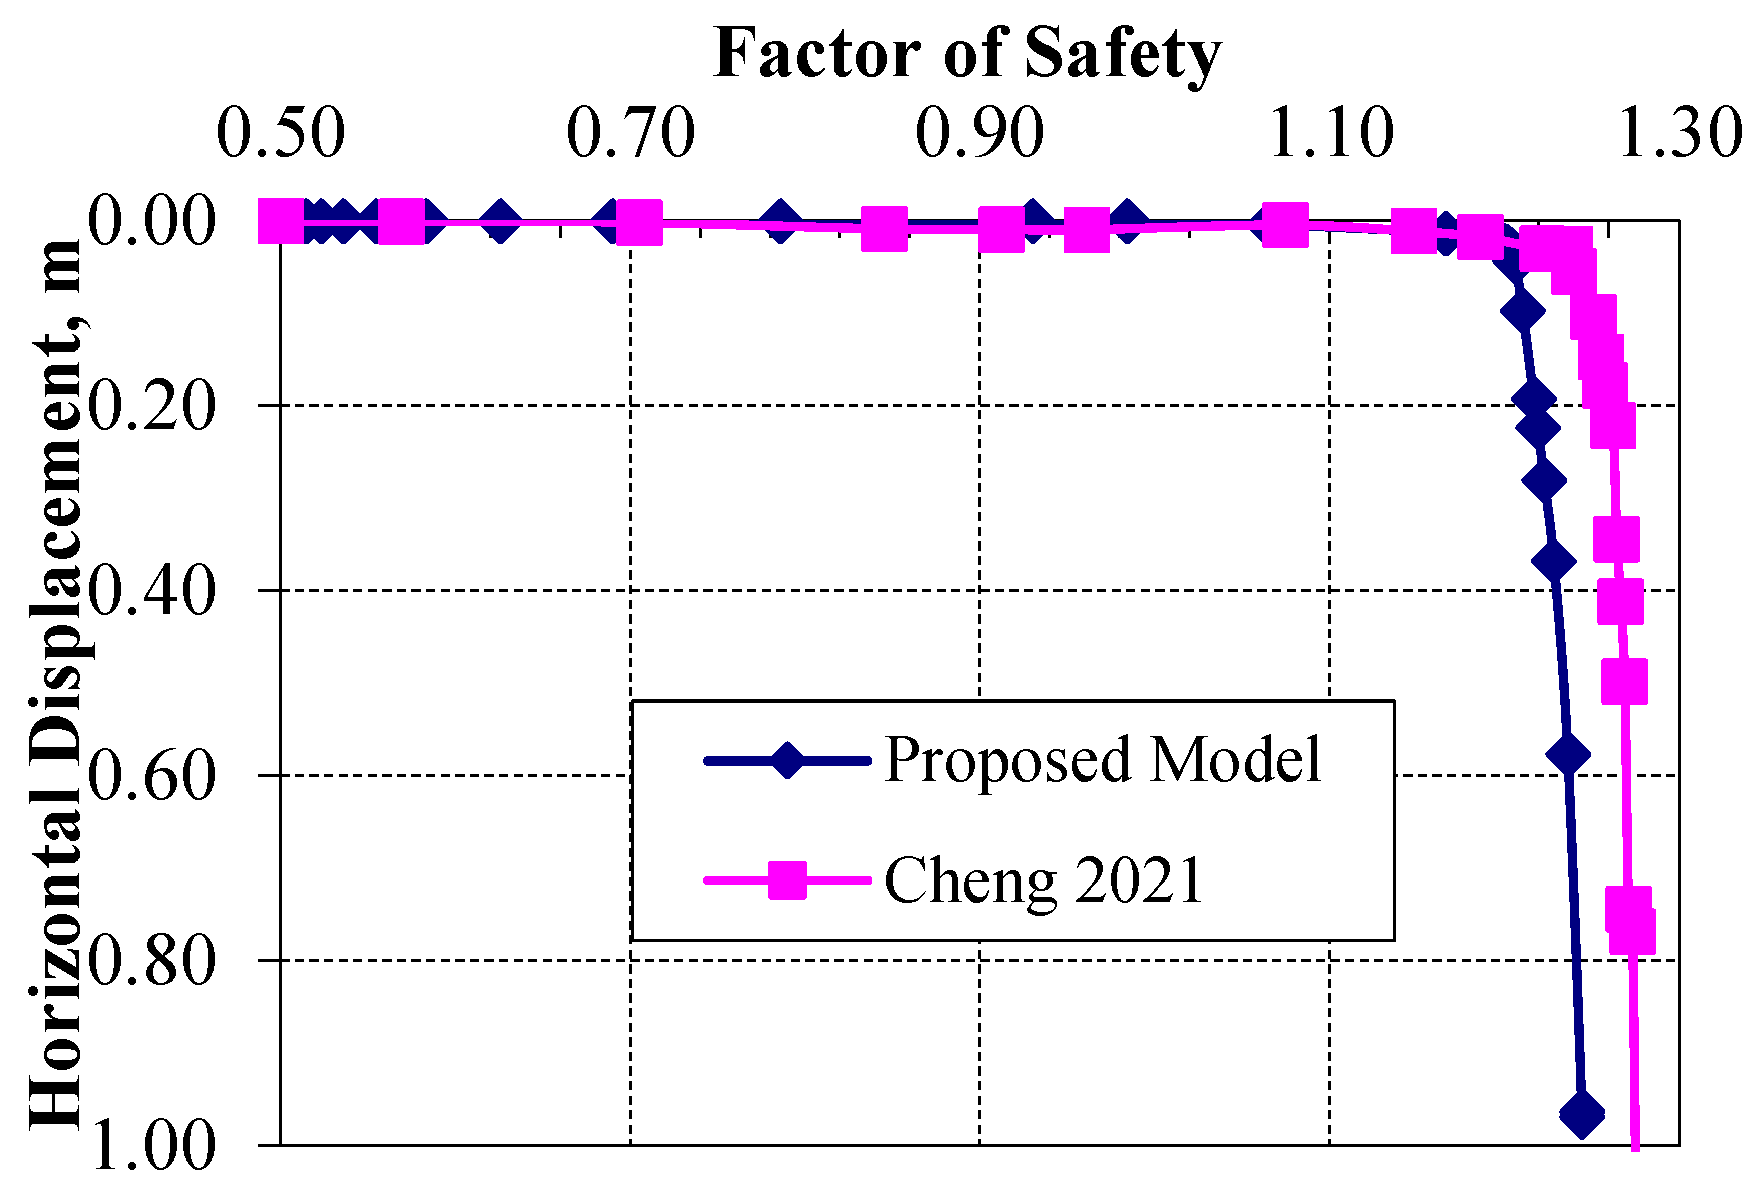
39] with regard to the slope crest horizontal movement. The slope safety factor is considered the constant reduction factor determined with the increase in slope movement, as shown in
Figure 3. The general slope configuration is shown in
Figure 4. The slope failure mechanism for the sandy soil slope was analyzed with the parameters presented in
Table 1 [
39]. In order to analyze the mechanism of slope deformation failure, the classic model of a general homogeneous slope was selected, and the finite element strength reduction method was used to calculate the slope safety factor. The Mohr–Coulomb failure criterion is utilized to define the slope soil as an ideal elastoplastic material.
This technique is shown to be effective in the case of a sandy soil slope. However, in the case of embankments founded on soft clay soil, more restrictive conditions should be used to determine the slope safety factors, as discussed in detail in the following sections.
The shading contour for the slope of the plastic strain zone from [
39] was found to be almost the same as the validated model made by Abaqus software, as shown in
Figure 5 and
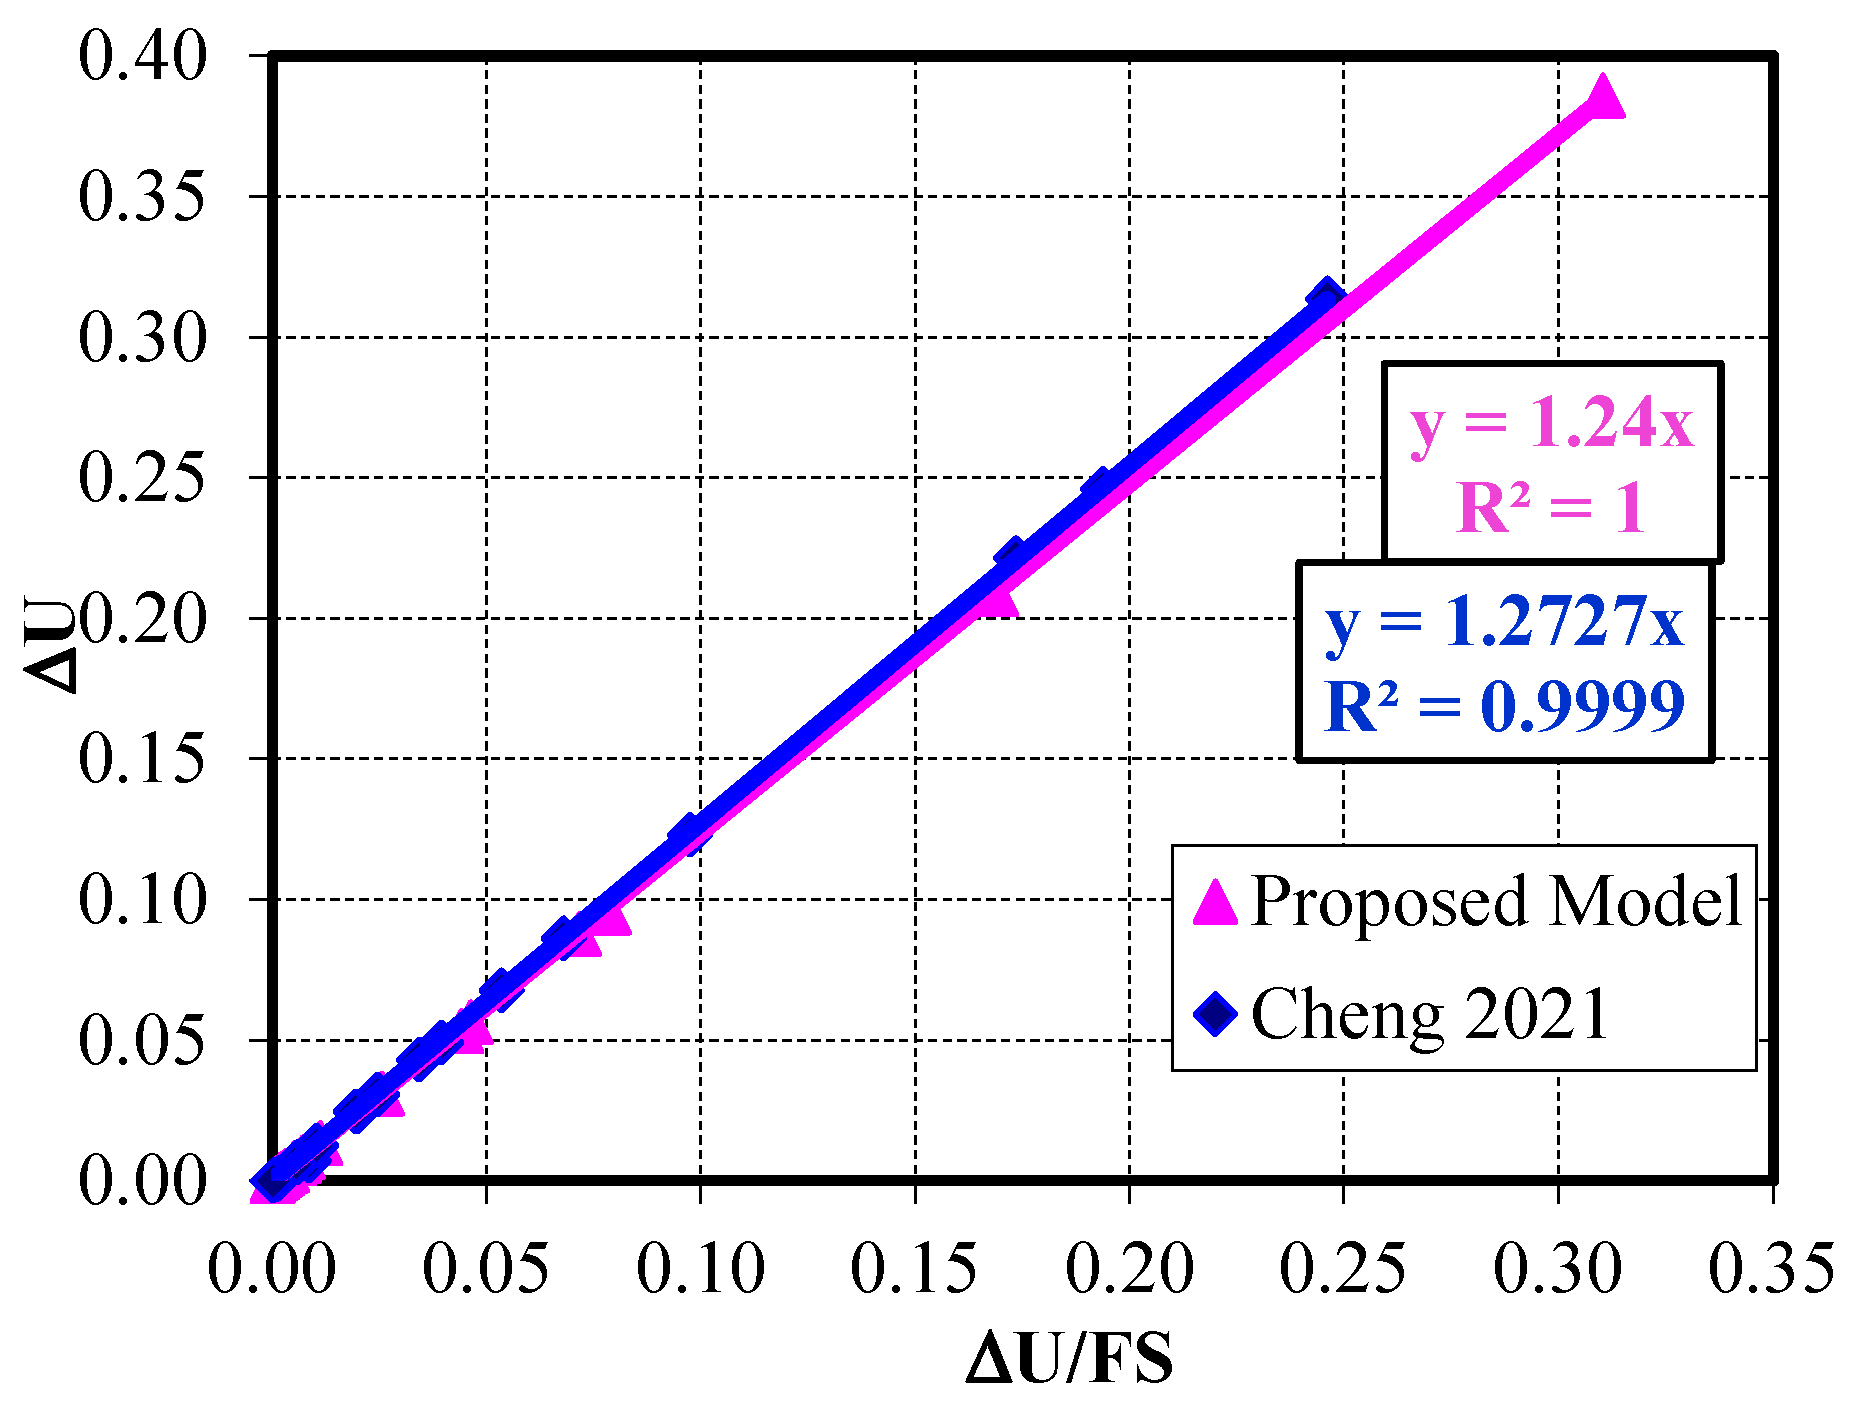
Figure 6. The slope safety factor that was obtained from numerical analysis was found to be 1.24 compared with 1.27 obtained from the slope stability analysis mentioned in Cheng et al. (2021) [
39], which is considered to be in very good agreement between both results, as illustrated in
Figure 7.
Figure 6 presents the horizontal displacement corresponding to a slope safety factor of 1.24. Although the slope safety factor is larger than 1.0, which means the resisting stresses exceed the mobilizing stresses, the slope displacement reaches an unrealistic value when exceeding 80 cm. An alternative method is proposed for determining the slope safety factor without relying on a specific displacement value. The slope safety factor could be determined as in Equation (3) by analyzing the relationship between the slope maximum displacement (Δu)—crest in our case—and the ratio of slope displacement at the corresponding safety factor (Δu/F.S.).
As presented in
Figure 8, the relationship was found to be linear, and the slope safety factor was calculated exactly as the same values that were obtained in
Figure 7.
3.2. Model Validation by Limit Equilibrium Method (LEM)
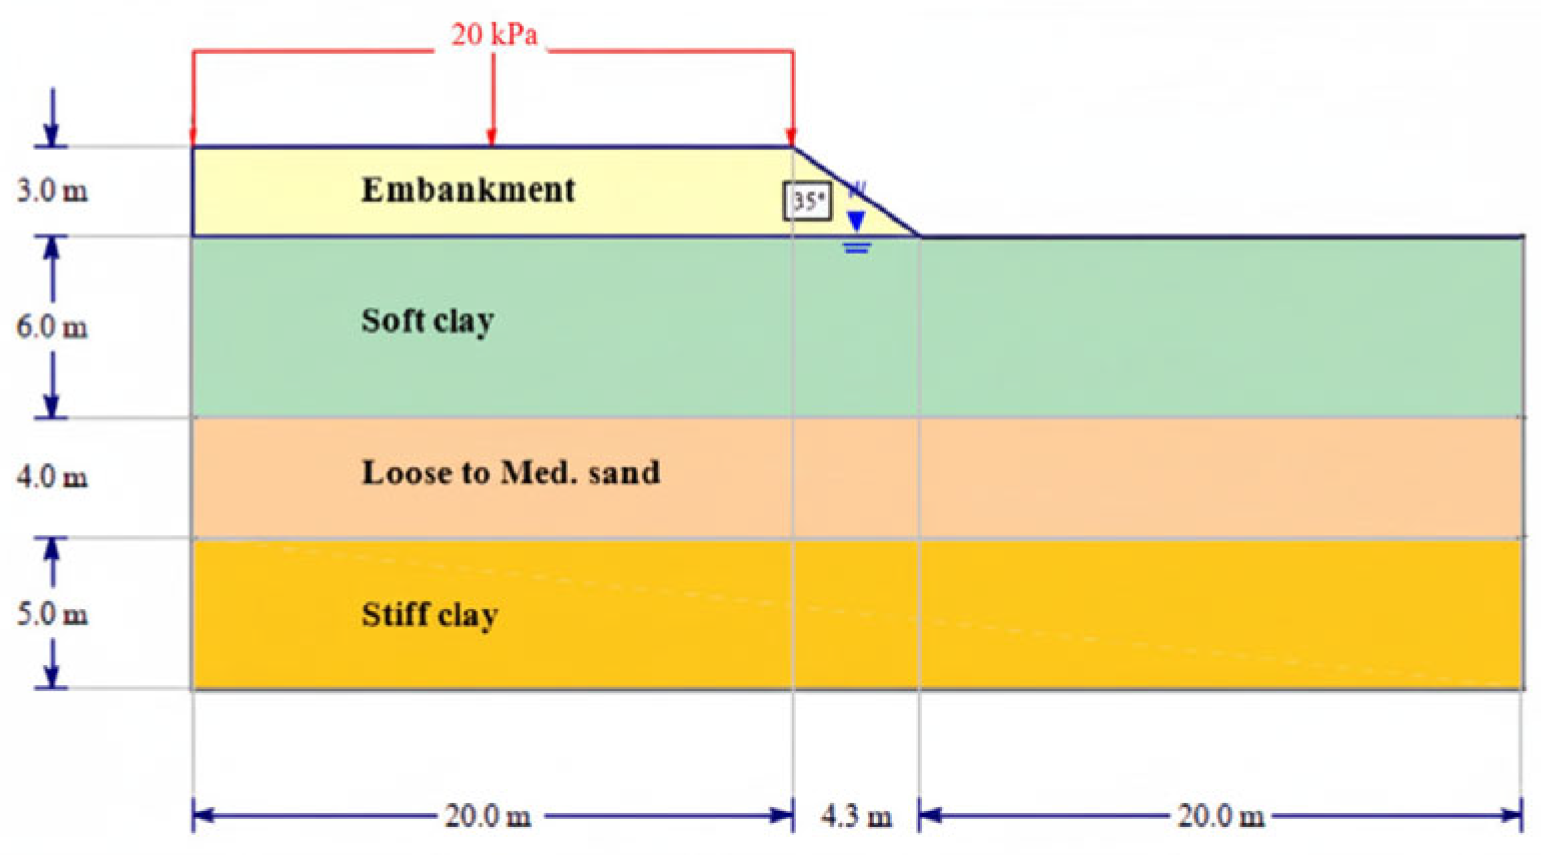
The soil profile of the main studied case consists of a saturated soft clay layer with a depth of 6.0 m, followed by a 4.0 m thick layer of loose sand and a 5.0 m stiff clay layer. The project is a road embankment subjected to a traffic surcharge of 20 kPa.
Figure 9 shows the soil profile, and
Table 2 lists the properties of soil layers. The isotropic properties of Pu foam are based on previous studies [
41,
42,
43].
The saturated soft clay resulting from the weight of the constructed embankment and the traffic loading will cause high settlement due to the consolidation processes. To decrease the total displacement of the constructed embankment, soil improvement techniques should be used, such as stone columns, sand drains, CMC, or any other column types that can be placed in square or triangular patterns, depending on the required improved area. In the present study, Pu-Foam columns were chosen to reduce the soft clay settlement and to increase the embankment factor of safety. The first step of the analysis was evaluating the slope safety factor using the limit equilibrium method.
Slide-6 software [
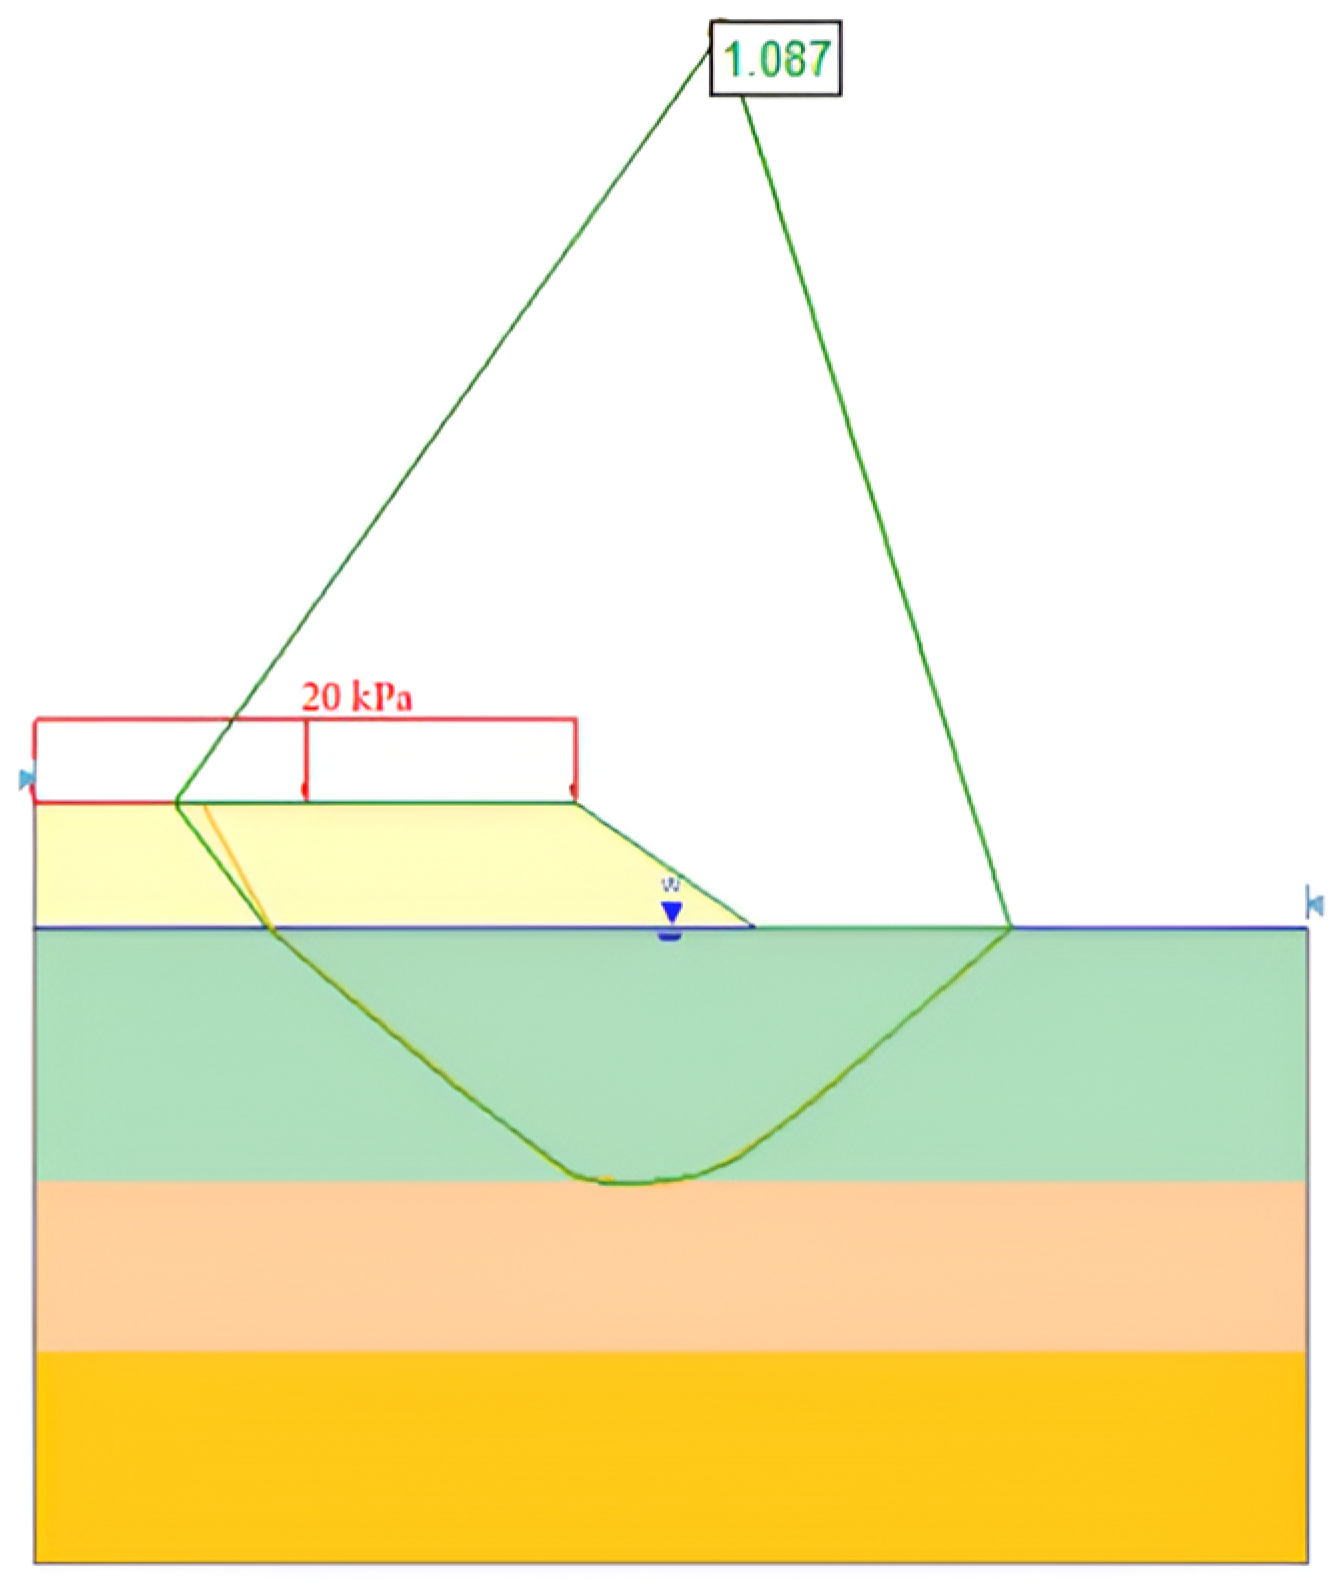
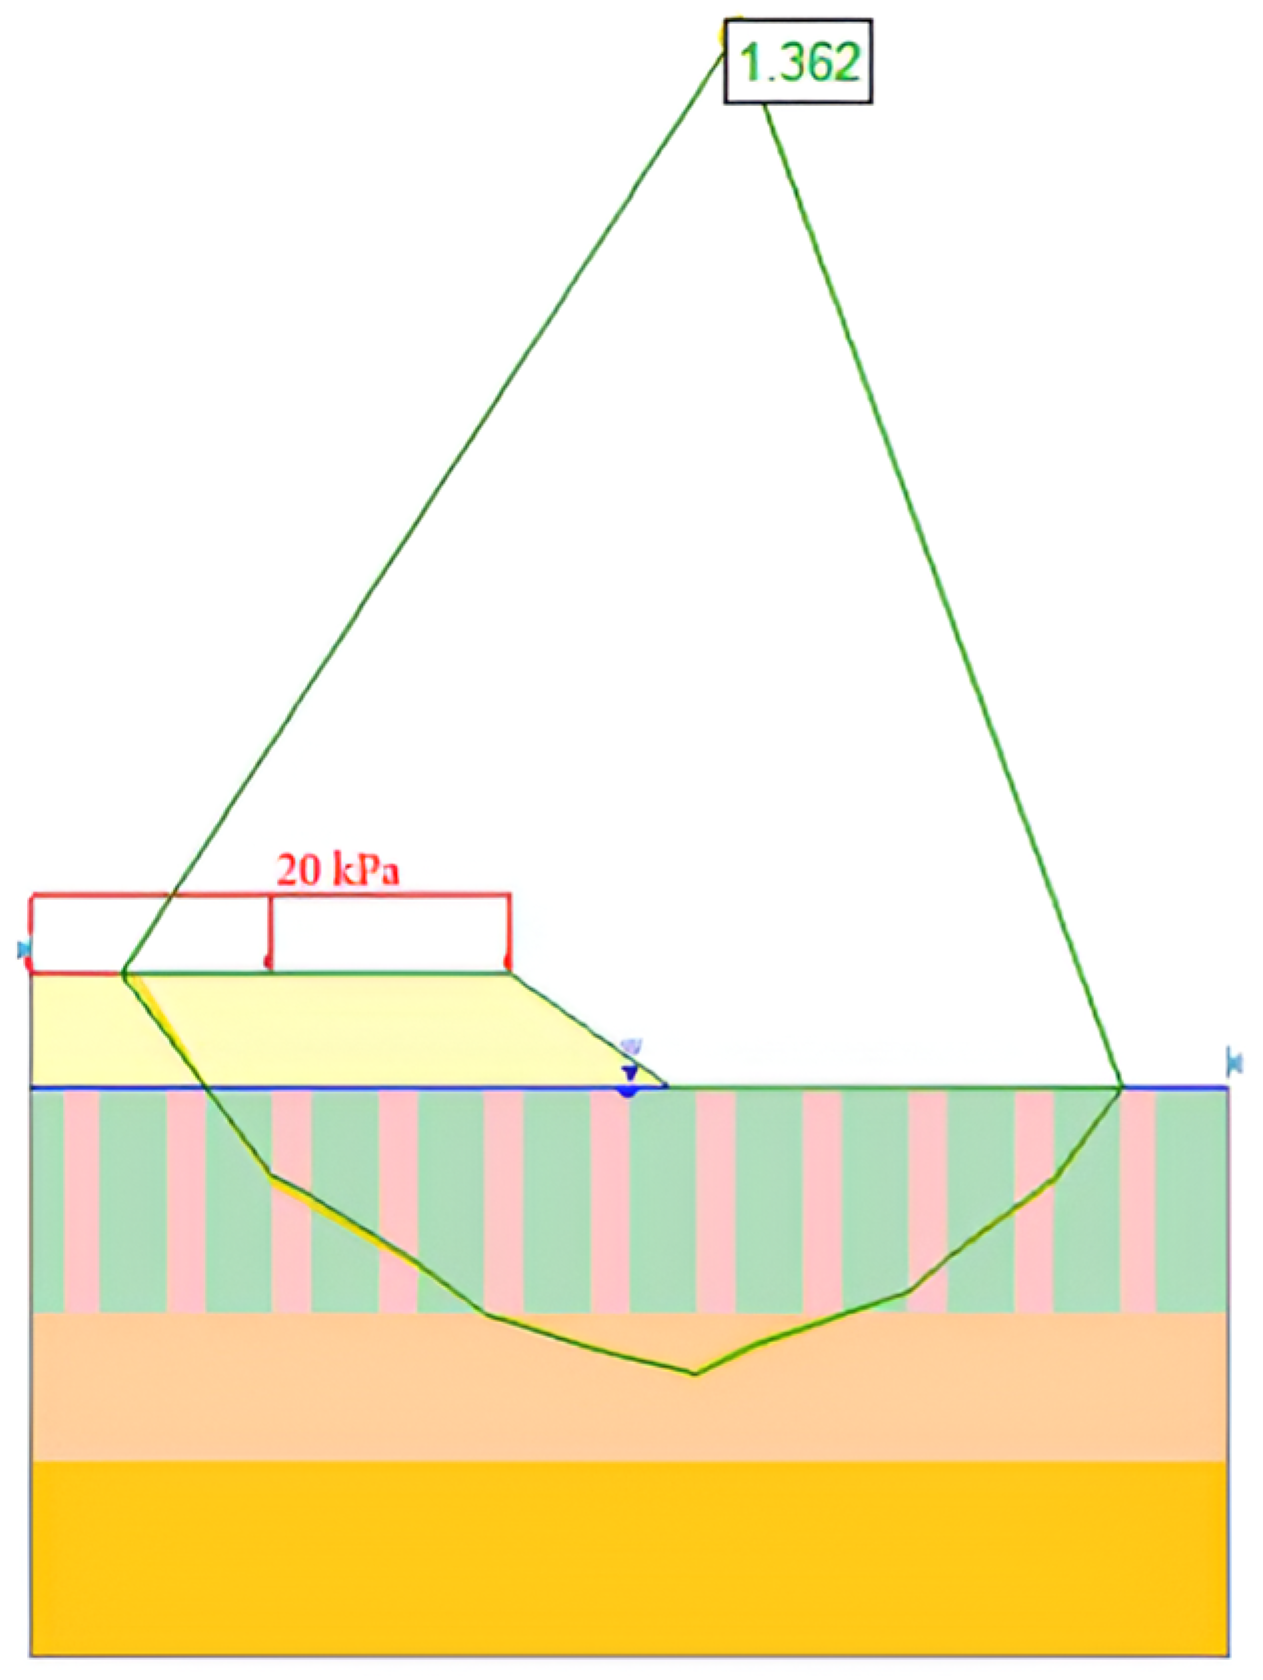
44] was used as an analysis tool to calculate the slope safety factor using limit equilibrium methods, considering circular or non-circular failure surfaces in three different cases. The first case is the soil without soil improvement; the second case had a Pu-Foam pile with L = 3.0 m; and the third case had a Pu-Foam pile with L = 6.0 m. In all three cases, the pile diameter (D) was 1.0 m and the pile spacing (S) = 2.80 m.
Limit equilibrium methods evaluate the slope safety factor in a simple way as these methods cannot take the effect of total displacement of the embankment and the effect of soft clay settlement in their calculations, especially when the horizontal movement of the top of the embankment reaches 2.0 m, as reported in [
39]. In contrast, the finite element method, using Abaqus software, is employed to simulate the soil behavior both with and without the inclusion of Pu-Foam piles. The slope safety factors are determined using the strength reduction technique and controlled with the aforementioned eight conditions.
Table 3 shows the comparison between the results of slide-6 and the Abaqus software finite element method with the constrained conditions. The slope failure surfaces are illustrated in
Figure 10,
Figure 11 and
Figure 12. The results showed that the factor of safety calculated by finite element method coincided with the factor of safety calculated by the limit equilibrium methods.
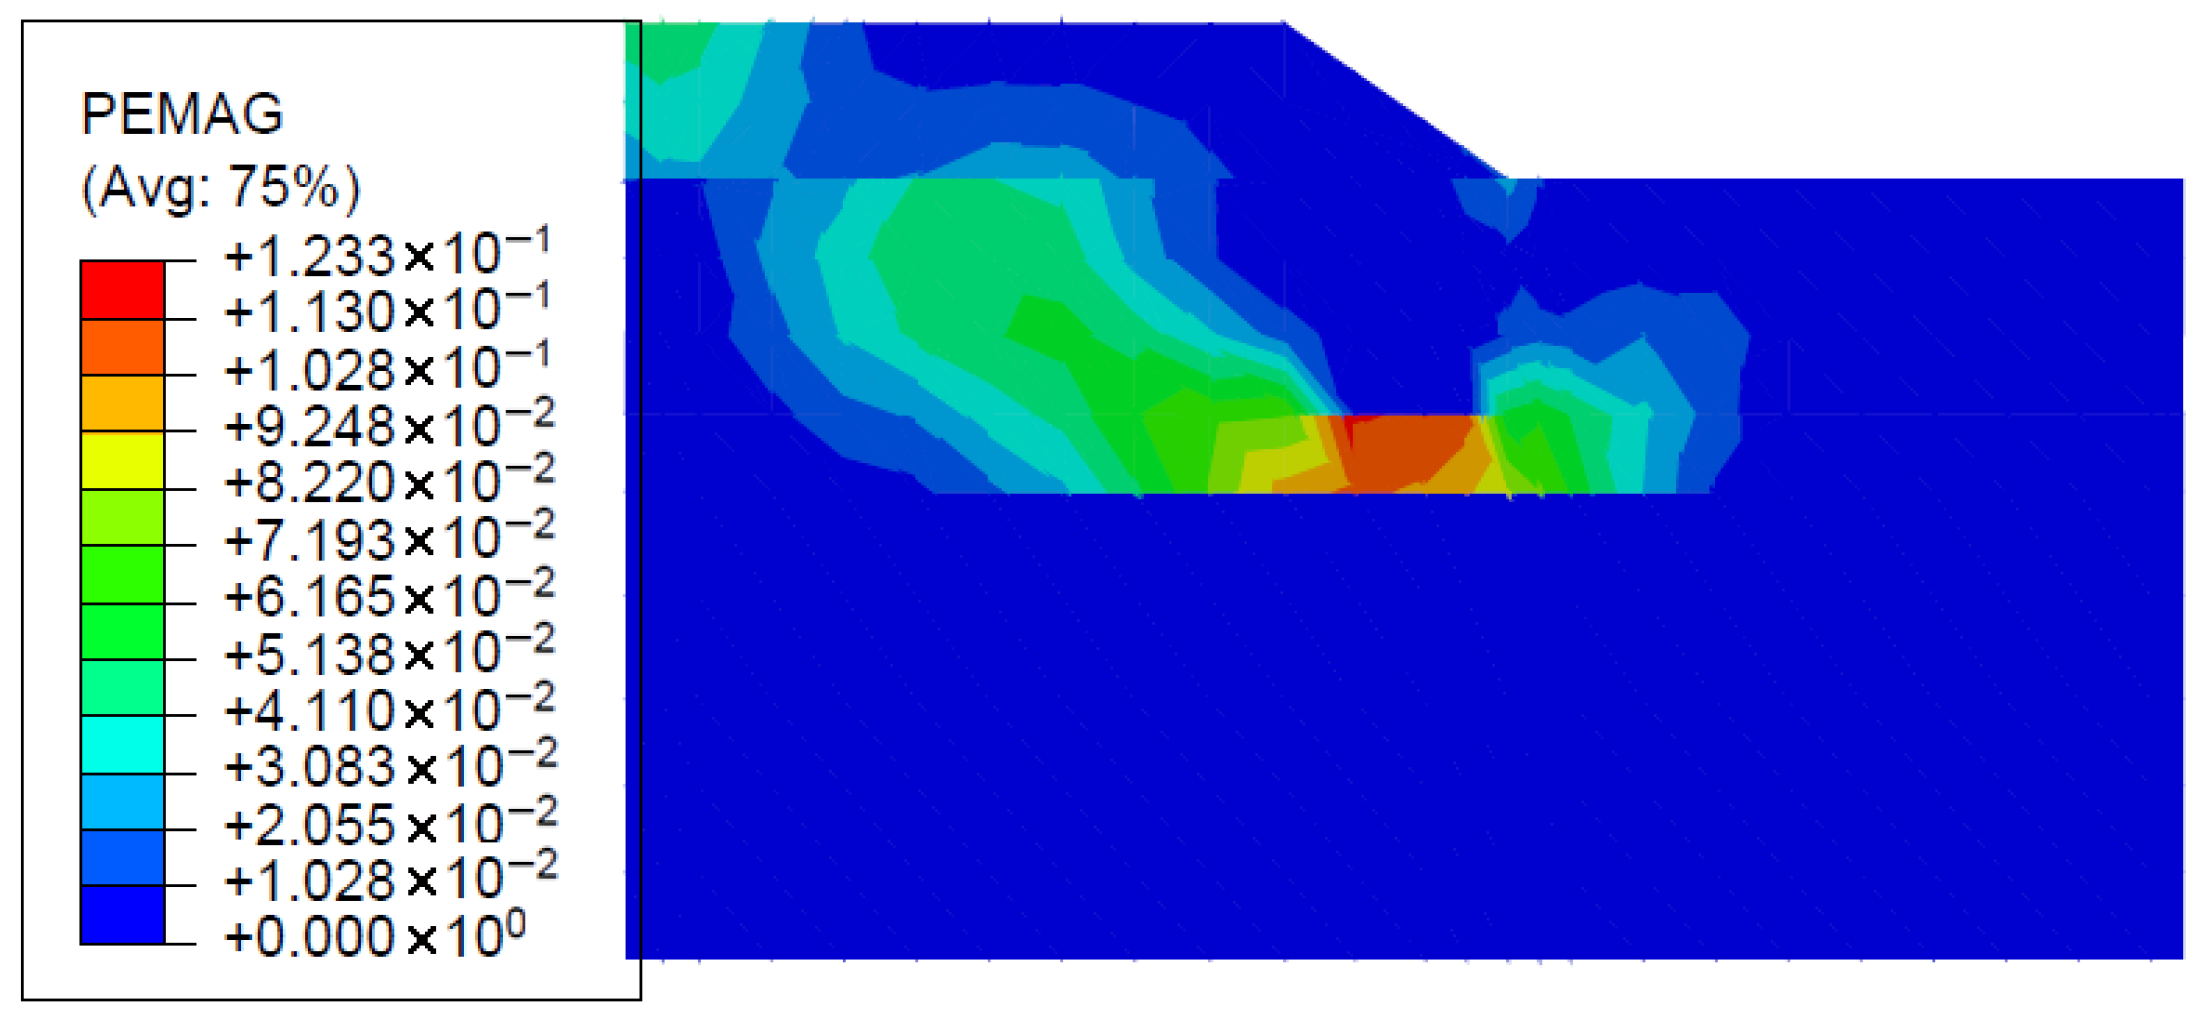
Figure 13 and
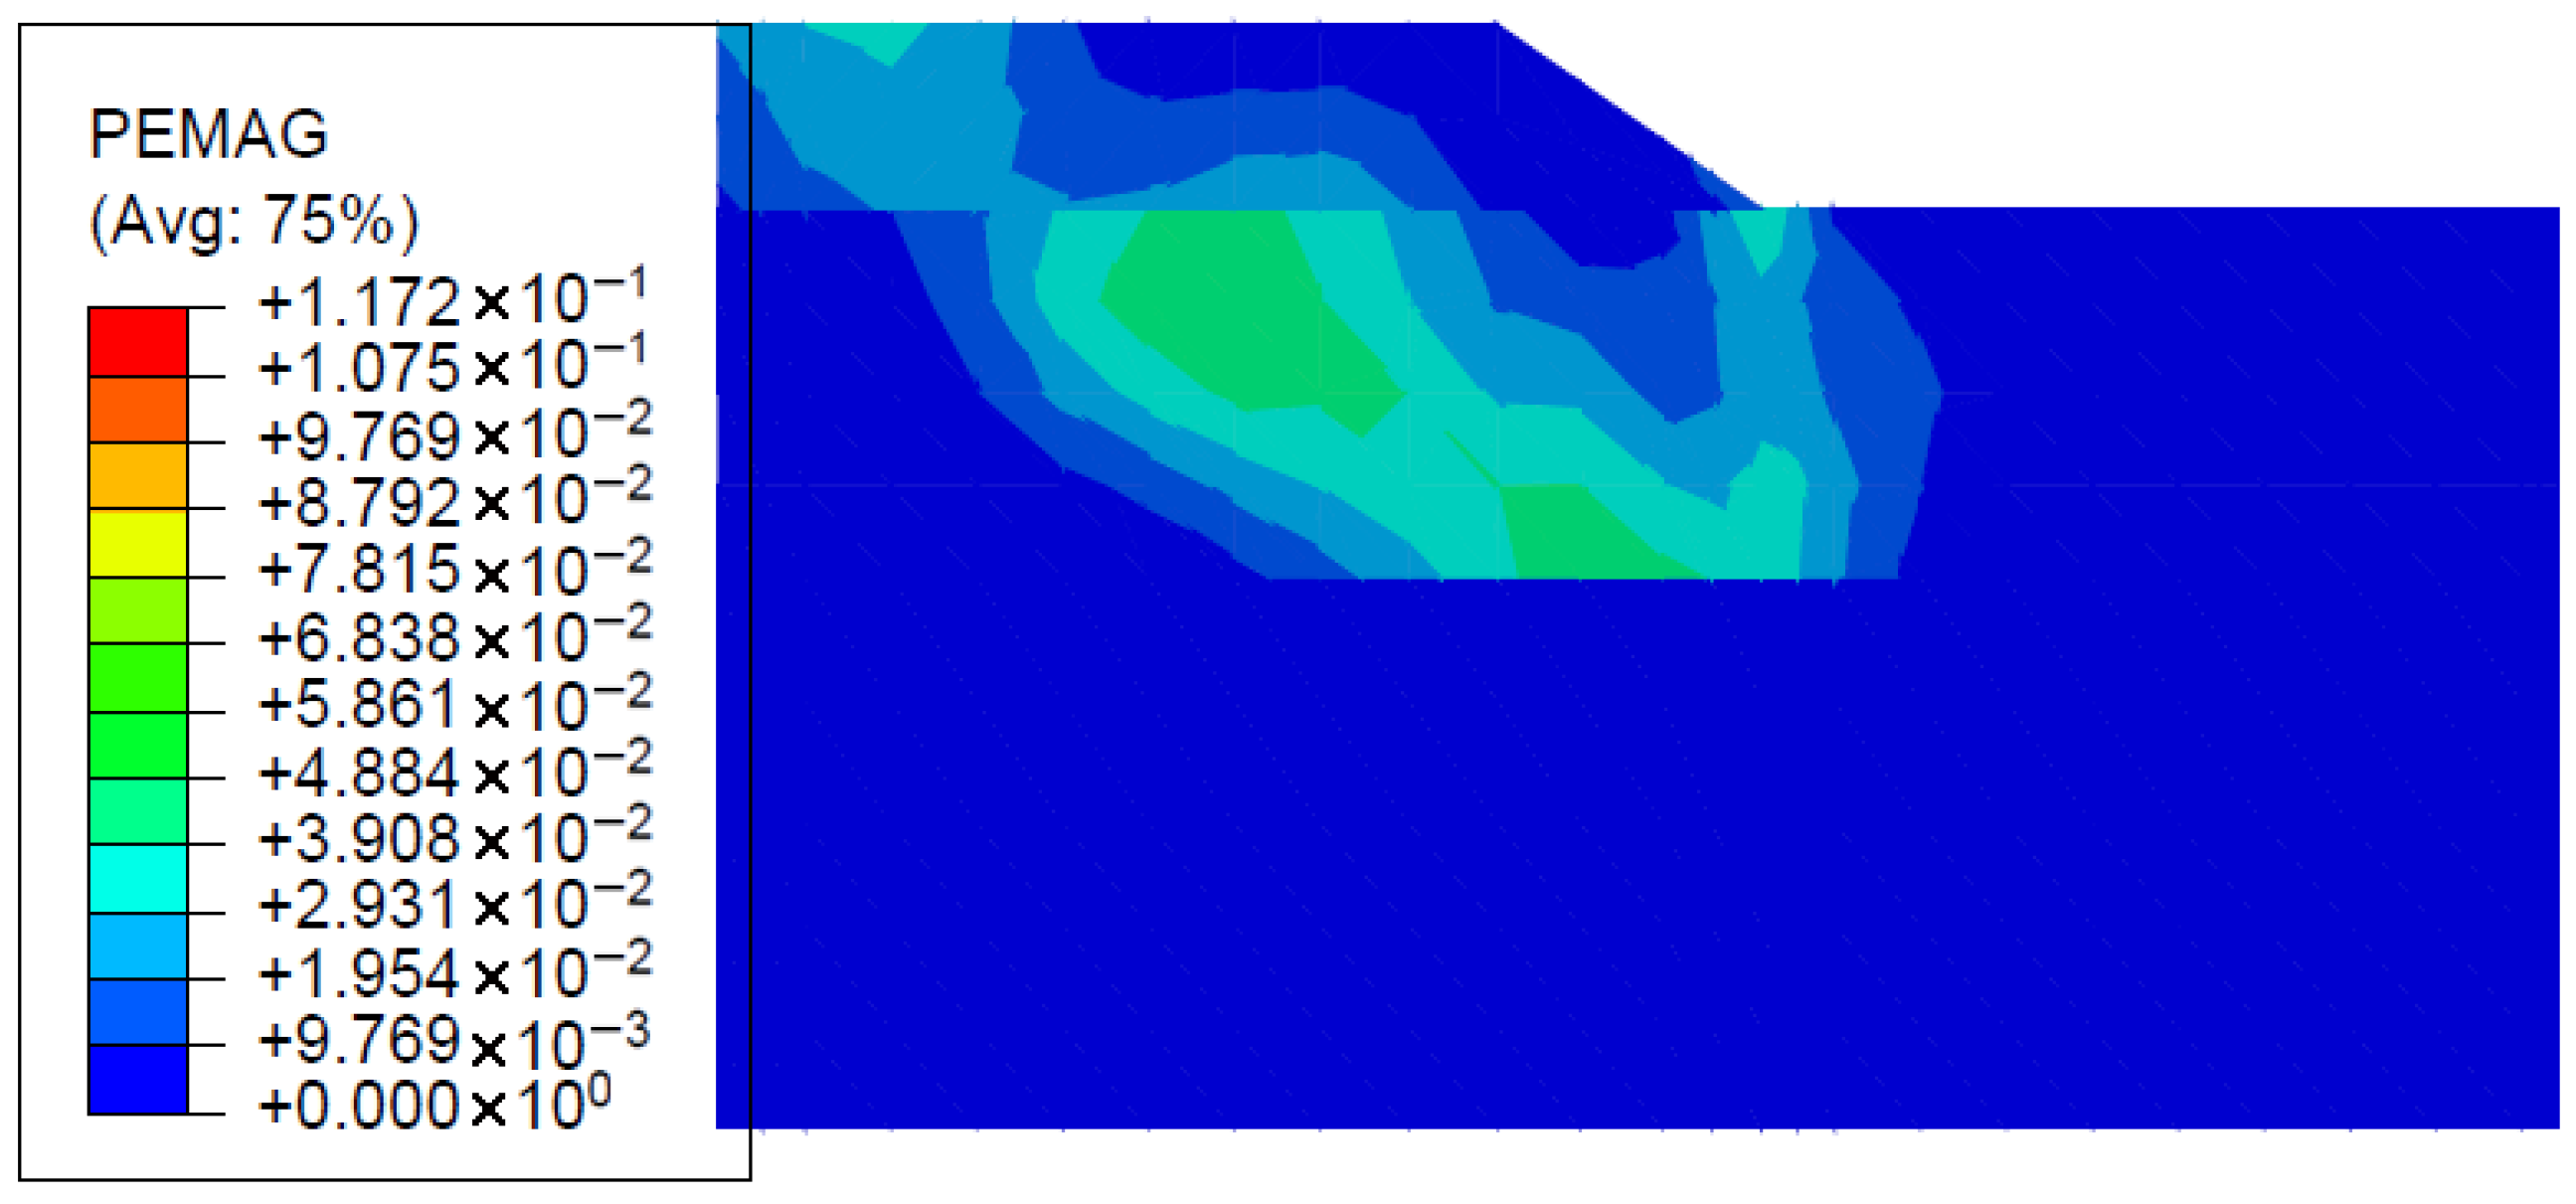
Figure 14 illustrate the magnitude of plastic strain obtained from Abaqus software, which presents the slope failure zones.
The factors influencing the slope safety factor of soft clay soil improved with Pu-Foam piles are discussed in detail in the following sections. These factors include the Pu-Foam pile length (L), the improved area (Ae), and the arrangement of the Pu-Foam piles. To provide a more comprehensive evaluation of the slope condition using Abaqus software, the analysis also considers the total settlement of the soft clay, the load distribution between the piles and the soft clay layer, and the development of excess pore water pressure.
3.3. Pu-Foam Parametric Study and FE Models
In the present study, our primary focus was on the influence of geometric parameters of the Pu-Foam piles on embankment performance. Based on our previous experience with Pu-Foam materials, the effects of density and Poisson’s ratio have been found to be relatively minor on the improvement of the slope failure mechanism compared with the surrounding soft clay in our cases. The elastic modulus is a more influential parameter. For the analyses presented, we therefore selected commonly reported average values of elastic modulus with relatively softer performance to promote a more uniform stress distribution. A more detailed Pu-Foam material parametric investigation is planned for future work.
The improved area (AE) of the soft clay layer by Pu-Foam pile is an important factor that affects the total displacement and the slope safety factor. The improvement area ratio is defined as the ratio between the Pu-Foam pile cross-section area to the service area of soil. In this study, the AE was changed from 10% to 60% with a Pu-Foam pile diameter of 1.0 m. The spacing between Pu-Foam piles was calculated according to Equations (4) and (5), as illustrated in
Table 4. The studied parameters were Pu-Foam pile length, (L); Pu-Foam improved area ratio (AE); and the Pu-Foam pile arrangement (square and triangular) as presented in
Figure 15. To study the effect of Pu-Foam pile length, the cases were categorized into five groups: A, B, C, D, and F, corresponding to pile lengths of 3.0, 4.0, 5.0, 6.0, and 8.0 m, respectively. In all cases, the Pu-Foam piles were installed before the construction of the embankment. The parametric study is summarized in
Table 4.
3.4. Effect of Pu-Foam Pile Length
3.4.1. Safety Factor of Embankment Slope
Figure 16 illustrates the relationship between the shear strength reduction (SSR), which is equivalent to the slope safety factor, and the total horizontal displacement at the crest of the embankment slope. This relationship is presented for Pu-Foam piles of varying lengths at 30% constant improved area ratio (AE). These cases are then compared with the case of unimproved soil (without Pu-Foam piles). As shown in
Figure 16, the factor of safety increases with total displacement, although the increasing rate becomes less significant at higher displacement values.
At AE = 30%, the slope safety factor for the unimproved soil is 1.24. When Pu-Foam piles with a length of 3.0 m are used, the factor of safety increases to 1.54. For pile lengths of 3.0 m, 4.0 m, 5.0 m, 6.0 m, and 8.0 m, the corresponding safety factors are 1.54, 1.61, 1.78, 1.91, and 1.88, respectively, as shown in
Figure 17. The maximum safety factor is achieved when the column is installed to 6.0 m depth which is the full depth of soft clay layer. Extending the piles into the underlying loose sand layer does not significantly increase the factor of safety, as shown in
Figure 16.
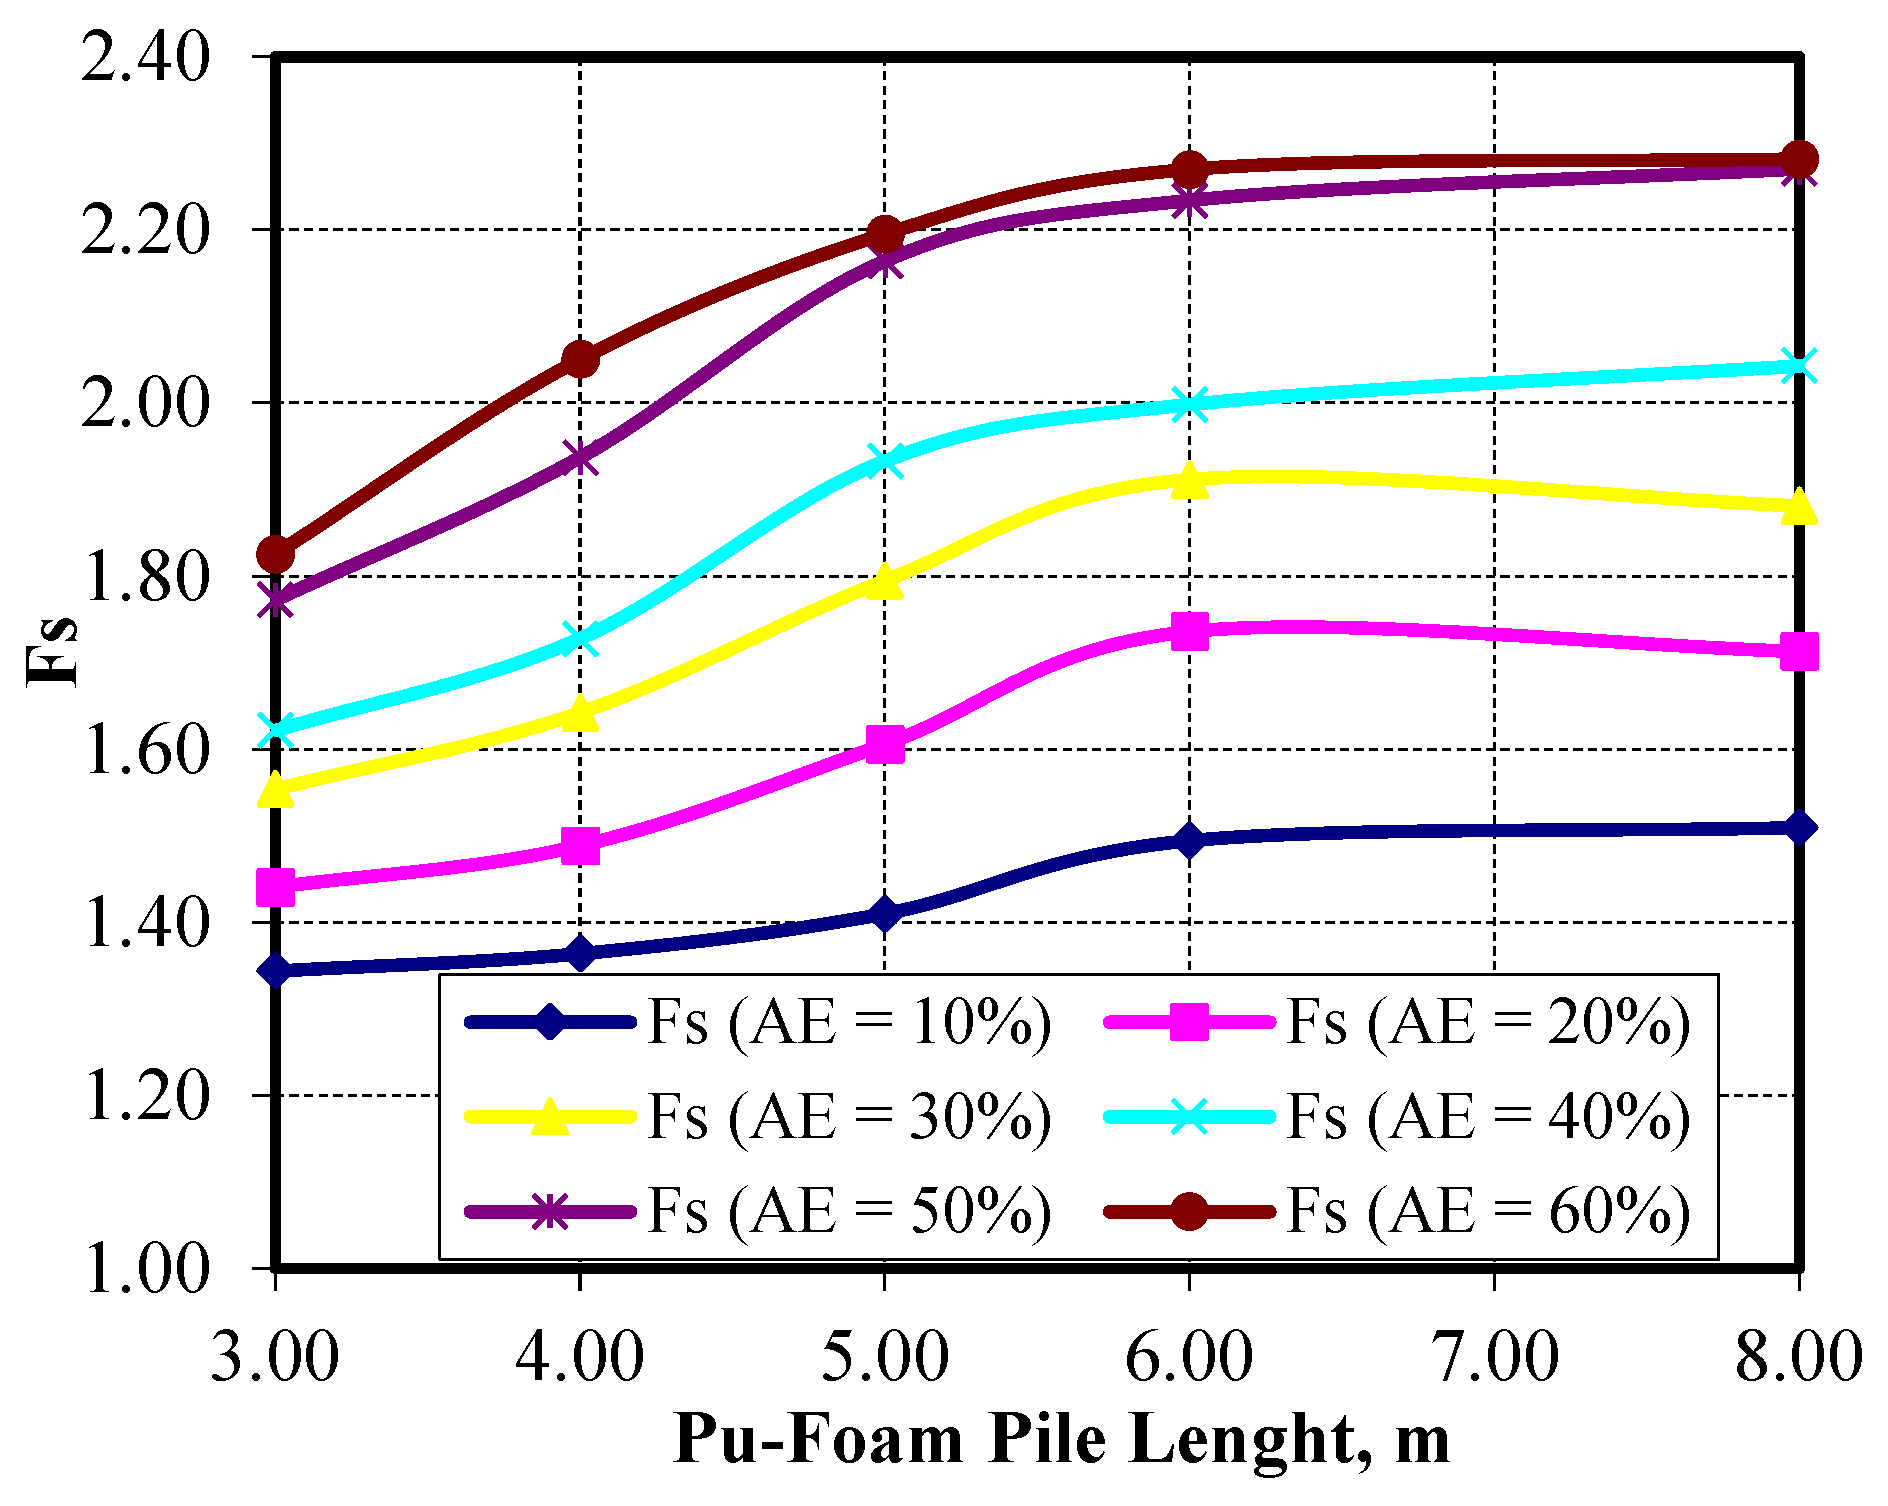
Figure 18 presents the effect of the Pu-Foam pile length on the factor of safety values for different values of improved area ratio (AE). The factor of safety increases with increasing Pu-Foam pile length till reaching the full depth of the soft clay layer and, after that, it remains constant. At a Pu-Foam pile length of 6.0 m, increasing the improved area ratio (AE) from 10% to 60% leads to a progressive increase in the factor of safety. The improvement ranges from approximately 20% at AE = 10% to over 82% at AE = 60%. After AE = 50%, increasing the improved area ratio has little effect on slope stability compared to the added cost.
3.4.2. Maximum Settlement of Soft Clay Below the Embankment
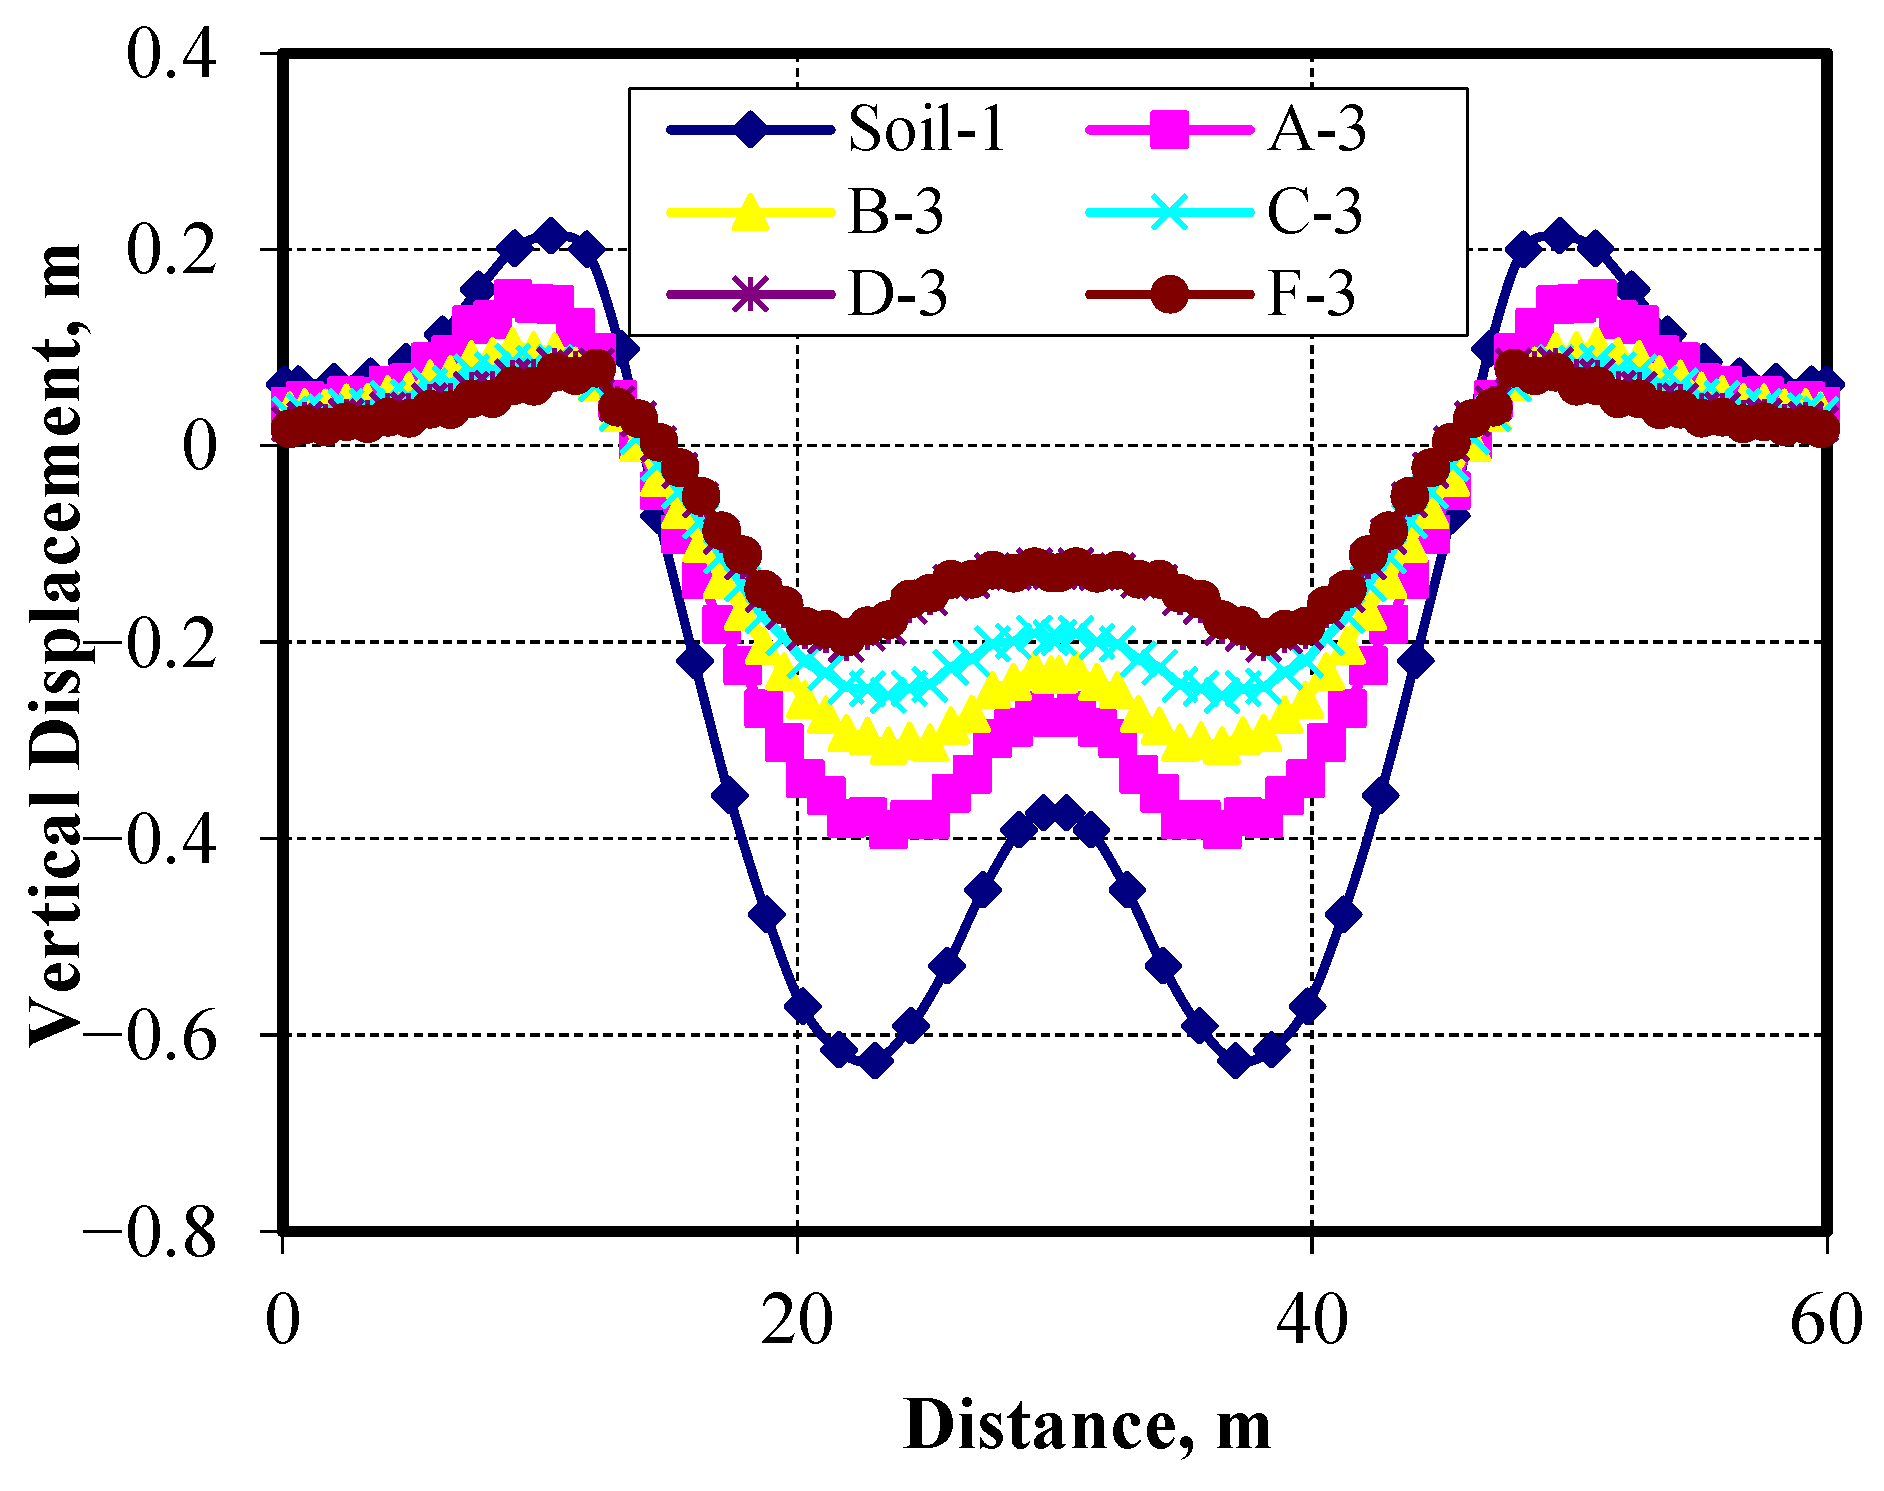
The vertical displacement at the surface of the saturated soft clay, including both the settlement beneath the embankment and lateral heave adjacent to it, is presented in
Figure 19 and
Figure 20. The results show that the maximum vertical settlement under the embankment for the case of soil without any improvement was found to be 0.627 m, while the maximum heaving reached 0.214 m. For an improved area ratio (AE) of 30%, varying the Pu-Foam pile lengths from 3.0 m to 8.0 m resulted in a noticeable reduction the vertical soil displacements. The vertical settlement decreased by 0.391 m in the case of a 3.0 m pile length, whereas it was 0.195 m for an 8.0 m pile length. The corresponding heaving values also reduced from 0.150 m to 0.0794 m at the same pile lengths. Based on the results, a Pu-Foam pile length of 6.0 m was identified as the optimal configuration for AE = 30%, offering a good improvement in the overall soil displacements.
3.4.3. Vertical Stresses at the Centerline of the Pu-Foam Piles
When a soil embankment is constructed over a soft clay layer and subjected to traffic loads, these loads are transferred to the underlying soft clay, resulting in significant settlement beneath the embankment. Using Pu-Foam piles beneath the embankment changes the mechanism of stress distribution, allowing the transferred loads to be shared between the soft clay and the Pu-Foam piles.
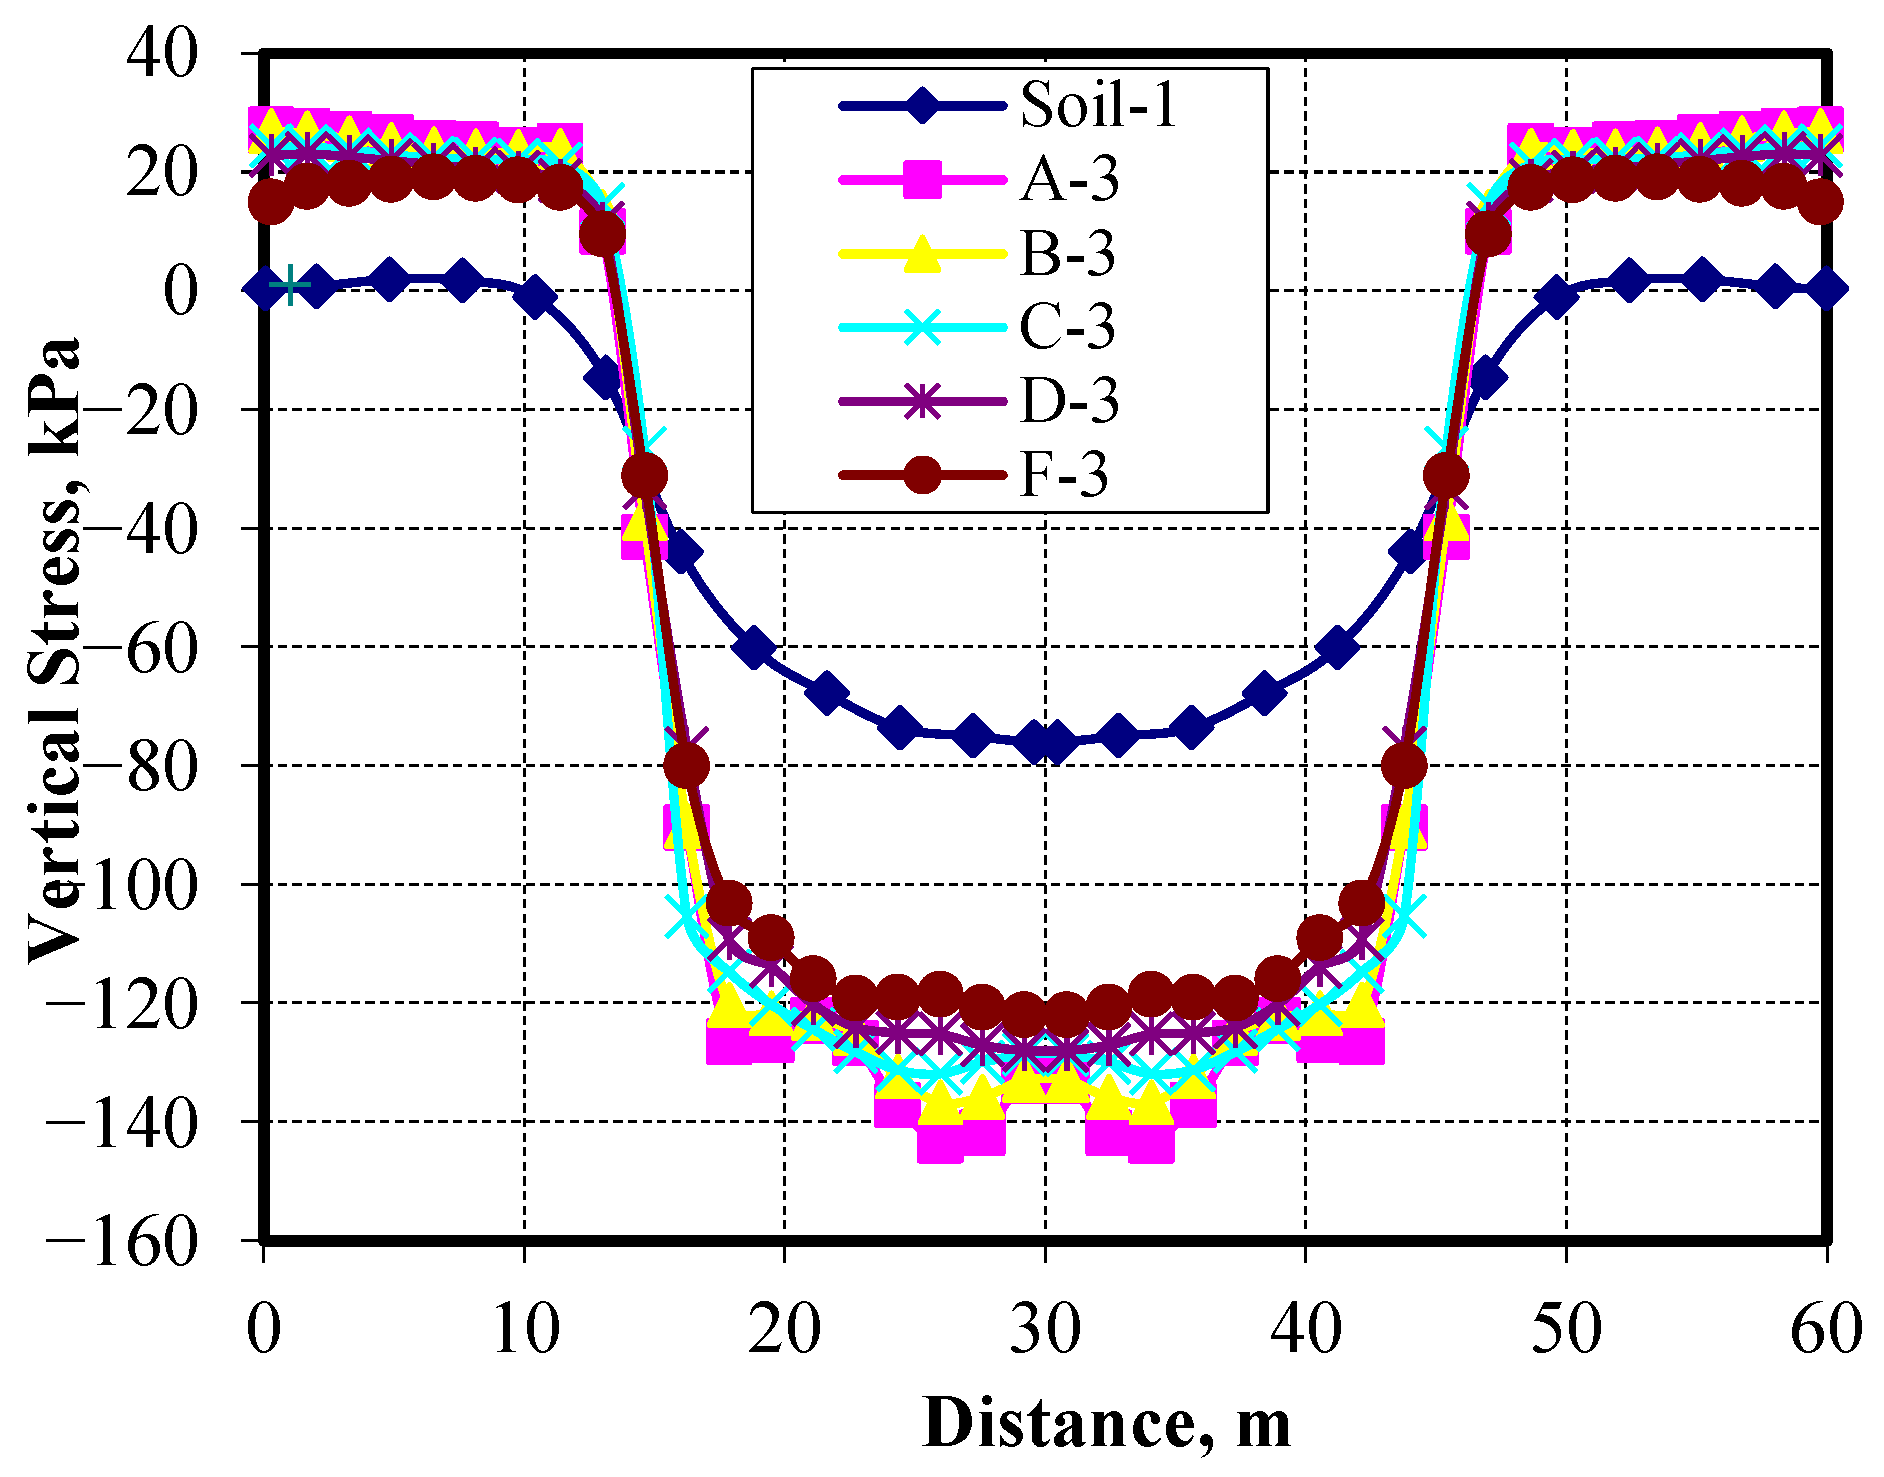
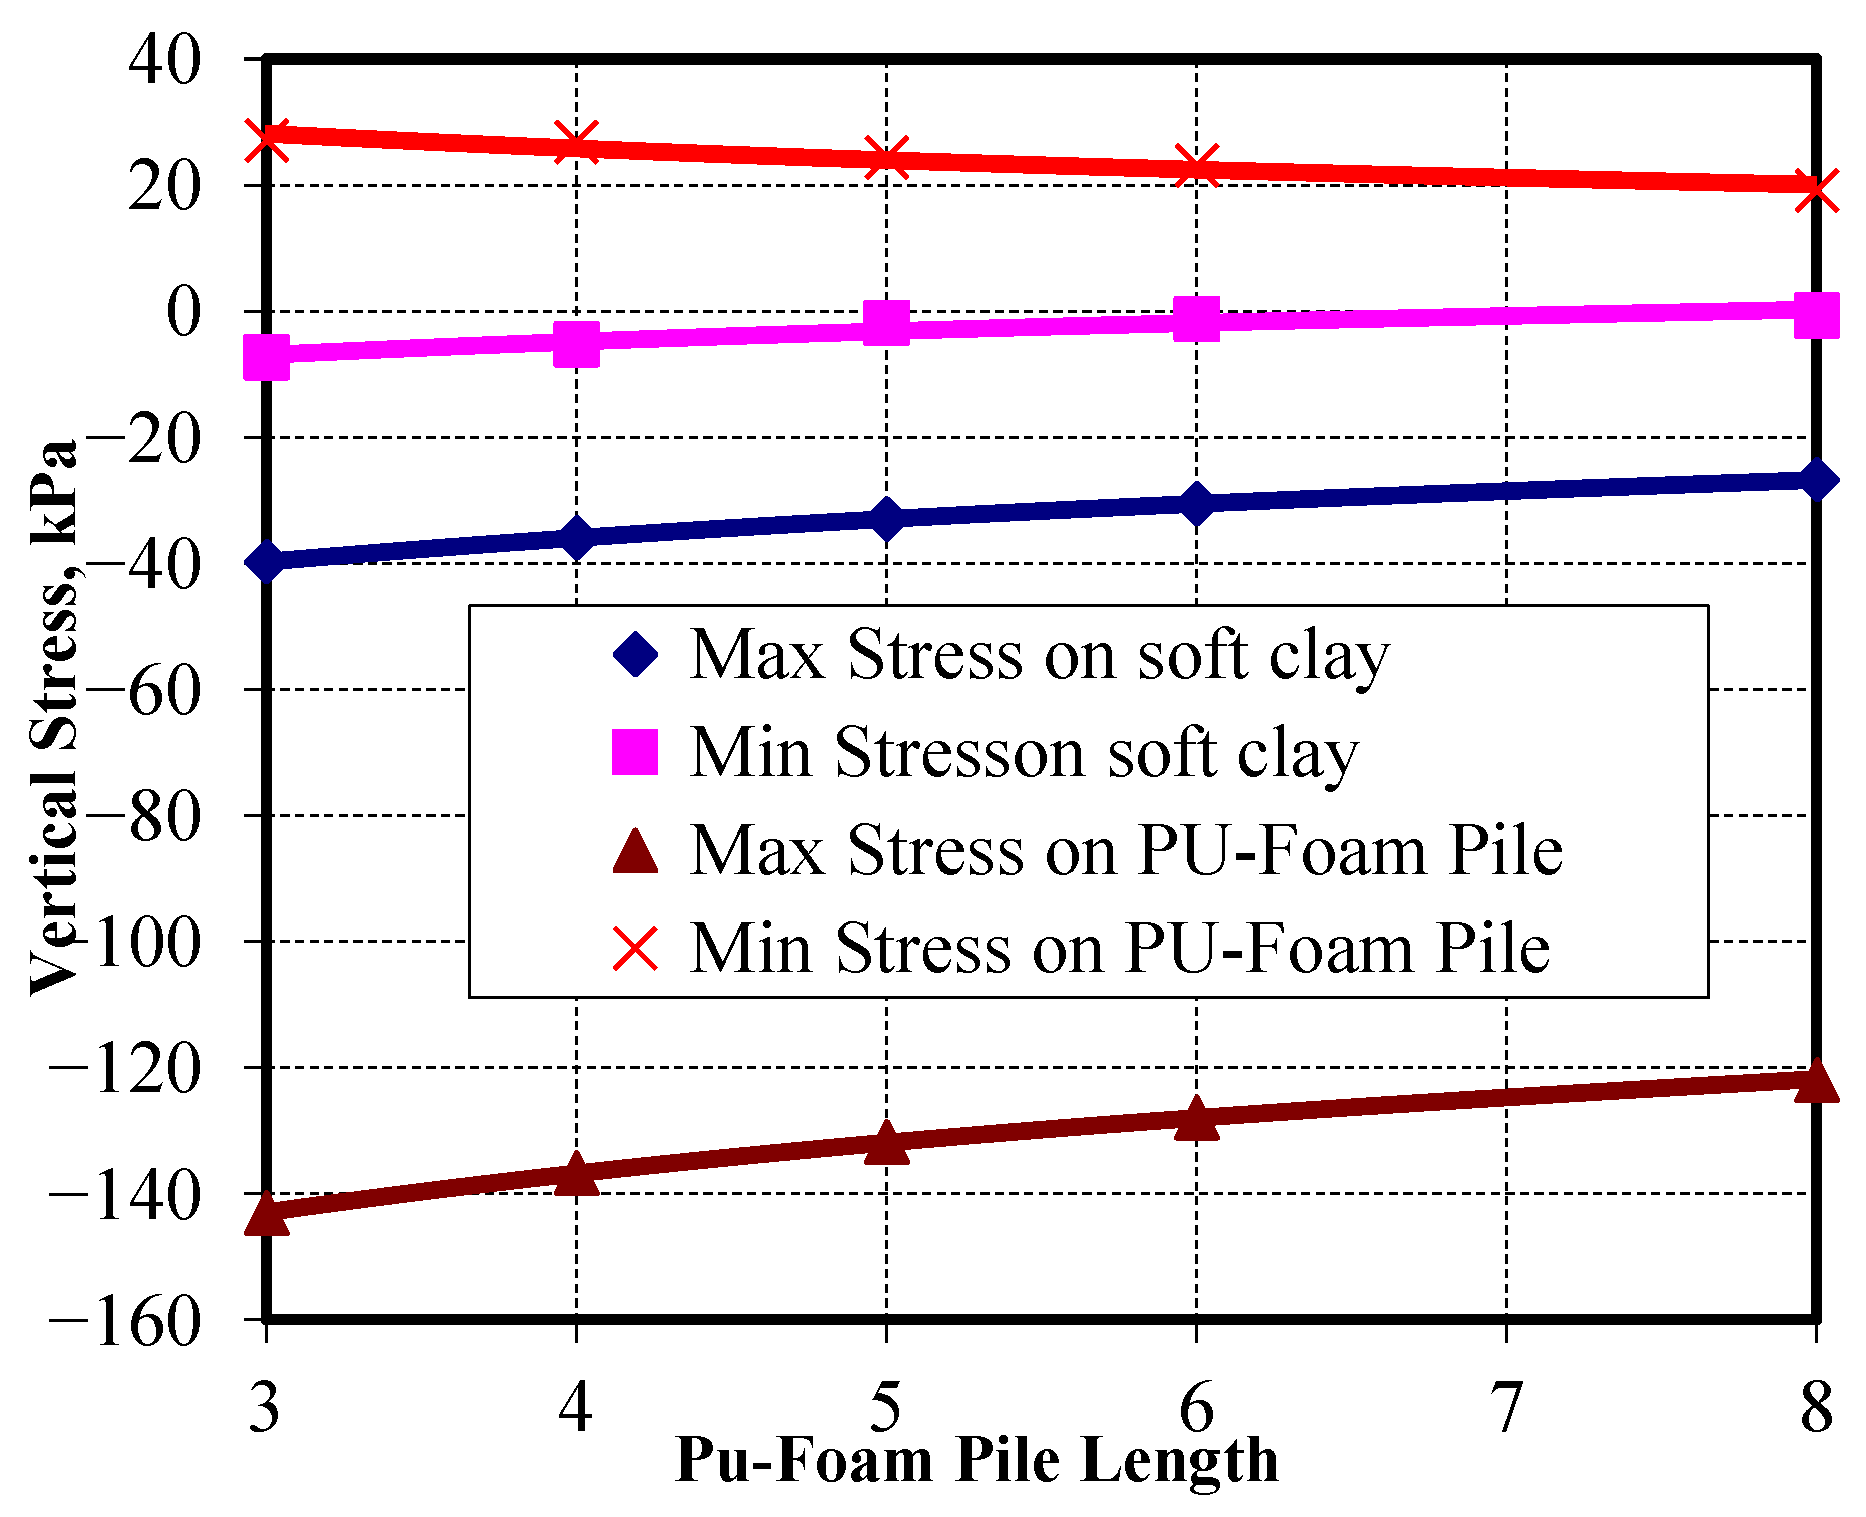
Figure 21 presents the vertical stress distribution along the top of the soft clay at the centerline of the piles, while
Figure 22 shows the vertical stress distribution along the top of the Pu-Foam piles. The results indicate that increasing the Pu-Foam pile length leads to a reduction in vertical stress transferred to the soft clay. Compared with the soil without improvements, using Pu-Foam piles reduces the vertical stresses by 47.7% when using a 3.0 m pile length, while the reduction reaches about 60% for a 6.0 m pile length. The transmitted vertical stresses to the Pu-Foam pile decreased from 143.05 kPa at a 3.0 m length to 122.0 kPa at an 8.0 m length. These results indicate that using longer piles causes a greater portion of embankment loads to be uniformly distributed along the pile length, which relieves the pressure on the pile heads. Due to the soil heave around the embankment, the Pu-Foam pile is subjected to tensile stresses. The tensile stresses are found to decrease with the increase of the pile lengths, as shown in
Figure 23.
Although the stress on the head of the pile decreased with the increase in pile length, there is a noticeable rise in the LDR ratios. The LDR for the Pu-Foam piles ranged from 52.0% to 60.9%, as shown in
Figure 24, while the corresponding LDR for the soft clay decreased from 48.0% to 39.1%. The stress reduction is caused by the fact that the longer pile length attracts more stresses along the pile shaft rather than being concentrated at the pile head. This stress distribution results in lowering the localized stresses at the pile head despite the increase in the load distribution ratios.
3.4.4. Excess Pore Water Pressure (EPWP)
Although the Pu-Foam pile is considered impervious and water dissipation does not occur through it, the piles are considered as a partial replacement of the soft clay layer.
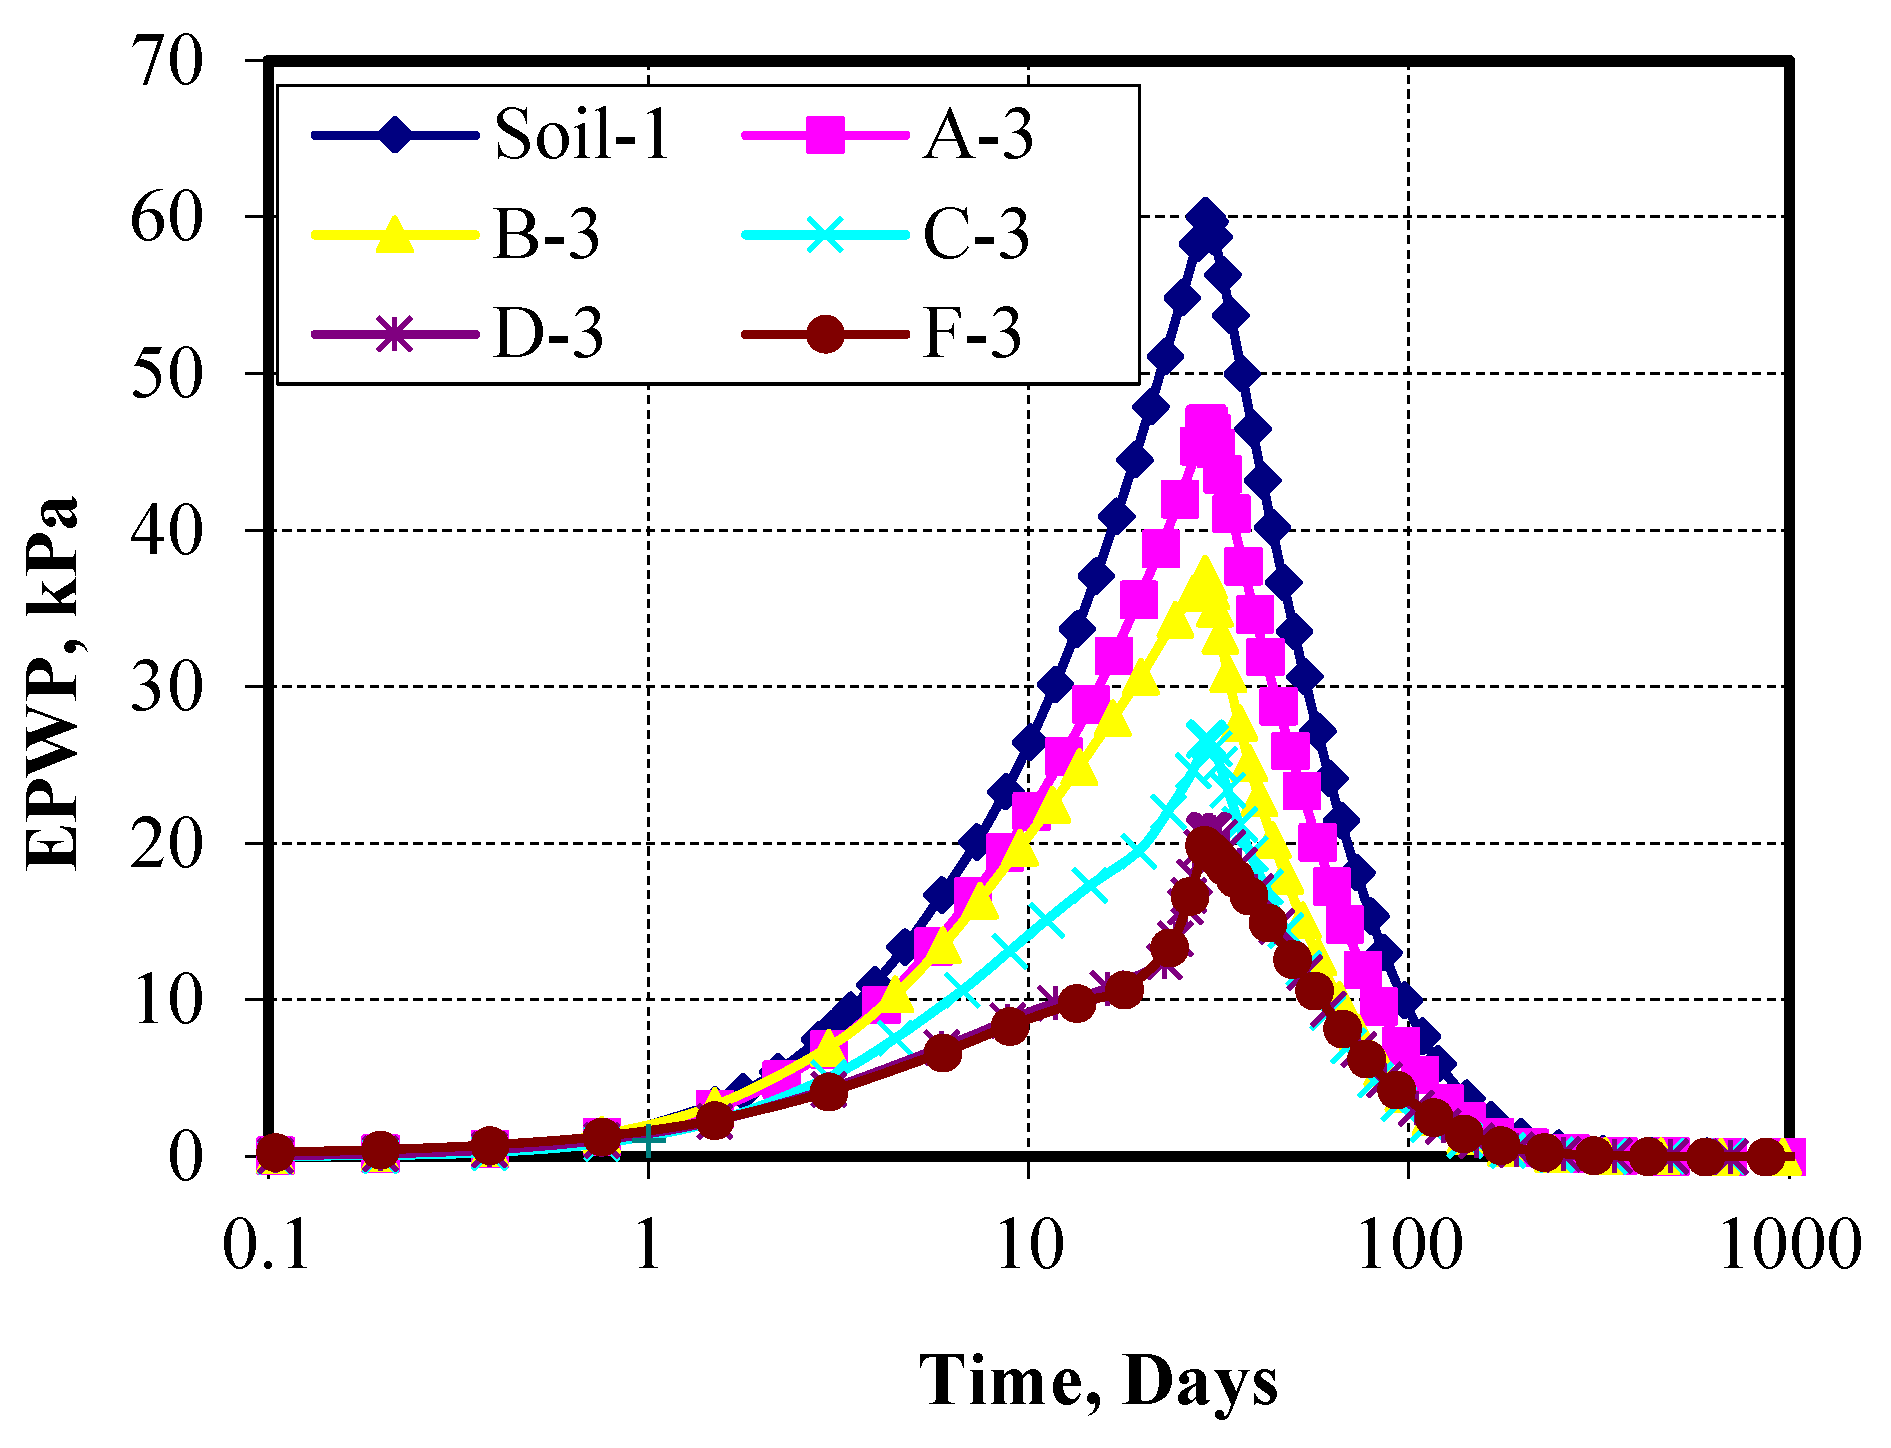
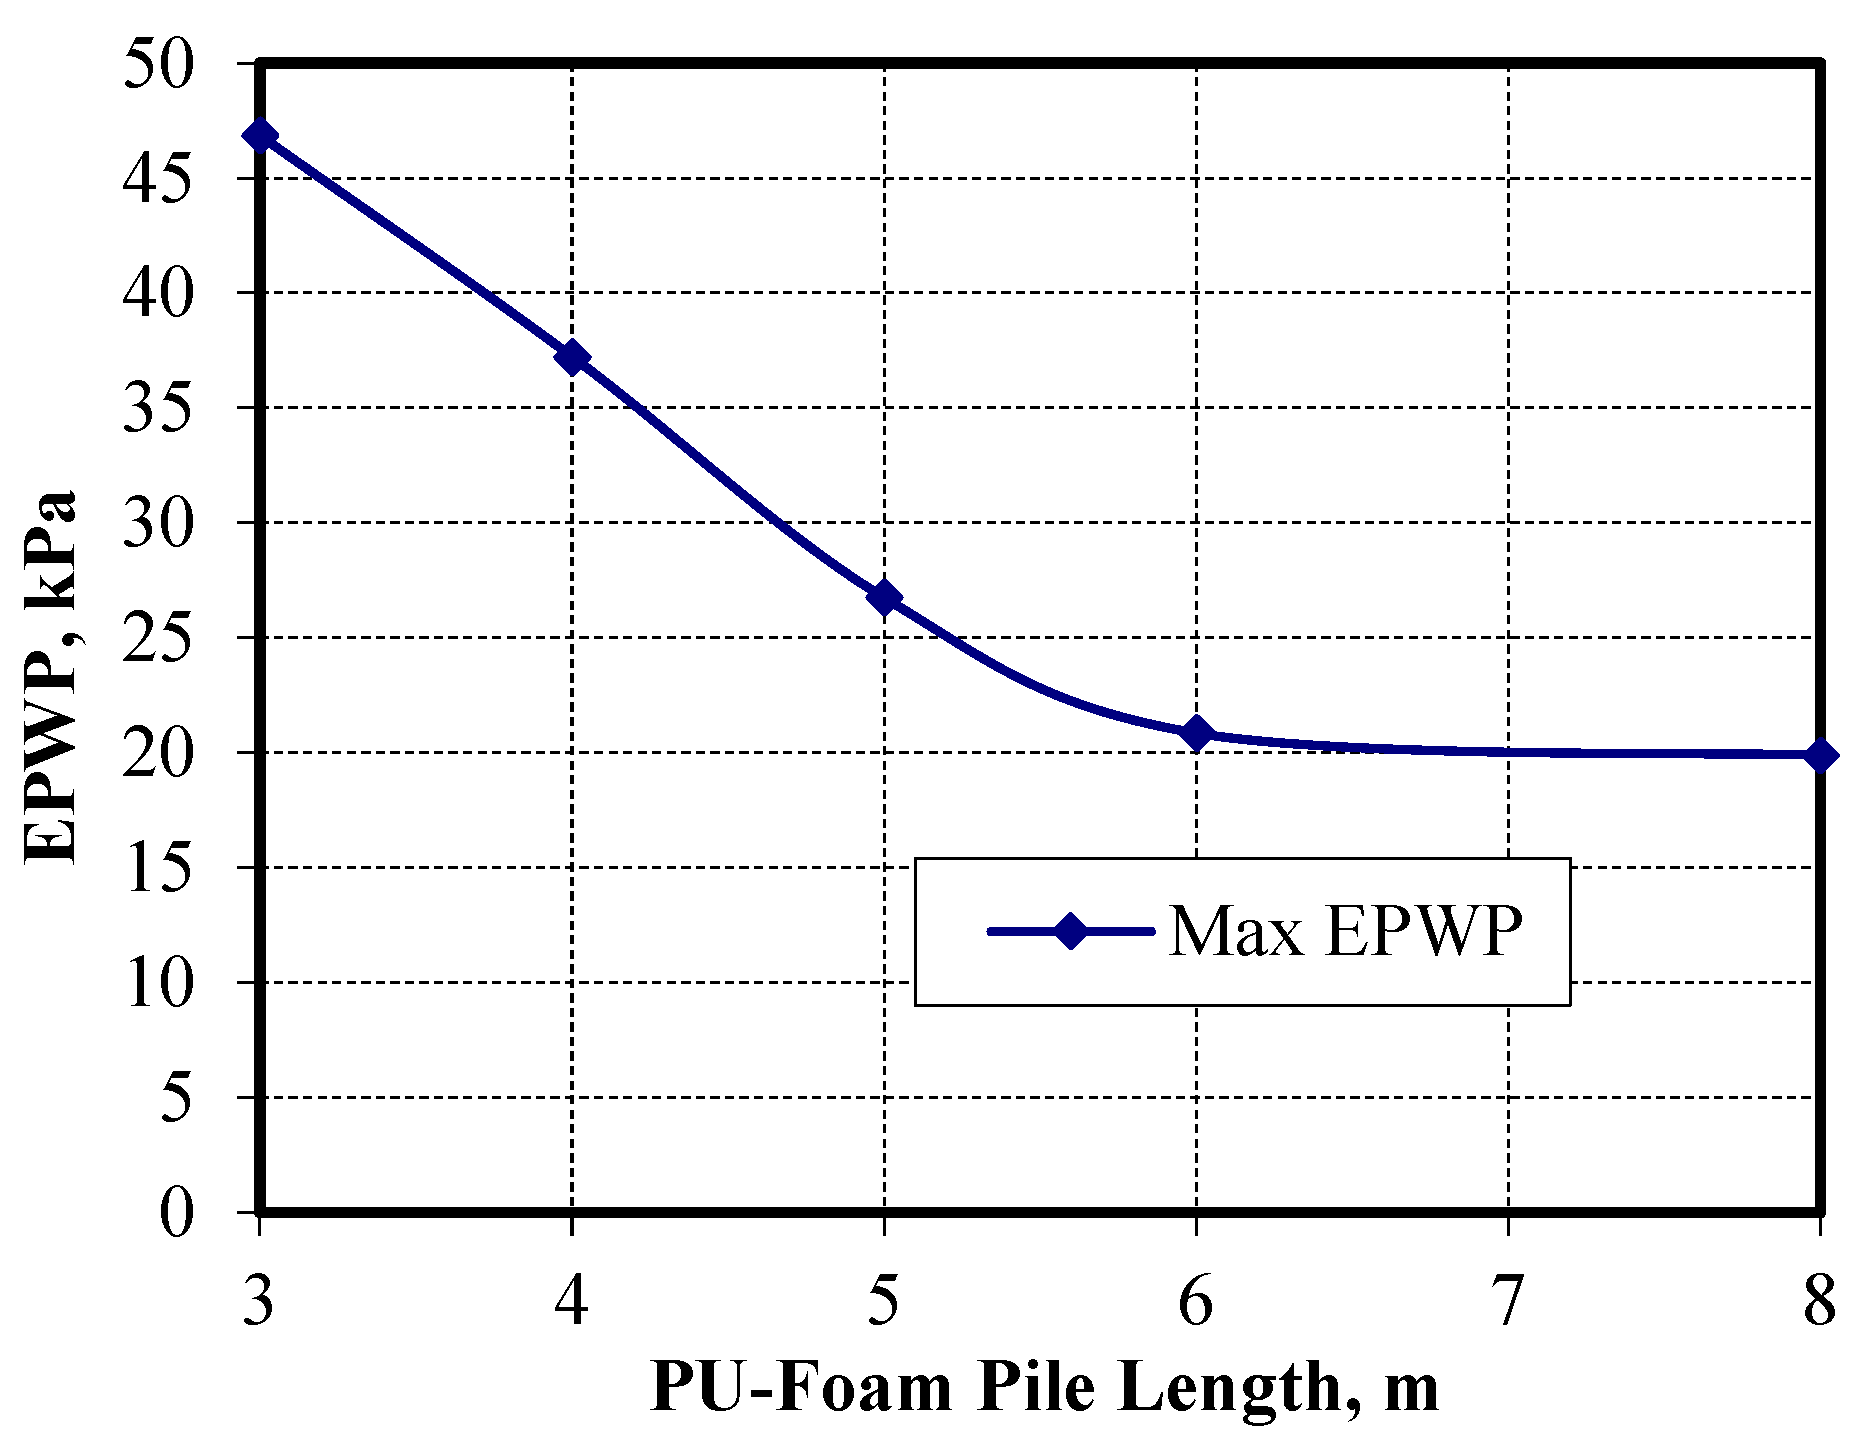
Figure 25 shows the excess pore water pressure within the consolidation time for different Pu-Foam pile lengths at an improved ratio of 30%. The results indicate that the excess pore water pressure (EPWP) decreased with the increase in the pile lengths. The maximum value of EPWP for the case without improvement was found to be 60.12 kPa, while the value of EPWP when using the Pu-Foam pile decreased to 19.9 kPa for the case where the Pu-Foam pile length reached 6.0 m, with no further decrease for longer piles, as shown in
Figure 26.
3.5. Effect of Soft Clay Improved Area Using Pu-Foam
3.5.1. Safety Factor of Embankment Slope
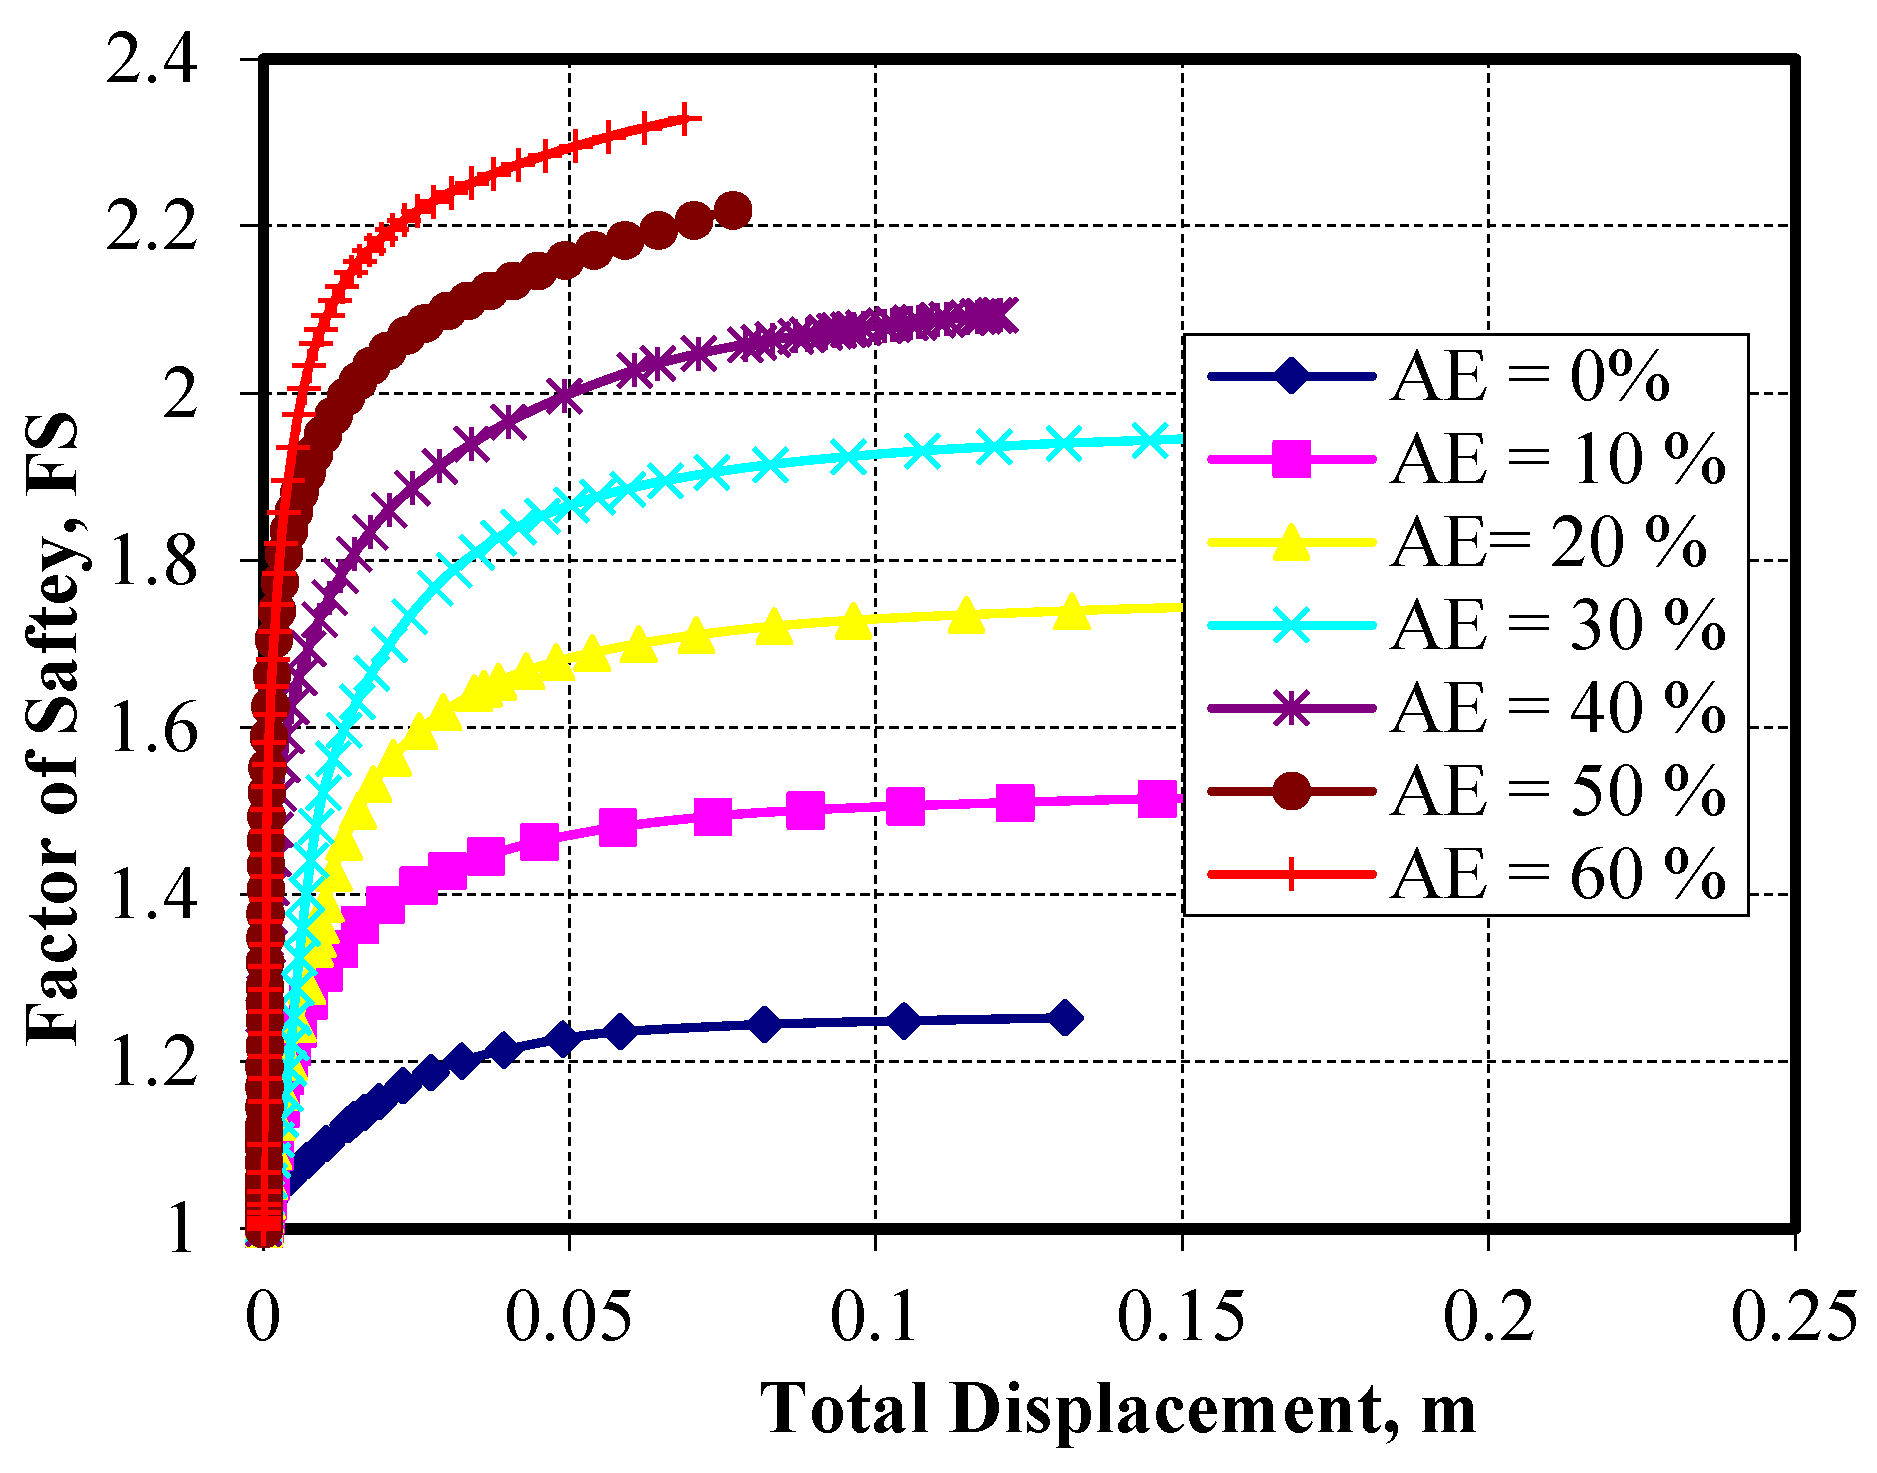
The improved area ratio (AE) depends on the Pu-Foam pile diameter and spacing. In this study, the area ratio was investigated to clarify how it affects the slope stability of an embankment constructed over soft clay. To explore the effect of AE, the pile diameter and length were kept constant at 1.0 m and 6.0 m, respectively, while AE was varied from 10% to 60% in incremental steps of 10%, using a square arrangement of piles. The relationship between total displacement and the factor of safety (FS) and (Δu/FS) is shown in
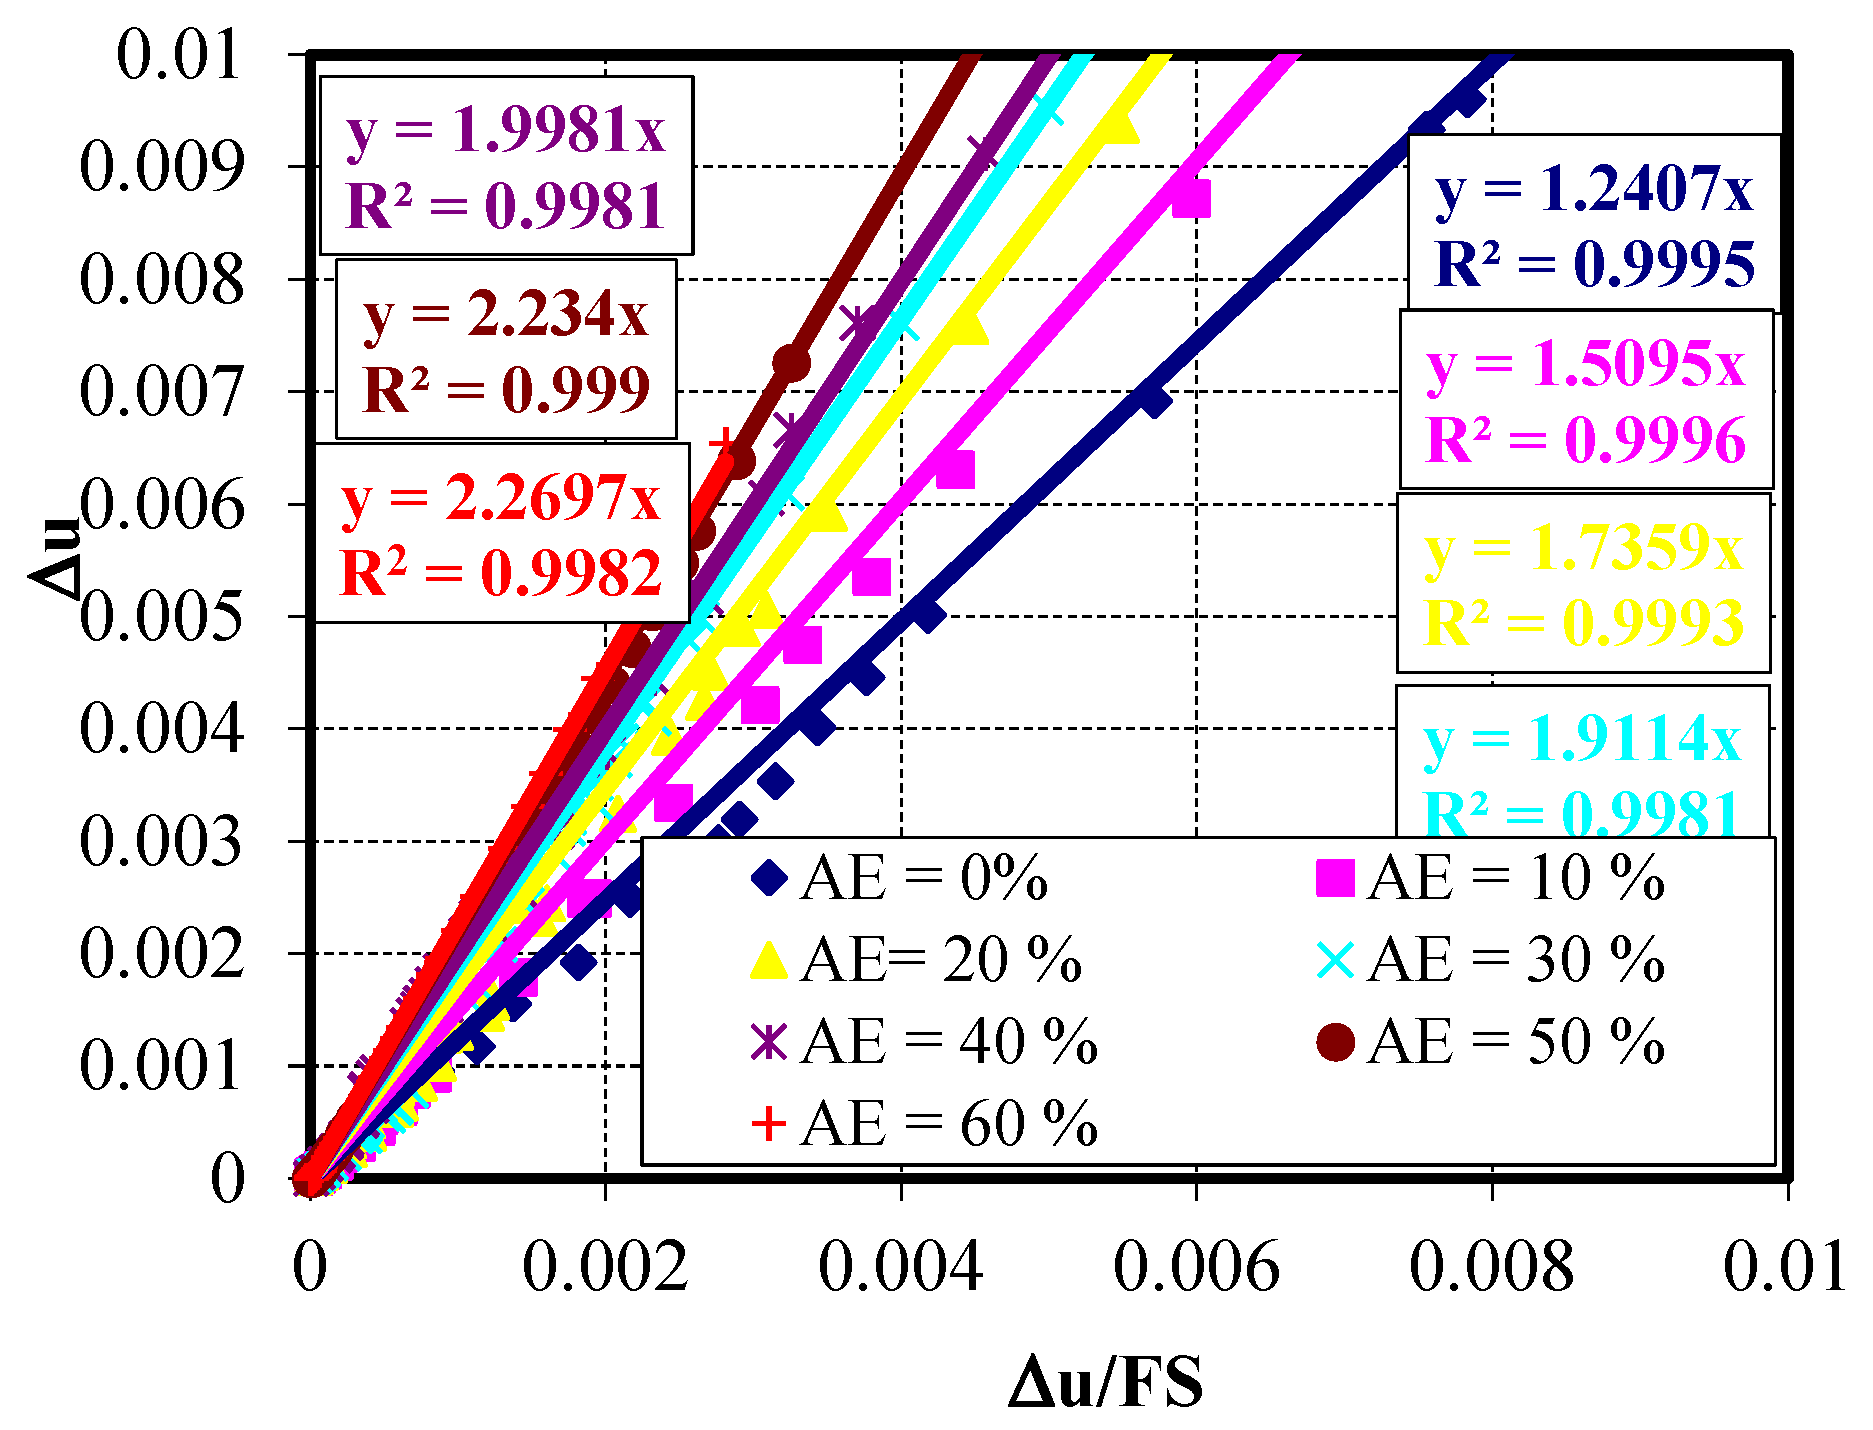
Figure 27 and
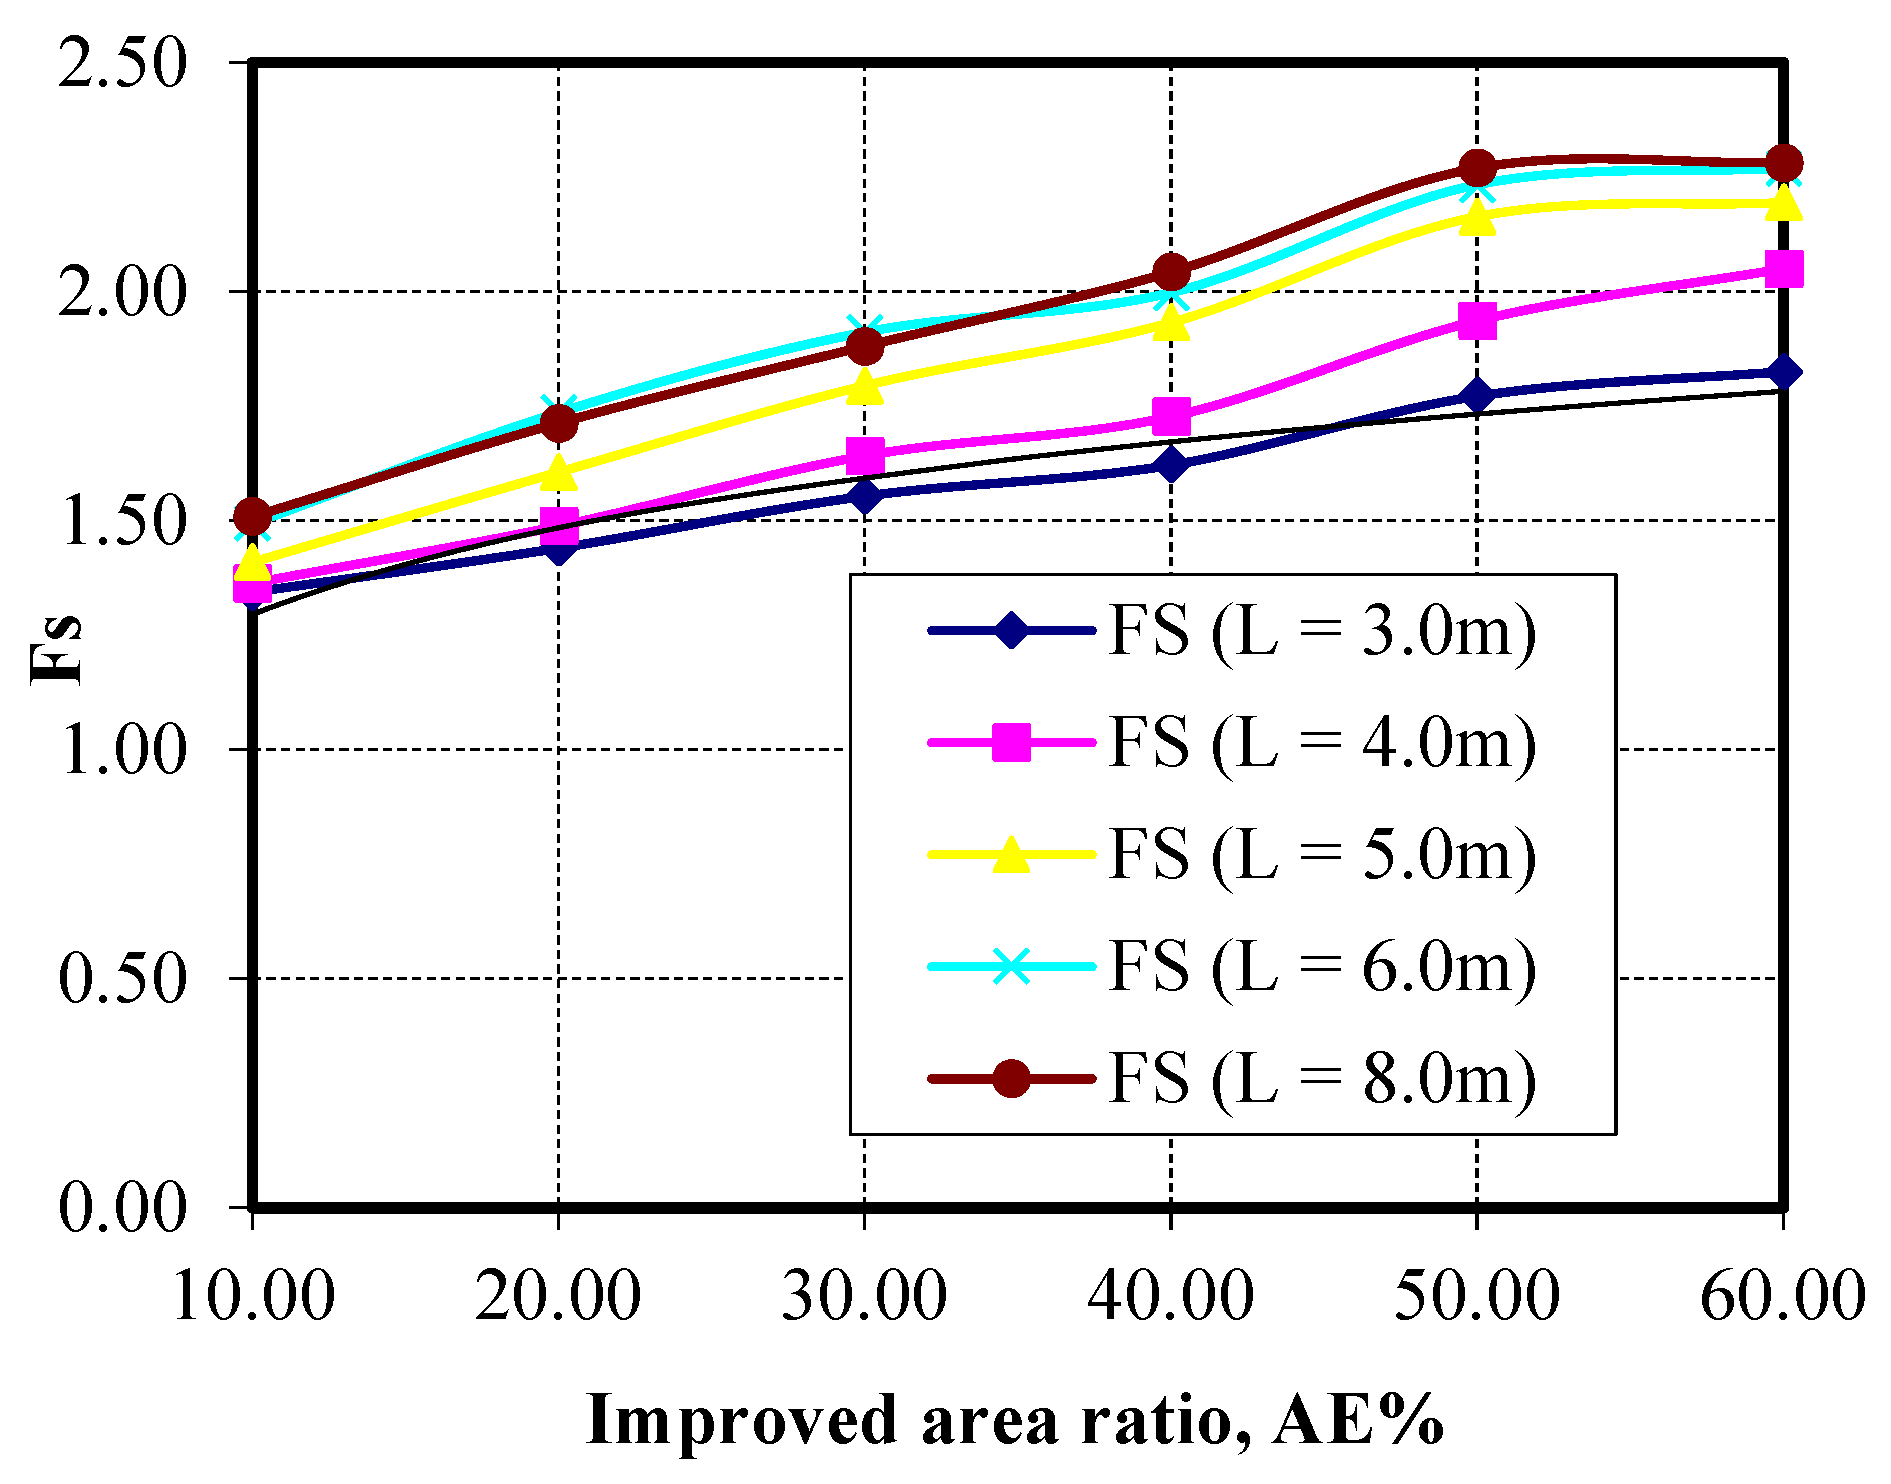
Figure 28. The results show that increasing AE leads to higher slope safety factors. Without any Pu-Foam pile improvement, the slope safety factor was 1.24. With increasing AE from 10% to 60%, the slope safety factor improved progressively till reaching 2.27. After AE = 50%, the benefit from adding more piles does not significantly increase the slope safety factor, but of course, this will increase the improvement cost. Based on this result, the most efficient and economical improvement appears to occur at AE = ranging from 40% to 50%. For a pile diameter of 1.0 m in a square pattern, this corresponds to a spacing between 1.25 m and 1.40 m. The variation in AE% and its effect on FS for different cases of Pu-Foam lengths are shown in
Figure 29.
3.5.2. Effect of Pu-Foam on Vertical Displacement
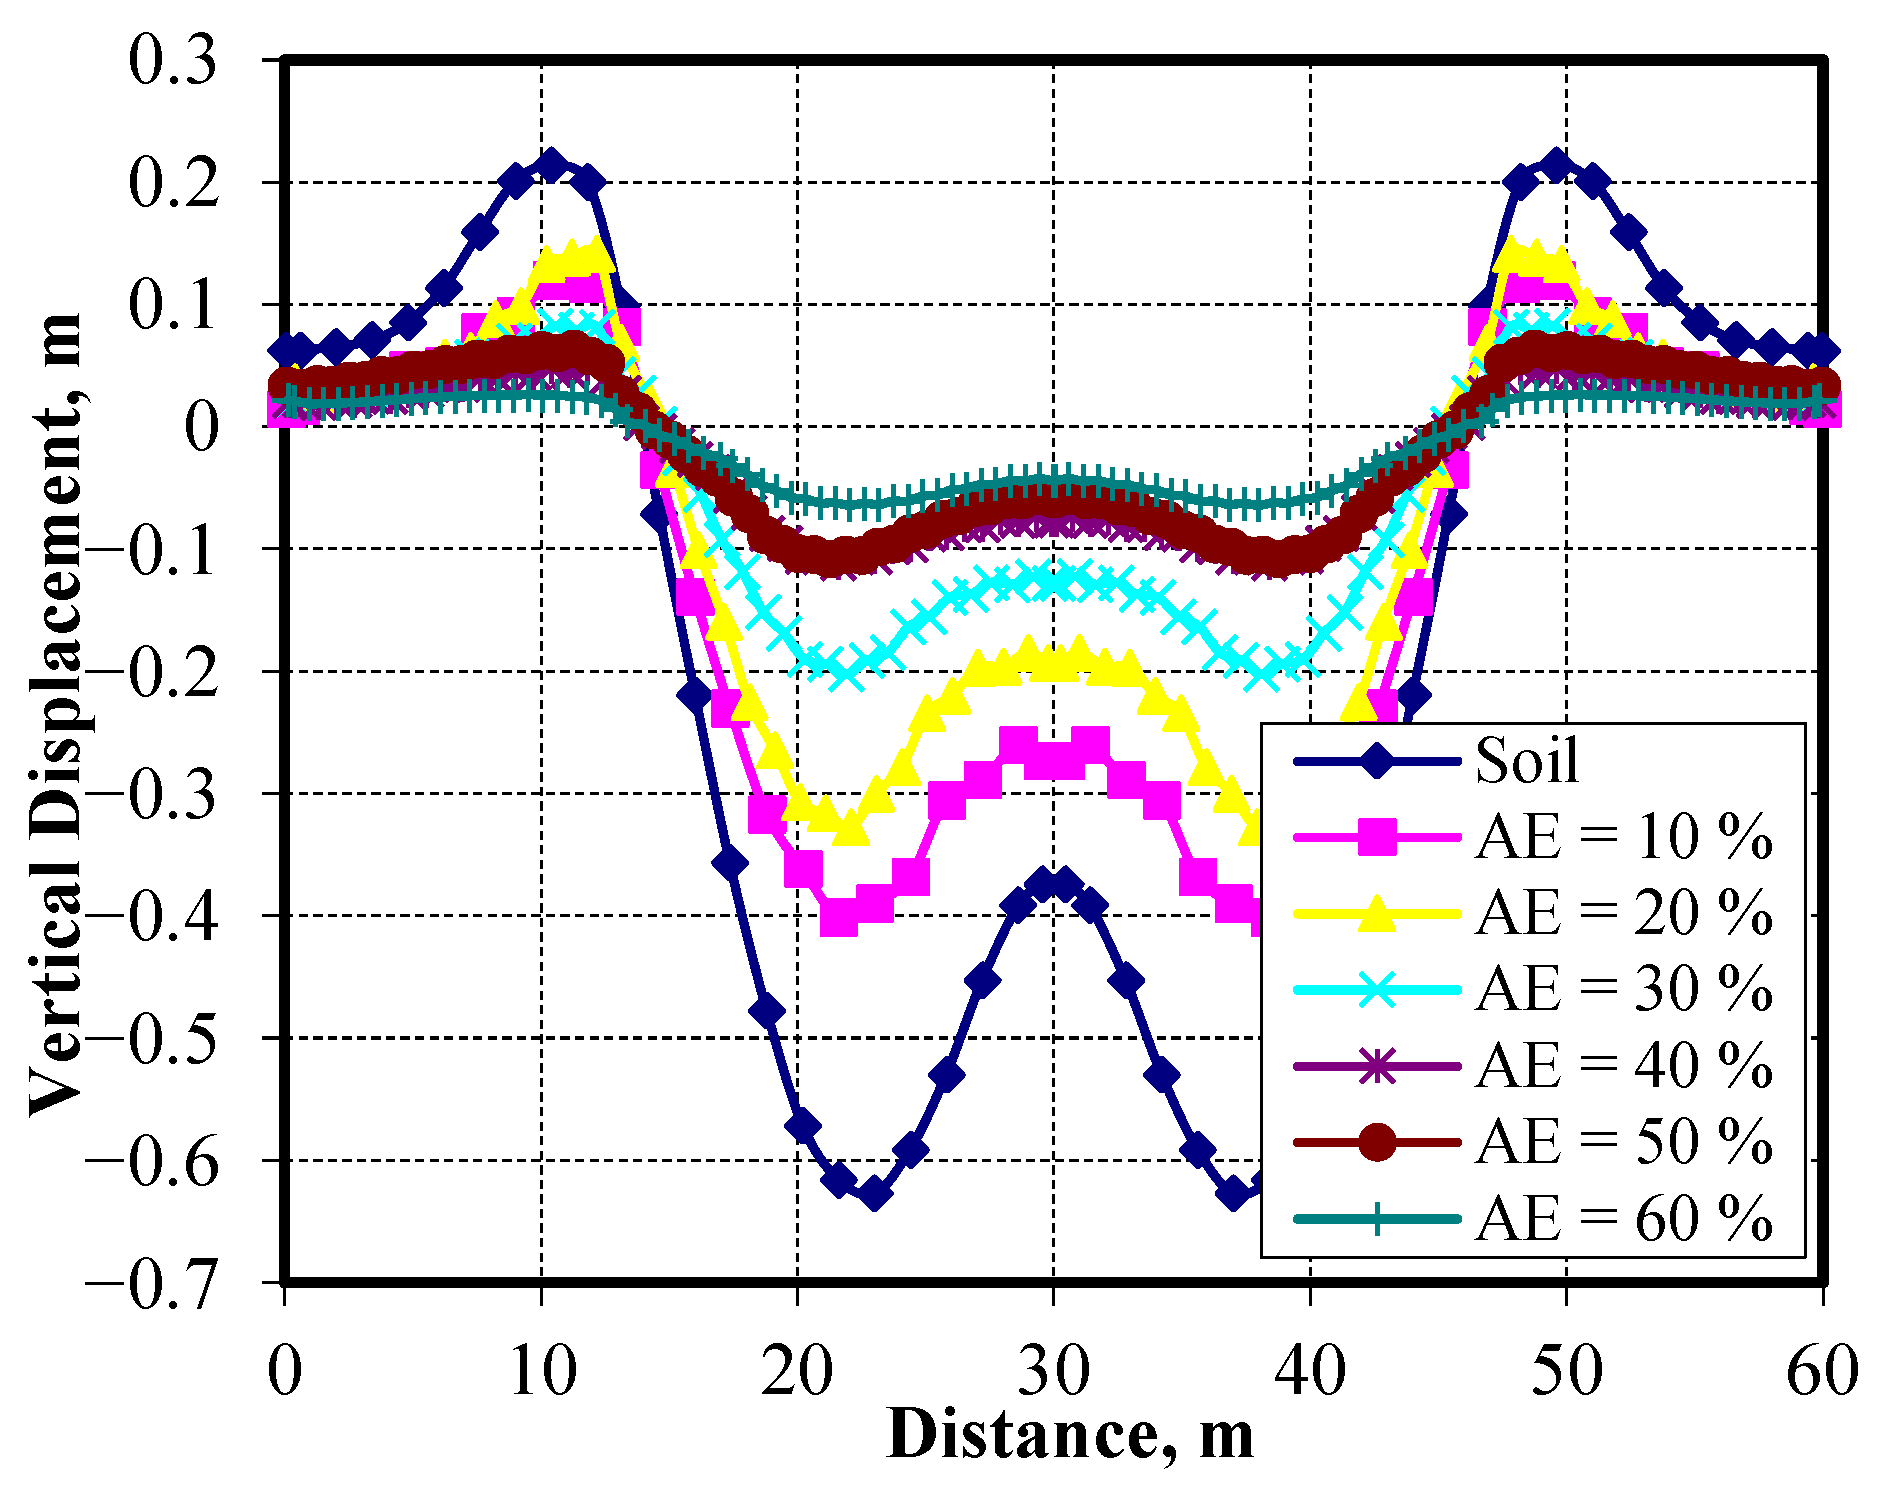
The vertical displacements at the top surface of the soft clay layer along the distance under the embankment have also been investigated, as shown in
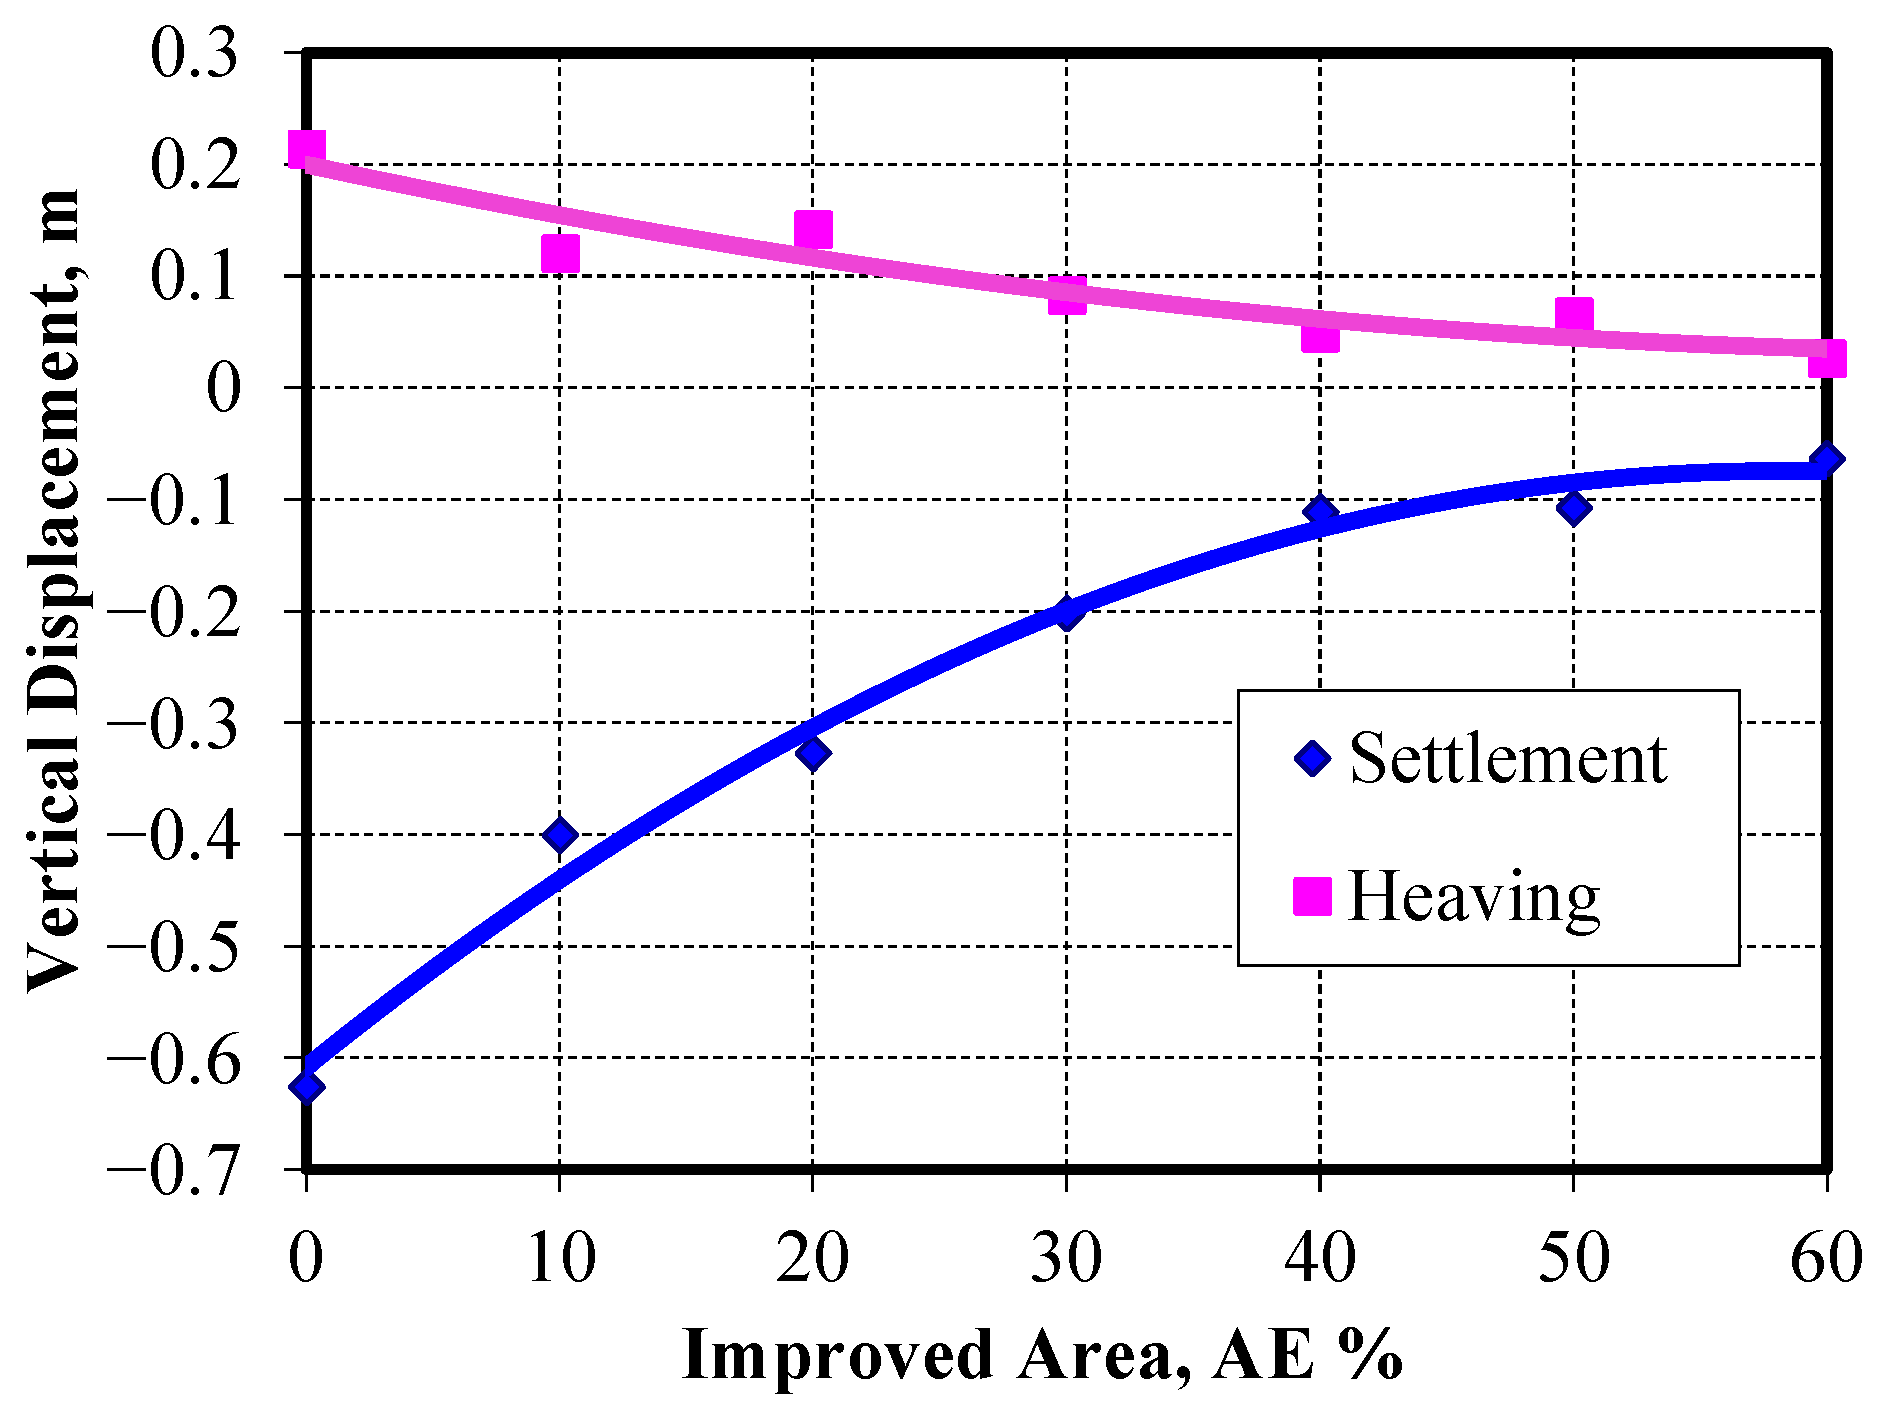
Figure 30. The settlement and heaving values for different cases of AE% are shown in
Figure 31. The results demonstrate a consistent reduction in both settlement and heave of the soft clay layer as the improved area ratio (AE) increases. Maximum settlement decreased by approximately 67.8% at AE = 30% and reached up to 98.3% at AE = 50%. Similarly, maximum heaving values were reduced by 61.5% at AE = 30% and by 87.8% at AE = 60%. The settlement and heaving values also indicated that the most economic value of AE% is ranged from 40% to 50%, after that range, the settlement and heaving values almost remained constant.
3.5.3. Effect of Pu-Foam on Vertical Stresses and Load Distribution Ratio
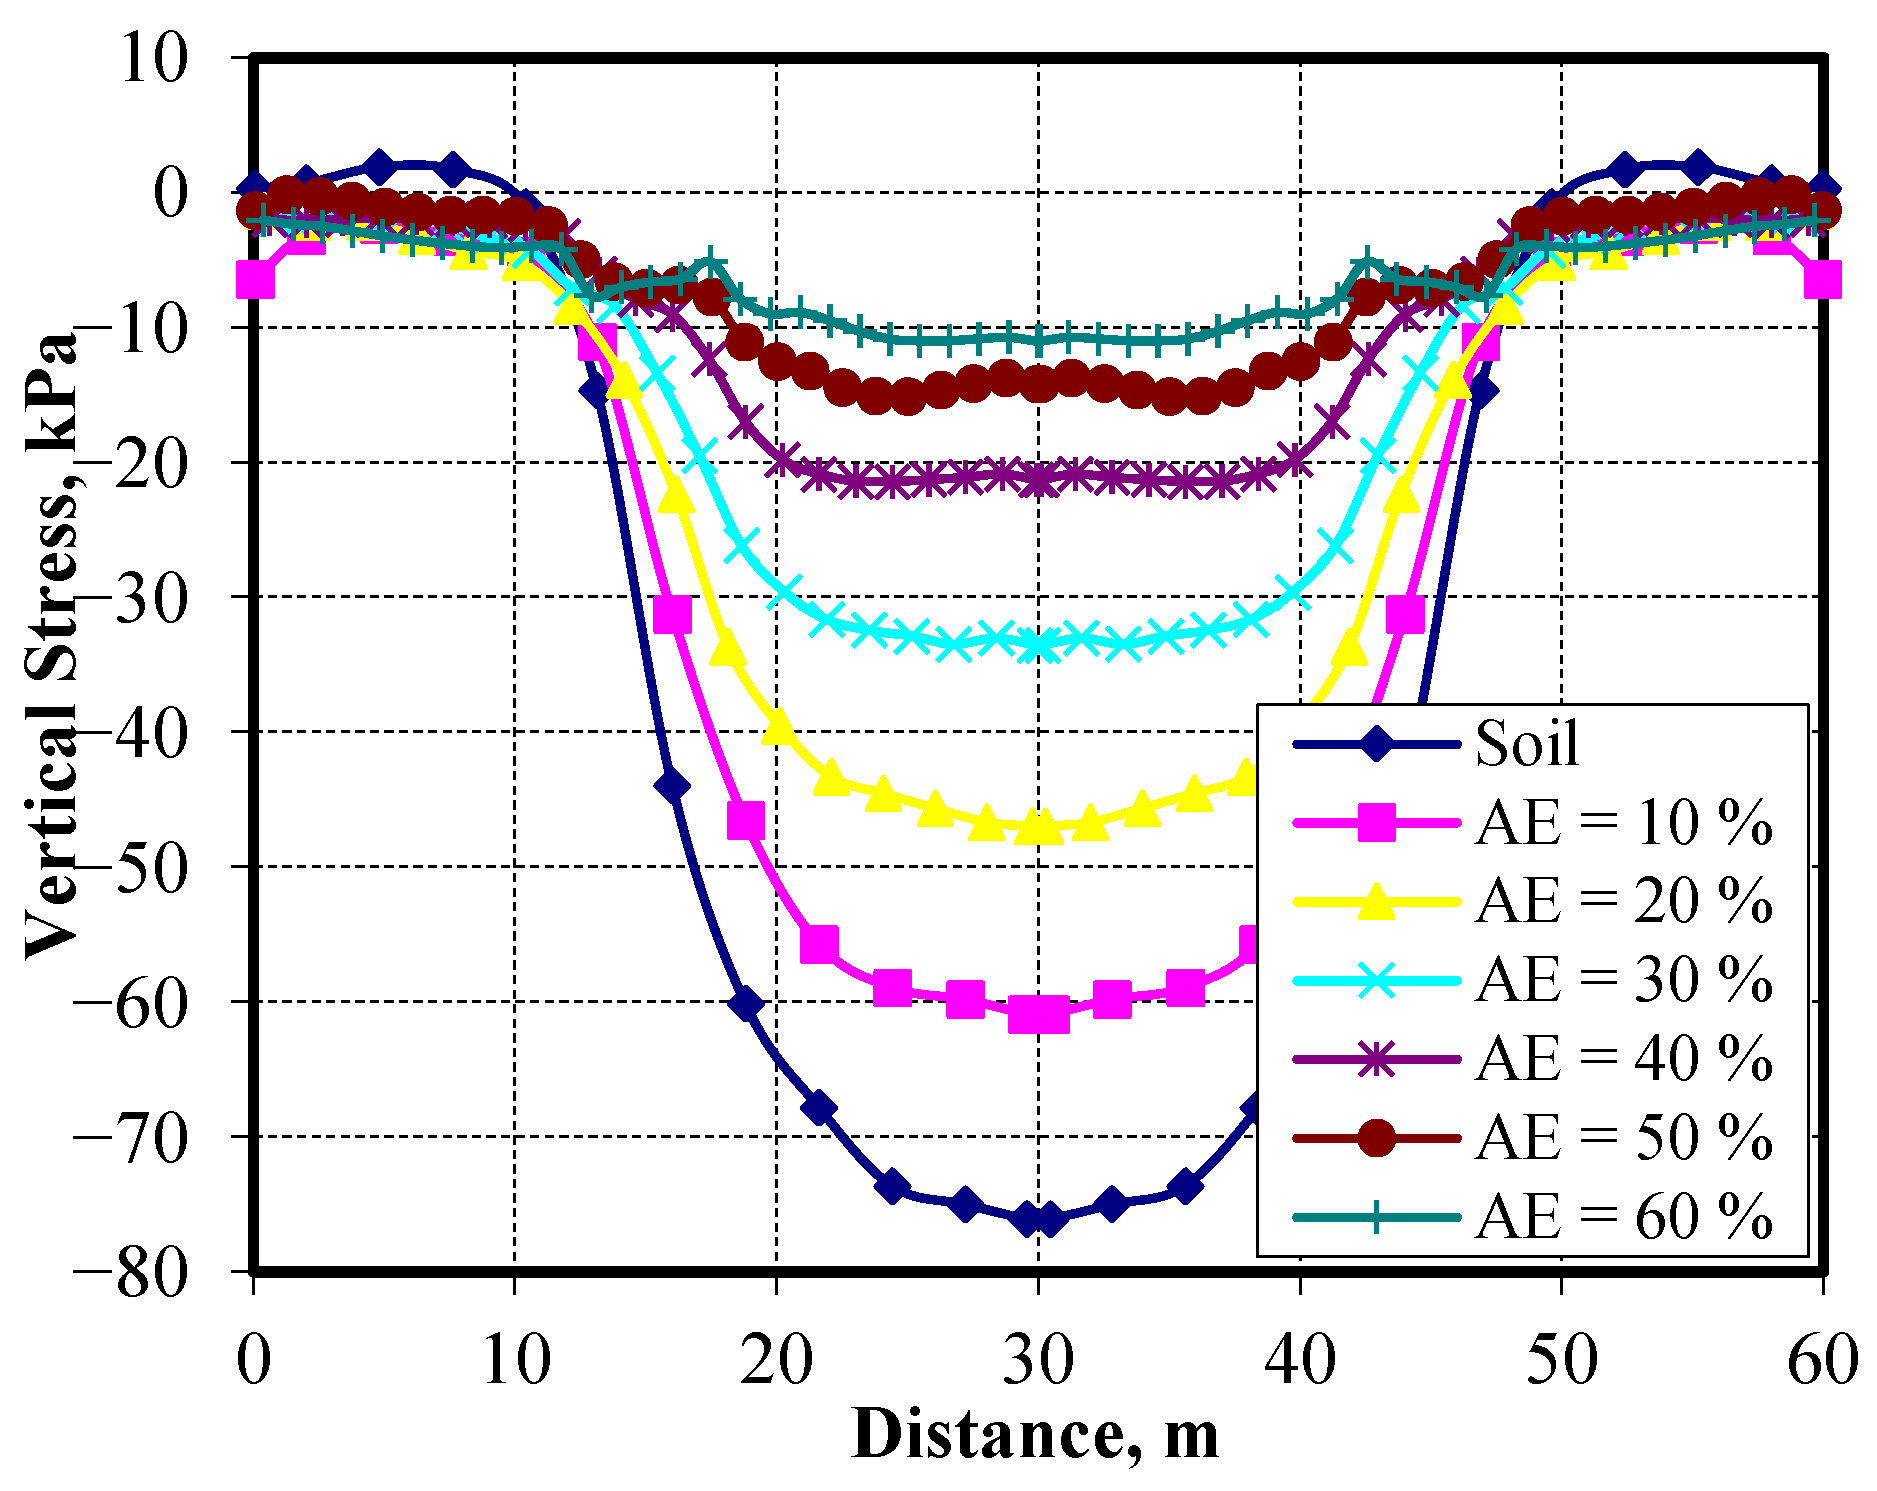
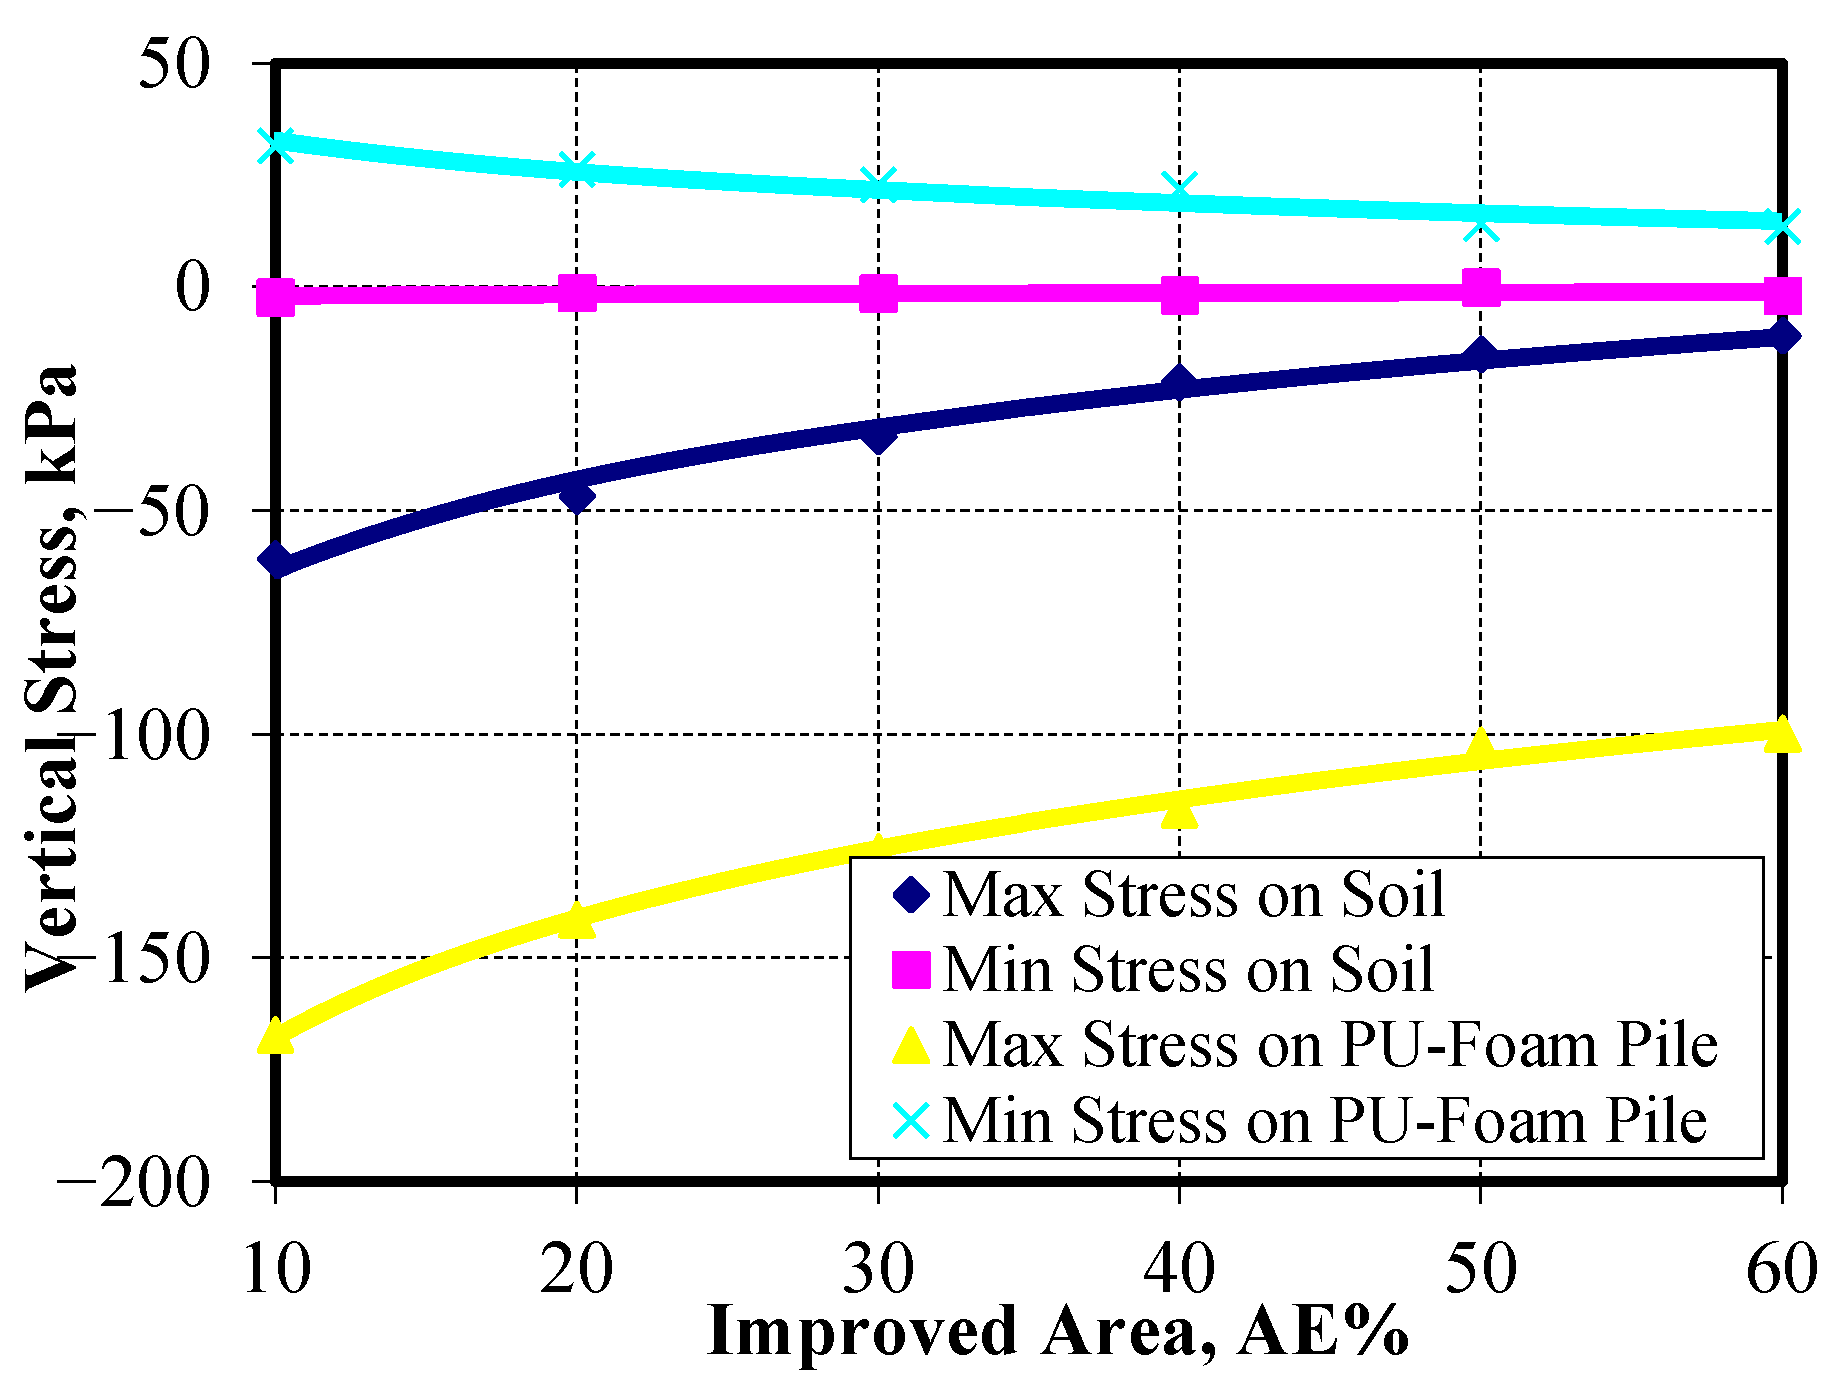
The stresses from the embankment self-weight and the traffic surcharge are shared between the saturated soft clay layer below the embankment and the Pu-Foam piles. In the case that pile length = 6.0 m in a square pattern, the resulting vertical stresses presented in
Figure 32 and
Figure 33 illustrated that the vertical stresses on the soft clay layer decreased with the increase in AE% at the same Pu-Foam pile length. The stress reduction was found to reach approximately 80% at AE = 50%. The vertical stresses on the top of the Pu-Foam pile increased about 30.4% at the same AE%. At the toe of the embankment slope, the soft clay layer heaves. The heaving values decreased, and the Pu-Foam pile was subjected to tensile stresses as shown in
Figure 34.
Figure 35 shows the effect of AE% on the load distributed ratio (LDR), indicating that the most efficient AE percentage ranged from 40% to 50%.
3.5.4. Effect of Pu-Foam on Excess Pore Water Pressure in Soft Clay
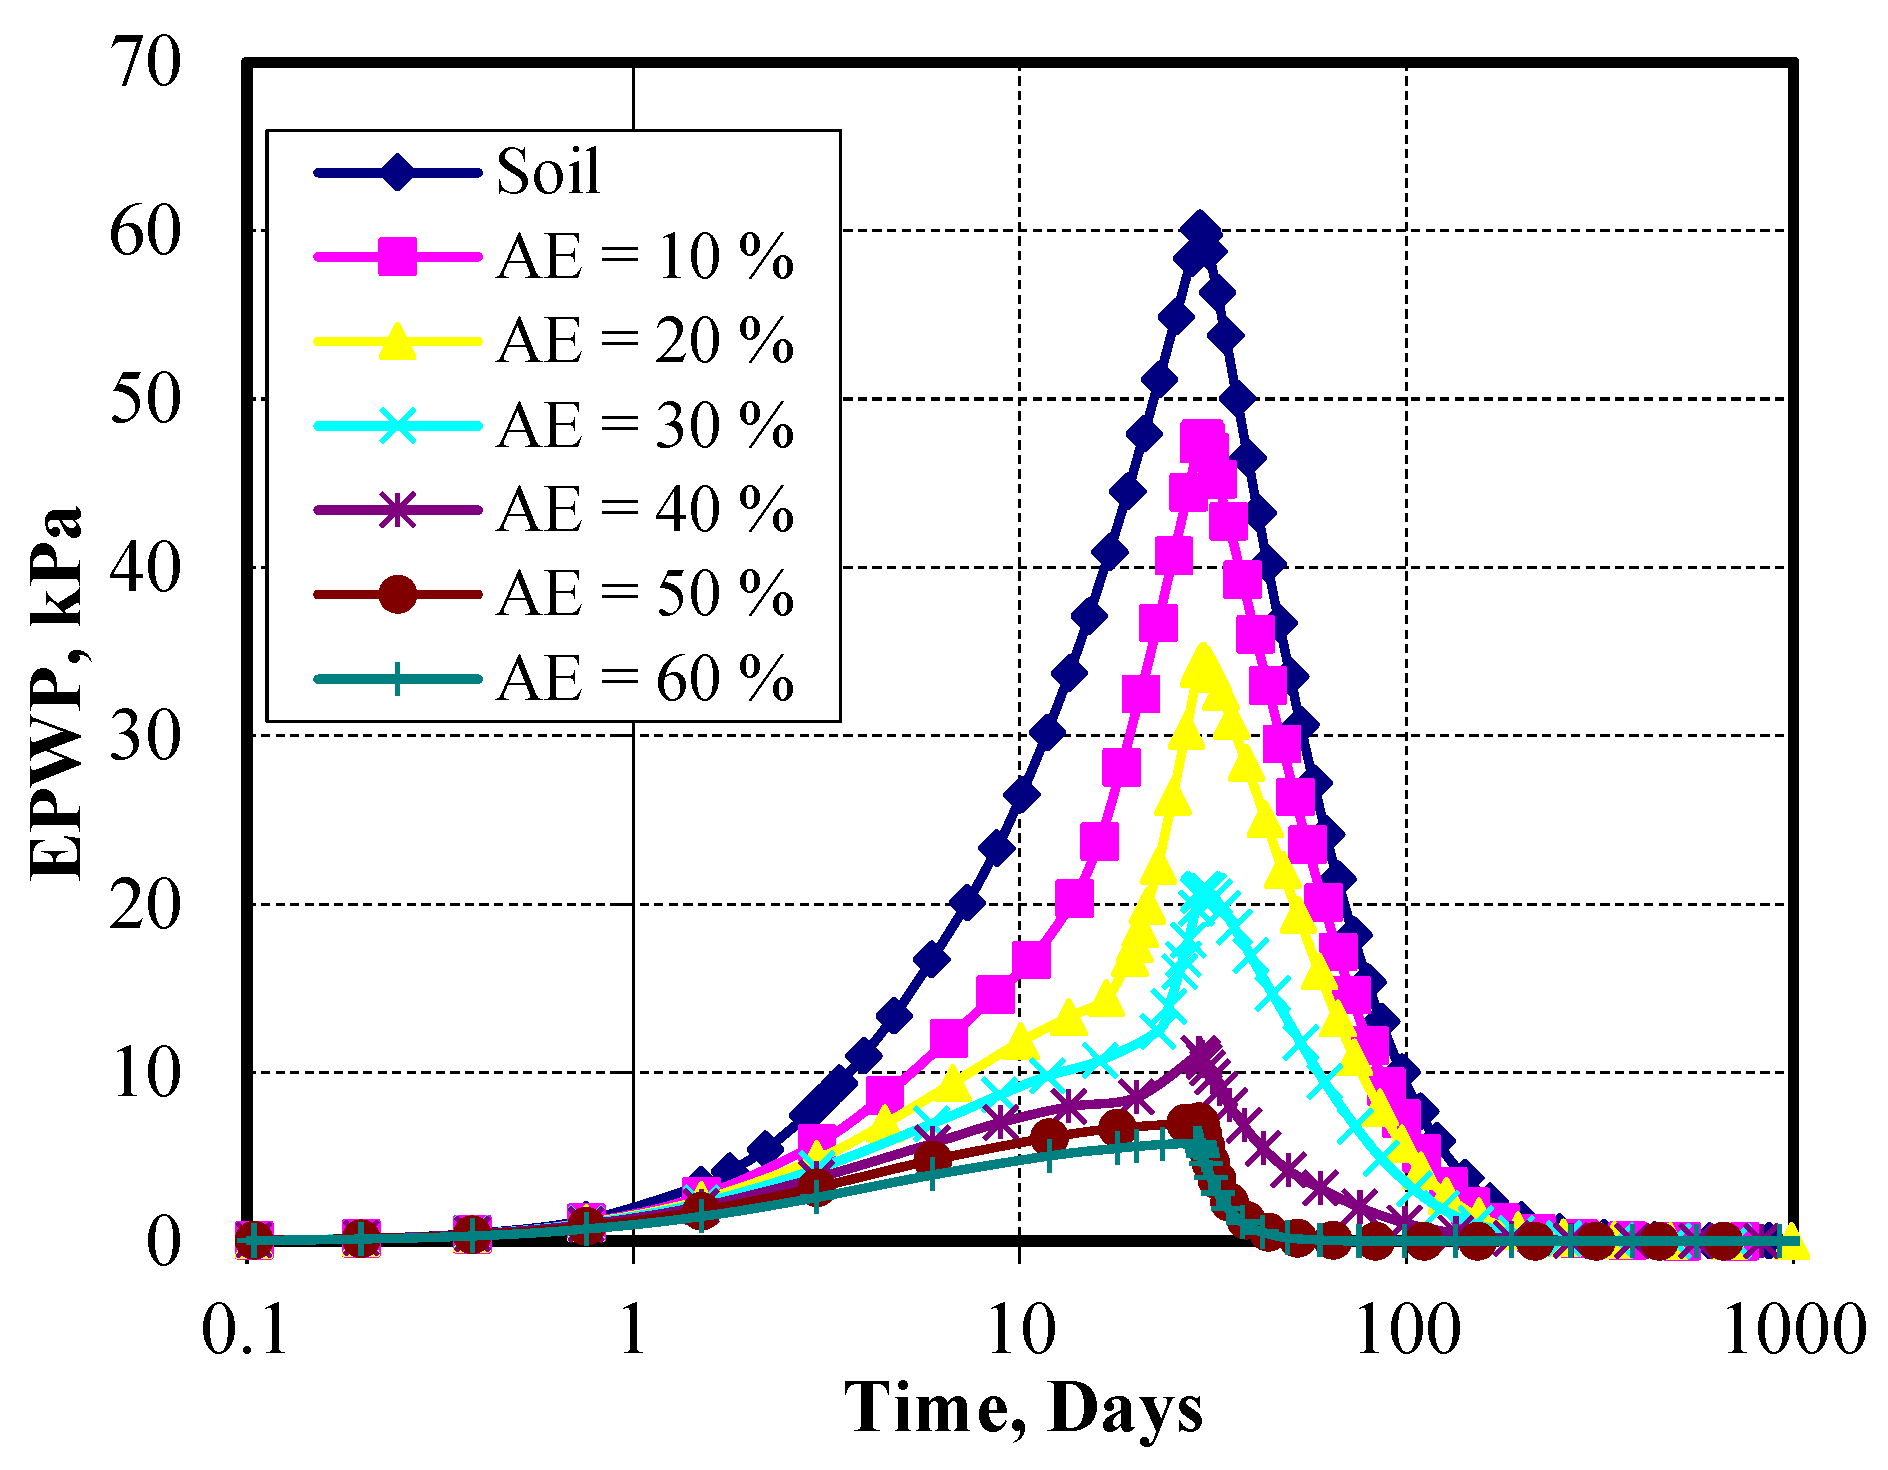
Figure 36 and
Figure 37 show the EPWP versus time for different improved area ratios. The results show that the EPWP decreases with the increase in AE%. The dissipation time of water pressure is found to slightly decrease with the increase of AE%. The maximum value of EPWP in soft clay was 60.11 kPa for the case without Pu-Foam improvement, and it was only 7.01 kPa when the AE% = 50%.
3.6. Effect of Pu-Foam Pile Arrangements
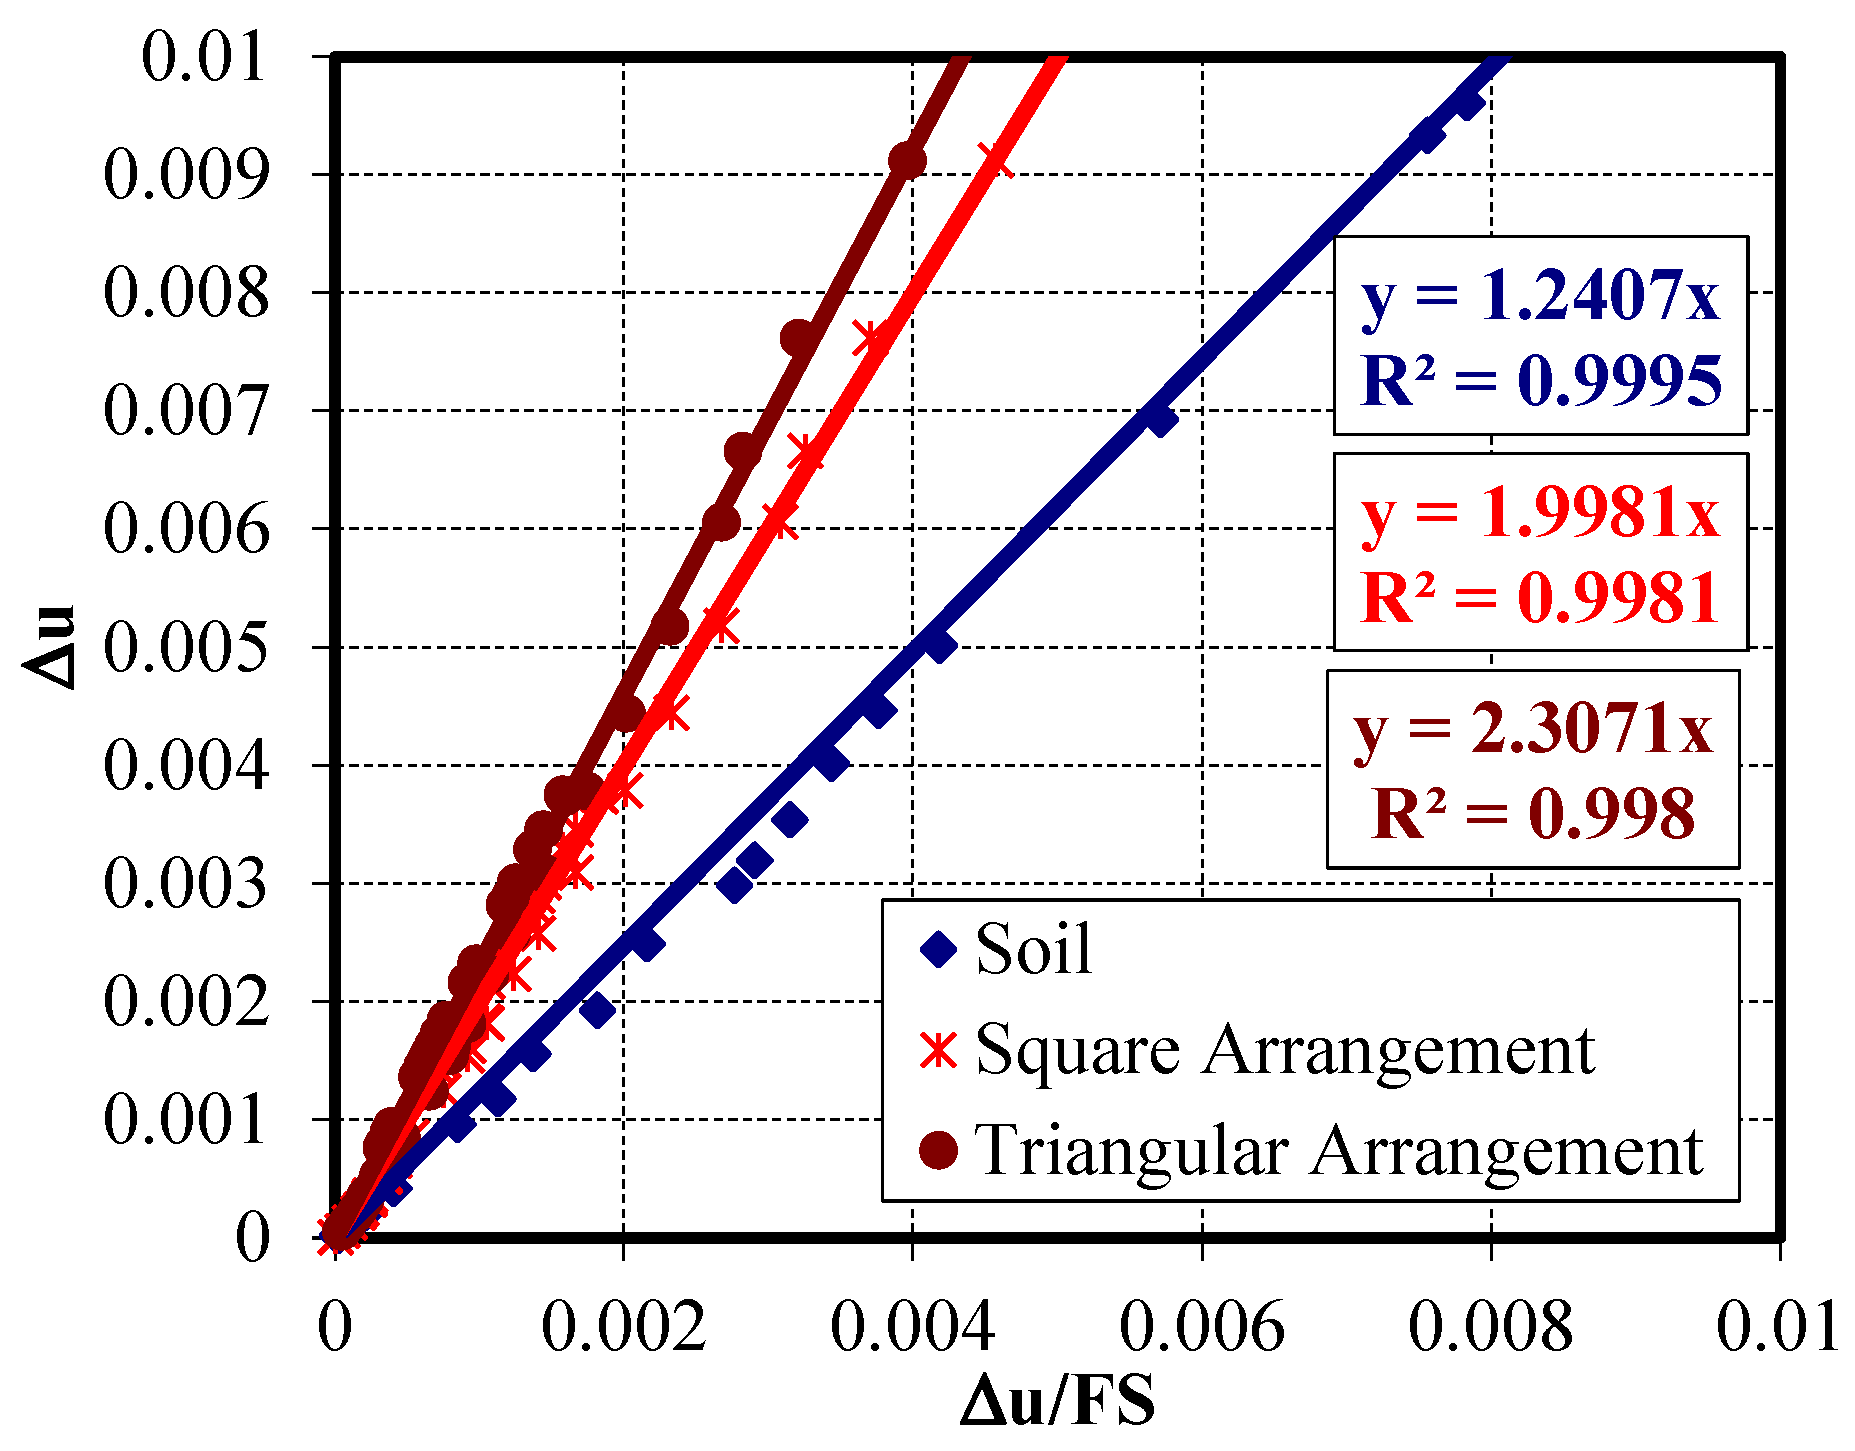
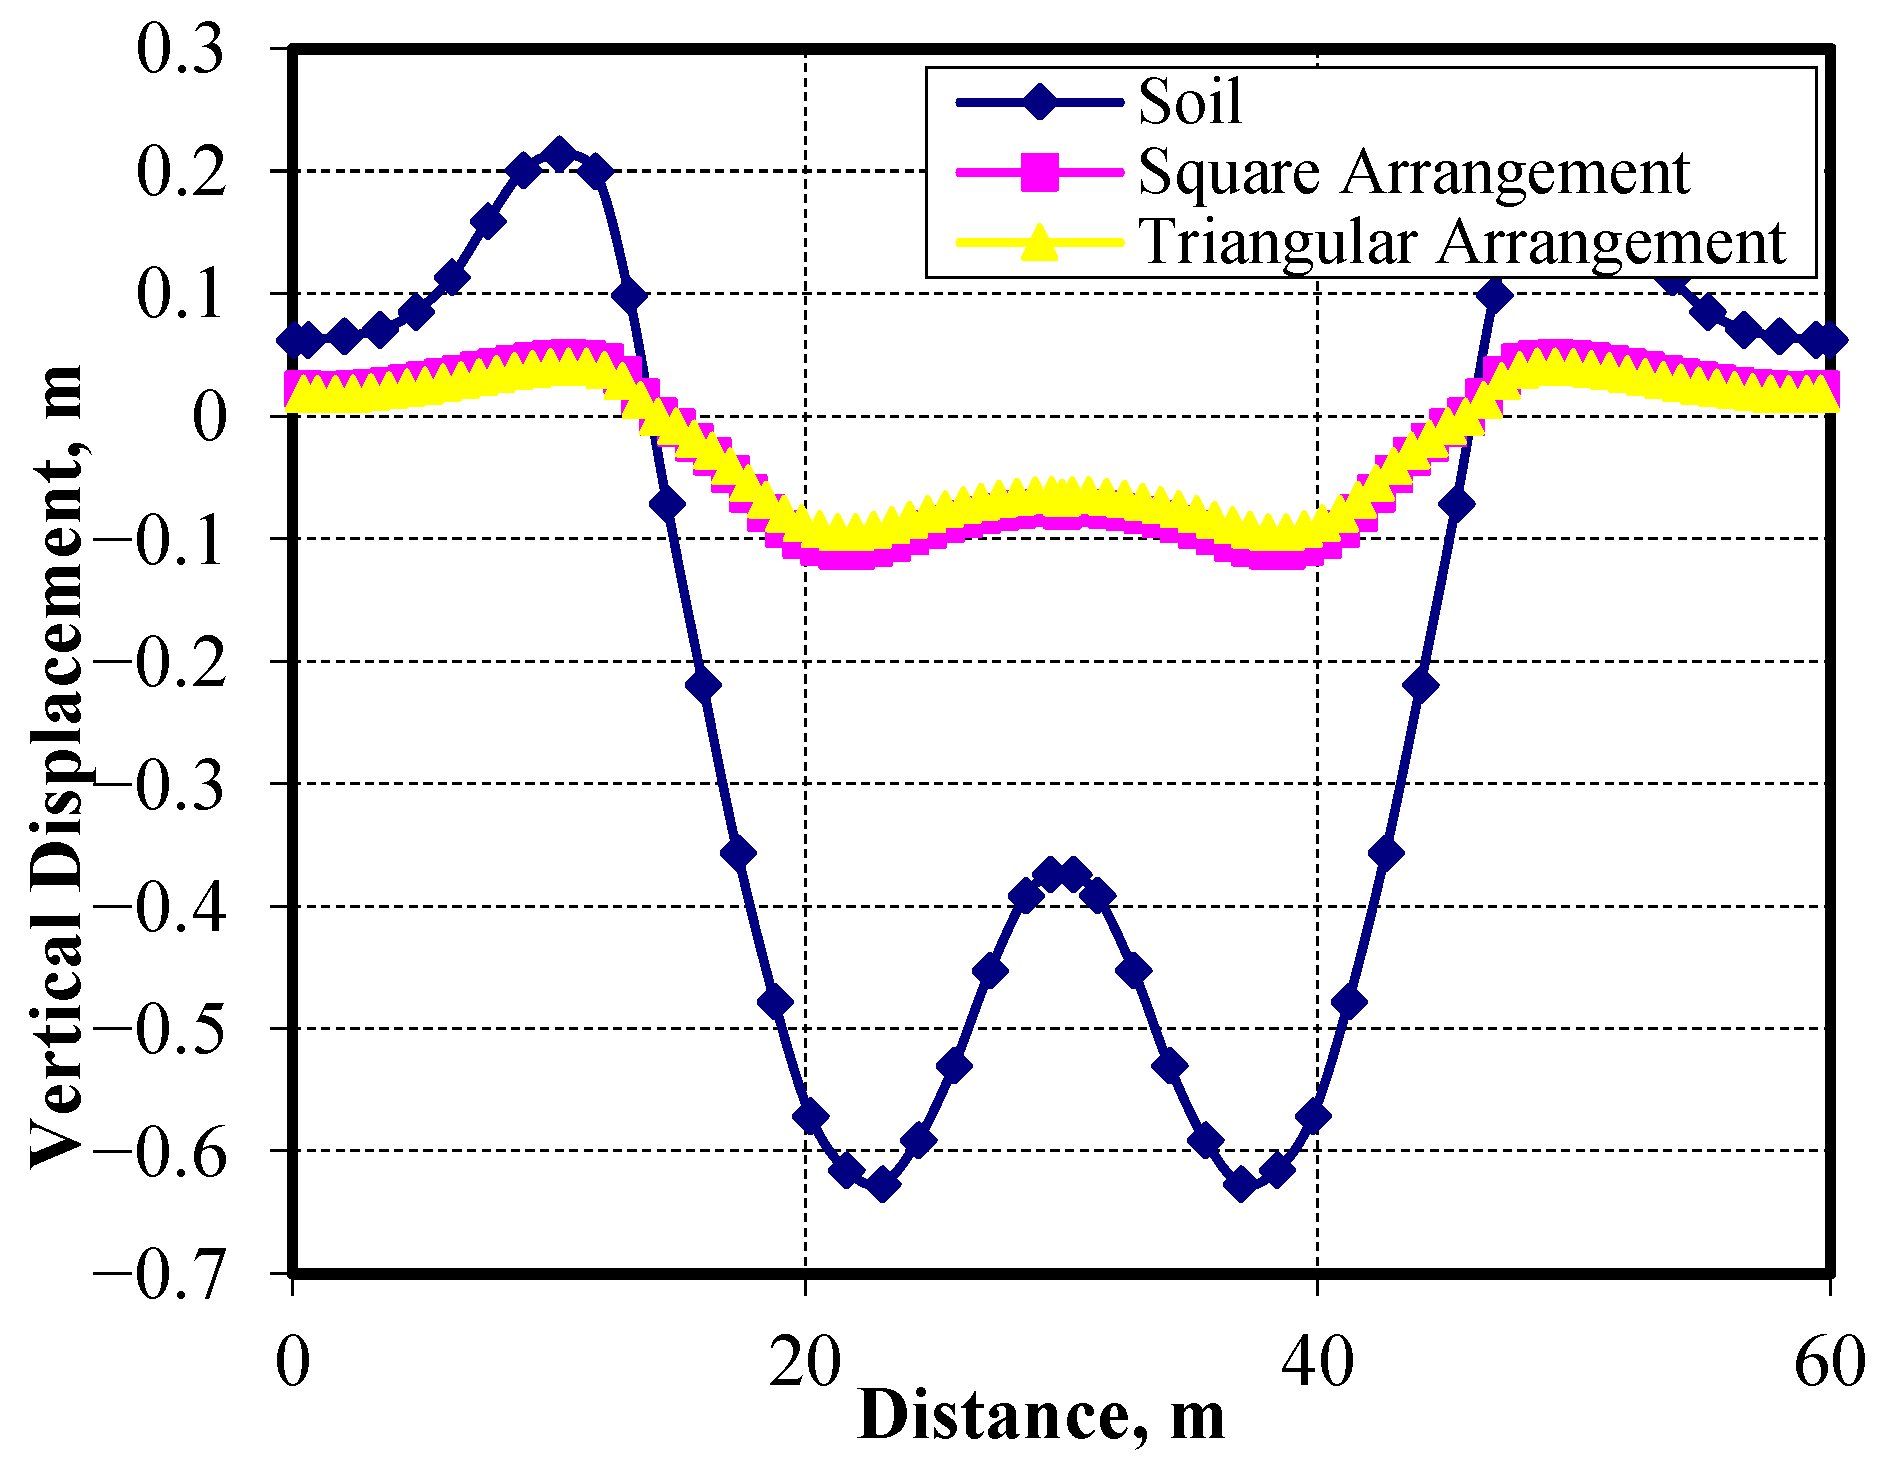
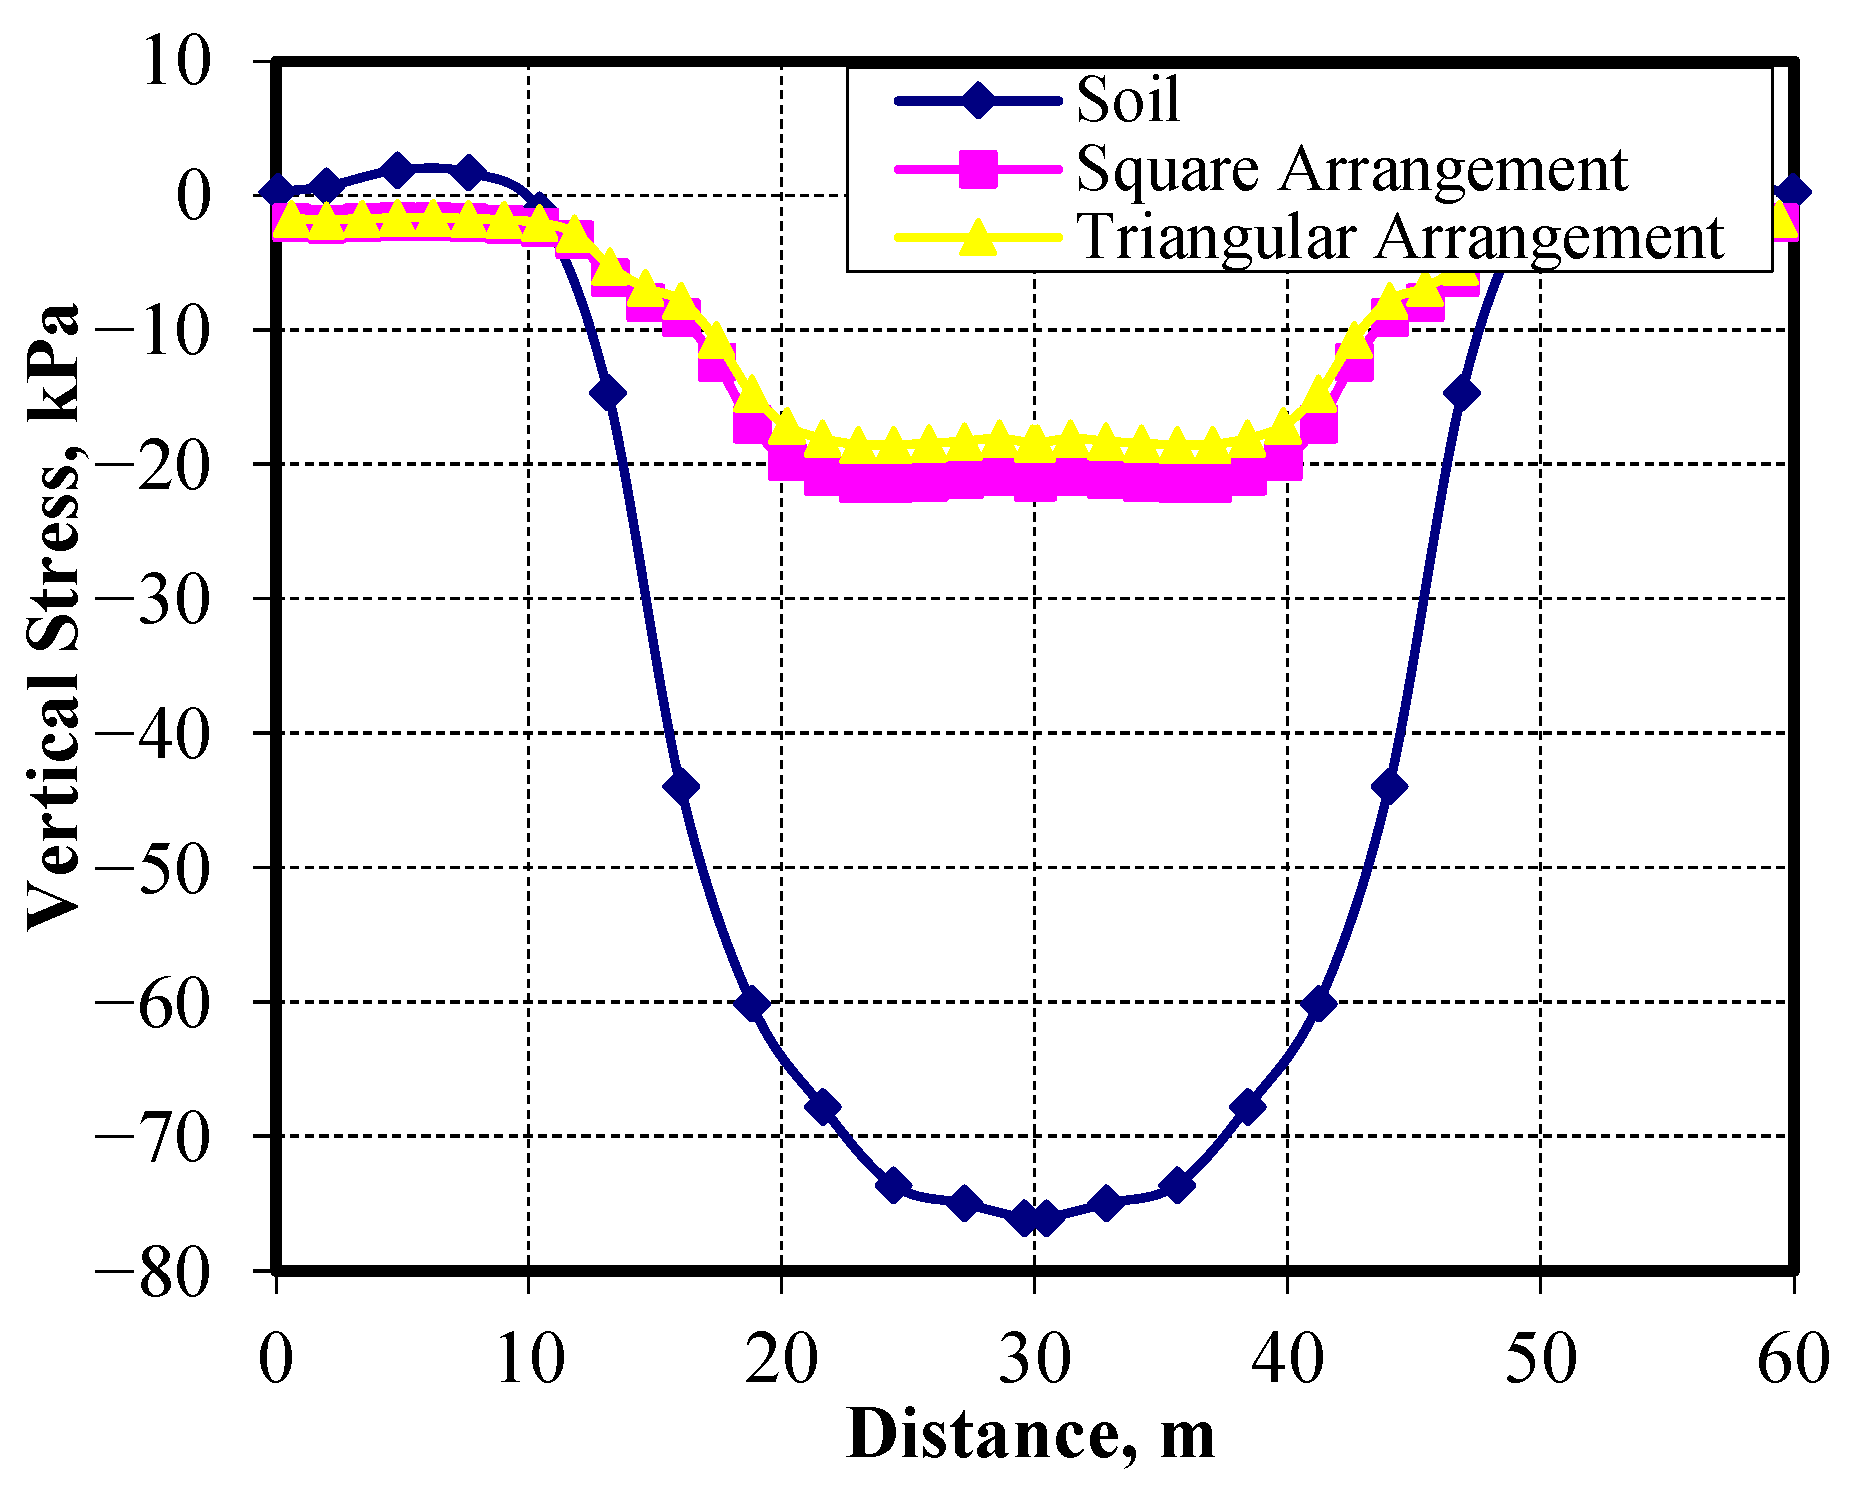
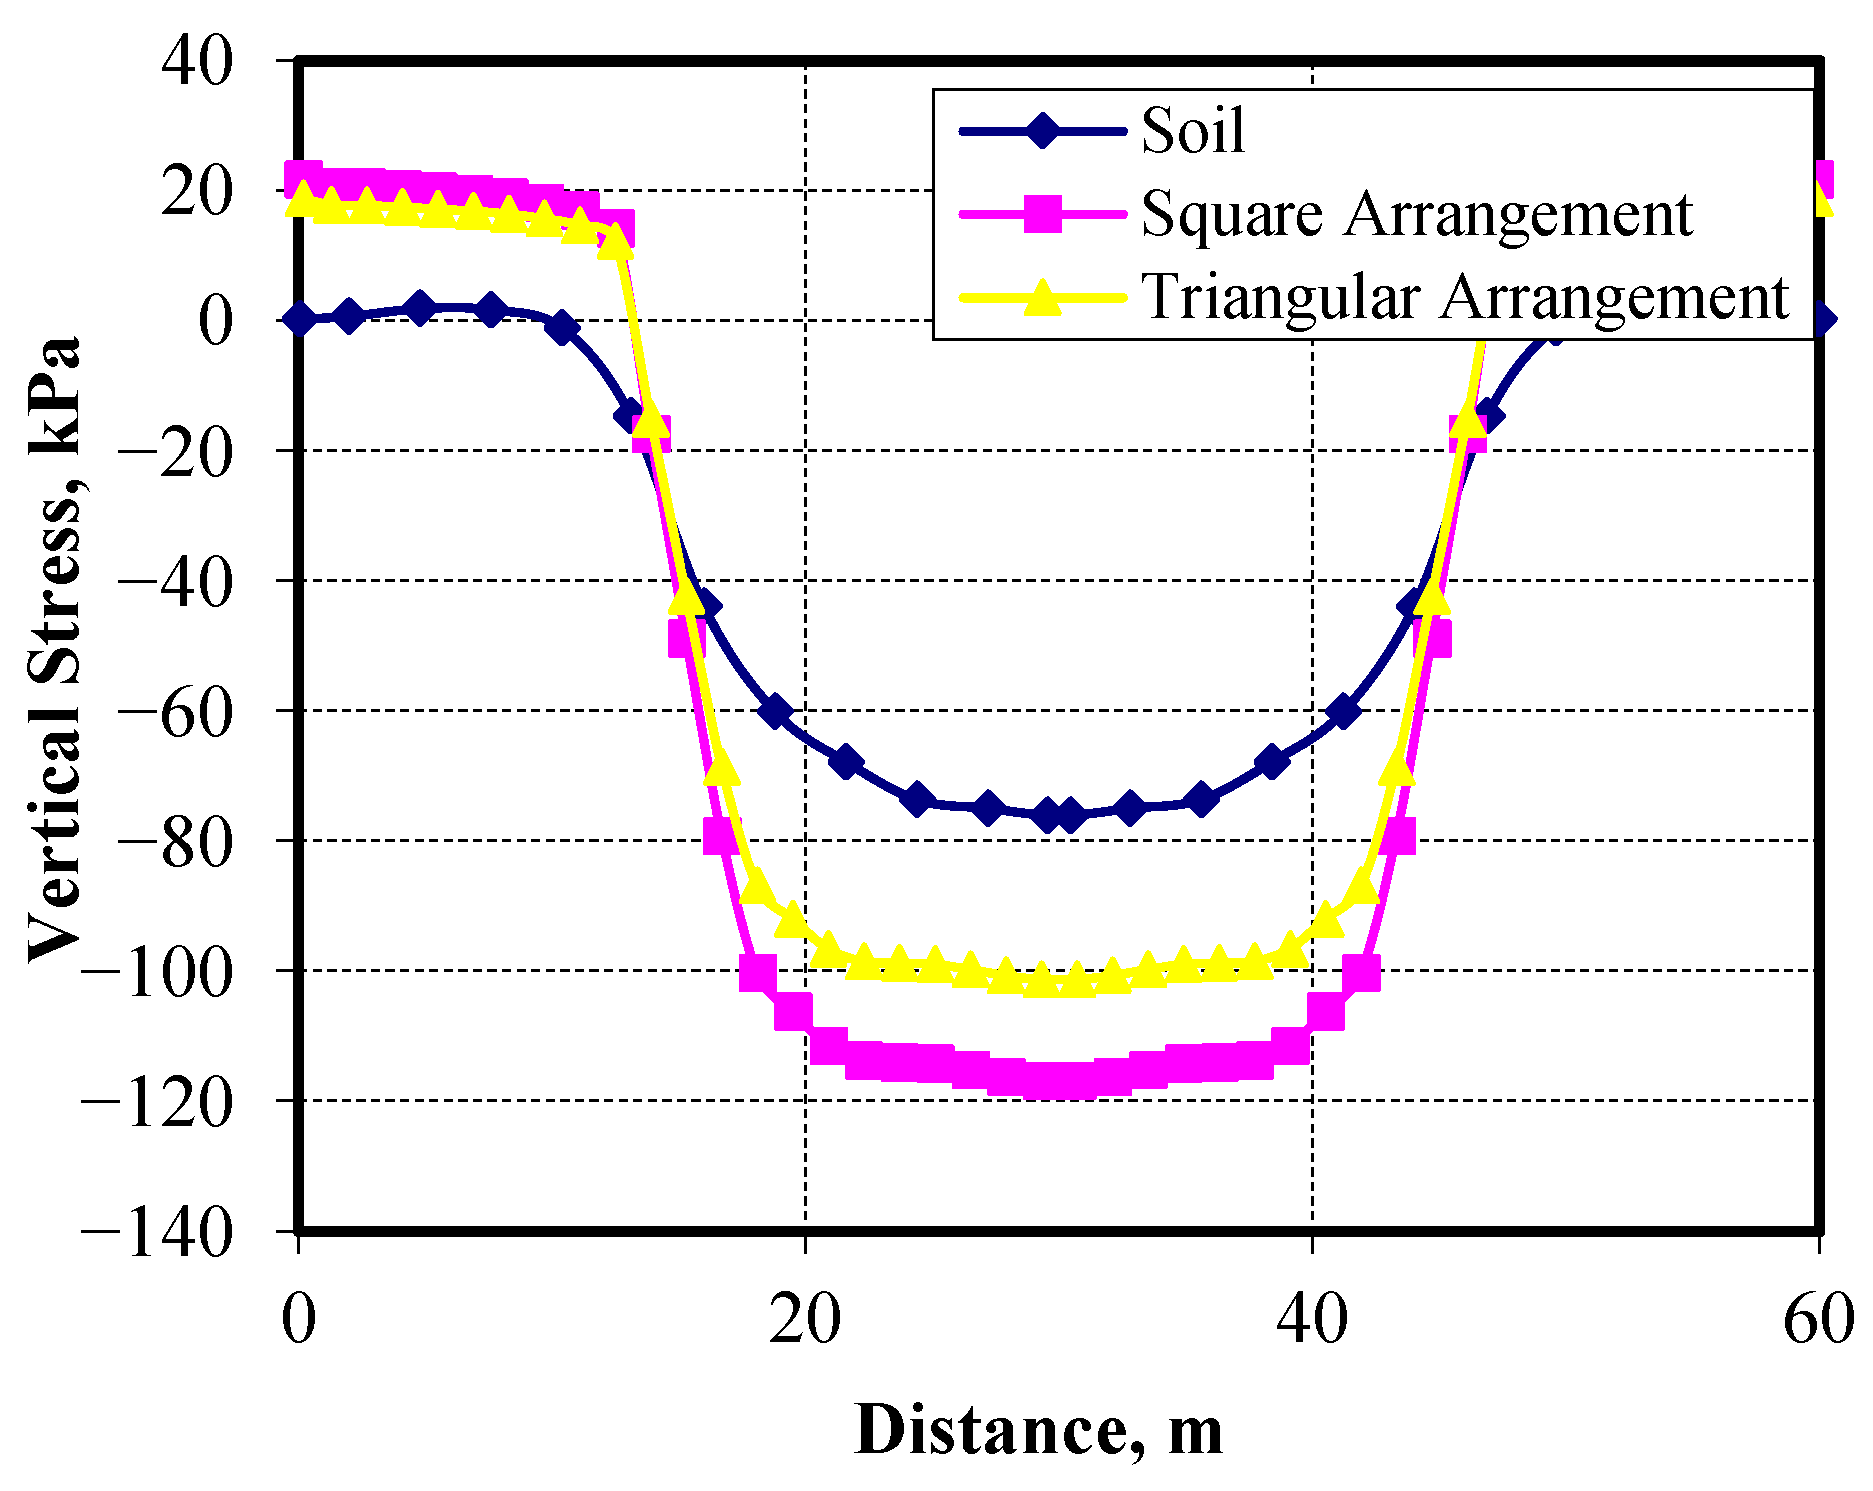
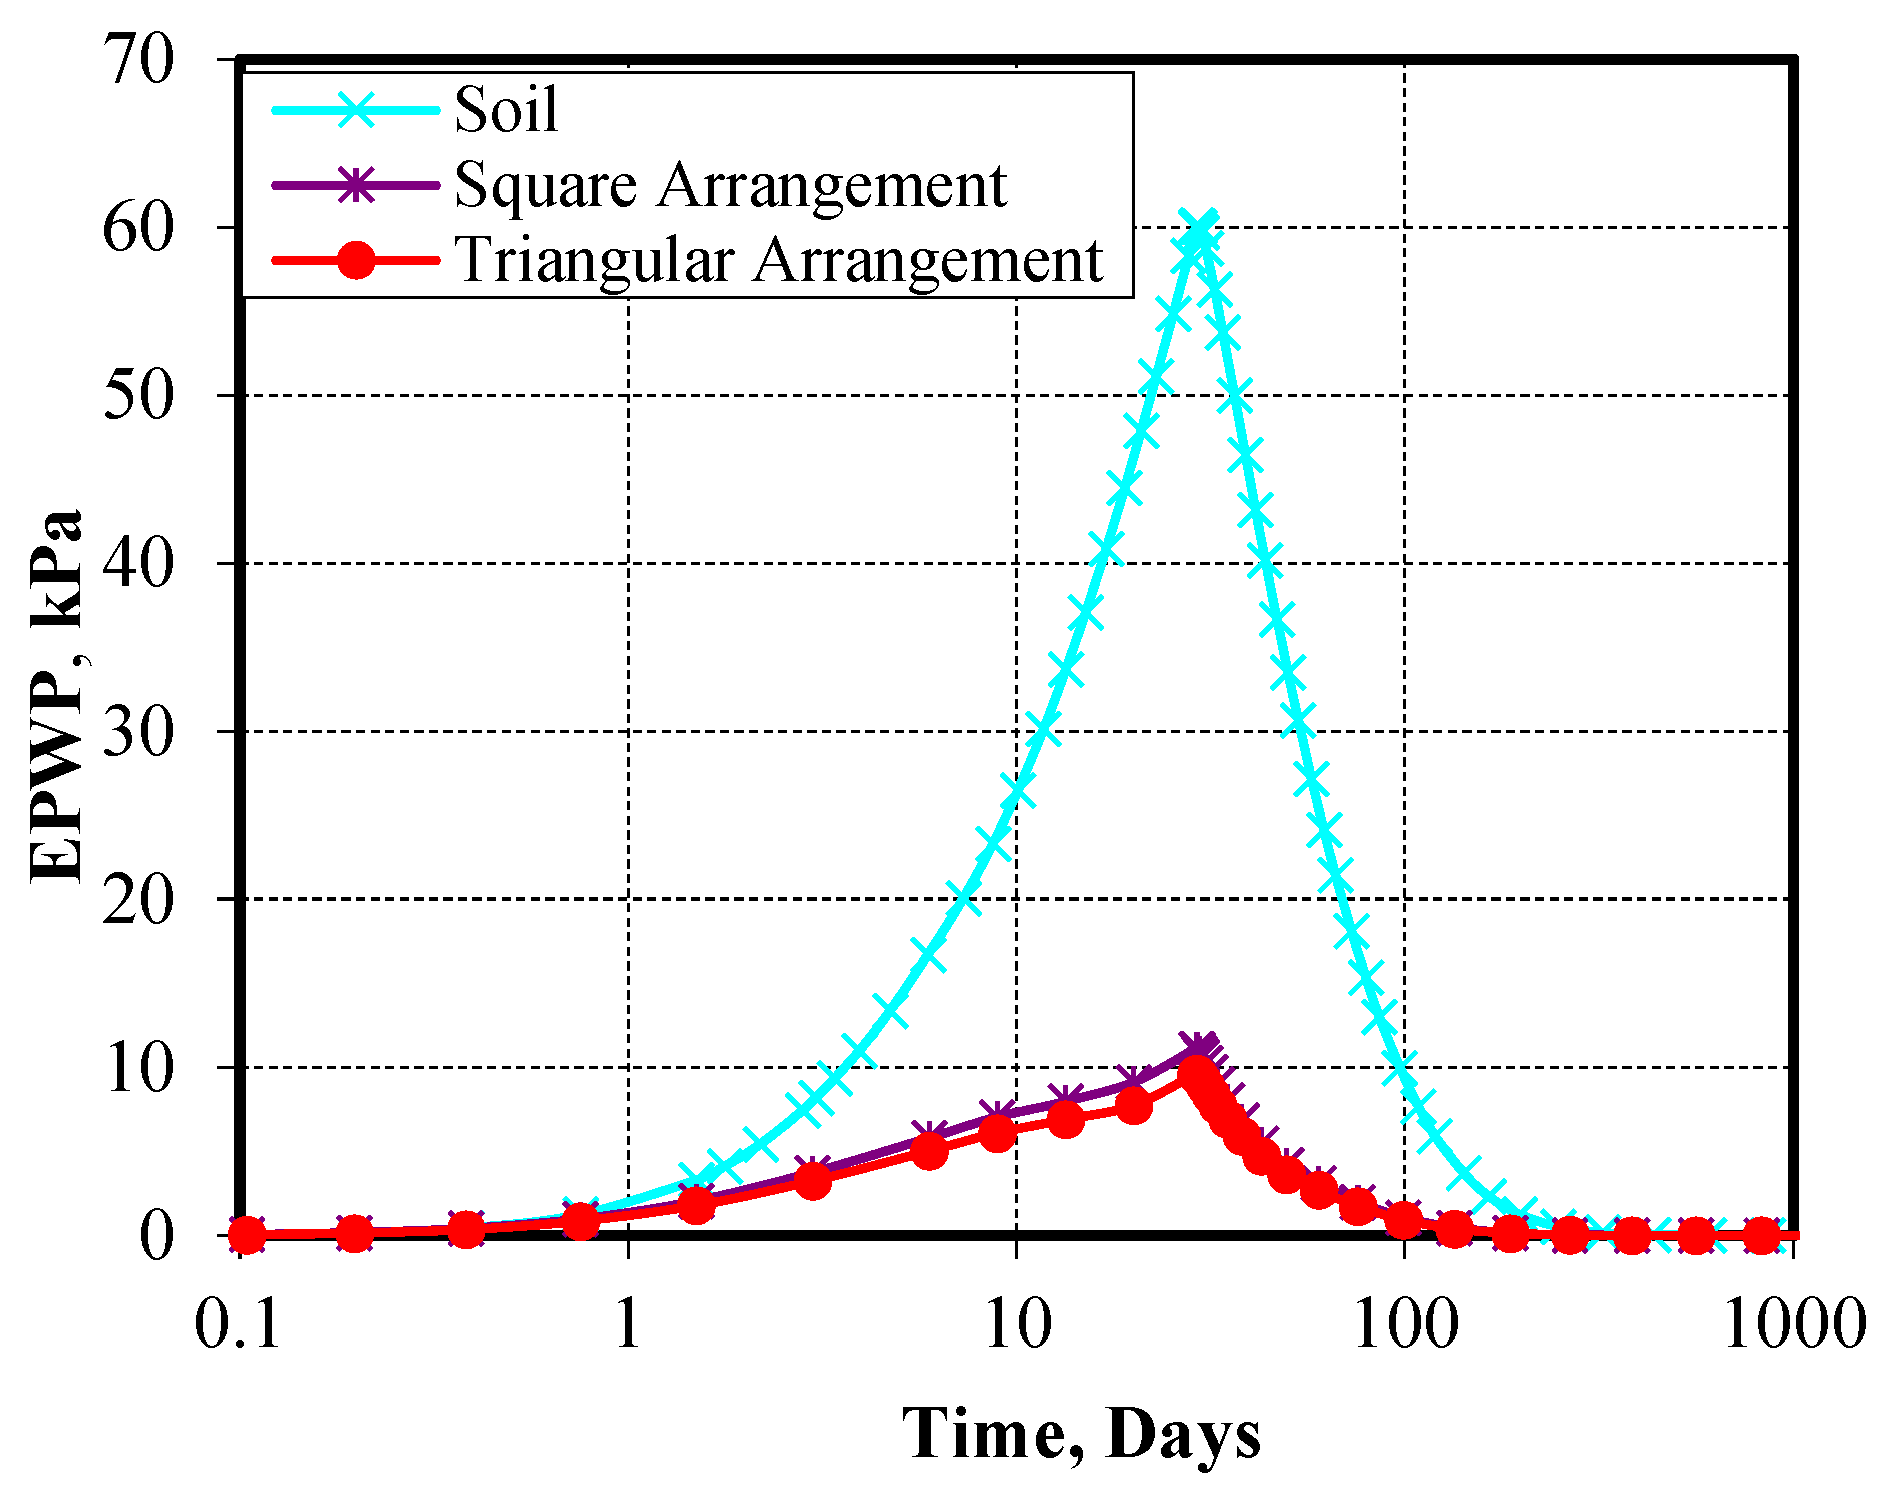
In the following section, the effect of the pattern of Pu-Foam piles under embankment is investigated through a series of 3D models by Abaqus software. The comparison is performed between a triangular pile arrangement and a square pile arrangement at the optimum dimensions of Pu-Foam and improved area ratio obtained from the previous analyses (Diameter = 1.0 m, L = 6.0 m, AE = 40%).
Figure 38 illustrates the calculated factor of safety of the slope for both triangular and square arrangements compared with the case of unimproved soil. It was found that both pile patterns showed a significant increase in the slope safety factor compared with the case of the untreated soil. The slope safety factor for triangular patterns was found to be 2.30, while it equaled 2.0 in the case of square patterns, with an increase of 15.0%.
Figure 39 and
Figure 40 present the vertical displacement and the vertical stresses at the top of the soft clay layer under the embankment, respectively. Both arrangements gave closely matched results compared with the case of the unimproved soil, while the transferred stresses at the pile head were found to be larger in the case of square patterns than in the triangular patterns, as shown in
Figure 41. Also, both patterns gave similar results of excess pore water pressures as shown in
Figure 42. In general, the results show that the triangular pattern is considered slightly more effective than the square pattern, and the choice of arrangement should be performed based on structural requirements and cost considerations.


