Article

Tensile Creep Behavior of PP/CF Wet-Laid Nonwoven Composite: Short-Term and Long-Term Creep Behavior

1
Guangzhou Institute of Advanced Technology, Haibin Road No. 1121, Nansha District, Guangzhou 510540, China
2
School of Electronics and Information Engineering, Foshan Polytechnic, Zhijiao Road No. 3, Sanshui Distrcit, Foshan 528137, China
*
Author to whom correspondence should be addressed.
Appl. Sci. 2025, 15(22), 12167; https://doi.org/10.3390/app152212167
Submission received: 18 September 2025 / Revised: 3 November 2025 / Accepted: 11 November 2025 / Published: 17 November 2025

Featured Application

The presented study systematically investigated the tensile creep behavior of a PP/CF nonwoven composite, providing a good reference for the long-term service performance of the composite.

Abstract

PP/CF wet-laid nonwoven composites have potential application in automotive secondary structural parts, but their long-term service behavior needs clarification. This paper investigated the effect of CF content, load, and interfacial enhancement on short-term creep behavior of the composite and plotted a master creep curve to study the long-term creep behavior. Short-term tests showed that creep resistance peaked at 30 vol% CF, higher loads reduced resistance, and interfacial enhancement improved it. The Findley and Burgers models fitted short-term curves well, with Burgers parameters reflecting intrinsic creep behavior. Creep master curves (reference temperature of 30 °C) of 30 vol% CF composites showed no rupture, indicating good long-term creep performance.

1. Introduction

Fiber-reinforced resin composites prepared by wet-laid nonwoven technology are referred to as wet-laid nonwoven composites. The preparation process of wet-laid nonwoven composites usually consists of two steps. In the first step, a wet-laid nonwoven preform is prepared, which involves using wet-laid nonwoven technology to fabricate reinforcing fibers and thermoplastic resin fibers into a wet-laid nonwoven preform. In the second step, compression molding is carried out; the preform is placed in a mold, the resin impregnates the fibers under the action of temperature and pressure, and after cooling, the wet-laid nonwoven composite is obtained.
The mechanical properties of wet-laid nonwoven composites make them suitable for manufacturing secondary structural load-bearing components [1], and they have application prospects in the automotive industry. To evaluate the application potential of wet-laid nonwoven composites as secondary structural load-bearing components, in addition to their quasi-static mechanical properties, their long-term mechanical properties need to be investigated to assess their long-term service performance as secondary structural load-bearing components. In our previous studies [2,3], we prepared a carbon fiber/polypropylene wet-laid nonwoven composite (PP/CF wet-laid nonwoven composite) and investigated its void elimination and interfacial enhancement, but the long-term mechanical properties of the composite have not been studied.
Therefore, the objective of the presented study is to evaluate the long-term mechanical properties. Specifically, this study will examine the effects of CF content, load level, and interfacial enhancement on the tensile creep behavior of PP/CF wet-laid nonwoven composites, and by utilizing the Time–Temperature Superposition Principle, construct the creep master curve of the material to study its long-term creep behavior.

2. Materials and Methods

2.1. Composite Preparation

The preparation process of PP/CF wet-laid nonwoven composites is the same as that in our previous study [4]. The compression molding temperature is 190 °C, and the compression molding time is 10 min. To minimize the void content of the samples, different compression molding pressures were employed for samples with different CF contents in this study. The compression molding pressures for samples with different CF contents are presented in Table 1.
To investigate the effect of interfacial enhancement on creep behavior, some composites were subjected to interfacial enhancement treatment in this study. Method B from our previous research [2] was selected as the interfacial enhancement scheme. This method can increase the interfacial shear strength from 1.98 MPa to 5.17 MPa.

2.2. Testing and Characterization

2.2.1. Short-Term Tensile Creep Behavior

To characterize the tensile creep behavior, the specimens were subjected to a fixed load while the creep strain–creep time curves were measured. The test method for short-term tensile creep refers to the standard GB/T 11546.1-2008 [5] Plastics—Determination of creep properties—Part 1: Tensile creep. In this study, a universal testing machine (LD23, manufactured by LISHI from Shanghai, China, sourced from our own lab) was used to test the short-term tensile creep behavior of the prepared composites, and an electronic extensometer (YYU-5/20, manufactured by NCS from Beijing China, sourced from our own lab) was employed to measure the real-time strain of the specimens. The dimensions of the specimens are 100 mm × 10 mm × 2 mm, and the creep time is 5400 s. The testing was conducted under room temperature and a relative humidity of 50%.
It should be noted that three different load levels—10 MPa, 20 MPa, and 40 MPa—were applied during the short-term tensile creep tests in this study. According to Table S1 in the Supplementary Materials, all these load levels are lower than the tensile strength of the prepared composite material, thus ensuring that the creep response remains within the elastic creep regime.

2.2.2. Long-Term Tensile Creep Behavior Test Method

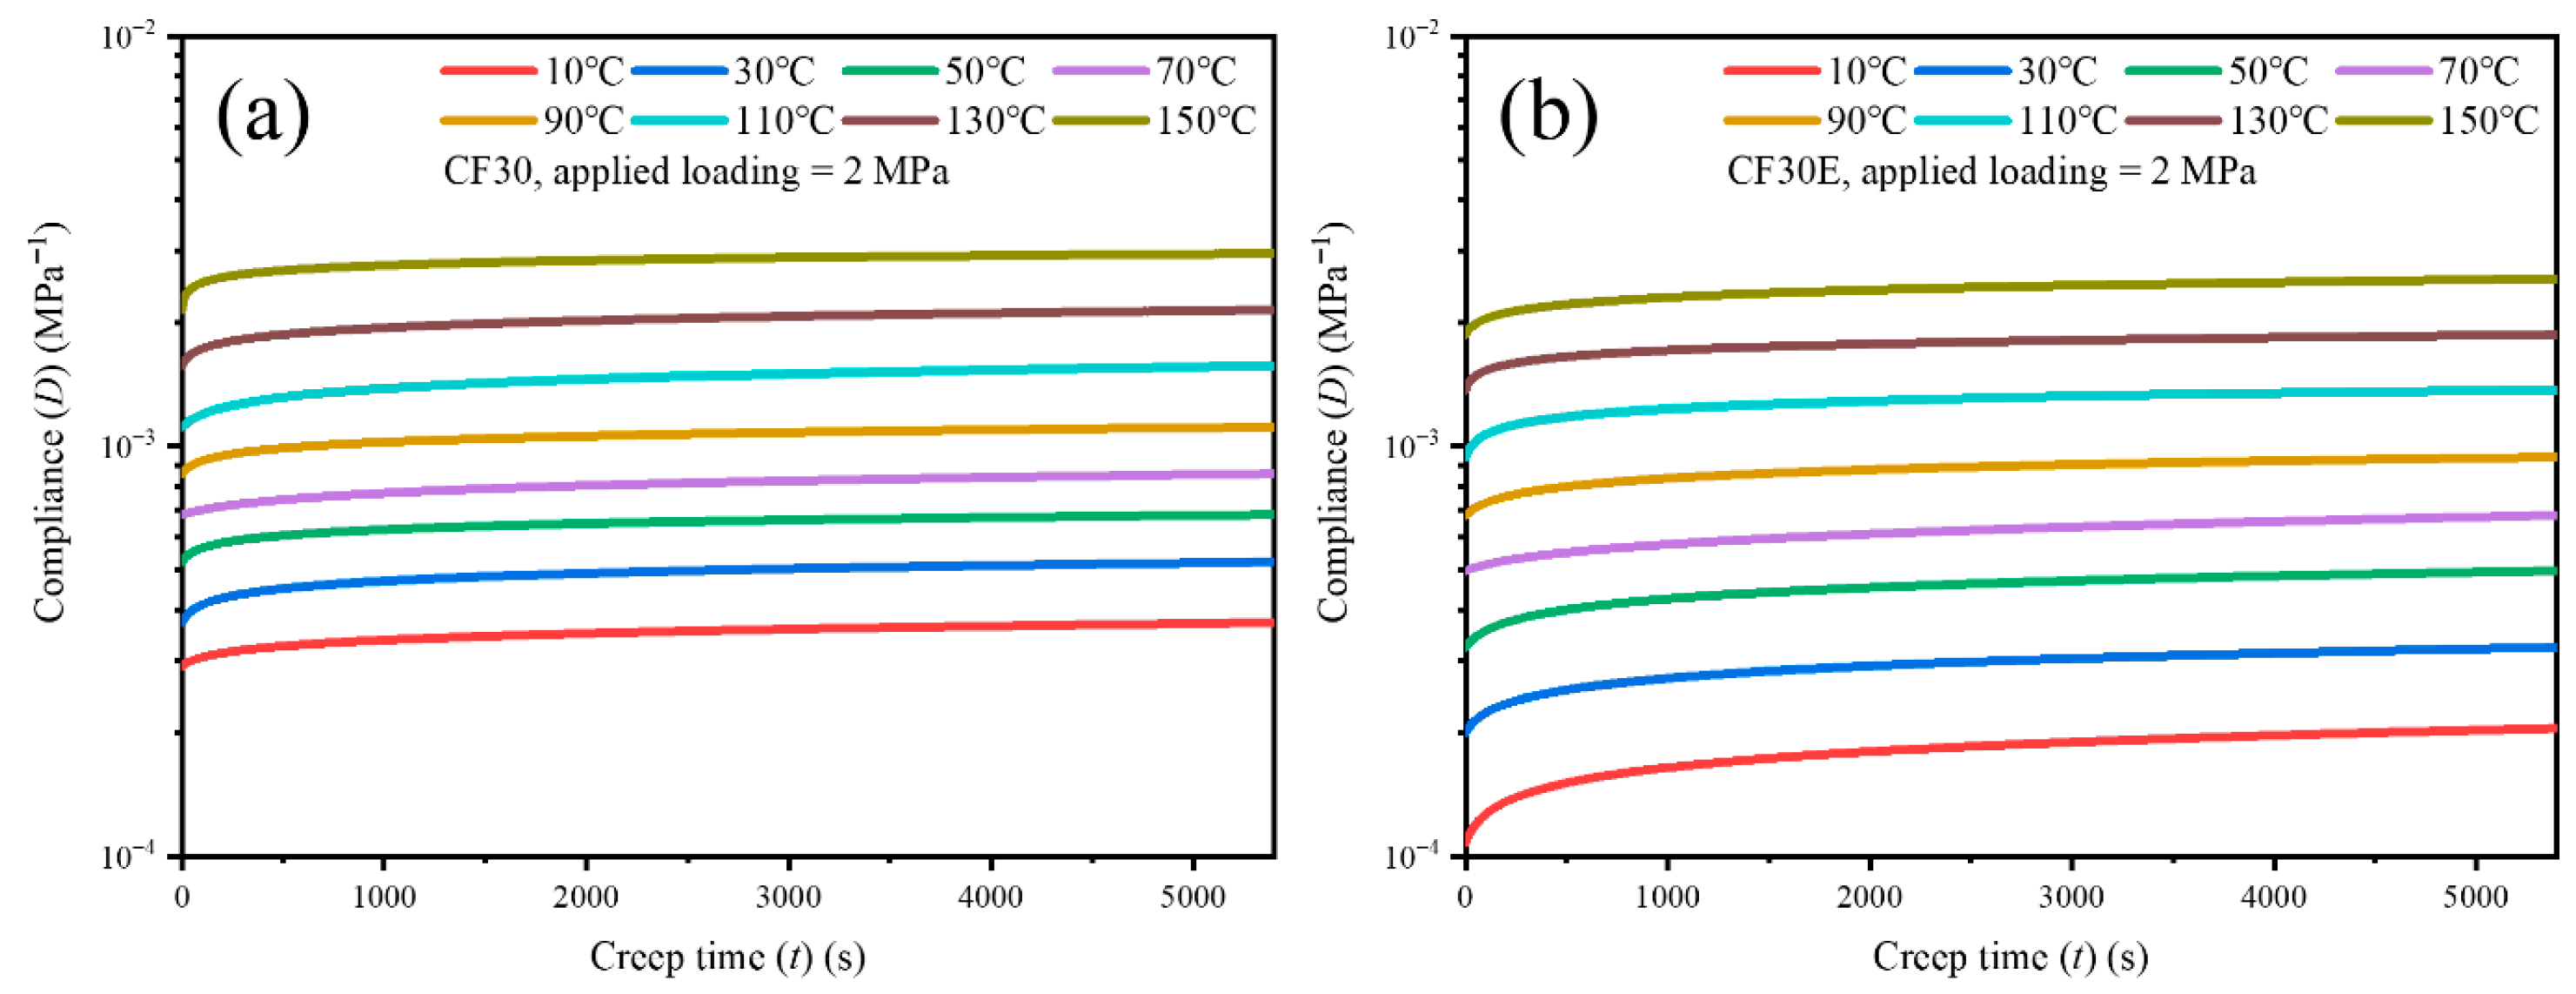
In this study, the Time–Temperature Superposition Principle was used to investigate the long-term tensile creep behavior of the prepared composites. For this purpose, a Dynamic Mechanical Analyzer (DMA) was utilized to obtain the isothermal tensile creep curves of the material at different temperatures. As in the short-term creep behavior test, the specimens were subjected to a fixed load while the creep strain–creep time curves were measured. The experimental scheme for the isothermal tensile creep test is listed in Table 2.
Based on the Time–Temperature Superposition Principle, the creep master curve of the composite at a reference temperature of 30 °C was obtained by shifting the isothermal tensile creep curves. To study the shift factor, dynamic mechanical tests were conducted on the material using the three-point bending mode of DMA to determine the glass transition temperature (Tg). The dimensions of the specimens for dynamic mechanical tests are 40 mm × 10 mm × 2 mm, with a heating rate of 3 K/min and alternating stress frequencies of 1, 3.33, 10, and 33.3 Hz

2.2.3. Void Content Test Method

We measured the void content of the composite using the Archimedes method. This involved first calculating the theoretical density of the composite and then determining its actual density using a density balance. The void content of the composite was obtained by comparing the theoretical density with the actual density. The void content of the composites was tested in accordance with the standard ASTM D 2584 [6]. The theoretical density (ρt) of the composites can be calculated using the following formula:
ρ t = V f ρ f + ( 1 V f ) ρ m
In accordance with the standard ASTM D2734 [7], the void content (Xv) of the composites can be calculated using the following formula:
X v = 100 % × ( ρ t ρ a ) / ρ t  
where ρa is the actual density of the composites measured by a density balance. All sample preparations were performed in three parallel experiments to calculate the average value and standard deviation of the void content data.

3. Results and Discussions

3.1. Void Content

Figure 1 shows the void content of composites with different CF contents. It can be observed that the void content increases with the increase in CF content. Previous studies [3] have indicated that the elimination of voids in PP/CF wet-laid nonwoven composites primarily relies on the compression of the impregnated CF network. Therefore, composites with higher CF content have a more fluffy impregnated CF network structure, resulting in higher void content.

3.2. Short-Term Creep Behavior

3.2.1. Effect of CF Content on Short-Term Tensile Creep Behavior

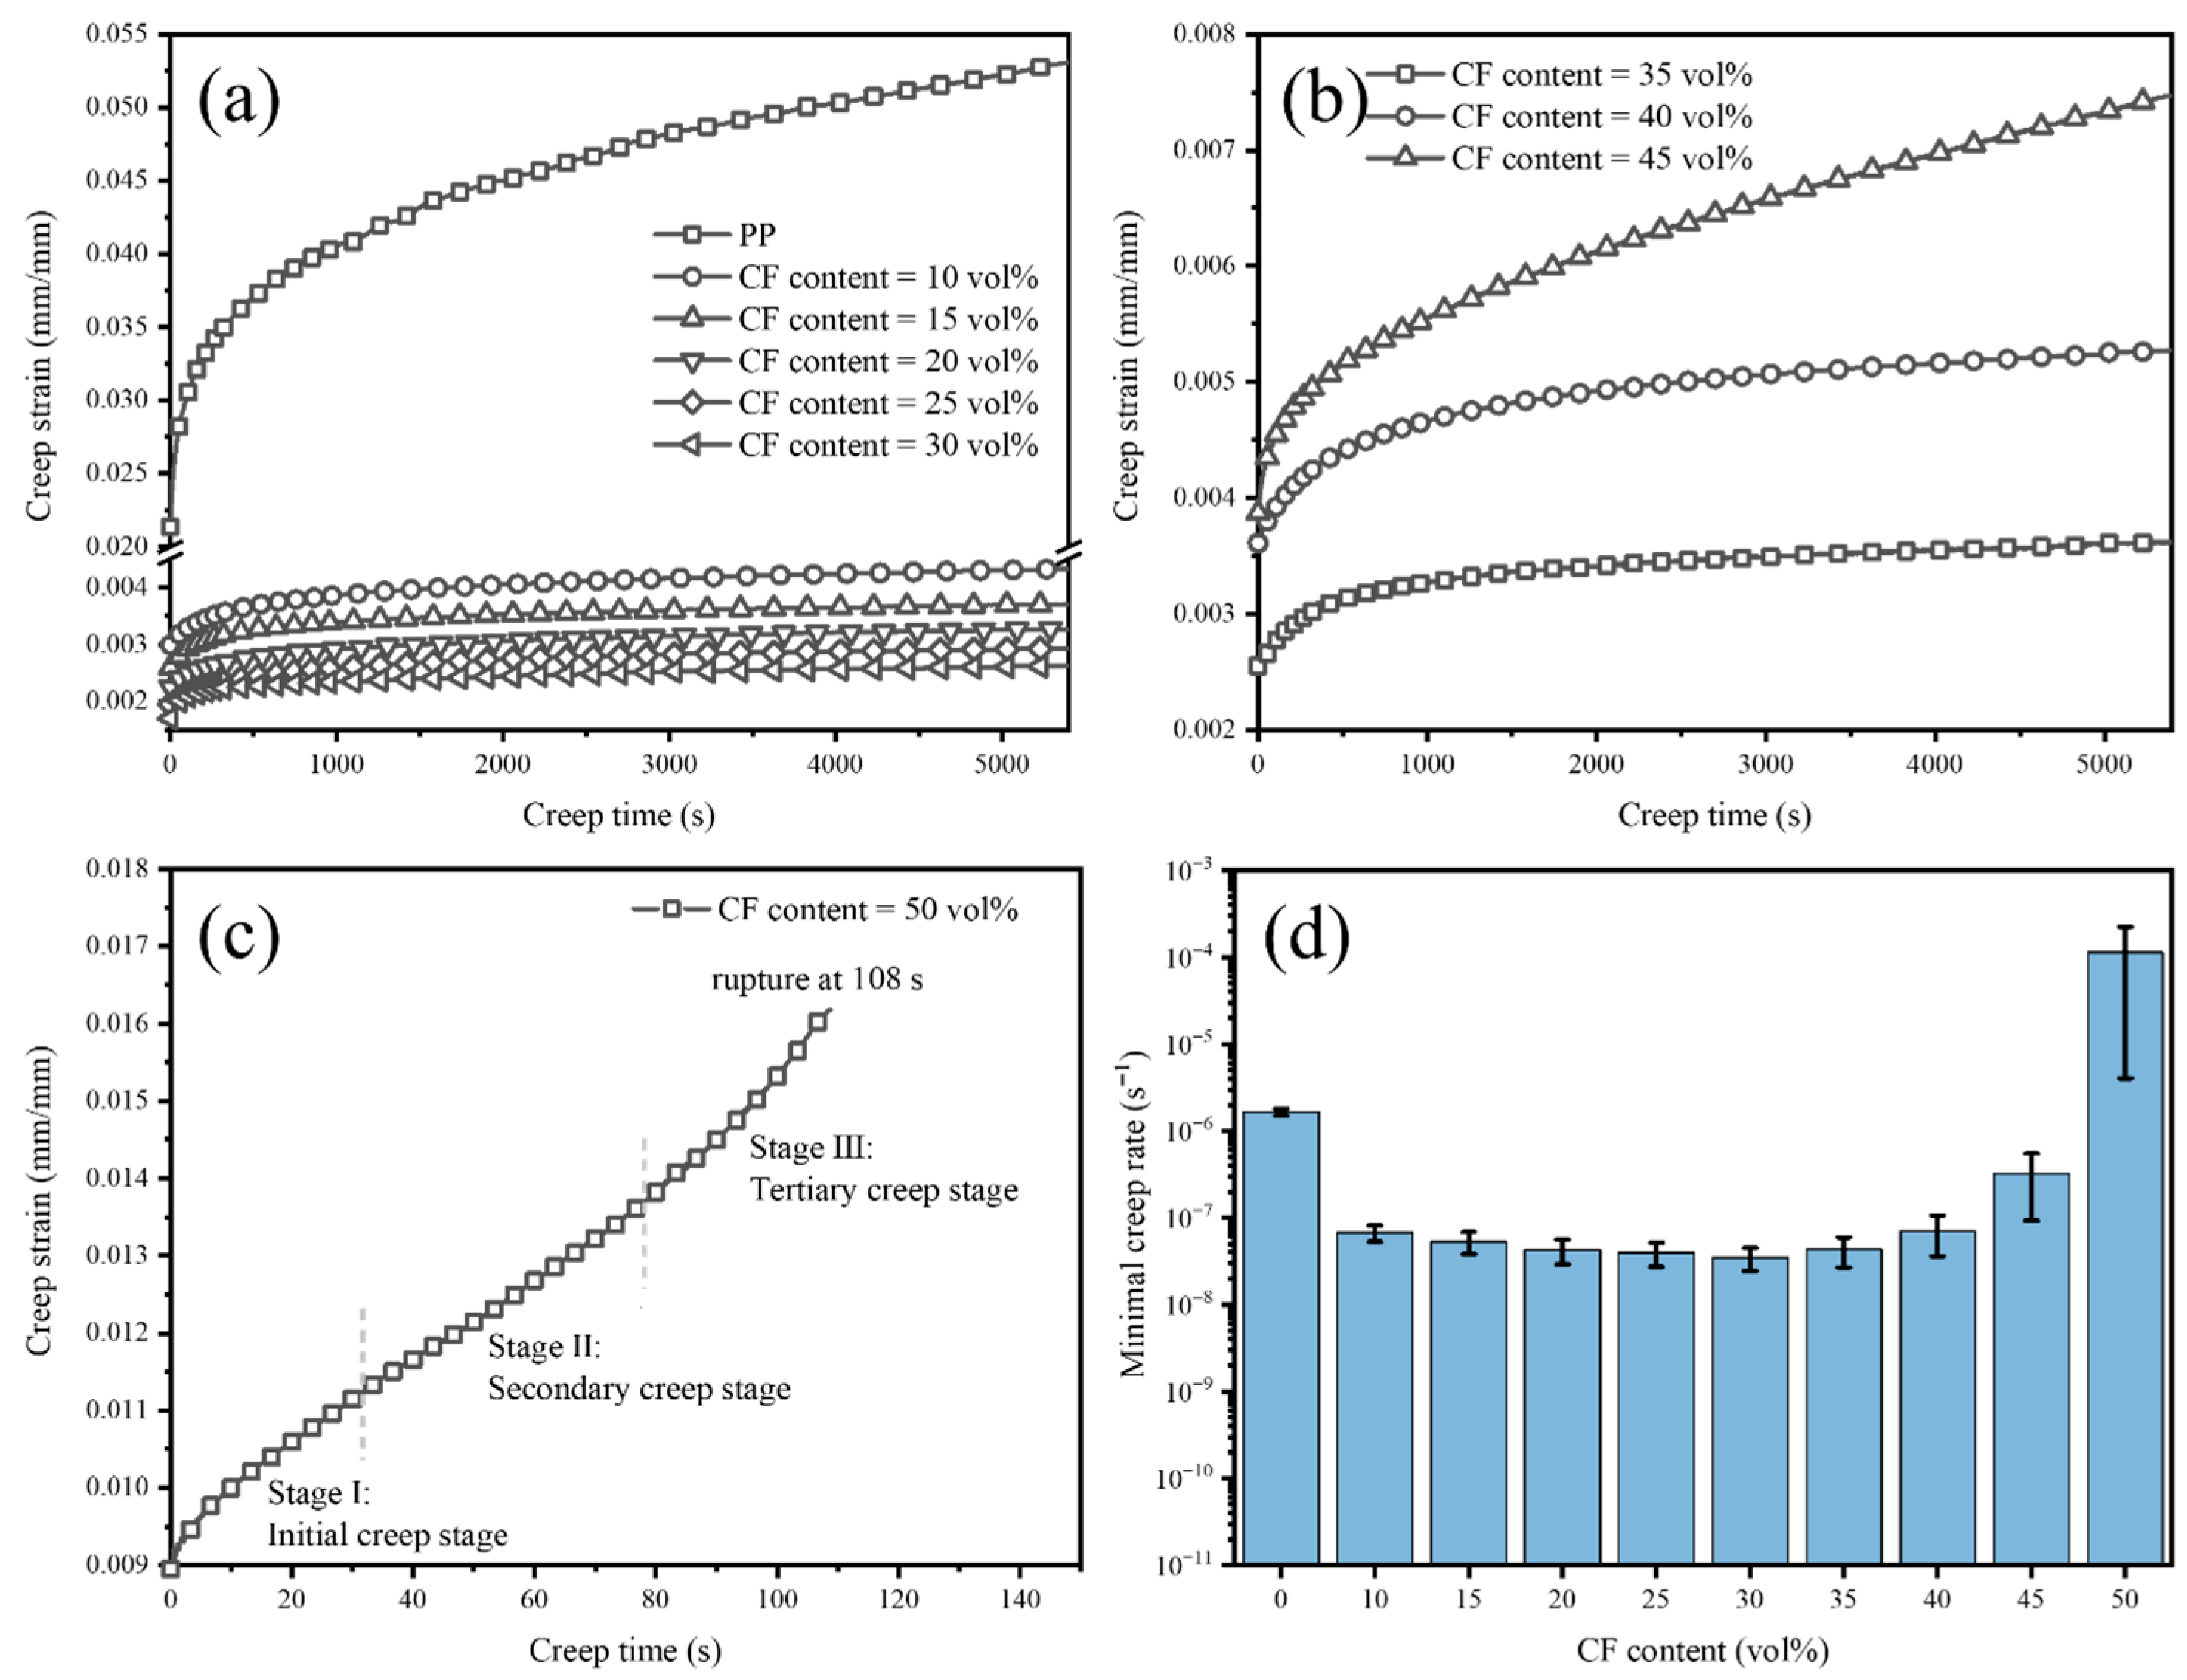
Figure 2 presents the representative short-term tensile creep curves of composites with different CF contents and the effect of CF content on the minimum creep rate of PP/CF wet-laid nonwoven composites. The load for the short-term tensile creep test is 20 MPa.
In general, creep can be divided into three stages [8]: Stage I, the primary stage; Stage II, the secondary (steady-state) creep stage, during which the creep strain increases steadily and the creep rate remains constant; and Stage III, the tertiary creep stage, where the creep strain increases rapidly, the creep rate rises sharply, and finally, fracture occurs. It can be seen from Figure 2a–c that the composite with 50 vol% CF content fractured during the tensile creep test, and its short-term tensile creep curve exhibits typical three-stage characteristics. Except for the sample with 50 vol% CF content, the other samples did not fracture during the test; thus, their short-term tensile creep curves only show the primary stage and the steady-state creep stage.
Next, the effect of CF content on short-term tensile creep behavior was examined. In Figure 2a–c, by comparing the creep curves and minimum creep rates of PP resin and the composites, it can be observed that the introduction of CF into the resin significantly reduces the minimum creep rate of the material, i.e., increases its creep resistance [9]. This is because the introduction of CF hinders the sliding of PP resin molecular chains, thereby enhancing creep resistance. In Figure 2d, with the further increase in CF content (i.e., the addition of more rigid CF), the sliding of PP resin molecular chains becomes increasingly difficult; therefore, when the CF content increases from 10 vol% to 30 vol%, the minimum creep rate of the composite decreases continuously, showing increasingly strong creep resistance. However, a further increase in CF content does not necessarily lead to a continuous increase in the creep resistance of the composite. As the CF content increases from 30 vol% to 50 vol%, the minimum creep rate of the PP/CF wet-laid nonwoven composite increases continuously, indicating increasingly weak creep resistance, as shown in Figure 2d; even at a creep time of 108 s, the composite with 50 vol% CF content undergoes creep rupture, as shown in Figure 2c. This is because when the CF content increases from 30 vol% to 50 vol%, the void content of the composite also increases gradually; the increase in void content reduces the creep resistance of the composite [4,10]. Meanwhile, as the CF content increases from 30 vol% to 50 vol%, the minimum creep rate of the composite also shows increasing instability, manifesting as the instability of creep behavior. This is due to the gradual decrease in the dispersion uniformity of CF with the increase in CF content [11].
It can be concluded that when the CF content is 30 vol%, the PP/CF wet-laid nonwoven composite exhibits the best creep resistance (i.e., the lowest minimum creep rate). In addition, at a CF content of 30 vol%, the composite also has good stability of creep behavior. Therefore, in the subsequent part of this study, the composite with 30 vol% CF content was selected as the specific research object to further investigate the effects of load level and interfacial enhancement on short-term tensile creep behavior. To study the effect of interfacial enhancement on the creep behavior of PP/CF wet-laid nonwoven composites, two types of composites with 30 vol% CF content were prepared in this study; the composite without interfacial enhancement was denoted as CF30 and the one with interfacial enhancement was denoted as CF30E. The interfacial enhancement method adopted Method B from the previous study [2], which can increase the interfacial shear strength from 1.98 MPa to 5.17 MPa.

3.2.2. Effects of Load Level and Interfacial Enhancement on Short-Term Tensile Creep Behavior

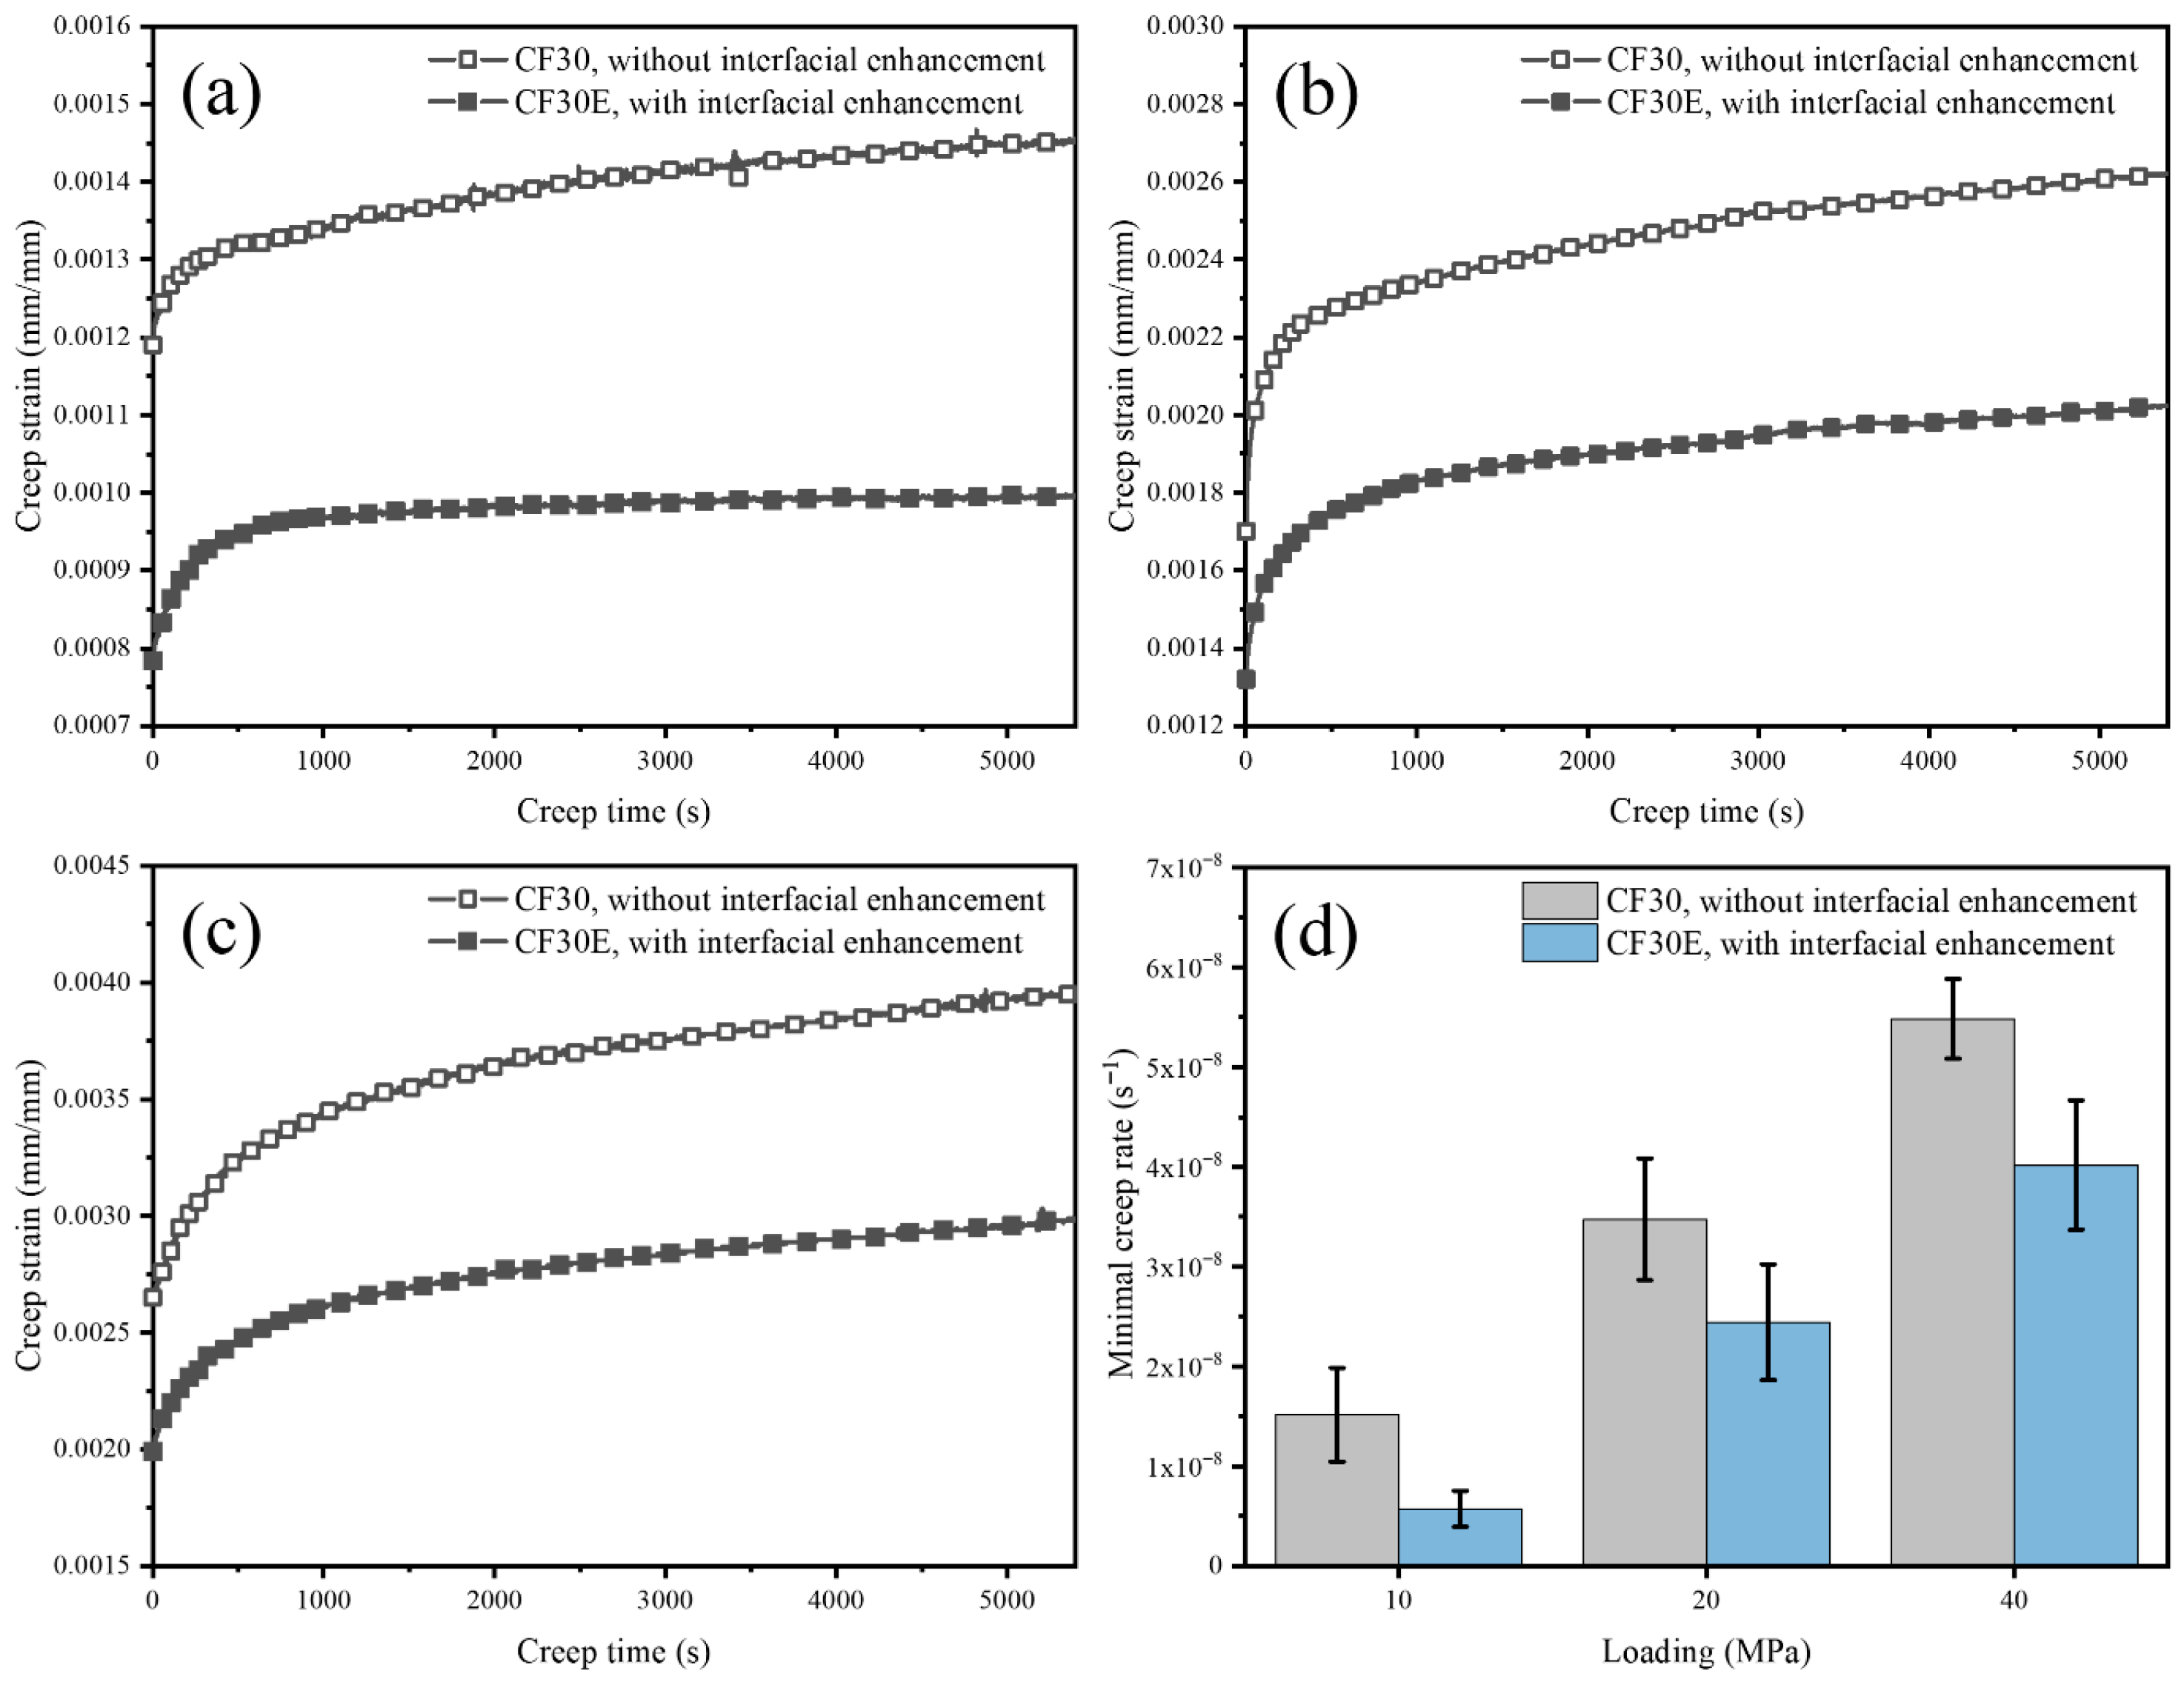
Figure 3 shows the representative short-term tensile creep behavior of CF30 and CF30E under different load levels and interfacial conditions. Firstly, neither CF30 nor CF30E experienced creep rupture during the test, so the creep curves presented only show the primary creep stage and the steady-state creep stage, as shown in Figure 3a–c. Secondly, in Figure 3d, it can be clearly observed that with the increase in load level, the creep resistance of both CF30 and CF30E decreases, which is reflected by the increase in the minimum creep rate. This is because the creep of resin matrix composites is mainly caused by the resin matrix; increasing the load level can promote the movement of resin molecular chains, thereby facilitating the occurrence of creep [12]. Meanwhile, in Figure 3d, it can also be observed that interfacial enhancement can significantly improve the creep resistance of the composite; the minimum creep rate of CF30E is lower than that of CF30. This is because better resin–fiber interfacial bonding enables CF to more effectively hinder the sliding of resin molecular chains, thereby enhancing the creep resistance of the composite [13].

3.2.3. Fitting of Short-Term Tensile Creep Curves

To describe the creep behavior of materials, researchers usually use creep models to fit the measured creep curves. Among them, the simplest and most commonly used is the Findley empirical model [14]:
ε t = ε 0 + A t n  
D t = ε t σ a = D 0 + A σ a t n
where ε(t) and D(t) are the creep strain and creep compliance varying with time, t is the creep time, ε0 is the instantaneous creep strain, D0 is the instantaneous creep compliance, σa is the load applied in the creep test, and A and n are material constants. Due to its simplicity and ease of fitting, the Findley model is one of the commonly used models for fitting the creep behavior of materials.
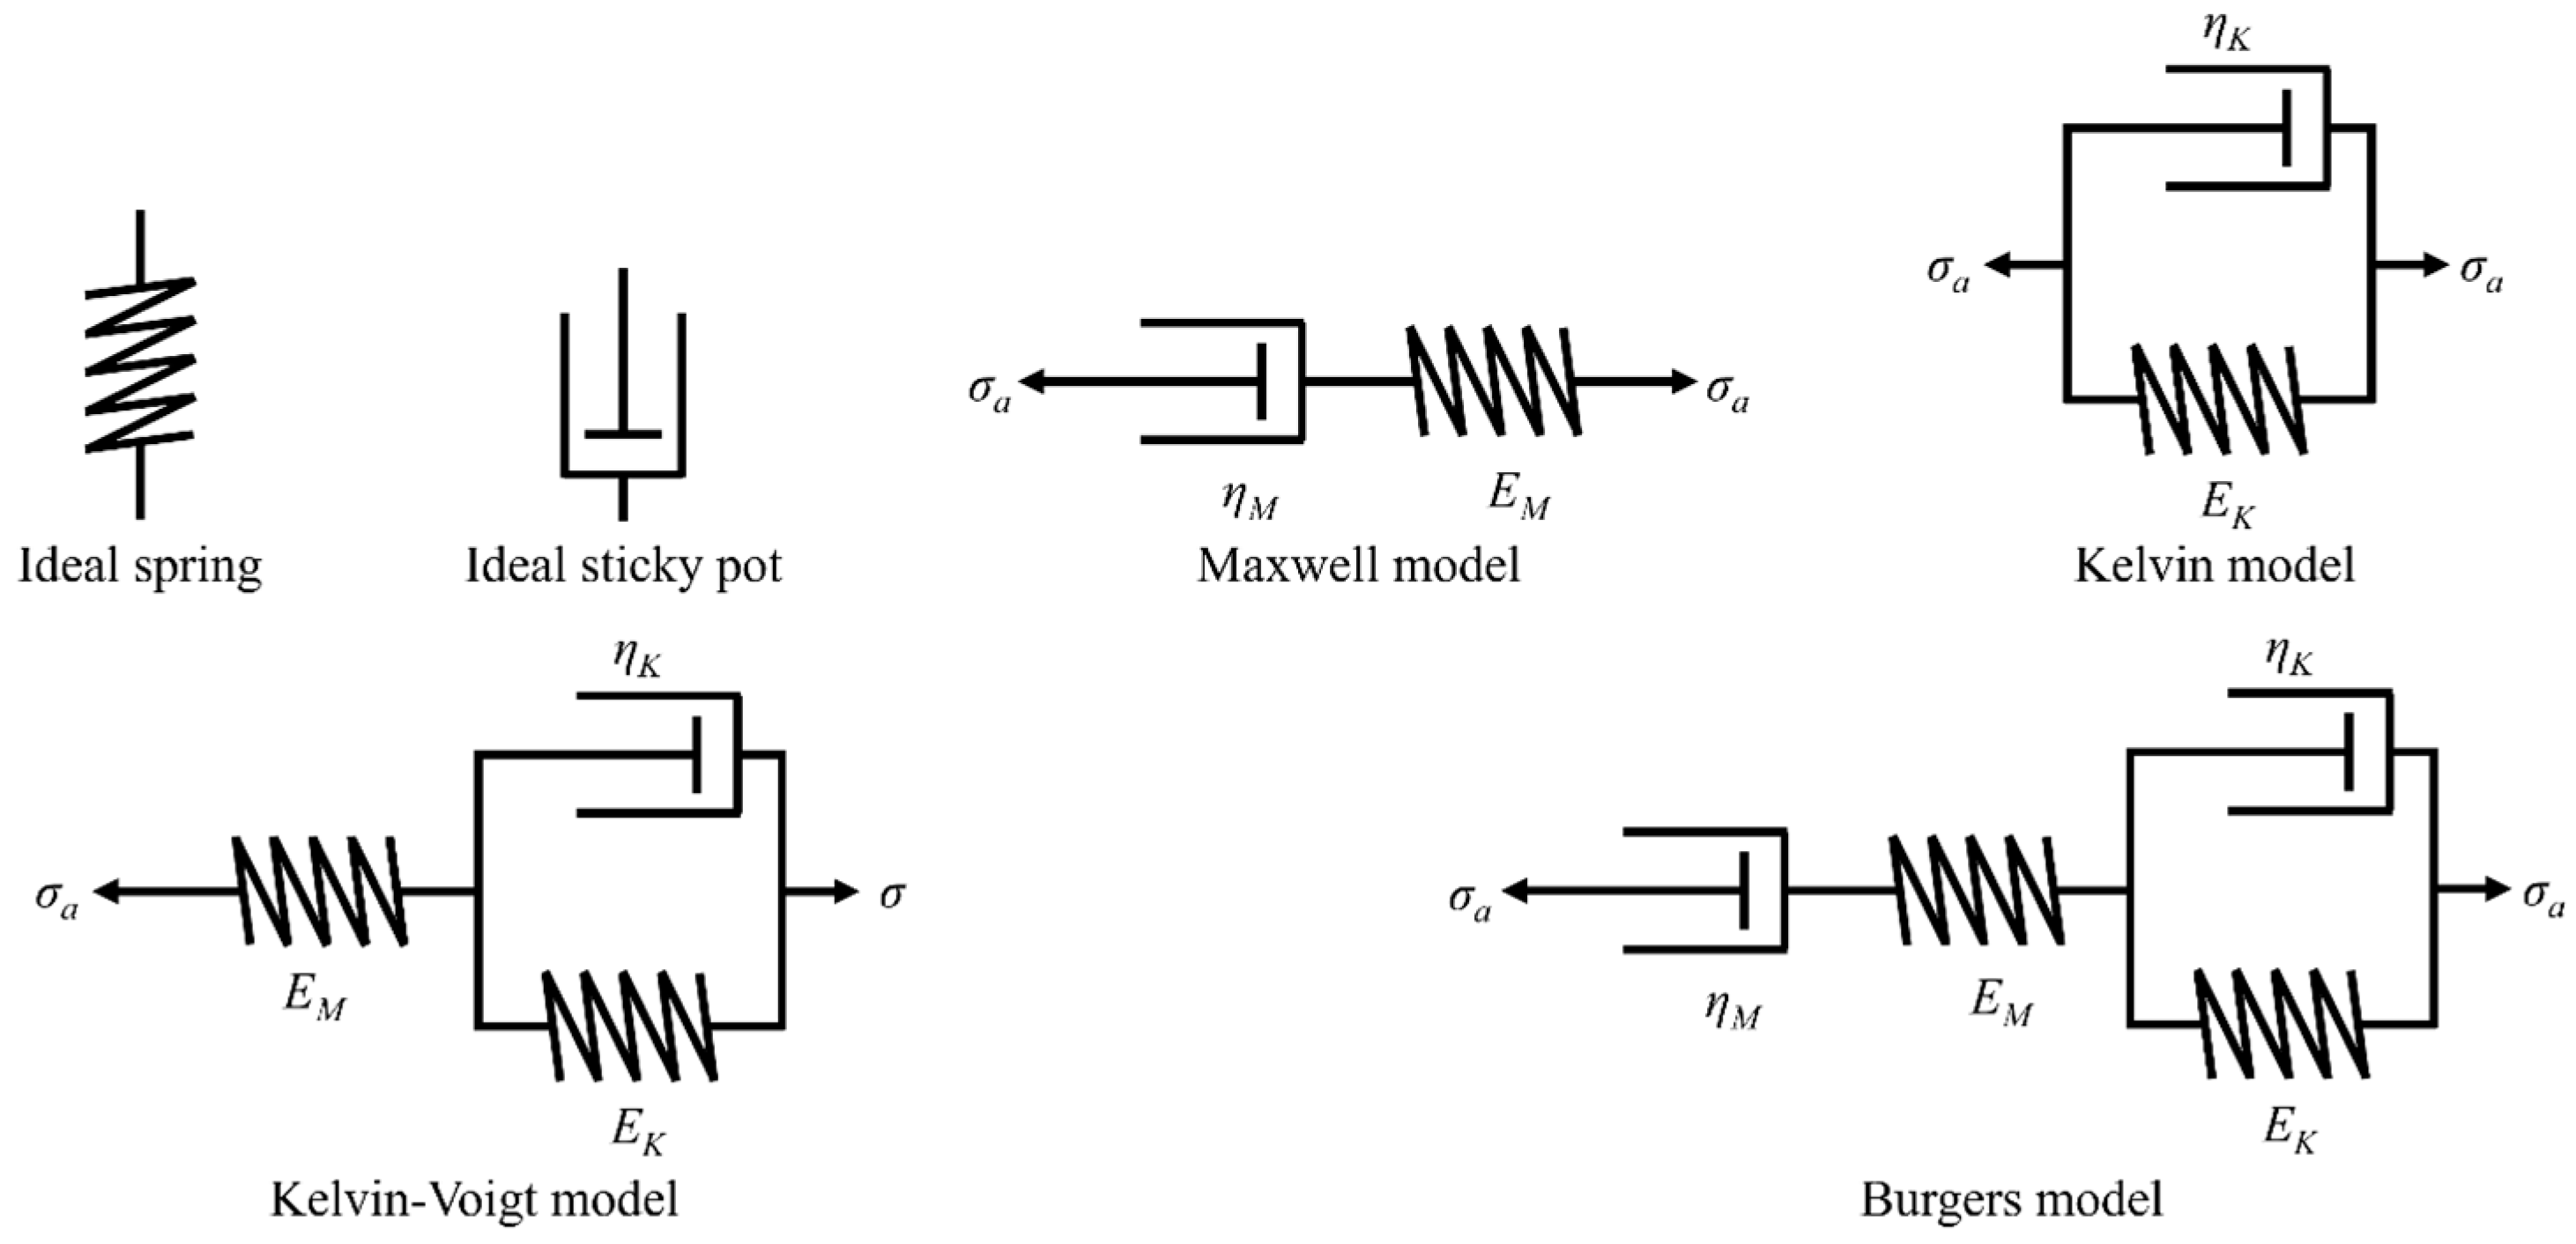
In addition to empirical models, researchers have also developed various constitutive models to describe the creep behavior of materials. As shown in Figure 4, such constitutive models are usually composed of one or more ideal springs and an ideal sticky pot.
The Maxwell model comprises an ideal spring and an ideal sticky pot connected in series. The creep equation of the Maxwell model is
ε t = σ a E M + σ a η M t
D t = ε t / σ a = 1 E M + 1 η M t
The Kelvin model comprises an ideal spring and an ideal sticky pot connected in parallel. The creep equation of the Kelvin model is
ε t = σ a E K σ a E K e x p ( E K η K t )
D t = ε t / σ a = 1 E K 1 E K e x p ( E K η K t )
The Kelvin–Voigt model is formed by connecting a Kelvin model and an ideal spring in series; therefore, it is also known as the three-element model. The creep equation of the Kelvin–Voigt model is
ε t = σ a E M + σ a E K σ a E K e x p ( E K η K t )
D t = ε t / σ a = 1 E M + 1 E K 1 E K e x p ( E K η K t )
The Burgers model is constructed by connecting a Kelvin element and a Maxwell element in series; thus, it is also called the four-element model. The creep equation of the Burgers model is
ε t = σ a E M + σ a E K + σ a η M t σ a E K e x p ( E K η K t )
D t = ε t / σ a = 1 E M + 1 E K + 1 η M t 1 E K e x p ( E K η K t )
The models mentioned above will be used to fit the prepared composites’ short-term creep curves. First, the Findley model was used for fitting. Meanwhile, considering that the Burgers constitutive model usually has a good fitting degree for the tensile creep curves of fiber-reinforced resin composites [13], the Burgers constitutive model was also selected in this study for fitting to investigate the intrinsic characteristics of the short-term tensile creep behavior of the prepared composites. The custom mode of the Curve Fitting toolbox in MATLAB (version R2021b) software was used to complete the model fitting. Representative curves displayed in Figure 2 and Figure 3 were used for fitting.
1.
Fitting with the Findley model
Table 3 presents the fitting parameters of the Findley model. It can be seen from Table 3 that the Findley model has a good fitting degree for each fitted curve; all fitting degrees (R2) are greater than 0.99. This indicates that the Findley model, as an empirical model, is convenient and effective for fitting experimental data.
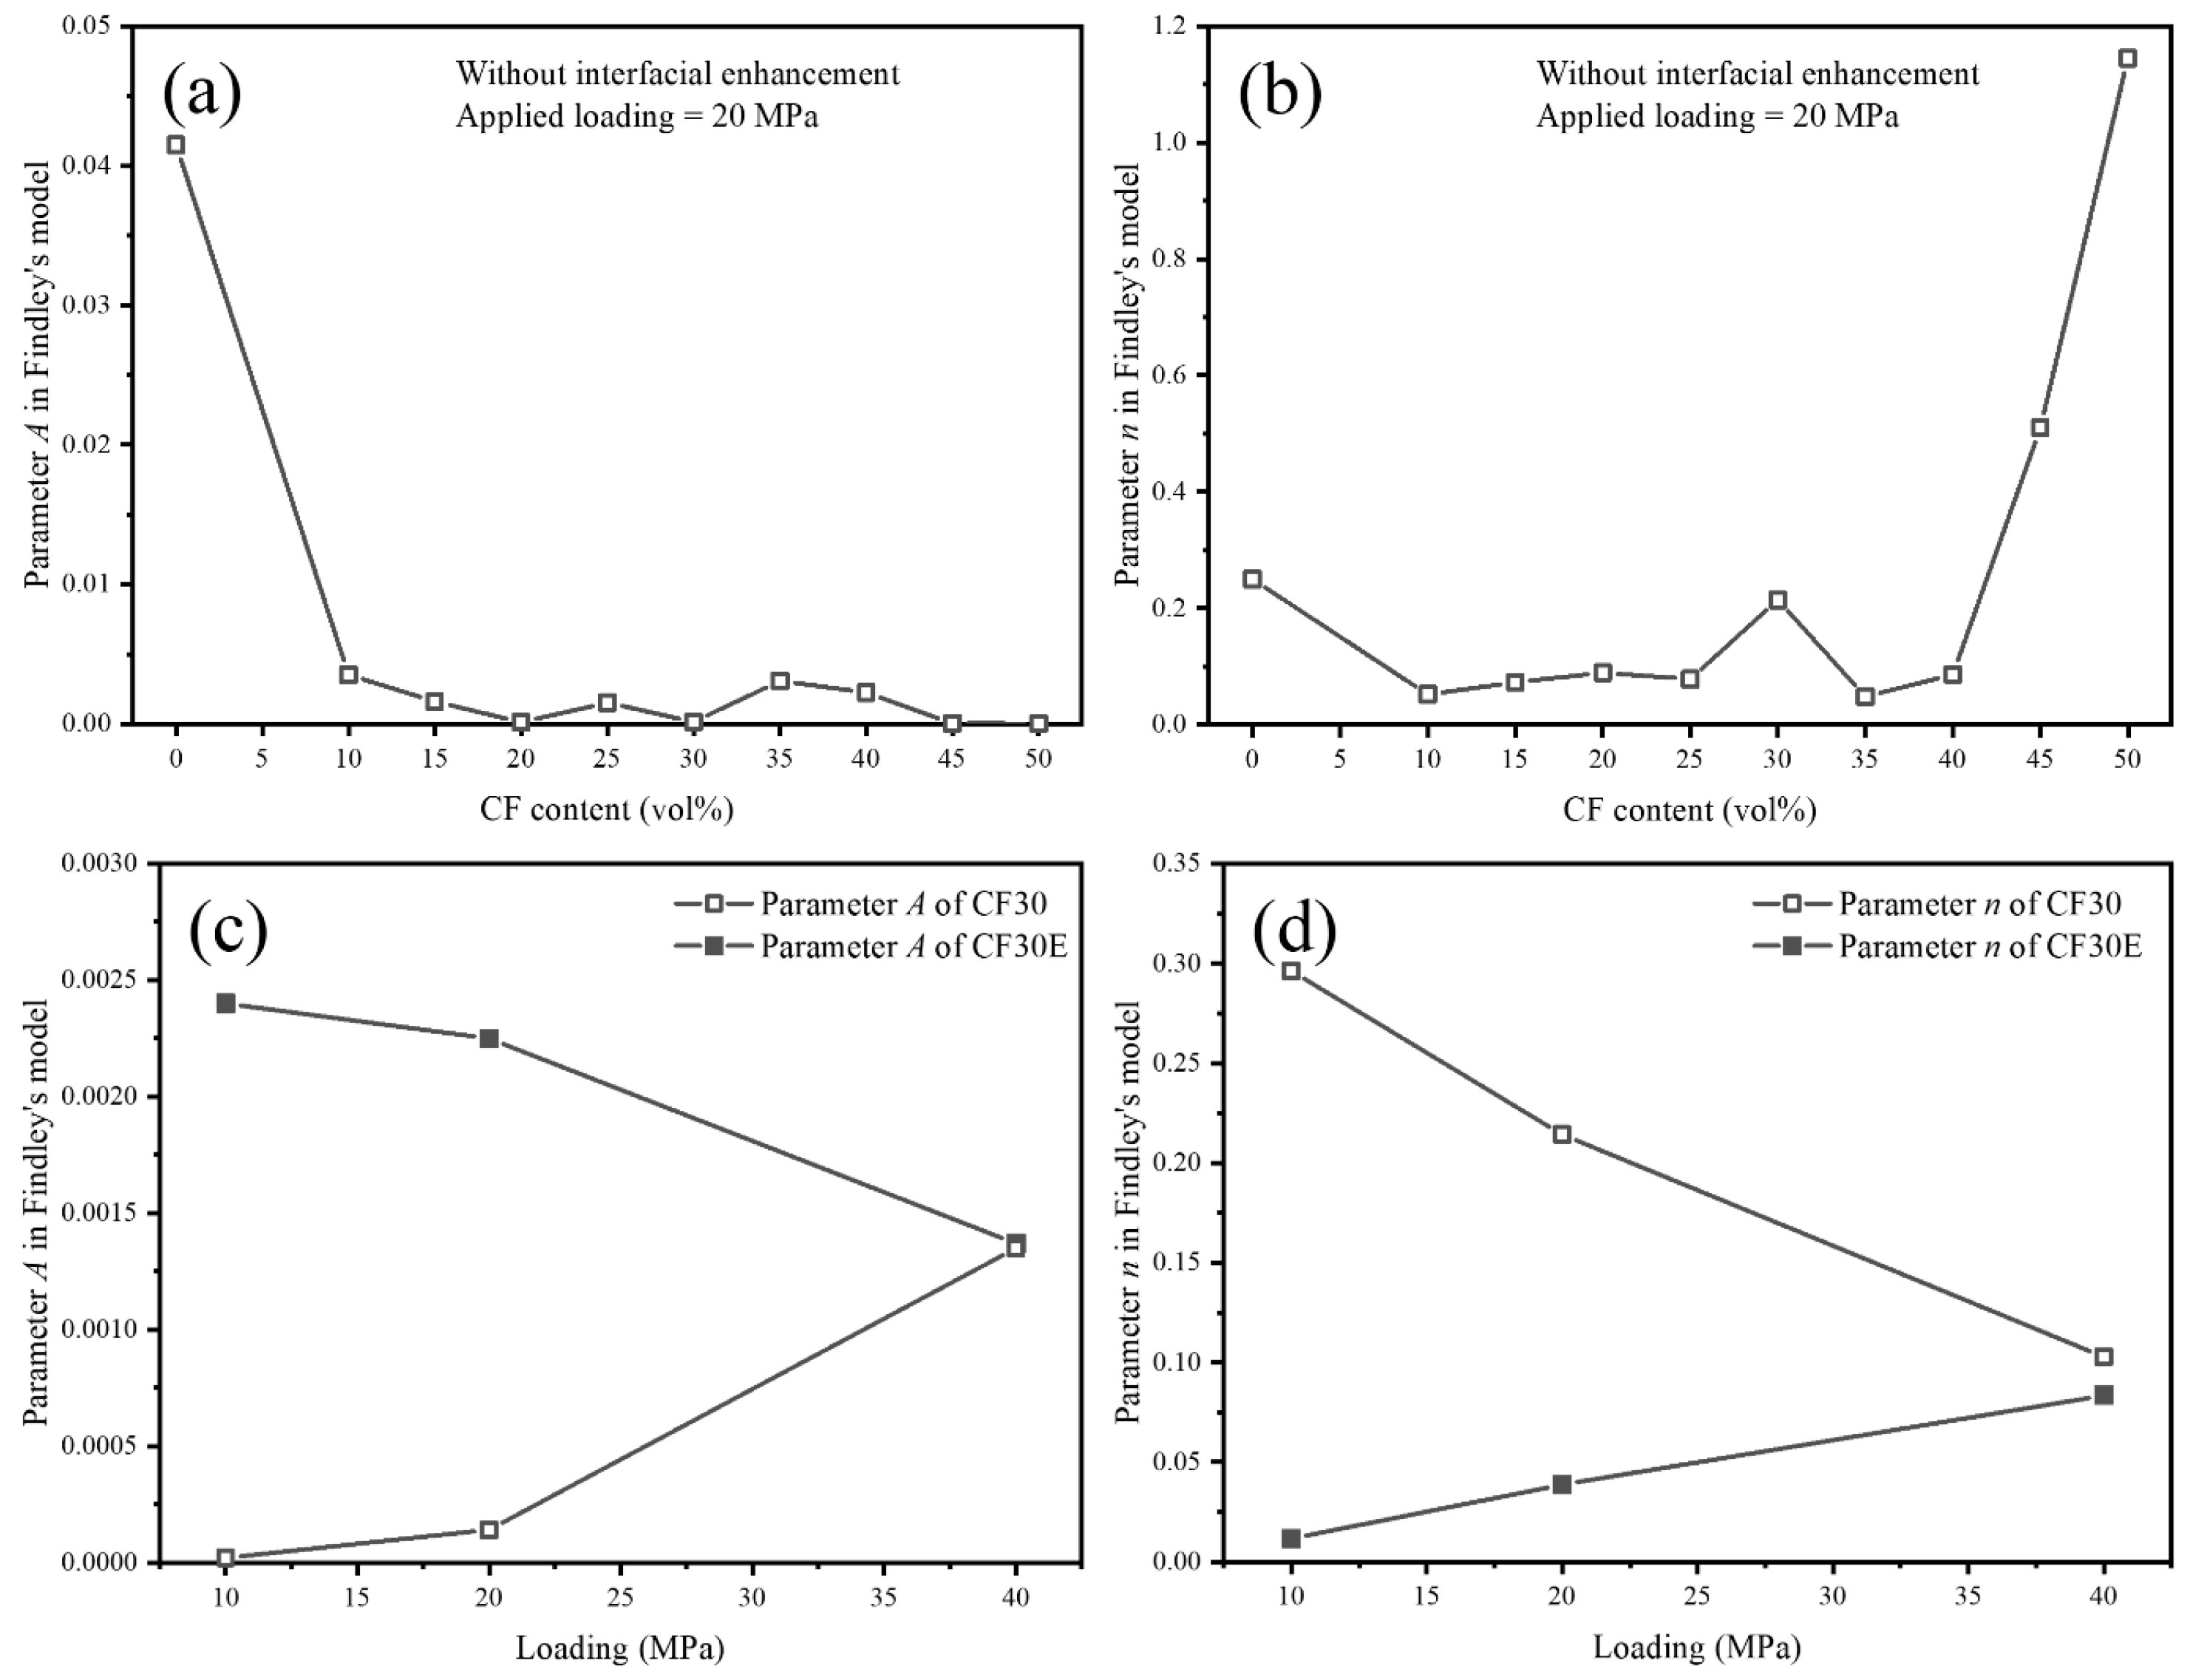
Some studies suggest that although the Findley model is an empirical model, the variation trends of its parameters A and n with various influencing factors may still reveal the intrinsic creep characteristics of the material. For example, Georgiopoulos et al. [17] prepared a biodegradable polymer/wood-fiber composite (BP/WF composite) and tested its short-term tensile creep curve. After fitting the measured short-term tensile creep curve using the Findley model, they found that the variations in parameters A and n with fiber content and load level could explain the intrinsic creep characteristics of the BP/WF composite. To investigate whether parameters A and n of the Findley model can reflect the intrinsic creep characteristics of the PP/CF wet-laid nonwoven composites prepared in this study, the variation curves of parameters A and n with CF content, load level, and interfacial enhancement were plotted, as shown in Figure 5. The comparison between the experimental creep curves and the Findley model-fitting creep curves can be seen in Figure S1.
First, the variation in parameter A was examined. It can be seen from Figure 5a that the introduction of CF can significantly reduce the value of parameter A; however, the variation in parameter A with CF content does not show a regular trend, and there is no phenomenon indicating that increasing the fiber content can reduce the value of parameter A, which is inconsistent with the results in the previous literature [18]. Secondly, as shown in Figure 5c, under different interfacial conditions, the variation in parameter A with load level shows an opposite trend, which also contradicts the literature report that the value of A increases with the increase in load level [18].
Next, the variation in parameter n was analyzed. It can be observed from Figure 5b that the introduction of CF can significantly reduce the value of parameter n; however, the variation in parameter n with CF content also does not exhibit a regular trend, and there is no trend showing that the value of parameter n decreases with the increase in fiber content, which is inconsistent with the results in the previous literature [17]. Secondly, as shown in Figure 5d, under different interfacial conditions, the variation in parameter n with load level also shows an opposite trend.
By observing the variations in parameters A and n, it can be concluded that as an empirical model, the Findley model cannot accurately describe the intrinsic characteristics of the short-term tensile creep behavior of PP/CF wet-laid nonwoven composites.
2.
Fitting with the Burgers model
To implement the fitting with the Burgers model, the Burgers model was first transformed into the following simpler form:
ε t = P 1 exp t P 2 + P 3 t + P 4
Obviously, we have
E M = σ a P 1 + P 4
E K = σ a P 1
η M = σ a P 3
η K = P 2 σ a P 1
Table 4 presents the fitting parameters of the Burgers model. It can be seen from Table 4 that the Burgers model also has a good fitting degree for each fitted curve; most of the fitting degrees (R2) are greater than 0.99. However, compared with the fitting degrees of the Findley model given in Table 3, the fitting degree of the Burgers model is slightly lower. This is because the Burgers model has more parameters, making it more difficult to achieve an excellent fitting effect. The comparison between the experimental creep curves and the Burgers model-fitting creep curves can be seen in Figure S1.
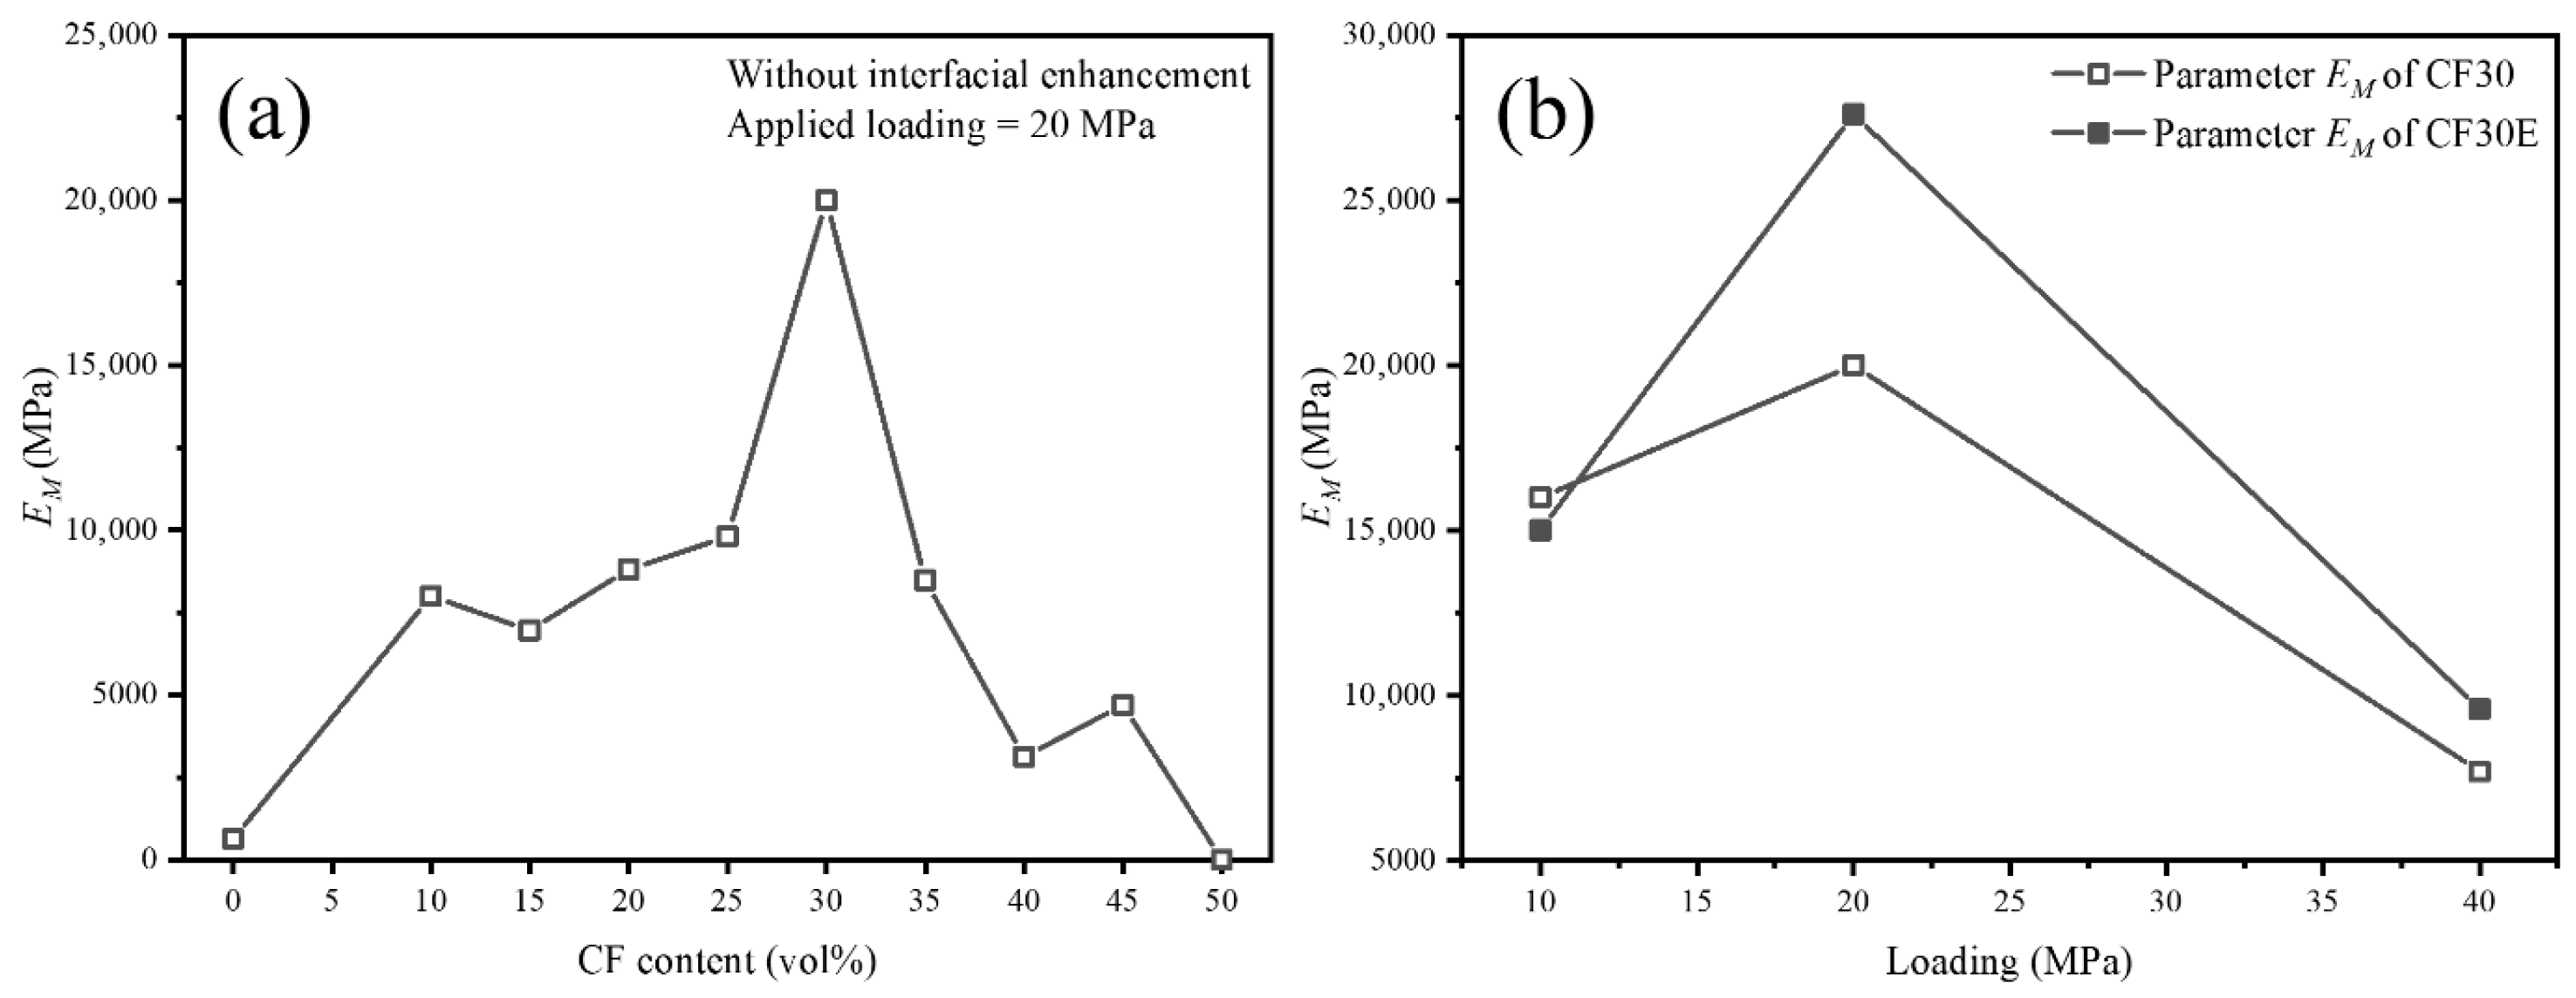
It is generally believed that the parameters of the Burgers model can reflect the intrinsic characteristics of the creep behavior of materials. Figure 6 shows the variation trends of parameter EM with CF content, load level, and interfacial enhancement. EM is the instantaneous creep modulus, which is related to the modulus of the material itself; therefore, the variation trend of EM with CF content should be consistent with that of the material’s own modulus with CF content. It can be seen from Figure 6a that the variation in EM with CF content shows a trend of first increasing and then decreasing, reaching the maximum value when the CF content is 30 vol%. Figure 6b indicates that interfacial enhancement can increase the value of EM; this is because interfacial enhancement can improve the tensile modulus of the prepared composite. EM first increases and then decreases with the increase in load level, which is inconsistent with the decreasing trend reported in the literature; this may be caused by insufficient fitting accuracy [19].
Figure 7 shows the variation trends of parameter EK with CF content, load level, and interfacial enhancement. EK is the retardant elastic modulus, which reflects the stiffness of molecular chains in the amorphous region [17]. Under normal circumstances, the effects of reinforcement content on EK and EM are consistent [17,18]. Therefore, as can be seen in Figure 7a, the variation of EK with CF content is similar to that of EM; it first increases and then decreases with the increase in CF content, reaching the maximum value when the CF content is 30 vol%. Meanwhile, it can be seen in Figure 7a that EK generally decreases with the increase in load level, which is consistent with the literature reports [17,18].
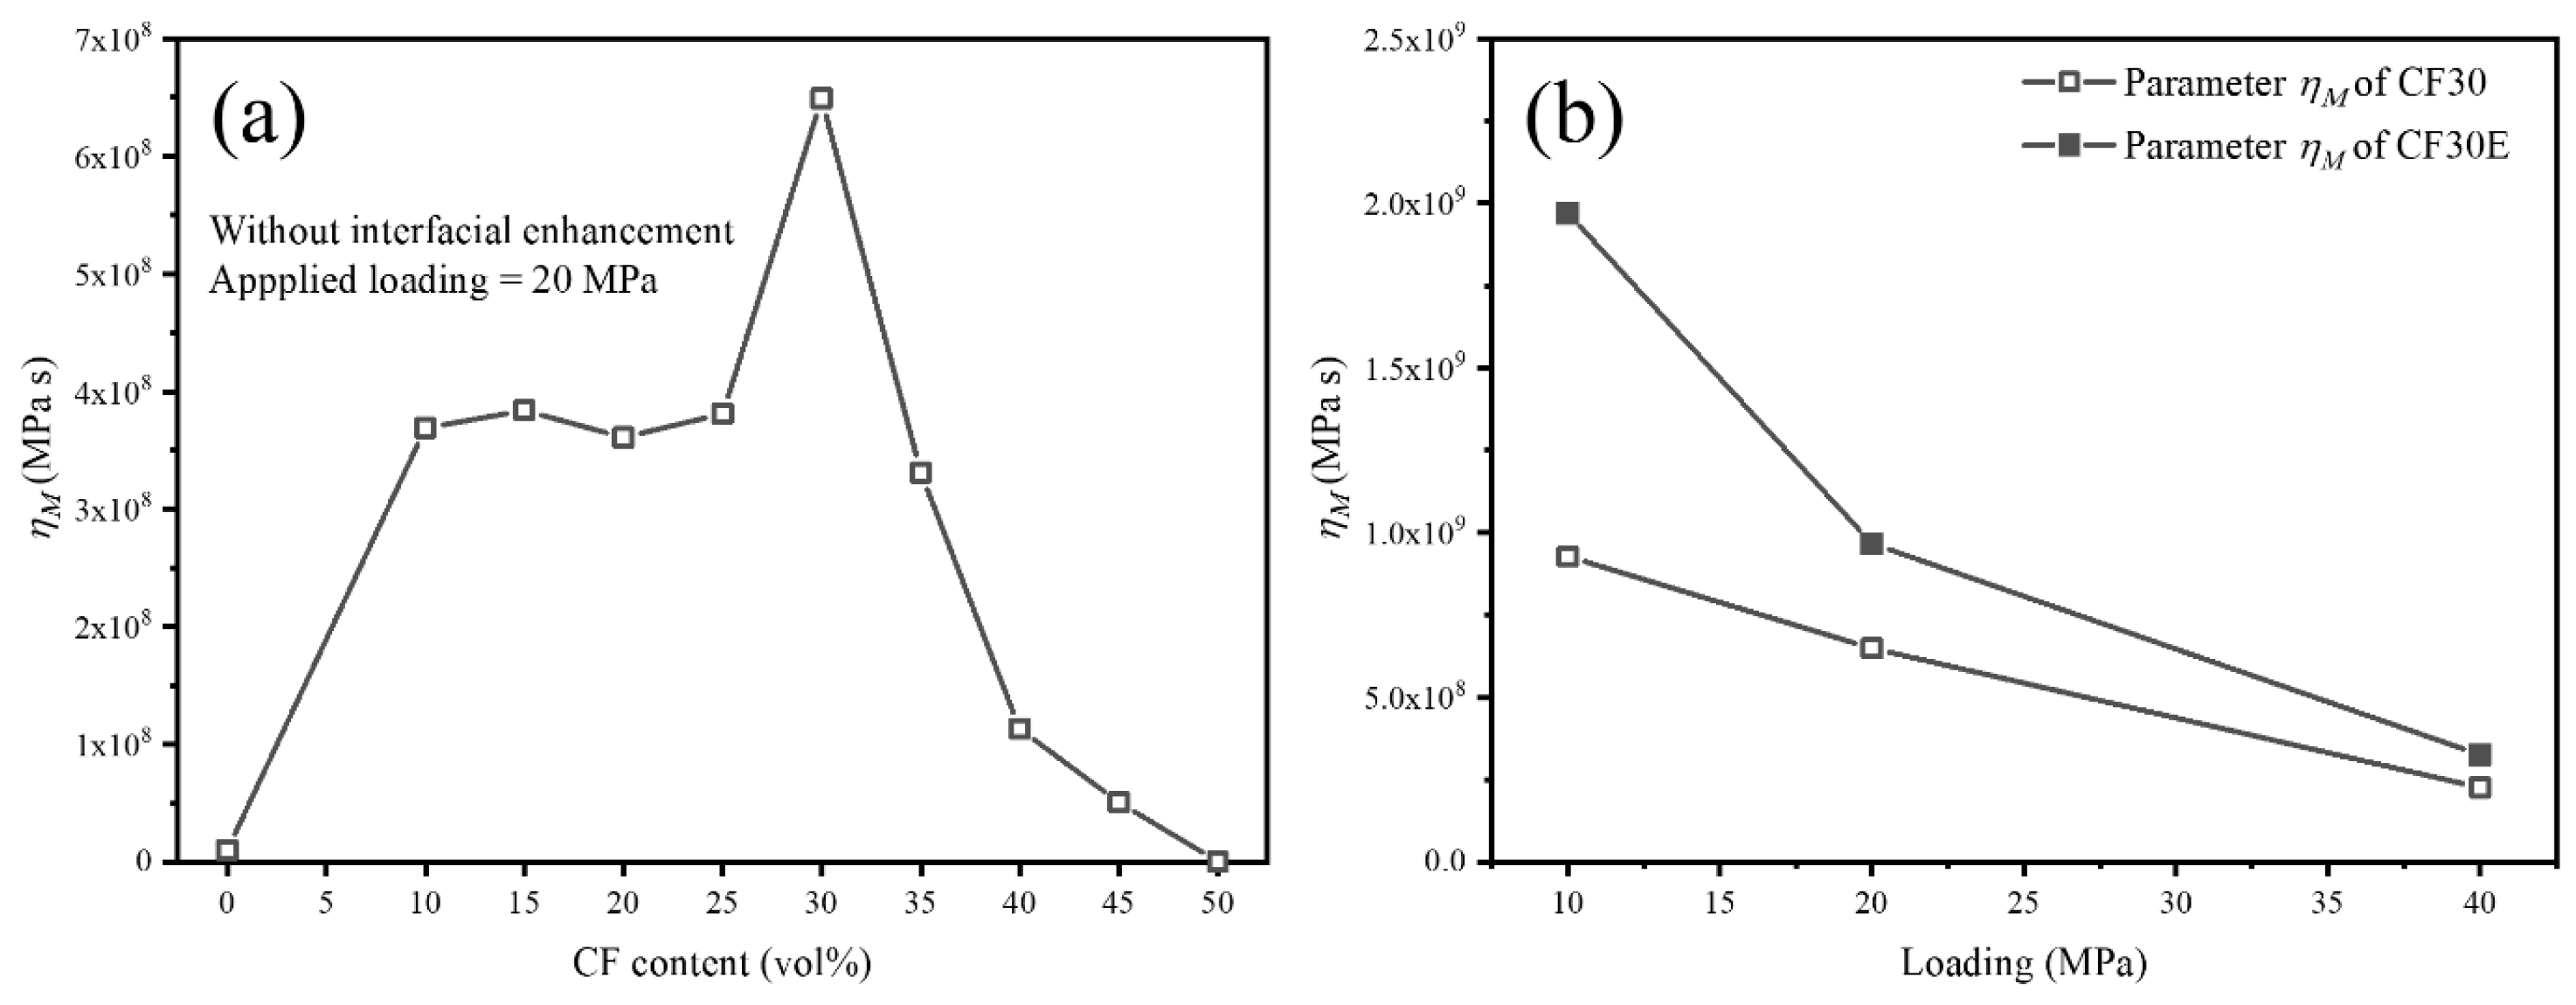
Figure 8 shows the variation trends of parameter ηM with CF content, load level, and interfacial enhancement. ηM is the retardant viscosity, which represents the molecular chain damage and irreversible deformation in the crystalline region; an increase in ηM indicates a decrease in molecular chain mobility, while a decrease in ηM indicates an increase in molecular chain mobility. It can be seen from Figure 8a that when the CF content increases from 0 to 30 vol%, ηM gradually increases; this is because the increase in CF further restricts the movement of resin molecular chains. However, a further increase in CF content cannot cause ηM to continue to decrease; this is because the increase in void content at this time will increase the mobility of molecular chains [4,10]. It can be seen from Figure 8b that ηM decreases with the increase in load level, which is because a higher load level is more conducive to the movement of resin molecular chains; meanwhile, interfacial enhancement can also increase the value of ηM, which is because stronger interfacial bonding is more beneficial for CF to restrict the movement of resin molecular chains, thereby reducing the mobility of resin molecular chains.
An important indicator for evaluating the creep behavior of materials is the relaxation time τ. The relaxation time represents the time required for the resin molecular chains to stabilize from a moving state, and its calculation formula is
τ = η K / E K
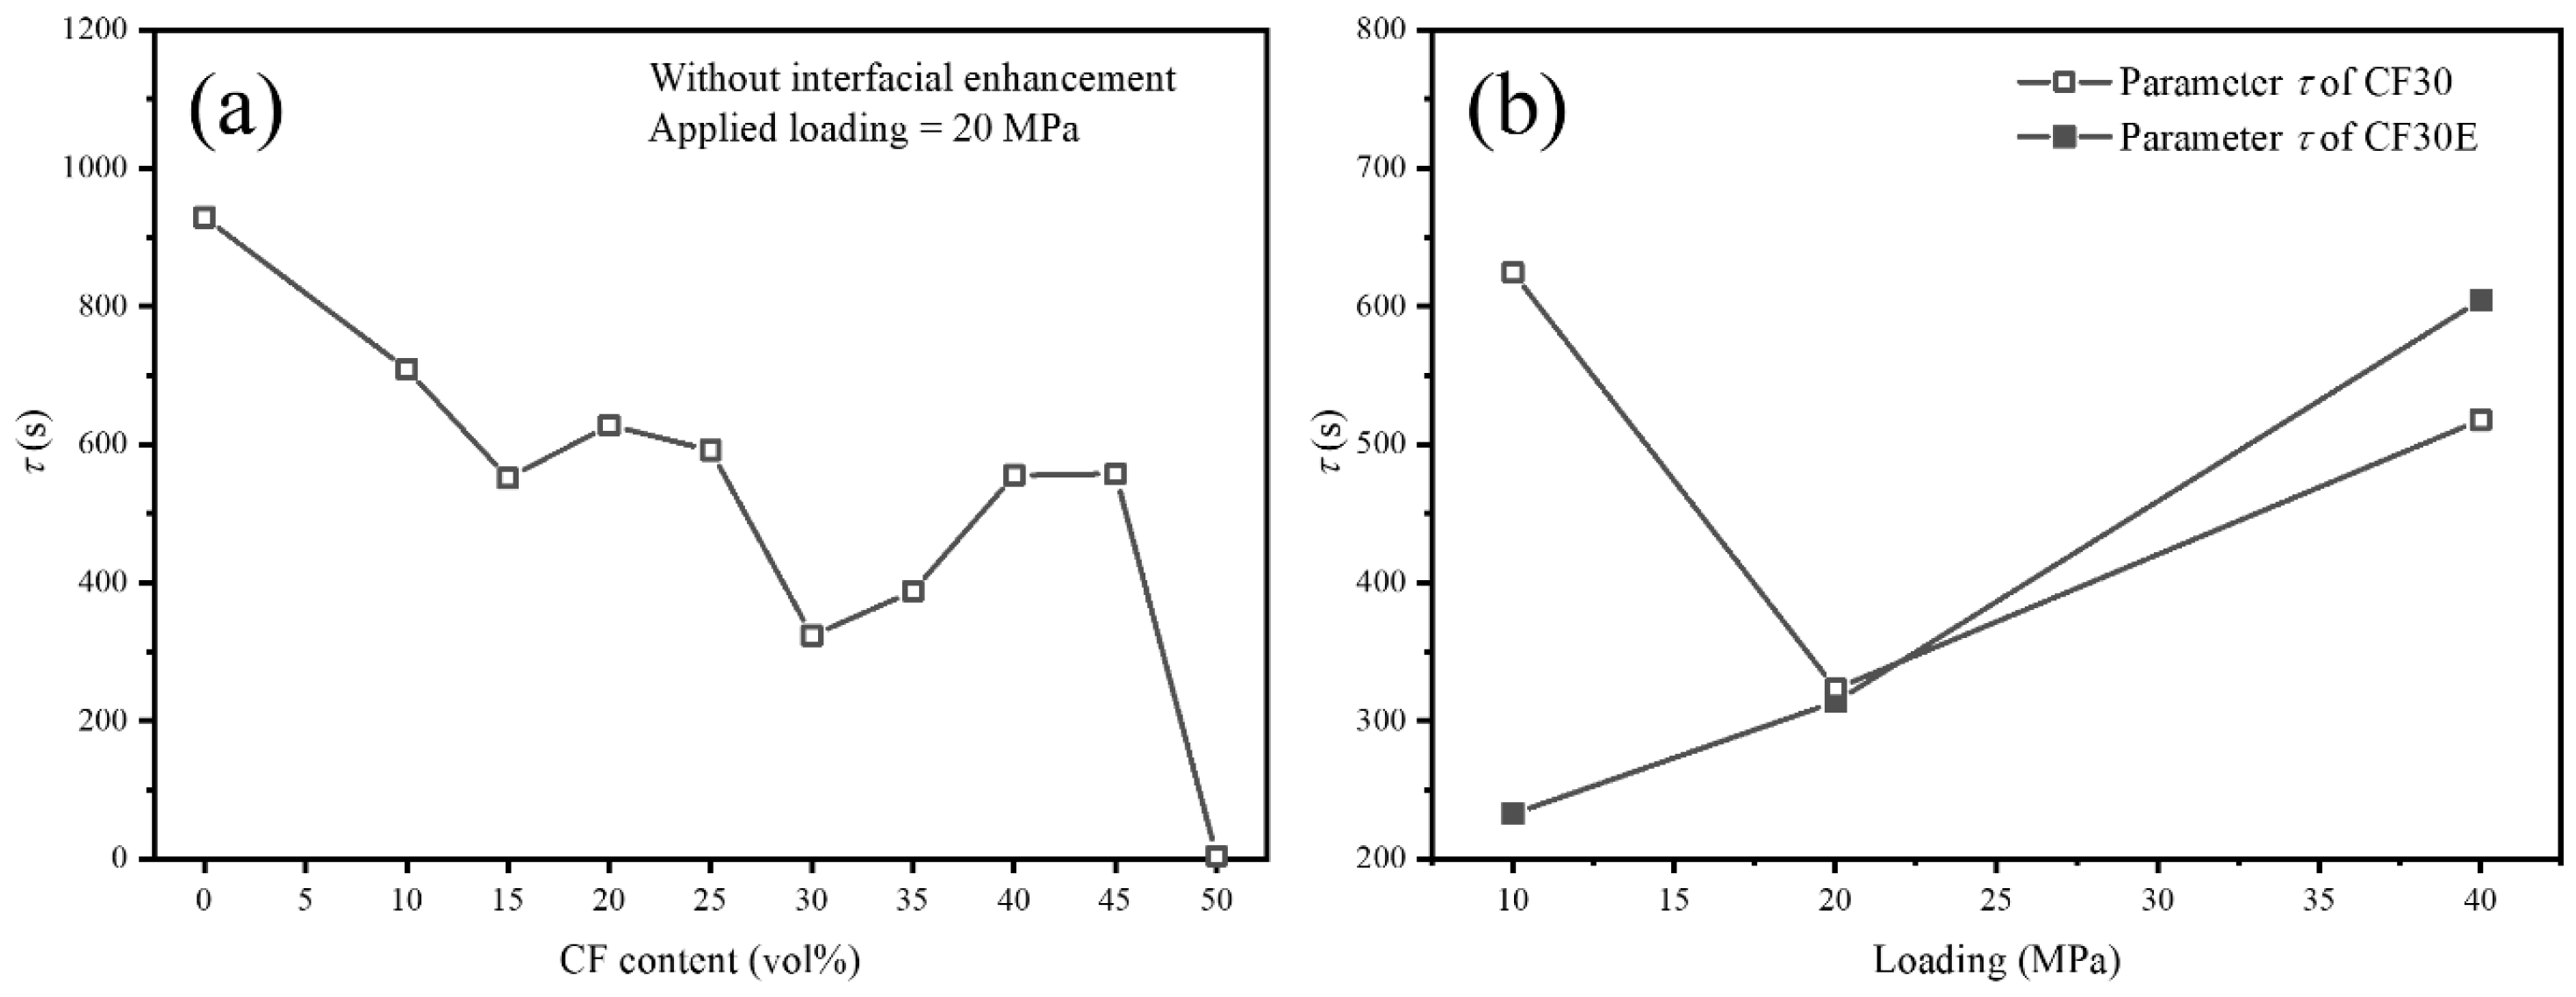
Figure 9 shows the variation trends of relaxation time τ with CF content, load level, and interfacial enhancement. It can be seen from Figure 9a that as the CF content increases from 0 to 30 vol%, the relaxation time gradually decreases; this is because the increase in CF can reduce the mobility of molecular chains, thereby decreasing the relaxation time. When the CF content increases from 30 vol% to 45 vol%, due to the increase in void content, the mobility of molecular chains increases, so the relaxation time increases. When the CF content reaches 50 vol%, the relaxation time drops sharply to 0, which may be due to poor fitting; the Burgers model cannot provide a good fit of the creep curve with typical three-stage behavior [20]. Figure 9b shows that under the condition of interfacial enhancement, the relaxation time increases with the increase in load level; this is because a higher load promotes the movement of resin molecular chains. However, under the condition without interfacial enhancement, the relaxation time does not increase with the increase in load level, and does not even show a monotonic trend; this may be caused by poor fitting.
In summary, compared with the Findley model, although the fitting degree of the Burgers model is relatively lower, the parameters of the Burgers model have physical meanings and can help understand the intrinsic creep characteristics of the material [11,17].

3.3. Long-Term Tensile Creep Behavior

3.3.1. Time–Temperature Superposition Principle

The creep behavior of polymer materials depends on the movement of resin molecular chains; therefore, a certain period of time is required for the polymer chains to obtain sufficient mobility. The mobility of molecular chains also depends on temperature; an increase in temperature can enhance the mobility of molecular chains, while a decrease in temperature can weaken it. This means that the same relaxation phenomenon can be observed either at a higher temperature for a shorter time or at a lower temperature for a longer time; that is, for molecular chain movement, increasing the temperature is equivalent to extending the observation time. The details given above are the basis of the Time–Temperature Superposition Principle.
Based on the Time–Temperature Superposition Principle, researchers can obtain the short-term creep curve of a material at a higher temperature and convert it into a long-term creep curve at a lower temperature; thus, the observation of the long-term creep behavior of the material can be completed within a shorter experimental time. The conversion between the creep curves at high and low temperatures requires the use of the shift factor (αT), which is expressed as follows:
D L o w e r T e m p t r = D H i g h e r T e m p ( t / a T )
lg t r = lg t a T
Obviously, the geometric meaning of Equation (16) is to shift the creep curve at a higher temperature to the left by αT units on the logarithmic axis, thereby obtaining the creep curve at a lower temperature. Among them, the converted time tr is called the reduced time.
There are mainly two methods for calculating the shift factor, namely the Williams–Landel–Ferry (WLF) equation and the Arrhenius equation. The expression of the WLF equation is
lg a T = C 1 ( T t e s t T r e f ) C 2 + ( T t e s t T r e f )
where Ttest(K) is the measured temperature of the creep curve, Tref(K) is the reference temperature, and C1 and C2 are empirical constants that can be obtained by fitting. The expression of the Arrhenius equation is
lg a T = Δ H R ( 1 T t e s t 1 T r e f ) l g ( e )
where ΔH is the activation energy of the material, R is the gas constant, and e is the natural constant. The calculation formula for the activation energy is
Δ H = R d ( l n ( f ) ) d ( 1 / T g )
where f is the frequency of the sinusoidal alternating stress borne by the material, and Tg (K) is the glass transition temperature.
In general, the WLF equation and the Arrhenius equation have their own optimal application ranges; the application range of the WLF equation is generally Tg~Tg + 100 K, and the application range of the Arrhenius equation is generally below Tg.

3.3.2. Results of Dynamic Mechanical Test

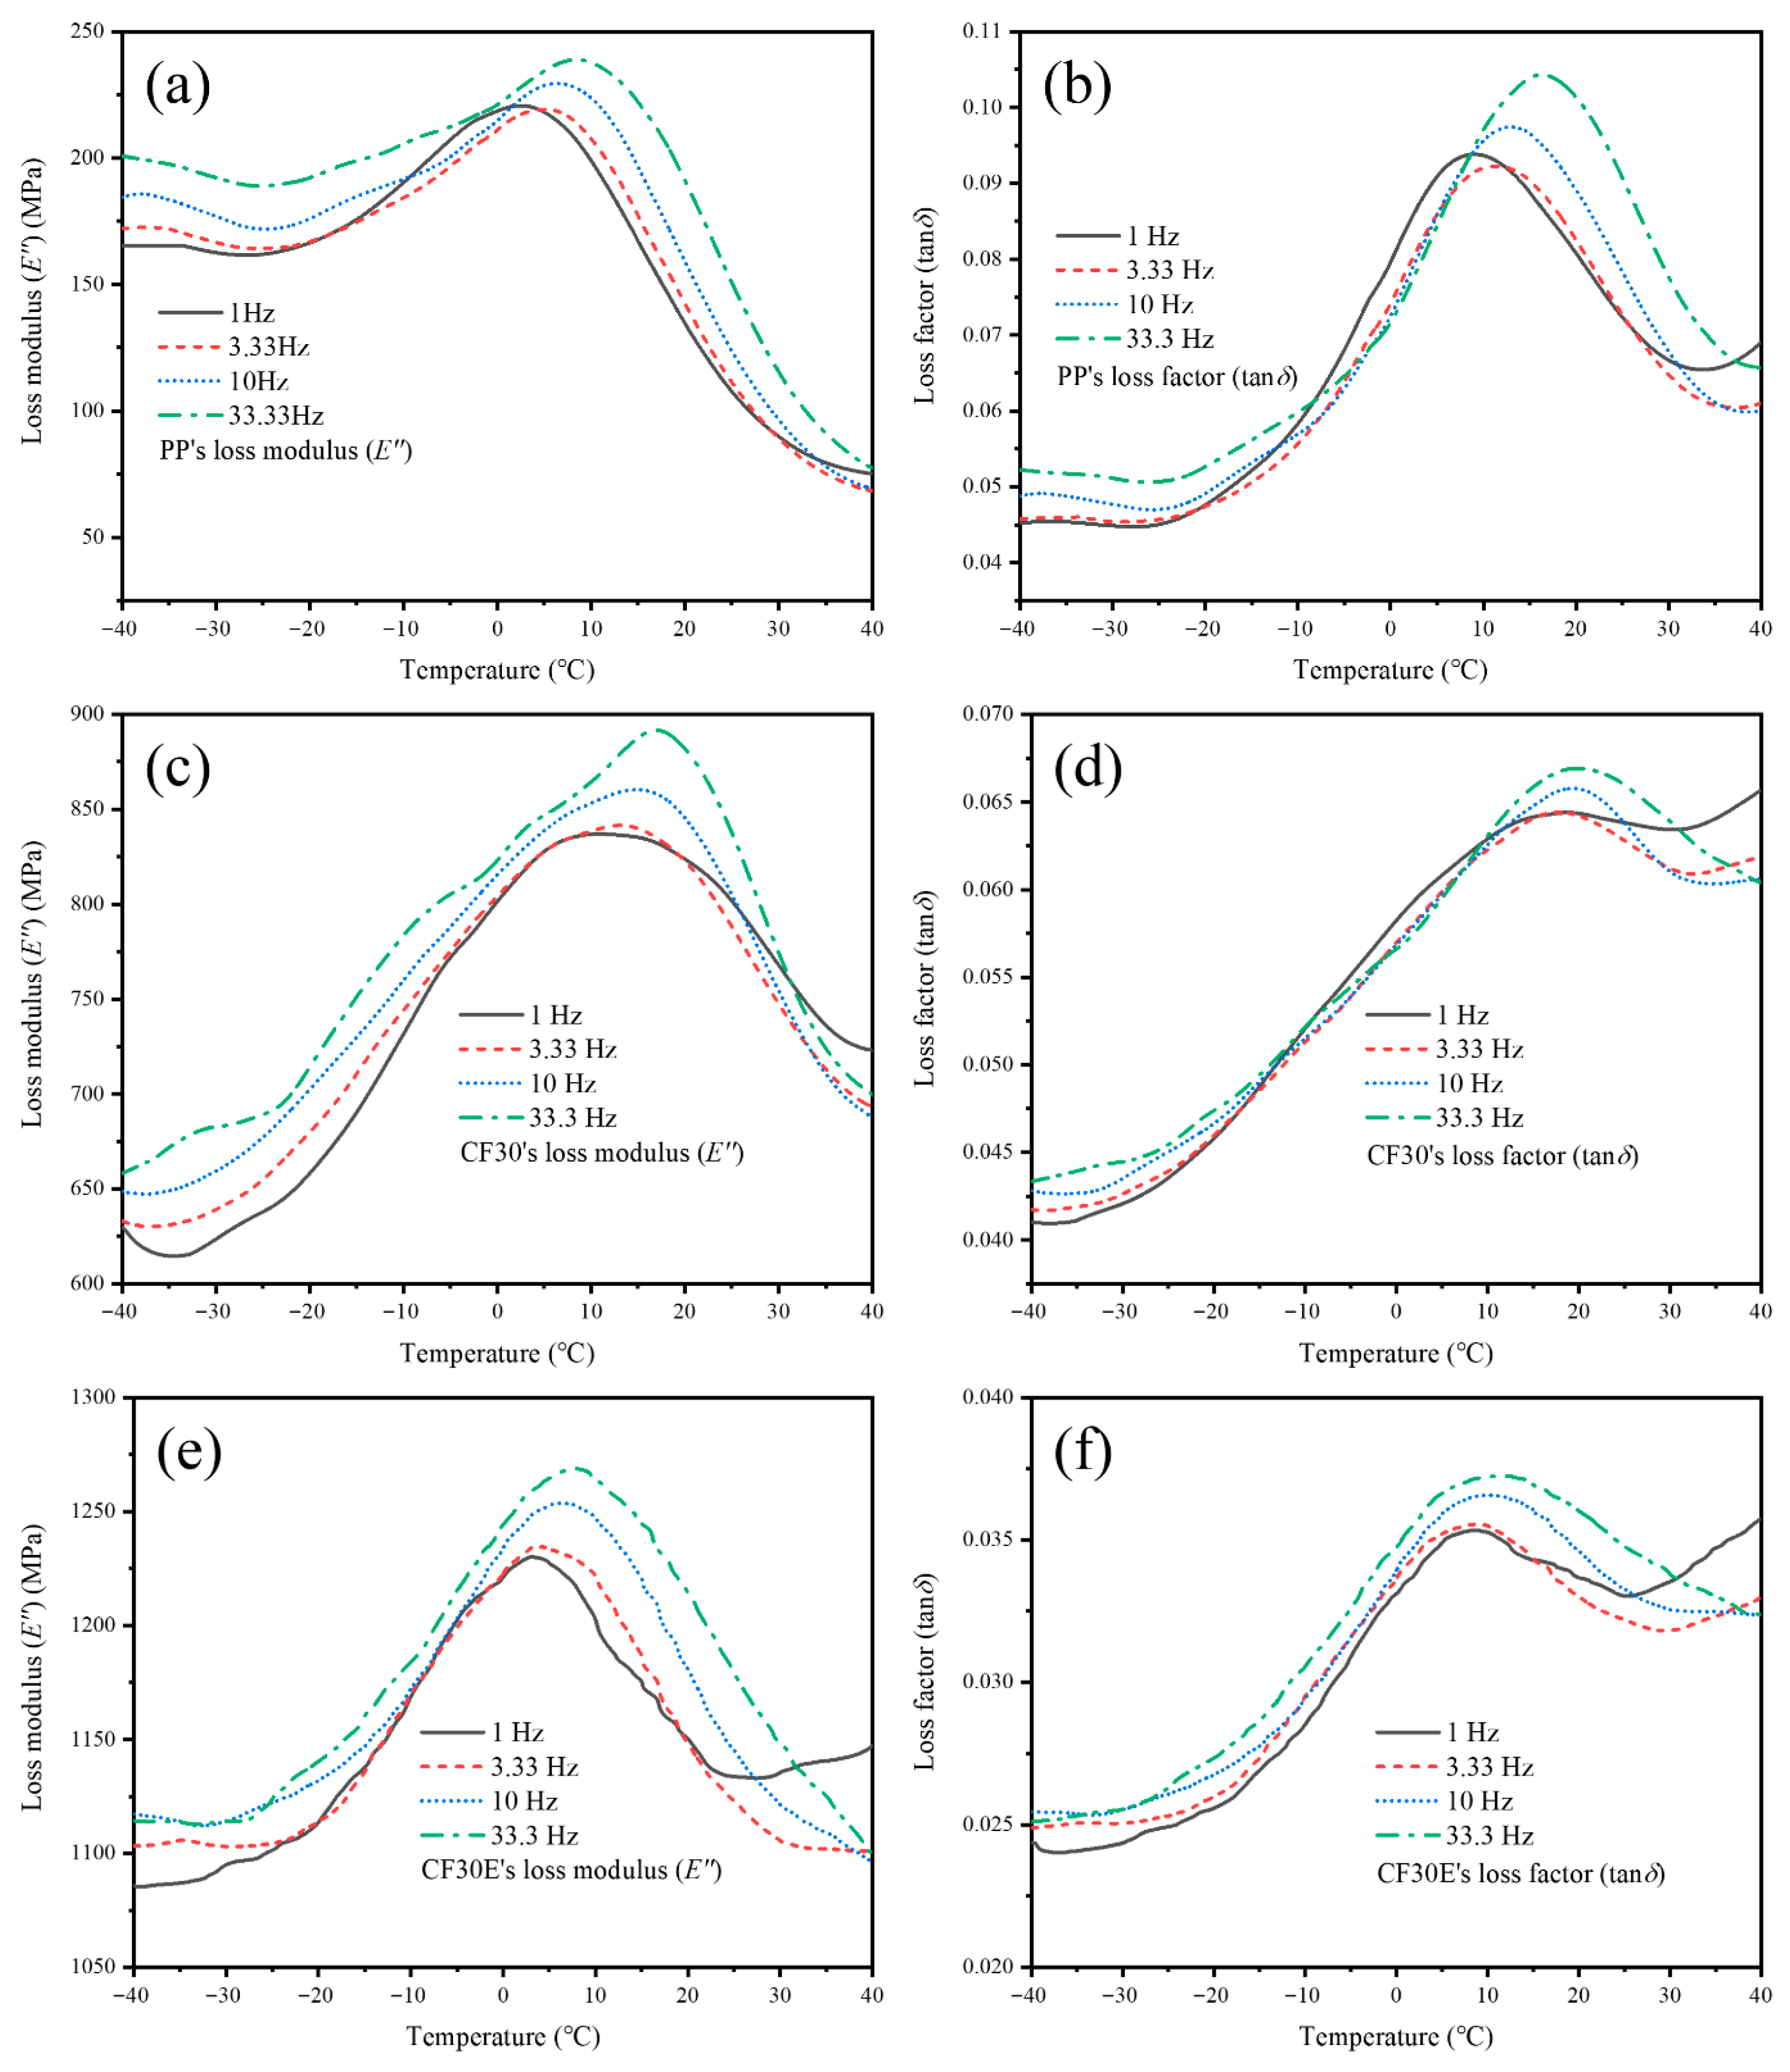
As mentioned earlier, when studying the long-term creep behavior of polymer materials, an important part is to investigate the glass transition temperature of the material. Due to the different test methods, the measured glass transition temperature of the same material may vary; this means that the glass transition temperature of polymer materials is usually a range rather than a fixed and definite value. In this study, in accordance with the standard ASTM D 4065-94 [21], the glass transition temperature was determined by testing the variation curves of the loss modulus (E″) and loss factor (tanδ) of the material with temperature. The temperature at the peak of the loss modulus and loss factor is the glass transition temperature [22]. The relationship between the loss modulus and the loss factor is as follows:
t a n δ = E / E
where E′ is the storage modulus.
Figure 10 shows the loss modulus and loss factor of PP resin, CF30, and CF30E. Firstly, it can be seen that the loss modulus of the composites is higher than that of the PP resin; this is because, after the introduction of rigid CF, more energy is required for the movement of molecular chains [23]. The loss modulus of CF30E is higher than that of CF30, indicating that interfacial enhancement can also increase the loss modulus of the composite; this is because better interfacial bonding can further hinder the movement of molecular chains [24]. Secondly, due to the introduction of CF, which enhances the stiffness of the resin and reduces the irreversible deformation of the resin, the loss factors of CF30 and CF30E are higher than that of the PP resin. In addition, by comparing the half-peak widths of each curve in Figure 10, it can be found that the half-peak width of the composites is slightly larger than that of the PP resin; this is because the introduction of CF leads to multi-stage relaxation of the resin molecular chains [25].
Table 5 presents the glass transition temperatures of PP resin, CF30, and CF30E measured under different conditions. It can be seen that the glass transition temperature range of PP is 2.71~16.13 °C; after the introduction of CF, the glass transition temperature range of CF30 increases to 10.73~20.87 °C. This is because the rigid CF can hinder the movement of molecular chains, so higher energy is required for the movement of molecular chains, which is reflected in the higher glass transition temperature. However, after the composite is subjected to interfacial enhancement treatment, the glass transition temperature range of CF30E decreases to 3.17~10.99 °C. This is because in this study, Method B from the previous research [2] was used for the interfacial enhancement treatment. In Method B, the CF surface is coated with a PDA coating, which increases the surface roughness of CF and thus provides more nucleation sites for the resin molecular chains [26]; therefore, it can be observed in Table 5 that the interfacial enhancement treatment reduces the glass transition temperature.
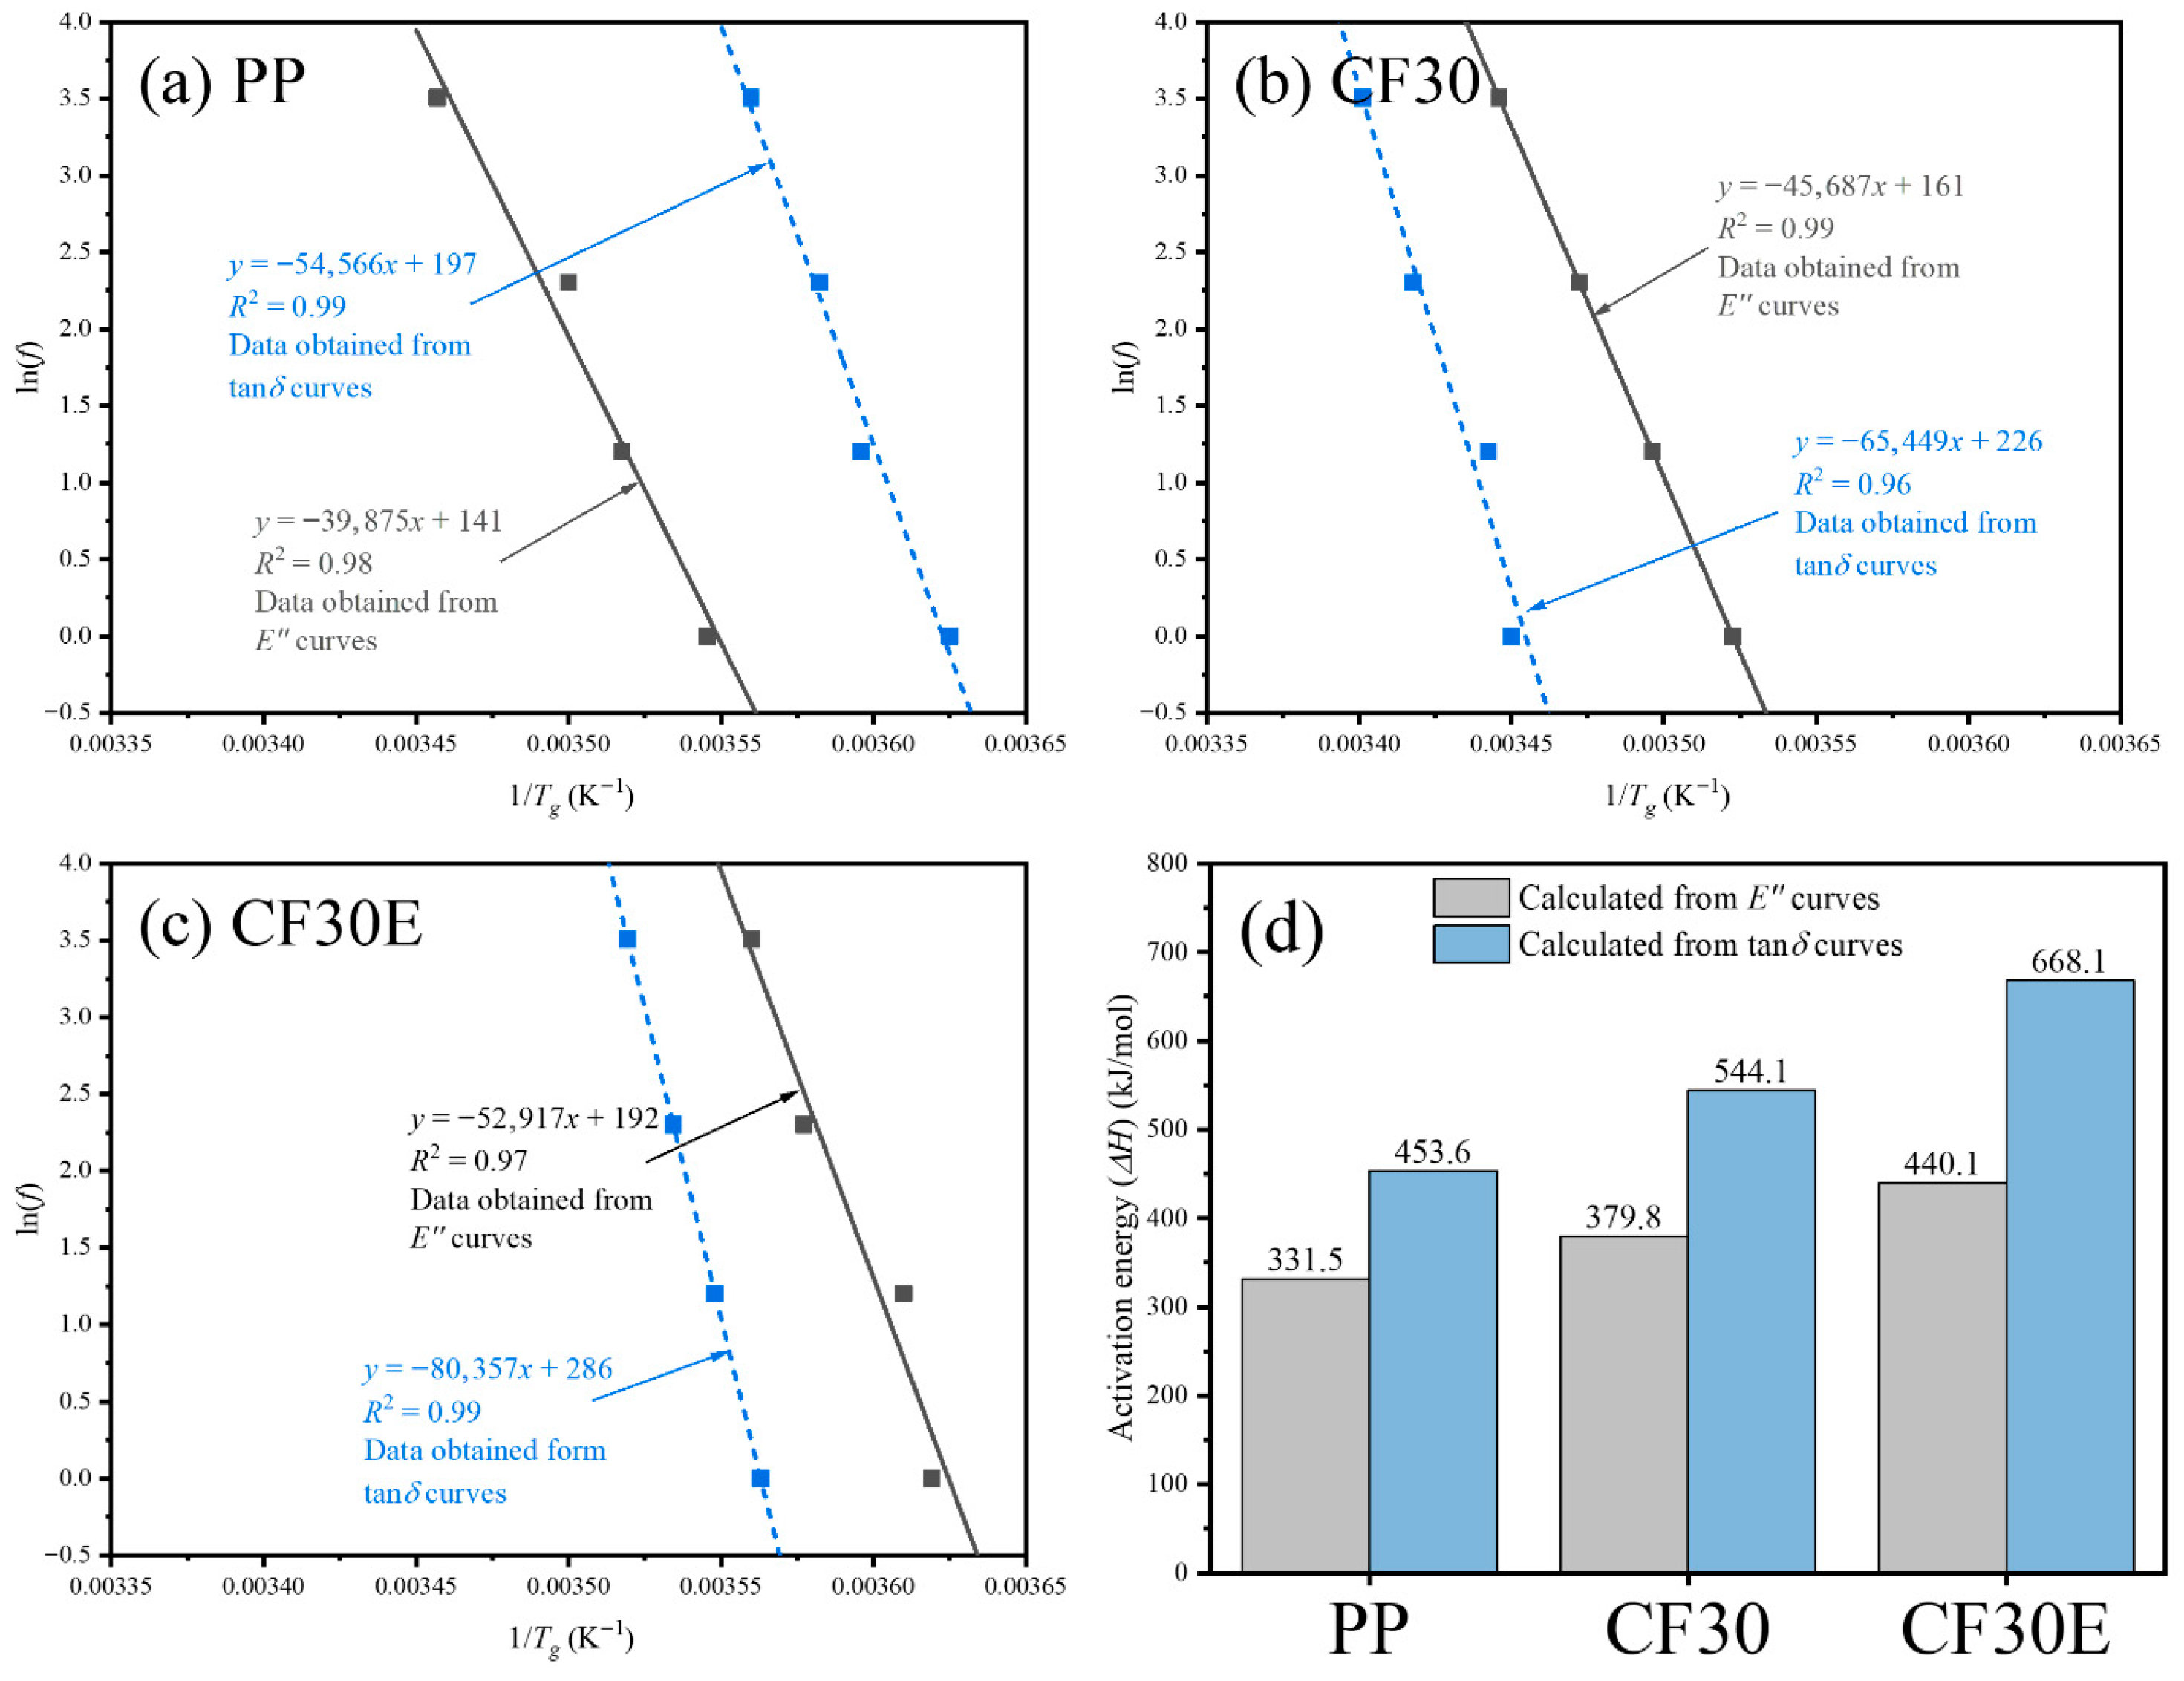
Figure 11a–c show the relationship between the measured glass transition temperature and the frequency of the alternating stress applied to the material; among them, the scattered points are the experimental data and the solid lines and dashed lines are the fitting lines. It can be seen that there is a good linear relationship between 1/Tg and ln(f), and the fitting degrees are all above 0.96. By substituting the slope of each fitting line into Equation (19), the activation energies of PP resin, CF30, and CF30E can be obtained, and the calculation results are shown in Figure 11d. The activation energy represents the difficulty of molecular chain movement in polymer materials; a higher activation energy indicates that the molecular chains are more difficult to move. Therefore, the activation energy of polymer materials is usually related to the creep resistance of the material; a higher activation energy corresponds to higher creep resistance [24]. It can be seen from Figure 11d that the activation energies of PP resin, CF30, and CF30E increase in sequence, which indicates that the introduction of reinforcing fibers and interfacial enhancement can both increase the activation energy of polymer materials, which is consistent with the conclusions of previous studies [24,27]. At the same time, the gradual increase in the activation energies of PP resin, CF30, and CF30E also means that their creep resistance increases gradually, which is consistent with the experimental phenomena shown in Figure 2 and Figure 3.

3.3.3. Isothermal Tensile Creep Curves and Creep Master Curves

Figure 12 shows the isothermal tensile creep curves of CF30 and CF30E under a load of 2 MPa. It can be observed that with the increase in temperature, the deformation of both CF30 and CF30E gradually increases; this is because the increase in temperature promotes the movement of PP resin molecular chains [28]. Based on the Time–Temperature Superposition Principle, the long-term tensile creep curve of CF30 and CF30E at a reference temperature of 30 °C, also known as the creep master curve, can be plotted by shifting and combining the short-term tensile creep curves in Figure 12. At present, there is no recognized and mature procedure to help researchers plot the creep master curve; therefore, researchers have a high degree of empiricism when plotting the creep master curve [29]. In this study, the method for plotting the creep master curve proposed by Chae et al. [30] and Liu et al. [31] was referred to; that is, in terms of the shifting order, the isothermal tensile creep curve closest to the reference temperature is first shifted to the reference temperature, and then the isothermal tensile creep curves far from the reference temperature are shifted. In terms of the shift factor, the creep rates at the initial and end segments of two adjacent curves are considered to determine the manual shift factor.
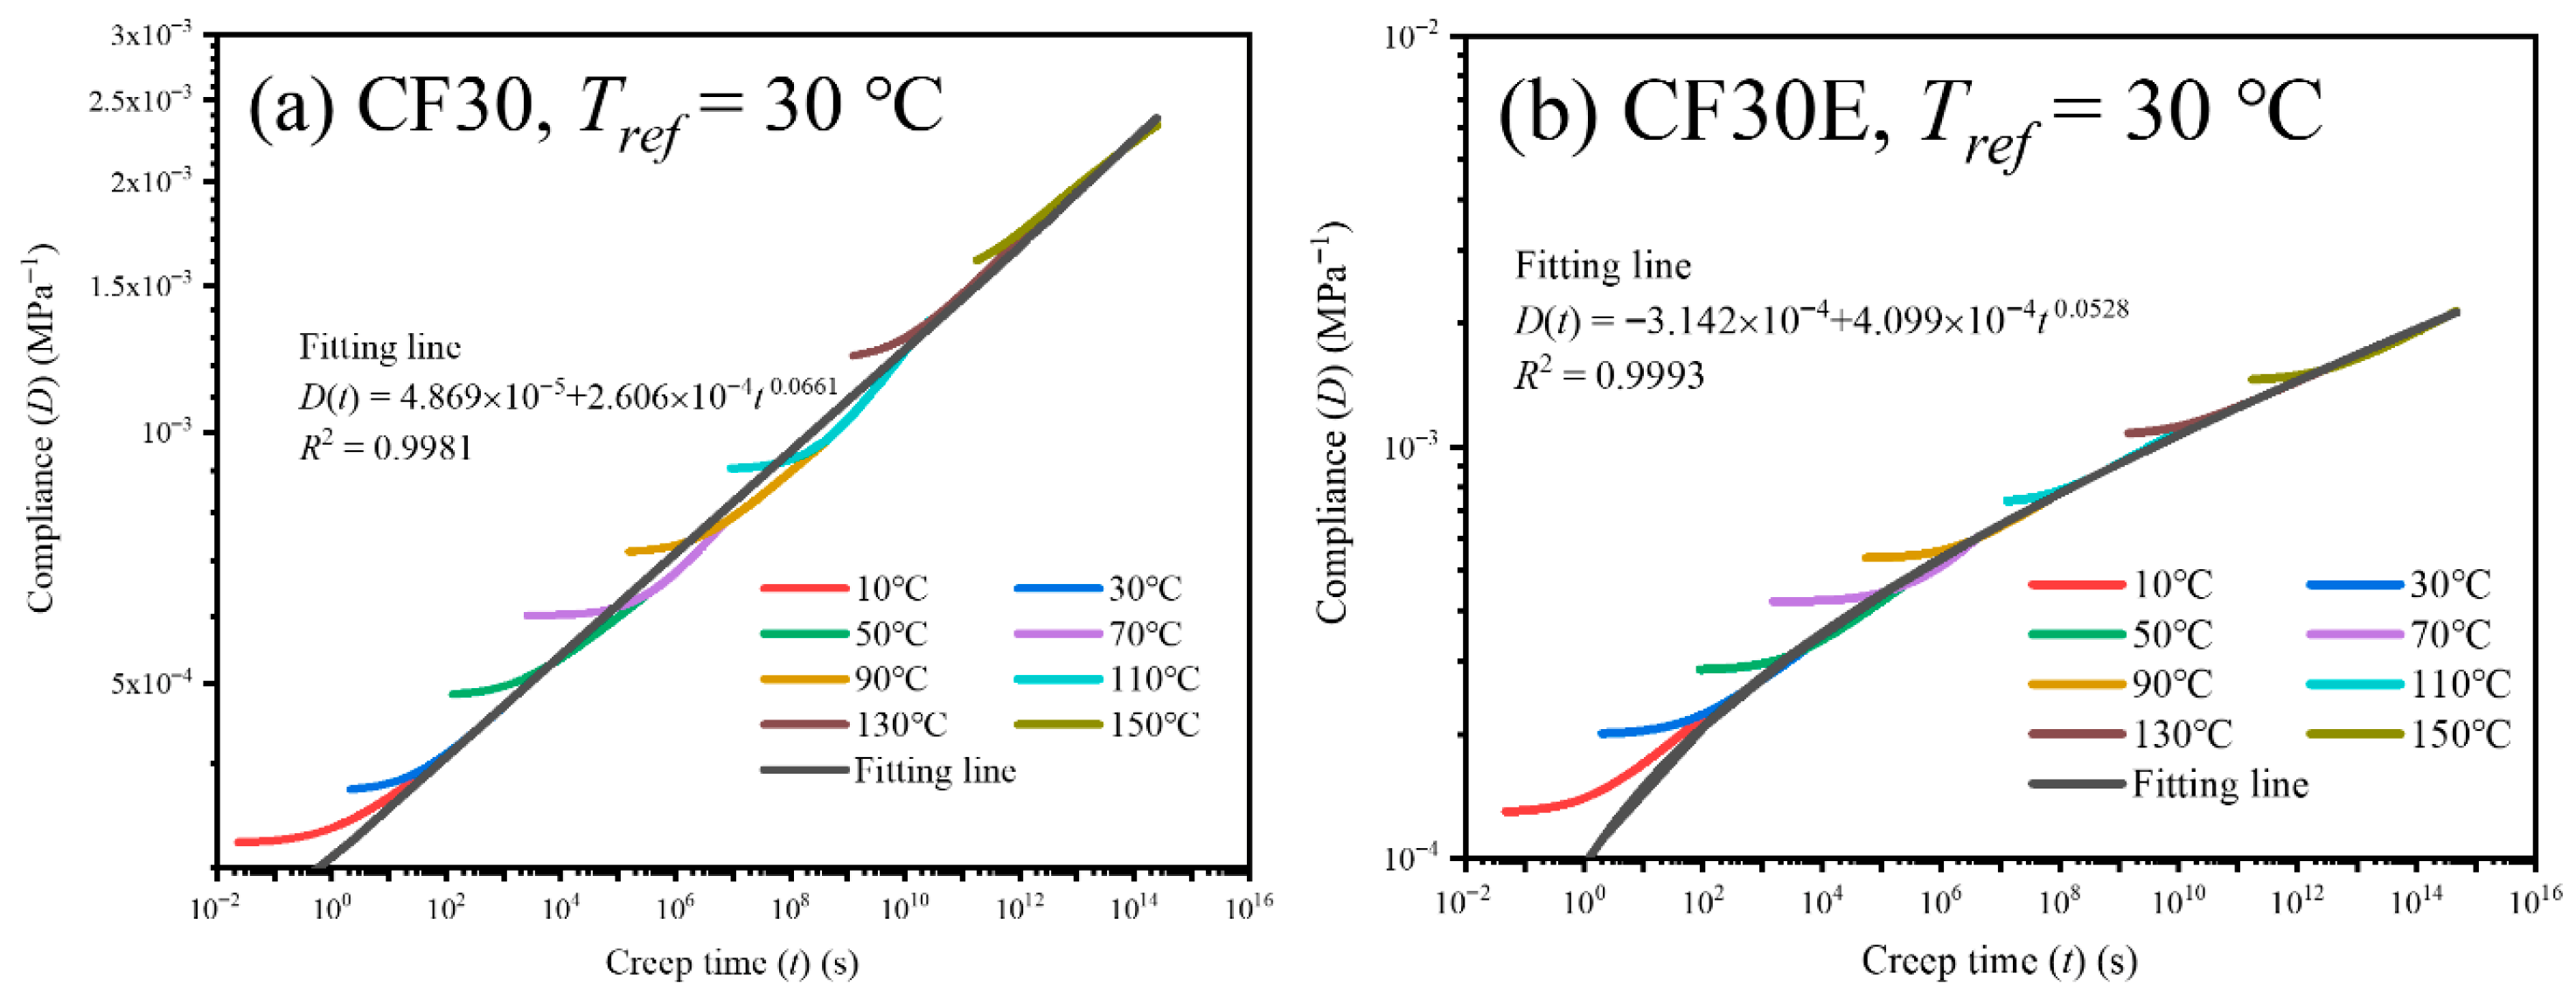
Figure 13 shows the tensile creep master curves of CF30 and CF30E at a reference temperature of 30 °C, where the shift factor used is the manual shift factor (see Figure 14). In general, for high polymers, the creep master curve plotted based on the Time–Temperature Superposition Principle is smooth; however, the tensile creep master curves in Figure 13 are not smooth, which indicates that the PP/CF wet-laid nonwoven composites do not strictly follow the Time–Temperature Superposition Principle [11], and this may be caused by the expansion of the composite when the temperature changes.
Secondly, within 0~1014 s, the plotted creep master curve does not show creep rupture or typical three-stage creep behavior, which indicates that the prepared PP/CF wet-laid nonwoven composite with 30 vol% CF content has strong creep resistance and good long-term service performance. In addition, it can be clearly observed that the creep deformation of CF30E is smaller than that of CF30; this indicates that interfacial enhancement is beneficial to improve the long-term service performance of the composite.
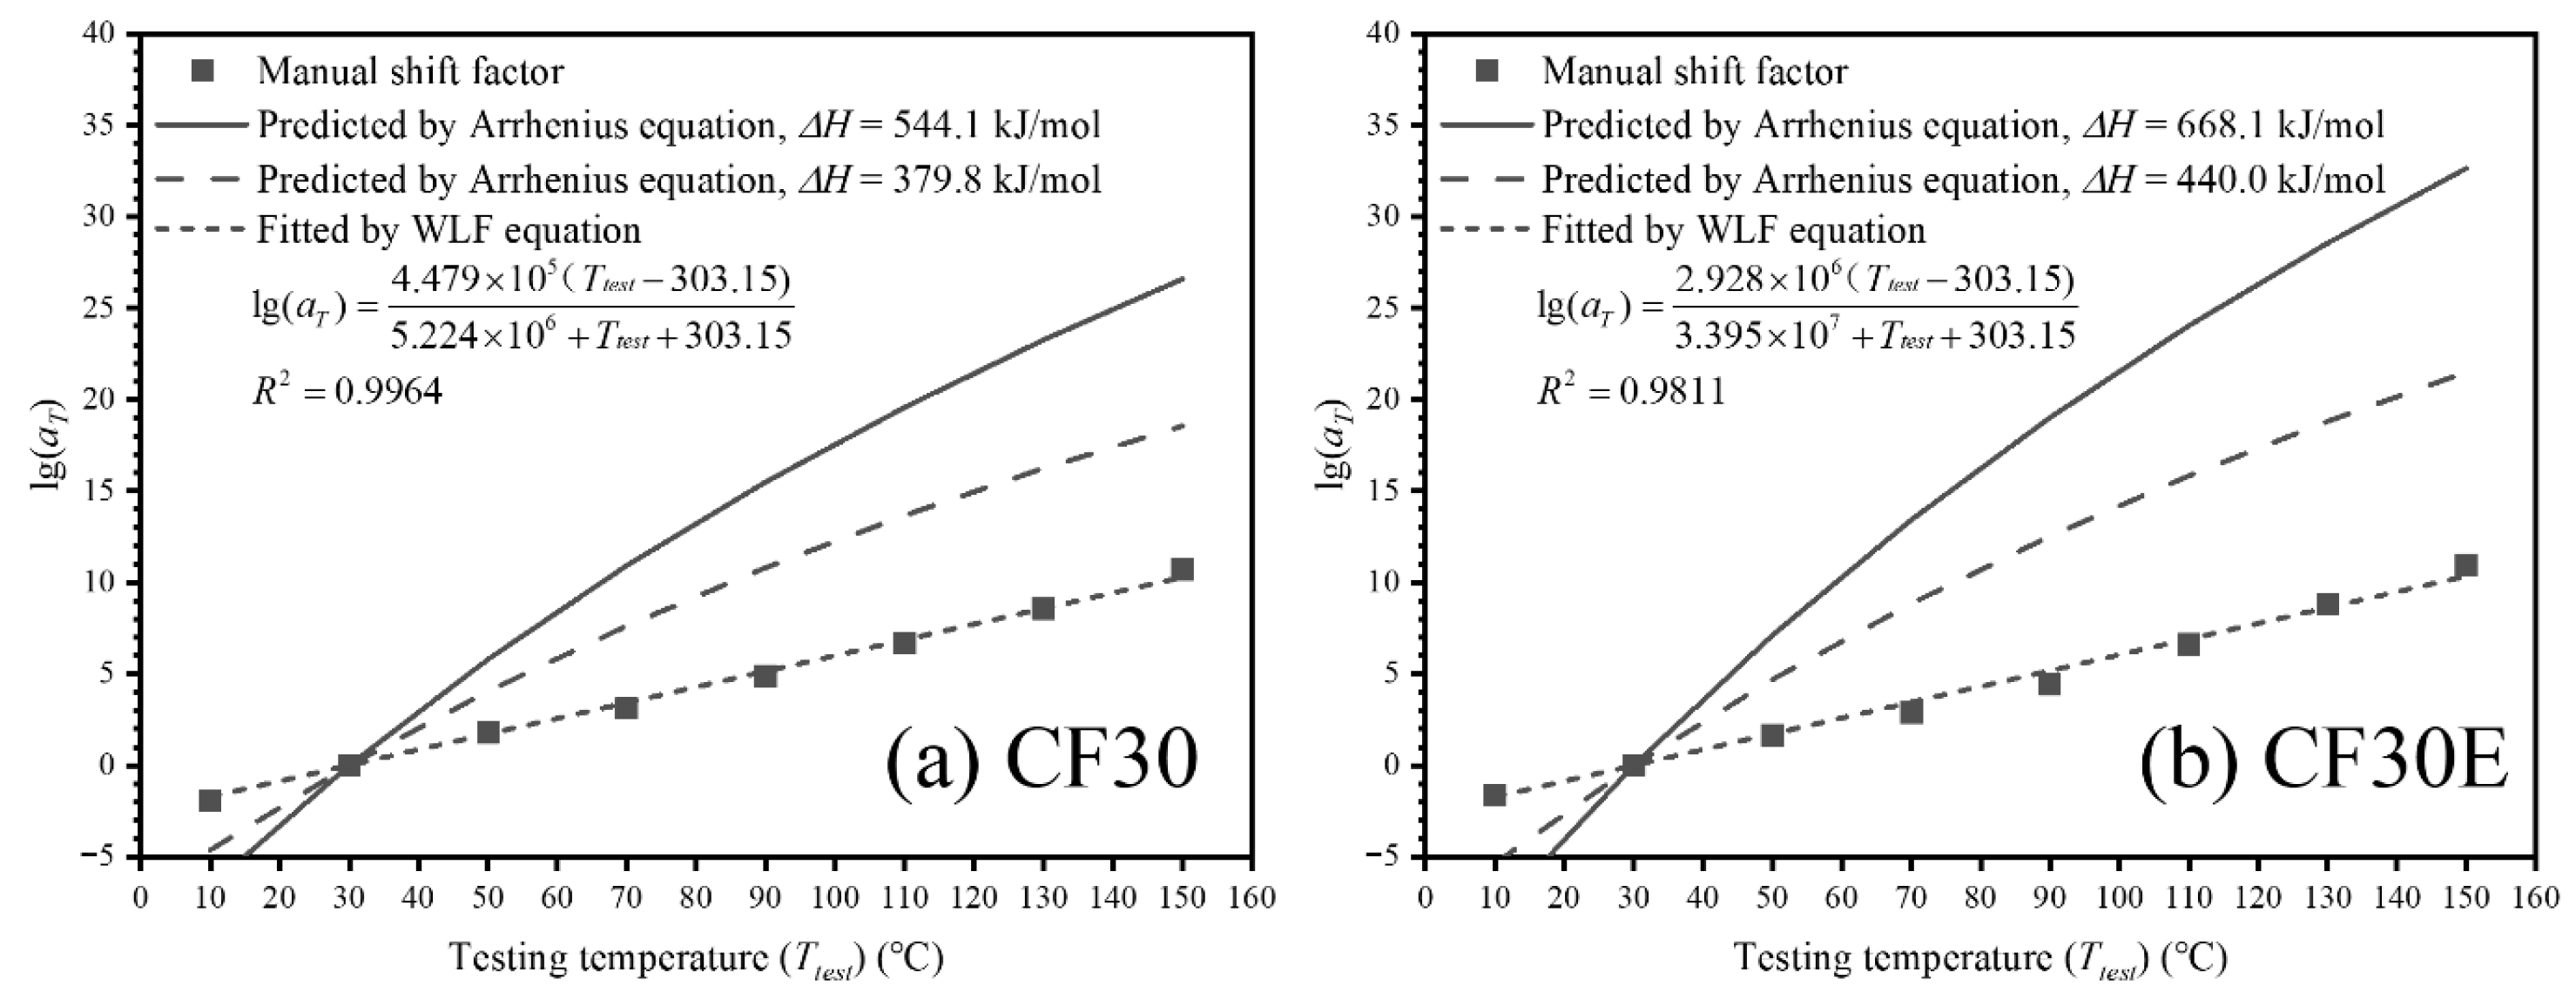
Figure 14 compares the manual shift factor with the values predicted by the Arrhenius equation and fitted by the WLF equation. The results show that the Arrhenius equation cannot predict the shift factor well, but the WLF equation can fit the manual shift factor well. For CF30, the fitting degree is 0.9964, the value of C1 is 4.479 × 10⁵, and the value of C2 is 5.224 × 10⁶; for CF30E, the fitting degree is 0.9811, the value of C1 is 2.928 × 10⁶, and the value of C2 is 3.395 × 10⁷. As mentioned earlier, the application range of the WLF equation is generally Tg~Tg + 100 K, and the application range of the Arrhenius equation is generally below Tg. Table 5 shows that the glass transition temperature range of CF30 is 10.73~20.87 °C, and that of CF30E is 3.17~10.99 °C; therefore, the test temperatures used in Figure 12 are basically within the range of Tg~Tg + 100 K. The good fitting degree of the WLF equation to the manual shift factor also indicates that when the temperature range is 10~150 °C, the energy dissipation mechanism of CF30 and CF30E remains unchanged, which is the movement of resin molecular chains [32].

4. Conclusions

This study examined the tensile creep behavior of PP/CF wet-laid nonwoven composites, with emphasis on the influences of carbon fiber (CF) content, load level, and interfacial enhancement. Both short- and long-term creep behaviors were investigated. Short-term creep tests revealed that creep resistance first increases and then decreases with rising CF content, peaking at 30 vol%. Higher load levels reduced creep resistance, while interfacial enhancement improved it. Both the Findley and Burgers models effectively described the short-term creep behavior; the Findley model offered better fitting accuracy, whereas the Burgers model provided more insight into the composite’s intrinsic creep characteristics. For long-term assessment, a creep master curve at a reference temperature of 30 °C was constructed using the Time–Temperature Superposition Principle for the 30 vol% CF composites. The master curve showed no signs of creep rupture or typical three-stage creep, indicating good long-term creep resistance. Interfacial enhancement further improved performance, supporting extended service life. The aforementioned conclusions will deepen researchers’ understandings of the creep behavior of PP/CF wet-laid nonwoven composites and provide theoretical support for their practical applications.
Future research can focus on the creep mechanisms of this composite, thereby providing further support for its applications.

Supplementary Materials

The following supporting information can be downloaded at: https://www.mdpi.com/article/10.3390/app152212167/s1, Figure S1: Comparisons between the experimental creep curves and the model-fitting creep curves; Table S1: Tensile strength of the prepared composites.

Author Contributions

Conceptualization, methodology, data curation, X.Y.; visualization, X.Y. and X.D.; writing—original draft preparation, X.Y.; writing—review and editing, funding acquisition, J.L.; supervision, project administration, J.Z. All authors have read and agreed to the published version of the manuscript.

Funding

This research was funded by the Guangdong Basic and Applied Basic Research Foundation, Grant No. 2025A1515010974.

Institutional Review Board Statement

Not applicable.

Informed Consent Statement

Not applicable.

Data Availability Statement

The original contributions presented in this study are included in the article. Further inquiries can be directed to the corresponding author.

Conflicts of Interest

The authors declare no conflicts of interest. The funders had no role in the design of the study; in the collection, analyses, or interpretation of data; in the writing of the manuscript; or in the decision to publish the results.

References

  1. Du, Y.; Yan, N.; Kortschot, M.T. A simplified fabrication process for biofiber-reinforced polymer composites for automotive interior trim applications. J. Mater. Sci. 2013, 49, 2630–2639. [Google Scholar] [CrossRef]
  2. Yan, X.; Zhao, G.; Yang, J.; Wang, X. Improving the interfacial shear strength of polypropylene/carbon fiber nonwoven composite by three different methods. J. Reinf. Plast. Compos. 2023, 42, 1207–1219. [Google Scholar] [CrossRef]
  3. Yan, X.; Zhao, G.-l.; Yang, J.; Wang, X.-w. Void content of polypropylene/carbon fiber wet-laid nonwoven composites: Effect of fiber content and molding conditions, and void elimination mechanism. Polym. Compos. 2023, 44, 7181–7196. [Google Scholar] [CrossRef]
  4. Alves, F.C.; Monticeli, F.M.; Neves, R.M.; Voorwald, H.J.C.; Cioffi, M.O.H.; Ornaghi, H.L. Influence of void content and morphology on the creep behavior on glass/epoxy composites. Compos. Commun. 2021, 25, 100712. [Google Scholar] [CrossRef]
  5. GB/T 11546.1-2008; Plastic—Determination of Creep Behaviour—Part 1: Tensile Creep. General Administration of Quality Supervision, Inspection and Quarantine (AQSIQ): Beijing, China, 2008.
  6. ASTM D 2584; Standard Test Method for Ignition Loss of Cured Reinforced Resins. ASTM: West Conshohocken, PA, USA, 2018.
  7. ASTM D2734; Standard Test Methods for Void Content of Reinforced Plastics. ASTM: West Conshohocken, PA, USA, 2023.
  8. Dobeš, F.; Milička, K. The relation between minimum creep rate and time to fracture. Met. Sci. 1976, 10, 382–384. [Google Scholar] [CrossRef]
  9. Raghavan, J.; Meshii, M. Creep of polymer composites. Compos. Sci. Technol. 1998, 57, 1673–1688. [Google Scholar] [CrossRef]
  10. Alves, F.C.; Monticeli, F.M.; Voorwald, H.J.C.; Cioffi, M.O.H. The relation of porosity and creep behavior of glass fiber/epoxy composite: Design of experiments approach. Polym. Compos. 2021, 42, 5869–5879. [Google Scholar] [CrossRef]
  11. Zhang, Y.-Y.; Sun, Z.; Li, Y.-Q.; Huang, P.; Chen, Q.; Fu, S.-Y. Tensile creep behavior of short-carbon-fiber reinforced polyetherimide composites. Compos. Part B Eng. 2021, 212, 108717. [Google Scholar] [CrossRef]
  12. Zhai, Z.Y.; Jiang, B.Y.; Drummer, D. Tensile Creep Behavior of Quasi-Unidirectional E-Glass Fabric Reinforced Polypropylene Composite. Polymers 2018, 10, 661. [Google Scholar] [CrossRef]
  13. Abdel-Magid, B.; Lopez-Anido, R.; Smith, G.; Trofka, S. Flexure creep properties of E-glass reinforced polymers. Compos. Struct. 2003, 62, 247–253. [Google Scholar] [CrossRef]
  14. Plaseied, A.; Fatemi, A. Tensile Creep and Deformation Modeling of Vinyl Ester Polymer and Its Nanocomposite. J. Reinf. Plast. Compos. 2009, 28, 1775–1788. [Google Scholar] [CrossRef]
  15. Zhao, L.L.; Wei, Y.; Zhang, G.W.; Xi, F. Short-term creep properties and creep model of wood-plastic composites. Polym. Compos. 2022, 43, 924–933. [Google Scholar] [CrossRef]
  16. Karabal, M.; Yıldız, A. Creep resistance enhancement and modeling of 3D printed Polyetherimide/carbon black composites. Compos. Struct. 2024, 345, 118398. [Google Scholar] [CrossRef]
  17. Georgiopoulos, P.; Kontou, E.; Christopoulos, A. Short-term creep behavior of a biodegradable polymer reinforced with wood-fibers. Compos. Part B-Eng. 2015, 80, 134–144. [Google Scholar] [CrossRef]
  18. Tang, X.-G.; Hou, M.; Zou, J.; Truss, R.; Zhu, Z. The creep behaviour of poly(vinylidene fluoride)/”bud-branched” nanotubes nanocomposites. Compos. Sci. Technol. 2012, 72, 1656–1664. [Google Scholar] [CrossRef]
  19. Dong, C.X.; Zhu, S.J.; Mizuno, M.; Hashimoto, M. Modeling and prediction of compressive creep of silane-treated TiO2/high-density polyethylene. J. Mater. Sci. 2010, 45, 3506–3513. [Google Scholar] [CrossRef]
  20. Nakazato, Y.; Zhu, S.; Usuki, A.; Kato, M. Analysis and Prediction of Creep Viscoelasticity in Nylon 6 Clay Hybrid Nanocomposites. J. Solid Mech. Mater. Eng. 2010, 4, 856–863. [Google Scholar] [CrossRef]
  21. ASTM D 4065-94; Standard Practice for Plastics: Dynamic Mechanical Properties: Determination and Report of Procedures. ASTM: West Conshohocken, PA, USA, 2001.
  22. Ghernaout, D.; Belaadi, A.; Boumaaza, M.; Chai, B.X.; Jawaid, M.; Abdullah, M.M.S.; Krishnasamy, P.; Al-Khawlani, A. Effects of incorporating cellulose fibers from Yucca treculeana L. on the thermal characteristics of green composites based on high-density poly-ethylene: An eco-friendly material for cleaner production. J. Mater. Res. Technol. 2024, 31, 787–798. [Google Scholar] [CrossRef]
  23. Gao, N.; Li, J.; Li, S.; Peng, Z. The dynamic mechanical properties of EPDM/Al(OH)3 composites. J. Appl. Polym. Sci. 2005, 98, 2454–2460. [Google Scholar] [CrossRef]
  24. Ayyagari, S.; Al-Haik, M. Enhancing the Viscoelastic Performance of Carbon Fiber Composites by Incorporating CNTs and ZnO Nanofillers. Appl. Sci. 2019, 9, 2281. [Google Scholar] [CrossRef]
  25. Spoljaric, S.; Genovese, A.; Shanks, R.A. Polypropylene–microcrystalline cellulose composites with enhanced compatibility and properties. Compos. Part A Appl. Sci. Manuf. 2009, 40, 791–799. [Google Scholar] [CrossRef]
  26. Ragoubi, M.; George, B.; Molina, S.; Bienaimé, D.; Merlin, A.; Hiver, J.M.; Dahoun, A. Effect of corona discharge treatment on mechanical and thermal properties of composites based on miscanthus fibres and polylactic acid or polypropylene matrix. Compos. Part A Appl. Sci. Manuf. 2012, 43, 675–685. [Google Scholar] [CrossRef]
  27. Paul, S.A.; Sinturel, C.; Joseph, K.; Mathew, G.D.G.; Pothan, L.A.; Thomas, S. Dynamic Mechanical Analysis of Novel Composites from Commingled Polypropylene Fiber and Banana Fiber. Polym. Eng. Sci. 2010, 50, 384–395. [Google Scholar] [CrossRef]
  28. Jabbar, A.; Militký, J.; Madhukar Kale, B.; Rwawiire, S.; Nawab, Y.; Baheti, V. Modeling and analysis of the creep behavior of jute/green epoxy composites incorporated with chemically treated pulverized nano/micro jute fibers. Ind. Crops Prod. 2016, 84, 230–240. [Google Scholar] [CrossRef]
  29. Pilz, G.; Wurzer, S.; Morak, M.; Pinter, G. Assessment of the stepped isothermal method for accelerated creep testing of high-density polyethylene. Mech. Time-Depend. Mater. 2022, 26, 775–790. [Google Scholar] [CrossRef]
  30. Chae, S.-H.; Zhao, J.-H.; Edwards, D.R.; Ho, P.S. Characterization of the Viscoelasticity of Molding Compounds in the Time Domain. J. Electron. Mater. 2010, 39, 419–425. [Google Scholar] [CrossRef]
  31. Liu, Y.; Huang, Z.; Sheng, B.; Wang, W.; Zhang, K. Experimental characterization of creep behavior of laminated bamboo composites based on stepped isothermal method. Polym. Compos. 2023, 44, 4551–4564. [Google Scholar] [CrossRef]
  32. Reis, A.K.d.; Monticelli, F.M.; Neves, R.M.; de Paula Santos, L.F.; Botelho, E.C.; Luiz Ornaghi, H., Jr. Creep behavior of polyetherimide semipreg and epoxy prepreg composites: Structure vs. property relationship. J. Compos. Mater. 2020, 54, 4121–4131. [Google Scholar] [CrossRef]
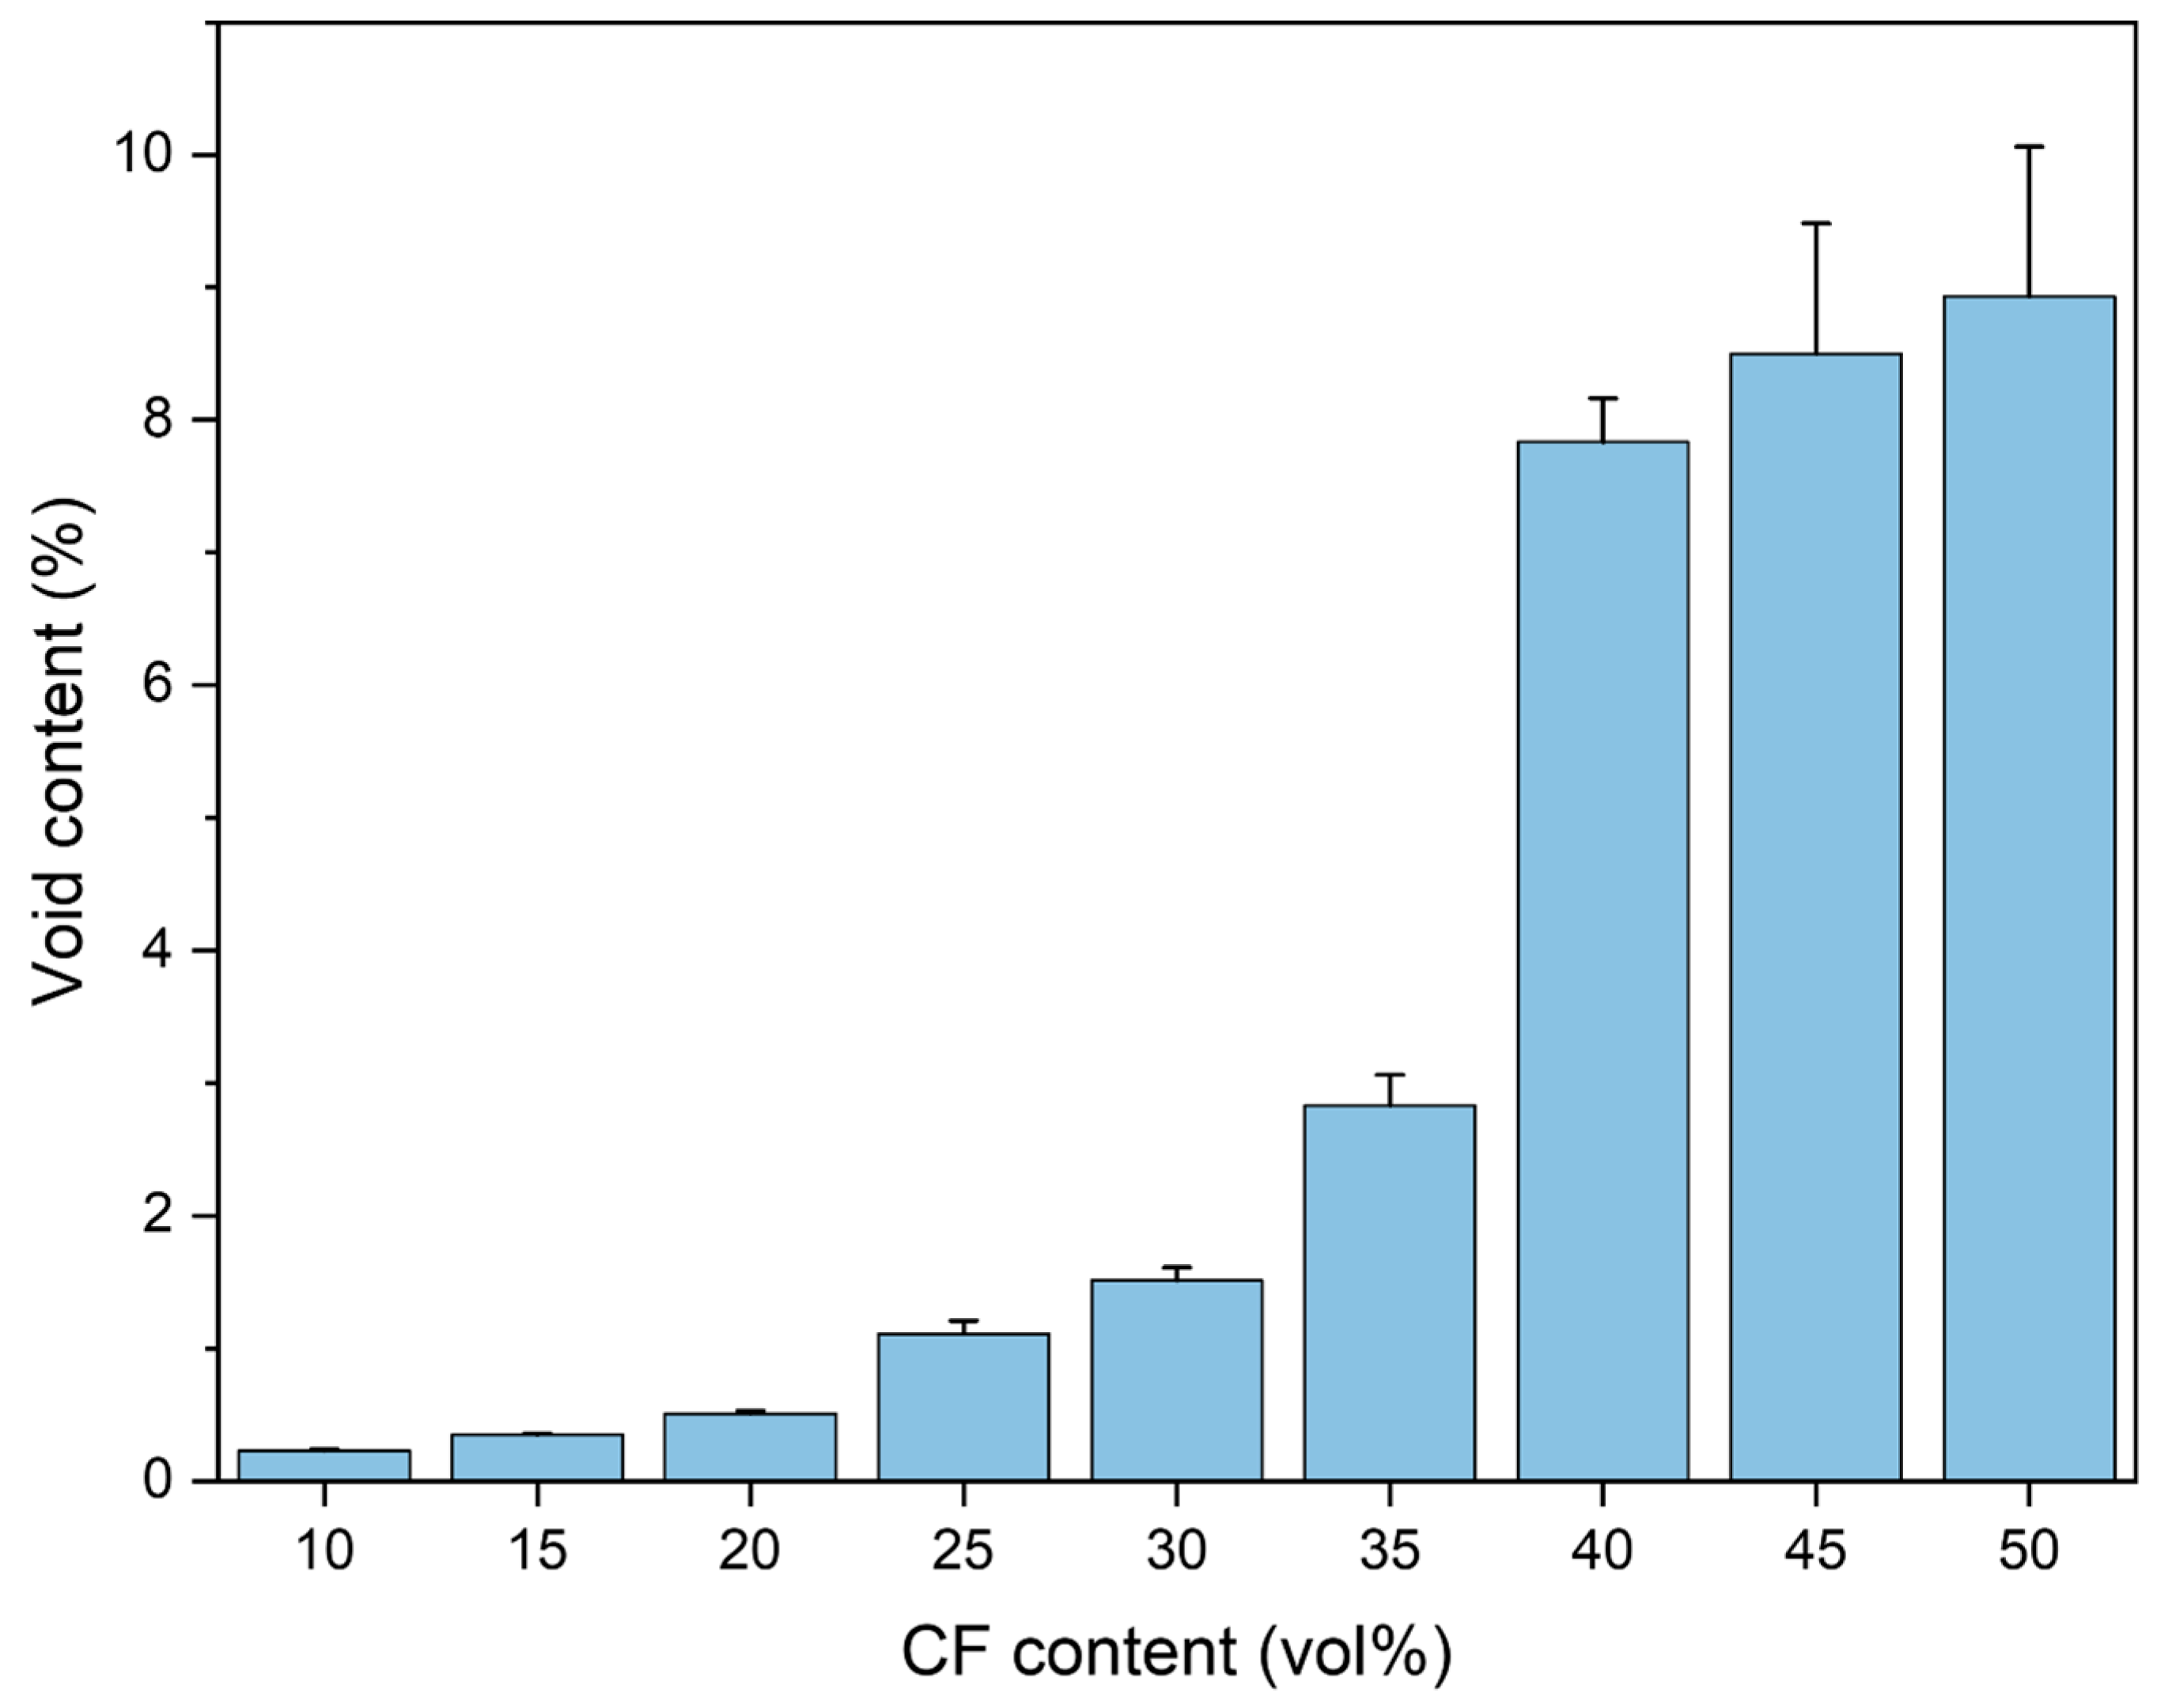
Figure 1. Void content of composites with different CF contents.
Applsci 15 12167 g001
Figure 2. The effect of CF content on the tensile creep behavior of the PP/CF wet-laid nonwoven composite: (a) tensile creep curves of the composites with CF content of 0, 10, 15, 20, 25, and 30 vol%; (b) tensile creep curves of the composites with CF content of 35, 40, and 45 vol%; (c) tensile creep curves of the composites with CF content of 50 vol%; (d) the effect of CF content on the minimal creep rate of the composite.
Applsci 15 12167 g002
Figure 3. The effect of loading levels and interfacial enhancement on the tensile creep behavior of the PP/CF wet-laid nonwoven composite: (a) loading of 10 MPa; (b) loading of 20 MPa; (c) loading of 40 MPa; (d) the effect of loading levels and interfacial enhancement on the minimal creep rate of the composite.
Applsci 15 12167 g003
Figure 4. Illustrations for the creep constitutive models [15,16].
Applsci 15 12167 g004
Figure 5. Trends of Parameter A and n: (a) effect of CF content on Parameter A; (b) effect of CF content on Parameter n; (c) effect of loading levels and interfacial-enhancement on Parameter A; (d) effect of loading levels and interfacial-enhancement on Parameter n.
Applsci 15 12167 g005
Figure 6. Trends of Parameter EM: (a) effect of CF content on Parameter EM; (b) effect of loading levels and interfacial enhancement on Parameter EM.
Applsci 15 12167 g006
Figure 7. Trends of Parameter EK: (a) effect of CF content on Parameter EK; (b) effect of loading levels and interfacial enhancement on Parameter EK.
Applsci 15 12167 g007
Figure 8. Trends of Parameter ηM: (a) effect of CF content on Parameter ηM; (b) effect of loading levels and interfacial enhancement on Parameter ηM.
Applsci 15 12167 g008
Figure 9. Trends of relaxation time τ: (a) effect of CF content on relaxation time τ; (b) effect of loading levels and interfacial enhancement on relaxation time τ.
Applsci 15 12167 g009
Figure 10. Loss modulus and loss factor of the PP matrix and the PP/CF wet-laid composites: PP’s loss modulus (a) and loss factor (b), CF30’s loss modulus (c) and loss factor (d), CF30E’s loss modulus (e) and loss factor (f).
Applsci 15 12167 g010
Figure 11. The relation between the glass transition temperature (Tg) and the frequency of alternating loading, and the activation energy of PP matrix, CF30, and CF30E: (ac) the relation between the glass transition temperature (Tg) and the frequency of alternating loading; (d) the activation energy of PP matrix, CF30, and CF30E.
Applsci 15 12167 g011
Figure 12. Isothermal tensile creep behavior of CF30 and CF30E under applied loading of 2 MPa: (a) CF30; (b) CF30E.
Applsci 15 12167 g012
Figure 13. Tensile creep master curve under the reference of 30 °C: (a) CF30; (b) CF30E.
Applsci 15 12167 g013
Figure 14. Comparisons between the manual shift factor, Arrhenius equation prediction, and WLF equation fitting values.
Applsci 15 12167 g014
Table 1. Molding pressures for composites with different CF content.
CF Content/vol%Molding Pressure/MPa
102
152
202
255
305
357
407
4510
5012
Table 2. Test conditions for the isothermal tensile creep test.
Specimen DimensionsTemperature Gradient/°CLoad/MPa
30 mm × 5 mm × 1 mm10, 30, 50, 70, 90, 110, 130, 1502
Table 3. Fitting parameters for Findley’s model.
CF Content/vol%Load/MPaInterfacial Conditionε0AnR2
020Without interfacial enhancement1.79 × 10−24.15 × 10−20.250.9997
10−1.18 × 10−33.52 × 10−30.052110.9999
157.38 × 10−41.60 × 10−30.072710.9965
206.50 × 10−41.22 × 10−40.089420.9994
25−3.35 × 10−51.52 × 10−30.07830.9970
301.72 × 10−31.42 × 10−40.21430.9973
35−1.06 × 10−33.09 × 10−30.048230.9963
405.70 × 10−42.25 × 10−30.086170.9983
454.15 × 10−34.10 × 10−50.51010.9997
509.63 × 10−32.86 × 10−51.1450.9957
3010Without interfacial enhancement1.18 × 10−32.17 × 10−50.29620.9950
30406.83 × 10−41.35 × 10−30.10280.9990
3010With interfacial enhancement−1.65 × 10−32.40 × 10−30.011780.9942
3020−1.12 × 10−32.25 × 10−30.038780.9986
30401.75 × 10−41.37 × 10−30.083480.9995
Table 4. Fitting parameters for Burgers model.
CF Content/vol%Load/MPaInterfacial ConditionEM/MPaEK/MPaηM/MPa sηK/MPa sR2
020Without interfacial enhancement6.35 × 1021.68 × 1031.00 × 1071.56 × 1060.9997
107.99 × 1034.12 × 1043.69 × 1082.92 × 1070.9990
156.96 × 1033.81 × 1043.84 × 1082.10 × 1070.9981
208.80 × 1034.19 × 1043.61 × 1082.63 × 1070.9986
259.80 × 1033.23 × 1043.81 × 1081.91 × 1070.9966
302.00 × 1041.30 × 1056.49 × 1084.20 × 1070.9912
358.47 × 1033.20 × 1043.31 × 1081.24 × 1070.9963
403.12 × 1031.18 × 1041.13 × 1086.55 × 1060.9967
454.69 × 1032.01 × 1045.07 × 1071.12 × 1070.9997
502.19 × 10−34.65 × 1043.75 × 1051.68 × 1050.9993
3010Without interfacial enhancement1.60 × 1042.13 × 1059.28 × 1081.33 × 1080.9612
30407.71 × 1032.82 × 1042.26 × 1081.46 × 1070.9980
3010With interfacial enhancement1.50 × 1047.14 × 1041.97 × 1091.66 × 1070.9780
30202.76 × 1041.10 × 1059.67 × 1083.45 × 1070.9979
30409.59 × 1034.12 × 1043.26 × 1082.49 × 1070.9989
Table 5. PP and PP/CF wet-laid nonwoven composites’ glass transition temperature measured under different conditions.
Test MethodFrequency/HzTg/°C
PPCF30CF30E
Peak of Loss Modulus Curve18.9010.733.17
3.3311.1412.873.86
1012.5614.866.40
33.316.1317.057.75
Peak of Loss Modulus Curve12.7116.717.51
3.334.9517.358.70
106.0119.449.79
33.37.7720.8710.99
Disclaimer/Publisher’s Note: The statements, opinions and data contained in all publications are solely those of the individual author(s) and contributor(s) and not of MDPI and/or the editor(s). MDPI and/or the editor(s) disclaim responsibility for any injury to people or property resulting from any ideas, methods, instructions or products referred to in the content.