Article

Characterization of Upper Extremity Joint Angle Error for Virtual Reality Motion Capture Compared to Infrared Motion Capture

by
Skyler A. Barclay
1,
Trent Brown
1,
Tessa M. Hill
2,
Ann Smith
2,
Timothy Reissman
1,*,
Allison L. Kinney
1 and
Megan E. Reissman
1
1
Empower Lab., University of Dayton, Dayton, OH 45469, USA
2
Gait & Motion Analysis Lab., Dayton Children’s Hospital, Miamisburg, OH 45342, USA
*
Author to whom correspondence should be addressed.
Appl. Sci. 2025, 15(22), 12081; https://doi.org/10.3390/app152212081
Submission received: 1 October 2025 / Revised: 24 October 2025 / Accepted: 10 November 2025 / Published: 13 November 2025
(This article belongs to the Special Issue Virtual Reality in Physical Therapy)

Abstract

Virtual reality (VR) offers built-in wearable sensor-based tracking capabilities. Current research focusses on position and orientation error, with limited results on more clinically relevant metrics, such as joint angles. This leads us to our first objective, to characterize the accuracy of upper extremity VR motion capture. Since the intent is for clinical translation, our second objective is to compare the errors across people identified as healthy controls and people who had experienced a spinal cord injury (SCI). Spatially and temporally synced VR and infrared motion capture data were collected during a variety of custom VR Beat Saber levels. Error values were found with infrared motion capture as the ground truth. The median RMSE was found to be below 7° for shoulder horizontal adduction and elbow flexion and 5° for shoulder elevation and wrist joint metrics. The percentage median error for the range of motion was found to be below 30%, 15%, and 5% for the frontal wrist, sagittal wrist, and all other joints, respectively. Larger standard deviations suggest that repetitions are needed to obtain reliable measurements. No statistical difference in any error metric was found between the control cohort and SCI cohort, providing evidence for clinical translation for post-SCI treatment.

1. Introduction

Virtual reality (VR) offers a platform to present engaging visual tasks, with built-in wearable sensor-based tracking capabilities. Most researchers have focused on validating VR trackers by comparing direct position and orientation values to a ground truth measurement in controlled environments [1,2,3,4,5]. However, less attention has been given to assessing their ability to capture clinically relevant metrics, such as joint angles, and with the intended clinical population, both of which are essential for evaluating movement quality and functional outcomes in a clinical setting. Within this study we plan to characterize the joint angle error intrinsic to HTC Vive 3.0 trackers with a combination of healthy controls and people of the intended clinical population.
Physical and occupational therapists frequently work with individuals who present a wide range of functional capabilities and affected regions, necessitating rehabilitation programs that are highly adaptable and tailored to the individual [6]. While the lower extremity has been extensively studied and supported by numerous normative datasets largely driven by the standardization and recognition of gait patterns [7], the upper extremity (UE) presents greater challenges. UE challenges include the lack of standardized and repeatable movements that often require multi-planar movement. Although quantified research on UE movement is more limited, it is used in almost all forms of activities of daily living [8], which is especially important for people who may be wheelchair-bound and rely mostly on their upper body.
A further challenge for clinics is the quantification of patients’ motor function, as access to advanced motion analysis systems is limited. The infrared (IR) camera-based motion capture system is the gold standard for motion analysis, but its inherent cost and complexity make it impractical for the average clinic to implement [1,9]. VR technology offers a promising alternative, combining wearable sensors with the ability to create customizable therapeutic environments and games, thereby supporting both functional assessment and rehabilitation.
While VR hardware can track motion, the accuracy of the tracking needs to be quantified for clinically relevant metrics such as joint angles. Ideally, since IR camera-based motion capture systems are the gold standard for tracking human movement, other systems such as wearable sensors should use an IR system as the ground truth for evaluation and comparisons [9]. Prior research focuses on more singular tracker metrics with positional errors between 1 and 5 cm and orientation errors below 0.4° [1,2,3,10]. Some studies have reported errors of only a few millimeters; however, these are typically values found from robotic movements or static positions [4,5,11] and it has been found that error increased when tracking humans compared with robotic movement [4] and at higher velocities [12]. Kinematic studies have compared joint angles between VR and IR motion capture, resulting in deviations between ±6° and ±42° across 16 full body joints [13] and a center of mass error of 2.1 ± 2.6 cm [14]. Finally, a latency of approximately 10 ms was reported for the Vive Tracker Ultimate [5], which may be relevant for applications requiring precise timing; however, in clinical contexts where peak values or the range of motion are the primary focus, such latency is unlikely to significantly impact outcomes. Although the benefit of Vive trackers in motion capture has been identified, all of these prior studies involved uniplanar range of motion (ROM)-type movements with healthy participants or robotic devices. Multiplanar open-ended motions introduce complexity that the previous studies have not discussed. This is in part due to the lack of standardized cyclic UE movements.
The commercially available VR game Beat Saber offers a useful platform for characterizing VR tracker error. It enables fully customizable movement tasks that can be performed across various locations within a user’s ROM or workspace. The tasks are often cyclic and repeatable, with clear start and end points, making them comparable to gait analyses. Each movement involves slicing through specific and predefined target positions. However, the path a person takes to achieve the task is open-ended, allowing for natural variation in movement strategy and complex degrees of freedom that are inherent with everyday UE motion. The game is also fully accessible from a wheelchair or seated position, enhancing its applicability across diverse populations. Moreover, the gamification aspect of Beat Saber provides a motivating and engaging way to present a high volume of movement tasks correlated to the beat of a variety of music genres. These varied movements help capture a comprehensive picture of VR tracker error.
A review of previous work has led to our main objectives for this research. The first objective is to validate and characterize the accuracy of UE motion tracking with VR compared to IR motion capture systems with respect to joint angles and segment-specific metrics. The study protocol is also motivated by the intent to evaluate clinical approaches with the intended population. This leads us to our second objective which is to characterize the error for multiple cohorts including people identified as healthy controls and people who had experienced a spinal cord injury (SCI). We hypothesize that the accuracy of the VR motion capture tracking will not be significantly different between the control cohort and the SCI cohort.

2. Materials and Methods

To accomplish the study objectives, spatially and temporally synced virtual reality (VR) and infrared (IR) motion capture data was collected. Data was not assessed for latency-induced errors in this study; therefore temporal alignment allows for the best comparison. The participants completed multiple static poses, ROM, as well as a variety of custom VR game levels while equipped with both VR and IR motion capture systems. All levels were played in the commercially available game, Beat Saber (Beat Games, Prague, Czech Republic; Version 1.34.2). Once the processing was completed, error values were found to characterize the difference between the two systems, with IR motion capture being the ground truth.

2.1. Equipment and Software

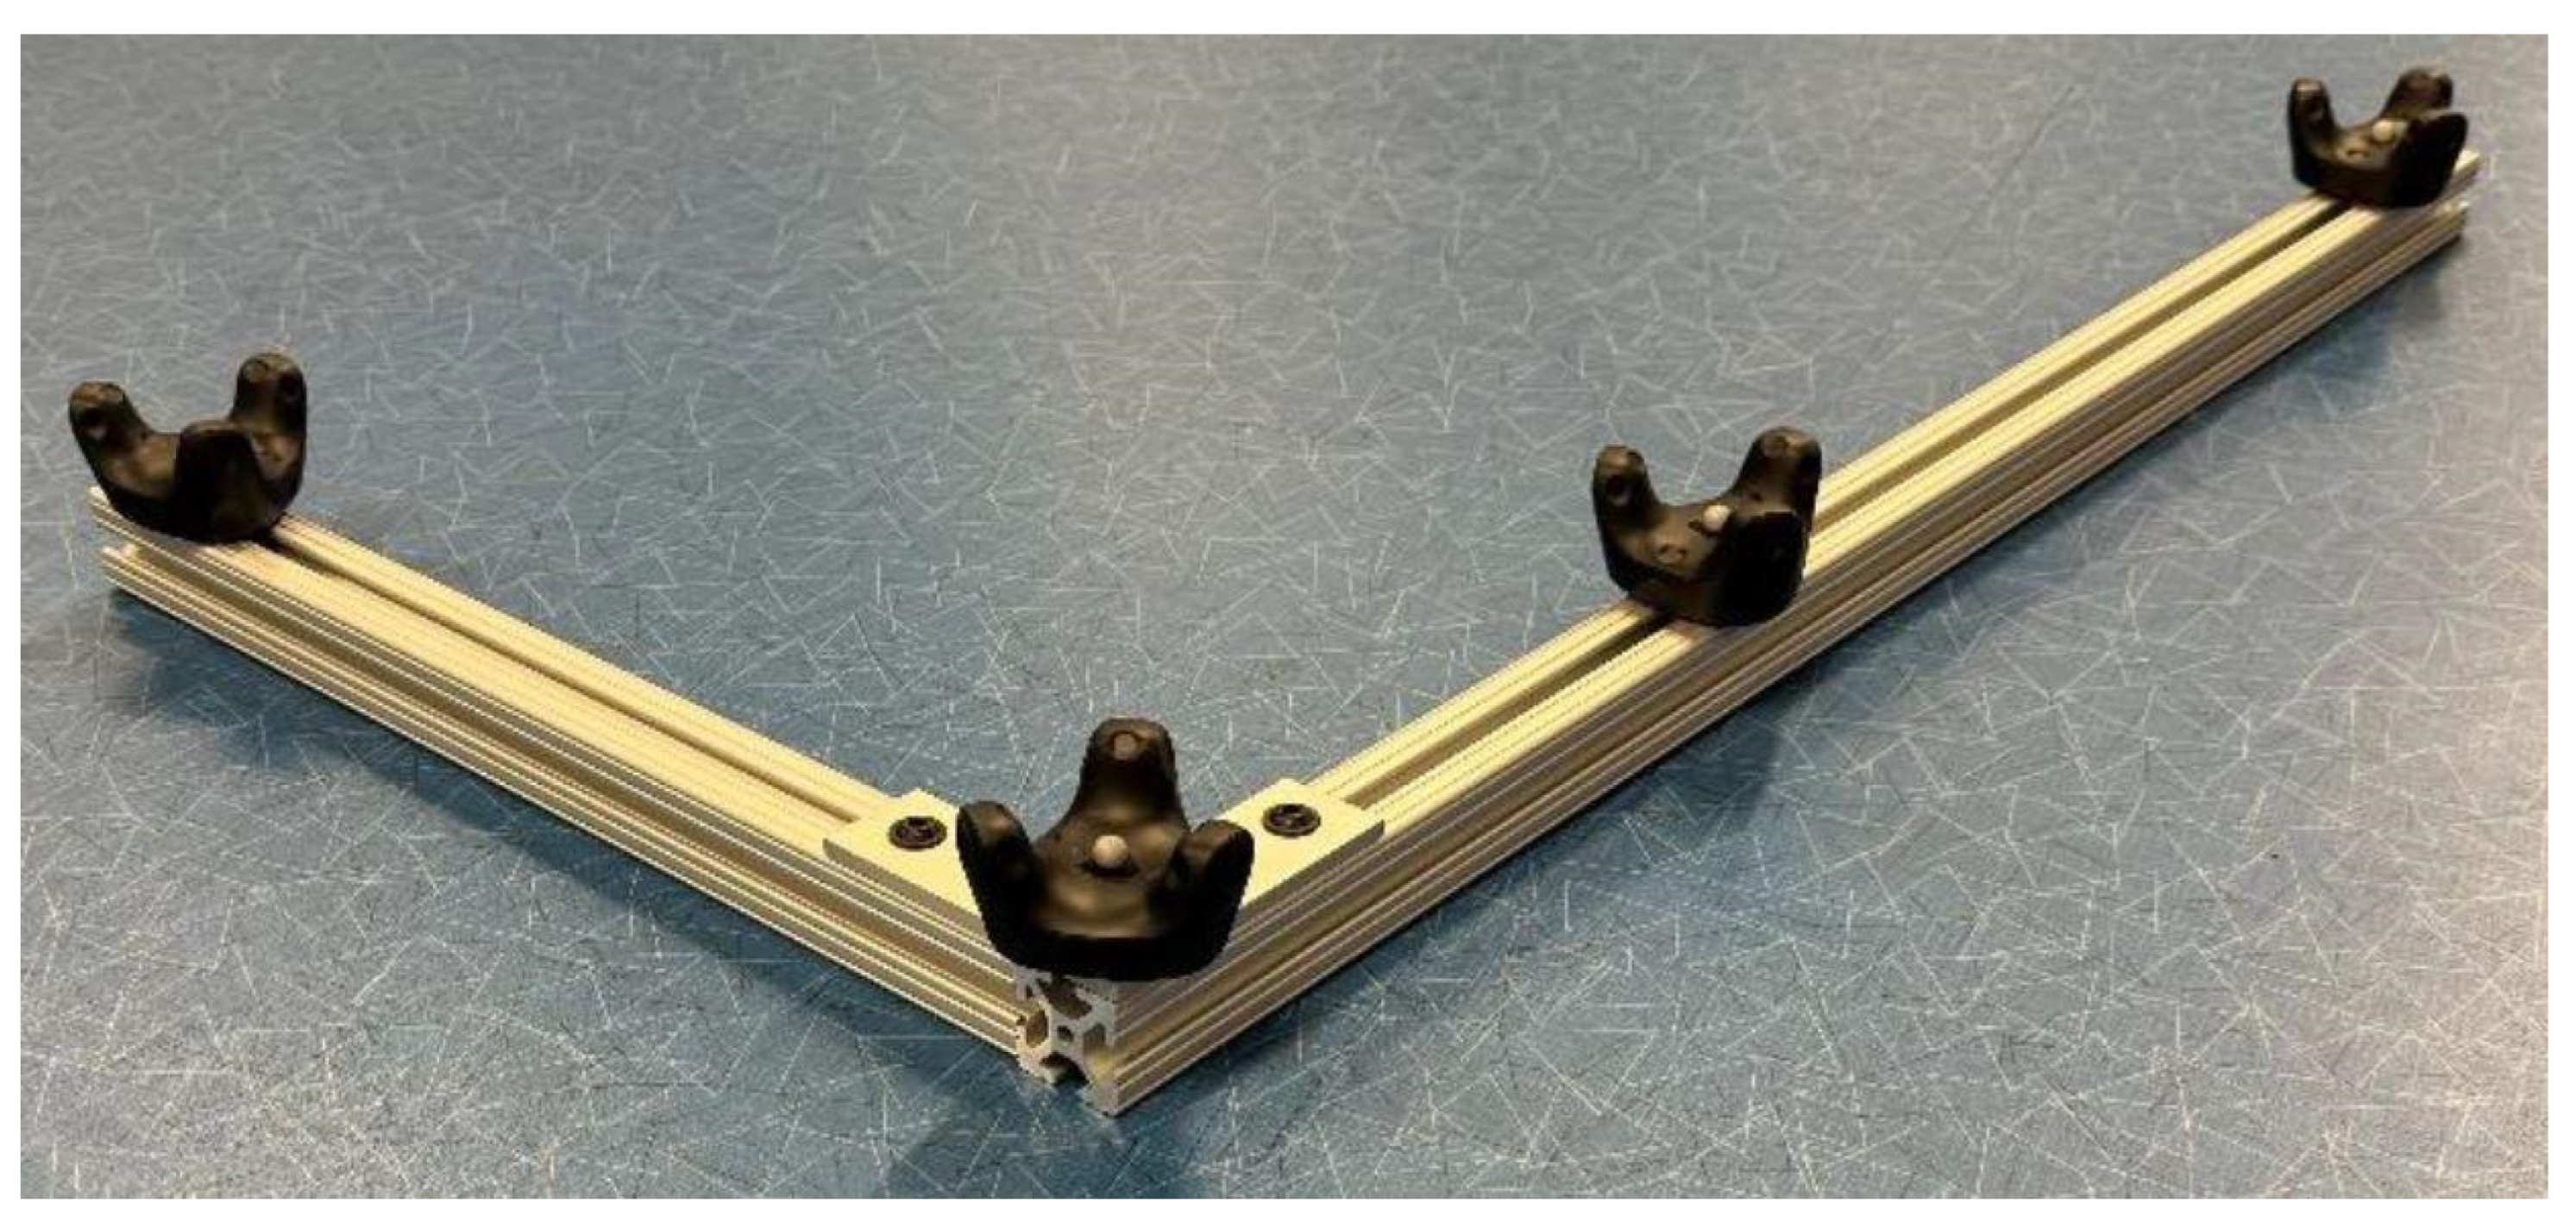
The IR motion capture system consisted of ten Vicon Vero cameras (Vicon, Oxford, UK), following the layout in Figure 1. Participants were equipped with 44 retroreflective markers (located on the VR headset, torso, arms, and controllers). All IR data was collected in Vicon Nexus 2 (Vicon, Oxford, UK; Version 2.16.0) at 240 Hz. The VR motion capture system consisted of four Valve Index 2.0 base stations which captured data from the Valve Index (Valve Corporation, Bellevue, WA, USA) headset and seven HTC Vive 3.0 trackers (HTC Corporation, Taiwan, China). Base stations were placed in each corner of the workspace (Figure 1), similarly to prior studies [1,13], following the 7 m maximum distance recommendation given by Valve Index. Trackers were located on each upper body segment (torso, upper arms, and lower arms) and the controllers (which tracked the hand). Controllers were attached to the hand using self-adhering wrap to ensure the hand and controller acted as one rigid body. All VR data was recorded in Brekel OpenVR (Brekel 3D, Amsterdam, The Netherlands; Version 1.54) at 240 Hz. The two motion capture systems were spatially aligned by setting the origins to a matching custom frame and then recording the same movement simultaneously (Figure 2). Collections occurred at the EMPOWER Lab at the University of Dayton and the Gait & Motion Analysis Lab at Dayton Children’s Hospital using matching setups and protocols.

2.2. Participants

Overall, 20 people participated in this study (Table 1). Of those 20, 9 people were identified as healthy controls (height of 1.71 ± 0.18 m, weight of 70.56 ± 27.19 kg, and average hours of exercise per week of 5.78 ± 4.09) and 11 people with a diagnosed movement impairment (height of 1.64 ± 0.19 m, weight of 77.10 ± 24.74 kg). The Capabilities of Upper Extremity Questionnaire (CUE-Q; out of 34 points; 17 questions with right and left extremity separated) and Manual Muscle Testing (MMT; out of 16; only including upper extremity and separated by right and left extremity; upper trapezius, anterior deltoid, lateral deltoid, posterior deltoid, biceps brachii, brachialis, triceps, and wrist extensors) were completed with all participants in the movement-impaired cohort.
Additionally, nine of the people with a movement impairment took part in a second stage of data collection. The second stage included an individualized subset of movement tasks based on their first visit. All data was processed in the same way, resulting in 28 overall collections for error analysis (1 was omitted due to technical issues). Participants with a movement impairment were recruited through targeted recruitment strategies, including advertisements from local physical therapists and community organizations. Participants in the control cohort were recruited primarily through convenience sampling, with efforts to select people who were an age and sex match to individuals in the movement impairment cohort.
Participants with different diagnoses were intentionally recruited within the movement-impaired cohort to ensure that the protocol and outcome measures were broadly applicable across populations that would likely be receiving UE therapy in a clinical setting. Due to sample sizes, only the SCI cohort will be included in diagnosis-specific statistical analysis. However, grouping all participants with and without movement impairments is valid for the primary analyses because the focus is on movement error characteristics that are not diagnosis-specific. Including the full cohort increases generalizability to the clinical application.
For all participants, the exclusion criteria included the following: (1) a history of photosensitive seizures; (2) current pain or open wounds on the arms or torso; (3) any concurrent diagnoses, injuries, or past surgery that affects balance or the upper body; (4) a history of a cardiovascular disorder; (5) any hearing loss in one or both ears. For the healthy control cohort, the inclusion criteria included the following: (1) aged 10–65 years; (2) ability (with corrective lenses) to read the 20/30 line on a Snellen eye chart. For the people with a movement impairment, the inclusion criteria included the following: (1) aged 8–65 years; (2) ability (with corrective lenses) to read the 20/30 line on a Snellen eye chart; (3) a diagnosis of a spinal cord injury (SCI), post-traumatic brain injury, cerebral palsy, or multiple sclerosis; (4) at least some movement ability in both arms.
Identical protocols were approved by the Institutional Review Boards of University of Dayton (Approval IDs 21144520-Healthy Control Cohort, 22087931-MS, CP, and TBI Cohort, and 19928150-SCI Cohort) and Dayton Children’s Hospital (Approval IRB00002278 for the SCI cohort) with written informed consent from each participant or legal guardian, with written informed assent from any minors. Both Institutional Review Boards are governed by the Department of Health and Human Services (DHHS) federal guidelines for the protection of human subjects in research, found in 45 CFR 46.

2.3. Data Collection

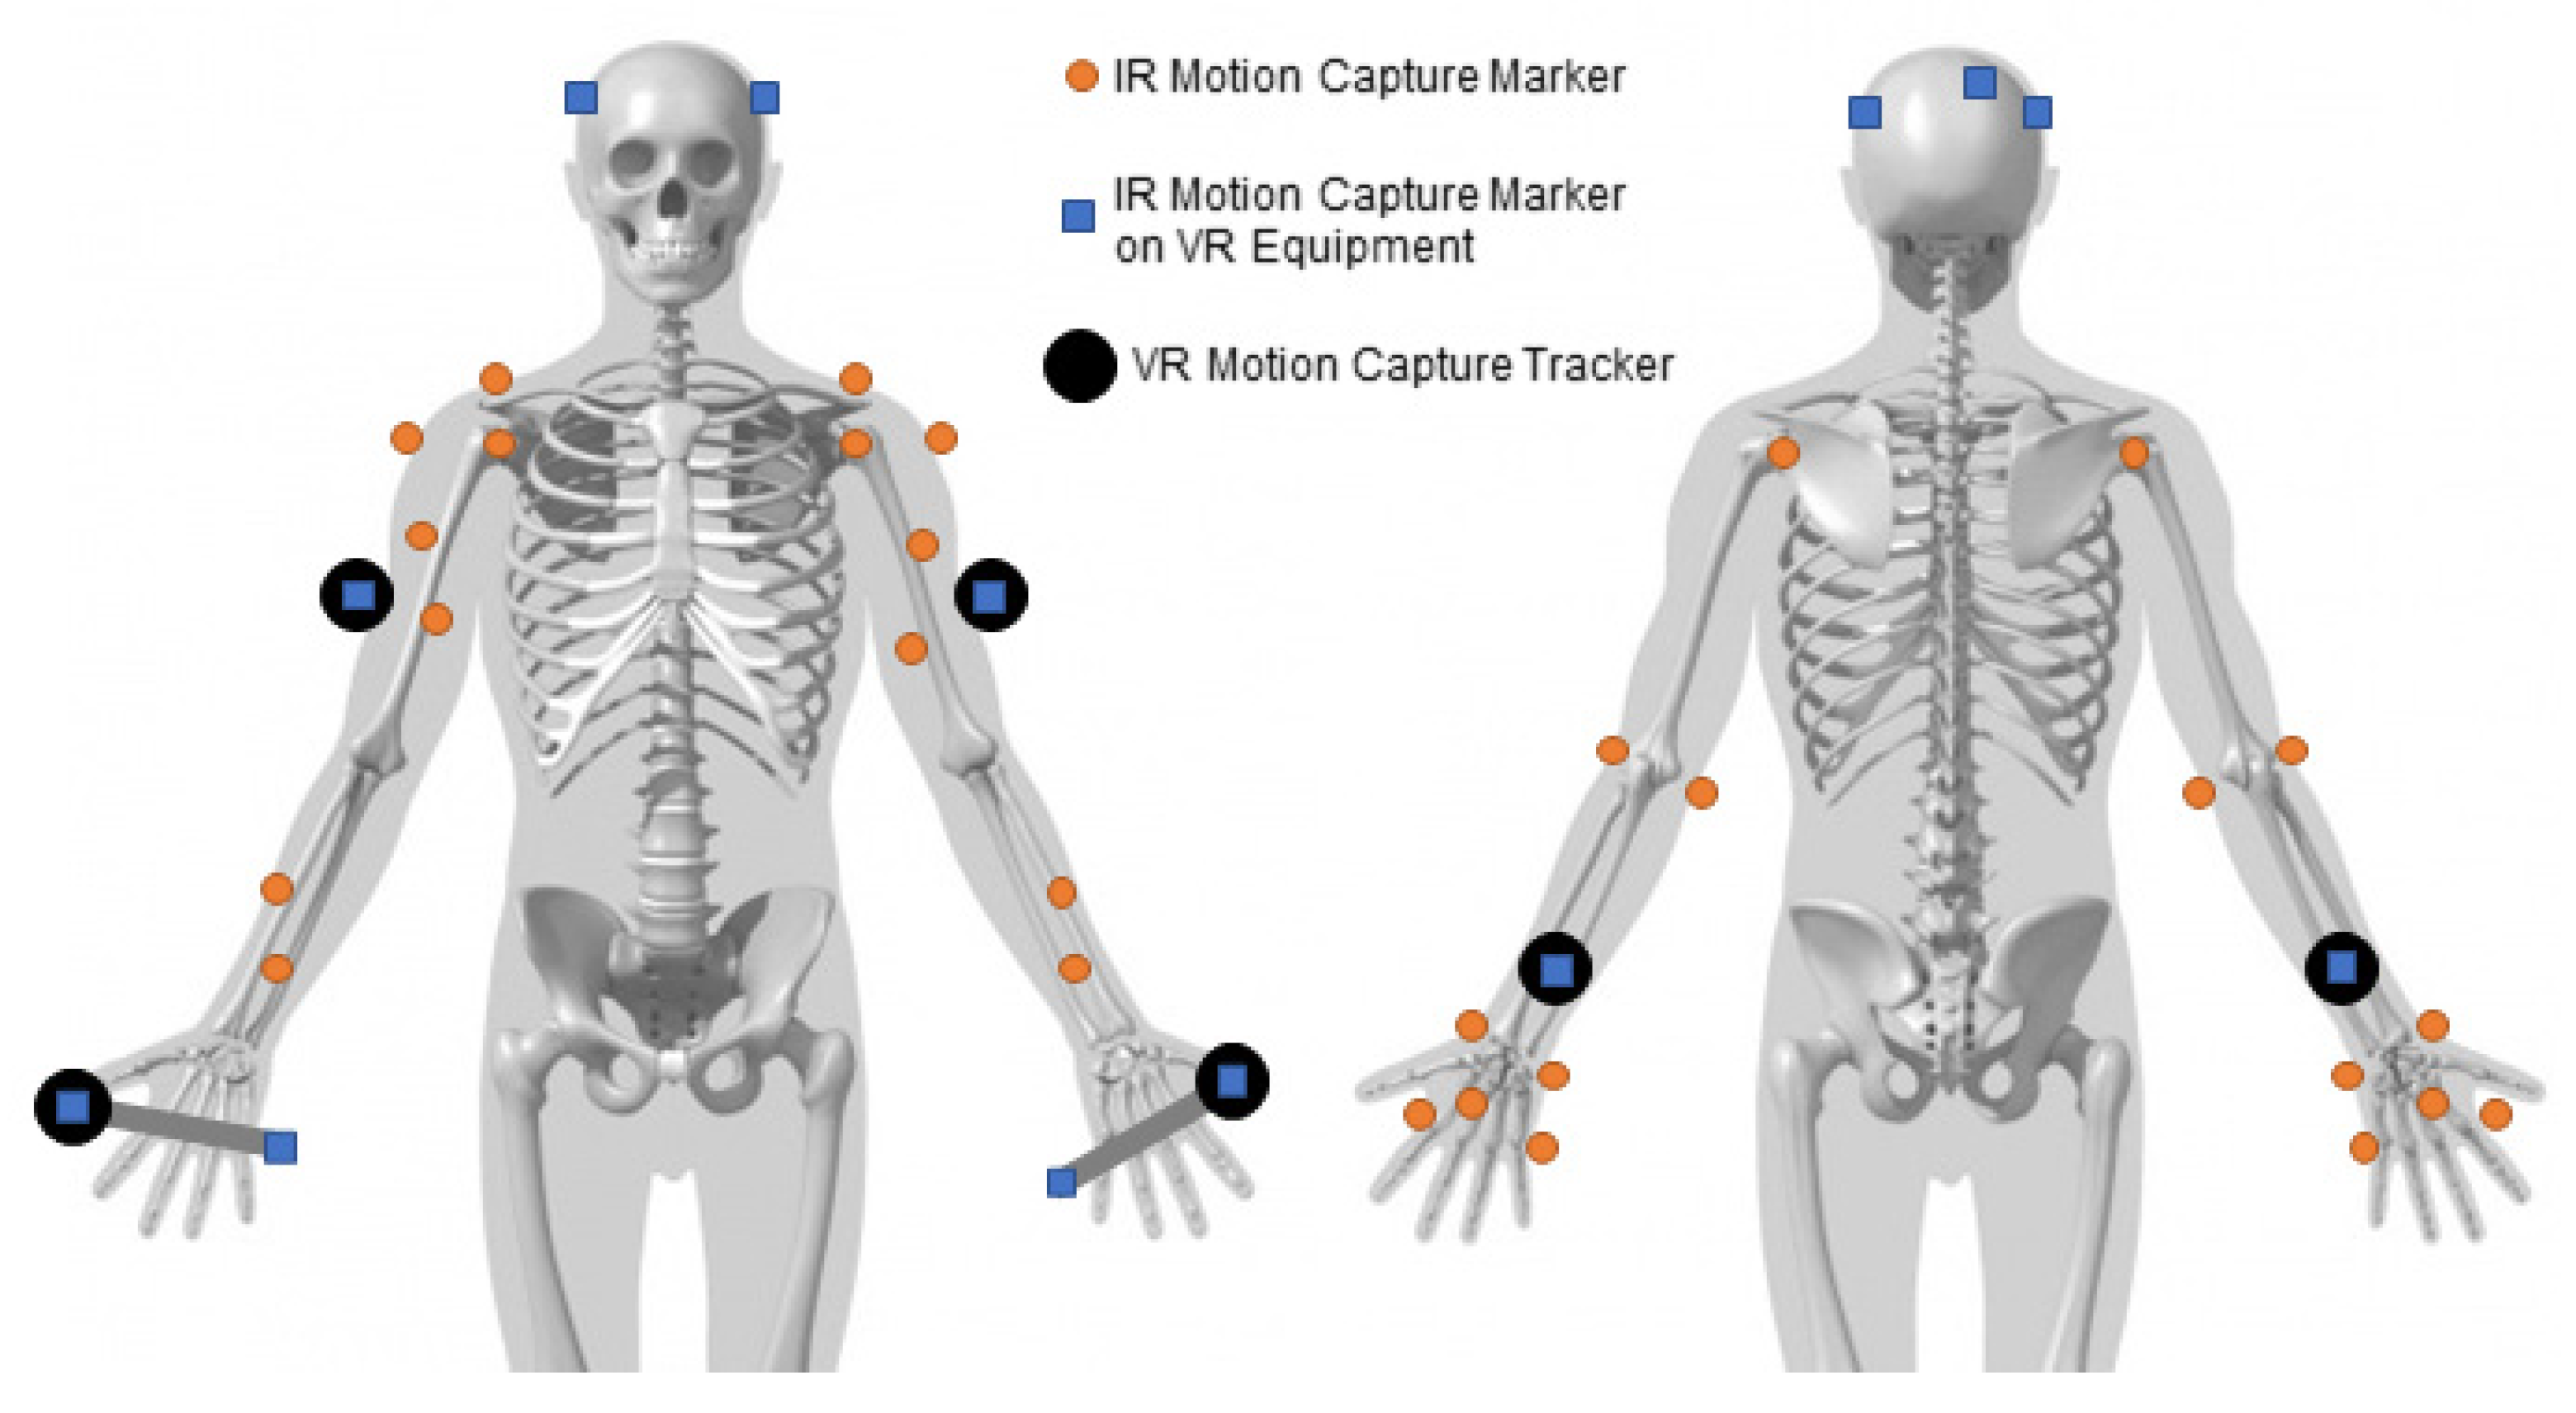
At each visit, the participant was outfitted with retroreflective markers and VR trackers (Figure 3). Since the two motion capture systems were set to the same origin, the data was spatially aligned, with any residual alignment error fixed in post processing. All tasks were presented in the Beat Saber customized VR game levels, where a task is defined as unilateral or bilateral slicing through a singular or set of virtual blocks. The instructions were to slice through the blocks with a virtual light saber as straight and centered as possible in the direction and position given by the arrow on the block. Participants completed a maximum of six game levels for the first stage of data collection and seven for the second stage of data collection. All game levels were approximately 3 min long, resulting in less than 25 min of playing. Error characterizations were calculated from metrics taken during the Beat Saber levels.

2.4. Post Processing

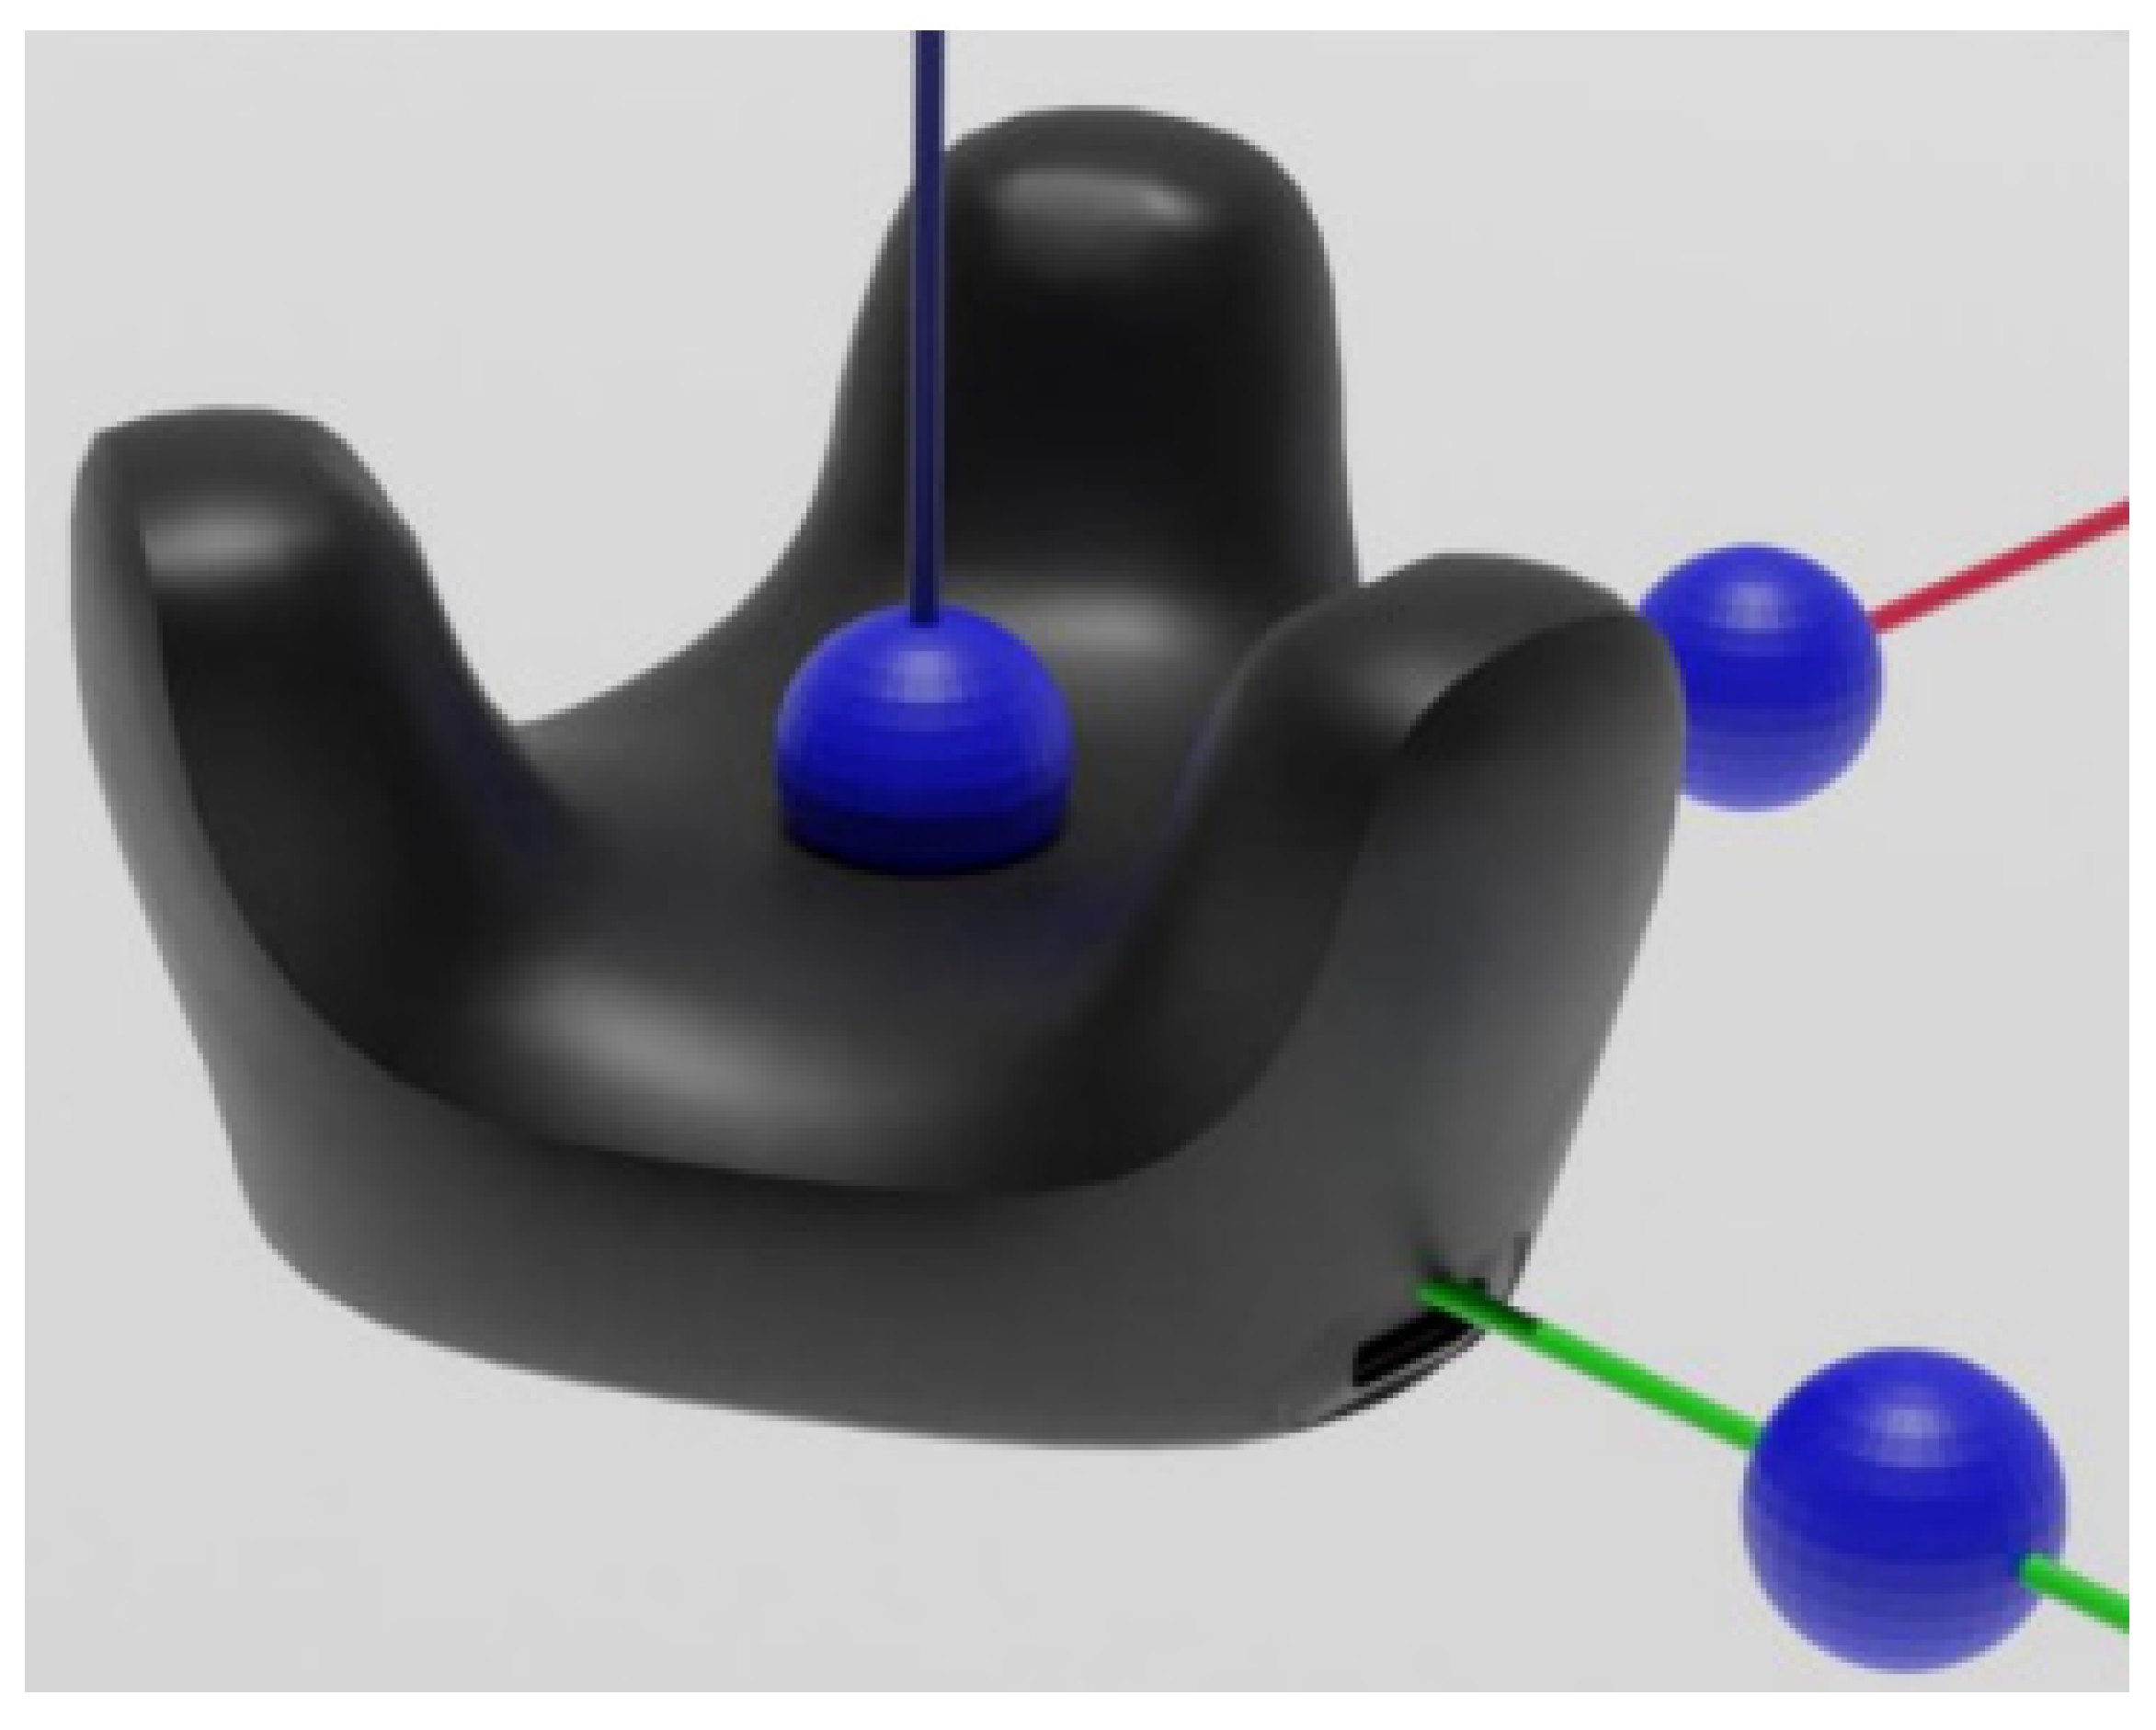
IR motion capture data was processed in Vicon Nexus 2. Blender (Blender Foundation, Amsterdam, The Netherlands; Version 3.5.1) and MATLAB (The MathWorks®, Natick, MA, USA; Version 2023a) were used to modify the Brekel FBX file into a C3D file to be more compatible with the IR data. All scripts used for data processing are provided in the Supplementary Materials, including a link to the GitHub repository. Modifications included taking the position and orientation from the FBX file and translating three virtual markers in each cardinal direction of the local coordinate system of the tracker (Figure 4). The virtual marker on the top of the tracker was translated to match the IR marker that was actually placed on the tracker, while the other two virtual markers were translated to an arbitrary distance along the axis. The Biomechanical Toolkit (BTK) in MATLAB was then used to convert the processed CSV into a C3D file compatible with Visual3D (HAS-Motion Inc., Kingston, ON, Canada; Version 2024.08.05).
C3D files from both the IR and VR systems were imported into MATLAB, where spatial alignment between the seven corresponding markers was optimized. This process corrected for any human error introduced during the initial origin setup. While in MATLAB, the two datasets were temporally aligned using the trajectories of the corresponding markers. Synced ScoreSaber (Beat Saber modifier that outputs performance) data was added to the Visual3D file as analog signals and used to identify the task profile. Prior to metric extraction we parsed the data into task profiles which represented a defined and repeated movement cycle. This concept is analogous to gait cycles for the lower extremity and is possible for a variety of UE therapeutic movements. The task profile included the entire motion before and after the task occurred, which was found to be approximately 0.9 s based on the spacing of 1.85 to 2.18 s between tasks (based on songs with a BPM of 110–130 s with a task every four beats). The final result is a C3D file with all performance, IR, and VR data combined and synced spatially and temporally.
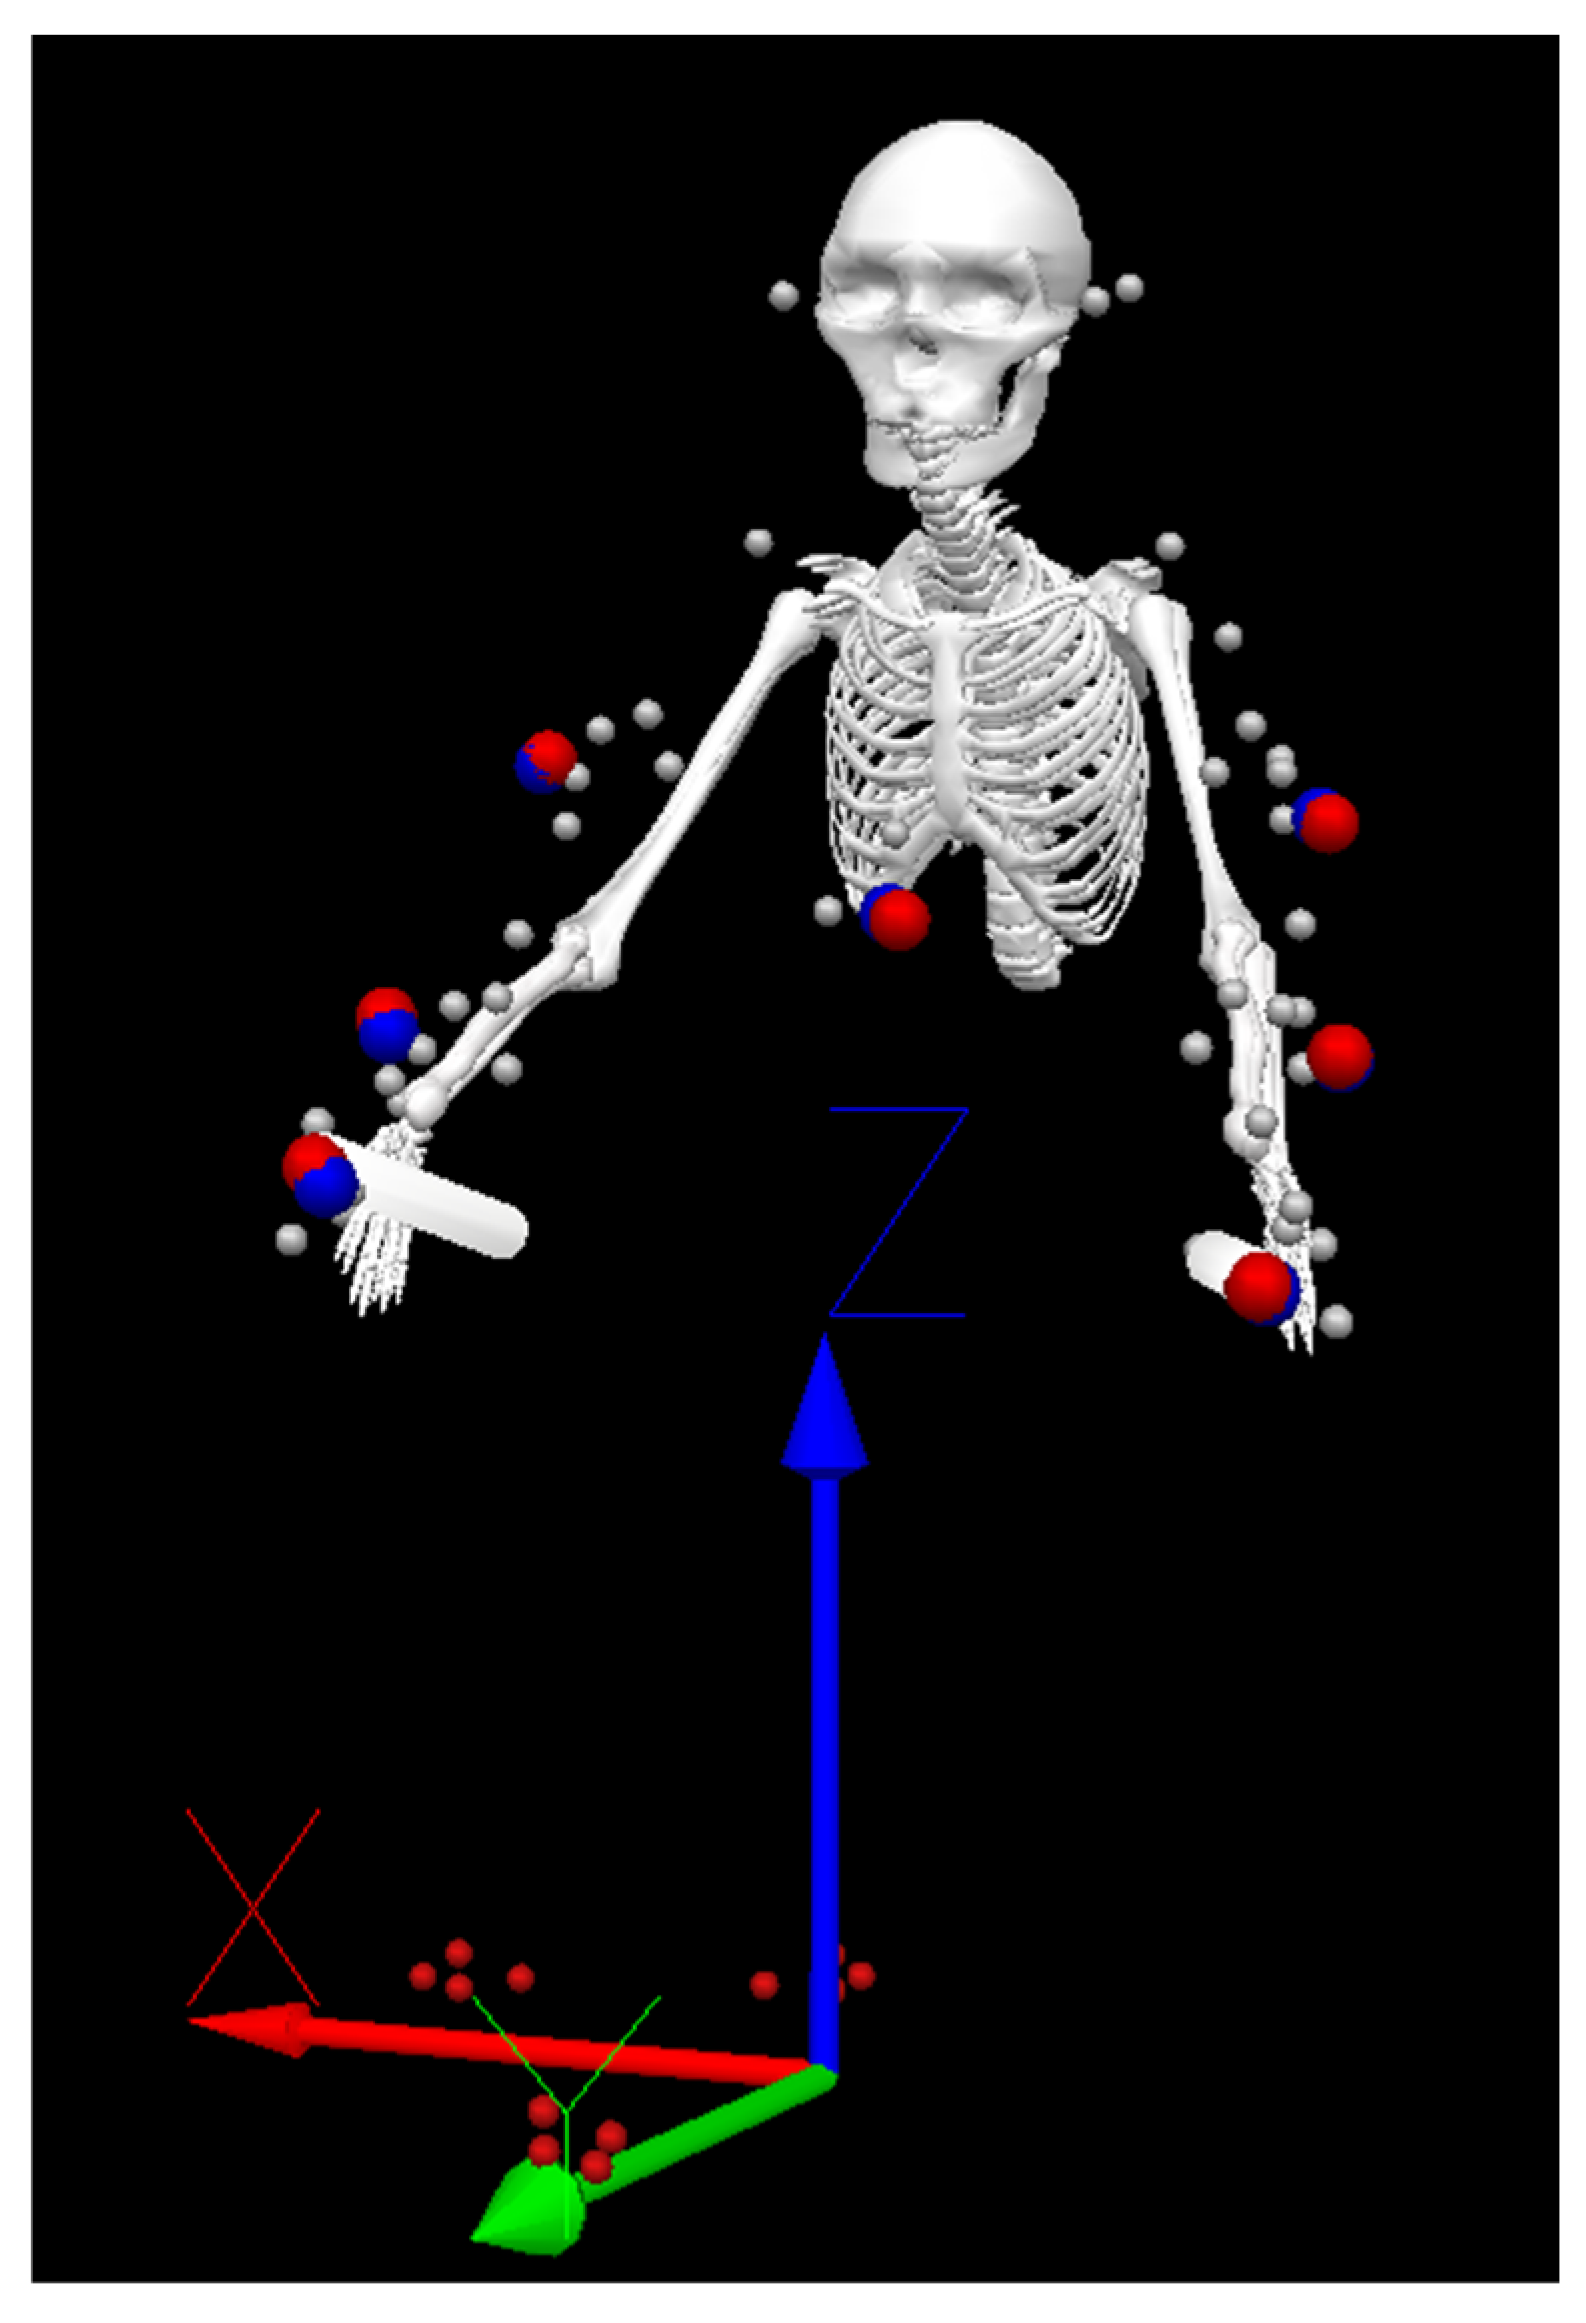
Once all data was combined into one C3D file, a skeletal model was created in Visual3D. A separate model was created for the two motion capture systems to allow for direct comparisons within the file (Figure 5). The IR model was created using standard UE practices, whereas the VR model was created with both IR and VR markers. The VR model was defined using the IR markers (defining the distal and proximal locations of each segment) but tracked using the VR markers. By using the same starting point, this allowed us to compare the actual tracking capabilities of the VR motion capture system independently to the model building.
All marker trajectories were filtered in Visual3D before analysis. IR markers were processed using a bidirectional Butterworth filter (cutoff frequency of 10 Hz), while VR markers were smoothed with a Generalized Cross-Validation Smoothing Spline (GCVSPL) filter. The GCVSPL filter was selected for the VR data because it effectively removed large spikes caused by occasional tracker drift during data collection, an issue that a Butterworth filter could not address without excessive smoothing.

2.5. Data Analysis

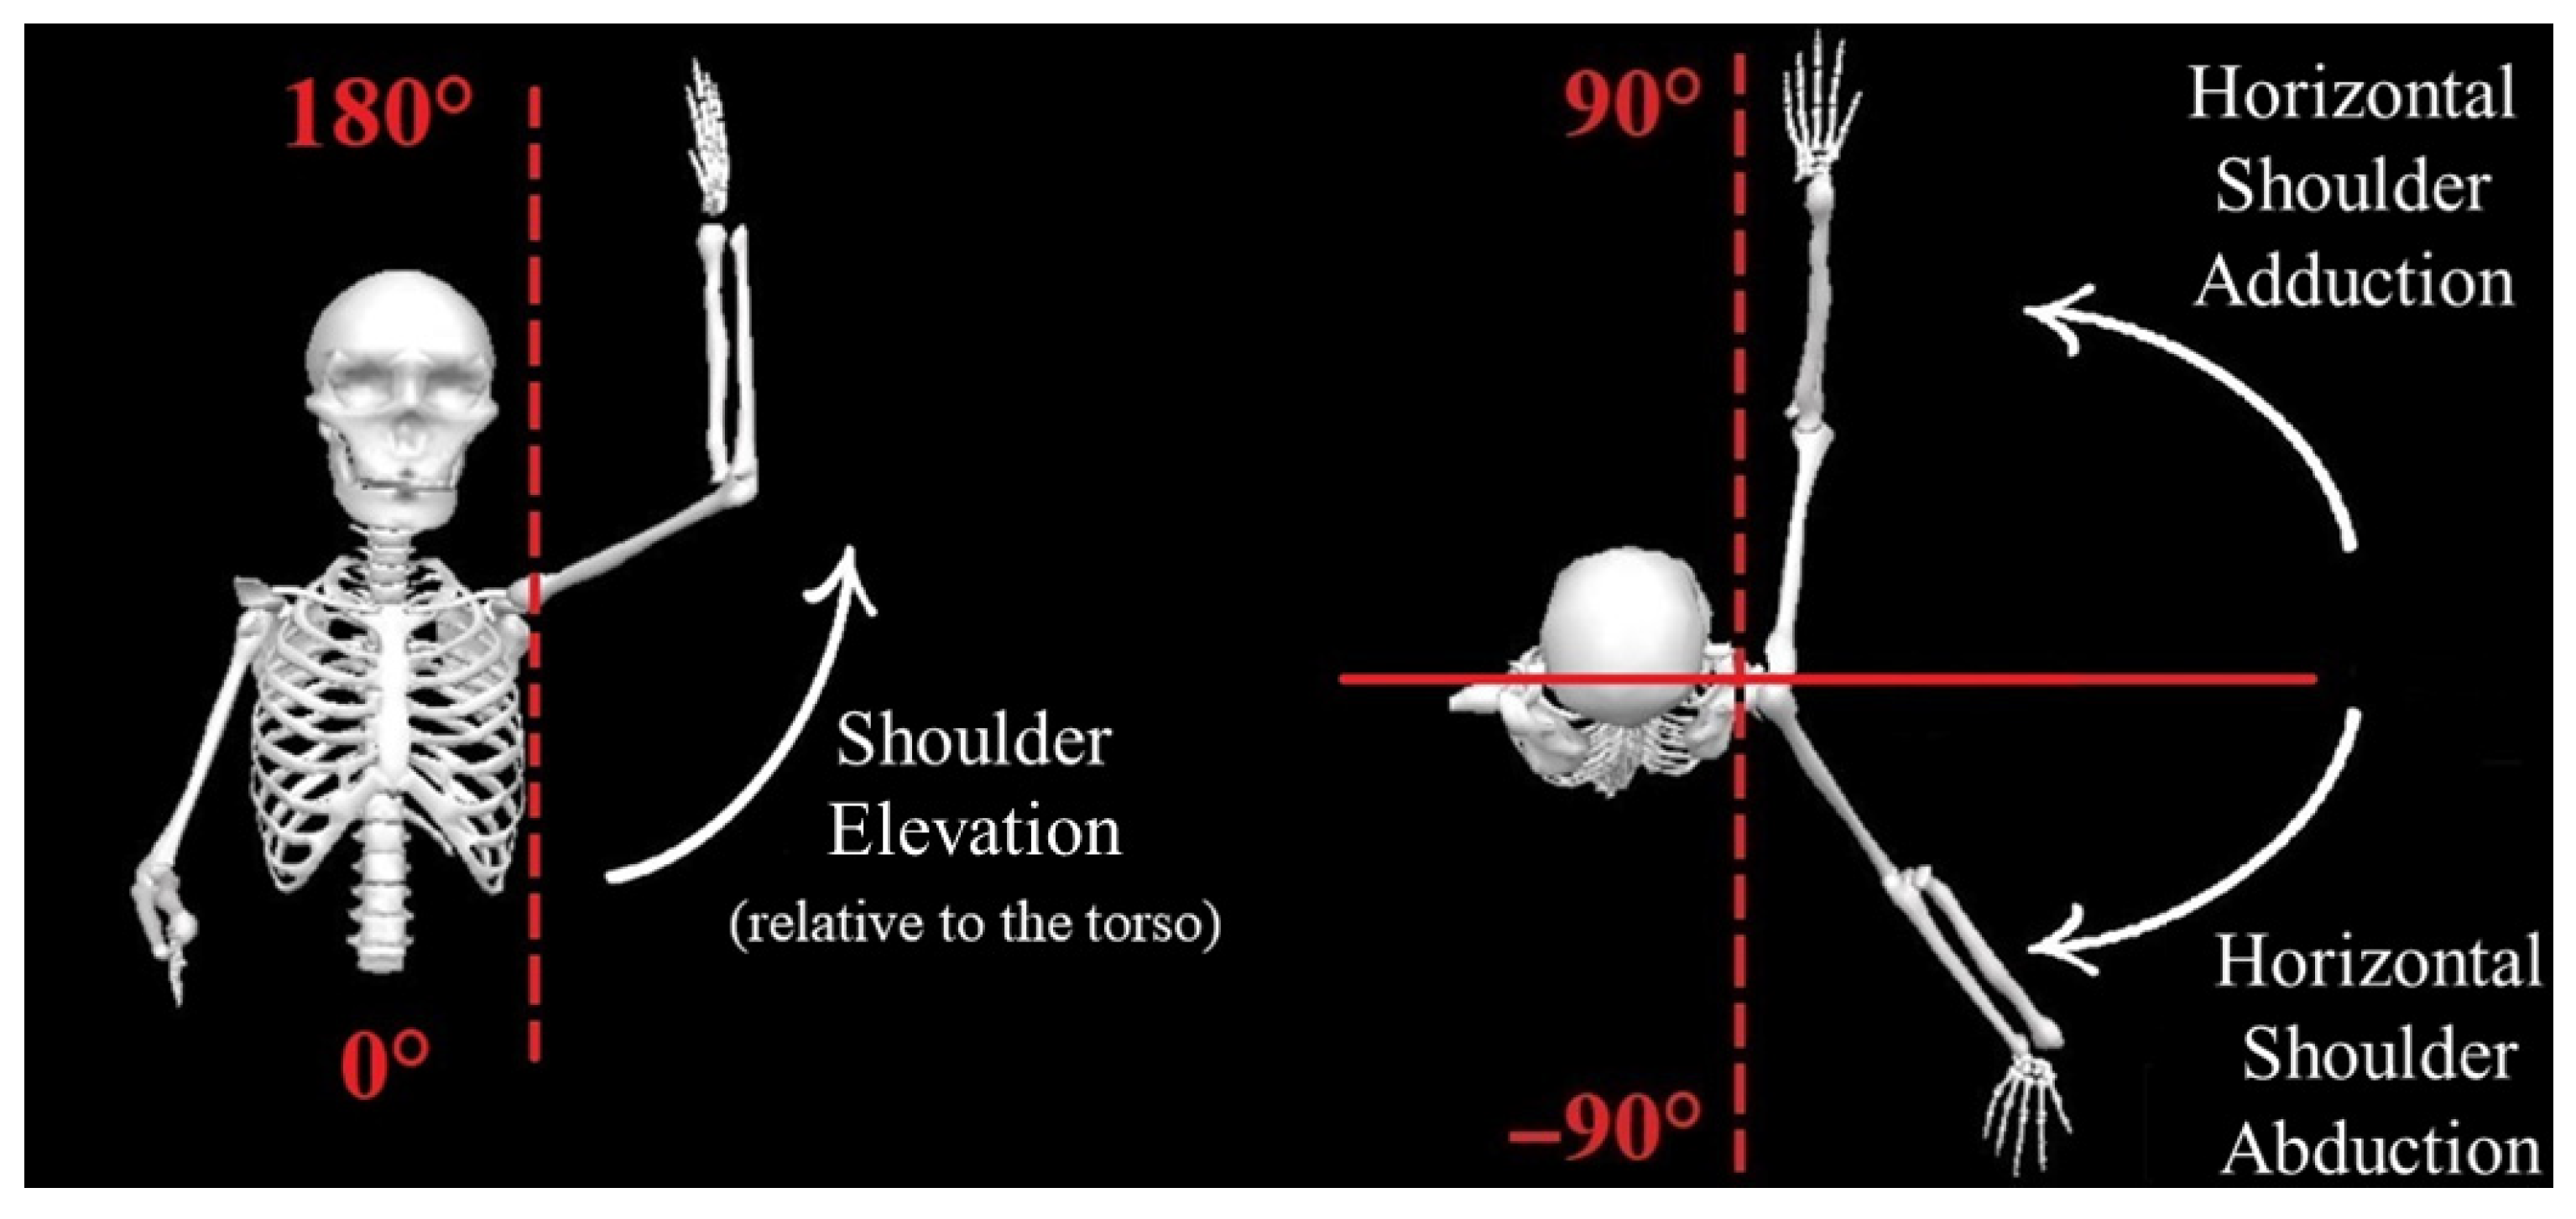
All metrics were calculated using both the IR and VR models over the 22,000+ task profiles. Joint angles included shoulder elevation, shoulder horizontal adduction/abduction, elbow flexion/extension, sagittal wrist flexion/extension, and frontal wrist radial/ulnar deviation angles. Traditional shoulder angles (adduction/abduction and flexion/extension) were not calculated as they resulted in Gimbal lock when the upper arm and torso coordinate systems aligned [15]. Instead, shoulder elevation was defined as the planar angle between the upper arm with respect to the torso and horizontal shoulder adduction was defined as the planar angle between the upper arm with respect to the frontal plane (Figure 6). In addition to joint-related metrics, two tracker-related metrics were defined as well, including total tracker path length and peak tracker velocity, both taken at each task profile. These metrics were calculated independently of the skeletal model. Lastly, error calculations consisted of all metrics described in Table 2, with a focus on root mean squared error (RMSE), ROM error, error at peak joint angles and peak joint velocities, as well as total tracker path length error and error at peak tracker velocities. Multiple error metrics are reported to address the interests of different stakeholder groups. RMSE is emphasized as the primary error metric, consistent with similar publications [2,8,9,16,17]. Additional metrics are provided at both the participant-grouped level and individual participant level. Participant group metrics, which analyze data after combining all participants, are best suited for research involving aggregated data across multiple individuals. In contrast, participant-level metrics, which are calculated separately for each participant before averaging (e.g., using the mean or median), are more relevant for individualized patient assessments. When not specified, assume the given metrics are participant-grouped. The errors are summarized in Table A1 (Appendix A) using the mean, median, standard deviation, and percent of median across all task profiles. Percent of median was included because error values and joint/tracker values need to be considered in the context of associated metric values.
Statistical analysis was run in NCSS (Number Cruncher Statistical System, LLC, Kaysville, UT, USA; Version 24.0.6) with a significance value of p < 0.05 for all comparisons. A repeated measure ANOVA (analysis of variance) was run to find the primary significance, p, and power, P. Sample sizes in the prior literature that contained human movement ranged from 1 to 20 people with a varying data count compared with our 20 participants, 28 collections, and over 22,000 data points, which resulted in power values over 0.8 for all presented results. Between factors included diagnoses (control cohort to SCI cohort only) and motion capture system (including data from all participants and all data collections), and within factors included collection day (for the eight participants who had data for both sessions). Since all factors compared only two conditions, no Tukey–Kramer’s pairwise comparisons were required. Box plots were created for visualization, capturing the 25% to 75% quartiles.

3. Results

Joint angle, joint velocity, and tracker values from the VR motion capture system were evaluated by characterizing the error compared to the IR motion capture system. The error is presented for each joint or each tracker individually. All metrics were evaluated during each task profile, generally resulting in 96–144 data points per level (6 or 7 levels per person for collection 1 and collection 2, respectively, assuming all levels were completed) with 22,000+ compiled data points depending on the metric.

3.1. Statistical Comparisons

A statistical analysis between the right and left joints yielded no significance for all error metrics (all p > 0.2 and P < 0.25) except for the horizontal shoulder adduction metrics of error at peak joint angle and peak joint velocity (all p < 0.05 and P < 0.82 and 0.6, respectively). However, due to the overwhelming lack of significance for all other error metrics and joints, as well as low power values, the right and left joints were combined for all other analyses and characterizations.
For all error metrics, no statistical significance was found between the control cohort and SCI cohort (all p > 0.05 and P < 0.5). Participants with multiple sclerosis (MS), post-traumatic brain injury (TBI), and cerebral palsy (CP) were not included in the diagnosis-specific statistic as the sample size was not large enough. For peak joint angle, ROM, peak joint velocity, total tracker path length, and peak tracker velocity, no significance was found between the IR and VR values (all p > 0.06 and P < 0.5). While there was no significant error between the IR and VR, the amount of error did vary between participants and collection days. In Figure 7 it can be seen that each participant and each collection day appear to have different median error values and variability of error. However, the interquartile range (25–75% of the data) is below ±10° for all participants. Box plots for all joints separated by participant and collection day can be found in Appendix B (Figure A1, Figure A2, Figure A3, Figure A4 and Figure A5).

3.2. Joint Angle Error Characterizations

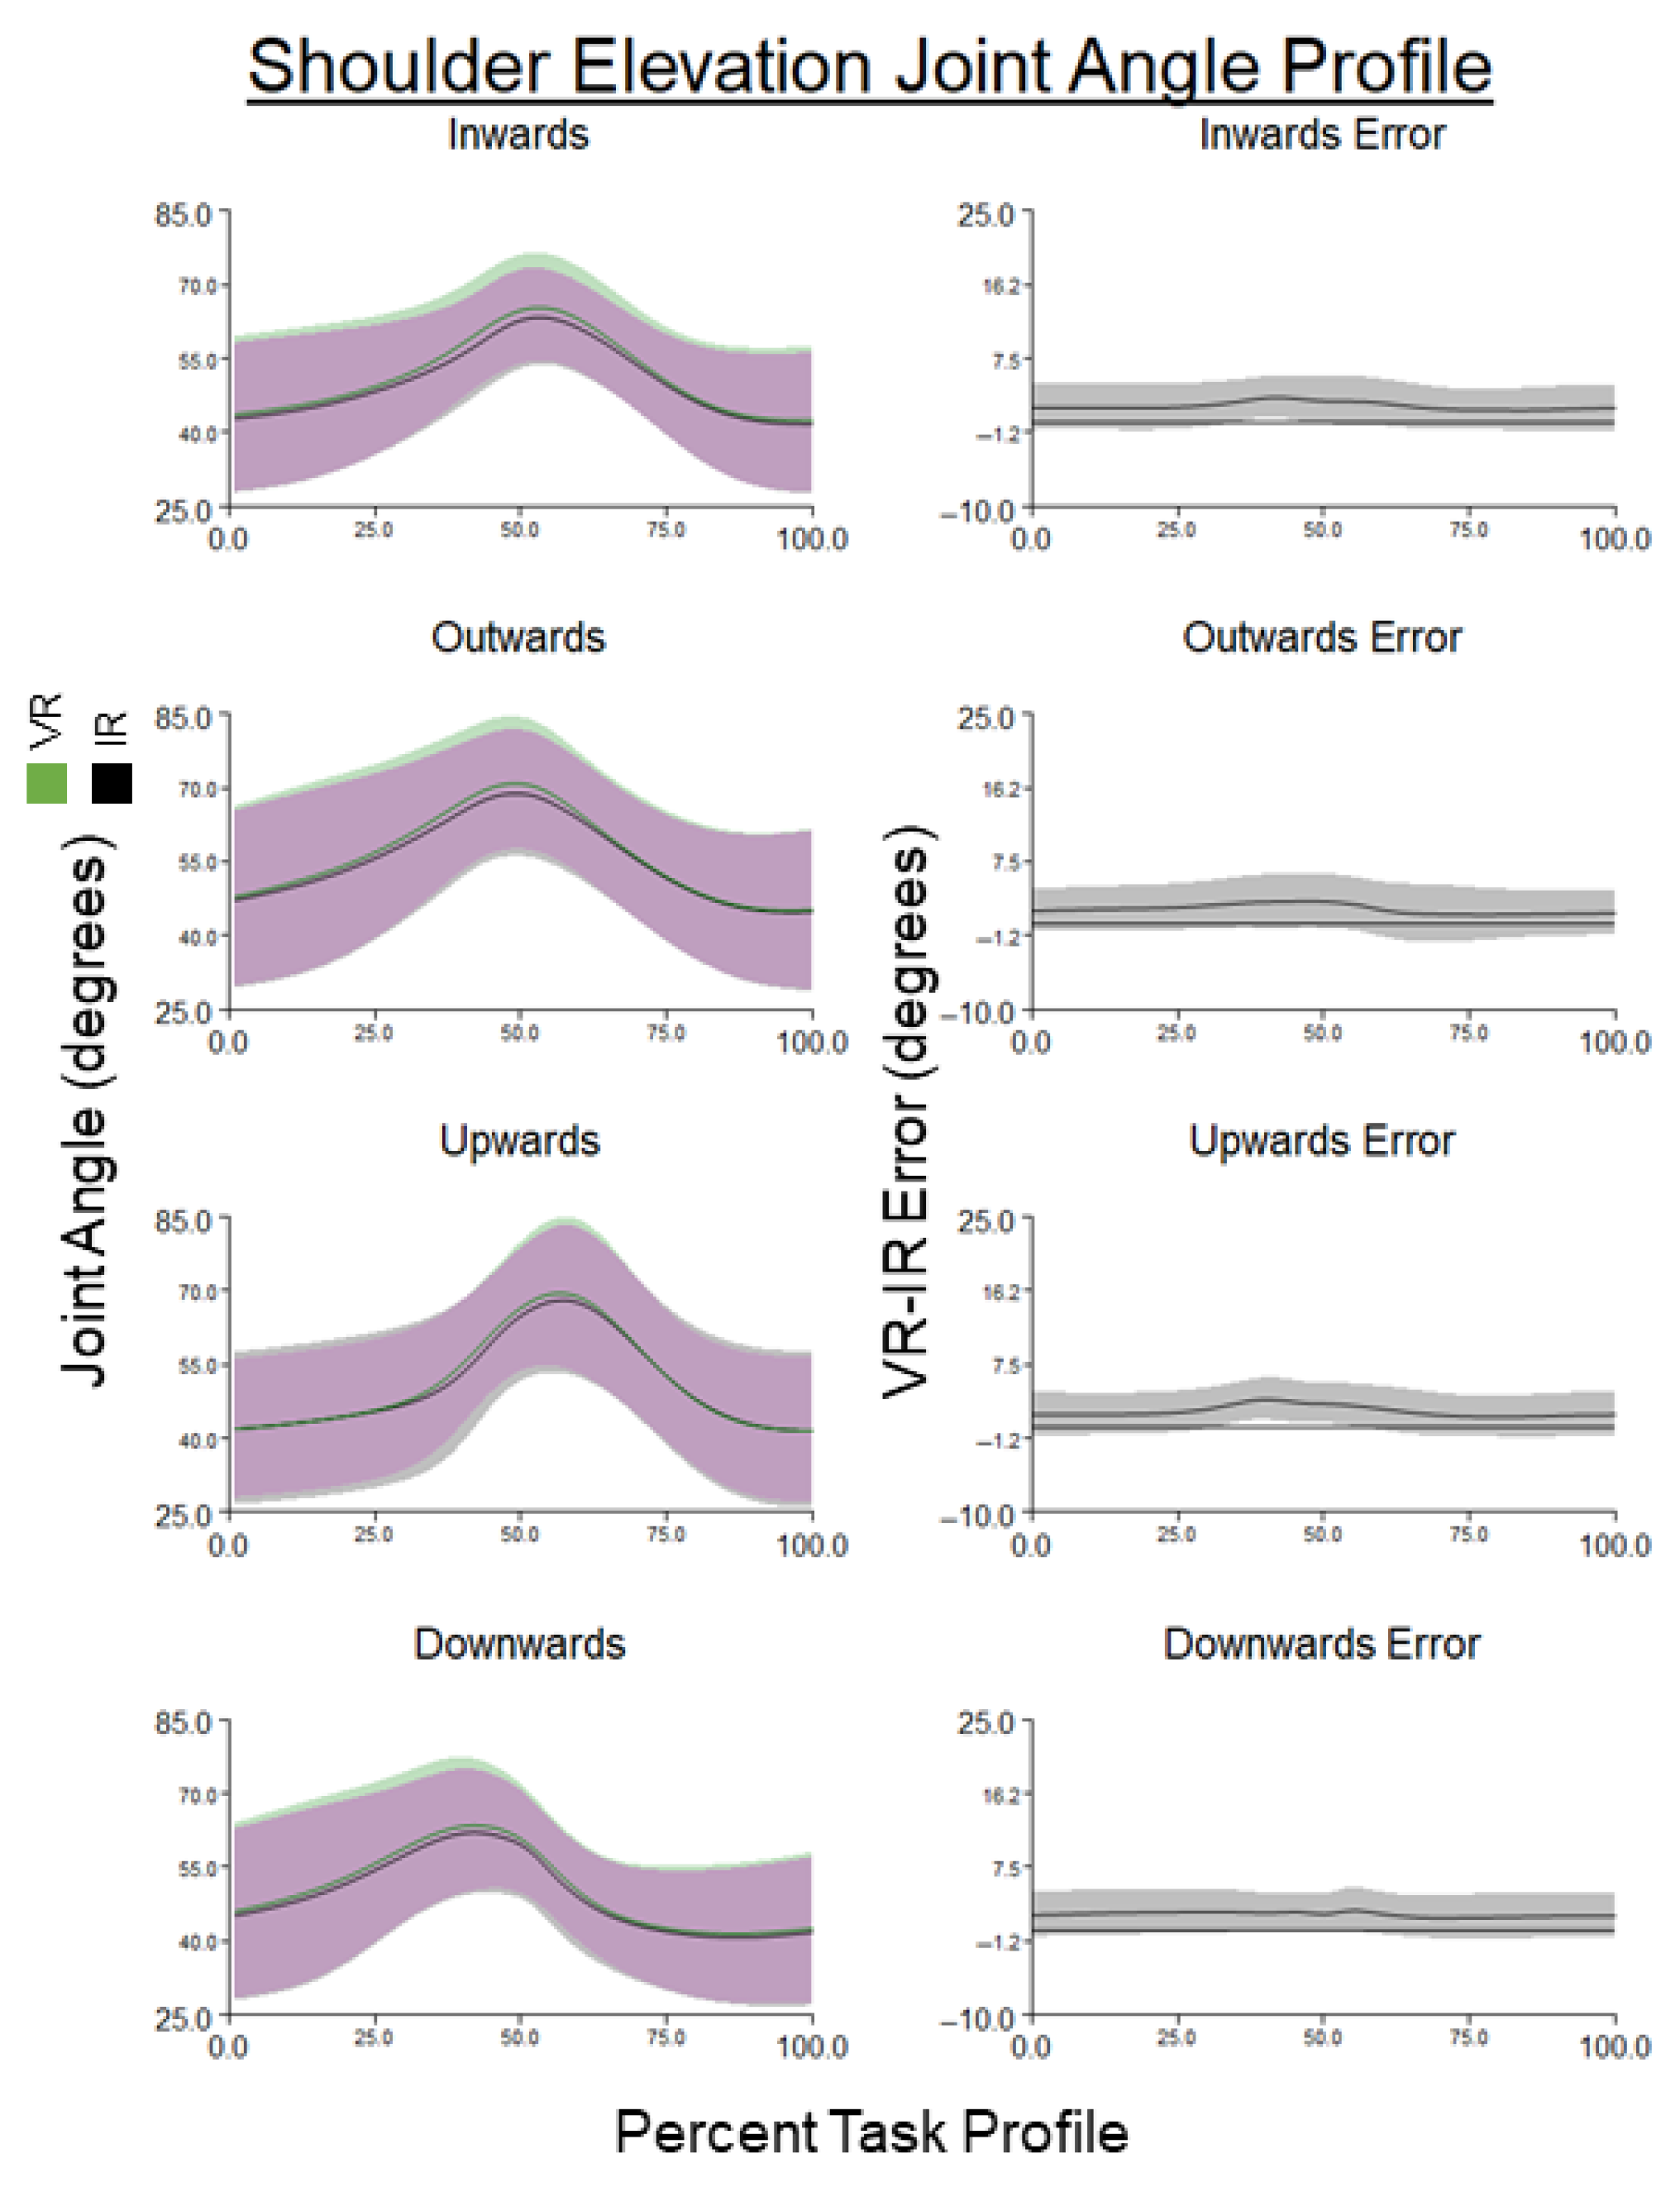
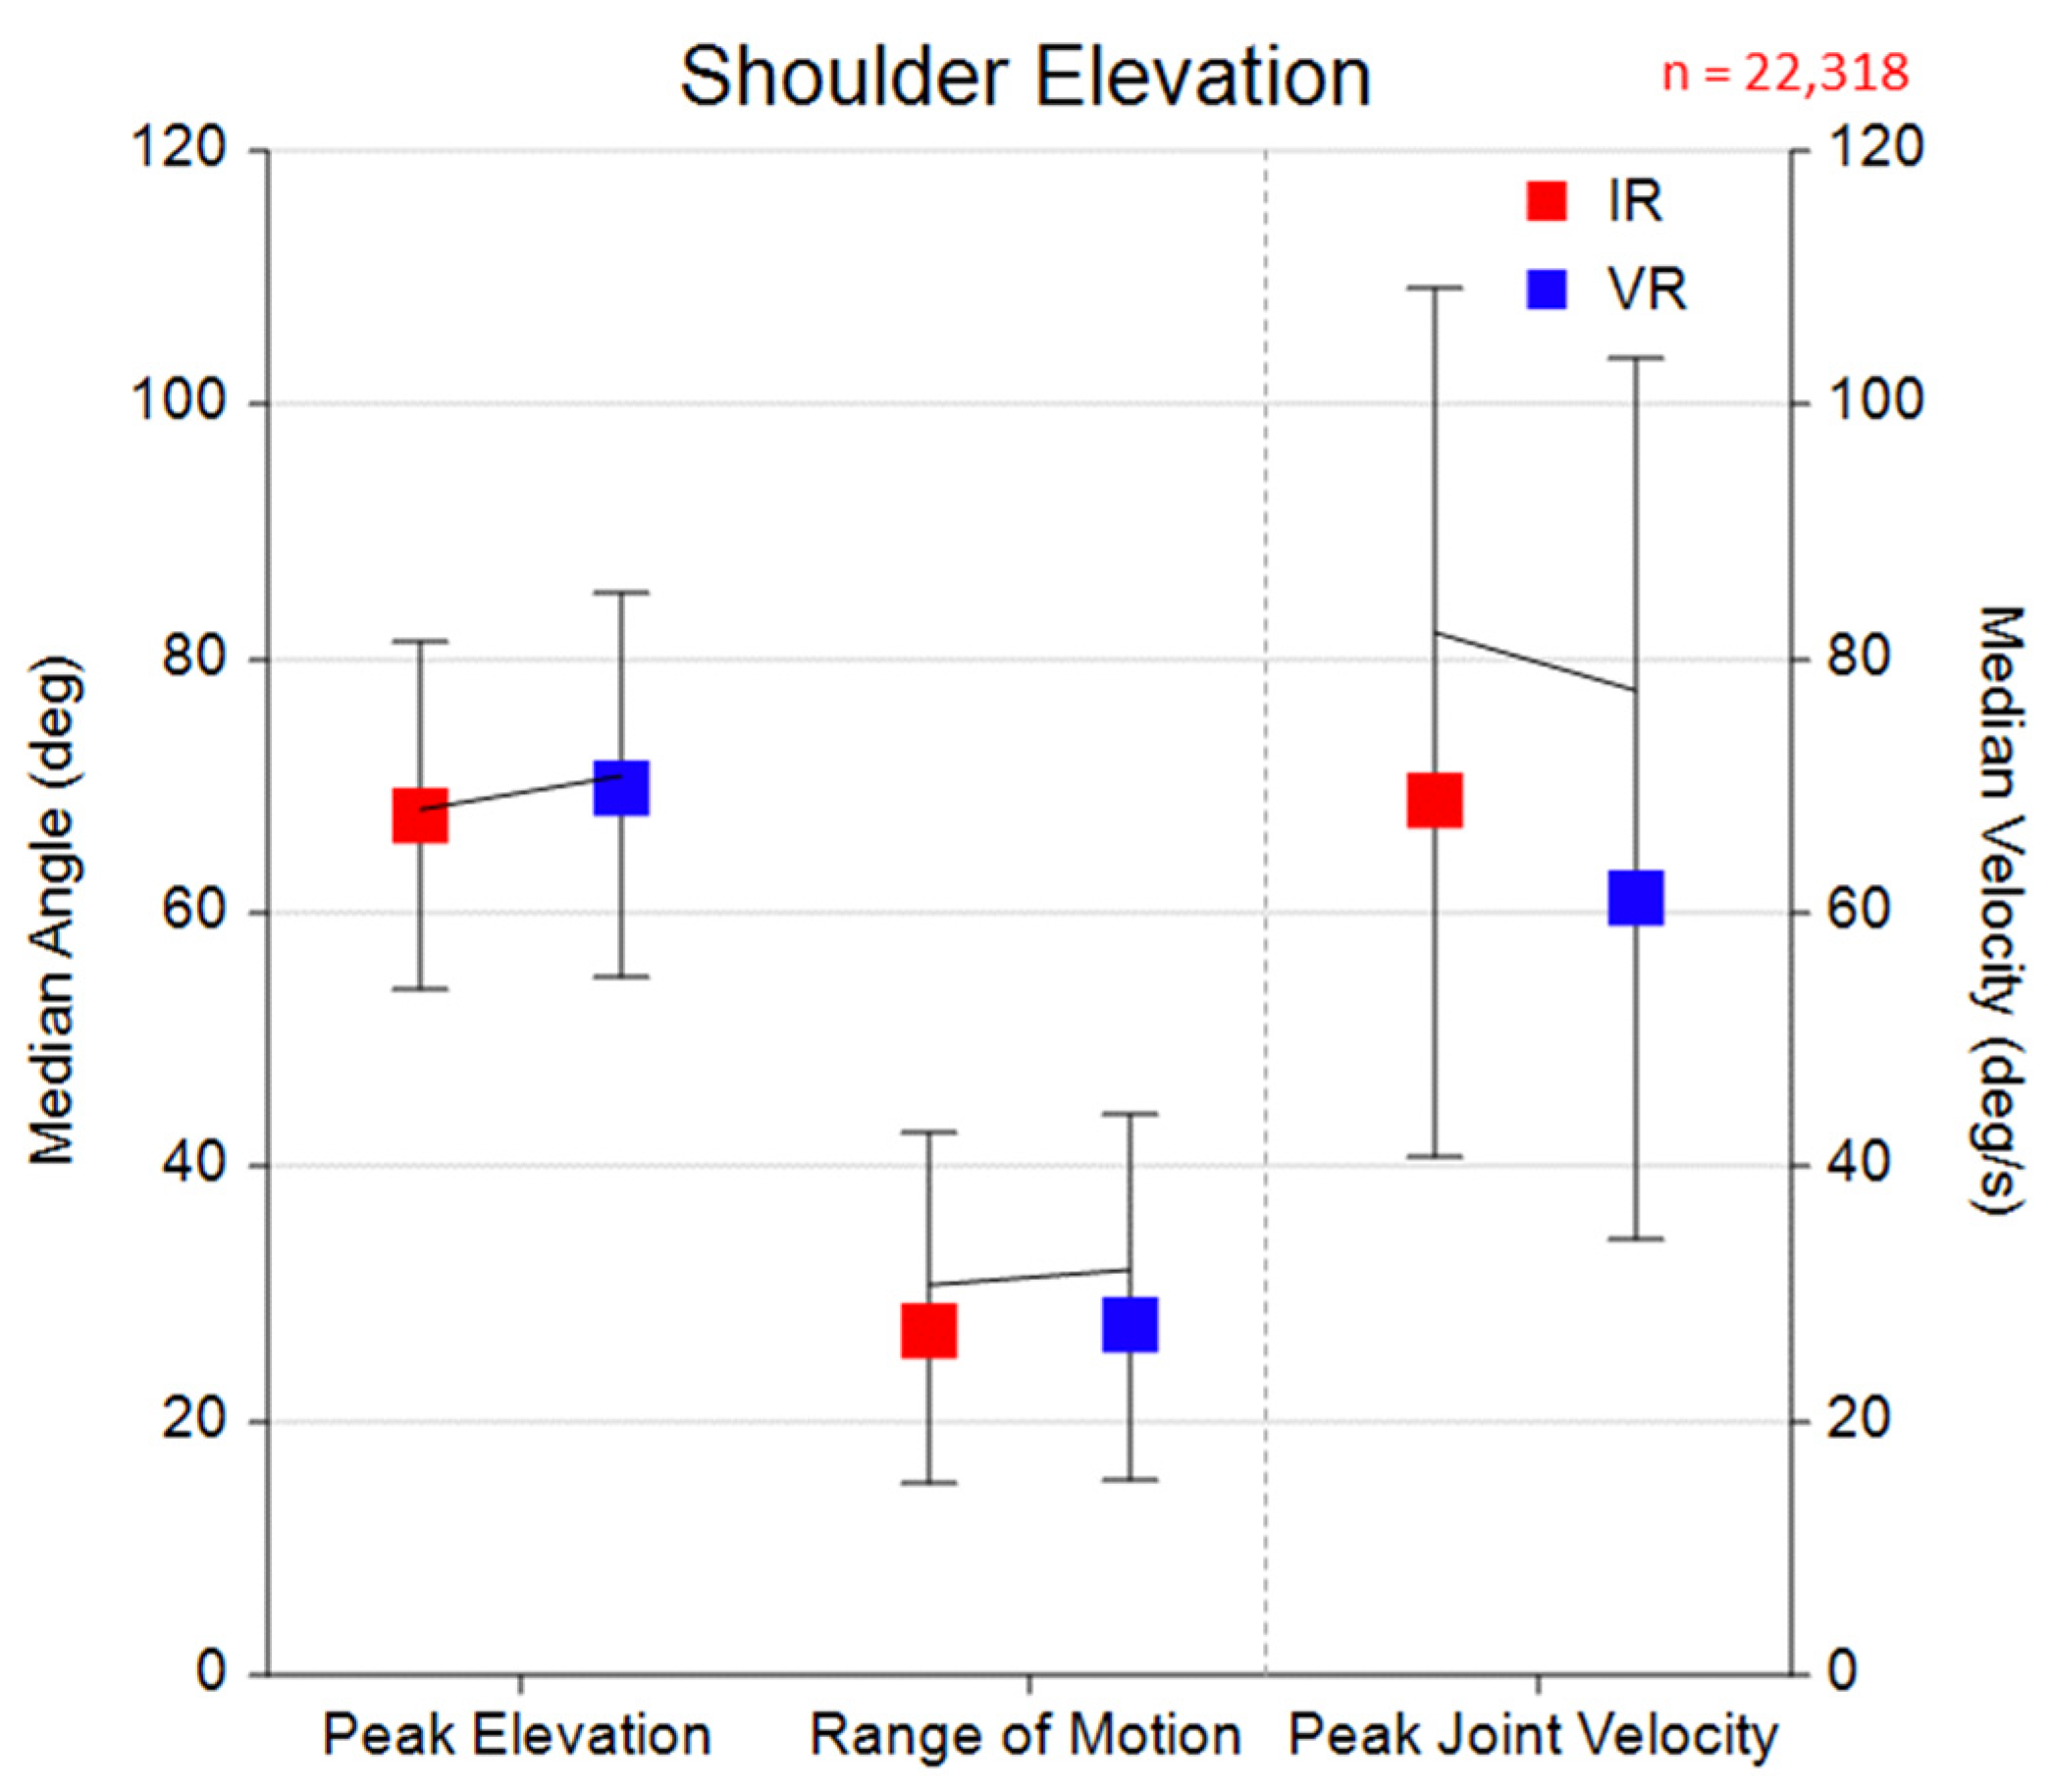
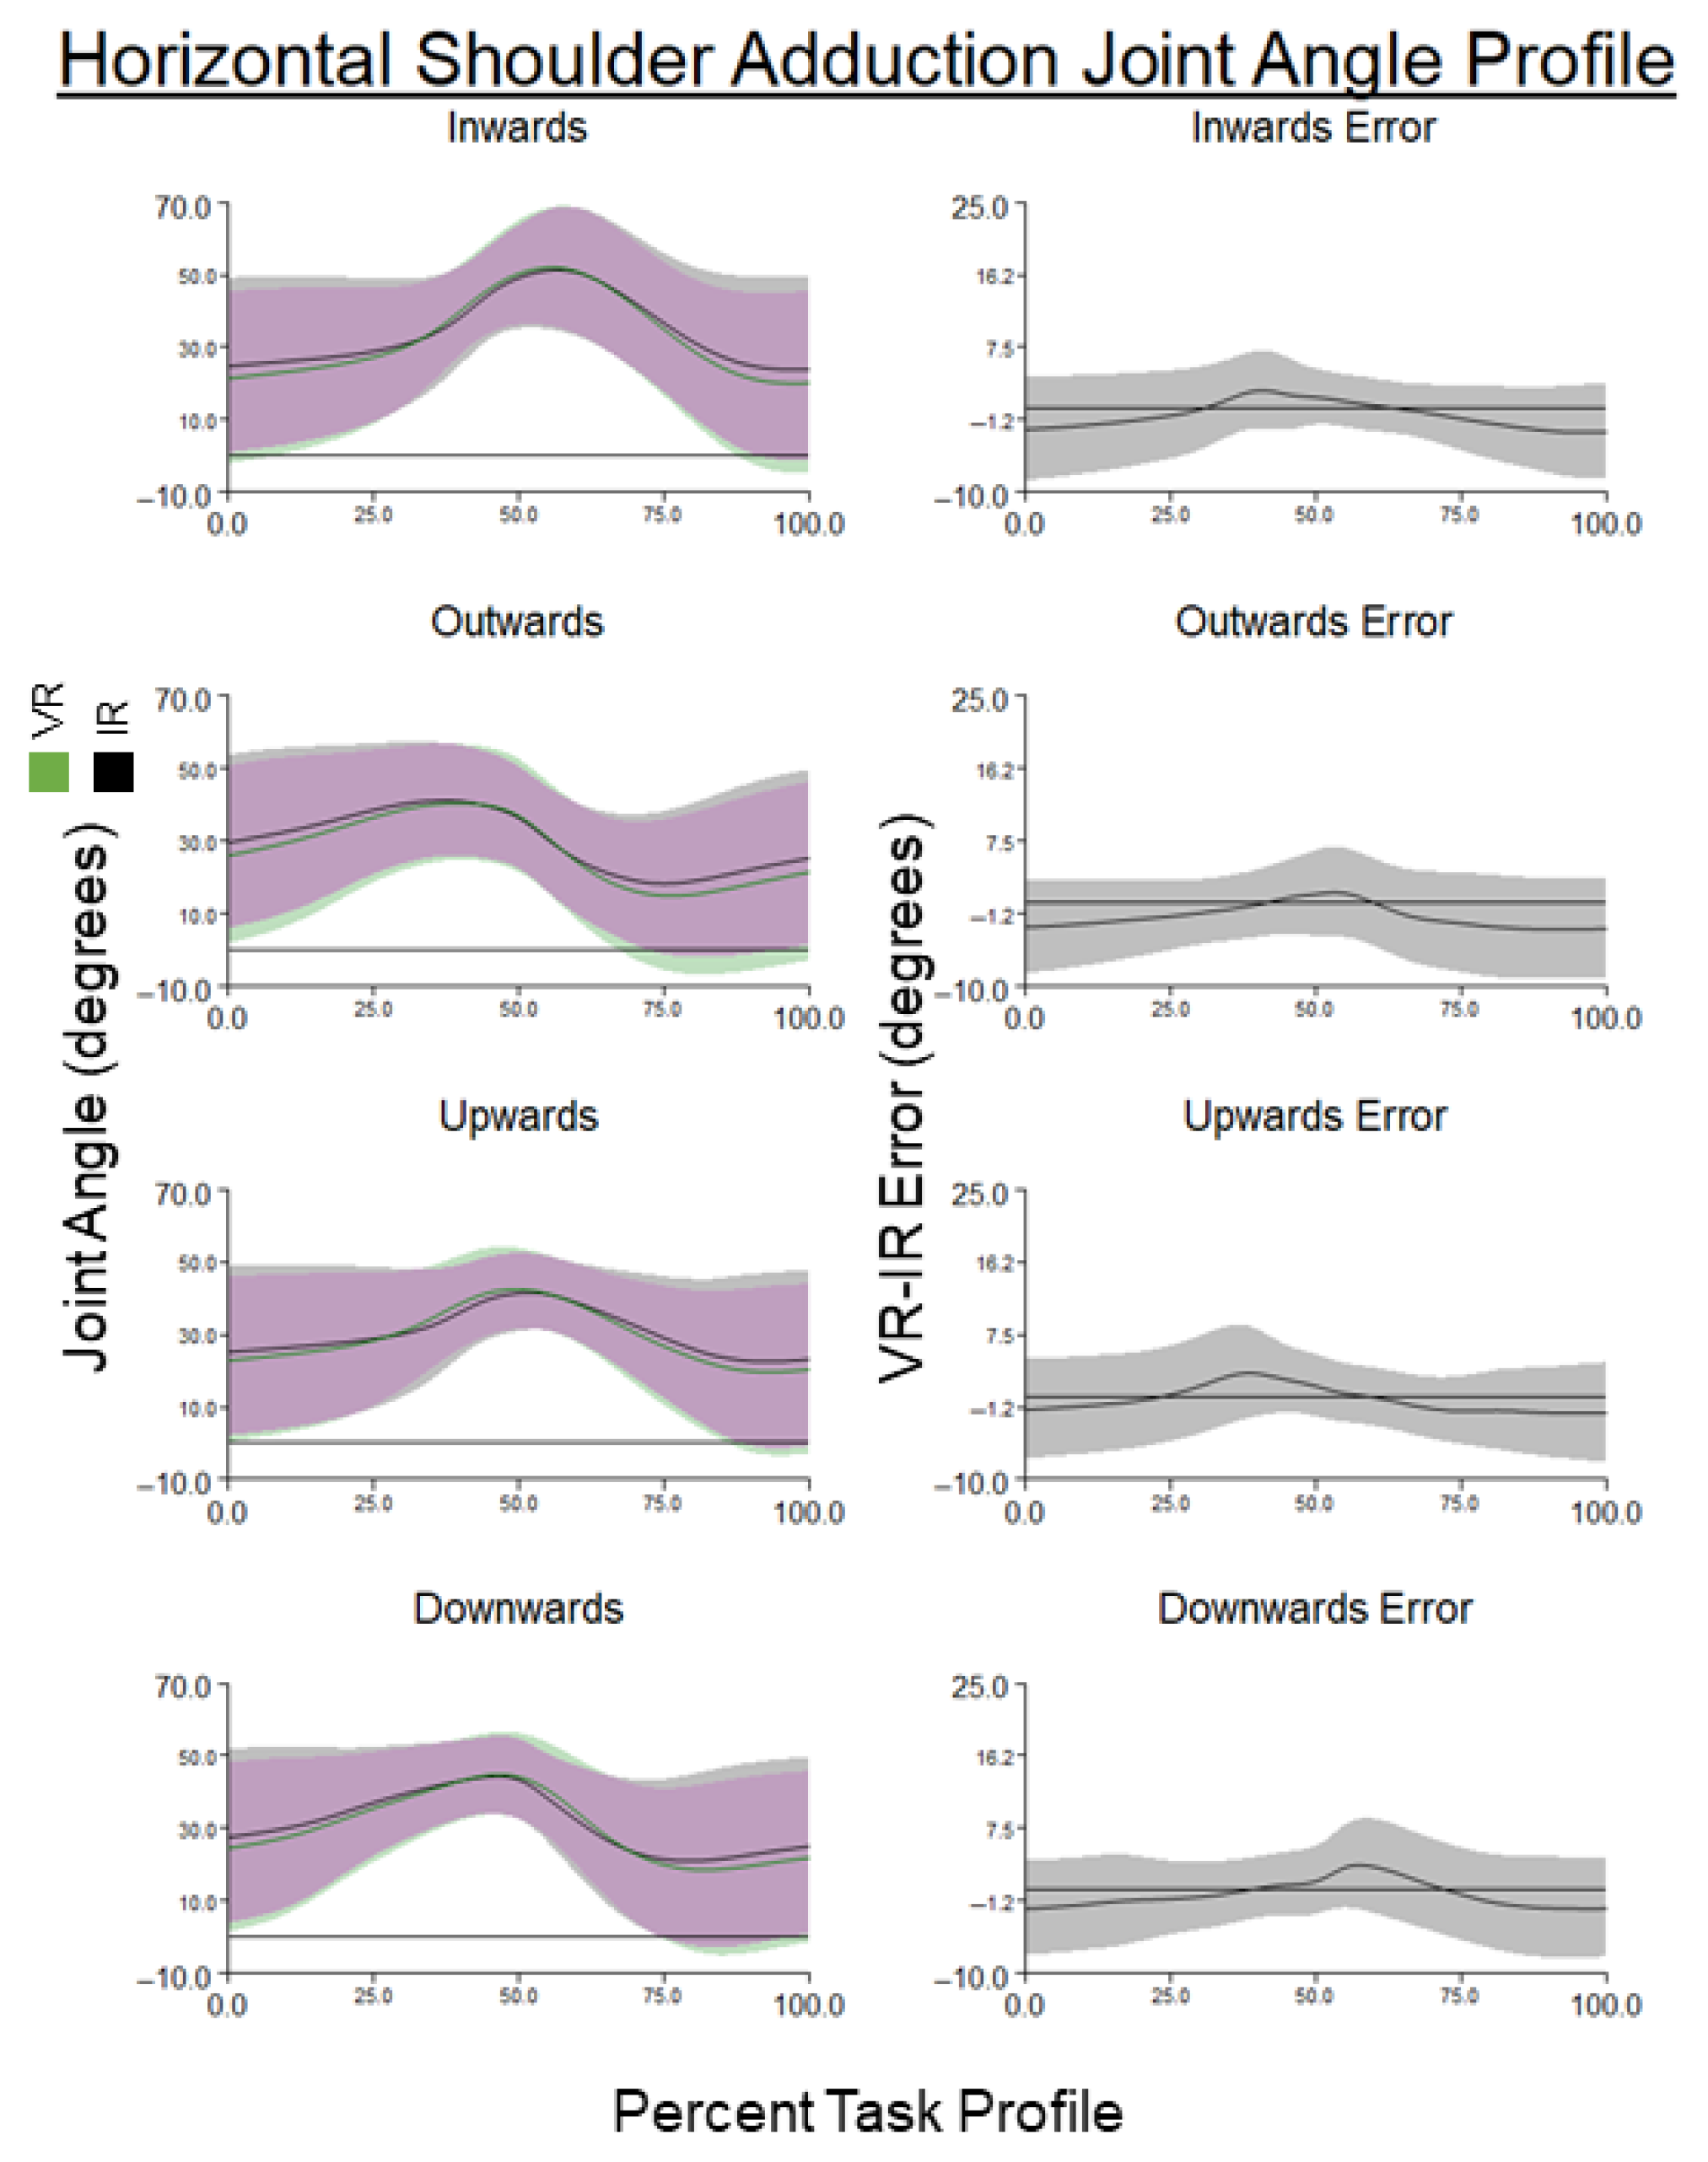
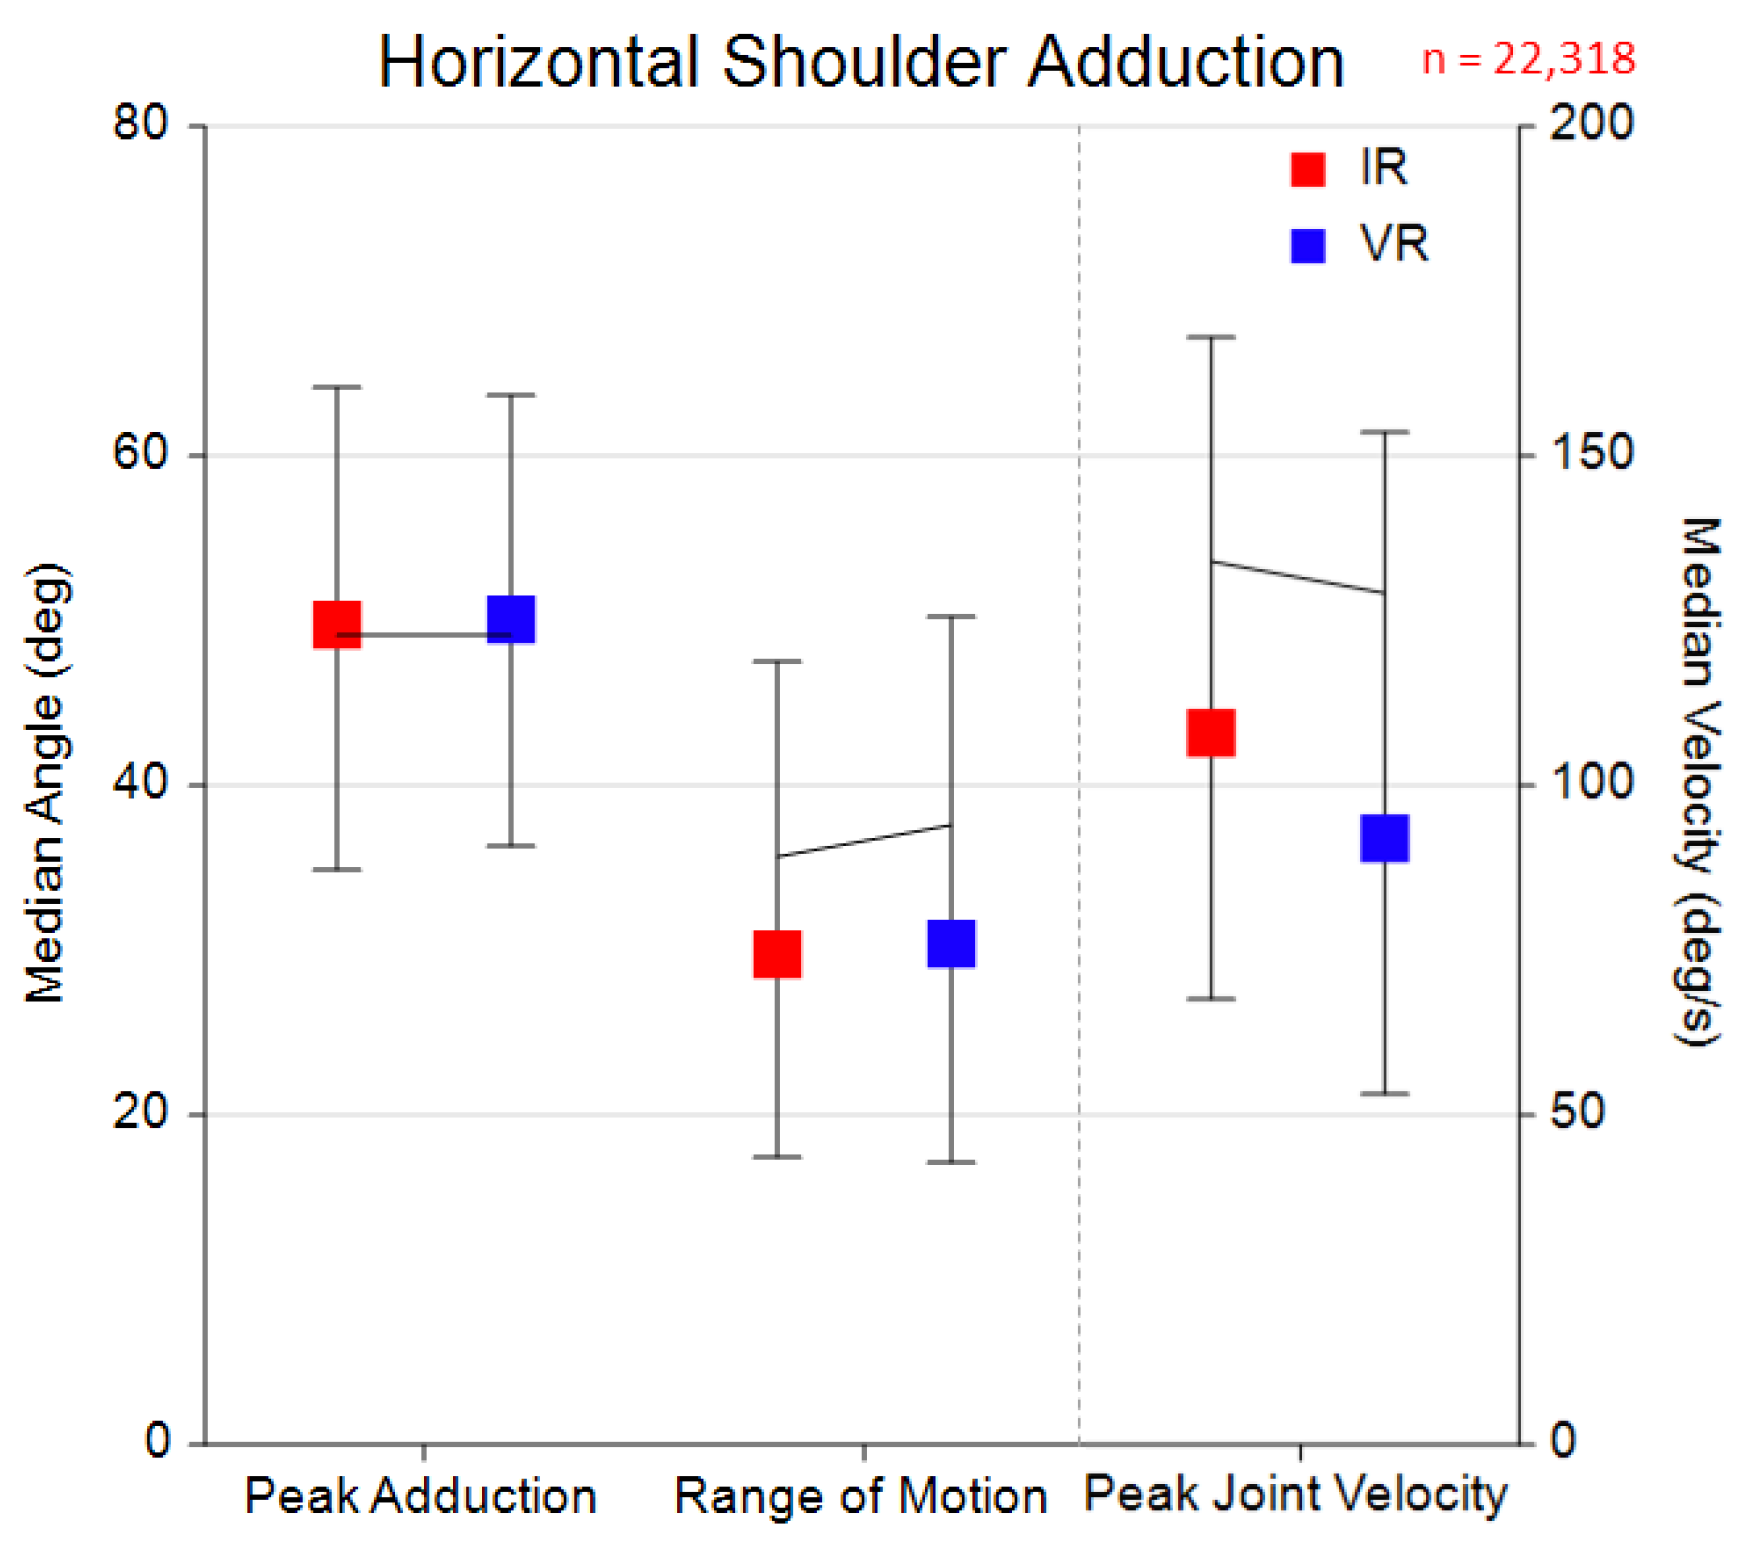
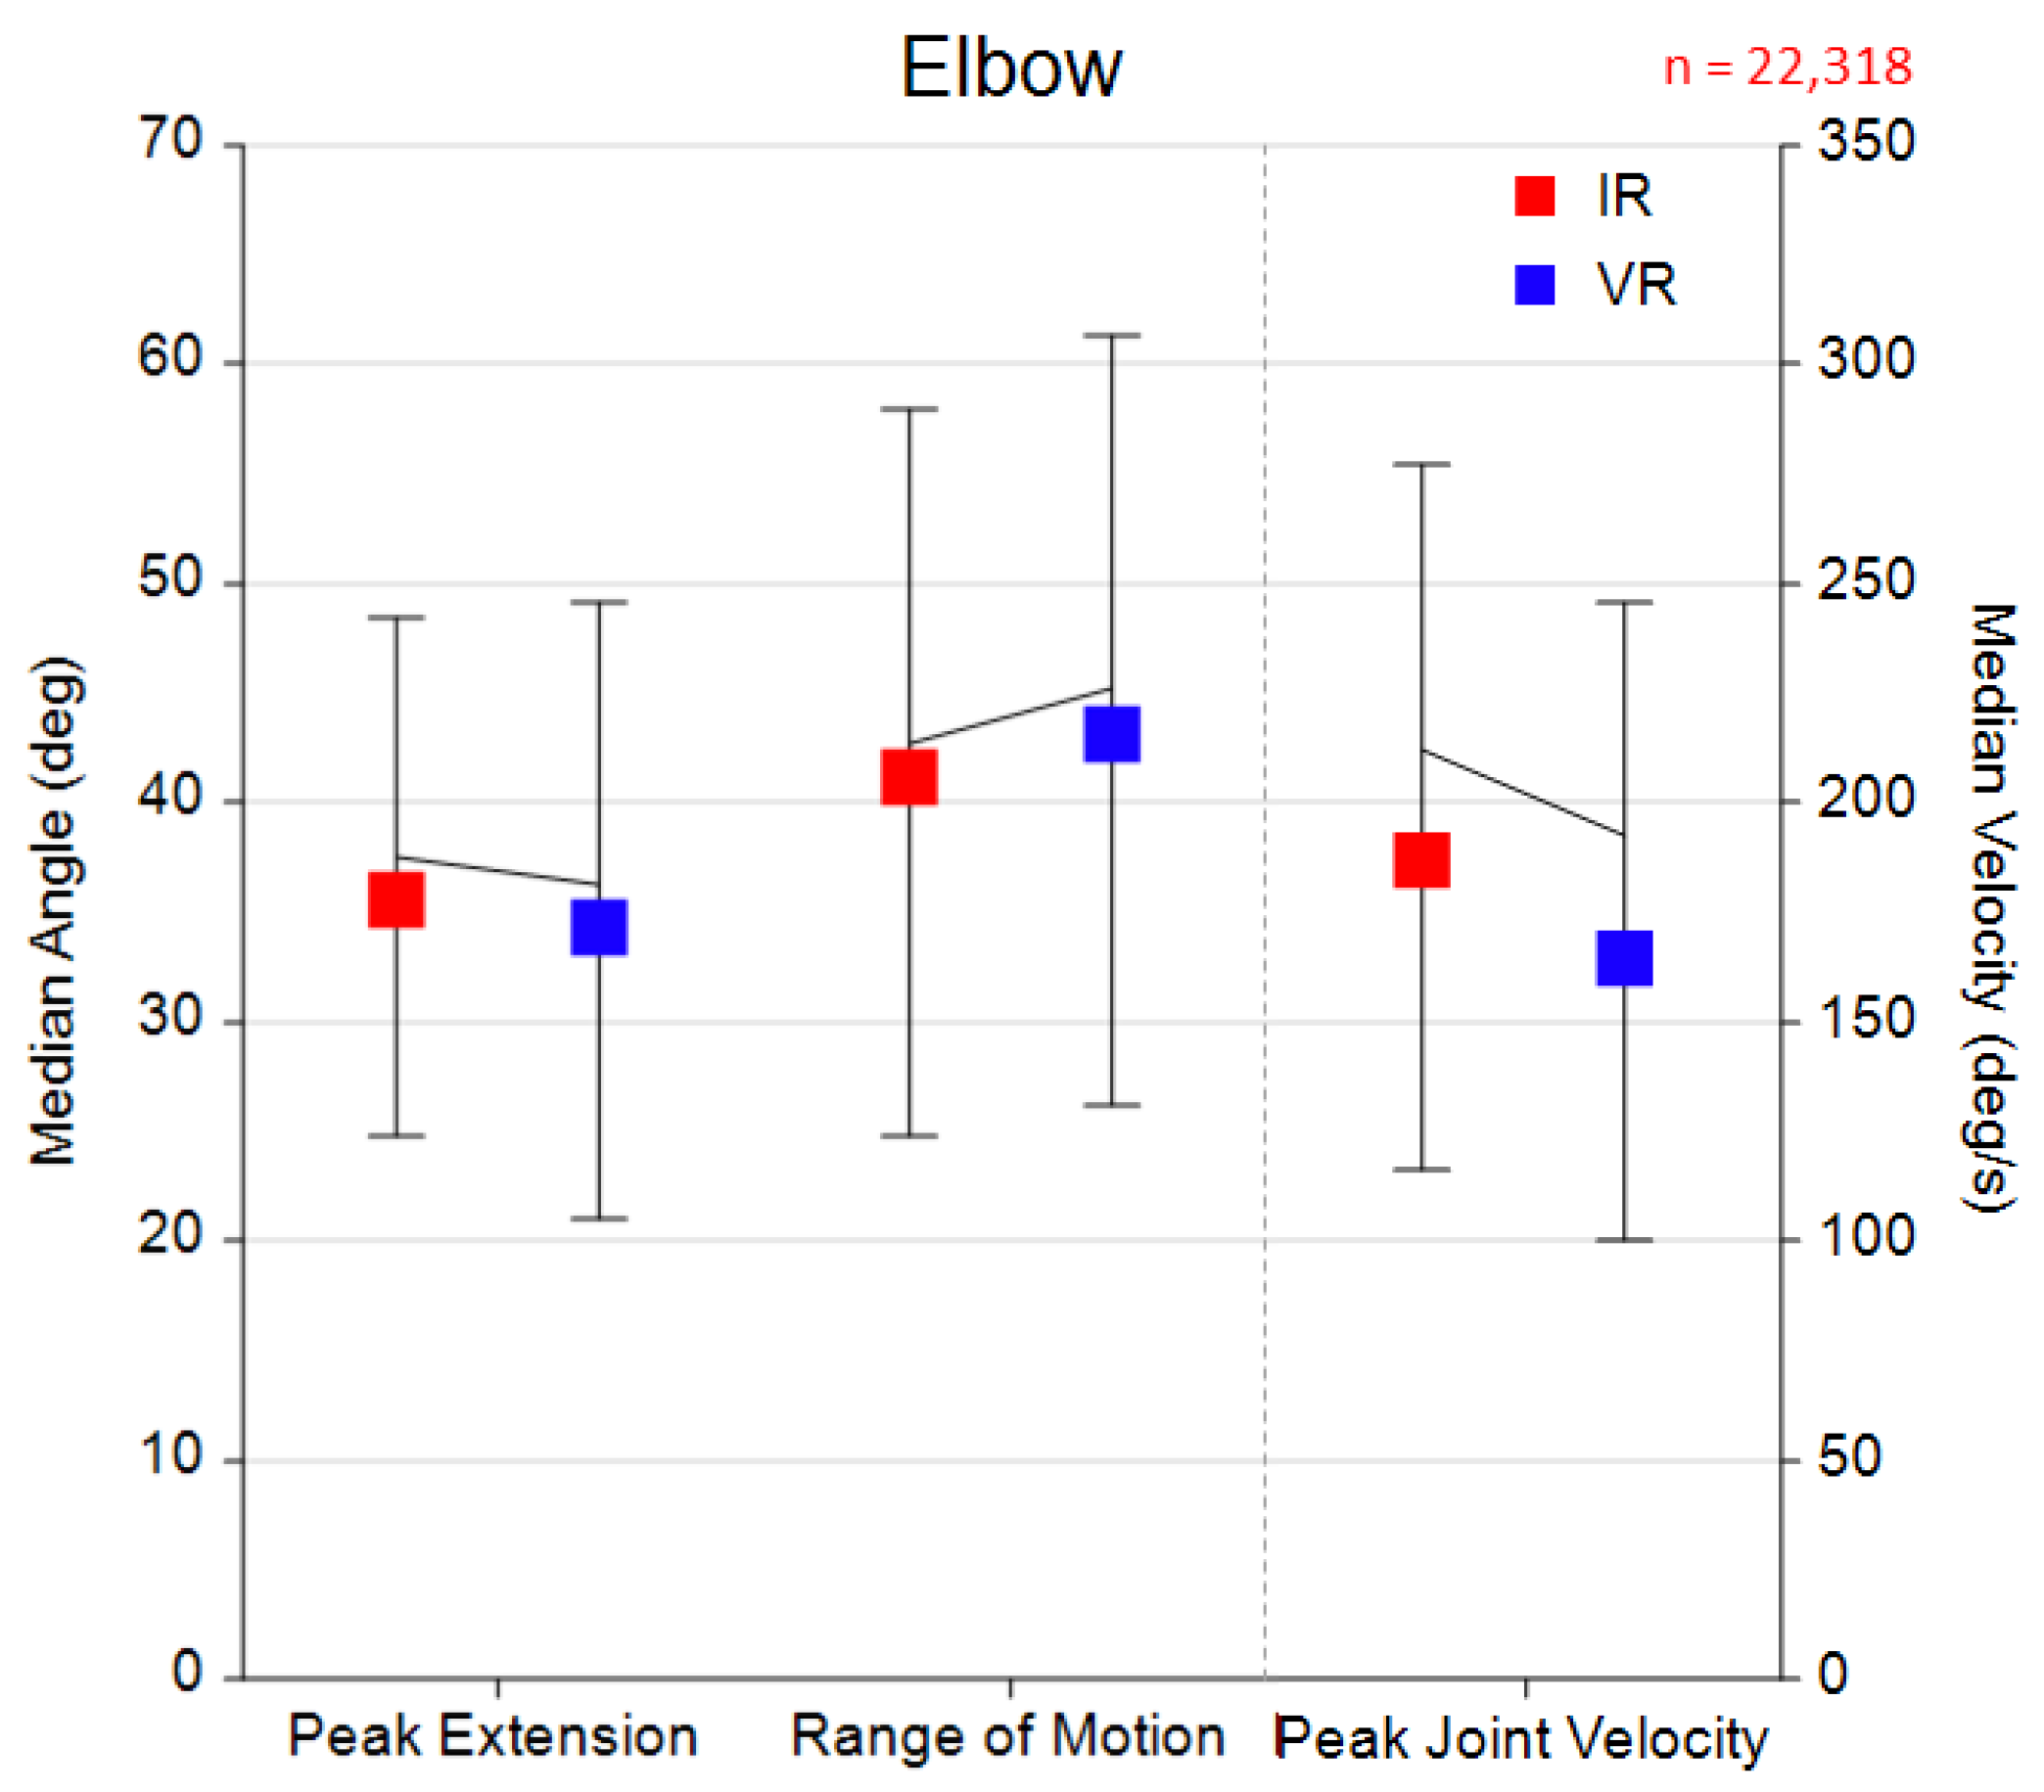
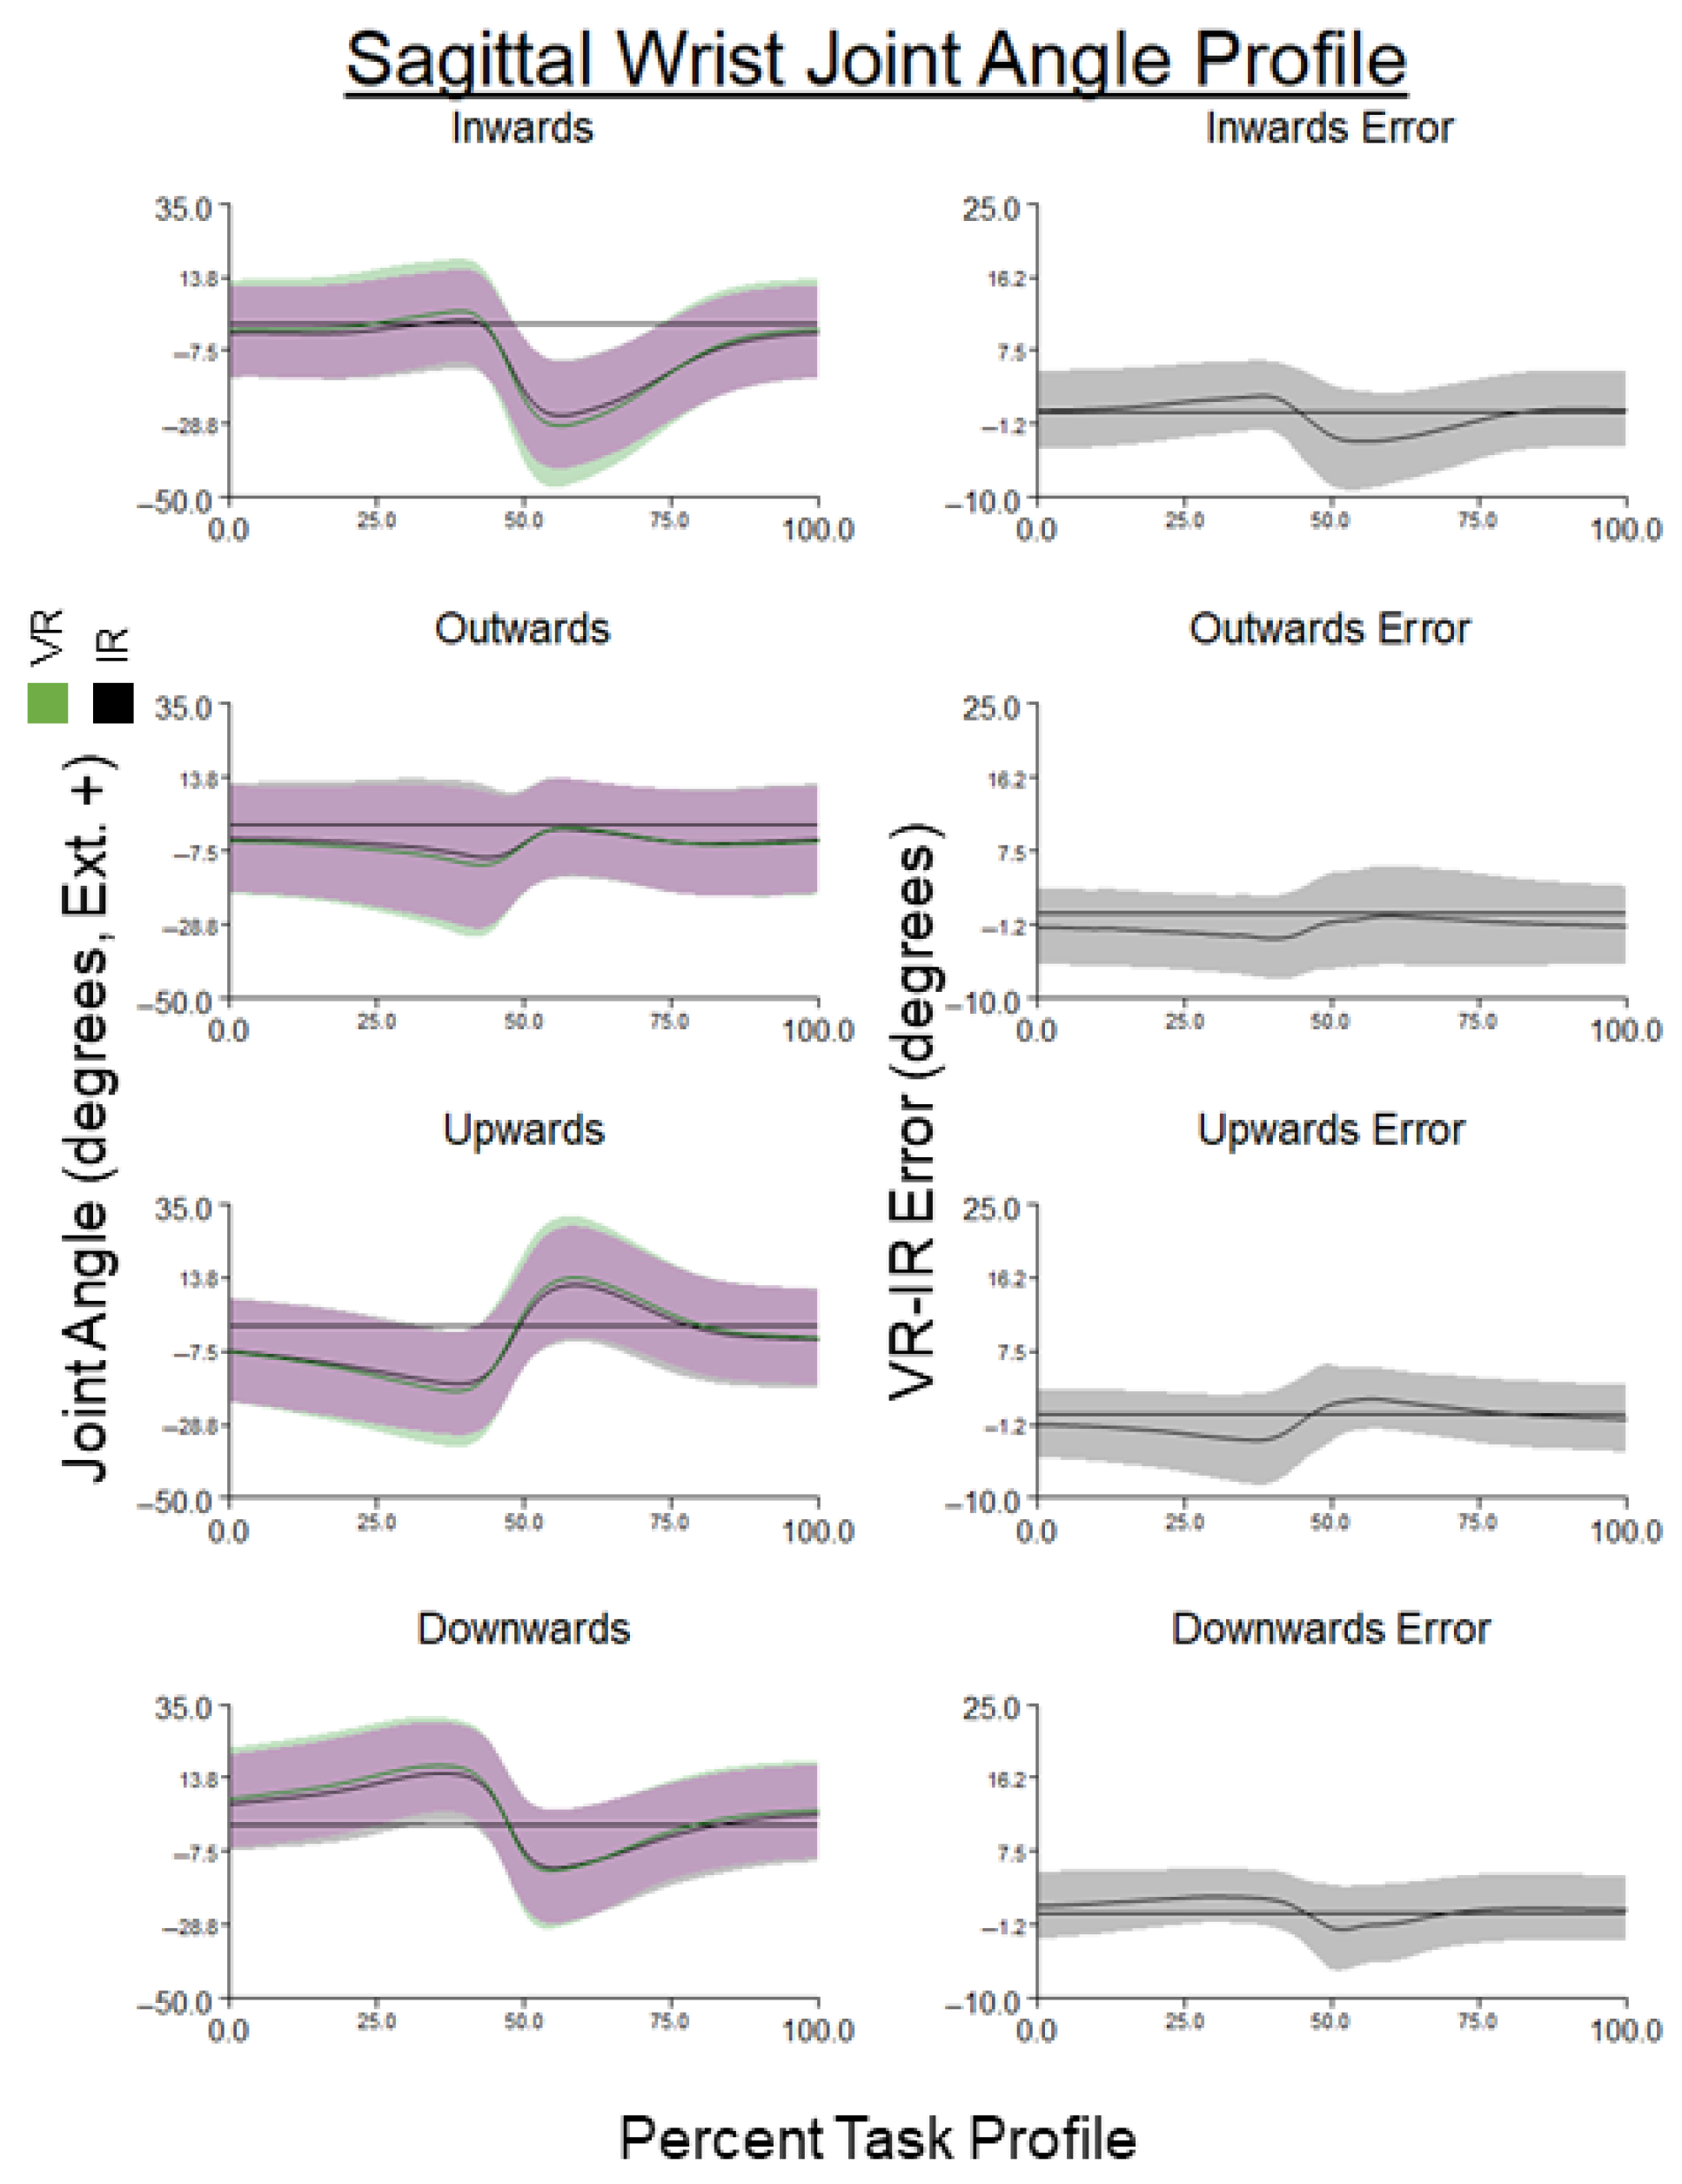
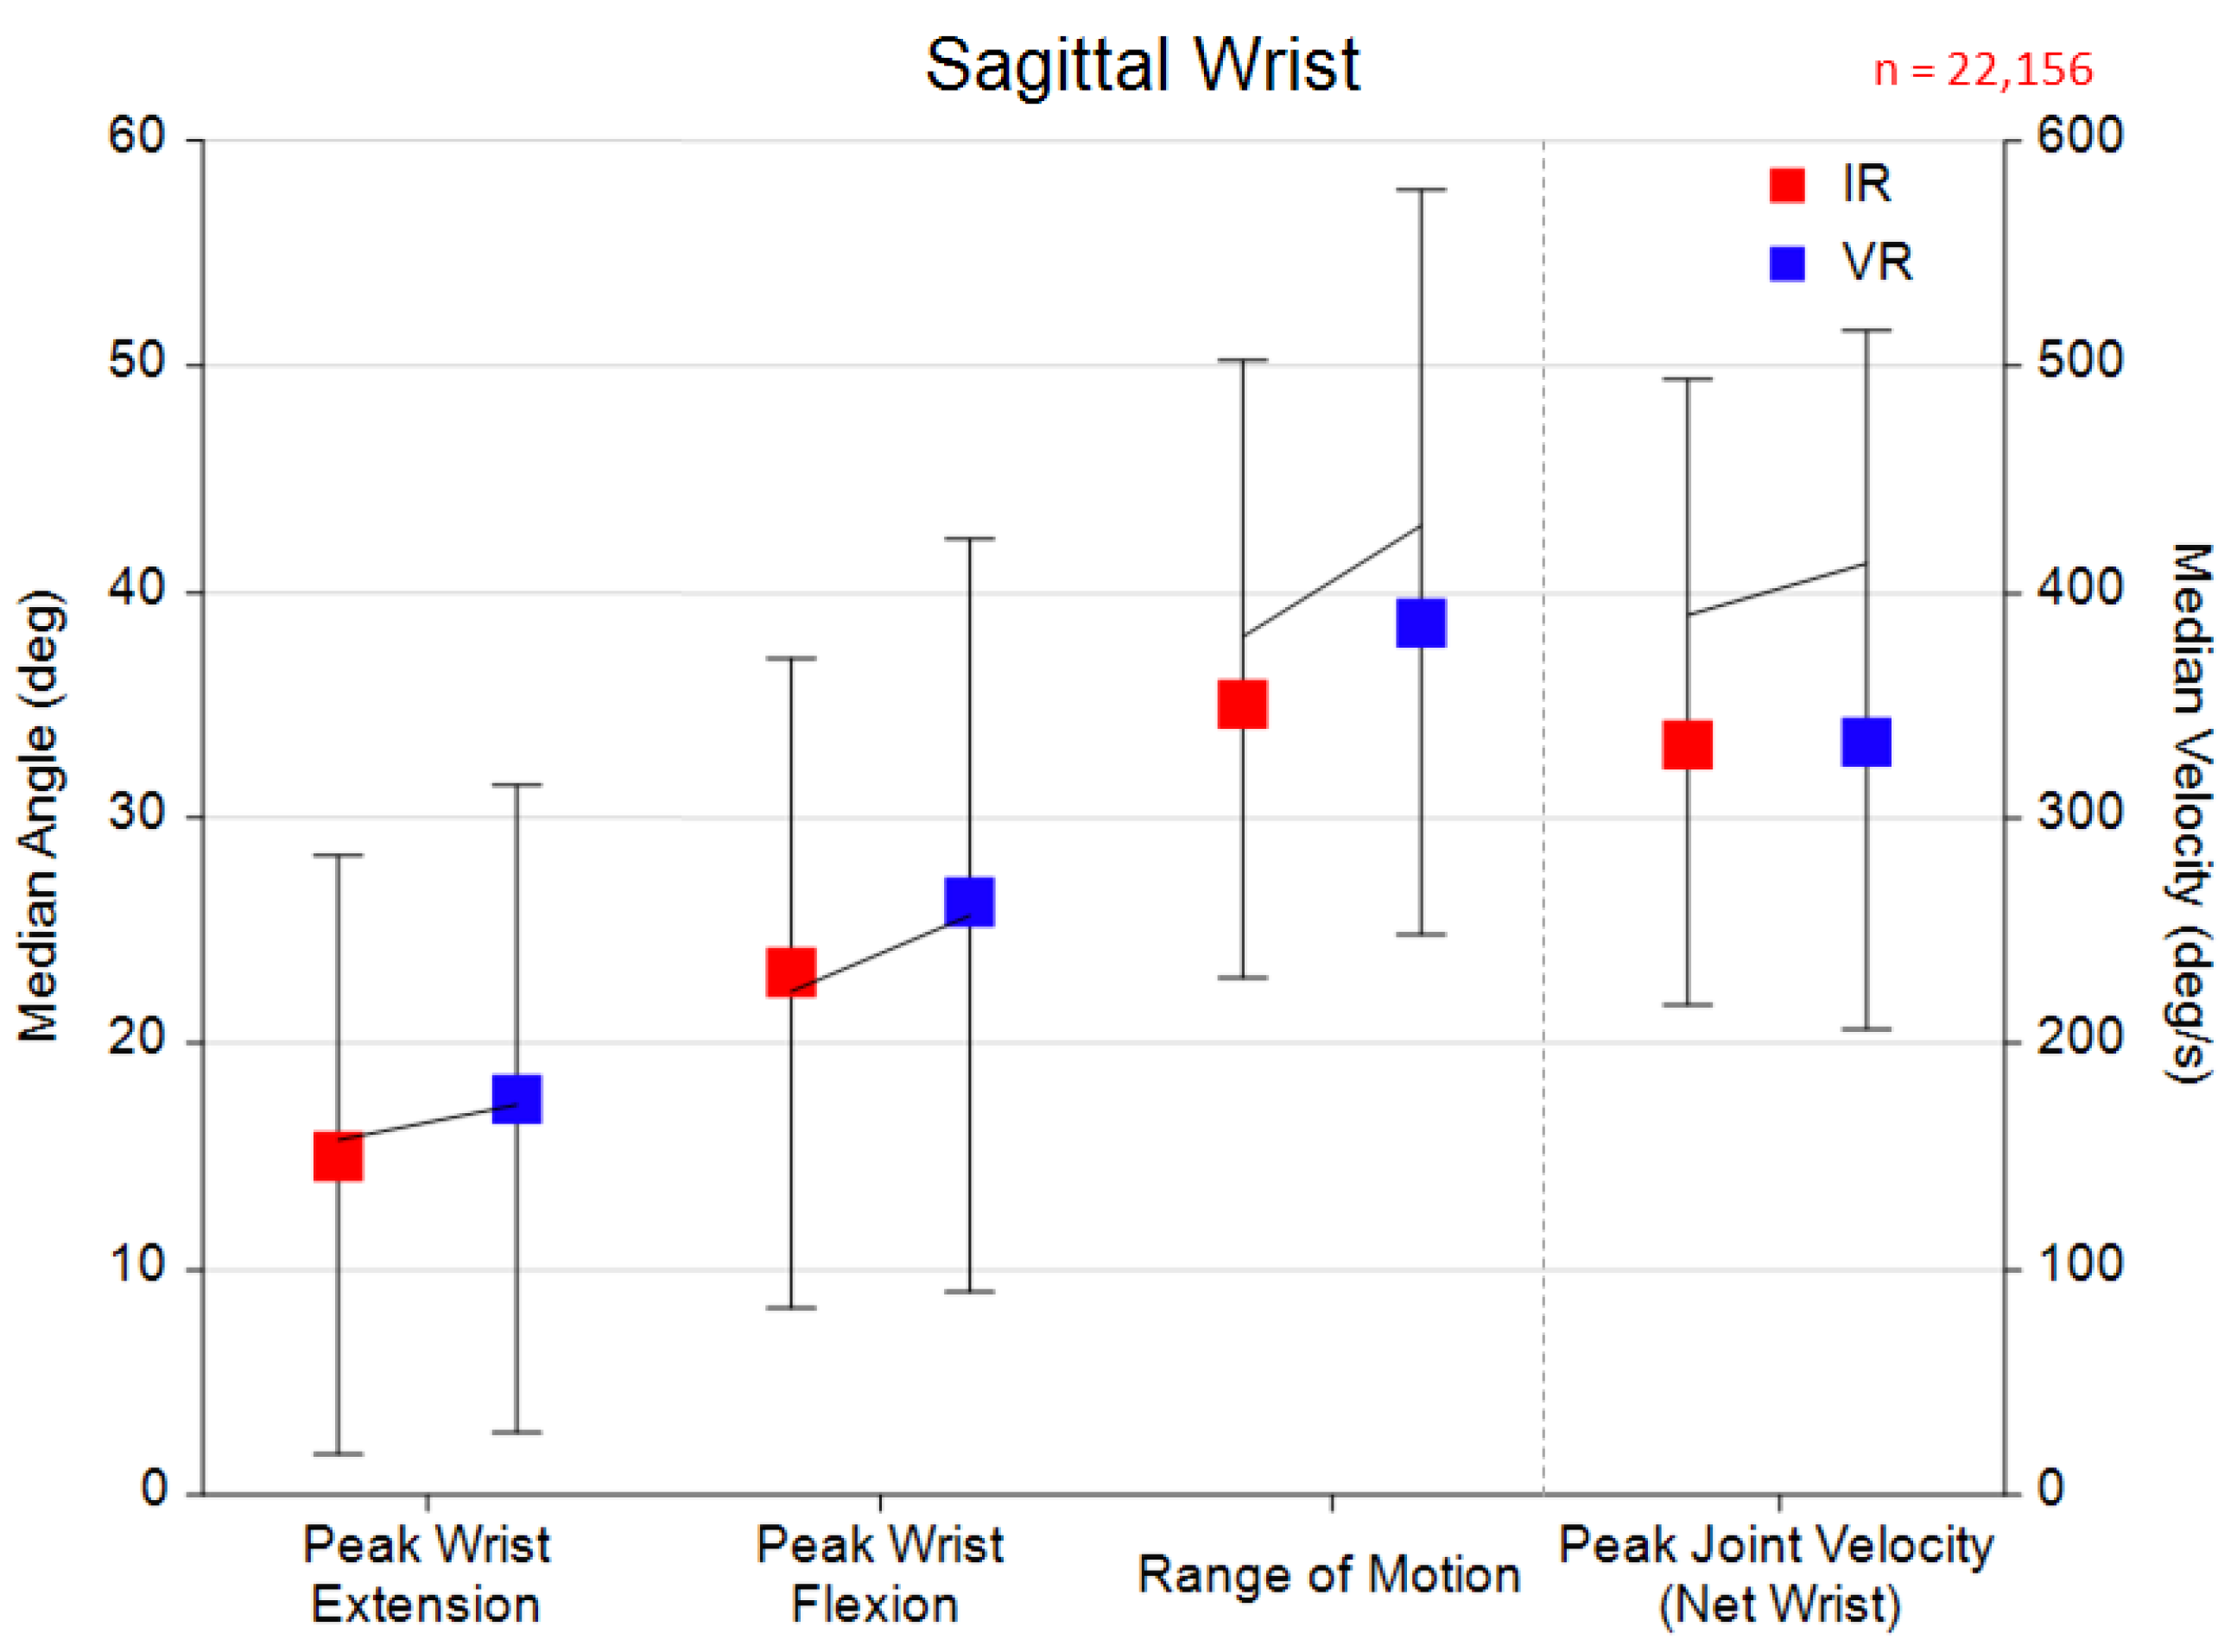
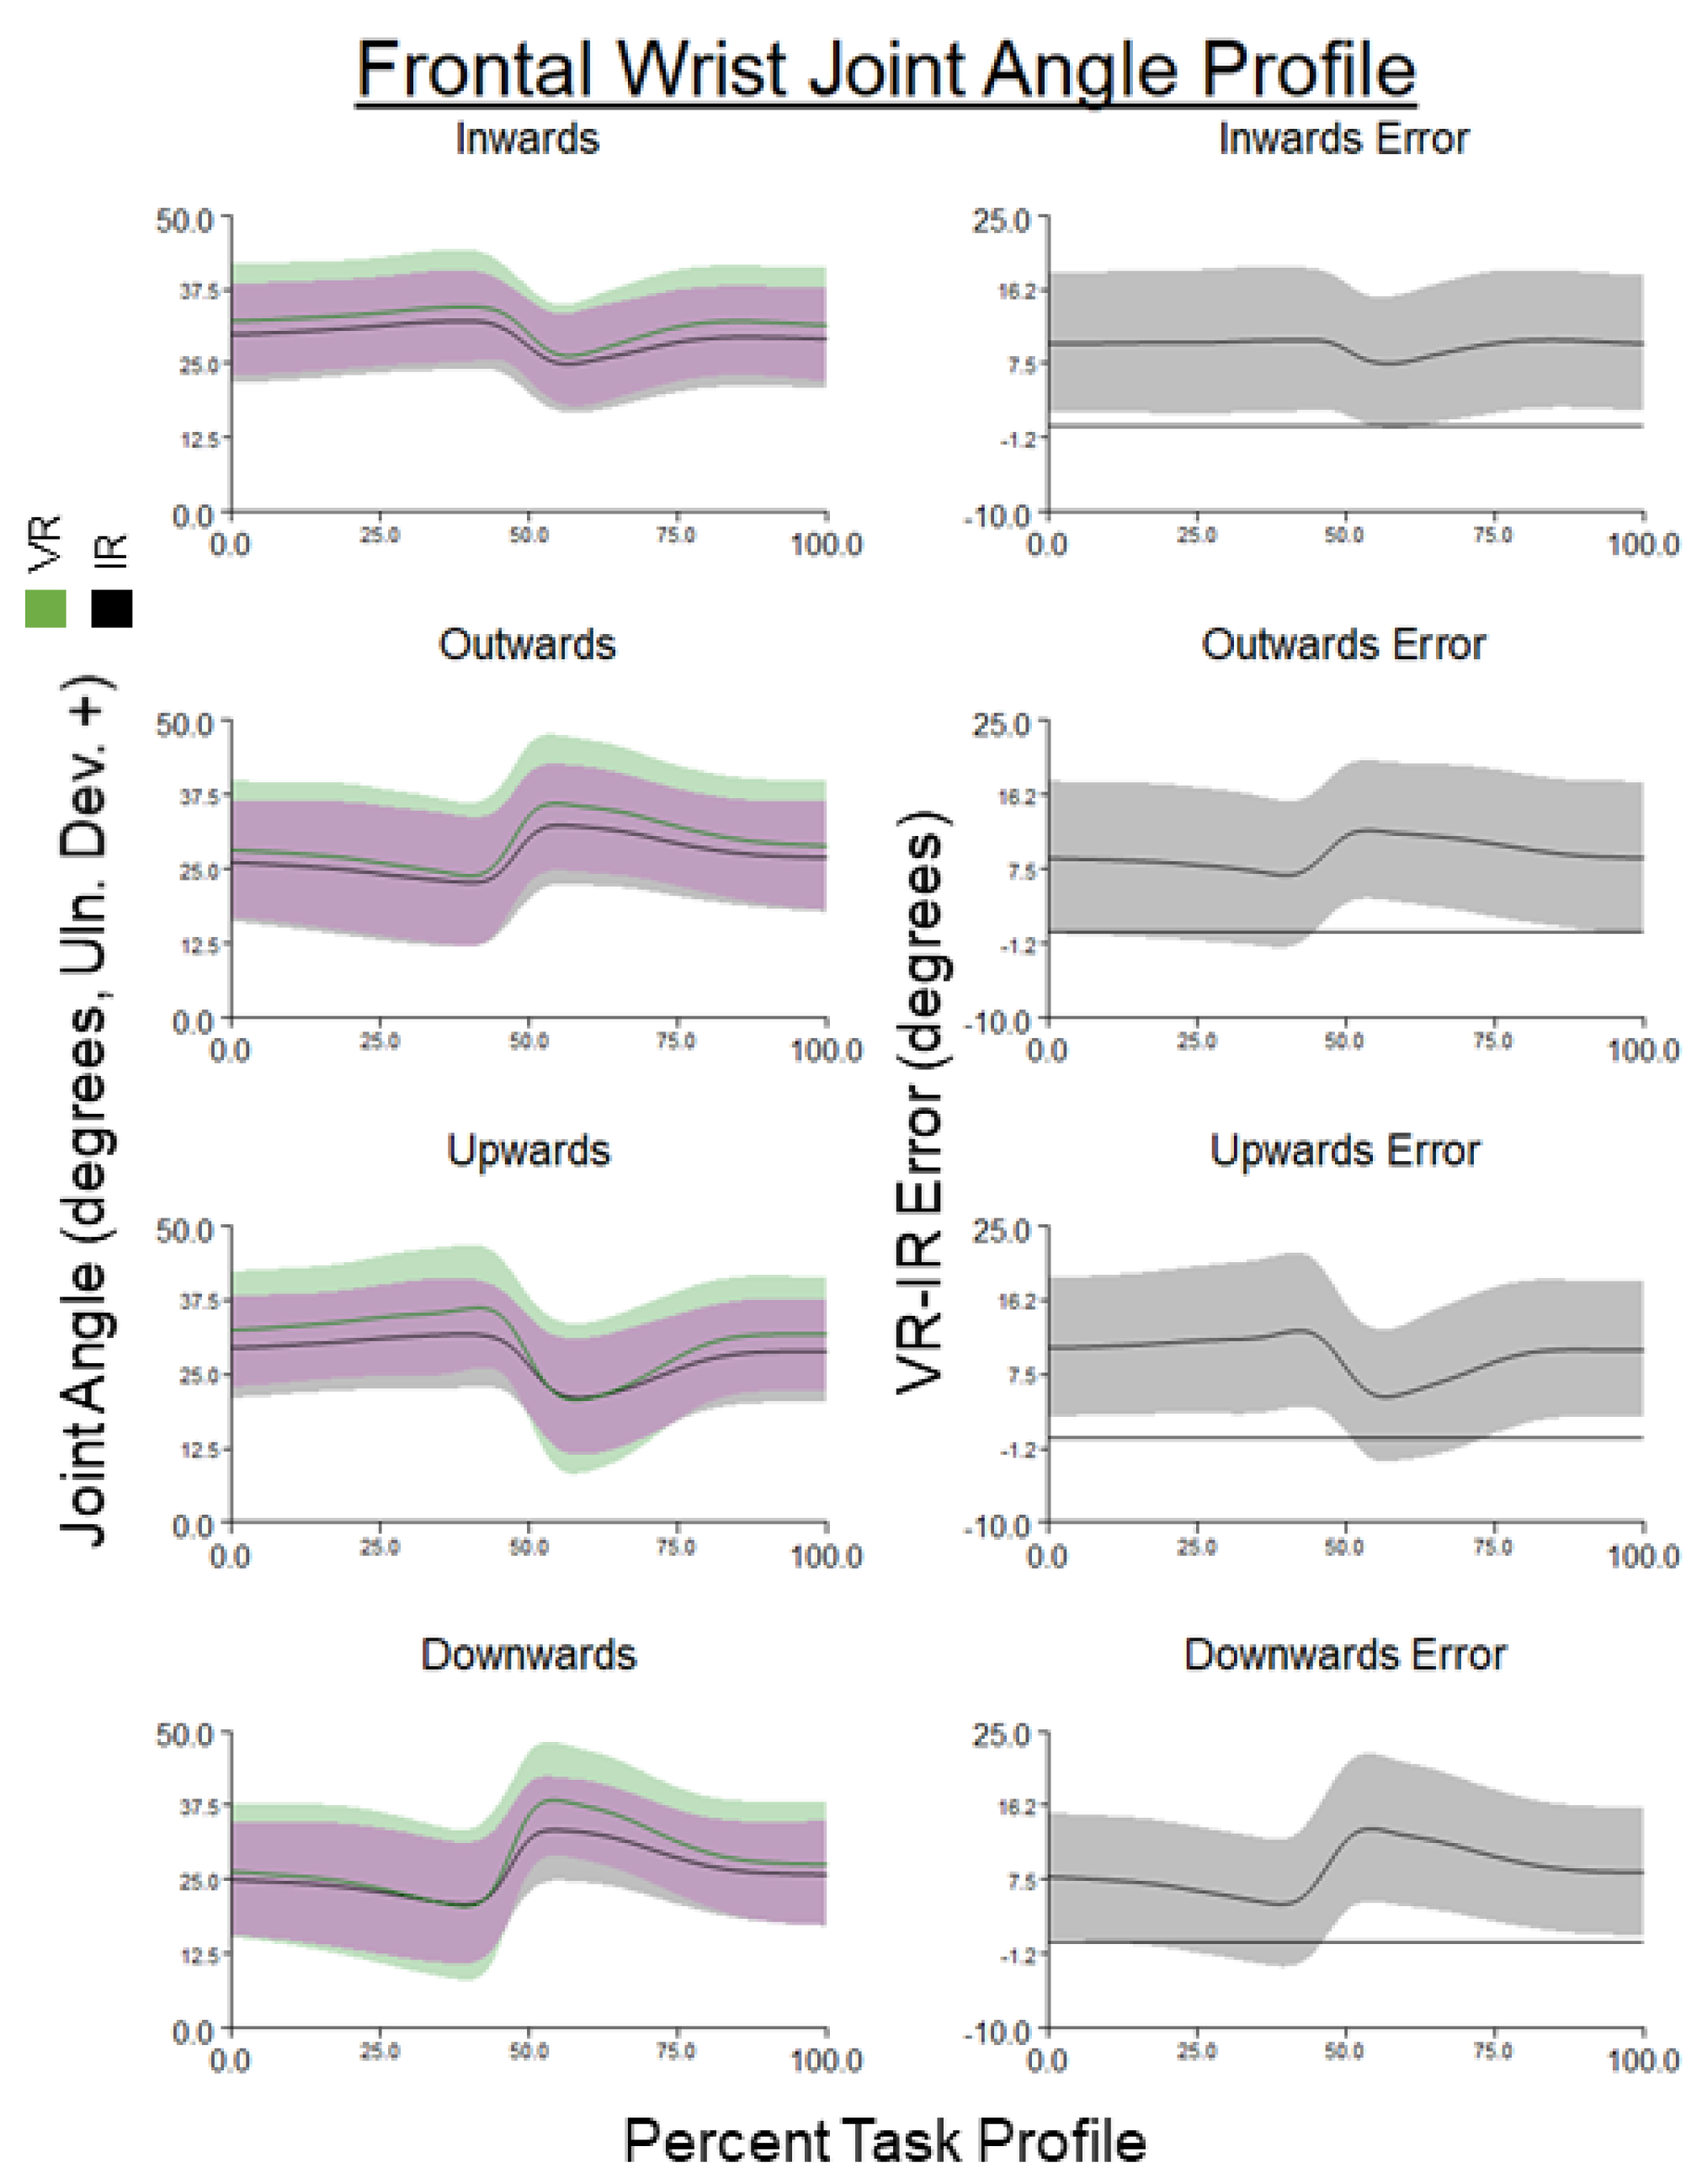
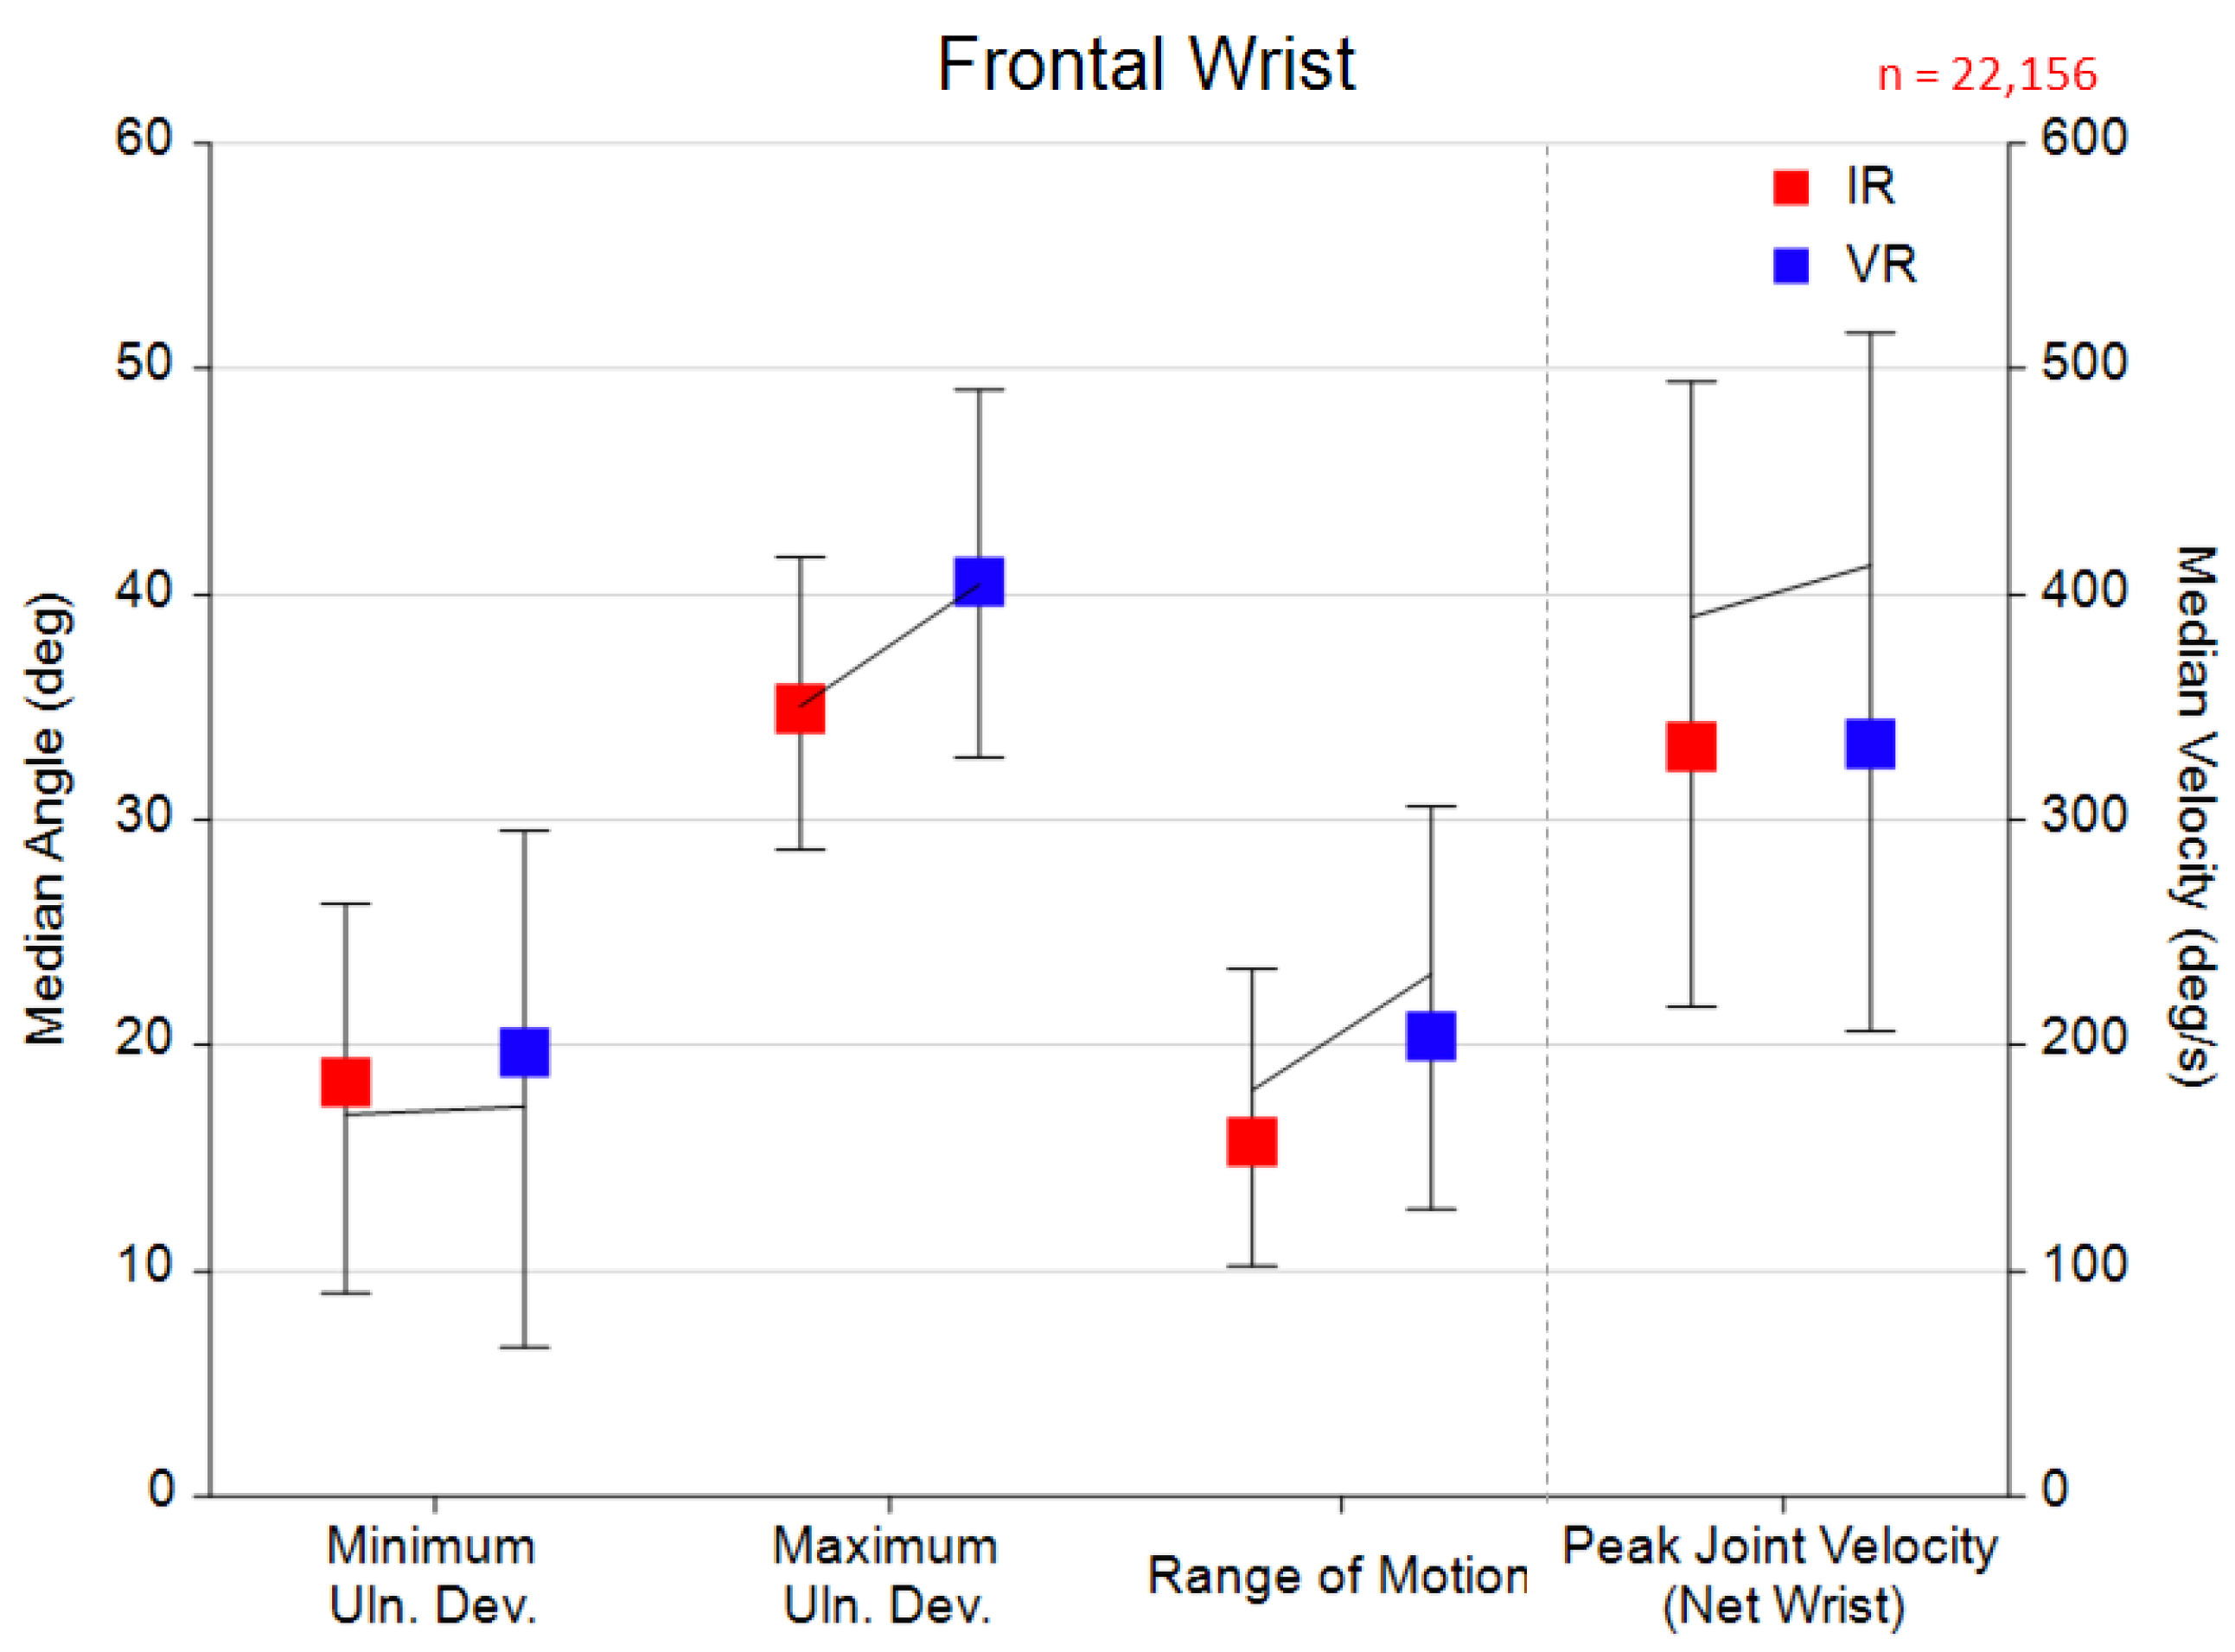
For all joints presented in this section, the format will include two figures. For each joint, the first figure displays the normalized VR and IR joint angle mean (left column) and error (right column) over a task profile (task occurred at 50%). For the left column, VR mean angles and standard deviations are green, IR are black, and purple is the overlap of both standard deviations. For the right column, error is calculated as difference in the two signals shown in the left column (VR−IR). The mean is shown by the bold black line, with the standard deviation in gray. These plots are separated by the direction of the task, as this condition changes the shape of the profile. For each joint, the second figure shows the median peak joint angle, range of motion, and peak joint velocity across all task profiles and participants, separated by IR (red square) and VR (blue square) motion capture systems. Distribution lines encompass the 25% and 75% percentiles and the connecting lines indicate the means. The left axis relates to the peak joint angle and range of motion values. The right axis relates to the joint velocity values.
Shoulder elevation joint angle profiles can be seen in Figure 8, with peak metrics in Figure 9. Shoulder elevation had a median RMSE of 3.79° ± 2.95° with median participant-grouped biases of 0.47° ± 5.24° for ROM, 2.18° ± 5.44 ° for peak joint angle, and 4.7°/s ± 31.0°/s for peak joint velocity. The median participant-level biases were 1.70° ± 4.35° for ROM, 2.81° ± 4.65° for peak joint angle, and 6.5°/s ± 25.3°/s for peak joint velocity.
Horizontal shoulder adduction joint angle profiles can be seen in Figure 10, with peak metrics in Figure 11. Horizontal shoulder adduction had a median RMSE of 6.20° ± 4.64° with median participant-grouped biases of 0.53° ± 10.32° for ROM, 0.04° ± 7.58° for peak joint angle, and 11.9°/s ± 515.9°/s for peak joint velocity. The median participant-level biases were 3.31° ± 8.31° for ROM, 2.69° ± 6.35° for peak joint angle, and 17.5°/s ± 248.7°/s for peak joint velocity.
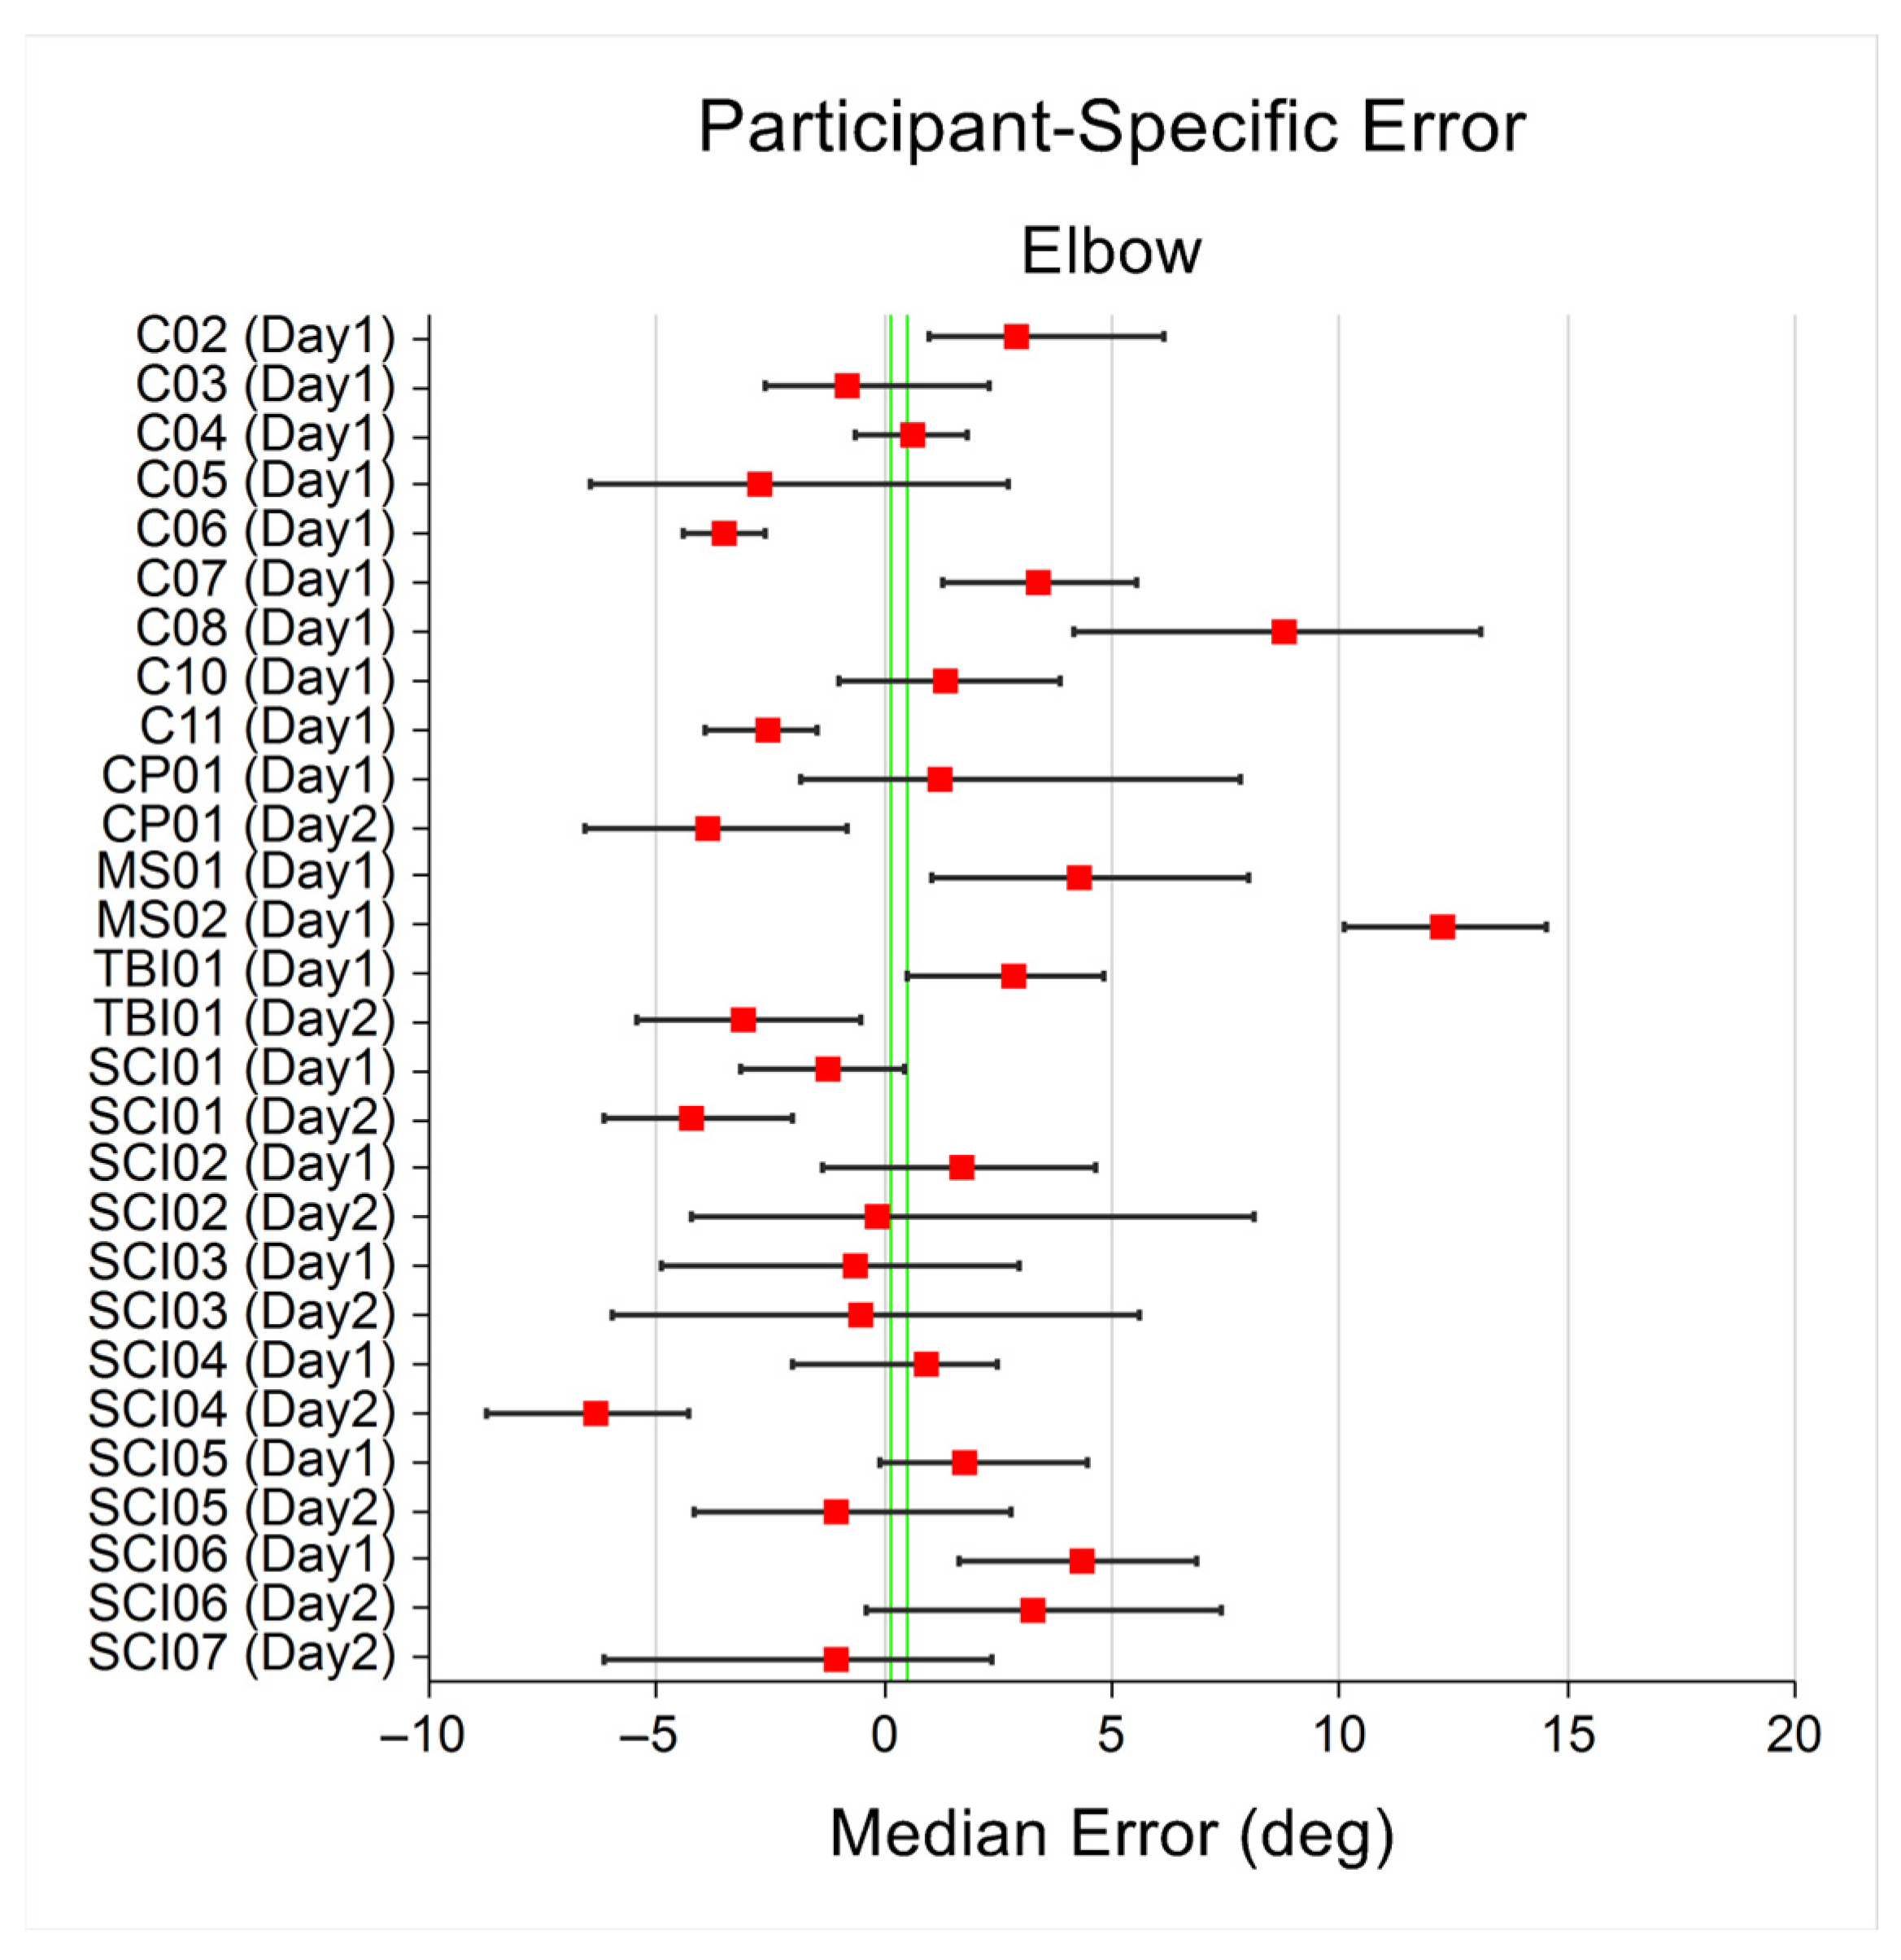
Elbow flexion/extension joint angle profiles can be seen in Figure 12, with peak metrics in Figure 13. The elbow had a median RMSE of 5.33° ± 3.68° with median participant-grouped biases of 1.95° ± 7.09° for ROM, −1.65° ± 7.98° for peak joint angle, and 22.4°/s ± 103.0°/s for peak joint velocity. The median participant-level biases were 2.21° ± 6.48° for ROM, 3.06° ± 6.44° for peak joint angle, and 20.4°/s ± 149.1°/s for peak joint velocity.
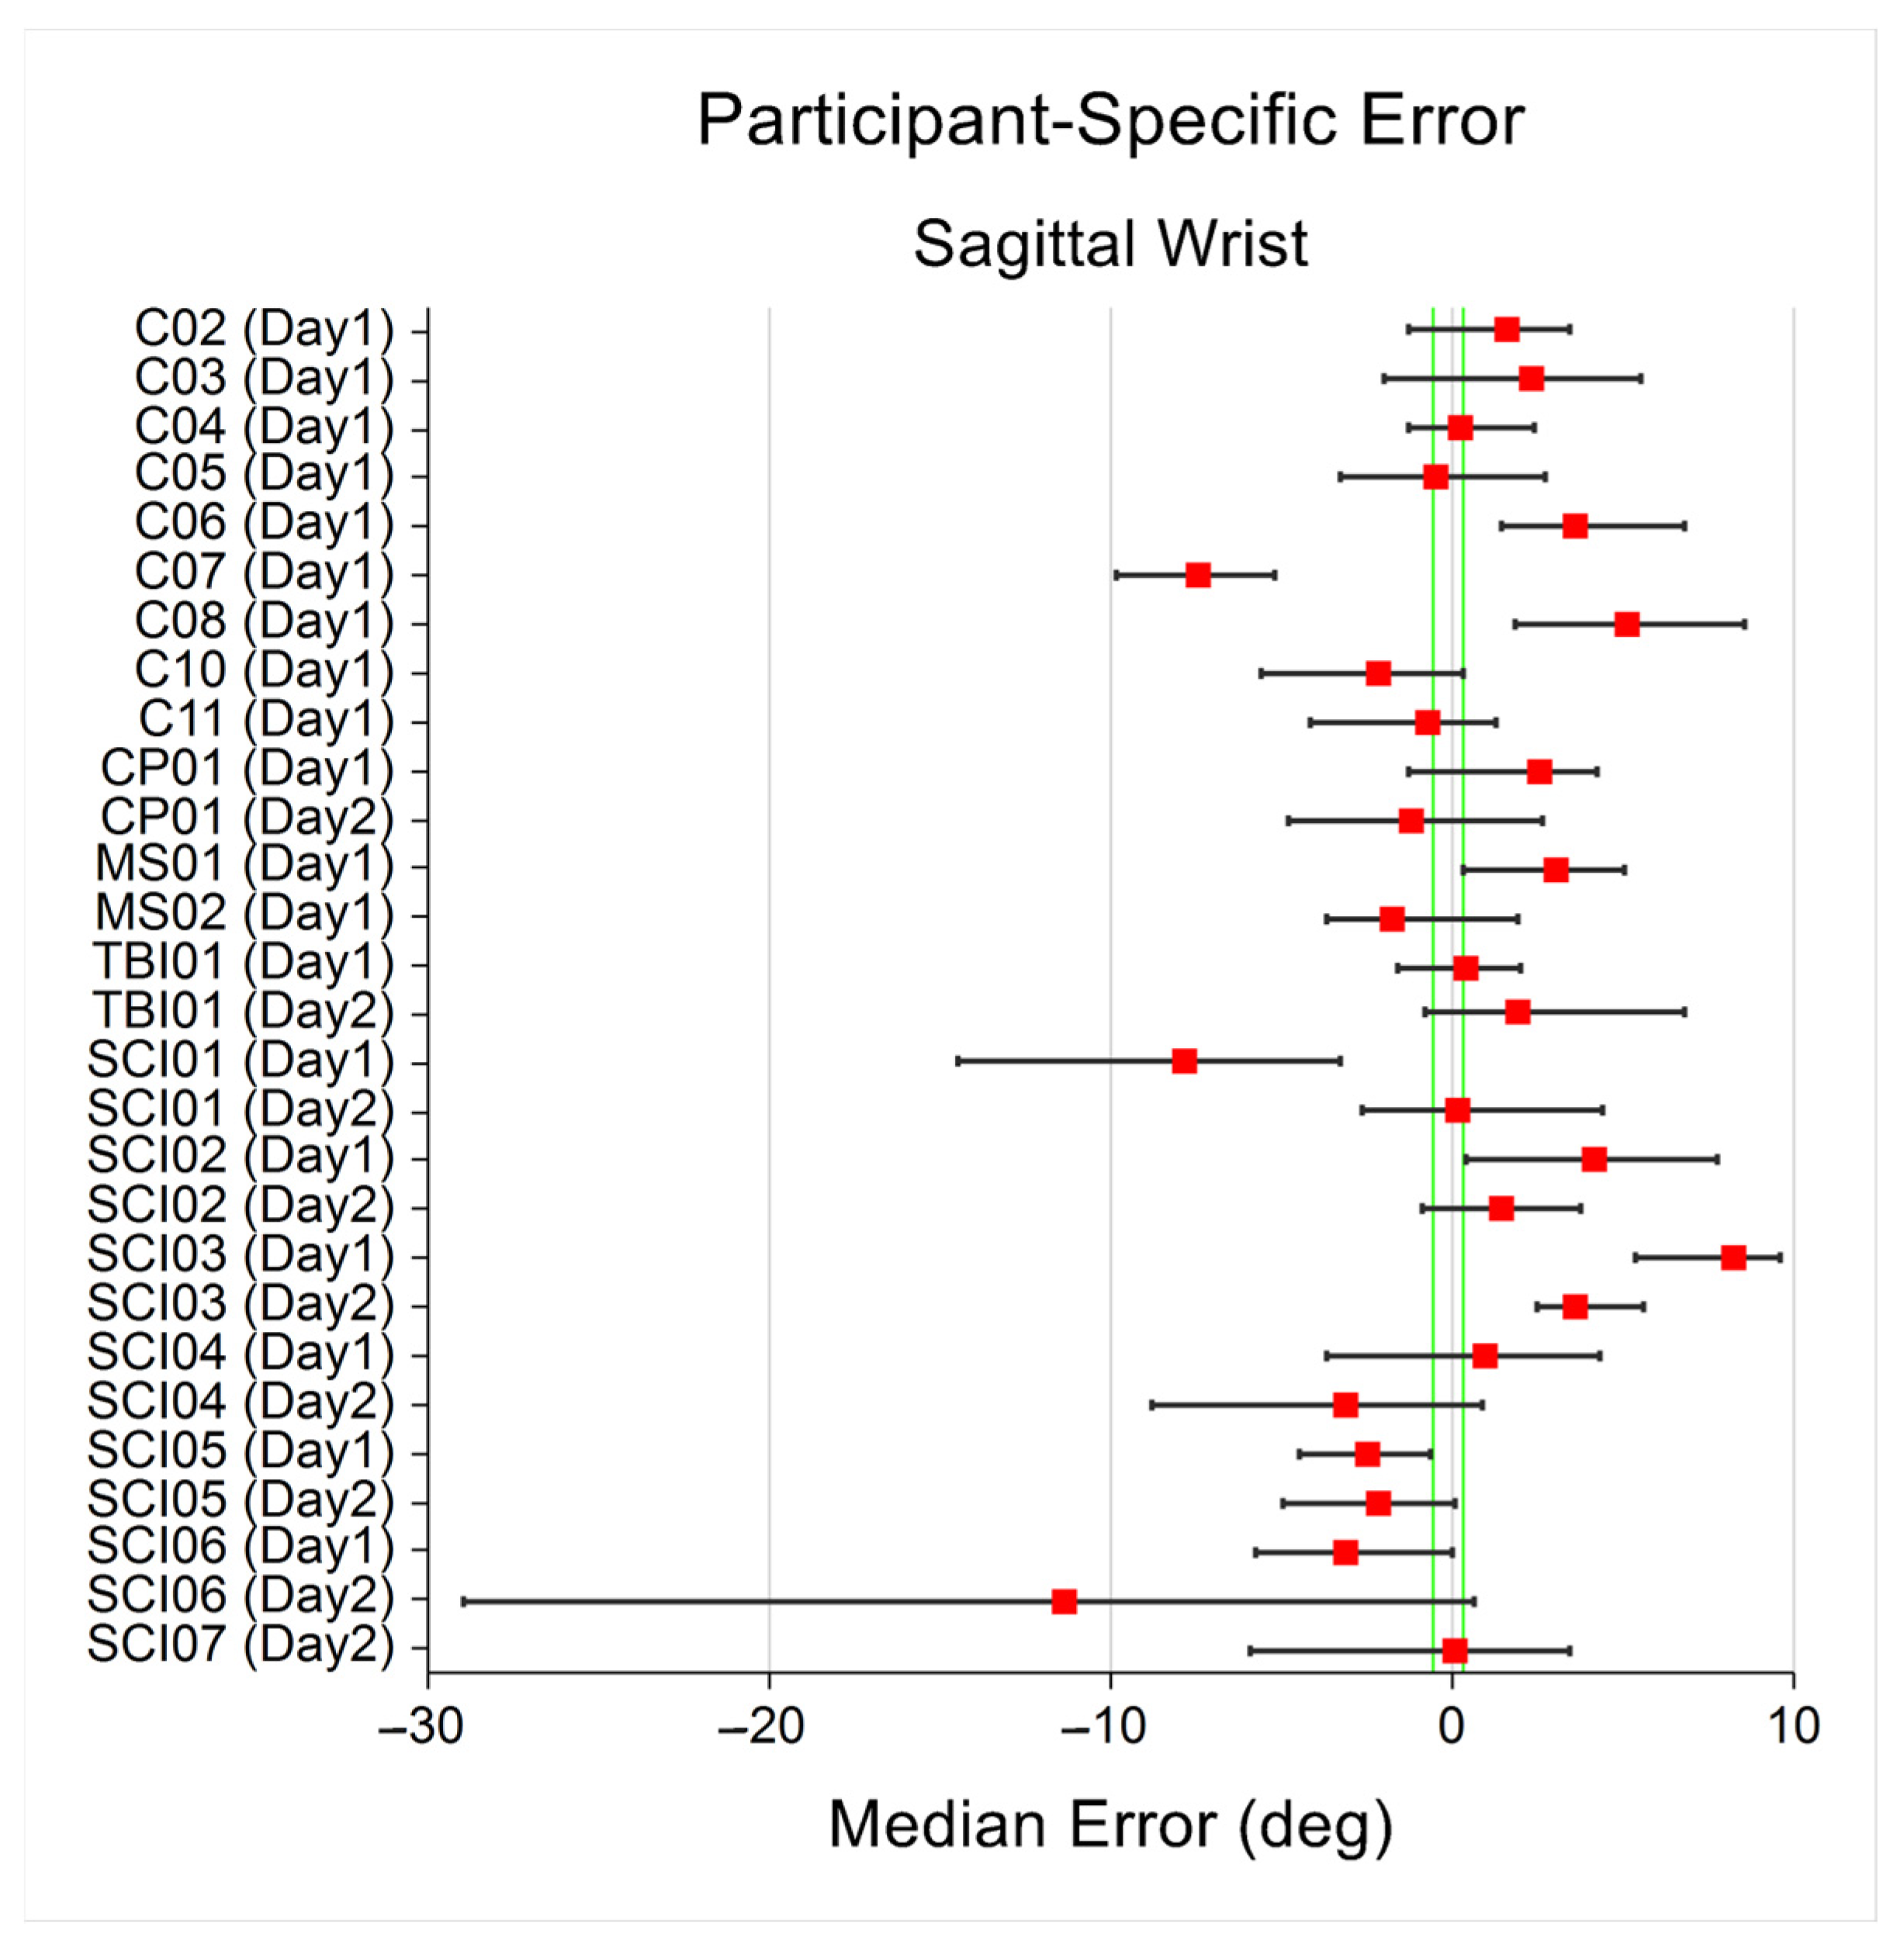
Sagittal wrist joint angle profiles can be seen in Figure 14, with peak metrics in Figure 15. The sagittal wrist had a median RMSE of 4.88° ± 4.94° with median participant-grouped biases of 3.98° ± 7.61° for ROM, −2.16° ± 8.91° (flexion) and 2.26° ± 7.08° (extension) for peak joint angle, and −2.8°/s ± 790.3°/s (net wrist) for peak joint velocity. The median participant-level biases were 4.90° ± 6.00° for ROM, −4.16° ± 6.24° (flexion) and 3.19° ± 5.39° (extension) for peak joint angle, and 27.8°/s ± 321.2°/s (net wrist) for peak joint velocity.
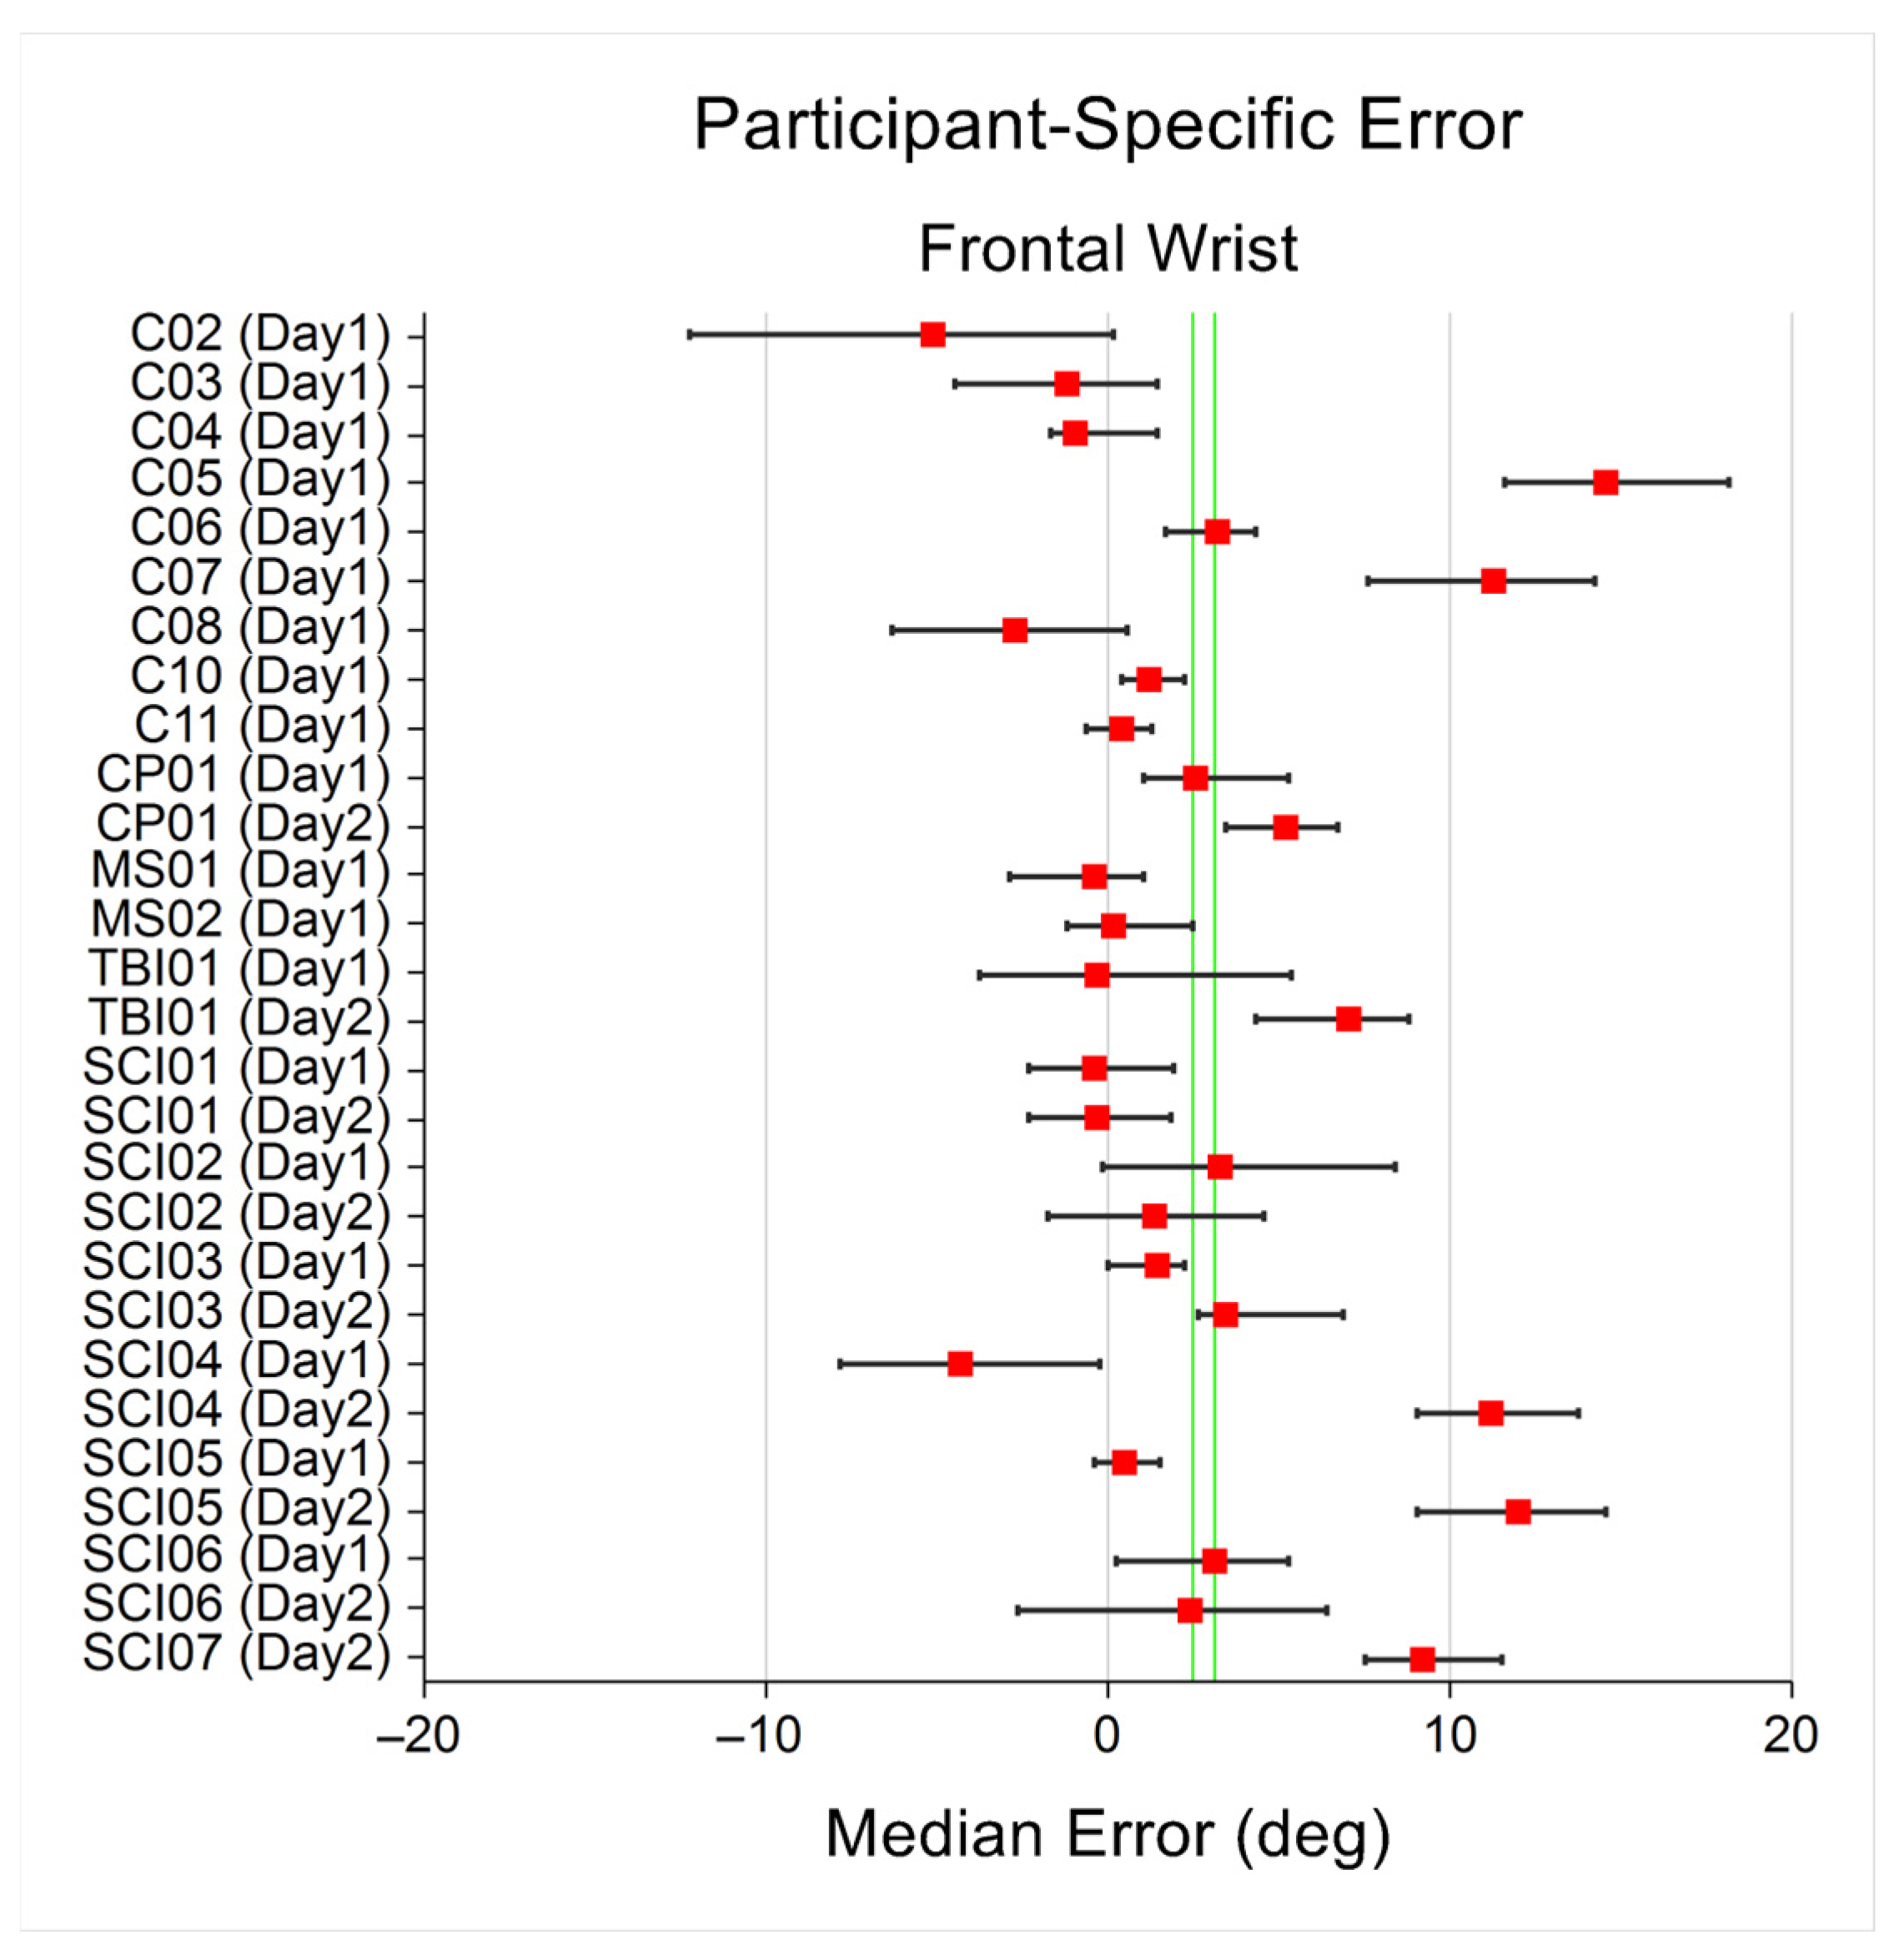
Frontal wrist joint angle profiles can be seen in Figure 16, with peak metrics in Figure 17. The minimum ulnar deviation was used instead of the peak radial deviation, as the modified position of the hand holding the VR controllers lead to almost no radial deviation. The frontal wrist had a median RMSE of 4.85° ± 4.57° with median participant-grouped biases of 4.19° ± 5.56° for ROM, 0.20° ± 7.66° (minimum ulnar deviation) and 4.45° ± 6.88° (maximum ulnar deviation) for peak joint angle, and −2.8°/s ± 790.3°/s (net wrist) for peak joint velocity. The median participant-level biases were 5.00° ± 4.41° for ROM, −4.07° ± 4.80° (minimum ulnar deviation) and −5.19° ± 4.13° (maximum ulnar deviation) for peak joint angle, and 27.8°/s ± 321.2°/s (net wrist) for peak joint velocity.

3.3. Tracker Error Characterizations

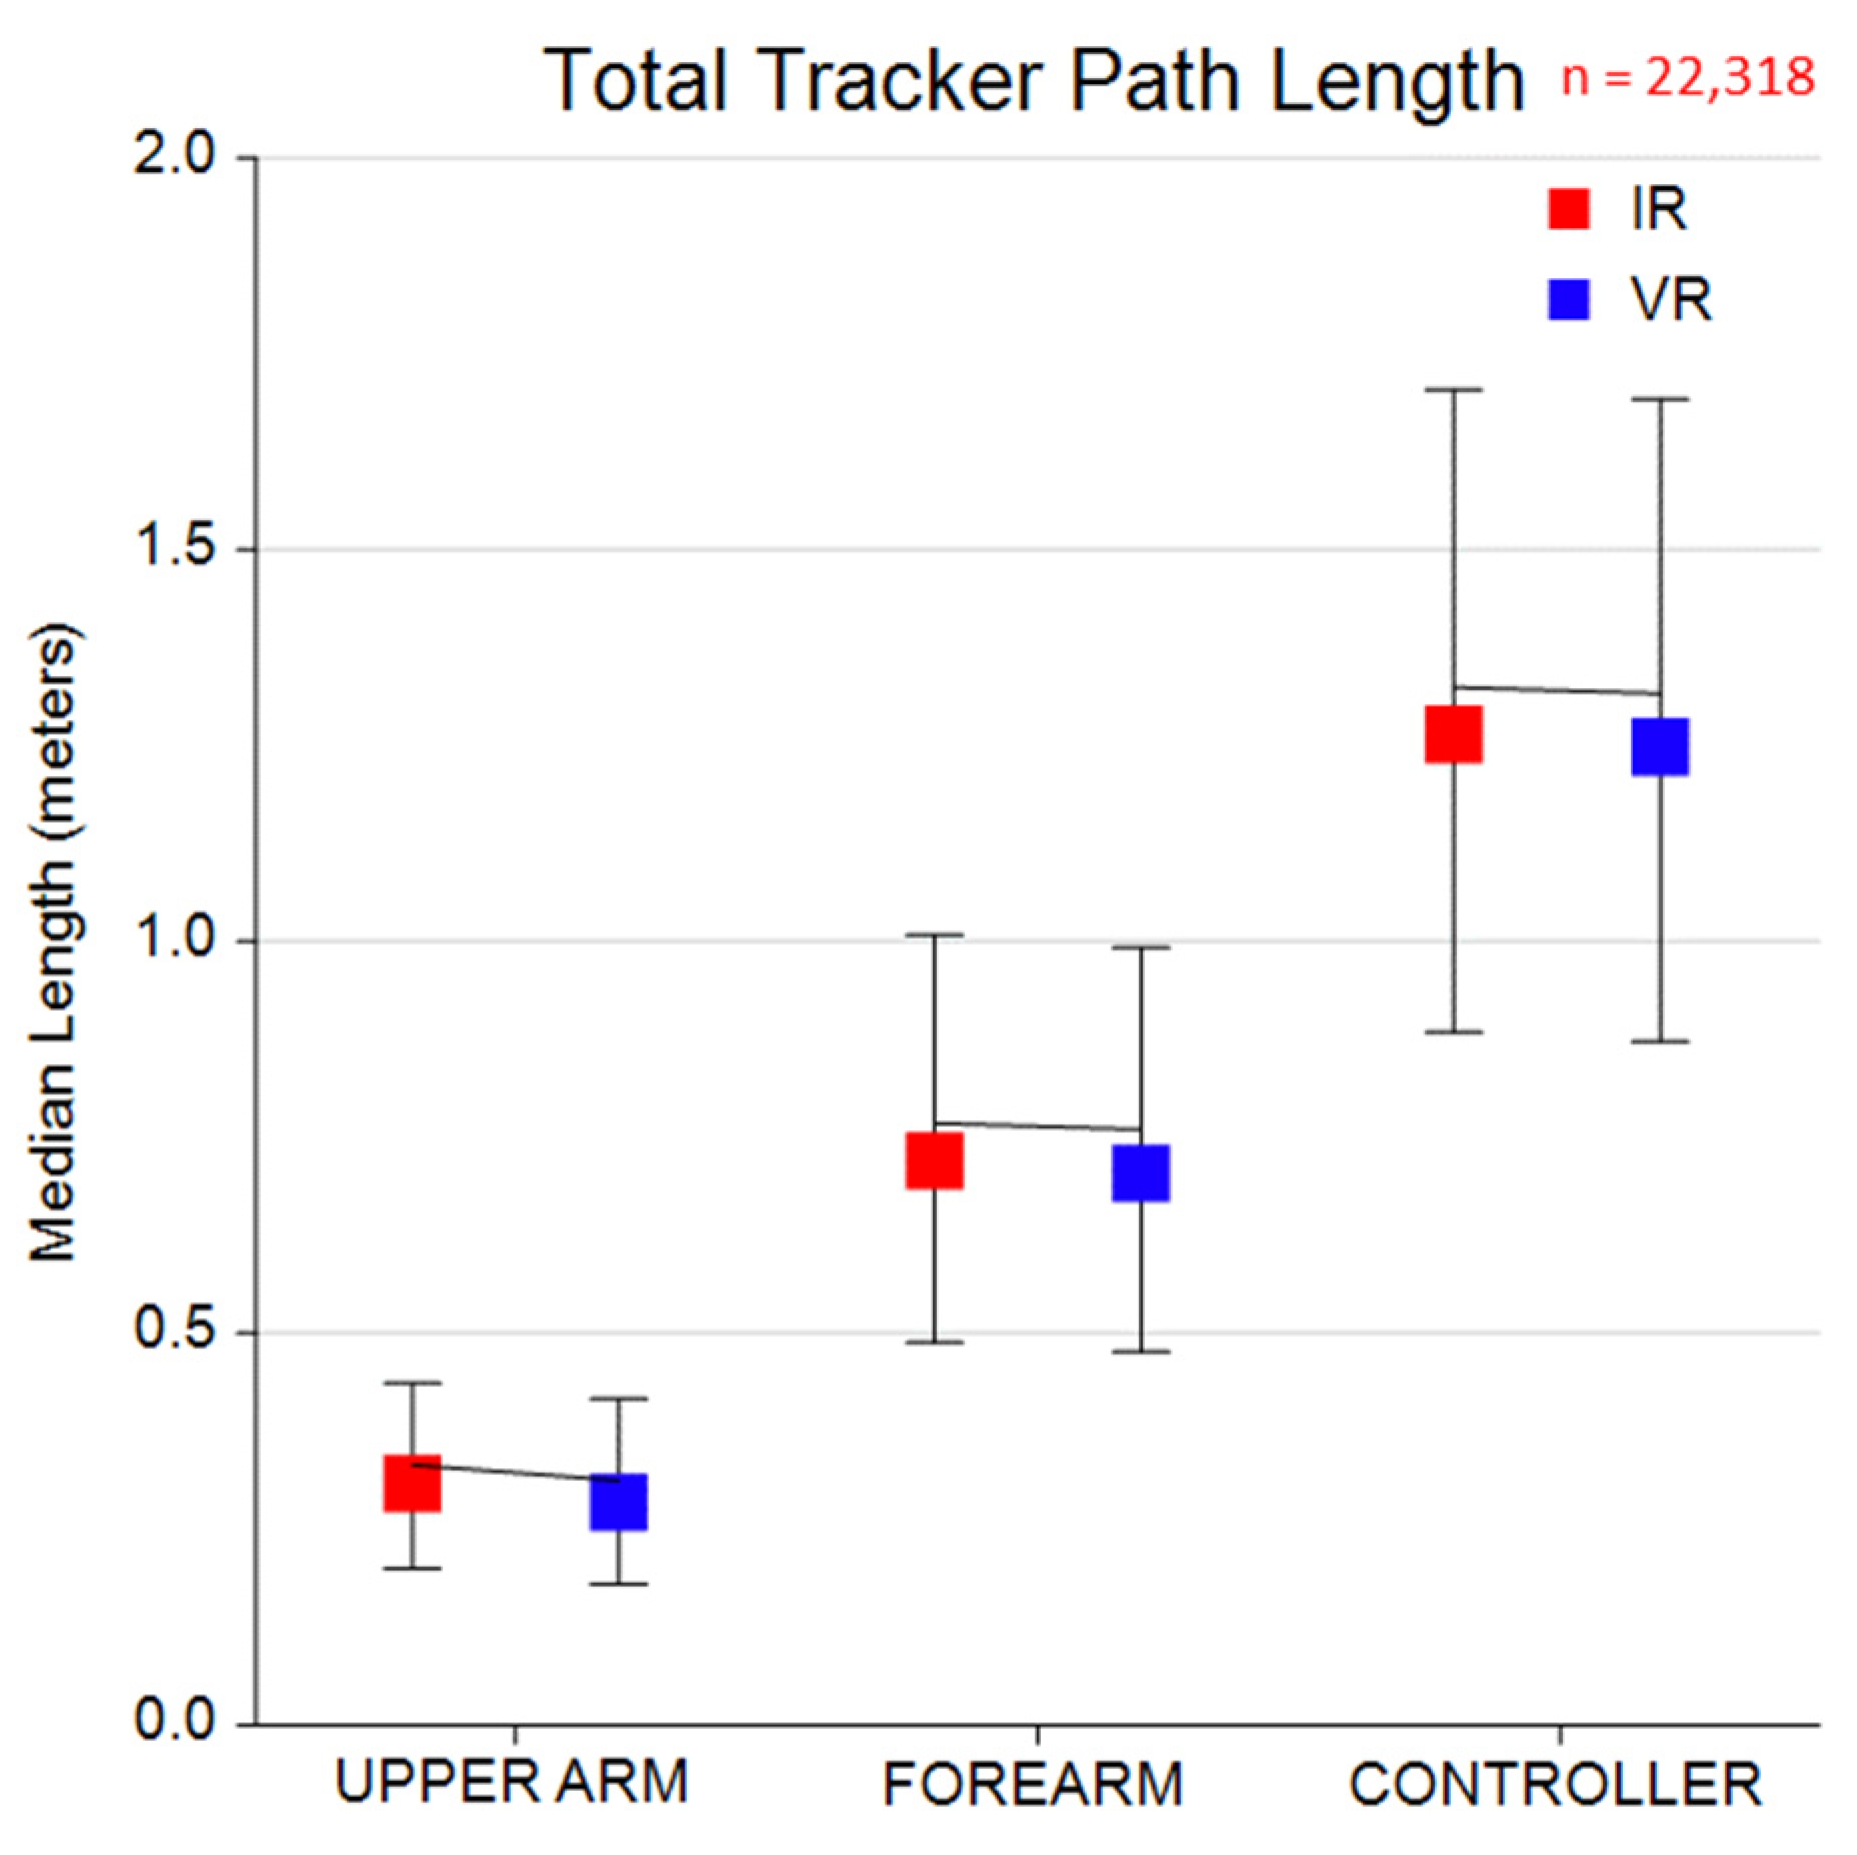
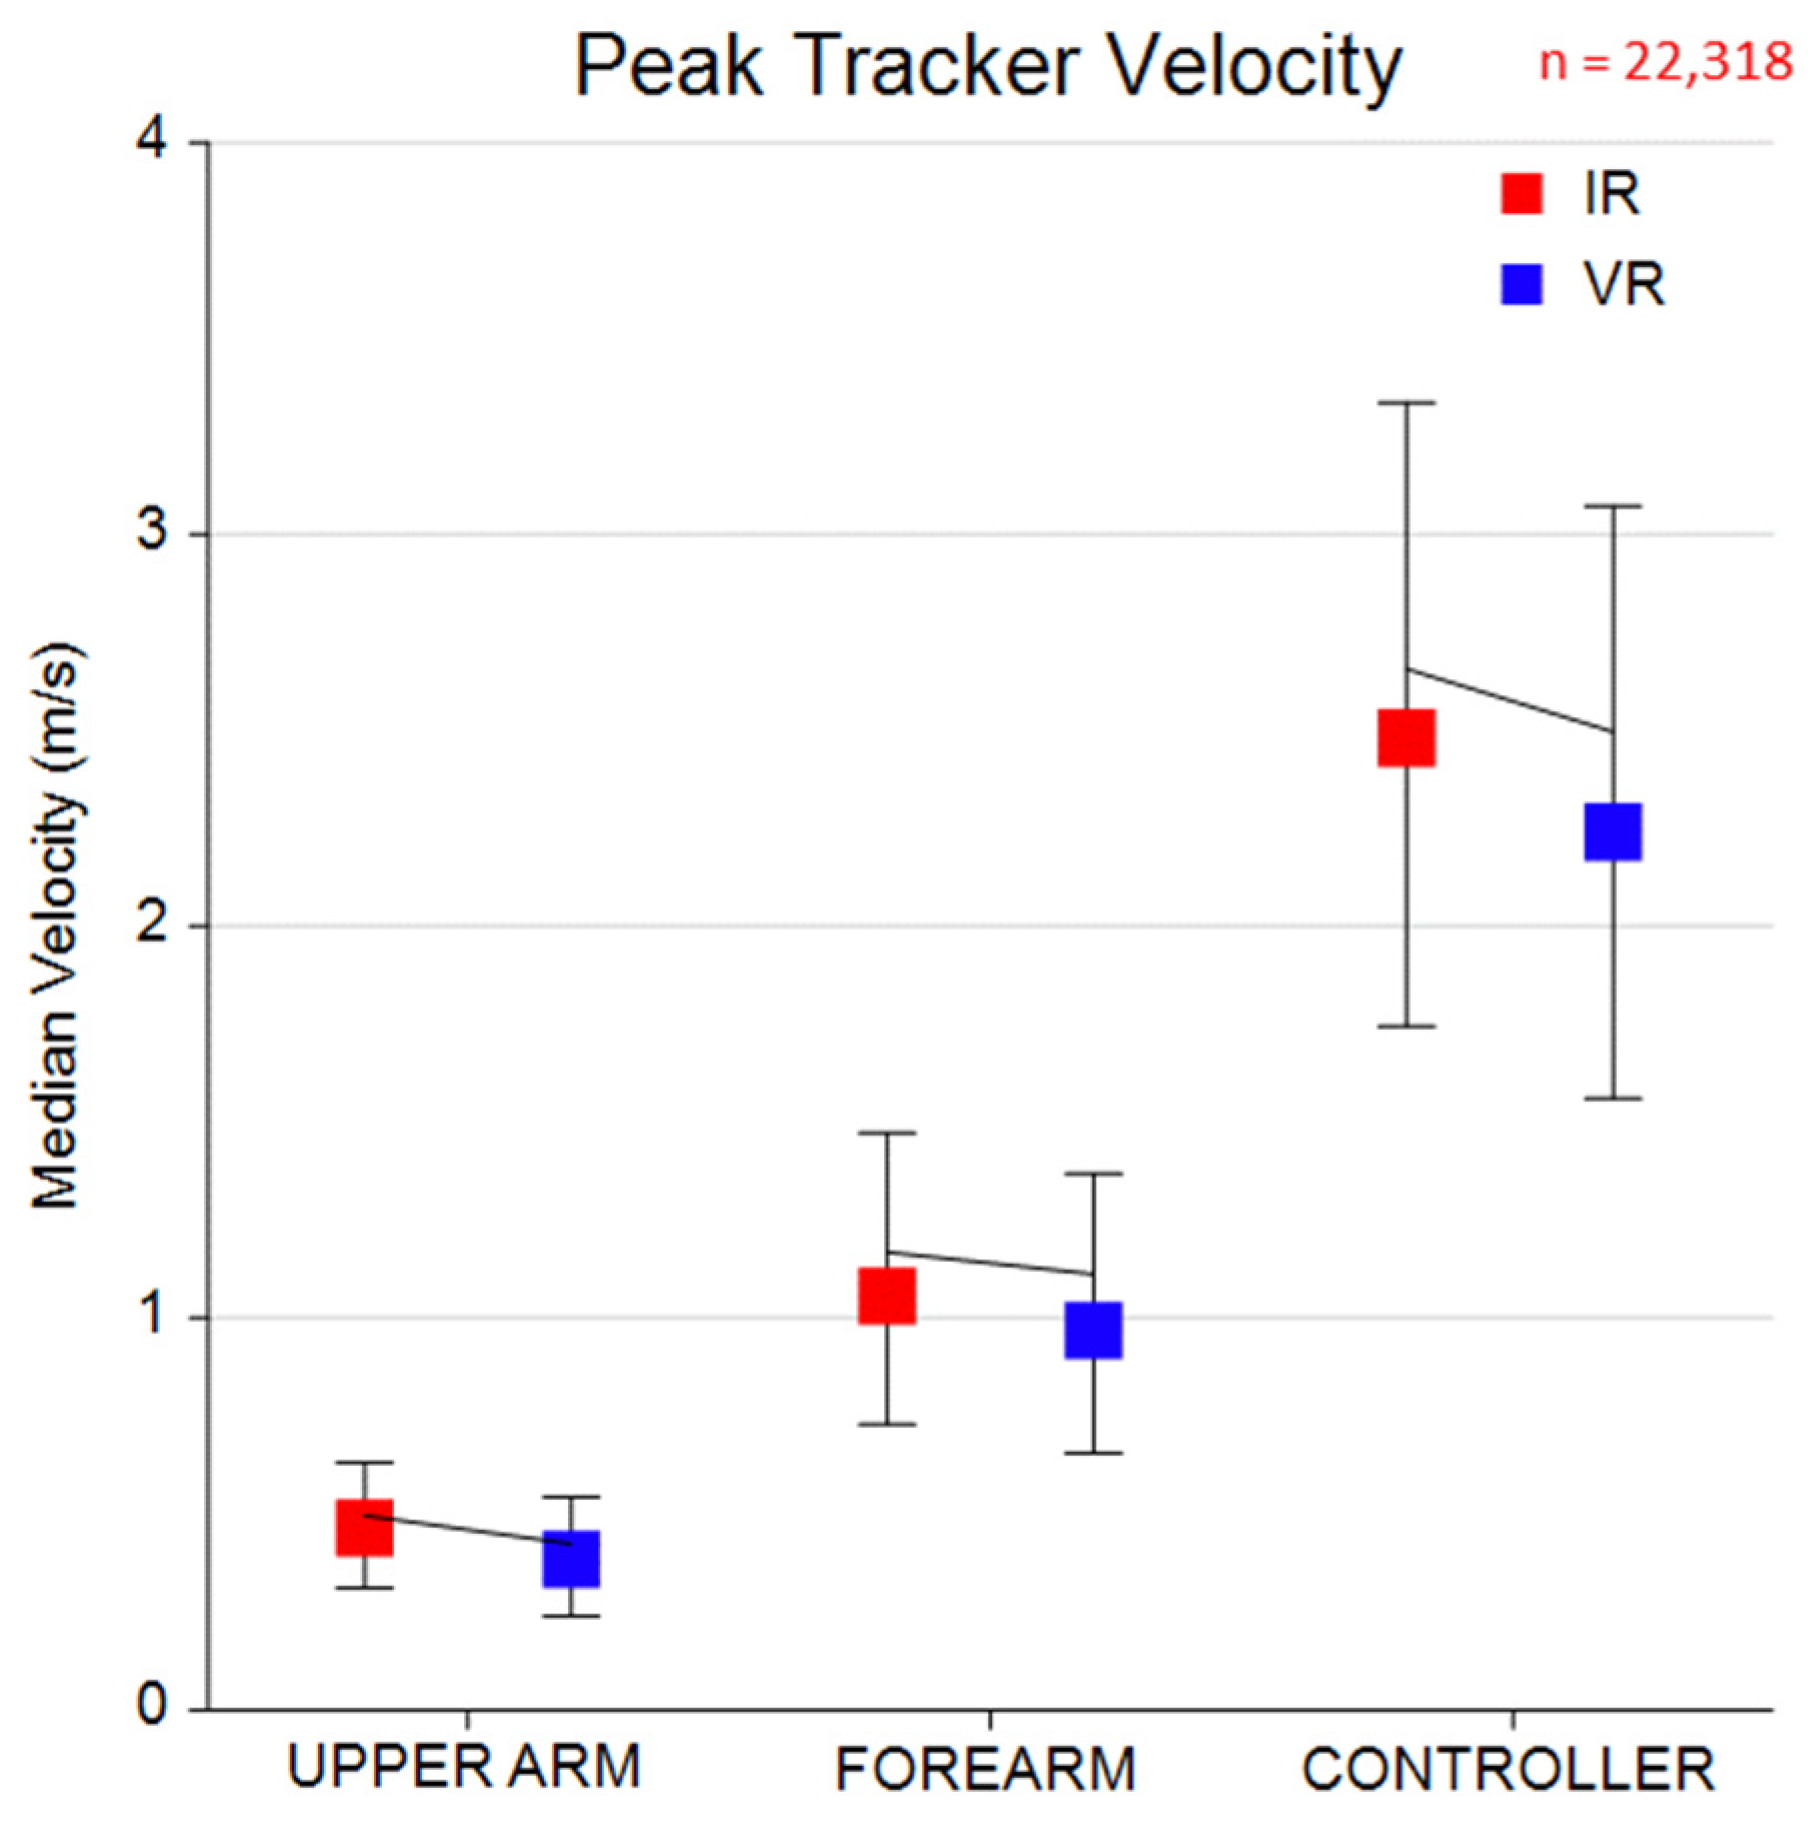
Tracker-specific metrics allow for immediate quantitative data without the use of a skeletal model. Error values were calculated for the combination of the right and left side for the upper arm, forearm, and controller. The median total tracker path length and peak tracker velocity across all task profiles and participants are plotted in Figure 18 and Figure 19. For each tracker, the median values were plotted across all task profiles and participants, separated by the IR (red square) and VR (blue square) motion capture systems. Distribution lines encompass the 25% and 75% percentiles and the connecting lines indicate the means. The controllers had the largest total path length and peak velocity (across each task profile) with decreasing path length and velocity as you move to more proximal trackers. A comparison of IR and VR measures of total tracker path length and peak velocity did not attain significance (all p > 0.25 and P < 0.2). For the total tracker path length, the median errors were −0.019 m ± 0.024 m for the upper arm, −0.012 m ± 0.036 m for the lower arm, and −0.010 m ± 0.213 m for the controller.
For the peak tracker velocity, the median errors were −0.069 m/s ± 0.096 m/s for the upper arm, −0.081 m/s ± 0.129 m/s for the lower arm, and −0.185 m/s ± 0.831 m/s for the controller. The median error values for both path length and peak velocity were negative. This indicates that the VR trackers underestimate these values; however, this is just a trend, as no significant differences were found. For all tracker locations, the percent error magnitude was significantly higher for the peak velocity metric compared with the total path length (all p < 0.0001).

4. Discussion

The first objective of this study was to validate and characterize the accuracy of VR motion capture compared with IR motion capture, assumed as the ground truth, for the upper extremity (UE). For peak joint angle, ROM, peak joint velocity, total tracker path length, and peak tracker velocity, no significance was found between IR and VR values. It can be seen that each participant and each collection day appear to have different median error values and variability of error with no apparent pattern. This indicates that other factors, such as the calibration quality and precise location of the trackers could play a role in the quality of tracking.
The second objective was to characterize any differences in error between people identified as healthy controls and people who had experienced a spinal cord injury (SCI). No statistical difference in error metrics was found between the control cohort and SCI cohort, supporting our hypothesis that tracker quality is not influenced by pathology. This provides evidence for the clinical translation of the VR motion capture system for people in therapy for post-SCI treatment. Preliminary data also suggests that the tracker accuracy will not be influenced by the use with other pathologies, such as multiple sclerosis, post-traumatic brain injury, and cerebral palsy. However, further testing would be needed to confirm this.

4.1. Kinematic Metric Error Characterizations

Multiple types of error were used to characterize each joint. This is because clinicians and other users may focus on different metrics depending on the goal. If the system is being used on a patient-specific level, then participant-level bias is more important than participant-grouped values. On the other hand, if the VR motion capture is being used in research settings where all participants will be grouped together, then participant-grouped values are more important. Lastly, RMSE and time series error values can be used to characterize the general error and compare it to other systems and studies.
Table 3 summarizes the error metric with the possible goal it would relate to. All values are expressed as the median value of all compiled task profile medians in degrees, or as a % of the median joint value. A full list of summarized error values with the mean, standard deviation, and median values and the percent of median can be found in Appendix A.
The mean and median error across each task profile was calculated using the matched VR–IR signals. The consistently smaller median compared with the mean suggests the presence of outliers, which are better accounted for by the median error. A median error below 3°, together with relatively wide variability, indicates that the VR signal is generally distributed around the IR signal. Thus, with sufficient data samples, the VR signal provides a reliable estimate of joint angle.
Error patterns differed across joints. Joint velocity was slightly underestimated by the VR system for the shoulder and elbow but was accurately captured for the wrist. Because the wrist exhibited the highest joint velocity, this suggests that movement speed was not a limiting factor for joint velocity accuracy. In contrast, joint angle was overestimated for the wrist but was accurately represented for the elbow and shoulder, implying that factors such as movement speed or tracker placement may influence joint angle accuracy. Overall, these findings indicate that when using VR trackers to assess joint kinematics, while not significantly different, shoulder and elbow velocities may be modestly underestimated, whereas wrist joint angles may be modestly overestimated on average.
The UE inherently has more challenges compared with the lower extremity due to the lack of standardized motions and the complexity of each joint. This was most apparent in the wrist. IR marker placement around the wrist followed Vicon Nexus recommendations of the lower 1/3 of the forearm [18], but the VR trackers are much larger allowing fewer placement options. The forearm tracker was placed as close to the wrist as possible to minimize skin movement artifacts during pronation and supination. Hand segment motion was defined using the controller tracker, which was secured to the hand with self-adhering tape. Even when taped, the controller was not fully rigid to the hand, introducing the potential for relative movement. Beat Saber movement tasks heavily involve wrist movement, which may not be the main priority depending on the therapeutic goal. In general, physical therapists have a focus on overall strength and gross movement compared with an occupational therapist who might be more focused on fine motor skills to improve activities of daily living. For applications requiring precise wrist tracking, we recommend selecting a different task or game and relocating the controller tracker directly onto the hand.

4.2. Tracker Metric Error Characterizations

Tracker total path length and velocity are metrics that can be calculated independently of the skeletal model and determined completely from the raw tracker data. The total path length can be estimated with a median error below 2 cm (percent error below 7% and 2% for the upper arm and forearm/controller, respectively). The peak tracker velocity can be estimated with a median error below 0.2 m/s (percent error below 15% and 8% for the upper arm and forearm/controller, respectively). The peak velocity has a significantly larger percent error compared with the total path length. This is to be expected since velocity is a derivative of position, meaning it will inherently have a greater error compared with the position it is based on.
Although motion can be fully described using joint angles, similar information can be found from the trackers. While the combination of shoulder elevation and horizontal shoulder adduction can provide the exact amount and direction of motion, the larger total path length reached by the upper arm tracker, the more the person had to raise their shoulder. The velocity of the tracker can also be directly related to the joint angle velocity. Similar personalized levels to the day 2 collections could be created using these two metrics from only the tracker data.
Overall, VR trackers used in combination with Brekel OpenVR enable the calculation of quantitative motion metrics across a wide range of movements. In addition to Brekel’s tracking capabilities, many VR games can export performance and movement data, allowing for integrated assessments of both gameplay performance and motion characteristics in specific applications, such as Beat Saber. Although IR motion capture remains the gold standard, and current VR motion capture relies on the IR skeletal model, the use of raw tracker data substantially expands the number of quantifiable metrics available.

4.3. Limitations and Future Work

The current joint angle and velocity error values are dependent on a skeletal model that is defined using the IR motion capture. This allowed us to compare the actual tracking capabilities of the VR motion capture system independent of the model building. This also means that the VR system is not yet an independent system. While the tracker metrics are not dependent on any other data, without the IR system the joint metrics will require a different method of prediction or skeletal model building. One future method could include using standardized poses and the ROM of each joint to use Visual3D Functional Joint Center functions to build a skeletal model. This option would require a continued Visual3D license and the expertise to run it. Another future method could include using machine learning algorithms to predict joint angles from the raw tracker data. For example, the data found from this study provides over 22,000 tasks and full time series data, which is helpful in the training of such algorithms. This alternative method would instead likely use open-source programs, along with Brekel Open VR, which is a one-time purchase.
Aside from modeling techniques, external influences were not evaluated in this study. It is important to consider all factors when setting up your space. Similarly to the room setup of the IR motion capture system, VR motion capture setup is found to influence the data. The setup could include aspects of exact tracker placement, base station quantity and placement, the position of motions within the play space, and the lighting of the room. A prior study evaluated Vive Trackers (generation 2.0) and a two-base station setup in a variety of static conditions. The main finding was that a more central location within the play space resulted in the highest tracking quality. They also found that having two trackers in the space did not significantly affect the overall quality [4]. Although our setup uses more updated trackers and base stations, an increase in base stations, and the use of seven trackers, these conditions have been found to influence tracking quality and therefore need to be considered in designs. A different study compared errors at different lighting levels using the Vive Tracker Ultimate and zero base stations, as this generation of tracker uses inside-out tracking technology. They found that lighting does affect tracking quality, mainly finding that rooms require sufficient lighting [5]. Each study, including ours, uses a variety of VR tracker and base station generations. VR is a fast-growing field, making it nearly impossible to always use the latest technology. This suggests that equipment is continually being improved on, implying that tracking capabilities could increase in quality as well.
This study did not follow a pre-registered protocol as this represents the first iteration of a new research approach. To our knowledge, no existing protocol exists for the methodology presented here. This approach leaves a framework for future work that will refine and further validate the protocol, leaving room for formalizing and registering the protocol.
The growing integration of VR in therapy and research highlights new possibilities for remote and data-driven rehabilitation. Within the context of VR games, including Beat Saber as a therapeutic platform, online databases, such as ScoreSaber and BeatLeader, enable the export of detailed controller motion data, allowing for the comprehensive quantitative analysis of user performance [19]. Error characterization for the Valve Index has already been completed and can give a close approximation of the error from these game-specific derived data. The database controller data has a comparable tracking accuracy to the controllers collected by Brekel, differing primarily in sampling rate. These databases generally operate at a variable, lower frequency compared with Brekel’s fixed 240 Hz, requiring resampling for certain analyses. This compatibility suggests the feasibility of home-based VR therapeutic game interventions supported by performance tracking. Beyond VR games, Brekel’s ability to record tracker data independent of headset and controller use enables the capture of unrestricted movement patterns, further expanding the potential applications of VR motion tracking in therapeutic and research settings.

5. Conclusions

VR-based tracking technology represents a reasonable method for rehabilitation clinics and smaller research groups to collect quantitative kinematic or general movement data, with or without the associated headsets. When appropriate, the use of VR headsets for visual input can also present systematic and cyclic movement tasks for assessment purposes. However, approaches to automate skeletal model creation or the direct prediction of kinematic signals remain as aspect for future work. Importantly, the error metrics characterized in this study represent the behaviors of individuals likely to be included in and benefit from upper extremity rehabilitation, particularly post SCI. Ideally, the adoption of VR-based movement tracking and quantitative data collection at the clinical level can further support the personalization of therapeutic interventions.

Supplementary Materials

General codes used to combine datasets can be found at https://github.com/millers53/Virtual-Reality-Motion-Capture-Processing-with-IR-Motion-Capture (accessed on 25 September 2025).

Author Contributions

Conceptualization, S.A.B., T.B. and M.E.R.; methodology and data collection, S.A.B., T.B., T.M.H., A.S., T.R., A.L.K. and M.E.R.; software, S.A.B., T.B. and M.E.R.; formal analysis, S.A.B., T.B., T.M.H. and M.E.R.; writing—original draft preparation, S.A.B. and T.B.; writing—review and editing, T.R., A.L.K. and M.E.R.; visualization, S.A.B., T.B. and T.M.H.; supervision, T.R., A.L.K. and M.E.R.; funding acquisition, T.R., A.L.K., M.E.R. and S.A.B. All authors have read and agreed to the published version of the manuscript.

Funding

We acknowledge the funding support that was granted by the Chancellor of the Ohio Department of Higher Education from the Research Incentive Third Frontier Fund. This material is based upon work supported by the National Science Foundation Graduate Research Fellowship under Grant No. 2539748.

Institutional Review Board Statement

The study was approved by the Institutional Review Board of University of Dayton (Approval IDs 21144520-Healthy Control Cohort, 22087931-MS, CP, and TBI, and 19928150-SCI) and Dayton Children’s Hospital (Approval IRB00002278). The IRB is governed by the Department of Health and Human Services (DHHS) federal guidelines for the protection of human subjects in research, found in 45 CFR 46.

Informed Consent Statement

Informed consent and assent (for minors) was obtained from all participants involved in the study.

Data Availability Statement

The raw data supporting the conclusions of this article will be made available by the authors on request.

Conflicts of Interest

The authors declare no conflicts of interest.

Abbreviations

The following abbreviations are used in this manuscript:
VRVirtual Reality
IRInfrared
UEUpper Extremity
SCISpinal Cord Injury
CPCerebral Palsy
MSMultiple Sclerosis
TBIPost-Traumatic Brain Injury
ROMRange of Motion
RMSERoot Mean Squared Error

Appendix A

Table A1. Full error characterization separated by joint and tracker. All data is summarized by the mean, median, and median with associated signed percent error (percent of median value). A positive sign indicates the VR motion capture system overestimated compared with the IR motion capture system.
Mean (% of Median Value)SD (% of Median Value)Median (% of Median Value)
Shoulder ElevationRMSE4.45 (14.51%)2.95 (15.44%)3.79 (13.98%)
Median Error1.76 (5.76%)4.45 (23.29%)1.54 (5.67%)
Median Absolute Error3.92 (12.79%)2.93 (15.30%)3.20 (11.81%)
Mean Error1.90 (6.21%)4.37 (22.85%)1.72 (6.35%)
Absolute Mean Error3.68 (12.00%)3.03 (15.84%)2.92 (10.79%)
Mean Absolute Error4.07 (13.28%)2.85 (14.89%)3.37 (12.44%)
ROM Error1.23 (4.03%)5.24 (27.43%)0.47 (1.74%)
Mean Absolute Participant-Level Bias2.32 (7.56%)3.56 (18.60%)2.25 (8.31%)
Mean Absolute Participant-Level Bias of ROM2.12 (6.91%)4.35 (22.74%)1.70 (6.28%)
Mean Absolute Participant-Level Bias at Peak Joint Angles3.05 (4.47%)4.65 (23.75%)2.81 (4.16%)
Error at Peak Joint Angles2.63 (3.86%)5.44 (27.80%)2.18 (3.22%)
Error at Peak Joint Velocities4.5 (5.52%)31.0 (53.99%)4.7 (6.77%)
Mean Absolute Participant-Level Bias at Peak Joint Velocities7.4 (9.04%)25.3 (44.10%)6.5 (9.48%)
Horizontal Shoulder AdductionRMSE7.23 (20.29%)4.64 (19.02%)6.20 (20.86%)
Median Error−0.83 (−2.34%)7.19 (29.46%)−0.40 (−1.35%)
Median Absolute Error6.18 (17.35%)4.32 (17.70%)5.20 (17.49%)
Mean Error−0.78 (−2.19%)7.13 (29.18%)−0.36 (−1.21%)
Absolute Mean Error5.63 (15.80%)4.44 (18.17%)4.65 (15.65%)
Mean Absolute Error6.48 (18.18%)4.27 (17.49%)5.51 (18.53%)
ROM Error1.96 (5.50%)10.32 (42.27%)0.53 (1.80%)
Mean Absolute Participant-Level Bias3.27 (9.18%)5.60 (22.95%)3.24 (10.89%)
Mean Absolute Participant-Level Bias of ROM3.83 (10.75%)8.31 (34.05%)3.31 (11.15%)
Mean Absolute Participant-Level Bias at Peak Angles2.62 (5.33%)6.53 (29.78%)2.69 (5.41%)
Error at Peak Joint Angles−0.03 (−0.06%)7.58 (34.59%)0.04 (0.07%)
Error at Peak Joint Velocities4.8 (3.58%)515.9 (182.16%)11.9 (11.02%)
Mean Absolute Participant-Level Bias at Peak Joint Velocities23.0 (17.20%)248.7 (87.80%)17.5 (16.20%)
ElbowRMSE6.10 (14.29%)3.68 (16.41%)5.33 (12.94%)
Median Error0.49 (1.14%)6.09 (27.16%)0.14 (0.34%)
Median Absolute Error5.13 (12.03%)3.62 (16.13%)4.22 (10.25%)
Mean Error0.22 (0.52%)6.10 (27.21%)−0.25 (−0.61%)
Absolute Mean Error4.77 (11.18%)3.81 (16.98%)3.95 (9.60%)
Mean Absolute Error5.45 (12.77%)3.51 (15.64%)4.62 (11.22%)
ROM Error2.52 (5.89%)7.09 (31.61%)1.95 (4.74%)
Mean Absolute Participant-Level Bias2.92 (6.85%)4.38 (19.55%)2.81 (6.82%)
Mean Absolute Participant-Level Bias of ROM2.60 (6.10%)6.48 (28.88%)2.21 (5.36%)
Mean Absolute Participant-Level Bias at Peak Joint Angles3.28 (8.74%)6.44 (35.81%)3.06 (8.62%)
Error at Peak Joint Angles−1.30 (−3.46%)7.98 (44.36%)−1.65 (−4.66%)
Error at Peak Joint Velocities19.6 (9.23%)149.1 (112.82%)20.4 (10.94%)
Mean Absolute Participant-Level Bias at Peak Joint Velocities19.6 (9.23%)149.1 (112.82%)20.4 (10.94%)
Sagittal WristRMSE6.04 (15.89%)4.94 (24.72%)4.88 (13.95%)
Median Error−0.52 (−1.37%)7.04 (35.22%)0.33 (0.95%)
Median Absolute Error5.27 (13.87%)4.86 (24.32%)4.03 (11.50%)
Mean Error−0.60 (−1.57%)6.98 (34.89%)0.26 (0.76%)
Absolute Mean Error4.89 (12.87%)5.01 (25.06%)3.66 (10.45%)
Mean Absolute Error5.54 (14.58%)4.92 (24.59%)4.31 (12.30%)
ROM Error4.98 (13.10%)7.61 (38.06%)3.98 (11.37%)
Mean Absolute Participant-Level Bias3.15 (8.29%)4.76 (23.78%)3.01 (8.61%)
Mean Absolute Participant-Level Bias of ROM5.11 (13.43%)6.00 (29.97%)4.90 (14.00%)
Mean Absolute Participant-Level Bias at Peak Joint Angles (Flexion)−4.42 (−19.77%)6.24 (30.89%)−4.16 (−17.92%)
Mean Absolute Participant-Level Bias at Peak Joint Angles (Extension)3.42 (21.79%)5.39 (27.19%)3.19 (21.24%)
Error at Peak Joint Angles (Flexion)−3.35 (−15.01%)8.91 (44.13%)−2.16 (−9.30%)
Error at Peak Joint Angles (Extension)1.63 (10.37%)7.08 (35.73%)2.26 (15.04%)
Error at Peak Joint Velocities−22.7 (−5.83%)790.3 (133.04%)−2.8 (−0.83%)
Mean Absolute Participant-Level Bias at Peak Joint Velocities55.2 (14.16%)321.2 (54.08%)27.8 (8.37%)
Frontal WristRMSE6.21 (34.40%)4.57 (41.63%)4.85 (30.80%)
Median Error3.12 (17.30%)6.57 (59.83%)2.46 (15.63%)
Median Absolute Error5.67 (31.40%)4.67 (42.53%)4.13 (26.24%)
Mean Error3.00 (16.59%)6.52 (59.35%)2.33 (14.81%)
Absolute Mean Error5.39 (29.84%)4.74 (43.14%)3.92 (24.88%)
Mean Absolute Error5.88 (32.55%)4.68 (42.57%)4.38 (27.83%)
ROM Error5.15 (28.52%)5.56 (50.60%)4.19 (26.60%)
Mean Absolute Participant-Level Bias−3.89 (−21.57%)3.64 (33.13%)−3.91 (−24.83%)
Mean Absolute Participant-Level Bias of ROM−5.23 (−28.95%)4.41 (40.15%)−5.00 (−31.77%)
Mean Absolute Participant-Level Bias at Peak Joint Angles (Minimum Ulnar Deviation)−4.22 (−24.90%)4.80 (34.47%)−4.07 (−22.20%)
Mean Absolute Participant-Level Bias at Peak Joint Angles (Maximum Ulnar Deviation)−5.33 (−15.22%)4.13 (36.66%)−5.19 (−14.84%)
Error at Peak Joint Angles (Minimum Ulnar Deviation)0.32 (1.89%)7.66 (54.97%)0.20 (1.07%)
Error at Peak Joint Angles (Maximum Ulnar Deviation)5.47 (15.62%)6.88 (61.01%)4.45 (12.73%)
Error at Peak Joint Velocities−22.7 (−5.83%)790.3 (133.04%)−2.8 (−0.83%)
Mean Absolute Participant-Level Bias at Peak Joint Velocities55.2 (14.16%)321.2 (54.08%)27.8 (8.37%)
Upper ArmPath Length−0.020 (−6.10%)0.024 (14.32%)−0.019 (−6.05%)
Velocity Error at Peak−0.084 (−16.82%)0.096 (38.56%)−0.069 (−14.89%)
ForearmTracker Path Length Error−0.014 (−1.85%)0.036 (9.42%)−0.012 (−1.69%)
Tracker Velocity Error at Peak−0.104 (−8.84%)0.129 (20.21%)−0.081 (−7.64%)
ControllerTracker Path Length Error−0.007 (−0.50%)0.123 (20.74%)−0.010 (−0.80%)
Tracker Velocity Error at Peak−0.161 (−6.04%)0.831 (63.75%)−0.185 (−7.43%)

Appendix B

Appendix B contains participant-specific median error plots for all joints. Figure A1, Figure A2, Figure A3, Figure A4 and Figure A5 follow the same format. The y-axis includes the participant code which identifies the cohort with the corresponding collection day. The red square indicates the median error (in degrees) with error bars including 25–75% percentiles. The green lines indicate the overall median and mean of all median errors, with specific values in the figure caption.
Figure A1. Participant and collection day-specific error for the shoulder elevation median error. A positive value indicates the VR motion capture system is overestimating compared with the IR motion capture system. Green lines indicate the median and mean of all median errors (median: 1.54° and mean: 1.76°).
Applsci 15 12081 g0a1
Figure A2. Participant and collection day-specific error for the horizontal shoulder adduction median error. A positive value indicates the VR motion capture system is overestimating compared with the IR motion capture system. Green lines indicate the median and mean of all median errors (median: −0.40° and mean: −0.83°).
Applsci 15 12081 g0a2
Figure A3. Participant and collection day-specific error for the elbow median error. A positive value indicates the VR motion capture system is overestimating compared with the IR motion capture system. Green lines indicate the median and mean of all median errors (median: 0.14° and mean: 0.49°).
Applsci 15 12081 g0a3
Figure A4. Participant and collection day-specific error for the sagittal wrist median error. A positive value indicates the VR motion capture system is overestimating compared with the IR motion capture system. Green lines indicate the median and mean of all median errors (median: 0.33° and mean: −0.52°).
Applsci 15 12081 g0a4
Figure A5. Participant and collection day-specific error for the frontal wrist median error. A positive value indicates the VR motion capture system is overestimating compared with the IR motion capture system. Green lines indicate the median and mean of all median errors (median: 2.46° and mean: 3.12°).
Applsci 15 12081 g0a5

References

  1. Merker, S.; Pastel, S.; Bürger, D.; Schwadtke, A.; Witte, K. Measurement Accuracy of the HTC VIVE Tracker 3.0 Compared to Vicon System for Generating Valid Positional Feedback in Virtual Reality. Sensors 2023, 23, 7371. [Google Scholar] [CrossRef] [PubMed]
  2. Joyner, J.; Kontson, K. Movement Tracking Accuracy of HTC Vive VR System during Upper Body Discrete Motion Tasks. In Proceedings of the Annual International Conference of the IEEE Engineering in Medicine and Biology Society (EMBS), Orlando, FL, USA, 15–19 July 2024. [Google Scholar] [CrossRef]
  3. Mancuso, M.; Charbonnier, C. Technical Evaluation of the Fidelity of the HTC Vive for Upper Limb Tracking. ISBS Proc. Arch. 2024, 42, 624. [Google Scholar]
  4. Sansone, L.G.; Stanzani, R.; Job, M.; Battista, S.; Signori, A.; Testa, M. Robustness and Static-Positional Accuracy of the SteamVR 1.0 Virtual Reality Tracking System. Virtual Real. 2022, 26, 903–924. [Google Scholar] [CrossRef]
  5. Kulozik, J.; Jarrassé, N. Evaluating the Precision of the HTC VIVE Ultimate Tracker with Robotic and Human Movements under Varied Environmental Conditions. arXiv 2024, arXiv:2409.01947. [Google Scholar] [CrossRef]
  6. Williams, A.M.; Ma, J.K.; Martin Ginis, K.A.; West, C.R. Effects of a Tailored Physical Activity Intervention on Cardiovascular Structure and Function in Individuals with Spinal Cord Injury. Neurorehabilit. Neural Repair 2021, 35, 692–703. [Google Scholar] [CrossRef] [PubMed]
  7. Shen, C.; Yu, S.; Wang, J.; Huang, G.Q.; Wang, L. A Comprehensive Survey on Deep Gait Recognition: Algorithms, Datasets and Challenges. IEEE Trans. Biom. Behav. Identity Sci. 2022, 7, 270–292. [Google Scholar] [CrossRef]
  8. Hansen, R.M.; Arena, S.L.; Queen, R.M. Validation of Upper Extremity Kinematics Using Markerless Motion Capture. Biomed. Eng. Adv. 2024, 7, 100128. [Google Scholar] [CrossRef]
  9. van Amstel, R.N.; Dijk, I.E.; Noten, K.; Weide, G.; Jaspers, R.T.; Pool-Goudzwaard, A.L. Wireless Inertial Measurement Unit-Based Methods for Measuring Lumbopelvic-Hip Range of Motion Are Valid Compared with Optical Motion Capture as Golden Standard. Gait Posture 2025, 120, 72–80. [Google Scholar] [CrossRef] [PubMed]
  10. Spitzley, K.A.; Karduna, A.R. Feasibility of Using a Fully Immersive Virtual Reality System for Kinematic Data Collection. J. Biomech. 2019, 87, 172–176. [Google Scholar] [CrossRef] [PubMed]
  11. Bauer, P.; Lienhart, W.; Jost, S. Accuracy Investigation of the Pose Determination of a VR System. Sensors 2021, 21, 1622. [Google Scholar] [CrossRef] [PubMed]
  12. Kuhlmann de Canaviri, L.; Meiszl, K.; Hussein, V.; Abbassi, P.; Mirraziroudsari, S.D.; Hake, L.; Potthast, T.; Ratert, F.; Schulten, T.; Silberbach, M.; et al. Static and Dynamic Accuracy and Occlusion Robustness of SteamVR Tracking 2.0 in Multi-Base Station Setups. Sensors 2023, 23, 725. [Google Scholar] [CrossRef] [PubMed]
  13. Vox, J.P.; Weber, A.; Wolf, K.I.; Izdebski, K.; Schüler, T.; König, P.; Wallhoff, F.; Friemert, D. An Evaluation of Motion Trackers with Virtual Reality Sensor Technology in Comparison to a Marker-Based Motion Capture System Based on Joint Angles for Ergonomic Risk Assessment. Sensors 2021, 21, 3145. [Google Scholar] [CrossRef]
  14. van der Veen, S.M.; Thomas, J.S. A Pilot Study Quantifying Center of Mass Trajectory during Dynamic Balance Tasks Using an HTC Vive Tracker Fixed to the Pelvis. Sensors 2021, 21, 8034. [Google Scholar] [CrossRef] [PubMed]
  15. Amadi, H.O.; Bull, A.M.J. A Motion-Decomposition Approach to Address Gimbal Lock in the 3-Cylinder Open Chain Mechanism Description of a Joint Coordinate System at the Glenohumeral Joint. J. Biomech. 2010, 43, 3232–3236. [Google Scholar] [CrossRef] [PubMed]
  16. Walmsley, C.P.; Williams, S.A.; Grisbrook, T.; Elliott, C.; Imms, C.; Campbell, A. Measurement of Upper Limb Range of Motion Using Wearable Sensors: A Systematic Review. Sports Med. Open 2018, 4, 53. [Google Scholar] [CrossRef]
  17. Adans-Dester, C.; Hankov, N.; O’Brien, A.; Vergara-Diaz, G.; Black-Schaffer, R.; Zafonte, R.; Dy, J.; Lee, S.I.; Bonato, P. Enabling Precision Rehabilitation Interventions Using Wearable Sensors and Machine Learning to Track Motor Recovery. NPJ Digit. Med. 2020, 3, 121. [Google Scholar] [CrossRef] [PubMed]
  18. Vicon Upper Body Modeling with Plug-in Gait. Available online: https://help.vicon.com/space/Nexus216/11602259/Upper+body+modeling+with+Plug-in+Gait (accessed on 20 September 2025).
  19. Nair, V.; Guo, W.; Wang, R.; O’Brien, J.F.; Rosenberg, L.; Song, D. Berkeley Open Extended Reality Recordings 2023 (BOXRR-23): 4.7 Million Motion Capture Recordings from 105,000 XR Users. IEEE Trans. Vis. Comput. Graph. 2024, 30, 2239–2246. [Google Scholar] [CrossRef]
Figure 1. Full camera setup including 4 valve base stations (green squares) in the corners and 10 Vicon Vero cameras (blue circles, 8 mounted to ceiling and 2 in front on tripods).
Applsci 15 12081 g001
Figure 2. Custom origin frame used to set the origin for the IR and VR motion capture systems.
Applsci 15 12081 g002
Figure 3. IR motion capture marker and VR motion capture tracker setup. IR motion capture markers are labeled in orange circles when they are placed on the skin, and blue squares when they are attached to a tracker or the headset. VR trackers are shown in black.
Applsci 15 12081 g003
Figure 4. Tracker with translated virtual markers. An addition virtual marker is present at the origin of the tracker.
Applsci 15 12081 g004
Figure 5. IR and VR models overlaid. The large red and blue spheres are the markers used to spatially sync the two systems, where the red spheres are the IR markers and the blue spheres are the VR virtual markers. Two skeletal models are present for each segment, one for each motion capture system.
Applsci 15 12081 g005
Figure 6. Visual definitions for shoulder elevation and horizontal shoulder adduction.
Applsci 15 12081 g006
Figure 7. Box plot of median error for shoulder elevation across each participant and collection day. A positive value indicates the VR motion capture system overestimated compared with the IR motion capture system. Participant code relates to diagnoses: C: control, CP: cerebral palsy, MS: multiple sclerosis, TBI: post-traumatic brain injury, and SCI: spinal cord injury.
Applsci 15 12081 g007
Figure 8. Shoulder elevation angle profile (left column) and associated error (VR–−IR) (right column) normalized across all task profiles and participants separated by cut direction. The bold lines indicate the mean profile and the shading indicates the standard deviation. For the left column the VR motion capture system is green and IR motion capture system is black, with purple shading representing the overlapping standard deviation.
Applsci 15 12081 g008
Figure 9. Shoulder elevation data distribution plot for peak joint angle, range of motion, and peak joint velocity separated by VR (blue, right) and IR (red, left) motion capture systems. The box indicates the median value with 25% and 75% distribution bars. n reflects the total number of tasks over the 20 participants and 28 overall collections.
Applsci 15 12081 g009
Figure 10. Horizontal shoulder adduction angle profile (left column) and associated error (VR–−IR) (right column) normalized across all task profiles and participants separated by cut direction. The bold lines indicate the mean profile and the shading indicates the standard deviation. For the left column the VR motion capture system is green and IR motion capture system is black, with purple shading representing the overlapping standard deviation.
Applsci 15 12081 g010
Figure 11. Horizontal shoulder adduction data distribution plot for peak joint angle, range of motion, and peak joint velocity separated by VR (blue, right) and IR (red, left) motion capture systems. The box indicates the median value with 25% and 75% distribution bars. n reflects the total number of tasks over the 20 participants and 28 overall collections.
Applsci 15 12081 g011
Figure 12. Elbow flexion/extension angle profile (left column) and associated error (VR–−IR) (right column) normalized across all task profiles and participants separated by cut direction. The bold lines indicate the mean profile and the shading indicates the standard deviation. For the left column the VR motion capture system is green and IR motion capture system is black, with purple shading representing the overlapping standard deviation.
Applsci 15 12081 g012
Figure 13. Elbow data distribution plot for peak joint angle, range of motion, and peak joint velocity separated by VR (blue, right) and IR (red, left) motion capture systems. The box indicates the median value with 25% and 75% distribution bars. n reflects the total number of tasks over the 20 participants and 28 overall collections.
Applsci 15 12081 g013
Figure 14. Sagittal wrist angle profile (left column) and associated error (VR–−IR) (right column) normalized across all task profiles and participants separated by cut direction. The bold lines indicate the mean profile and the shading indicates the standard deviation. For the left column the VR motion capture system is green and IR motion capture system is black, with purple shading representing the overlapping standard deviation.
Applsci 15 12081 g014
Figure 15. Sagittal wrist data distribution plot for peak joint angle, range of motion, and peak joint velocity separated by VR (blue, right) and IR (red, left) motion capture systems. The box indicates the median value with 25% and 75% distribution bars. n reflects the total number of tasks over the 20 participants and 28 overall collections.
Applsci 15 12081 g015
Figure 16. Frontal wrist angle profile (left column) and associated error (VR–−IR) (right column) normalized across all task profiles and participants separated by cut direction. The bold lines indicate the mean profile and the shading indicates the standard deviation. For the left column the VR motion capture system is green and IR motion capture system is black, with purple shading representing the overlapping standard deviation.
Applsci 15 12081 g016
Figure 17. Frontal wrist data distribution plot for peak joint angle, range of motion, and peak joint velocity separated by VR (blue, right) and IR (red, left) motion capture systems. The box indicates the median value with 25% and 75% distribution bars. n reflects the total number of tasks over the 20 participants and 28 overall collections.
Applsci 15 12081 g017
Figure 18. Total tracker path length data distribution plot for each tracker separated by VR (blue, right) and IR (red, left) motion capture systems. The box indicates the median value with 25% and 75% distribution bars. n reflects the total number of tasks over the 20 participants and 28 overall collections.
Applsci 15 12081 g018
Figure 19. Peak tracker velocity data distribution plot for each tracker separated by VR (blue, right) and IR (red, left) motion capture systems. n reflects the total number of tasks over the 20 participants and 28 overall collections.
Applsci 15 12081 g019
Table 1. Full participant demographics where CUE-Q is the Capabilities of Upper Extremity Questionnaire and MMT is Manual Muscle Testing. Results for the CUE-Q and MMT are represented as percentages of the total possible (34 and 16 possible points for the CUE-Q and MMT, respectively).
Participant CodeSexAgeDiagnosesSCI LevelCUE-QMMT
C02Male43N/A, Healthy ControlN/AN/AN/A
C03Male54N/A, Healthy ControlN/AN/AN/A
C04Male26N/A, Healthy ControlN/AN/AN/A
C05Male20N/A, Healthy ControlN/AN/AN/A
C06Male27N/A, Healthy ControlN/AN/AN/A
C07Male36N/A, Healthy ControlN/AN/AN/A
C08Male11N/A, Healthy ControlN/AN/AN/A
C10Female10N/A, Healthy ControlN/AN/AN/A
C11Female38N/A, Healthy ControlN/AN/AN/A
CP01Female42Cerebral PalsyN/A79%98%
MS01Female44Multiple SclerosisN/A84%99%
MS02Female51Multiple SclerosisN/A95%100%
TBI01Male39Post-Traumatic Brain InjuryN/A99%100%
SCI01Male26Spinal Cord InjuryC6-C7 Incomplete64%98%
SCI02Male51Spinal Cord InjuryC6-C7 Incomplete70%97%
SCI03Male43Spinal Cord InjuryC5-C6 Incomplete29%83%
SCI04Male34Spinal Cord InjuryT9-T12 Incomplete99%100%
SCI05Female36Spinal Cord InjuryC3-C6 Incomplete82%98%
SCI06Female8Spinal Cord InjuryT1-T2 Complete87%98%
SCI07Male11Spinal Cord InjuryT11-T12 Complete97%80%
Table 2. Definitions and equations for each error metric.
Error Metric Definition   and   Equation   ( i   =   f r a m e ,   s   =   s u b j e c t )
RMSERMSE across each task profile i = 1 N V R i I R i 2 N
Median ErrorMedian error across each task profile M e d i a n ( V R i I R i )
Median Absolute ErrorMedian value of the absolute error across each task profile M e d i a n ( V R i I R i )
Mean ErrorMean error across each task profile i = 1 N ( V R i I R i ) N
Absolute Mean ErrorAbsolute value of the mean error across each task profile i = 1 N ( V R i I R i ) N
Mean Absolute ErrorMean value of the absolute error across each task profile i = 1 N | V R i I R i | N
ROM ErrorROM Error for each task profile
Error at Peak Joint AnglesError in peak joint angle across each task profile
Error at Peak Joint VelocitiesError in peak joint angle velocity across each task profile
Total Tracker Path Length ErrorError in total tracker path length across each task profile
Error at Peak Tracker VelocitiesError in peak tracker velocity across each task profile
Absolute Participant-Level Mean Bias M e a n   E r r o r s
Absolute Participant-Level Bias of ROM R O M   E r r o r s
Absolute Participant-Level Bias at Peak Angles | E r r o r   a t   P e a k   J o i n t   A n g l e s |
Absolute Participant-Level Bias at Peak Joint Velocities | E r r o r   a t   P e a k   J o i n t   V e l o c i t y s |
Table 3. Practical implementations and summary of error metrics by goal.
SettingGoalError MetricError Summary
Research (Participant-Grouped Metrics)Comparing
tracking quality to other systems and studies
RMSEMedian RMSE is below 7° for all joint metrics and below 5° for shoulder elevation and both wrist joint metrics
VR–IR ErrorMedian error is below 3° for all joint metrics
Absolute VR–IR ErrorAbsolute median error is below 6° for all joint metrics
Large motionsROM ErrorPercent median error is below 30% for frontal wrist, 15% for sagittal wrist, and 5% for all other joint metrics
Fast motionsError at Peak Joint VelocityPercent median error is below 12% for all joint metrics, below 10% for shoulder elevation, and below 1% for net wrist
Large joint angles (could be holding the position)Error at Peak Joint AnglePercent median error is below 23% for all wrist joint metrics and 5% for all other joint metrics
Patient-Specific
(Participant-Level Bias Metrics)
Large motionsROM ErrorPercent median error is below 32% for frontal wrist and 15% for all other joint metrics
Fast motionsError at Peak Joint VelocityPercent median error is below 20% for all joint metrics and below 10% for shoulder elevation and net wrist joint metrics
Large joint angles (could be holding the position)Error at Peak Joint AnglePercent median error is below 16% for all joint metrics and below 5% for shoulder and elbow joint metrics
Disclaimer/Publisher’s Note: The statements, opinions and data contained in all publications are solely those of the individual author(s) and contributor(s) and not of MDPI and/or the editor(s). MDPI and/or the editor(s) disclaim responsibility for any injury to people or property resulting from any ideas, methods, instructions or products referred to in the content.