Abstract
The soil–water retention curve (SWRC) is a fundamental property that governs the hydraulic and mechanical behavior of unsaturated soils. Laboratory SWRC determination remains time-consuming and costly, promoting indirect estimation methods. However, existing methods often oversimplify the pore structure and particle arrangement of soils and neglect the effect of capillary menisci, resulting in discrepancies from natural soil behavior. This study proposes a novel method to estimate the SWRC of coarse-grained soils based on grain size distribution (GSD) and relative density. In the proposed method, soil particles are idealized as spheres in a two-dimensional (2D) plane, and the packing structure is modeled using representative quadrilaterals composed of four poly-disperse particles. The GSD is employed to calculate the probability of different particle sizes occupying the corners of the quadrilateral elements, while the relative density defines their geometric configuration. The water retention behavior is then evaluated using the geometric relationships between the air–water interface and particle radii. The predicted SWRCs are in good agreement with experimental data, indicating that the method can effectively capture the water retention characteristics of coarse-grained soils governed by capillary effects. The method’s applicability is limited to coarse-grained soils and excludes clayey soils where adsorbed water dominates retention mechanisms.
1. Introduction
The soil–water retention curve (SWRC), also referred to as the soil–water characteristic curve (SWCC), defines the relationship between the quantity of water retained in the soil—expressed as the degree of saturation, volumetric water content, or gravimetric water content—and the corresponding matric suction. The SWRC is affected by many factors, such as the soil type, soil structure, temperature, density and contact angle [1,2]. As a key property of unsaturated soil, the SWRC plays a vital role in assessing hydraulic conductivity and shear strength change under unsaturated conditions [3,4,5,6,7,8,9]. In particular, coarse-grained soils—such as sands and gravels—are widely used in geotechnical applications like capillary barrier systems [10]. Understanding the SWRC of coarse-grained soils is therefore essential for designing such systems.
Laboratory measurements of the SWRC in laboratory tests, though accurate, are often time-consuming, expensive, and labor-intensive. This has led to the development of numerous indirect estimation methods. These methods can broadly be categorized into empirical models [11,12,13,14,15,16,17,18,19,20] and physical-based models [21,22,23,24,25]. Empirical models are typically developed by fitting a large set of measured data, producing functional relationships that can represent experimental results well when sufficient parameters are included. Although convenient, such empirical methods often lack physical interpretability and may not generalize well beyond the specific conditions under which they were calibrated.
In contrast, physically based models aim to predict the SWRC using measurable properties such as GSD, void ratio, and porosity. These models often rely on the assumption that the pore size distribution can be correlated with the GSD. For instance, the AP81 model [21] was developed based on a simplified representation of soil pores as cylindrical tubes, using soil porosity and GSD. An empirical parameter that depends on soil particle number was introduced to fit the complexity of soil pore space, which varies with soil sample mass. However, the accuracy of such models still depends on the empirical parameters. In order to develop a robust model, Mohammadi and Vanclooster [24] proposed a SWRC model based on simple cube packing. However, like many semi-physical or conceptual models, the particle accumulation structure is oversimplified, as indicated by Wang [25]. Additionally, most existing models consider only extreme pore conditions, such as completely dry or fully saturated states. They fail to capture intermediate saturation states, which are influenced by capillary bridges.
To address these limitations, Jaafar and Likos [22] proposed a two-dimensional (2D) geometric model incorporating two extreme cases of grain packings, namely, triangular and quadrilateral packings consisting of poly-disperse particles, to represent the loose packing and dense packing conditions, respectively. Although this model includes the effects of menisci, it assumes a fixed particle size ratio and interpolates results between extreme cases without considering the real pore structure under intermediate states. Zhai [23] proposed a model that utilized triangular packing to represent the soil element, and introduced nonzero contact angles to better estimate measured SWRCs. Again, the triangular packing can only represent the extreme case of densest packing, which may result in a relatively high contact angle for loose soils.
In this paper, a novel method is proposed for the estimation of the SWRC of coarse-grained soils based on the GSD and relative density. This approach builds upon and extends previous geometric models [22,23,26] by integrating to compute the probability of particle sizes occupying the corners of representative quadrilateral packings, while utilizing relative density to define the geometric arrangement of the particles. A key innovation of the proposed method lies in its departure from earlier approaches that rely on empirical packing factors or interpolation between two limiting cases of packing density. Instead, the relative density is directly used to control and construct the internal geometry of representative packing elements, providing a physically meaningful link between soil structure and water retention behavior. The water retention characteristics are then determined based on the geometric relationships between particle radii and the curvature of the air–water interface. Specifically, the geometrical relationship between the air–water interface and pore structures is used to quantify the volume of the retained water in different morphologies. This approach enables the SWRCs to be modeled over the entire saturation range and considered the geometry of soil pores under different relative densities. The accuracy and robustness of the proposed method are demonstrated through comparisons with experimental data from the literature.
2. Methodology
2.1. Representative Elemental Quadrilateral
Following Chan and Govindaraju [26], Jaafar and Likos [22] and Zhai [23], soil particles are idealized as a series of spheres of varying sizes arranged in a two-dimensional (2D) plane. The representative grain assembly is modeled as a quadrilateral packing consisting of four particles (, , , ), each in contact with its two adjacent neighbors: –, –, –, and –. When two diagonal particles (– or –) are in contact (Figure 1a,b), the quadrilateral can be treated as two triangle packings, corresponding to the densest packings described in the models proposed by Jaafar and Likos [22] and Zhai [23]. Particle is assumed to have the biggest radius, i.e., , and . The quadrilateral is defined by connecting the centers of the particles (see Figure 1).
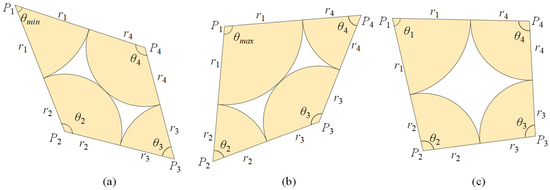
Figure 1.
Geometrical features for quadrilateral packing: (a) possible densest configuration with ; (b) possible densest configuration with ; (c) looser packing () with .
However, the geometry of the quadrilateral cannot be uniquely determined by its four side lengths alone, as multiple configurations of vertex positions can satisfy the same set of side lengths. Additional information, such as the internal angle at (denoted as ), is required. The void area (enclosed by the four particles), void ratio (e) and relative density () of the segment vary with angle .
The minimum and maximum values of are denoted as and . These values are obtained when either diagonal particle pair is in contact, as shown in Figure 1a,b. By using the Law of Cosines, and can be computed as:
With known, the geometry of the quadrilateral can be uniquely determined. The values of , and are functions of , and can be calculated using Equations (A1)–(A10) in Appendix A. It should be noted that only convex quadrilateral segments were considered in this study, as the soil assembly is considered in a compacted state. Hence, if any of the computed , , and exceeds 180°, the corresponding configuration is omitted in the calculation. The area of the quadrilateral is the sum of the areas of the triangles and , and can be calculated as:
Within the segment, the solid area, , is given by:
Void area is then:
The void ratio of the segment is defined as:
Given the radii of the four particles, the void ratio in Equation (6) becomes a function of the angle . The maximum void ratio is determined by numerically evaluating Equation (6). This evaluation is performed over the interval . Numerical optimization techniques, such as the Golden—section search method, are used for this purpose. The minimum value of , denoted as , occurs either at (yielding , Figure 1a) or at (yielding , Figure 1b). Figure 2 illustrates the evolution of with respect to for a quadrilateral packing with mm, mm, mm, mm. As shown in Figure 2, with increasing , the void ratio initially increases from to the maximum value , then decreases to .
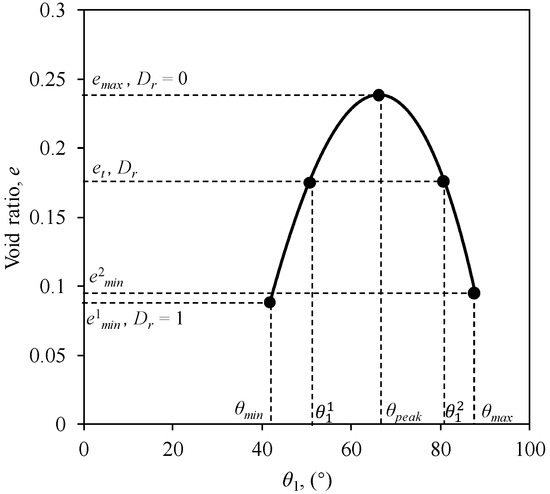
Figure 2.
Evolution of over for quadrilateral packing with mm, mm, mm, mm.
The target void ratio , corresponding to a given relative density, is interpolated as:
where is the smaller value between and . Given the target void ratio from Equation (7), the corresponding angle can be determined by numerically solving Equation (6). It is noted that if the target void ratio is greater than the larger of and , but smaller than , two corresponding angles, and , can both result, as illustrated in Figure 2. In this case, is randomly selected between and .
It is recognized that the proposed model is based on a 2D idealization of soil particles and pore structure. This simplification is necessary to derive tractable geometric relationships for capillary menisci and water retention. While this approach facilitates a clear physical framework, it may not fully capture the complexity of three-dimensional pore networks, including effects of pore connectivity and tortuosity. The results should be interpreted with an understanding of this simplification.
2.2. Grain Size Distribution and Representative Elemental Quadrilateral Occurrence
The radii of the four particles in each quadrilateral are randomly selected based on the GSD. There is no specific order among them, except that the particle with the largest radius is labeled as . In this model, the approach developed by Zhai [23] is adopted to determine the probability that a soil particle with diameter occupies a position in a quadrilateral. Following Zhai [23], the grain size distribution (GSD) is firstly divided into equal-mass intervals to obtain representative grain sizes , , , …. The mass of each interval is converted into the number of soil particles by using the corresponding representative grain size. For example, if the number of particles with diameter of is , then the number of particles with diameter of is . The total number of particles is the sum over all intervals:
The probability of the soil particles with diameter occupying a vertex of a representative elemental quadrilateral is:
The probability of occurrence of a quadrilateral is determined by the probabilities , , , of its four corner particles. The total void area is computed as the weighted sum of the void areas of all representative elemental quadrilaterals:
where is the total number of representative elemental quadrilaterals; is the void area of the ith representative elemental quadrilateral, and is calculated by Equation (5).
The radii of the four particles in a representative elemental quadrilateral are selected from the set of discrete grain sizes derived from the GSD (i.e., ). This generates a finite set of all possible quadrilateral combinations. In this study, a total of unique combinations were considered, which was found to provide a stable statistical representation of the pores. The probability of occurrence for a specific quadrilateral, defined by particles with probabilities , is given by the product . The total void area and total water-filled area are then computed as the probability-weighted sum over all quadrilaterals, as shown in Equations (10) and (13), ensuring that the results are deterministic and repeatable.
2.3. Water Retention Characteristic of the Representative Elemental Quadrilateral
The water retention characteristic for each of the representative elemental quadrilateral is dependent on the radius of air–water interface for the given matric suction. Based on the Young-Laplace equation, the radius of air–water interface, , can be defined as
where is the surface tension of the air–water interface; θ is the contact angle between air–water interface and solid interface; is the matric suction.
When the soil suction of is applied to the soil sample, the water retention characteristics in different elemental quadrilaterals are different. As a result, the degree of saturation, , of the whole soil sample is defined as
where is obtained by Equation (10). is the total water-filled area in all the representative elemental quadrilaterals, and is calculated by Equation (13).
where is the retained water area for each quadrilateral, computed based on geometric conditions, as detailed in Section 2.3.1 and Section 2.3.2.
The method proposed in this paper considers only the SWRC during the drying process. To obtain the SWRC, the soil is assumed to be fully saturated at the initial state under zero suction. The suction is then increased in discrete steps. It is important to note that the model calculates the water distribution under the assumption of static equilibrium at each given suction level. Furthermore, as the model idealizes the soil fabric as a collection of independent 2D elements and does not simulate pore connectivity or dynamic drainage processes, the resulting SWRC is independent of the suction step size. In this study, the suction was increased in logarithmic steps to efficiently characterize the curve. For each suction, the corresponding is computed using Equation (11), and the water-filled areas in all representative elemental quadrilaterals are calculated to determine the overall saturation using Equations (12) and (13).
It should be noted that the SWRC described in this section accounts solely for capillary water. According to soil science classification, water in soil can be divided into three categories: (1) gravitational water, (2) capillary water, and (3) hygroscopic water or absorbed water [27]. Capillary water predominates in sandy soils, whereas hygroscopic water predominates in clayey soils. Therefore, the theoretical framework presented in this study is primarily applicable to sandy soils.
2.3.1. Scenario for
For the densest quadrilateral packing (, see Figure 1a,b), the quadrilateral is treated as two geometric triangles. For example, in Figure 1a, the quadrilateral is decomposed into two geometric triangles and . For each geometric triangle, air can only enter the pore when is equal to or smaller than a critical threshold, , corresponding to the so-called snap-off condition. Under this condition, the circle defined by radius is tangent to at least three surrounding particles. If the given exceeds , the pore remains fully saturated. Conversely, when , air can invade the pore, forming capillary menisci between particles, as shown in Figure 3b,c. In such configurations, for each geometric triangle can be determined analytically using the Descarte’s circle theorem,
where , and denote the radii of the three particles located at the vertices of the geometric triangle. Note that values of for the two geometric triangles are different, as radii of the particles confining the geometric triangles are different. For example, in Figure 3a, for geometric triangles is smaller than for geometric triangles .
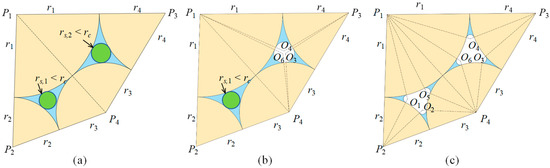
Figure 3.
Illustration of water retention characteristics in the densest quadrilateral packings with : (a) both geometric triangles are saturated; (b) three menisci at particle contacts in one geometric triangle and saturated pocket in the other geometric triangle; (c) six menisci at particle contacts.
A geometric triangle is saturated if is greater than —for example, both geometric triangles in Figure 3a and the geometric triangles in Figure 3b. In this case, the water area in a saturated geometric triangle is calculated using Equation (15).
where and are the radii of the soil particles; , and are the corresponding angle of the geometric sub-triangle. These angles are computed using the Law of Cosines (refer to Equations (A11)–(A13) in Appendix B).
A decrease in leads to a reduction in . When falls below the of a geometric triangle, it indicates that air invades into the corresponding triangle, resulting an unsaturated condition. Examples include geometric triangle in Figure 3b and both geometric triangles in Figure 3c. To calculate the water area, the geometric triangle is further subdivided into three meniscus sub-triangles. The water area in each meniscus sub-triangle is defined by the radii of the two contacting soil particles and the radius of the meniscus, as shown in Figure 4. The water area in each meniscus sub-triangle is still calculated by Equation (15), but the radius of the third soil particle in contact is replaced by .
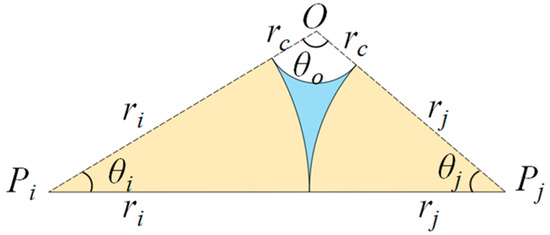
Figure 4.
Meniscus sub-triangles at particle contacts.
For given , the water areas in the two geometric triangles are different. Water area in each geometric triangle is computed separately, the total water area in a densest quadrilateral packing is obtained by summing the water-filled areas of its two constituent geometric triangles.
2.3.2. Scenario for
In the scenario where the relative density , the pore space is confined by all four surrounding particles, making the analytical determination of the critical meniscus radius challenging. A circle tangent to all four particles can only exist under rare geometric conditions. The water retention behavior for quadrilateral with is more complex than that for quadrilateral with . Figure 5 shows the possible water retention characteristic in an example quadrilateral packing with with the increase of . Figure 5a illustrates the saturated under low . With the increase in , decreases. When decreases to a certain value, air enters the wider side of the pore, as shown in Figure 5b. As further increases, the air–water interface of the intruded air moves toward the particle contacts, causing the air bubble to expand. When two diagonally opposite particles are sufficiently close, air may also enter from the opposite side, forming two bubbles within the pore, as illustrated in Figure 5c. With a continued increase in , air eventually occupies the center of the pore, while water remains only at the particle contacts, see Figure 5d. However, due to the geometrical complexity of the quadrilateral, it is difficult to obtain a numerical solution for the or value corresponding to each unsaturated state. Therefore, we propose the following approach to determine the state of unsaturated soil under a given (or ) value.
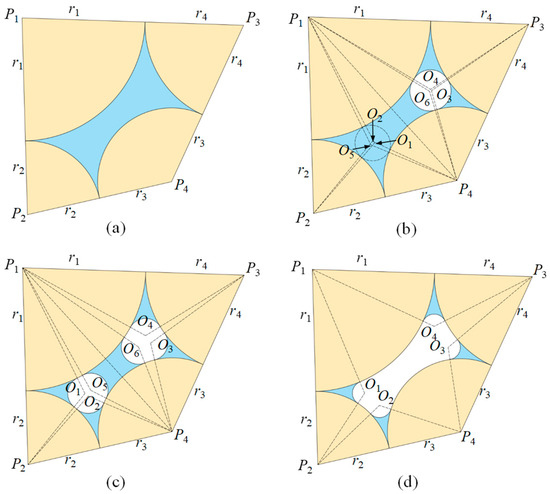
Figure 5.
Illustration of water retention characteristic in the quadrilateral packings with under unsaturated state: (a) the pore space confined by four surrounding particles is saturated; (b) two menisci formed at particle contacts and one bulk water body retained between three particles; (c) four menisci formed at particle contacts and one pendular bridge formed between two separated particles; (d) four menisci formed at particle contacts.
For a given , Menisci are firstly assumed to form between any two contacting particles. The filling angles of the menisci on each particle are calculated. For example, at particle , the filling angles are and (see Figure 5). To calculate the filling angle, four meniscus sub-triangles are constructed: , , and , where points , , and denote the centers of the circular menisci. The filling angles on each particle within a sub-triangle are calculated using the Law of Cosines (see Equations (A11) and (A12), Appendix B).
A pendular bridge may form between two diagonal particles and if their separation distance satisfies the following condition:
where is the distance between the centers of particle and . In such cases, a pendular sub-triangle is formed using particles , , and the circle defined by (see Figure 6a). The corresponding filling angles within this pendular sub-triangle are calculated using Equations (A14) and (A15). Notably, for an unsaturated pore, only one pendular bridge is allowed. If both diagonals – and – satisfy Equation (17), the pore is considered fully saturated. If neither pair satisfies the condition, the pore remains unsaturated.
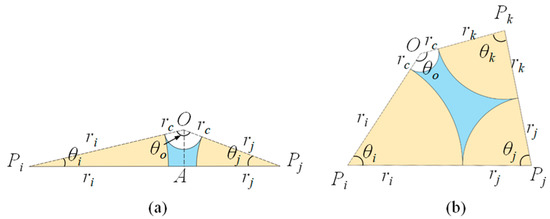
Figure 6.
Meniscus sub-triangles and sub-quadrilateral. (a) Pendular bridges between two diagonal particles; (b) bulk water enclosed by three neighboring particles.
The number of possible pendular bridges is used to determine the water retention condition, classified into three cases. Case 1: Both diagonal pairs satisfy Equation (17). The pore is fully saturated. Case 2: Neither diagonal pair satisfies Equation (17). The pore is unsaturated. In this case, only menisci exist between contacting particles. The total water area is computed by summing the water areas of the four meniscus sub-triangles, each calculated using Equation (15). Case 3: Only one diagonal pair satisfies Equation (17). In this case, the pore may be desaturated. To determine the water retention property in this case, the quadrilateral is split into two geometric sub-triangles along the corresponding diagonal. For each geometric sub-triangle, the filling angle condition is checked:
where and are the meniscus filling angles between particle and its neighbors and , respectively; is the vertex angle at . If the inequality holds, the geometric sub-triangle is saturated; otherwise, it is considered unsaturated.
If only one geometric sub-triangle is unsaturated, to compute the water area, two meniscus sub-triangles and one meniscus sub-quadrilateral are divided (see Figure 6b). For example, as shown in Figure 5a, meniscus sub-triangle and and sub-quadrilateral are constructed. The water area in the meniscus sub-quadrilateral is calculated using the same theory in Section 2.1, while the water area in the meniscus sub-triangles is computed using Equation (16).
If both the geometric sub-triangles are unsaturated, the water areas of the menisci on soil particle contacts are calculated as in Case 2. Additionally, to avoid the rupture of the pendular bridge [28], the following condition must be checked:
As shown in Figure 7, when Equation (19) is not satisfied, the two air–water interfaces of the pendular bridge intersect, leading to its rupture. However, the resultant ruptured water configuration cannot exist in a real thermodynamic equilibrium system. A pendular bridge is formed when Equation (19) is satisfied, and its area is given by:
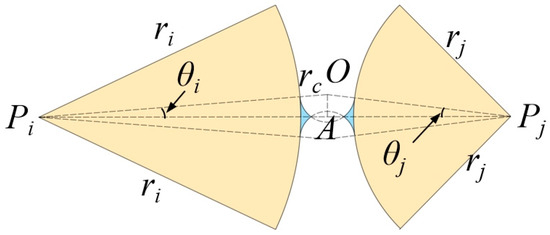
Figure 7.
Rupture pendular bridge between two diagonal particles.
3. Experimental Validation and Discussion
3.1. Experimental Validation
To validate the proposed method, it is important to note that this validation relies on previously published datasets from the literature; no new independent laboratory experiments were conducted as part of this work. The objective of this validation strategy was to evaluate the model’s performance and generalizability across a diverse range of materials. For this purpose, eight materials representing a range of grain size distributions, relative densities and grain morphologies were selected. These materials include monodisperse polylactic acid (PLA) particles from Liu et al. [29]; Ottawa 20/30 and 50/70 sands from Park [30]; Ottawa F75 sand from Le and Ghayoomi [31]; Silty sand from Imam [32]; fine recycled concrete aggregate (RCA), fine reclaimed asphalt pavement (RAP) and coarse RAP from Rahardjo [33]. Table 1 summarizes the grain size characteristics of each material. The corresponding grain size distribution curves are plotted in Figure 8. The comparison between the effective grain sizes and the measured grain size distributions is illustrated in Figure 9.

Table 1.
Grain size characteristics and relative density of the tested materials.
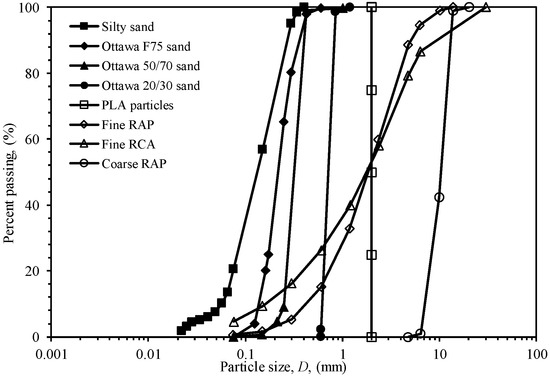
Figure 8.
Grain size distributions of the test materials.
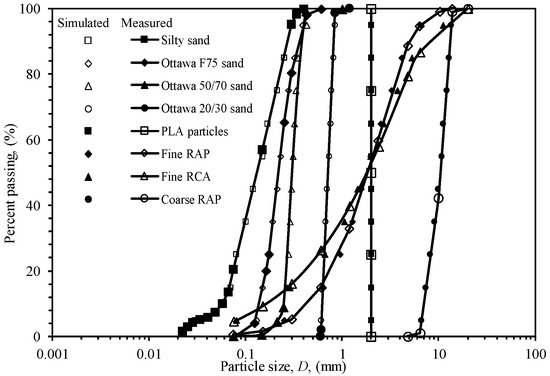
Figure 9.
Comparison of the effective and measured grain sizes of the test materials.
Figure 10 shows the comparison between modeled and measured SWRCs for the tested materials from the literature. Overall, a favorable agreement is observed between the predictions and experimental data across the wide range of soils and densities investigated. Particularly noteworthy is its performance for silty sand (Figure 10e), where the model successfully captures the evolution of the SWRCs with different relative densities (0, 0.4 and 0.9). The error bars in Figure 10 represent the standard deviation of the modeled degree of saturation, computed from the distribution of water-filled areas across the 10,000 quadrilateral combinations considered in each simulation. The mean degree of saturation for a given suction is calculated from the probability-weighted sums using Equation (12), while the standard deviation quantifies the variability in model predictions arising from the statistical representation of pore structures. It is observed that the standard deviation (represented by the error bars) is relatively small at both high saturation (S > 0.9) and low saturation (S < 0.2), but becomes significantly larger at intermediate saturation levels (0.2 < S < 0.9). This pattern can be explained by the diversity of pore sizes represented by the quadrilaterals. Quadrilaterals formed by larger particles create larger pores, whereas those formed by smaller particles create smaller pores. Under low suction conditions, all pores remain nearly fully saturated, resulting in minimal variability. Under high suction conditions, most pores are drained, also leading to low variability. At intermediate suction levels, however, larger pores drain readily (exhibiting low saturation) while smaller pores resist air entry (maintaining high saturation). This divergence in drainage behavior creates substantial variability in saturation among the different quadrilaterals, which is reflected in the larger standard deviation. Notably, in Figure 10a (PLA particles with uniform grain size), all quadrilaterals have identical geometry. Consequently, there is no variability in pore structure or water retention behavior, resulting in a standard deviation of zero throughout the entire suction range.
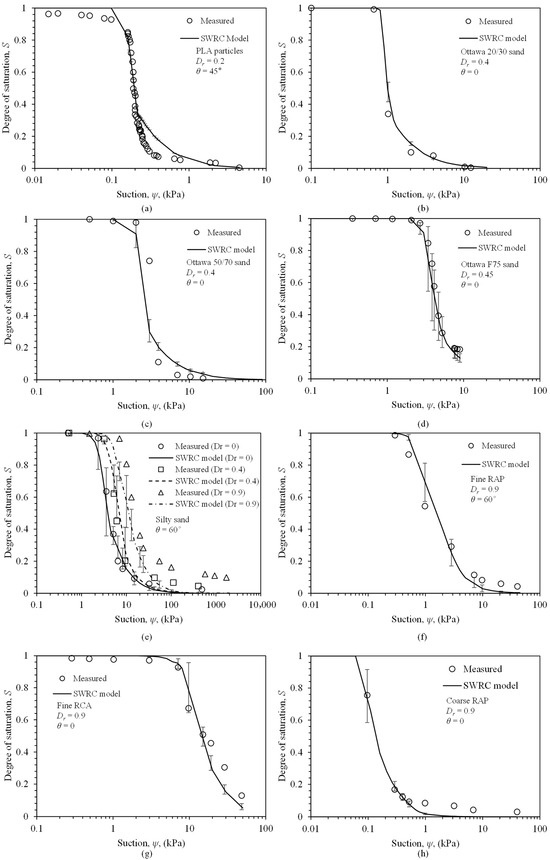
Figure 10.
Comparison between the measured and modeled SWRCs: (a) PLA particles; (b) Ottawa 20/30 sand; (c) Ottawa 50/70 sand; (d) Ottawa F75 sand; (e) Silty sand; (f) Fine RAP; (g) Fine RCA; (h) Coarse RAP.
Since the source experimental data did not include contact angle values, this parameter was necessarily assumed for the modeling. For Ottawa sands, fine RCA, and coarse RAP, a contact angle of zero was adopted, falling within the typical range reported for similar granular materials in previous studies [34,35]. For PLA particles, a contact angle of 45° was applied, consistent with the experimental measurements provided in [36]. For Silty sand and fine RAP, a contact angle of 60° was selected, which aligns with the values recommended in experimental studies on similar fine-grained and recycled materials [37,38]. Although these contact angles are model assumptions, all values lie within physically realistic ranges supported by existing literature. It should be noted that any minor deviations between simulated and measured SWRCs may be attributed to unmodeled factors such as particle shape effects, which are known to influence water retention behavior but remain challenging to quantify explicitly.
The coefficient of determination (R2) was employed to quantitatively evaluate the predictive accuracy of the models, see Table 2. The R2 values of the proposed model range from 0.818 to 0.982, indicating generally good agreement between predictions and experimental data. In comparison, Zhai’s model [23] also yielded relatively high R2 values, ranging from 0.823 to 0.974. However, it fails to account for the influence of relative density, leading to severely overestimated contact angles for looser specimens. Moreover, Zhai’s model assumes in the 2D model, which further contributes to the overestimation of the contact angle. On the other hand, Jaafar and Likos’s model [22] exhibits R2 values ranging from 0.328 to 0.940, except for the PLA particles case where the model fails to capture the experimental trend, resulting in a poor fit (R2 = −0.484). Its generally lower performance might be attributed to the assumption of a zero contact angle, along with the use of a fixed particle size ratio and an interpolation method between extreme cases that does not consider the real pore structure. This simplification results in notably poor R2 values for PLA particles, silty sand, and fine RAP. For Ottawa sands, fine RCA, and coarse RAP, the proposed model also demonstrates superior performance with higher R2 values than the two existing models.
Table 2.
Comparison of model performance based on R2 values for different materials.
3.2. Sensitivity to Contact Angle and Relative Density Variations
Figure 11 analyzes the sensitivity of the predicted SWRC to contact angle and relative density. All data were derived from the GSD of Ottawa 20/30 sand. The predicted SWRC demonstrates significant sensitivity to both contact angle and relative density variations. In Figure 11a, with the increase of , the SWRC shifts right. The SWRC demonstrates strong sensitivity to relative density, particularly within the medium suction range (1–10 kPa), where increasing from 0 to 1 elevates the degree of saturation by over 40% due to reduced pore sizes and enhanced capillary forces. This density dependence gradually diminishes as suction increases beyond 20 kPa, where all curves converge toward residual saturation conditions. This trend is consistent with Imam’s experimental observations [32] (Figure 10e), which also showed a strong relative density influence at medium suction and curve convergence at high suction in granular soils. Meanwhile, with the increase of , the SWRC shifts left, as shown in Figure 11b. Notably, the influence of is relatively minor below 40° but becomes significantly more pronounced above this threshold. A similar dependence of primary drainage curves on contact angle has been reported in the literature. For example, O’Carroll et al. [39] conducted drainage experiments on Ottawa sand under different wetting conditions and observed a consistent trend of decreasing capillary pressure with increasing contact angle, further validating the sensitivity pattern identified in the present model.
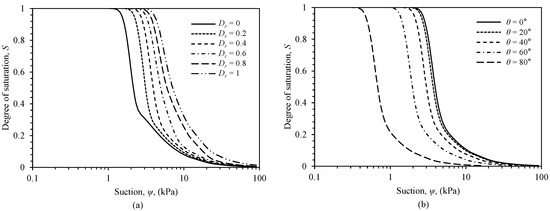
Figure 11.
Sensitivity analysis of the SWRC model for Ottawa 20/30 sand: (a) effect of relative density ( = 0–1) at a fixed contact angle of 0°; (b) effect of contact angle (0–80°) at a fixed relative density of = 0.4.
It should be noted that the model assumes a uniform contact angle and spherical particles. In reality, heterogeneous contact angles and non-spherical particle shapes can further influence the SWRC. Surface roughness and chemical heterogeneity may lead to spatially varying contact angles, potentially enhancing water retention at high suction. Similarly, angular particles can create more complex pore geometries, often resulting in a higher residual saturation and a more gradual drying curve than predicted for spherical grains. These factors represent important considerations when applying the model to highly irregular or recycled materials.
4. Conclusions
This study presents a novel method for estimating the soil–water retention curve (SWRC) of coarse-grained soils based on grain size distribution (GSD) and relative density. In this approach, soil particles are idealized as 2D spheres. The soil fabric is modeled using representative quadrilateral packings. Each packing is composed of four poly-disperse particles. The GSD is employed to determine the probability of particles with different radii occupying the corners of these representative packing elements, while the relative density governs their geometric configuration. Water retention behavior is computed using geometric relationships. These relationships link particle radii to air–water interface curvature. The model captures the effects of capillary menisci, pendular bridges, and saturation pockets. Comparison with experimental data demonstrates that the proposed method reliably estimates the SWRC of coarse-grained soils and effectively accounts for capillarity-dominated water retention.
While the 2D formulation of the model provides computational tractability but inherently simplifies the 3D nature of soil pore space. Key limitations include the potential underestimation of pore tortuosity and the oversimplification of meniscus geometry, which could introduce scaling errors in the predicted SWRC, particularly at intermediate saturations. These limitations are expected to be more pronounced for loosely packed soils, where 3D pore connectivity is highly complex, and for angular grains, whose corner-scale capillary effects are inherently three-dimensional. Therefore, results should be interpreted with an understanding of this simplification. It should be noted that the proposed method is not applicable to clayey soils, where adsorbed water dominates the retention behavior. Future work should focus on extending this geometric framework to 3D, potentially by incorporating pore morphology data from X-ray CT, to better capture these effects.
Author Contributions
Conceptualization, X.L. and X.W.; methodology, X.L. and R.L.; software, X.L.; validation, R.L.; formal analysis, X.L. and X.S.; investigation, X.L., J.L. and X.S.; writing—original draft preparation, X.L. and X.W.; writing—review and editing, X.L., J.L. and X.W.; supervision, X.L. All authors have read and agreed to the published version of the manuscript.
Funding
This research was funded by the National Natural Science Foundation of China grant number No. 42502279.
Institutional Review Board Statement
Not applicable.
Informed Consent Statement
Not applicable.
Data Availability Statement
The raw data supporting the conclusions of this article will be made available by the corresponding author on request.
Conflicts of Interest
The authors declare no conflicts of interest.
References
- Wheeler, S.J.; Sharma, R.S.; Buisson, M.S.R. Coupling of hydraulic hysteresis and stress–strain behaviour in unsaturated soils. Géotechnique 2003, 53, 41–54. [Google Scholar] [CrossRef]
- Sun, D.A.; Sheng, D.; Xu, Y. Collapse behaviour of unsaturated compacted soil with different initial densities. Can. Geotech. J. 2007, 44, 673–686. [Google Scholar] [CrossRef]
- Gao, Y.; Sun, D.A.; Zhou, A.; Li, J. Predicting Shear Strength of Unsaturated Soils over Wide Suction Range. Int. J. Geomech. 2020, 20, 04019175. [Google Scholar] [CrossRef]
- Tan, Y.; Zhang, H.; Wang, C.; Li, H. Analysis of Soil–Water Characteristic Curve and Microstructure of Undisturbed Loess. Appl. Sci. 2024, 14, 3329. [Google Scholar] [CrossRef]
- Liu, X.; Zhou, A.; Li, J.; Feng, S. A fully coupled micro-hydromechanical (micro-HM) model for partially saturated soils based on DEM. Comput. Geotech. 2024, 173, 106298. [Google Scholar] [CrossRef]
- Bao, X.; Li, J.; Wang, S.; Cui, X. Investigation of the Water-Retention Characteristics and Mechanical Behavior of Fibre-Reinforced Unsaturated Sand. Appl. Sci. 2023, 13, 11337. [Google Scholar] [CrossRef]
- Liu, X.; Zhou, A.; Li, J.; Feng, S. A micro-mechanical model for unsaturated soils based on DEM. Comput. Methods Appl. Mech. Eng. 2020, 368, 113183. [Google Scholar] [CrossRef]
- Vanapalli, S.K.; Fredlund, D.G.; Pufahl, D.E.; Clifton, A.W. Model for the prediction of shear strength with respect to soil suction. Can. Geotech. J. 1996, 33, 379–392. [Google Scholar] [CrossRef]
- Wang, B.; Cui, C.; Xu, C.; Meng, K.; Li, J.; Xu, L. A novel analytical solution for horizontal vibration of partially embedded offshore piles considering the distribution effect of wave loads. Ocean Eng. 2024, 307, 118179. [Google Scholar] [CrossRef]
- Rahardjo, H.; Satyanaga, A.; Leong, E.C.; Wang, J.Y. Effects of coarse-grained material on hydraulic properties and shear strength of top soil. Eng. Geol. 2008, 101, 165–173. [Google Scholar] [CrossRef]
- Fredlund, M.D.; Wilson, G.W.; Fredlund, D.G. Use of the grain-size distribution for estimation of the soil-water characteristic curve. Can. Geotech. J. 2002, 39, 1103–1117. [Google Scholar] [CrossRef]
- Satyanaga, A.; Rahardjo, H.; Zhai, Q. Estimation of unimodal water characteristic curve for gap-graded soil. Soils Found. 2017, 57, 789–801. [Google Scholar] [CrossRef]
- van Genuchten, M.T. A Closed-form Equation for Predicting the Hydraulic Conductivity of Unsaturated Soils. Soil Sci. Soc. Am. J. 1980, 44, 892–898. [Google Scholar] [CrossRef]
- Fredlund, D.G.; Xing, A. Equations for the soil-water characteristic curve. Can. Geotech. J. 1994, 31, 521–532. [Google Scholar] [CrossRef]
- Wang, Y.; Hu, X.; Li, Y.; Liu, Y. Study on the soil water characteristic curve and its fitting model of Ili loess with high level of soluble salts. J. Hydrol. 2019, 578, 124025. [Google Scholar] [CrossRef]
- Zhou, A.N.; Sheng, D.; Carter, J.P. Interpretation of unsaturated soil behaviour in the stress—Saturation space, I: Volume change and water retention behaviour. Comput. Geotech. 2012, 43, 178–187. [Google Scholar] [CrossRef]
- Li, Y.; Vanapalli, S.K. A novel modeling method for the bimodal soil-water characteristic curve. Comput. Geotech. 2021, 138, 104329. [Google Scholar] [CrossRef]
- Gao, Y.; Sun, D.A.; Zhou, A.; Li, J. A simple method for predicting the hydraulic properties of unsaturated soils with different void ratios. Soil Tillage Res. 2021, 209, 104913. [Google Scholar] [CrossRef]
- Gao, Y.; Sun, D.A.; Zhou, A.; Li, J. A novel equation for simulating the bimodal soil–water retention curve of unsaturated soils. Acta Geotech. 2024, 19, 5347–5362. [Google Scholar] [CrossRef]
- Feng, C.; Cui, C.; Li, H.; Zhang, W. Bayesian Updating of Soil–Water Character Curve Parameters Based on the Monitor Data of a Large-Scale Landslide Model Experiment. Appl. Sci. 2020, 10, 5526. [Google Scholar] [CrossRef]
- Arya, L.M.; Paris, J.F. A Physicoempirical Model to Predict the Soil Moisture Characteristic from Particle-Size Distribution and Bulk Density Data. Soil Sci. Soc. Am. J. 1981, 45, 1023–1030. [Google Scholar] [CrossRef]
- Jaafar, R.; Likos, W.J. Estimating Water Retention Characteristics of Sands from Grain Size Distribution using Idealized Packing Conditions. Geotech. Test. J. 2011, 34, 489–502. [Google Scholar] [CrossRef]
- Zhai, Q.; Rahardjo, H.; Satyanaga, A.; Dai, G. Estimation of the soil-water characteristic curve from the grain size distribution of coarse-grained soils. Eng. Geol. 2020, 267, 105502. [Google Scholar] [CrossRef]
- Mohammadi, M.H.; Vanclooster, M. Predicting the Soil Moisture Characteristic Curve from Particle Size Distribution with a Simple Conceptual Model. Vadose Zone J. 2011, 10, 594–602. [Google Scholar] [CrossRef]
- Wang, C.; Li, Y.; Zhang, H.; Wang, J. Estimating soil-water characteristic curve from the particle size distribution with a novel granular packing model. Water Resour. Res. 2025, 61, e2024WR037262. [Google Scholar] [CrossRef]
- Chan, T.P.; Govindaraju, R.S. Estimating Soil Water Retention Curve from Particle-Size Distribution Data Based on Polydisperse Sphere Systems. Vadose Zone J. 2004, 3, 1443–1454. [Google Scholar] [CrossRef]
- Zhai, Q.; Rahardjo, H.; Satyanaga, A.; Dai, G. Estimation of unsaturated shear strength from soil–water characteristic curve. Acta Geotech. 2019, 14, 1977–1990. [Google Scholar] [CrossRef]
- Liu, X.; Zhou, A.; Li, J.; Feng, S. Reproducing micro X-ray computed tomography (microXCT) observations of air–water distribution in porous media using revised pore-morphology method. Can. Geotech. J. 2020, 57, 149–156. [Google Scholar] [CrossRef]
- Liu, P.; Wang, C.; Li, Y.; Zhang, H. Effects of particle morphology on pore structure and SWRC of granular soils. Géotech. Lett. 2023, 13, 29–34. [Google Scholar] [CrossRef]
- Park, J.S.; Kim, J.H.; Lee, S.H.; Kwon, T.H. Hydraulic properties of sands treated with fungal mycelium of trichoderma virens. J. Geotech. Geoenviron. Eng. 2023, 149, 04023109. [Google Scholar] [CrossRef]
- Le, K.N.; Ghayoomi, M. Cyclic Direct Simple Shear Test to Measure Strain-Dependent Dynamic Properties of Unsaturated Sand. Geotech. Test. J. 2017, 40, 20160044. [Google Scholar] [CrossRef]
- Imam, R.; Vaseghi Maghvan, S.; Saaly, M. Effects of hydraulic balance time on the shear strength of an unsaturated granular soil at various densities. In Proceedings of the 70th Canadian Geotechnical Conference, Ottawa, ON, Canada, 24–26 September 2017. [Google Scholar]
- Rahardjo, H.; Satyanaga, A.; Leong, E.C.; Santoso, V.A. Unsaturated properties of recycled concrete aggregate and reclaimed asphalt pavement. Eng. Geol. 2013, 161, 44–54. [Google Scholar] [CrossRef]
- Ustohal, P.; Stauffer, F.; Dracos, T. Measurement and modeling of hydraulic characteristics of unsaturated porous media with mixed wettability. J. Contam. Hydrol. 1998, 33, 5–37. [Google Scholar] [CrossRef]
- Ramírez-Flores, J.C.; Woche, S.K.; Bachmann, J.; Goebel, M.-O.; Hallett, P.D. Comparing capillary rise contact angles of soil aggregates and homogenized soil. Geoderma 2008, 146, 336–343. [Google Scholar] [CrossRef]
- Laput, O.; Vasenina, I.; Salvadori, M.; Kurzina, I. Low-temperature plasma treatment of polylactic acid and PLA/HA composite material. J. Mater. Sci. 2019, 54, 11726–11738. [Google Scholar] [CrossRef]
- Kumar, S.; Malik, R.S. Verification of Quick Capillary Rise Approach for Determining Pore Geometrical Characteristics in Soils of Varying Texture. Soil Sci. 1990, 150, 883–888. [Google Scholar] [CrossRef]
- Goebel, M.O.; Bachmann, J.; Woche, S.K.; Fischer, W.R. Water Potential and Aggregate Size Effects on Contact Angle and Surface Energy. Soil Sci. Soc. Am. J. 2004, 68, 383–393. [Google Scholar] [CrossRef]
- O’Carroll, D.M.; Abriola, L.M.; Polityka, C.A.; Bradford, S.A.; Demond, A.H. Prediction of two-phase capillary pressure–saturation relationships in fractional wettability systems. J. Contam. Hydrol. 2005, 77, 247–270. [Google Scholar] [CrossRef] [PubMed]
Disclaimer/Publisher’s Note: The statements, opinions and data contained in all publications are solely those of the individual author(s) and contributor(s) and not of MDPI and/or the editor(s). MDPI and/or the editor(s) disclaim responsibility for any injury to people or property resulting from any ideas, methods, instructions or products referred to in the content. |
© 2025 by the authors. Licensee MDPI, Basel, Switzerland. This article is an open access article distributed under the terms and conditions of the Creative Commons Attribution (CC BY) license (https://creativecommons.org/licenses/by/4.0/).