Article

Quantitative Assessment of the Reliability Index in the Safety Analysis of Spatial Truss Domes

by
Beata Potrzeszcz-Sut
,
Agnieszka Dudzik
and
Paweł Grzegorz Kossakowski
*
Faculty of Civil Engineering and Architecture, Kielce University of Technology, 25-314 Kielce, Poland
*
Author to whom correspondence should be addressed.
Appl. Sci. 2025, 15(22), 12060; https://doi.org/10.3390/app152212060
Submission received: 22 October 2025 / Revised: 10 November 2025 / Accepted: 11 November 2025 / Published: 13 November 2025

Abstract

The objective of the article is the quantitative assessment of the reliability index for a specific type of structure—trusses with node snap-through. The trends in contemporary geometric and structural design of architectural forms of rod domes are evolving towards increasing diameters and reducing rise. Therefore, it is justified to assess the safety of this type of structure. The Hasofer–Lind reliability index (β) was adopted as the reliability measure. In the reliability analysis, the FORM method was applied using the implicit form of the random variables function (combining external reliability software with the noncommercial finite-element method program) and using explicit forms of limit-state functions (neural networks were used and own original finite-element method module). In addition, the classical Monte Carlo method and the hybrid Monte Carlo method (combining with a neural network) were used. For dome loads in the range of 73–100%, the reliability index β can be estimated with reasonable accuracy (error) compared to standard methods. The obtained approximation functions allow for easy determination of the percentage of the maximum load that ensures safe operation. In addition, they allow us to indicate at what load level the reliability index reaches the standard level (at least β = 1.5 for the serviceability limit state).

1. Introduction

The design of engineering structures involves a certain degree of risk resulting from the uncertainty of design parameters. In practice, the randomness of the basic variables of the analyzed models is taken into account by applying safety factors that change the values of the design parameters of the structure in accordance with the recommendations given in the standards. However, reality shows that this is a complex issue and requires going beyond deterministic formulations. The last few decades have seen intensive development of methods that allow the use of probabilistic models to estimate the probability of structural failure. These methods are used to realistically assess the structure safety or its structural elements [1,2,3,4]. The literature on the subject presents the use of probabilistic methods in the safety assessment of steel bar structures [5,6,7,8,9,10,11] or system reliability methods [12,13].
In probabilistic reliability analysis, design parameters are assumed to be represented by random variables, allowing their randomness to be explicitly considered in the design process. This allows the construction of a mathematical model that estimates the probability of a specific structure’s behavior. Similar to the deterministic approach, the mathematical model uses the concept of a limit state. The set of uncertain design parameter values that lead to the limit state being exceeded defines a random event, which is associated with structural failure. The probability of this event (known as the failure probability) and its functions are measures of the reliability of the structure.
Difficulties in probabilistic analysis involve defining appropriate probability distributions for structural parameters. Furthermore, random variables are characterized by two parameters (mean value and standard deviation) instead of the single parameter required in deterministic methods. These aspects lead to the conclusion that it is necessary to provide engineers with algorithms that enable them to estimate the statistical parameters of random variables used in the analysis, based on available data. This postulate seems entirely justified, because structural reliability issues are not unrelated to reality. The unified Structural Standards—Eurocodes [14], introduced in 2010 and applicable throughout the European Union, are largely based on the so-called semi-probabilistic approach. According to this approach, structural elements dimensioned according to standards are provided with a sufficiently high level of reliability.
The most objective measure of failure risk is probability. Determining the failure probability involves estimating the integral of the probability density function of random structural parameters within the failure area. Because defining a realistic structural model requires the use of at least several random variables, integrals in reliability analysis are usually multidimensional. Therefore, alternative integral estimation algorithms are necessary. These utilize linear or quadratic approximations of the failure area. They so-called First-Order Reliability Method (FORM) [15,16,17] and Second-Order Reliability Method (SORM) [18,19,20] are effective and provide sufficient accuracy.
However, they require knowledge of the first and second derivatives of the state function. A different approach to the problem of estimating the value of the multidimensional integral defining the probability of failure is presented by a group of simulation methods. The most well-known, from which more advanced solutions are derived, is the classical Monte Carlo method (MC) [21,22]. Due to the need to perform a large number of simulations to estimate the probability of structure failure, which is usually very small, this method in its classical form is rarely used in reliability calculations. A way to address the inefficiency of the Monte Carlo method in structural reliability issues is to use artificial neural networks (ANNs) [23,24,25]. The idea behind this solution is to replace the finite-element programs used to generate samples during simulation with ANNs. This is the so-called hybrid Monte Carlo method (HMC), which is finding more and more applications in solving engineering problems [10,26,27].
Probabilistic methods are characterized by considerable complexity, both in terms of estimating failure probability and creating a valid model for random analysis—hence their limited popularity in everyday engineering practice to date, even though they allow for a very rational and largely cost-effective assessment of the safety of a structure, its components, or the performance of a given material.
The trends in contemporary geometric and structural design of architectural forms of rod domes are evolving towards increasing diameters and reducing rise. Therefore, this paper assesses the reliability index (β) of spatial truss structures with a low rise. By “low rise,” we mean a small ratio of the structure’s height H to its span L (H/L < 1/5), and thus a small angle of inclination of the dome’s rods relative to the horizontal. In most structures of this type, loss of rod stability between nodes does not cause an overall loss of stability, while node snap-through can lead to global instability. The problem of node snap-through was first solved by Misses in 1925 [28].
This problem is reflected in real structures where failure occurred as a result of a loss of stability due to node snap-through—for example, the single-layer mesh dome disaster in Chorzów in 1966 or the dome disaster in Bucharest in 1963 [29]. Increasing diameters and reducing the height of structures compels designers to analyze such structures taking into account nonlinear effects. The main problem in the numerical analysis of nonlinear problems is the occurrence of singular points along the equilibrium path of the structure. Using probabilistic methods, we can determine the probability of failure approaching a limit point by moving along the equilibrium path of the structure.
Although a number of review articles published recently have touched on this topic, they focused solely on a certain area of structural engineering like loss of stability due to node snap-through, as well as the application of artificial neural networks in the analysis of truss structures [30,31,32,33,34,35]. However, there is a lack of studies addressing the comprehensive safety assessment of low-rise truss structures using artificial neural networks. The present work aims to fill this gap.
The aim of this study is to quantitatively assess the reliability index (β) of selected spatial domes using a hybrid approach. This approach involves constructing an approximation formula for the indicated group of structures. This allows definition of the maximum value of the load multiplier corresponding to the limit value of the reliability index β, which guarantees the safe operating range of the structure.

2. Materials and Methods

2.1. Finite-Element Method as a Training Data Generator

The finite-element method (FEM) is currently the fundamental tool for analyzing the behavior of engineering structures and is increasingly being used as a training data generator for machine learning models, especially neural networks, see e.g., [24]. In studies [5,10], it was shown that FEM enables the creation of training and testing datasets that reflect nonlinear dependencies between random structural parameters (e.g., forces, modulus of elasticity, cross-sectional area) and its limit state.
In one study [5], data from FEM calculations were used to train neural networks formulating explicit limit-state functions, which subsequently replaced complex numerical models in reliability analysis using the FORM method. The application of this approach significantly reduced the calculation time (from approximately one hour to one minute), while maintaining high accuracy of the results.
In turn, in another study [10] the FEM method was integrated with neural networks in the so-called hybrid Monte Carlo (HMC) method. The neural network, trained on the results obtained from FEM, generated the data needed for random simulations in the reliability analysis of spatial trusses. This allowed for a reduction in the computational costs of the classical Monte Carlo approach while retaining its statistical advantages.

2.2. Neural Network (NN) as a Limit-State Function Approximator

In the reliability analysis of engineering structures, the limit-state function G(X) is a key element, describing the transition of the structure from a safe state to a failure state. In a probabilistic approach, it is assumed that
G(X) = R(X) − S(X),
where R(X) is the structural resistance, S(X) is the load, and the vector X = [X1, X2, …, Xn] represents random variables describing material, geometrical, and load parameters.
Due to the complexity of nonlinear models, the direct determination of the function G(X) using the classical finite-element method (FEM) is time-consuming. Therefore, in the latest approaches, neural networks are increasingly used as surrogate models which enable the approximation of the limit-state function based on the data generated by FEM.
In one example (SET1), a back-propagation neural network (BPNN) was used which is a variant of a feedforward neural network. The structure of the BPNN consists of three basic layers:
  • The input layer—corresponding to the random variables Xi;
  • One or more hidden layers—performing the nonlinear transformation of data;
  • The output layer—corresponding to the value of the limit-state function G(X).
Schematically, the architecture of such a network can be written as
NH − 1,
where N is the number of input neurons (equal to the number of random variables), H is the number of neurons in the hidden layer, and “1” is a single output neuron representing the value of G(X). The computational process in the neural network can be represented by the following equation:
G N N X   =   f o j = 1 H w j ( 2 ) f h i = 1 N w ij ( 1 ) X i + b j ( 1 ) + b ( 2 ) ,
where w i j ( 1 ) —weights of connections between the input and hidden layer; w j ( 2 ) —weights between the hidden and output layer, b j ( 1 ) ; b ( 2 ) —bias terms; f h (⋅)—activation function in the hidden layer (most often tanh or sigmoid); and f o (⋅)—linear function in the output neuron.
Thanks to its capacity to approximate nonlinear relations, the BPNN can model the complex dependency between the structural parameters and its limit state. In practice, this means that after training the network on a dataset obtained from FEM analysis
X ( k ) , G F E M X ( k ) , k = 1 ,   2 ,   ,   M
An explicit form of the function GNN(X) is obtained, which can replace costly numerical computations.
The function defined in this way can then be used in probabilistic procedures, such as the FORM/SORM method or Monte Carlo simulations, to determine the reliability index β and the probability of failure pf. The advantage of this approach is a significant reduction in calculation time—the neural network, after a one-time training process, allows for the immediate assessment of the structure’s limit state for any set of random parameters.
To ensure the reproducibility of the surrogate modeling procedure, the training parameters of the neural networks used in the study are specified. In all cases, feedforward NH − 1 networks were trained using the Levenberg–Marquardt algorithm, with a sigmoidal activation function in the hidden layer and a linear output neuron. Training and testing datasets were generated using FEM results.
For SET1, 64 training and 300 testing samples were used, and the 3–7–1 architecture provided the most favorable balance of errors and Mean Squared Error (MSE) stability for learning and testing, respectively: MSEL = 9.97 × 10⁻⁸, MSET = 5.34 × 10⁻⁷.
For SET2, the dataset consisted of 64 training and 216 testing samples; the best performance was obtained for the 3–5–1 network, achieving very low approximation errors (MSEL = 3.51 × 10⁻⁷, MSET = 7.42 × 10⁻⁷).
In both cases, training and testing errors were consistent, confirming the proper generalization of the neural models used in the subsequent reliability analyses, including the hybrid Monte Carlo approach.

2.3. Applied Methods of Reliability Analysis

2.3.1. The FORM Method Combined with an Explicit Limit-State Function

Each limit function is associated with a specific limit state. In simple computational models, the state of a structure can be described using parameters identifying the load (action) S and the load-bearing capacity (resistance) R. Assuming that these quantities are uncorrelated and dependent on various random parameters grouped in the vector X = {X1, X2, …, Xn}, the general form of the limit-state function can be defined as (1). The function defined by Formula (1) can take on a more detailed description depending on defined variables, e.g., load components, action coefficients, load-bearing capacity parameters, material properties, or dimensions of the structure and elements. Furthermore, the function defined by Formula (1) is associated with the appropriate limit state (ultimate, serviceability, or fatigue). Depending on the assumed values, this function expresses one of three possible states: a safe domain (G(X) > 0), a failure domain (G(X) < 0), or the limit-state surface (G(X) = 0). Determining the failure probability pf is then performed using the available reliability analysis methods. Often, the large number of random variables makes estimating the failure probability pf, and thus the reliability index β, very difficult, if not impossible. Therefore, an important element of the analysis is the appropriate selection of probabilistic design parameters.
When defining an explicit limit function, it is necessary to generate it in a form that describes the random nature of the structural parameters as accurately as possible. Therefore, it seems logical that achieving this goal is possible by using as many random variables as possible when formulating the function described by Formula (1). Assuming that the structural failure criterion will be determined by limit functions related to the serviceability limit state, it is necessary to obtain certain maximum values as a function of the random variables during calculations. For this purpose, a tool is necessary to generate a formula for the desired value for the analyzed structure. Due to the use of random variables in the description of design parameters (e.g., E, A, J, l, Q, fy, etc.), which are implicit at the level of strength analysis, it is necessary to use a module enabling symbolic calculations. Neural networks (NNs) were used to determine formulas for the searched quantities. The training and testing patterns were computed by FEM. The authoring program, implemented in the MATLAB R2025b environment, was applied. The calculations provided formulas in standard mathematical notation as a function of the Xi variables. These formulas were used to formulate a limit function, and then it was implemented in the NUMPRESS reliability program.

2.3.2. The FORM Method Combined with an Implicit Limit-State Function

Using of explicit formula to define random variables function can only be performed for very simple limit functions. In more complex cases, a symbolic computation module is necessary. In practical implementations, this relationship is implicit and is determined using a numerical procedure, such as the finite-element method (FEM).
This requires the use of a reliability analysis program. The authors of this paper presented a combination of the reliability program NUMPRESS [36] with the external finite-element method module KRATA [37]. Implementing a structural reliability task using the NUMPRESS program begins with creating a computational model. The user specifies the parameters of the marginal probability distributions of random variables, and in the case of correlated variables, also the cross-correlation coefficients. The model definition takes into account two types of random variables: basic and external. External variables are implicit functions of random variables whose values are obtained as a result of executing the FEM program (KRATA). After defining the computational model, the user enters the limit function formula in standard mathematical notation as a dependency on the basic and external random variables. The reliability program invokes the FEM program, which calculates the values necessary to define the limit function for subsequent sets of random variables. The next step is to select a reliability analysis method and run the calculations. The task culminates in generating information containing failure probability values, the estimation of which requires repeated calculations of the limit function for various realizations of the random variable vector. In most practical design cases, this requires repeated execution of external finite-element method programs. The next step is to select a reliability analysis method and run the calculations. The task culminates in generating information containing failure probability values. Their estimation requires repeated calculations of the limit function for various realizations of the random variable vector. In most practical design cases, this requires repeated execution of external FEM programs.

2.3.3. Classical and Hybrid Monte Carlo Method in Structural Reliability Analysis

The Monte Carlo (MC) method is one of the oldest and most accurate probabilistic techniques used in structural reliability analysis. Originally developed by Stanisław Ulam and John von Neumann during the 1940s, the method derives its name from the inherently random nature of the simulated processes (Metropolis and Ulam [38]; Hurd [39]). In engineering applications, the MC method numerically estimates a multidimensional integral representing the failure probability of a structure characterized by random parameters Xi:
p f = G ( X ) 0 f X X d X ,
where G(X) is the limit-state function, and fX(X) denotes the joint probability density function of the random variable vector [40,41].
In practice, this integral is evaluated through random sampling. For each realization Xi, the limit-state function G(Xi) is computed. When G(Xi) < 0, structural failure is assumed. After Ns trials, the estimated failure probability is
p ^ f = 1 N s i = 1 N s I G X i 0 ,
where I[⋅] is the indicator function taking a value 1 for failure and 0 otherwise [42,43].
The accuracy of the MC estimate is inversely proportional to the square root of the number of simulations:
ε M C C N s ,
where C is a constant dependent on the variance of the function G(X), indicating that the precision of the method does not depend on the dimensionality of the random space. However, for nonlinear finite-element models, the computational cost becomes prohibitive due to the need for repeated evaluations of G(X) [44].
To improve efficiency, several variance-reduction techniques have been developed, such as Importance Sampling [45] and Adaptive Sampling [46]. A more recent advancement involves the hybrid Monte Carlo (HMC) approach, which integrates soft-computing methods—primarily artificial neural networks (ANNs)—as surrogate models for the limit-state function [47,48,49].
The HMC procedure consists of two stages. In the first stage, the finite-element method (FEM) is used to generate a training and testing dataset for the neural network. The trained back-propagation neural network (BPNN) approximates the explicit limit-state function GNN(X), which is then used in the second stage to perform fast Monte Carlo simulations:
p f H M C = 1 N s i = 1 N s I G N N X i 0 .
This hybrid approach retains the accuracy of the classical MC method while reducing computational time by one to two orders of magnitude [10].
The hybrid Monte Carlo method has proven particularly effective in the reliability assessment of nonlinear steel truss domes susceptible to node snap-through instability. By combining the statistical rigor of the MC method with the approximation capabilities of neural networks, the HMC technique offers a powerful and computationally efficient tool for modern reliability-based structural analysis.

2.4. Methods of Approximation of the Reliability Index

In order to develop analytical relationships describing the dependence between the Hasofer–Lind reliability index (β) and the percentage of ultimate load utilization (ηP = % of Pult) the numerical results obtained for all analyzed structures (SET1–SET4) were combined into a single dataset.
Two subsets were defined:
  • Full Data: Containing all 36 computational points in the range ⟨46%, 100%⟩ of Pult.
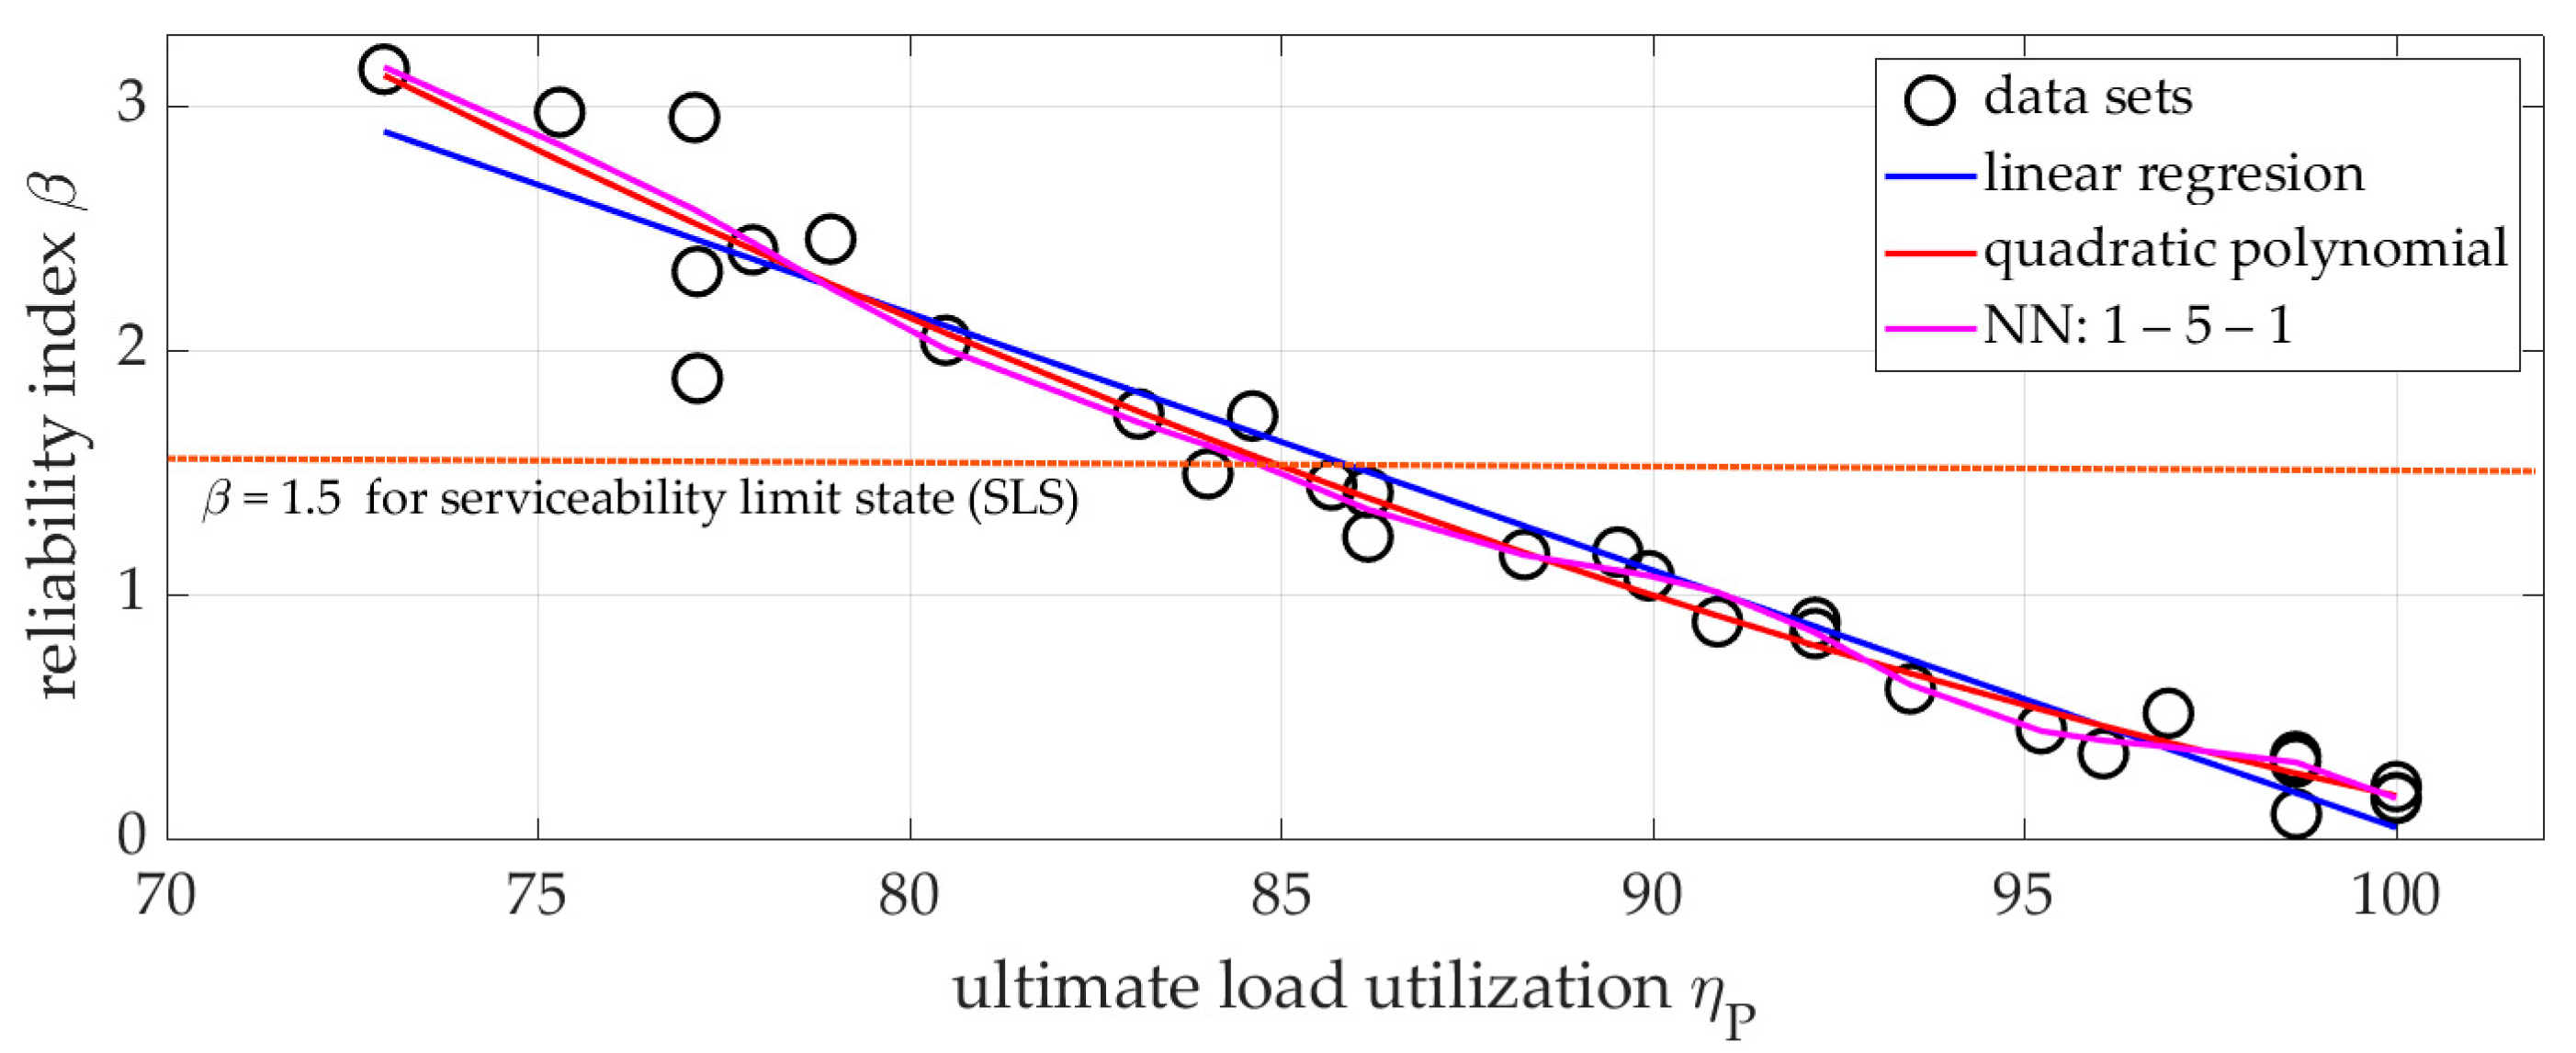
  • Reduced Data: A subset limited to ⟨73%, 100%⟩ of Pult, introduced to minimize the dispersion of β values observed for lower load levels.
Three approximation techniques were employed to describe the functional relationship β = f(ηP):
  • Linear regression, expressed as
β(ηP) = a0 + a1ηP.
2.
Quadratic polynomial, expressed as
β(ηP) = b0 + b1ηP + b2∙(ηP)2
3.
Simple feedforward neural network (NN), with an adaptive architecture of the form 1H1, where H denotes the number of neurons in the hidden layer. The network was trained using the back-propagation algorithm, and the model parameters were selected adaptively so that the Mean Squared Eror (MSE) for training and testing datasets remained comparable, thus avoiding overfitting.
The approximation quality was evaluated based on the mean percentage error (ep) and the correlation coefficient (R) between the predicted and reference β values.
The resulting formulas are presented in Section 3.2, together with their corresponding accuracy metrics.

3. Results and Discussion

This section presents the results of reliability analyses for four spatial truss domes differing in geometry and loading configuration. For each case, the reliability index (β) was determined using various probabilistic methods (FORM, Monte Carlo, hybrid Monte Carlo with neural networks).

3.1. Description of Analyzed Structures

Table 1 summarizes the main geometric characteristics of the analyzed dome structures (SET1–SET4). All structures are made of steel, have a circular plan, and are subjected to vertical loads modeled as random variables with a normal distribution. The geometrical coordinates for all presented constructions are provided in the Supplementary Materials.

3.2. Reliability Assessment Results

3.2.1. SET1

The first analyzed structure (SET1) represents a low-rise steel truss dome that has been repeatedly discussed in the literature as a representative model for nonlinear and probabilistic studies [37,50]. This dome configuration is considered an illustrative example of the node snap-through instability mechanism, making it a valuable benchmark for assessing the reliability of spatial truss systems.
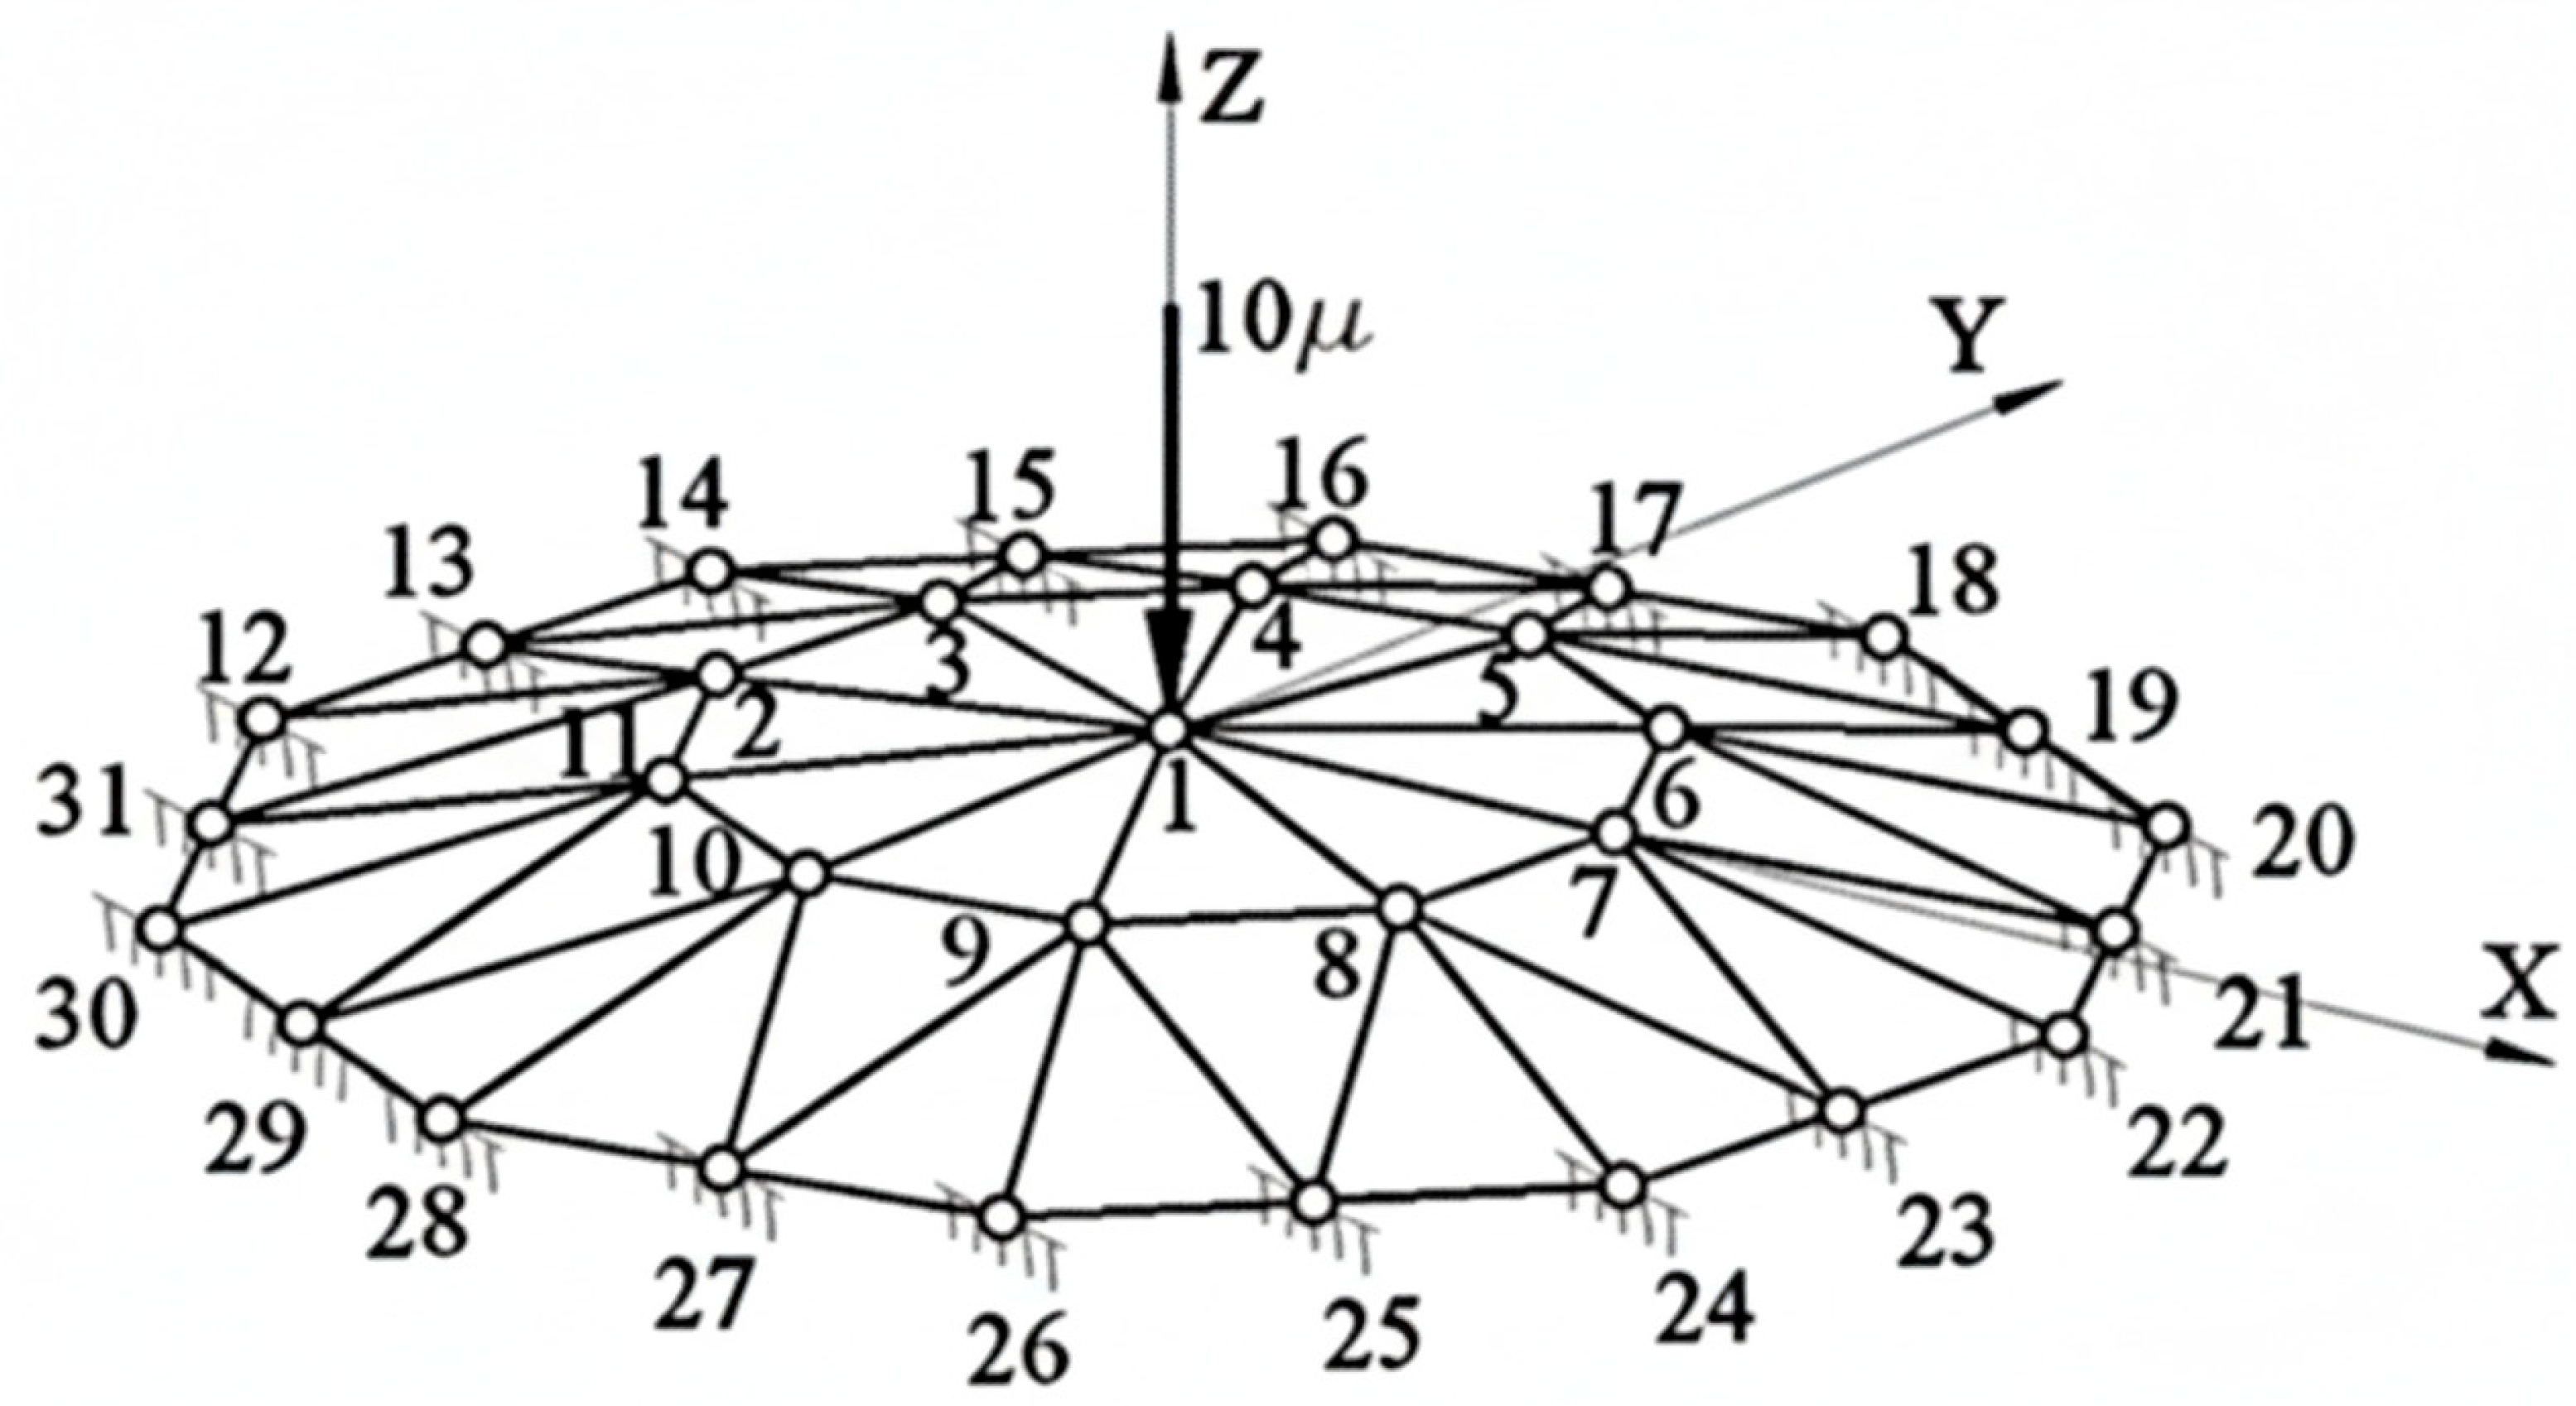
The geometric and material parameters of the dome were adopted from previous works [5,10,50]. The structure is composed of steel tubular members RO168.3 × 10, with the material properties defined as a modulus of elasticity E = 205 GPa and yield strength σY = 235 MPa. The dome height is 8.216 m, and its span is 86 m, which corresponds to typical dimensions used in reliability investigations of shallow truss domes. The structural geometry and the loading scheme are shown in Figure 1.
The reliability assessment was carried out using the HMC method, in which the simulation procedure was supported by NN surrogate model. This approach allows the replacement of time-consuming nonlinear finite-element simulations with fast NN-based evaluations of the limit-state function.
The computed ultimate load of the structure was Pult = 207.4 kN. The obtained values of the Hasofer–Lind reliability index (β) for different loading levels—expressed as percentages of (Pult) are summarized in Table 2. These results reflect the relationship between the utilization degree of the structural capacity and its probabilistic safety level.

3.2.2. SET2

The second analyzed example concerns the reliability assessment of a steel truss structure susceptible to the loss of stability due to the snap-through phenomenon at the node. The geometric and loading scheme of the structure (showed on Figure 2) was adopted from [51], while it should be emphasized that this dome has also been investigated in other studies, e.g., in [6], which confirms its representativeness as a benchmark model for probabilistic analysis.
The structure was designed using RO135×5 circular hollow sections, with all members made of S355NH steel characterized by a yield strength σY = 355 MPa and a modulus of elasticity E = 210 GPa. The support conditions were modeled as pinned fixtures. The reliability analysis was carried out with the First-Order Reliability Method (FORM) using both the implicit limit-state function (βA) and the explicit limit-state function (βB) derived from a neural network model. The structure is defined by a height of 0.524 m and a span of 20 m, while the calculated limit load factor μult amounts to 6.65. Table 3 summarizes the Hasofer–Lind reliability index (β) values for various load levels, presented as percentages of the ultimate load (μult). These data empirically establish the direct relationship between how close a structure is to its capacity limit and its calculated probabilistic safety level.

3.2.3. SET3

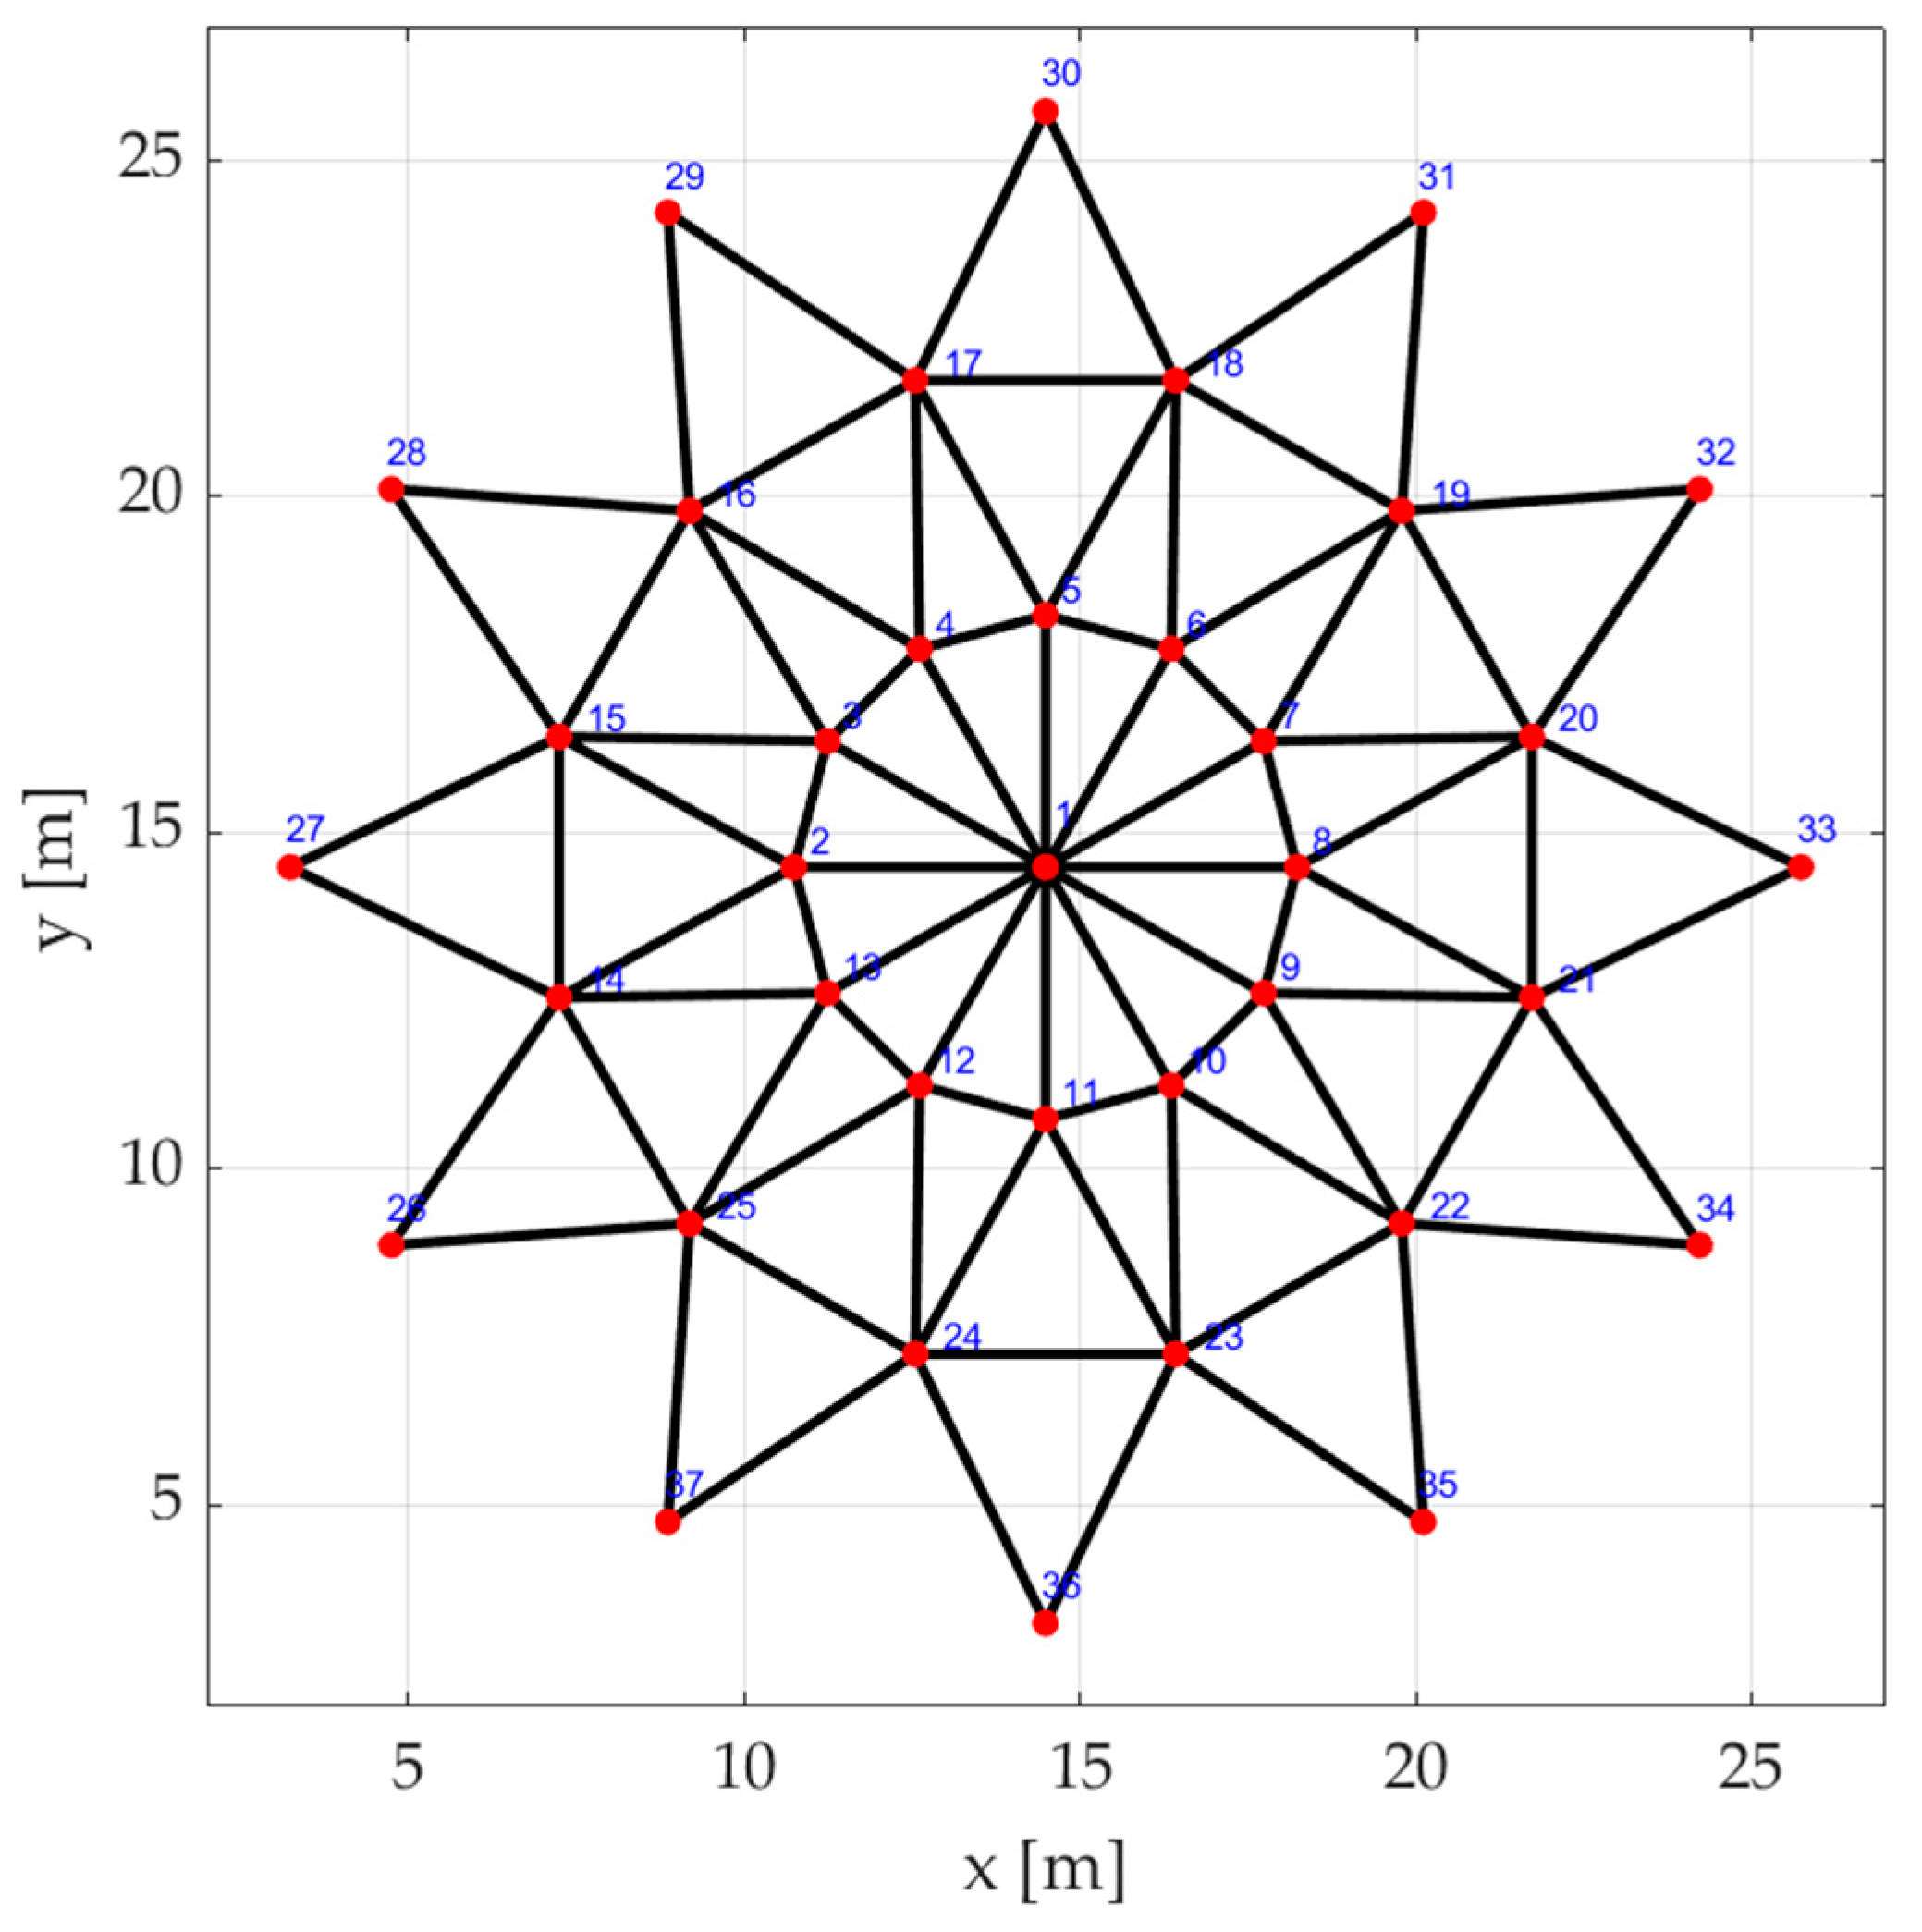
The third analyzed structure (SET3) is a single-layer steel truss dome consisting of 37 nodes and 84 bars (showed on Figure 3). Its geometric layout and loading configuration were adopted from Radoń and Zabojszcza [8], where detailed nonlinear analyses of similar domes were presented. The dome has a height of 0.9 m and a span of 22.5 m, forming a shallow, low-rise configuration that is highly susceptible to the snap-through instability phenomenon.
In the reference study [52], several computational stages were performed: a linear static analysis (LA), a linear buckling analysis (LBA), and a geometrically nonlinear analysis (GNA). Based on these analyses, the ultimate load was determined as Pult = 11.1 kN for the applied vertical load. The present study adopts this value as the reference for the probabilistic reliability evaluation.
The classical Monte Carlo method (MC) was used to estimate the reliability index β for different load levels expressed as percentages of Pult. This approach enabled direct probabilistic estimation without the need for surrogate models, providing a reference dataset for comparison with hybrid and neural-network-assisted techniques used in other sets.
The β–load relationship (Table 4) demonstrates a consistent increase in reliability with decreasing load intensity, confirming the expected probabilistic trend for structures governed by global instability.

3.2.4. SET4

The fourth analyzed structure (SET4) corresponds to a Lamella dome, whose stability and reliability were evaluated with respect to the possibility of snap-through instability at the nodes. The stability of the structure was examined using FEM, while the reliability assessment was performed using FORM [53].
The dome was designed with circular hollow steel members RO180×8, made of S355NH steel characterized by a yield strength fy = 355 MPa and a modulus of elasticity E = 210 GPa. The geometric parameters of the analyzed configuration include a height of 1.484 m and a span of 30 m, corresponding to a low-rise dome geometry typical for spatial truss systems sensitive to snap-through phenomena. The computed limit load for this structure is μult = 17.95. It was additionally assumed that the global instability is not preceded by local buckling of the members.
The obtained Hasofer–Lind reliability index (β) values for various loading levels—expressed as a percentage of μult—are summarized in Table 5. The results indicate a monotonic increase in β with decreasing load ratio, confirming the expected correlation between reduced loading and higher structural safety margins.
The geometric and loading scheme of the analyzed dome is presented in Figure 4.

3.3. Reliability Assessment and Approximation of the Reliability Index

The reliability analyses for all dome configurations (SET1–SET4) produced a consistent relationship between the Hasofer–Lind reliability index (β) and the relative load level expressed as a percentage of the ultimate capacity (% Pult). Despite the geometric and material diversity of the examined domes, the resulting data points formed a coherent trend. At higher load ratios (ηP > 75%), the β values obtained from all sets converge, confirming the dominant nature of the global snap-through instability mechanism. A monotonic decrease in β with increasing load ratio indicates the expected reduction in the safety margin as the structure approaches its limit state.
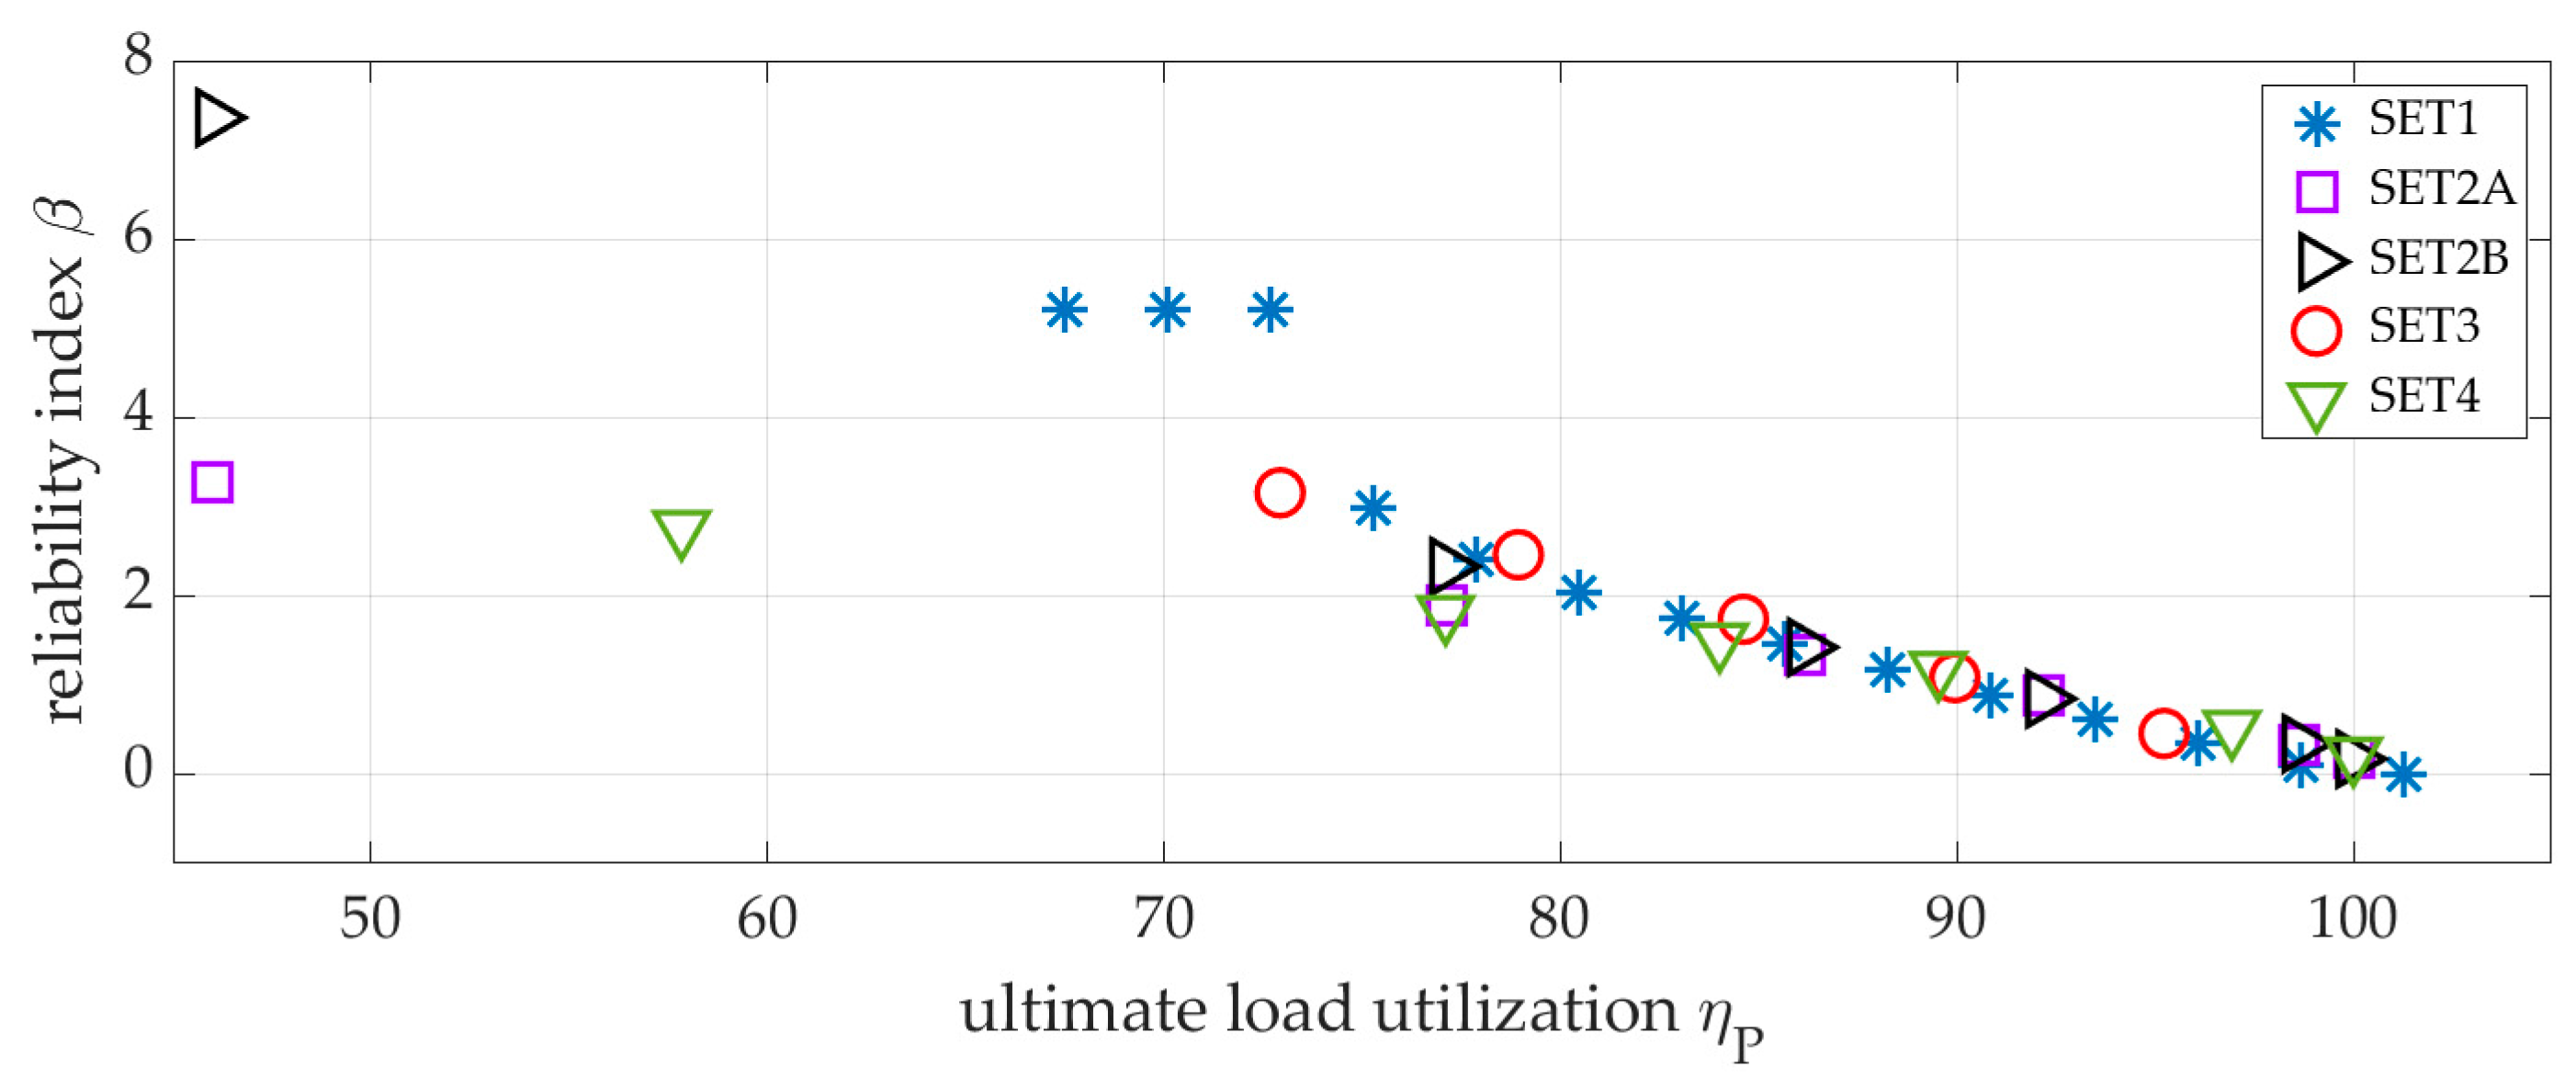
The aggregated results (36 data points) are presented graphically in Figure 5, which plots β as a function of % Pult for all analyzed sets. The diagram reveals a nearly identical slope of the βηP curves for the different computational approaches (FORM, MC, and HMC with NNs), demonstrating that the hybrid and NN-assisted procedures correctly reproduce the probabilistic behavior of the structures while substantially reducing computational effort.
To formulate an analytical description of this relationship, the complete dataset was divided into two subsets:
  • Full Data—Including all results within the range ⟨46%, 100%⟩ of Pult.
  • Reduced Data—Limited to ⟨73%, 100%⟩ of Pult, introduced to minimize the dispersion of reliability index (β) values at low load levels.
Full Data approximation
For the full dataset, linear, quadratic, and neural-network models were applied to approximate β = f(ηP). The comparison of average percentage error (ep) and correlation coefficient (R) is presented in Table 6.
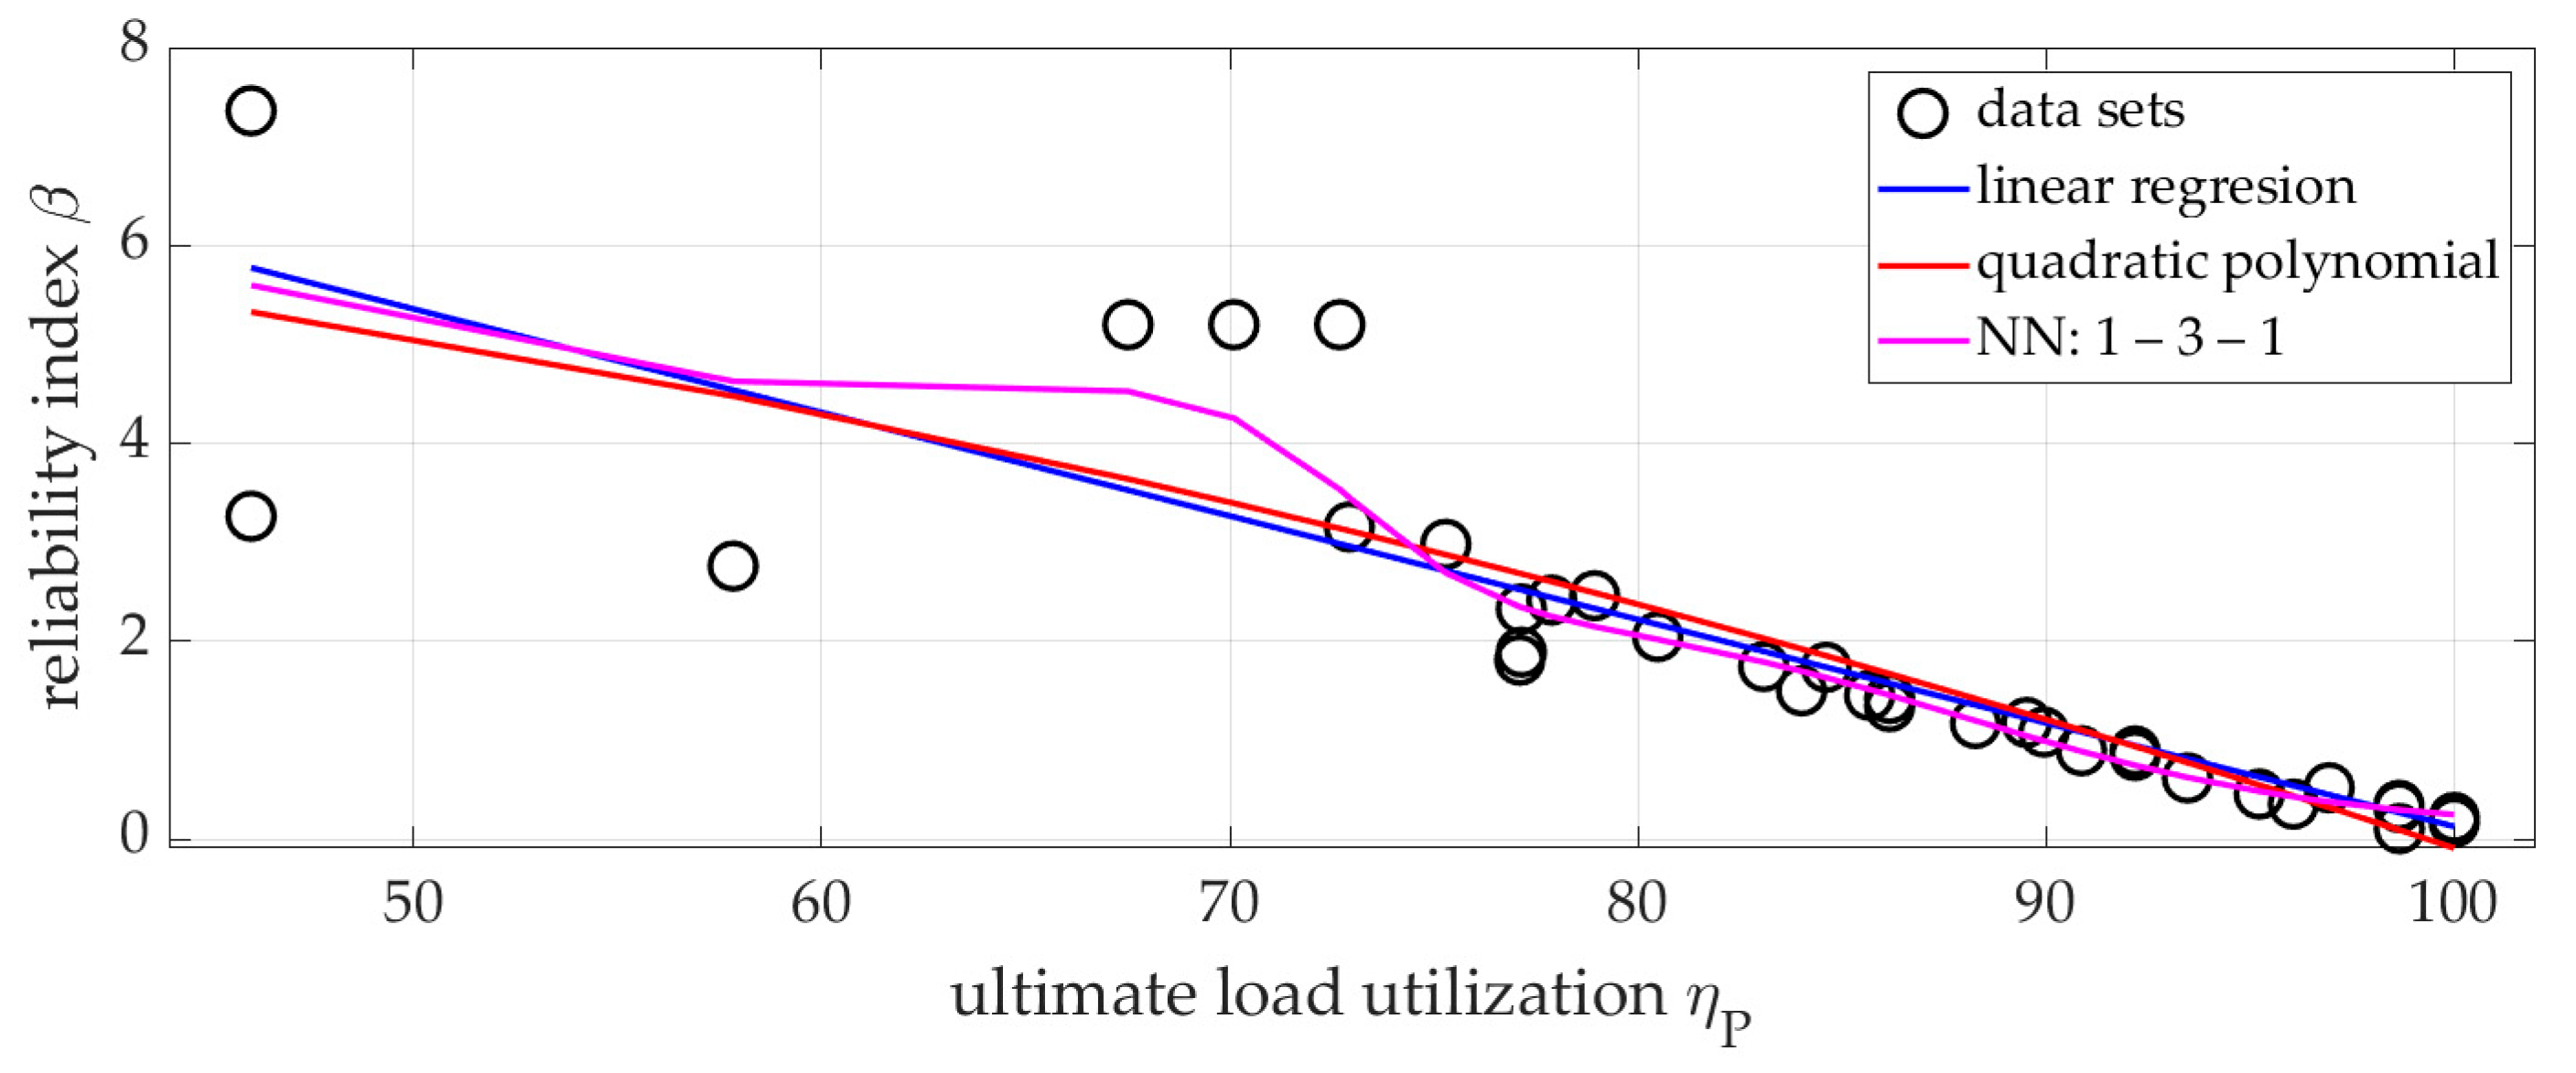
The diagram corresponding to Full Data (Figure 6) shows that all approximation methods capture the general decreasing trend of reliability index (β), yet the neural network provides the highest correlation and lowest mean error, particularly in the mid-load range (70–90% Pult).
Reduced Data approximation
Because the scatter of β was larger for low loads, a second approximation was performed using the Reduced Data subset (73–100% Pult). The obtained results, summarized in Table 7, exhibit significantly improved accuracy and correlation.
The graph (Figure 7) confirms that, in the high-load range, the curves produced by the three approximation methods are almost coincident. The linear and neural-network models yield particularly stable estimations of the reliability index (β), whereas the quadratic polynomial slightly overestimates the reliability index (β) at intermediate load ratios. The figure also illustrates the β dependence on the percentage of ultimate load (ηP) and indicates the serviceability limit-state level at β = 1.5.
High correlation coefficients (R > 0.97) indicate that the developed formulas accurately describe the probabilistic behavior of low-rise truss domes within the operational load range.
A practical comparison of the approximation methods reveals notable differences between accuracy and computational cost. For the full dataset (46–100% Pult), the neural network provided the highest correlation (R ≈ 0.91) but required additional training and model selection. The linear and quadratic models, while slightly less accurate, involve no training cost and can be applied immediately.
Within the reduced and engineering-relevant range (73–100% Pult), the models performed almost identically: the linear approximation achieved R = 0.9761, compared to R = 0.9758 for the neural network. This indicates that, in the operational domain of the structures, simple linear or quadratic formulas are sufficient, offering high accuracy at negligible computational expense. Neural-network-based models become advantageous mainly when the dataset spans a wide load range, includes strong nonlinearities, or when higher precision justifies the additional computational complexity.
Despite the different geometries, dimensions, load configurations, and result formats, it was found that after converting to percentage share, the reliability index (β) results overlap. A graphical summary of the index for the full set, and the summed tables for SET1–SET4, allowed for obtaining 36 pseudo-measurement points. as shown in Figure 5.
Further research will involve expanding the database of structures susceptible to node snap-through—including the analysis of structures with different numbers of bars, nodes, and geometrical parameters. It is planned to improve the computational models by increasing the number of random variables in the mathematical model description, defining probability density functions that reflect the real behavior of the structures and correlation between random variables take into account. In addition, further analyses will be carried out for more complex loading conditions such as snow load data obtained from meteorological stations in a given area over a specified period. Improving the models will allow for the reflection of the real structural work.
Furthermore, statistical analysis of the reliability index (β) for other types of engineering structures is planned.

Analysis of the Causes of Differences

The differences between the β values obtained using FORM, MC, and HMC stem from the distinct ways these methods represent the limit-state function G(X) and from the mechanical behavior of the structure near the critical point. FORM relies on local linear or quadratic approximations and therefore assumes regularity and smooth curvature of the limit-state surface. This makes it more sensitive to strong nonlinearities, especially in snap-through-prone structures where the curvature of G(X) = 0 increases sharply near the limit point. In contrast, the classical Monte Carlo method samples the full nonlinear response directly, without imposing any local approximations.
Differences between MC and HMC arise from the accuracy of the neural-network surrogate GNN(X). Although the network captures the global character of the limit state very well, small deviations may occur in regions with steep gradients, causing slight shifts in the estimated reliability index β.
Mechanically, the 73–100% Pult range corresponds to the segment of the equilibrium path approaching the snap-through point. In this region, the structural response is dominated by a single instability mechanism, and geometric nonlinearities govern the global behavior. Consequently, the relationship between load and displacement becomes more monotonic and predictable, which reduces variability between methods and leads to the convergence of β values. At lower load levels, the structure behaves in a quasi-linear regime, where small modeling differences more easily propagate into discrepancies in β.
Thus, the 73–100% load range represents the domain in which the snap-through mechanism dominates, making the results of different approximation strategies more consistent and mechanically meaningful.

4. Conclusions

In summary, the finite-element method can act as a precise generator of training data that enables the construction of surrogate models based on neural networks. The combination of FEM and NN creates an effective tool for structural reliability analysis, combining the accuracy of numerical analysis with the speed and flexibility of machine learning methods.
A statistical assessment of the reliability index was attempted for a specific type of structure with shared characteristics. Based on a small but methodologically varied sample, promising results were obtained. Using various probabilistic methods for steel dome structures with different geometries, dimensions, load configurations, and result formats, it was found that after converting to percentage share, the values of the reliability index (β) overlap. For dome loads in the range of 73–100%, the reliability index can be estimated with reasonable accuracy (error) compared to standard methods. The obtained approximation functions allow for easy determination of the percentage of the maximum load that ensures safe operation. In addition, they allow us to indicate at what load level the reliability index reaches the standard level.
Furthermore, the comparative analysis of approximation techniques demonstrated that a simple second-order polynomial provides a robust and computationally efficient representation of the relationship between β and the load ratio ηP. The use of basic neural networks was also examined; however, their application proved unnecessary in this case, since the predictive accuracy was similar to that of the simpler polynomial model, while the computational effort was significantly higher. This suggests that, for this class of structures, classical regression techniques remain an adequate and practical tool for engineering reliability estimation.
The proposed approach can be used in engineering practice to predict potential damage and failures in the structure to assess the safety level of low-rise bar dome structures or to optimize material usage and construction costs.

Supplementary Materials

The following supporting information can be downloaded at https://doi.org/10.5281/zenodo.17353625, accessed on 10 November 2025. Dataset: Coordinates of all Nodes for Spatial Truss Domes (SET1–SET4)—Data for Structural Reliability Analysis.

Author Contributions

Conceptualization, B.P.-S. and A.D.; methodology, B.P.-S. and A.D.; software, B.P.-S.; validation, B.P.-S.; formal analysis, A.D.; investigation, A.D.; resources, B.P.-S. and A.D.; data curation, B.P.-S.; writing—original draft preparation, B.P.-S.; writing—review and editing, A.D. and P.G.K.; visualization, B.P.-S.; supervision, B.P.-S., P.G.K. and A.D.; project administration, P.G.K.; funding acquisition, P.G.K. All authors have read and agreed to the published version of the manuscript.

Funding

This research received no external funding.

Institutional Review Board Statement

Not applicable.

Informed Consent Statement

Not applicable.

Data Availability Statement

The original contributions presented in this study are included in the article. Further inquiries can be directed to the corresponding author.

Conflicts of Interest

The authors declare no conflicts of interest.

Abbreviations

The following abbreviations are used in this manuscript:
ANNArtificial Neural Network
BPNNBack-Propagation Neural Network
FORMFirst-Order Reliability Method
FEMFinite-Element Method
GNAGeometrically Nonlinear Analysis
HMCHybrid Monte Carlo Method
LALinear Static Analysis
LBALinear Buckling Analysis
MCClassical Monte Carlo Method
MSEMean Squared Eror
SLSServiceability Limit State

References

  1. Ditlevsen, O.; Madsen, H. Structural Reliability Methods; John Wiley & Sons: Chichester, UK, 1996. [Google Scholar]
  2. Melchers, R.E. Structural Reliability Analysis and Predictions, 2nd ed.; John Wiley & Sons: Chichester, UK, 1999. [Google Scholar]
  3. Nowak, A.; Collins, K. Reliability of Structures, 2nd ed.; CRC Press: New York, NY, USA, 2013. [Google Scholar]
  4. Harr, M.E. Reliability-Based Design in Civil Engineering; Dover Publications Inc.: New York, NY, USA, 2000. [Google Scholar]
  5. Dudzik, A.; Potrzeszcz-Sut, B. The Structural Reliability Analysis Using Explicit Neural State Functions. MATEC Web Conf. 2019, 262, 10002. [Google Scholar] [CrossRef]
  6. Dudzik, A.; Potrzeszcz-Sut, B. Hybrid Approach to the First Order Reliability Method in the Reliability Analysis of a Spatial Structure. Appl. Sci. 2021, 11, 648. [Google Scholar] [CrossRef]
  7. Dudzik, A. Reliability Assessment of Steel-Aluminium Lattice Tower. IOP Conf. Ser. Mater. Sci. Eng. 2017, 245, 032072. [Google Scholar] [CrossRef]
  8. Zabojszcza, P.; Radoń, U. The Impact of Node Location Imperfections on the Reliability of Single-Layer Steel Domes. Appl. Sci. 2019, 9, 2742. [Google Scholar] [CrossRef]
  9. Radoń, U.; Szaniec, W.; Zabojszcza, P. Probabilistic Approach to Limit States of a Steel Dome. Materials 2021, 14, 5528. [Google Scholar] [CrossRef]
  10. Potrzeszcz-Sut, B. Reliability Analysis of Shell Truss Structure by Hybrid Monte Carlo Method. J. Theor. Appl. Mech. 2020, 58, 469–482. [Google Scholar] [CrossRef]
  11. Grubišić, M.; Ivošević, J.; Grubišić, A. Reliability Analysis of Reinforced Concrete Frame by Finite Element Method with Implicit Limit State Functions. Buildings 2019, 9, 119. [Google Scholar] [CrossRef]
  12. Kubicka, K.; Obara, P.; Radoń, U.; Szaniec, W. Assessment of Steel Truss Fire Safety in Terms of the System Reliability Analysis. Arch. Civ. Mech. Eng. 2019, 19, 417–427. [Google Scholar] [CrossRef]
  13. Kubicka, K.; Radoń, U. The Impact of Support Type on the Reliability of Steel Trusses Subjected to the Action of a Fire. Appl. Sci. 2020, 10, 7916. [Google Scholar] [CrossRef]
  14. PN-EN 1993; Eurocode 3: Design of Steel Structures. European Committee for Standardization (CEN): Brussels, Belgium, 2006.
  15. Hasofer, A.; Lind, N. Exact and Invariant Second-Moment Code Format. J. Eng. Mech. Div. ASCE 1974, 100, 111–121. [Google Scholar] [CrossRef]
  16. Rackwitz, R.; Fiessler, B. Structural Reliability under Combined Random Load Sequences. Comput. Struct. 1978, 9, 489–494. [Google Scholar] [CrossRef]
  17. Cornell, A. A Probability-Based Structural Code. J. Am. Concr. Inst. 1969, 66, 974–985. [Google Scholar]
  18. Hohenbichler, M.; Gollwitzer, S.; Kruse, W.; Rackwitz, R. New Light on First and Second Order Reliability Methods. Struct. Saf. 1987, 4, 267–284. [Google Scholar] [CrossRef]
  19. Der Kiureghian, A.; De Stefano, M. Efficient Algorithm for Second-Order Reliability Analysis. J. Eng. Mech. 1991, 117, 2904–2923. [Google Scholar] [CrossRef]
  20. Yan-Gang, Z.; Tetsuro, O. A General Procedure for First/Second-Order Reliability Method (FORM/SORM). Struct. Saf. 1999, 21, 95–112. [Google Scholar]
  21. Rossi, L.; Winands, M.H.M.; Butenweg, C. Monte Carlo Tree Search as an Intelligent Search Tool in Structural Design Problems. Eng. Comput. 2021, 38, 3219–3236. [Google Scholar] [CrossRef]
  22. Metropolis, N. The Beginning of the Monte Carlo Method; Los Alamos Science: Los Alamos, NM, USA, 1987; Special Issue; pp. 125–130. [Google Scholar]
  23. Cardoso, J.; Almeida, J.; Dias, J.; Coelho, P. Structural Reliability Analysis Using Monte Carlo Simulation and Neural Networks. Adv. Eng. Softw. 2008, 39, 505–513. [Google Scholar] [CrossRef]
  24. Hasani, H.; Freddi, F. Artificial Neural Network-Based Automated Finite Element Model Updating with an Integrated Graphical User Interface for Operational Modal Analysis of Structures. Buildings 2024, 14, 3039. [Google Scholar] [CrossRef]
  25. Beskopylny, A.; Lyapin, A.; Anysz, H.; Meskhi, B.; Veremeenko, A.; Mozgovoy, A. Artificial Neural Networks in Classification of Steel Grades Based on Non-Destructive Tests. Materials 2020, 13, 2445. [Google Scholar] [CrossRef]
  26. Kaliszuk, J. Hybrid Monte Carlo Method in the Reliability Analysis of Structures. Comput. Assist. Mech. Eng. Sci. 2011, 18, 205–216. [Google Scholar]
  27. Deng, J.; Gu, D.; Li, X.; Qi Yue, Z. Structural Reliability Analysis for Implicit Performance Functions Using Neural Network. Struct. Saf. 2005, 27, 25–48. [Google Scholar] [CrossRef]
  28. Mises, R.V.; Ratzersdorfer, J. Die Knicksicherheit von Fachwerken. ZAMM J. Appl. Math. Mech. Z. Für Angew. Math. Und Mech. 1925, 5, 218–235. [Google Scholar] [CrossRef]
  29. Mirski, J.Z. The Origin and Morphology of Bar Domes in the Context of Geometric Shaping of Architectural Forms. Ph.D. Dissertation, Kielce University of Technology Publishing House, Kielce, Poland, 2003. (In Polish). [Google Scholar]
  30. Thai, H.-T. Machine Learning for Structural Engineering: A State-of-the-Art Review. Structures 2022, 38, 448–491. [Google Scholar] [CrossRef]
  31. Đorđević, F.; Marinković, M. PINN Surrogate Model for Nonlinear Equilibrium Path Analysis of von Mises Shallow Truss. J. Big Data 2025, 12, 103. [Google Scholar] [CrossRef]
  32. Mai, H.T.; Lieu, Q.X.; Kang, J.; Lee, J. A Robust Unsupervised Neural Network Framework for Geometrically Nonlinear Analysis of Inelastic Truss Structures. Appl. Math. Model. 2022, 107, 332–352. [Google Scholar] [CrossRef]
  33. Manguri, A.; Magisano, D.; Jankowski, R. Gradient-Based Weight Minimization of Nonlinear Truss Structures with Displacement, Stress, and Stability Constraints. Int. J. Numer. Methods Eng. 2025, 126, e70096. [Google Scholar] [CrossRef]
  34. Mai, H.T.; Lee, S.; Kang, J.; Lee, J. A Damage-Informed Neural Network Framework for Structural Damage Identification. Comput. Struct. 2024, 292, 107232. [Google Scholar] [CrossRef]
  35. Ojha, V.; Pantò, B.; Nicosia, G. Adaptive Search Space Decomposition Method for Pre- and Post- Buckling Analyses of Space Truss Structures. Eng. Appl. Artif. Intell. 2023, 117, 105593. [Google Scholar] [CrossRef]
  36. Kowalczyk, P.; Rojek, J.; Stocki, R.; Bednarek, T.; Tauzowski, P.; Lasota, R.; Lumelskyy, D.; Wawrzyk, K. NUMPRESS−Integrated Computer System for Analysis and Optimization of Industrial Sheet Metal Forming Processes. Hut. Wiadomości Hut. 2014, 81, 55–63. [Google Scholar]
  37. Radoń, U. Zastosowanie Metody FORM w Analizie Niezawodności Konstrukcji Kratowych Podatnych Na Przeskok; Wydawnictwo Politechniki Świętokrzyskiej: Kielce, Poland, 2012. [Google Scholar]
  38. Metropolis, N.; Ulam, S. The Monte Carlo Method. J. Am. Stat. Assoc. 1949, 44, 335–341. [Google Scholar] [CrossRef]
  39. Hurd, C. A Note on Early Monte Carlo Computations and Scientific Meetings. Ann. Hist. Comput. 1985, 7, 141–155. [Google Scholar] [CrossRef]
  40. Robert, C.; Casella, G. Monte Carlo Statistical Methods; Springer: New York, NY, USA, 1999. [Google Scholar]
  41. Rubinstein, R.; Kroese, D. Simulation and the Monte Carlo Method; Wiley-Interscience: New York, NY, USA, 2008; ISBN 0-470-17794-2. [Google Scholar]
  42. Kallenberg, O. Foundations of Modern Probability; Springer: New York, NY, USA, 2002. [Google Scholar]
  43. Olofsson, P.; Andersson, M. Probability, Statistics, and Stochastic Processes, 2nd ed.; Wiley-Interscience: New York, NY, USA, 2012. [Google Scholar]
  44. Jelic, A.; Baitsch, M.; Hartmann, D.; Spitzlei, K.; Ballnus, D. Distributed Computing of Failure Probabilities for Structures in Civil Engineering. In Proceedings of the X. International Conference on Computing in Civil and Building Engineering, Weimar, Germany, 2–4 June 2004. [Google Scholar]
  45. Doliński, K. Importance Sampling Techniques in Reliability Calculation; IPPT PAN: Warszawa, Poland, 1988; Volume 37. [Google Scholar]
  46. Carpentier, A.; Munos, R. Adaptive Stratified Sampling for Monte-Carlo Integration of Differentiable Functions. In Proceedings of the Advances in Neural Information Processing Systems 25 (NIPS 2012), Lake Tahoe, NV, USA, 3–6 December 2012. [Google Scholar]
  47. Papadrakakis, M.; Lagaros, N. Reliability-Based Structural Optimization Using Neural Networks and Monte Carlo Simulation. Comput. Methods Appl. Mech. Eng. 2002, 191, 3491–3507. [Google Scholar] [CrossRef]
  48. Hurtado, J.; Alvarez, D. Reliability Assessment of Structural Systems Using Neural Networks. In Proceedings of the (CDROM) European Congress on Computational Methods in Applied Sciences and Engineering, ECCOMAS-2000, Barcelona, Spain, 11–14 September 2000. [Google Scholar]
  49. Kaliszuk, J.; Waszczyszyn, Z. Reliability Analysis of a Steel Girder by the Hybrid Monte Carlo Method. Progress in steel, composite and aluminium structures. In Proceedings of the 11th International Conference on Metal Structures, Rzeszów, Poland, 21–23 June 2006; pp. 843–847. [Google Scholar]
  50. Waszczyszyn, Z.; Cichoń, C.; Radwańska, M. Stability of Structures by Finite Element Methods; Elsevier: Amsterdam, The Netherlands, 1994. [Google Scholar]
  51. Dudzik, A. Impact of the Mathematical Model Description on the Assessment of the Reliability of Structural Elements. IOP Conf. Ser. Mater. Sci. Eng. 2017, 245, 062055. [Google Scholar] [CrossRef]
  52. Radoń, U.; Zabojszcza, P. Stability Analysis of the Single-Layer Dome in Probabilistic Description by the Monte Carlo Method. J. Theor. Appl. Mech. 2020, 58, 425–436. [Google Scholar] [CrossRef]
  53. Dudzik, A.; Radoń, U. The Evaluation of Algorithms for Determination of the Reliability Index. Arch. Civ. Eng. 2015, LXI, 133–147. [Google Scholar] [CrossRef]
Figure 1. Geometric and loading scheme of the SET1 structure.
Applsci 15 12060 g001
Figure 2. Geometric and loading scheme of the SET2 structure.
Applsci 15 12060 g002
Figure 3. Geometric scheme of the SET3 structure—drawn based on [52].
Applsci 15 12060 g003
Figure 4. Geometric and loading scheme of the SET4 structure.
Applsci 15 12060 g004
Figure 5. Graphical presentation of the Full Data of results (SET1-SET4).
Applsci 15 12060 g005
Figure 6. Comparison of reliability index (β) approximations for Full Data.
Applsci 15 12060 g006
Figure 7. Comparison of reliability index (β) approximations for reduced data.
Applsci 15 12060 g007
Table 1. Geometric statistics of trusses.
SET1SET2SET3SET4
Number of nodes13313761
Number of bars2470120150
Span (X) [m]80.6020.0022.5030.00
Width (Y) [m]100.0019.0222.5028.54
Height (Z) [m]8.220.520.901.49
Table 2. SET1—Values of the Hasofer–Lind reliability index (β) for different load levels.
Computation Point123456
P [kN]207.40212.73200.90189.09188.47177.27
ηP100.00102.5796.8791.1790.8785.47
reliability index (β)-1.442.0563.1283.4315.199
Table 3. SET 2: Values of the Hasofer–Lind reliability index (β).
Computation Point123456
μ6.656.566.135.735.133.06
ηP10098.6592.1886.1777.1445.98
reliability index βA0.1770.3200.8921.3401.8913.264
reliability index βB0.1710.3430.8461.4232.2387.361
Table 4. SET3—Values of the Hasofer–Lind reliability index (β) for different load levels.
Computation Point123456
P [kN]11.1010.579.9849.3928.7628.095
ηP100.0095.2389.9584.6178.9472.93
reliability index (β)-0.4571.0831.7372.4613.156
Table 5. SET4—Values of the Hasofer–Lind reliability index (β) for different load levels.
Computation Point123456
μ17.9517.4016.0715.0813.8410.38
ηP100.0097.0589.0184.0177.0757.83
reliability index (β)0.190.481.101.481.892.81
Table 6. Comparison of accuracy metrics for reliability index (β) approximation models (Full Data range: 46–100% Pult).
Approx MethodMean Ep %Correlation RProposed Formula
Linear function25.98060.8649β(ηP) = 10.5866 − 0.1046 ηP
Quadratic polynomial27.81160.8708β(ηP) = 6.8551 − 0.0023 ηP + 0.0007 (ηP)2
Simple NN21.15100.9096Hidden formula of NN: 1–3–1
Table 7. Comparison of accuracy metrics for reliability index (β) approximation models (Reduced Data range: 73–100% Pult).
Approx MethodMean Ep %Correlation RProposed Formula
Linear function3.420.9761β(ηP) = 10.5761 − 0.1052 ∙ ηP
Quadratic polynomial 4.890.9887β(ηP) = 22.5385 − 0.3808 ∙ ηP + 0.0016 ∙ ηP 2
Simple NN4.030.9758Hidden formula of NN: 1–5–1
Disclaimer/Publisher’s Note: The statements, opinions and data contained in all publications are solely those of the individual author(s) and contributor(s) and not of MDPI and/or the editor(s). MDPI and/or the editor(s) disclaim responsibility for any injury to people or property resulting from any ideas, methods, instructions or products referred to in the content.