Article

Comparative Analysis of Driving Performance and Visual and Physiological Responses Between Professional and Civilian Drivers in Simulated Environments

1
Department of Vehicle Production and Engineering, Széchenyi István University, H-9026 Győr, Hungary
2
Institute of the Information Society, Ludovika University of Public Service, H-1083 Budapest, Hungary
3
Department of Civil & Environmental Engineering, Technion Israel Institute of Technology, Haifa 32000, Israel
4
Department of Civil Engineering and Architecture, University of Catania, Via S. Sofia, 64-95123 Catania, Italy
*
Author to whom correspondence should be addressed.
Appl. Sci. 2025, 15(22), 12024; https://doi.org/10.3390/app152212024 (registering DOI)
Submission received: 20 September 2025 / Revised: 31 October 2025 / Accepted: 5 November 2025 / Published: 12 November 2025
(This article belongs to the Special Issue Road Safety in Sustainable Urban Transport)

Abstract

Current research and development in understanding road users’ driving behaviors play a key role in improving traffic safety. Recently, several driving simulators have been employed as a suitable approach to investigate several drivers’ responses in challenging traffic scenarios. Although professional drivers represent a particular category among driving populations, the body of literature about their comparative behavioral and psychological characteristics remains limited. This study examined the differences in driving performance and visual and physiological responses between civilian and professional drivers in a simulated environment. A total of 30 drivers, with an equal split between professional and civilian categories, took part in a series of driving simulations. The simulations incorporated various infrastructure types, including four cone avoidance tasks and a high-speed motorway task. This study collected comprehensive data on performance metrics, hand usage, heart rate, and eye movements. Eye-tracking technology was used to measure visual attention. The findings revealed that during cone avoidance scenarios, civilian drivers exhibited a similar performance, visual behavior, and physiological response, except for the speed, experiment duration, and throttle, to professional drivers. In the motorway scenario, all metrics showed no significant difference between the two driver groups. These results highlight the need for cautious interpretation, particularly given the limitations of the sample. Revalidation is needed in larger studies, especially for understanding the differences between drivers’ metrics, which is crucial to elevate drivers’ safety, and assessing training programs in Hungary.

1. Introduction

1.1. Drivers’ Attention and Eye-Tracking Metrics

In recent years, the study of driver behavior has gained significant attention due to its implications for road safety. Drivers face several challenges in road traffic. One of the commonly known challenges is distraction. Driver distraction, characterized as a shift in attention from critical driving tasks to secondary activities, constitutes a significant component of the broader issue of driver inattention [1]. This phenomenon encompasses a range of attentional diversions, notably driver-diverted attention, which involves engagement in both driving-related tasks and non-driving-related activities (NDRTs) [2]. Distraction negatively impacts activities essential for safe driving, often leading to compromised decision making and delayed reaction times [3].
According to the National Highway Traffic Safety Administration (NHTSA), distractions are categorized into four distinct types: visual, auditory, biomechanical (manual or physical), and cognitive [4]. Visual distractions occur when drivers lose road awareness due to focusing on non-road visual targets, while auditory distractions stem from external sounds or signals that divert attention [5]. Manual distractions, such as interacting with devices instead of maintaining control of the steering wheel, further reduce reaction time and situational awareness [6]. Cognitive distractions involve internal thoughts that detract from the driver’s focus, resulting in a “look at but not see” effect, where drivers appear visually attentive but fail to process critical visual information.
Eye-tracking technology and algorithmic analysis of glance behavior have emerged as pivotal tools for quantifying driver inattention, even in cases where drivers demonstrate visual spare capacity or exhibit off-target glances [7]. Research has demonstrated a significant correlation between fixation rate, accident rates, and the complexity of road conditions [8]. This finding highlights the critical role of eye fixation in understanding drivers’ attention and inattention. Further investigations have revealed that NDRTs have varying impacts on driver behavior. For instance, auditory and audiovisual stimuli have been found to elicit faster reaction times compared with visual-only information, emphasizing the importance of multimodal interaction design for minimizing distraction [9].
Naturalistic driving studies have also explored the influence of different input and control modalities on driver behavior. Our previous study gave detailed data on fixation points and detected changes in pupil diameter, enabling the monitoring of driver distraction and estimating cognitive load during comparison tests [10].
NDRTs require the allocation of visual attention, which can be quantified using eye-tracking technology through metrics such as the total eyes-off-road time (TEORT). The TEORT measures the duration during which the driver’s gaze is directed away from the road, often focusing on areas of interest (AOIs) like in-vehicle information systems (IVISs) [11]. Eye tracking has proven to be a valuable tool for assessing user behavior during driving tasks, as it facilitates precise measurements of visual attention and behavioral responses in both real-world and simulated driving scenarios. Notably, gaze shifts, AOI fixation times, and pupillometry data are commonly used to assess drivers’ cognitive load and engagement levels [12].
The primary eye-tracking metrics extensively utilized in the literature include duration, fixation, pointing, pupil diameter, and cascades [13]. For instance, a study by Le et al. validated eye-tracking metrics to assess cognitive distraction among drivers by comparing simulated and naturalistic conditions [14]. Furthermore, Marquart et al. discussed various eye and glance measures and their relevance to assessing driver mental workload [15]. They noted that increased workload correlates with longer blink latency and fixation durations, enlarged pupil size, and inconsistent results regarding blink rates. The paper analyzed two key metrics of fixations as follows [16]. While fixation count indicates the number of times a person focuses on a specific area, reflecting visual engagement and attention, fixation duration measures how long the gaze remains fixed on a point, with longer durations suggesting deeper cognitive engagement. Additionally, another study explored how eye gaze metrics like entropy and gaze transitions could detect cognitive loads in simulated environments [17]. They found that professional drivers exhibited higher entropy values during high-cognitive-load tasks, reflecting greater visual-scanning behaviors under stress.

1.2. Psychophysiological Metrics and Drivers’ Performance

In addition to eye-tracking sensors, there are other physiological sensors used for driver load and fatigue detection. Several researchers found that basic heart rate (HR) more robustly differentiates levels of cognitive workload during driving than heart rate variability (HRV) [18]. This demonstrates HR’s enhanced sensitivity in conditions of increased cognitive demand.
Recent research highlights the potential of psychophysiological and motion capture methods for assessing driver stress, cognitive states, and motor performance in simulated environments [19]. A dynamic hybrid choice model was developed that integrates physiological measures with self-reported indicators to quantify stress in simulated driving, demonstrating improved predictive accuracy compared with conventional models [20]. Complementing this, other researchers conducted a systematic review of physiological indicators of situational awareness, identifying eye tracking as the most reliable modality, while cardiovascular and EEG measures showed mixed but promising results [21]. Extending these perspectives to motor assessment, others have compared marker-based, inertial, and markerless motion capture systems in tracking upper-body movements of prosthesis users, finding that IMU-based systems offer robust accuracy for most joints, while Kinect performs better for elbow kinematics but shows weaker reliability overall [22]. Together, these studies underscore the value of integrating physiological and kinematic sensing approaches to capture both internal states and external performance, thereby advancing human factors research in driving and rehabilitation contexts.

1.3. Professional Drivers’ Studies

Increasing attention to professional drivers has been noticed in the literature in recent years. For example, a study compared distraction levels between private vehicle drivers and taxi drivers [23]. The study demonstrated that taxi drivers exhibit higher distraction levels compared with private vehicle drivers. Furthermore, factors like a history of damage or injury accidents significantly influenced their distraction. Another study evaluated cognitive and safety challenges faced by taxi drivers compared with general drivers. Taxi drivers exhibited a greater cognitive load when managing simultaneous demands such as passenger interaction and navigation [24]. Another study highlighted differences in fatigue management strategies between professional and non-professional drivers [25]. Professional drivers reported using pre-planned methods like rest stops, while non-professionals relied on tactical measures like opening windows, which lacked long-term effectiveness. Moreover, professional drivers exhibited reduced cognitive focus during higher-workload tasks, suggesting that monitoring tools like eye tracking could enhance our understanding of distraction and its impact on professional driving performance.
Dorn analyzed the effects of advanced and standard police driver training on performance and stress in simulations [26]. The results indicated that advanced training improves safety, but stress management remains crucial for optimal driving performance. Some researchers investigated the impact of early driver training in France, comparing young drivers’ responses in simulated accidents with those of traditionally trained and experienced drivers [27]. The study found that early trained drivers showed better evasive actions and control, indicating enhanced visuomotor skills in challenging situations. Another study explored the differences in sustained and divided attention between novice and experienced drivers using a computerized task known as the Sustained Attention to Response Task (SART) [28]. Experienced drivers displayed significantly higher performance in both sustained and divided attention tasks compared with novice drivers.

1.4. Research Gap and Study Aim

Professional drivers can be divided into several groups and may have different working environments. In Hungary, no previous study has investigated professional drivers’ gaze behaviors nor examined their driving performance compared with general drivers. In this context, our study contributes to the literature by extending the use of eye-tracking technology and incorporating heart rate monitoring and vehicle telemetry data to measure the physiological and behavioral responses of professional drivers under simulated conditions. This approach aimed to delineate the performance of trained police drivers more distinctly from that of civilian drivers in Hungary.
In this study, we investigated the following hypotheses:
H1: 
Civilian drivers have lower driving performance than professional drivers (especially trained delegation drivers from the Personal Protection Division of the Hungarian Police Service).
H2: 
In terms of driving behavior, civilian drivers maintain significantly lower control and stability compared with professional drivers.
H3: 
Civilian drivers have significantly lower visual attention and higher heart rate responses compared with professional drivers.

2. Materials and Methods

This study aimed to evaluate the participants’ driving performances, driving behaviors, and situational awareness under various controlled but challenging conditions.

2.1. Experiment

This study involved a total of 30 participants divided into two groups: 15 civilian drivers and 15 professional drivers, specifically, trained delegation drivers from the Personal Protection Division of the Hungarian Police Service. Participant recruitment did not account for confounding factors such as age, experience, or gender. The inclusion criteria were to be regular drivers and professionals. The participants were tested in a simulation environment designed to assess their driving performance under various challenging conditions.
Since the primary goal of this pilot study was to explore the hypotheses and assess the feasibility, we selected a moderate sample size (15 participants per group). In a previous preliminary simulator study exploring drivers’ responses to driving system reminders on four stimuli in vehicles, only six participants were involved, with each participant participating in four sessions [29]. In another study, 17 participants were involved to investigate the effect of time-on-task on drivers’ mental workload and driving performance during a simulated driving task [30]. Therefore, the sample size selected in this study was consistent with that in previous simulator studies.
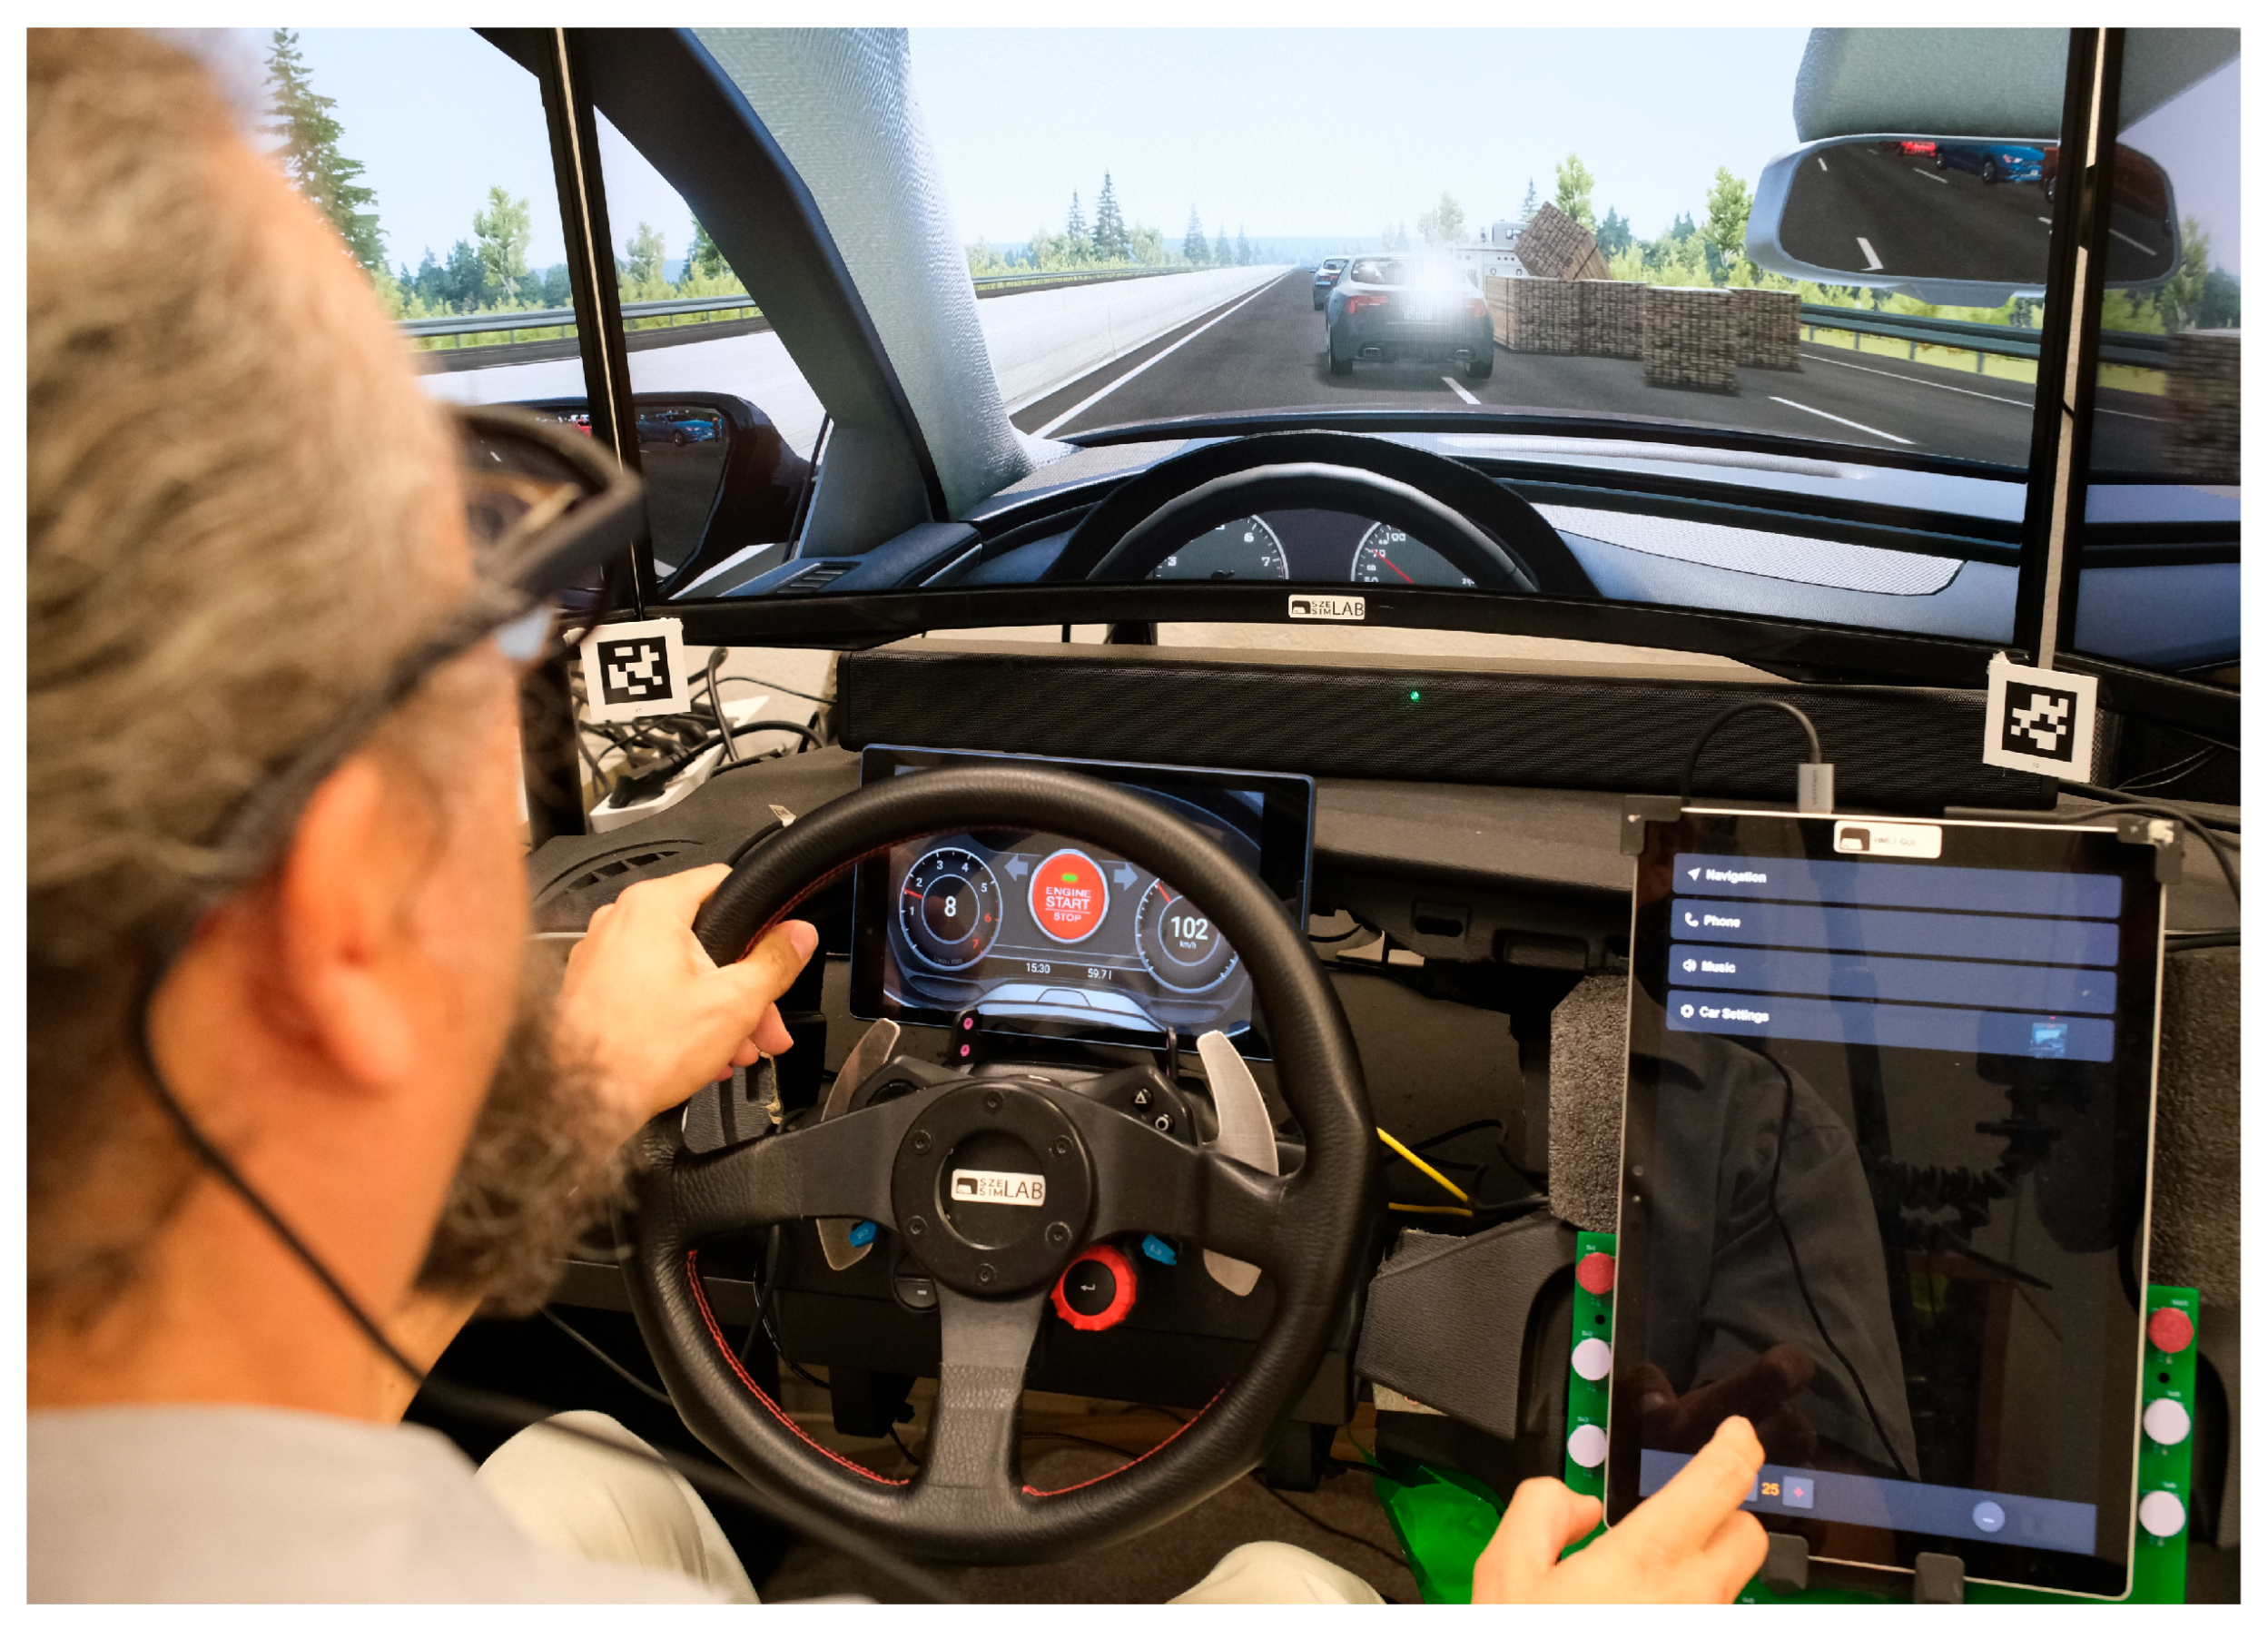
The simulation setup consisted of a custom-built BeamNG.tech v0.32 (BeamNG GmbH, Bremen, Germany) simulation environment, specifically tailored to include unique scenarios relevant to the study objectives. The hardware used for the experiment included a high-performance Intel i9 PC equipped with an NVIDIA GeForce GTX GPU and three 32-inch monitors providing a 180-degree visual experience. Additionally, a Genius G29 steering wheel and pedal set were employed to ensure realistic driving inputs.
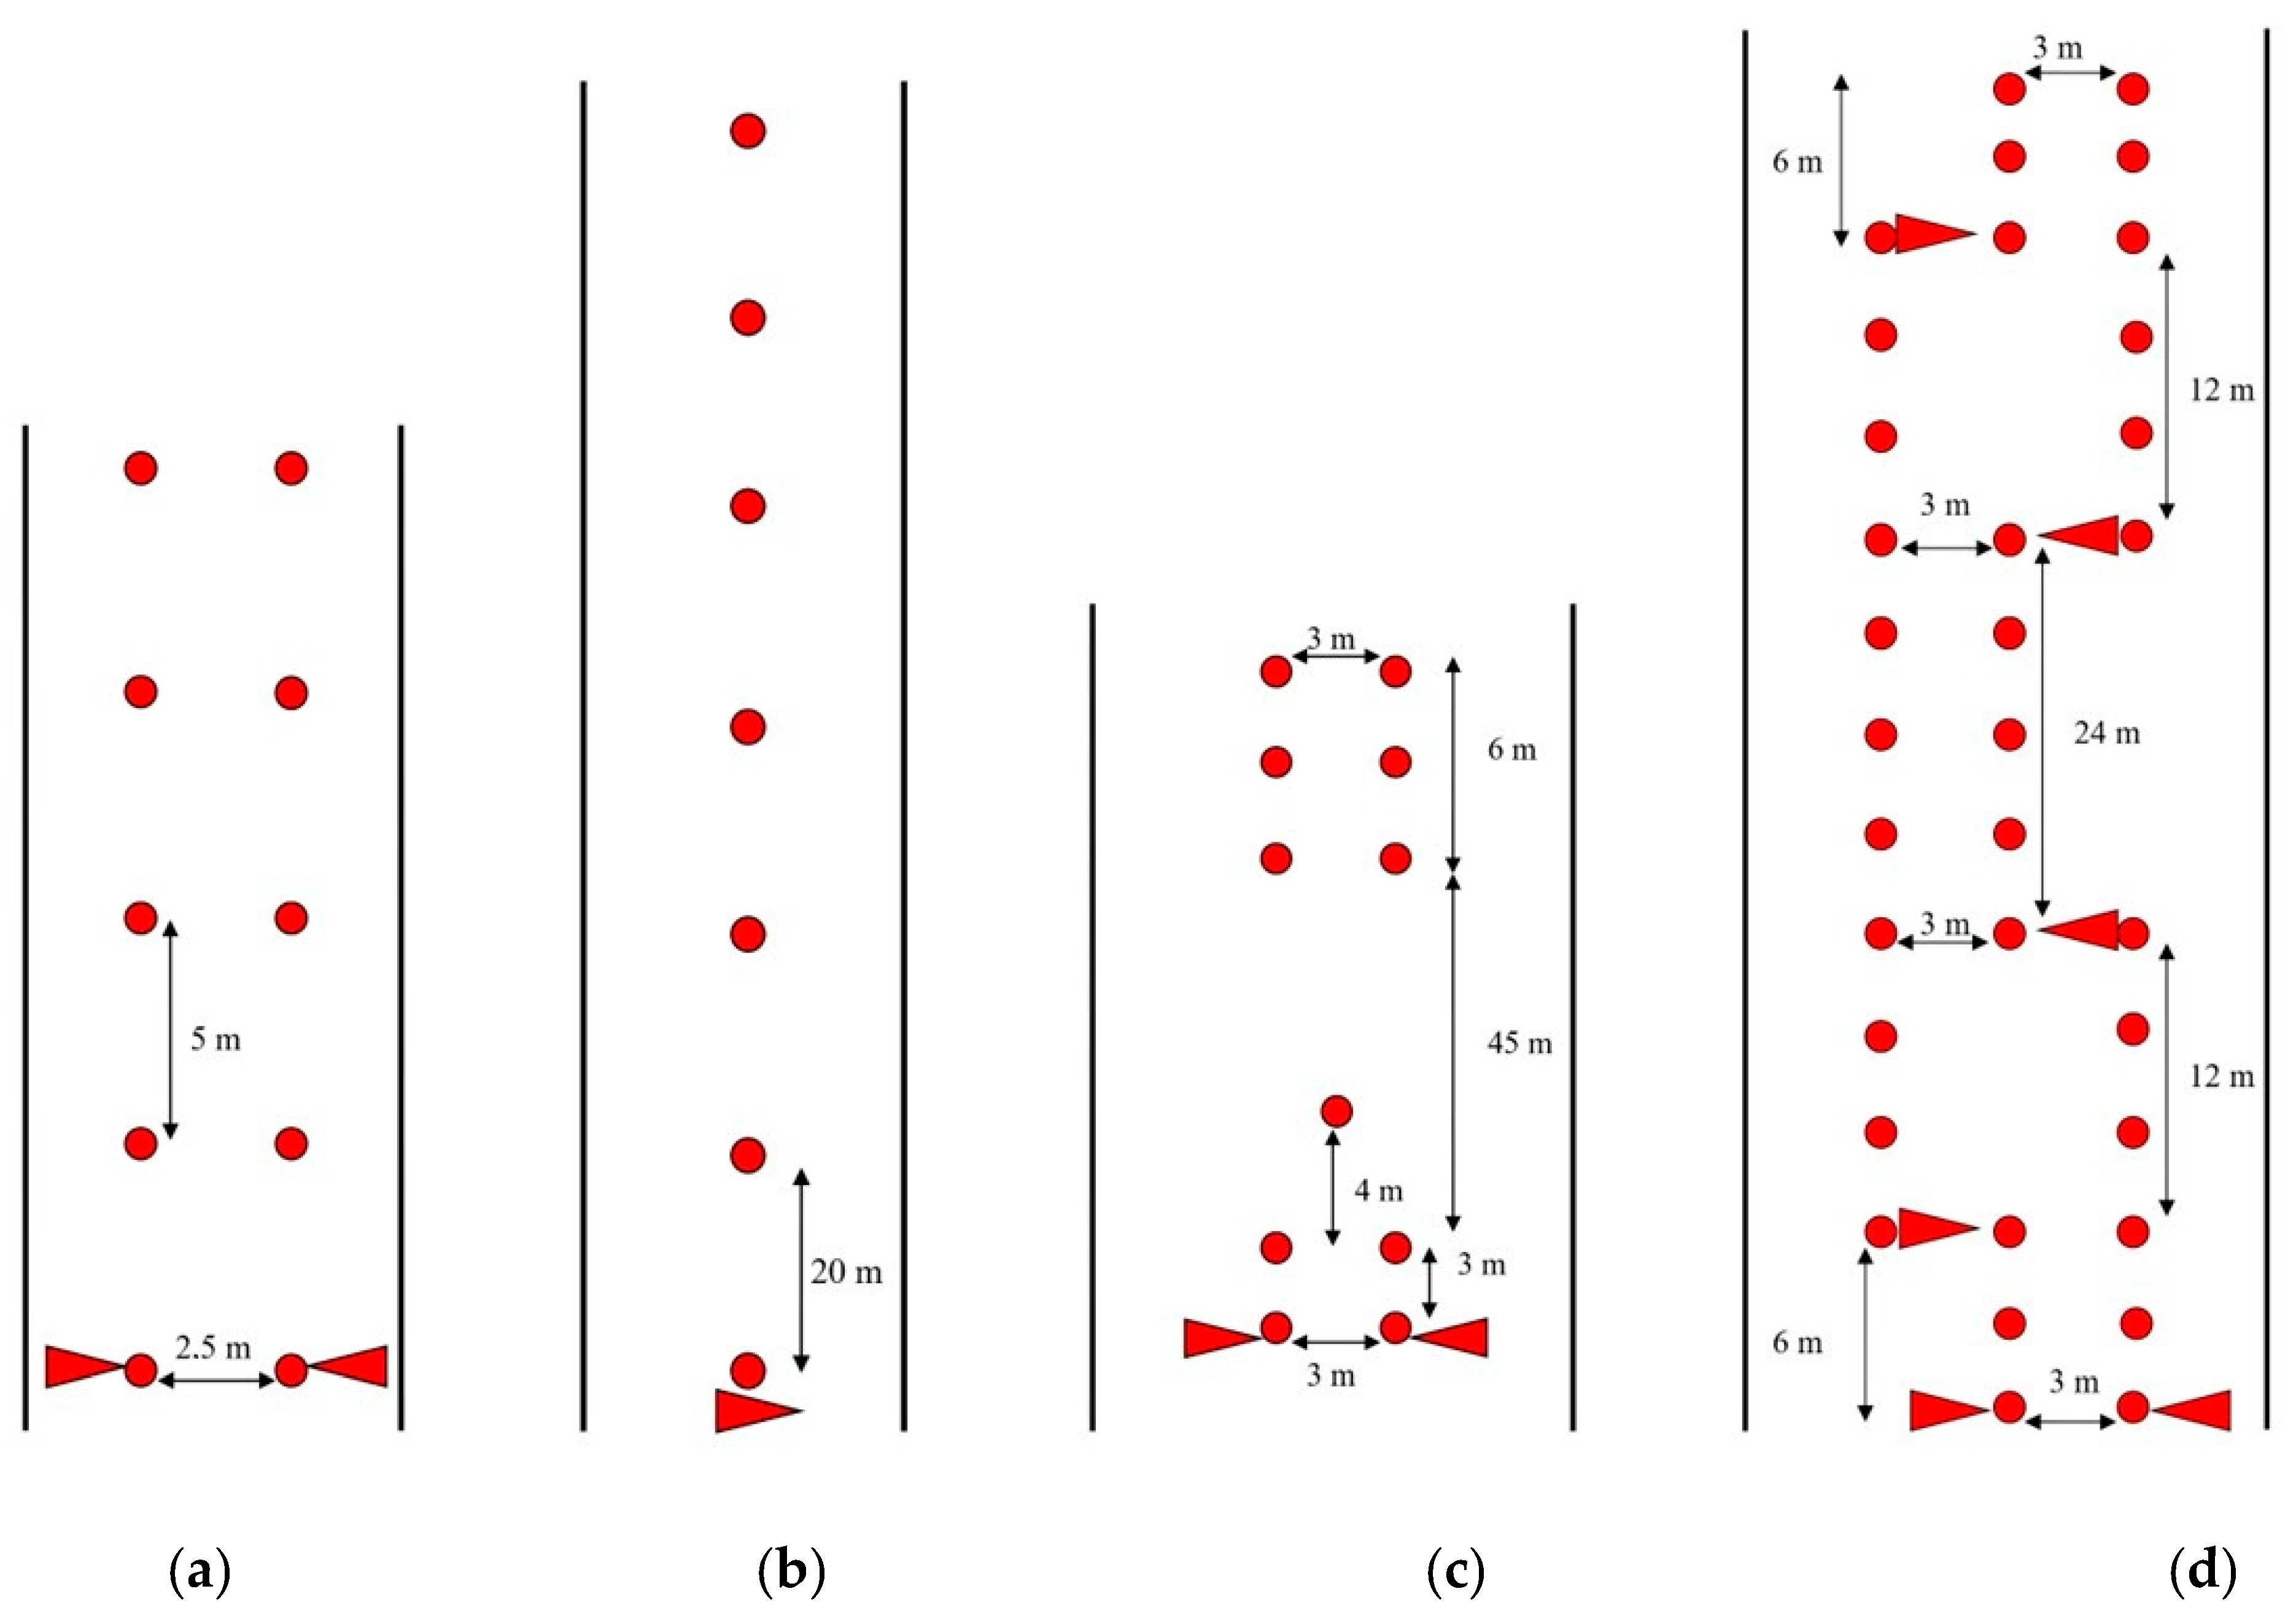
The experiment featured several driving scenarios categorized into cone avoidance and motorway tasks. The cone avoidance scenarios tested the participants’ precision and control in the following exercises (Figure 1):
  • Narrow passage: Navigating through a confined space with cones to assess precision under restricted conditions.
  • Slalom: Driving in a zigzag pattern around cones.
  • Center of gravity displacement: Simulating vehicle stability challenges requiring precise handling techniques.
  • Double obstacle avoidance: Navigating around two obstacles in quick succession.
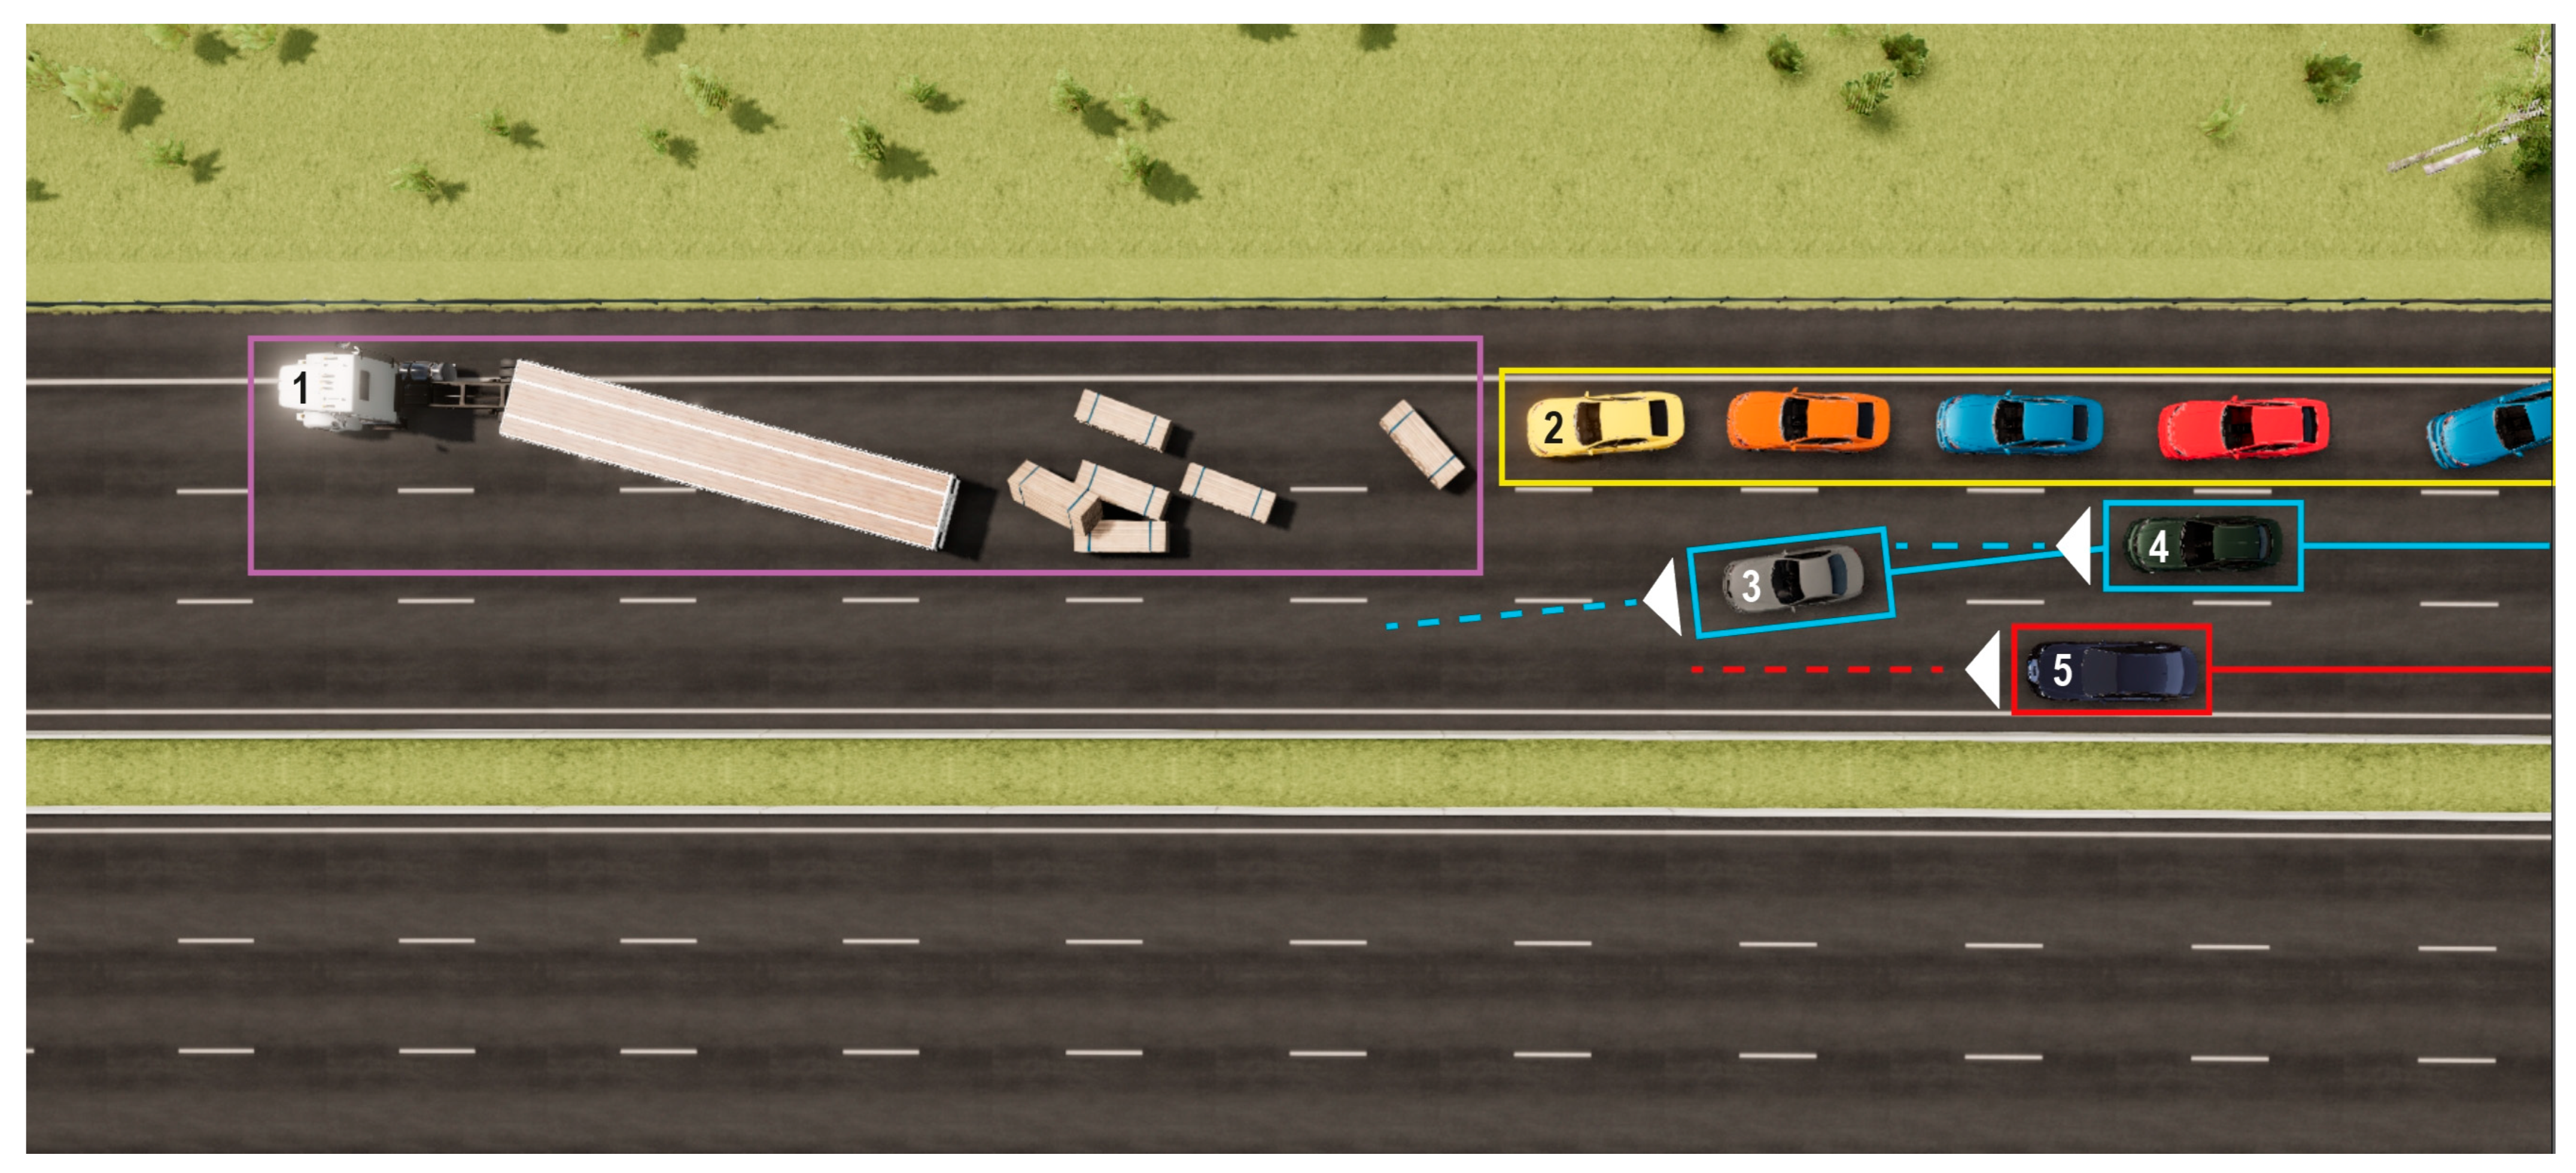
In addition, a motorway scenario was designed to test high-speed driving skills and the ability to respond to in-car and road-related events. This scenario included the following (Figure 2 and Figure 3):
  • High-speed driving: Maintaining speed and safe positioning in the inner lane.
  • Stationary vehicles blocking the road (a simulated accident).
  • Unexpected event management (UEM): Responding to a simulated incident where a vehicle partially shifted into the inner lane due to an accident, testing situational awareness.

2.2. Measurement System

The testing method utilized a Pupil Neon eye-tracking device (Pupil Labs GmbH, Berlin, Germany) to observe visual focus. Selected for its accuracy—1.8° without individual calibration and 1.3° with a basic offset adjustment—and its effectiveness under different lighting conditions and head movements, the Pupil Neon is dependable for practical applications [31]. The eye-tracking information was captured using a mobile app that transmitted raw data to a cloud-based service. For post-processing purposes, the Pupil Neon Player v5.0.5 desktop application (Pupil Labs GmbH, Berlin, Germany) was used, and all data were exported for further calculations.
This head-mounted system includes binocular glasses with dual-infrared eye cameras for precise eye movement tracking, complemented by a wide-angle RGB camera that captures the driver’s field of vision. The Pupil Labs Neon records a video with the world-view and infrared eye cameras, along with raw data such as timestamps, pupil locations, and gaze coordinates (x- and y-positions).
A full-HD webcam was mounted above the participants’ heads to record hand movements throughout the tasks. The webcam data captured specific hand positions and movements, including the following:
  • Two hands on the steering wheel;
  • One hand on the steering wheel;
  • No hand on the steering wheel.
The Polar H9 wearable heart rate-monitoring device (Polar Electro Oy, Kempele, Finland) was attached to all participants throughout the experiment.

2.3. Procedure

Before starting the experiment, all participants provided written consent to participate. Following this, detailed instructions regarding the tasks and procedures were delivered to each participant via machine voice to ensure consistency in instruction delivery. A 5 min free-driving session was provided to allow participants to familiarize themselves with the simulation environment and controls.
The experiment consisted of four cone avoidance tasks followed by a motorway scenario, all conducted in the same order for every participant to maintain uniformity. For the cone avoidance tasks, the number of cone hits was recorded at the end of each task.
In the motorway scenario, participants were required to complete an NDRT involving an increase in the interior temperature by 3 degrees. The test assistant initiated this task at a predetermined point on the road, just before a simulated accident scenario. The participant’s ability to complete the NDRT and their response to the upcoming accident were carefully observed and noted to assess their task performance.
After the driving tasks, participants completed a General Questionnaire to provide essential background information. The questionnaire collected data on demographics and driving experience. Additionally, the questionnaire included specific questions about the simulation, such as prior experience with driving simulators and comfort with the setup.
This structured procedure ensured that all participants underwent identical conditions, allowing for standardized comparison across tasks and scenarios.

2.4. Statistical Analysis

We processed and analyzed the collected data using the R program version 4.5.0 (R Core Team, R Foundation for Statistical Computing, Vienna, Austria). Regarding the acclimation period, which represents the familiarization session with the driving simulator in our experiment, it was excluded from the analysis. To determine the participants’ profiles (characteristics), the statistical analysis involved descriptive statistics. Confounders, including age, experience, or gender, did not control participant recruitment. The inclusion criteria were to be regular drivers and professionals. However, through analyzing the collected data, we identified a significant difference between professional and civilian drivers. To overcome this, age was included as a covariate in a mixed ANCOVA to statistically control its potential to affect the dependent variables. In the case of the cone avoidance test, to compare how both driver groups differed in their performance (cone avoidance precision rate, speed, steering intensity, hand on steering wheel, throttle, fixation frequency, mean duration of fixation, and heart rate), we used the Wilcoxon rank-sum test, also called the Mann–Whitney U test.
Furthermore, several mixed analyses of covariance (mixed-design ANCOVA) were conducted to examine the effects of class and scenario, controlling for age, on the collected metrics. The mixed ANCOVA was modeled using the lme() function from R’s lme4 package. For each metric, the linearity, homogeneity of regression slopes, normality, outliers, and homogeneity of variance of the models’ residual assumptions were checked. In the cases where the residual variance differed between scenarios, we included varIdent() from the R’s nlme package function in the model, reflecting the heterogeneous residuals. The variance function was used in all the models, except for the hands on steering wheel dependent variable, where the assumption of homogeneity of variance of the models’ residual was met. The results of the assumptions can be found in Appendix A (Table A1 and Table A2). The statistical significance level was set at 0.05.
In the case of the motorway scenario, the Wilcoxon rank-sum test and a t-test were conducted to assess the difference between the collected metrics of both driver classes. The normality of the metrics was first tested using the Shapiro–Wilk test to assign the appropriate statistical test. A t-test was employed when a normal distribution was met (p-value > 0.05). If not, the Wilcoxon rank-sum test was applied. Moreover, the Wilcoxon rank-sum test was used to compare how both driver groups assessed the different scenarios (cone avoidance vs. motorway) in terms of the realism of the scenario, the subjective control over the vehicle, and the self-assessed success.

3. Results

This section presents an analysis of the experimental results, highlighting the differences between civilian and professional drivers. The results are reported with 95% confidence intervals (α = 0.05 level of significance).

3.1. Participants’ Profiles

The mean age of all participants was 38.66 years (min. = 21, max. = 51, and SD = 10.49). However, professional drivers were older than the civilian class, with average ages of 45.4 and 31.9, respectively. Similarly, for the number of years since license acquisition, the professional category reported a higher average (27 years) than the civilian category (13.7 years). Additionally, the average kilometers driven by each category are illustrated in Figure 4. Professionals traveled approximately twice the monthly distance and three times the distance to work as civilians. In total, professional drivers covered three times the average distance driven by civilian drivers.
In terms of driving frequency, professional drivers uniformly reported daily driving. In contrast, civilian drivers were distributed into daily (47%) and weekly (53%) driving frequencies.

3.2. Cone Avoidance Scenarios

To aid interpretation, the collected metrics were assigned to three categories: driving performance, driving behavior, and visual and physiological metrics. The driving performance metrics were basically related to the scenarios, involving cone avoidance precision rate and the duration of the experiment. The driving behavior metrics involved speed, steering intensity, hands on the steering wheel, and throttle. Lastly, the visual and physiological metrics reflected human responses, including fixation frequency, mean duration of fixation, and heart rate. The metrics served for the comparative assessment of civilian and professional drivers across four experimental tasks. The descriptions of the metrics are presented in Table 1.

3.2.1. Descriptive Statistics of Cone Avoidance Tasks

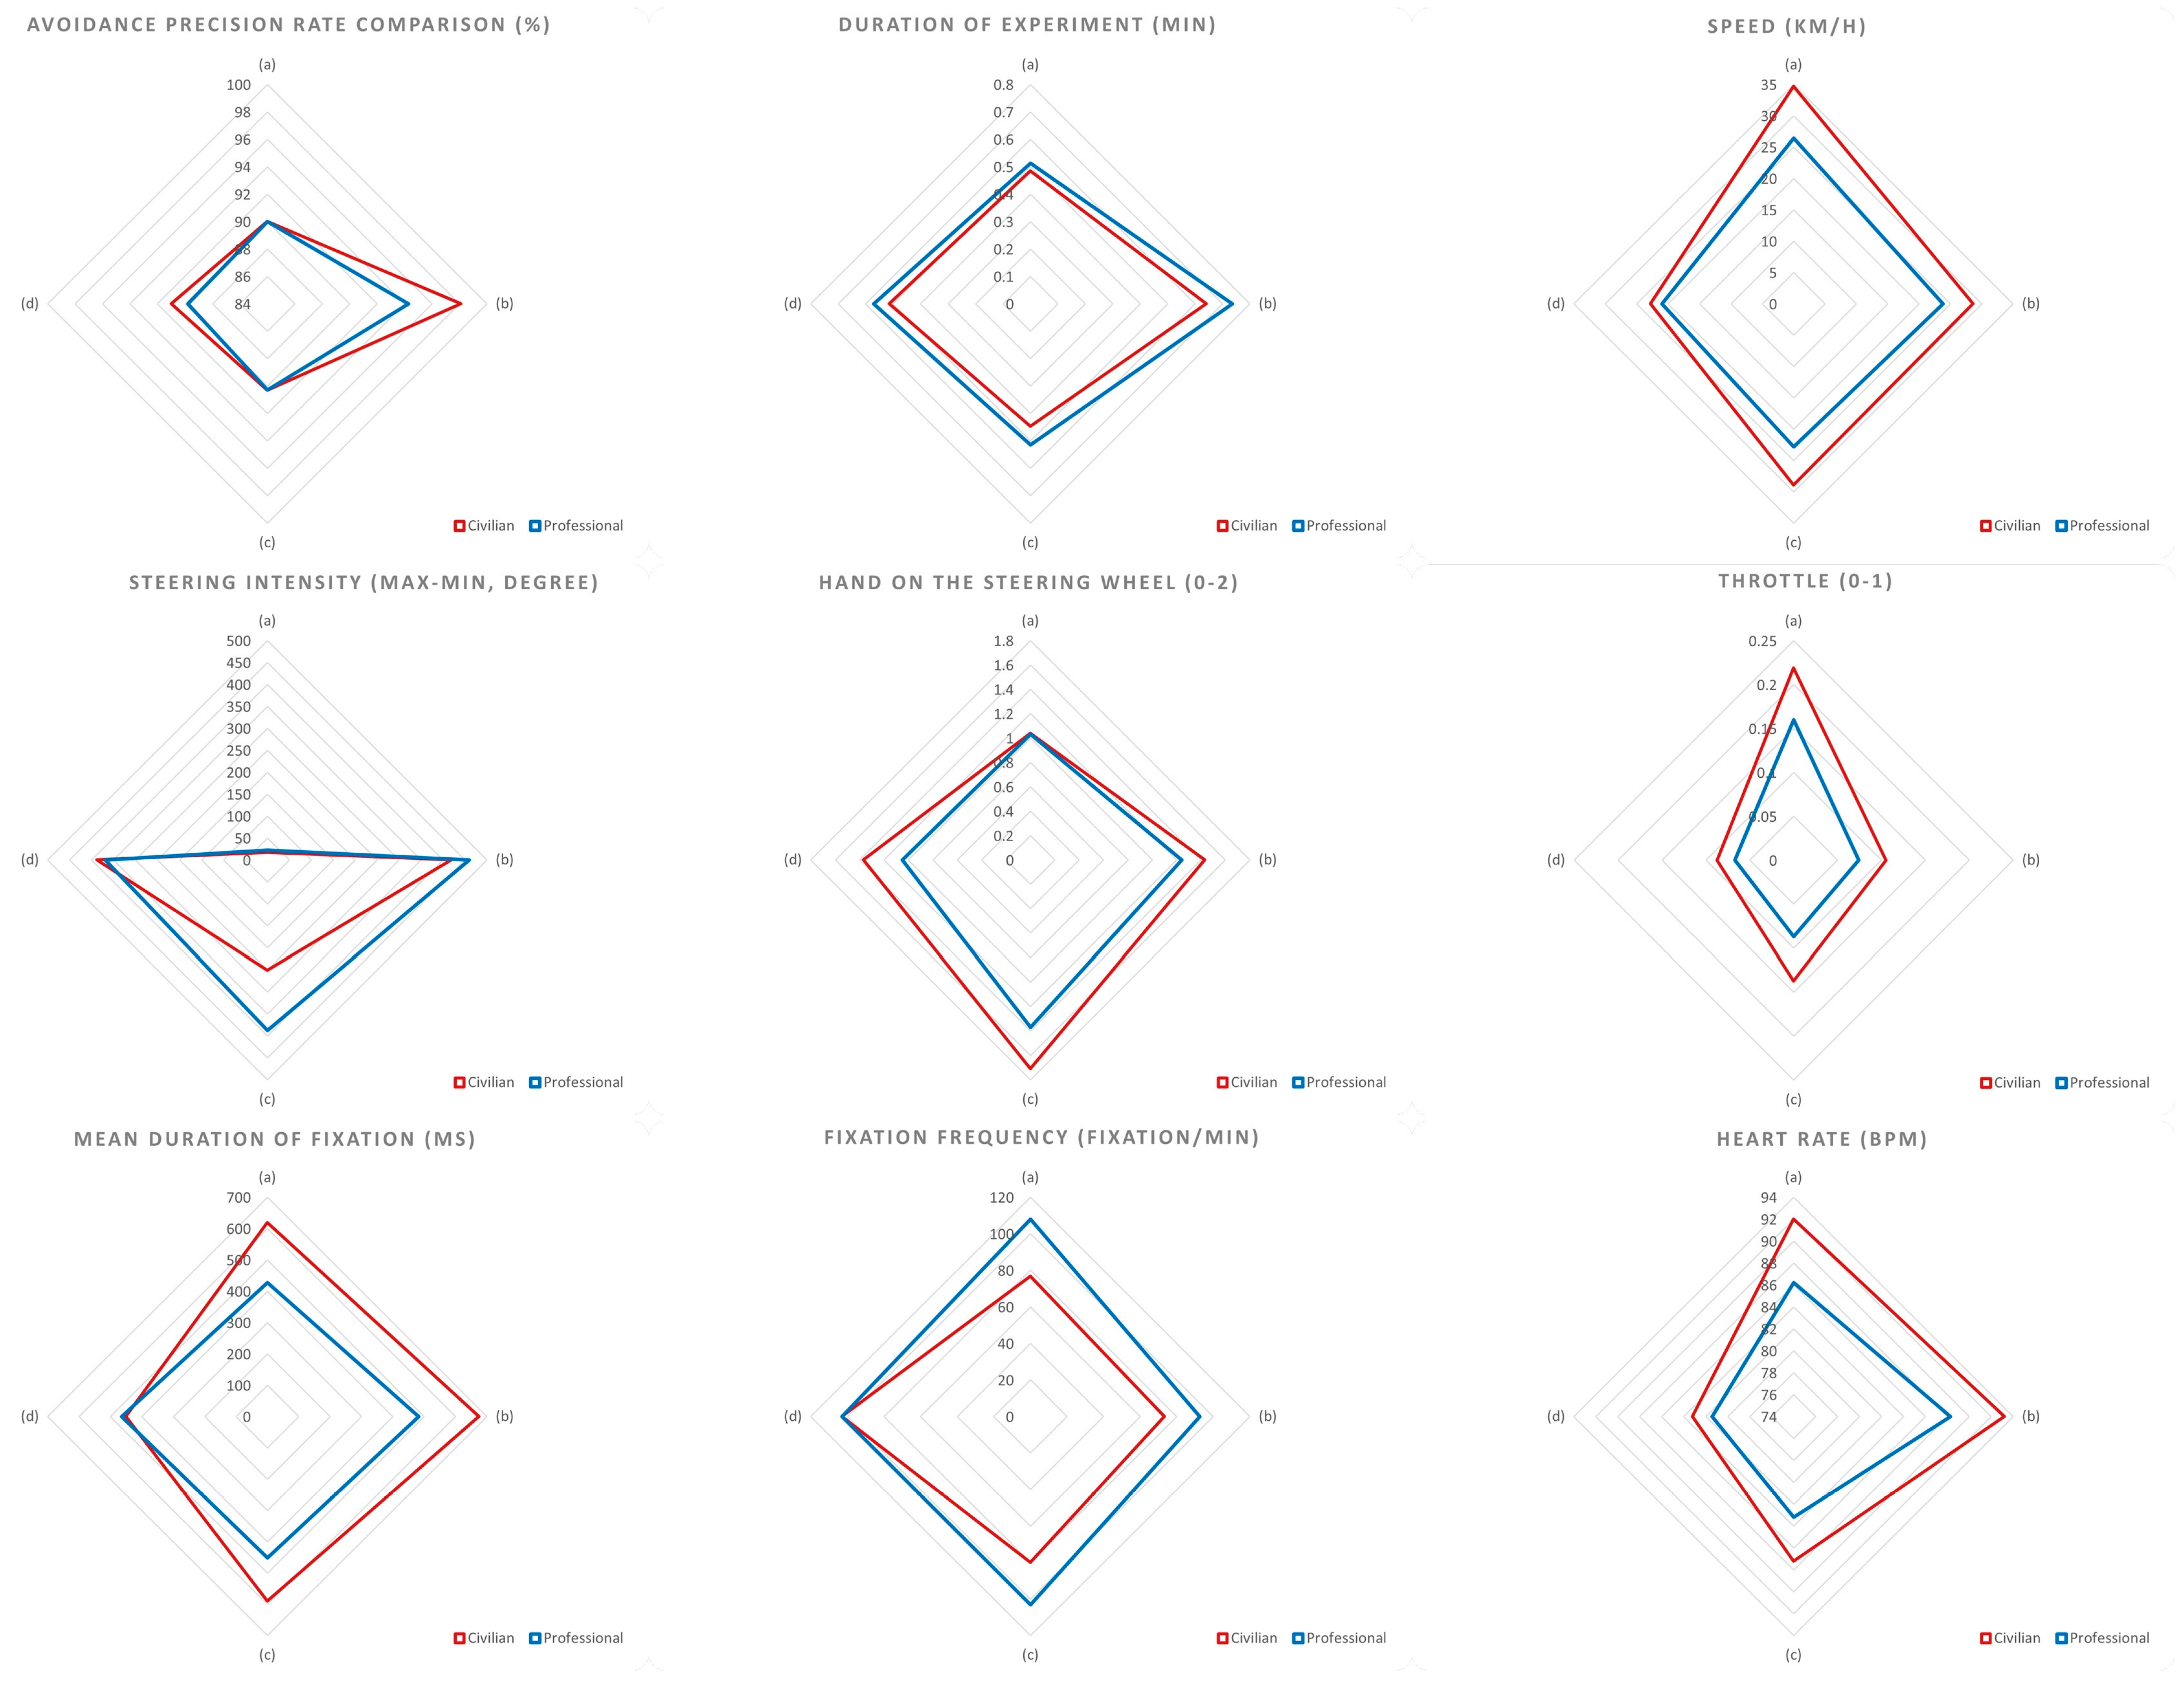
We summarize the collected metrics of the four scenarios for civilian and professional drivers in Table 2 and Table 3, respectively. In addition, Figure 5 was derived from both tables, summarizing the same set of metrics. Civilians showed a high performance, with an average 92.35% cone avoidance rate across the four scenarios. Similarly, professionals exhibited the same dedication, with 91.1%. Civilians also showed higher values of speed than professional drivers. The average speed of civilians was 28.75 km/h, compared with 23.5 km/h for professionals, which represented an increase of approximately 18%. Across scenarios, differences followed the same pattern, comprising scenario (a), narrow passage (34.7 vs. 26.4 km/h); scenario (b), slalom (29.5 vs. 23.8 km/h); scenario (c), center of gravity displacement (28.9 vs. 22.8 km/h); and scenario (d), double obstacle avoidance (22.8 vs. 21 km/h). Among professionals, steering intensity values were consistently higher (overall mean: 309.9) compared with civilians (268.7), with a reduction of approximately 15% for the latter. In terms of throttle, a pattern of decreasing mean values appeared across scenarios, with higher values scored by civilians. For the visual behavior, the fixation mean length showed large differences, with civilians averaging 583.75 ms compared with 456.25 ms for professionals, an increase of 27%. Across scenarios, fixation durations were consistently longer for civilians (e.g., slalom: 675.00 vs. 483 ms). As for the heart rate, for both driver classes, a slight increase in the mean was noticed in scenario (b) compared with scenario (a), followed by a decrease in the remaining scenarios. Civilians exhibited a higher heart rate, averaging 88.9 bpm compared with 84.77 bpm for professionals, representing a 5% increase.

3.2.2. Wilcoxon Test Results

In the first stage, Wilcoxon tests were used in an initial exploratory analysis to evaluate the difference between scenarios independently. The preliminary results are summarized in Table 4. In terms of driving performance metrics, only one significant difference was found between the experiment durations of civilians and professionals in the scenario (c) (p = 0.0343). The Wilcoxon analysis results indicate that the driving behavior parameters tended to have significant differences between both groups in different scenarios, but particularly in scenario (c) (all p-values < 0.05). While the results confirmed that the speed differences were statistically significant in scenarios (b) and (c), the throttle differences were statistically significant in scenarios (c) and (d). Steering intensity and hands on the steering wheel were only significantly different in scenario (c). As for the physiological metrics, only one significant difference was detected between the mean fixation duration of civilians and professionals in scenario (b) (p = 0.0381).

3.2.3. Mixed-Design ANCOVA Results

Following preliminary non-parametric comparisons using Wilcoxon tests, in the second stage, we conducted mixed-design ANCOVA to more comprehensively assess the effects of scenarios (within-subject factor) and class (between-subjects factor), while controlling for age as a covariate, on the collected metrics. Age was not the main factor of interest in this work, and as the difference in age was significant between the two driver groups, it was initially treated as a covariate to adjust for the imbalance statistically. However, when the homogeneity of regression slopes assumption of a model was violated (indicated by a significant scenario × age interaction (p-value < 0.05)), age was retained in the interaction with scenario and class factors. Retaining the interaction allowed its effect to vary across scenarios rather than treating it as a uniform covariate. In this study, for the speed, steering intensity, heart rate, and experiment duration dependent variables, the homogeneity of regression slopes assumption was violated. Thus, the models were refitted by accounting for age as an interacting covariate.
Each collected metric was analyzed separately as a dependent variable. The modeling results of the three categories are illustrated in Table 5, Table 6 and Table 7.
Driving Behavior Metrics
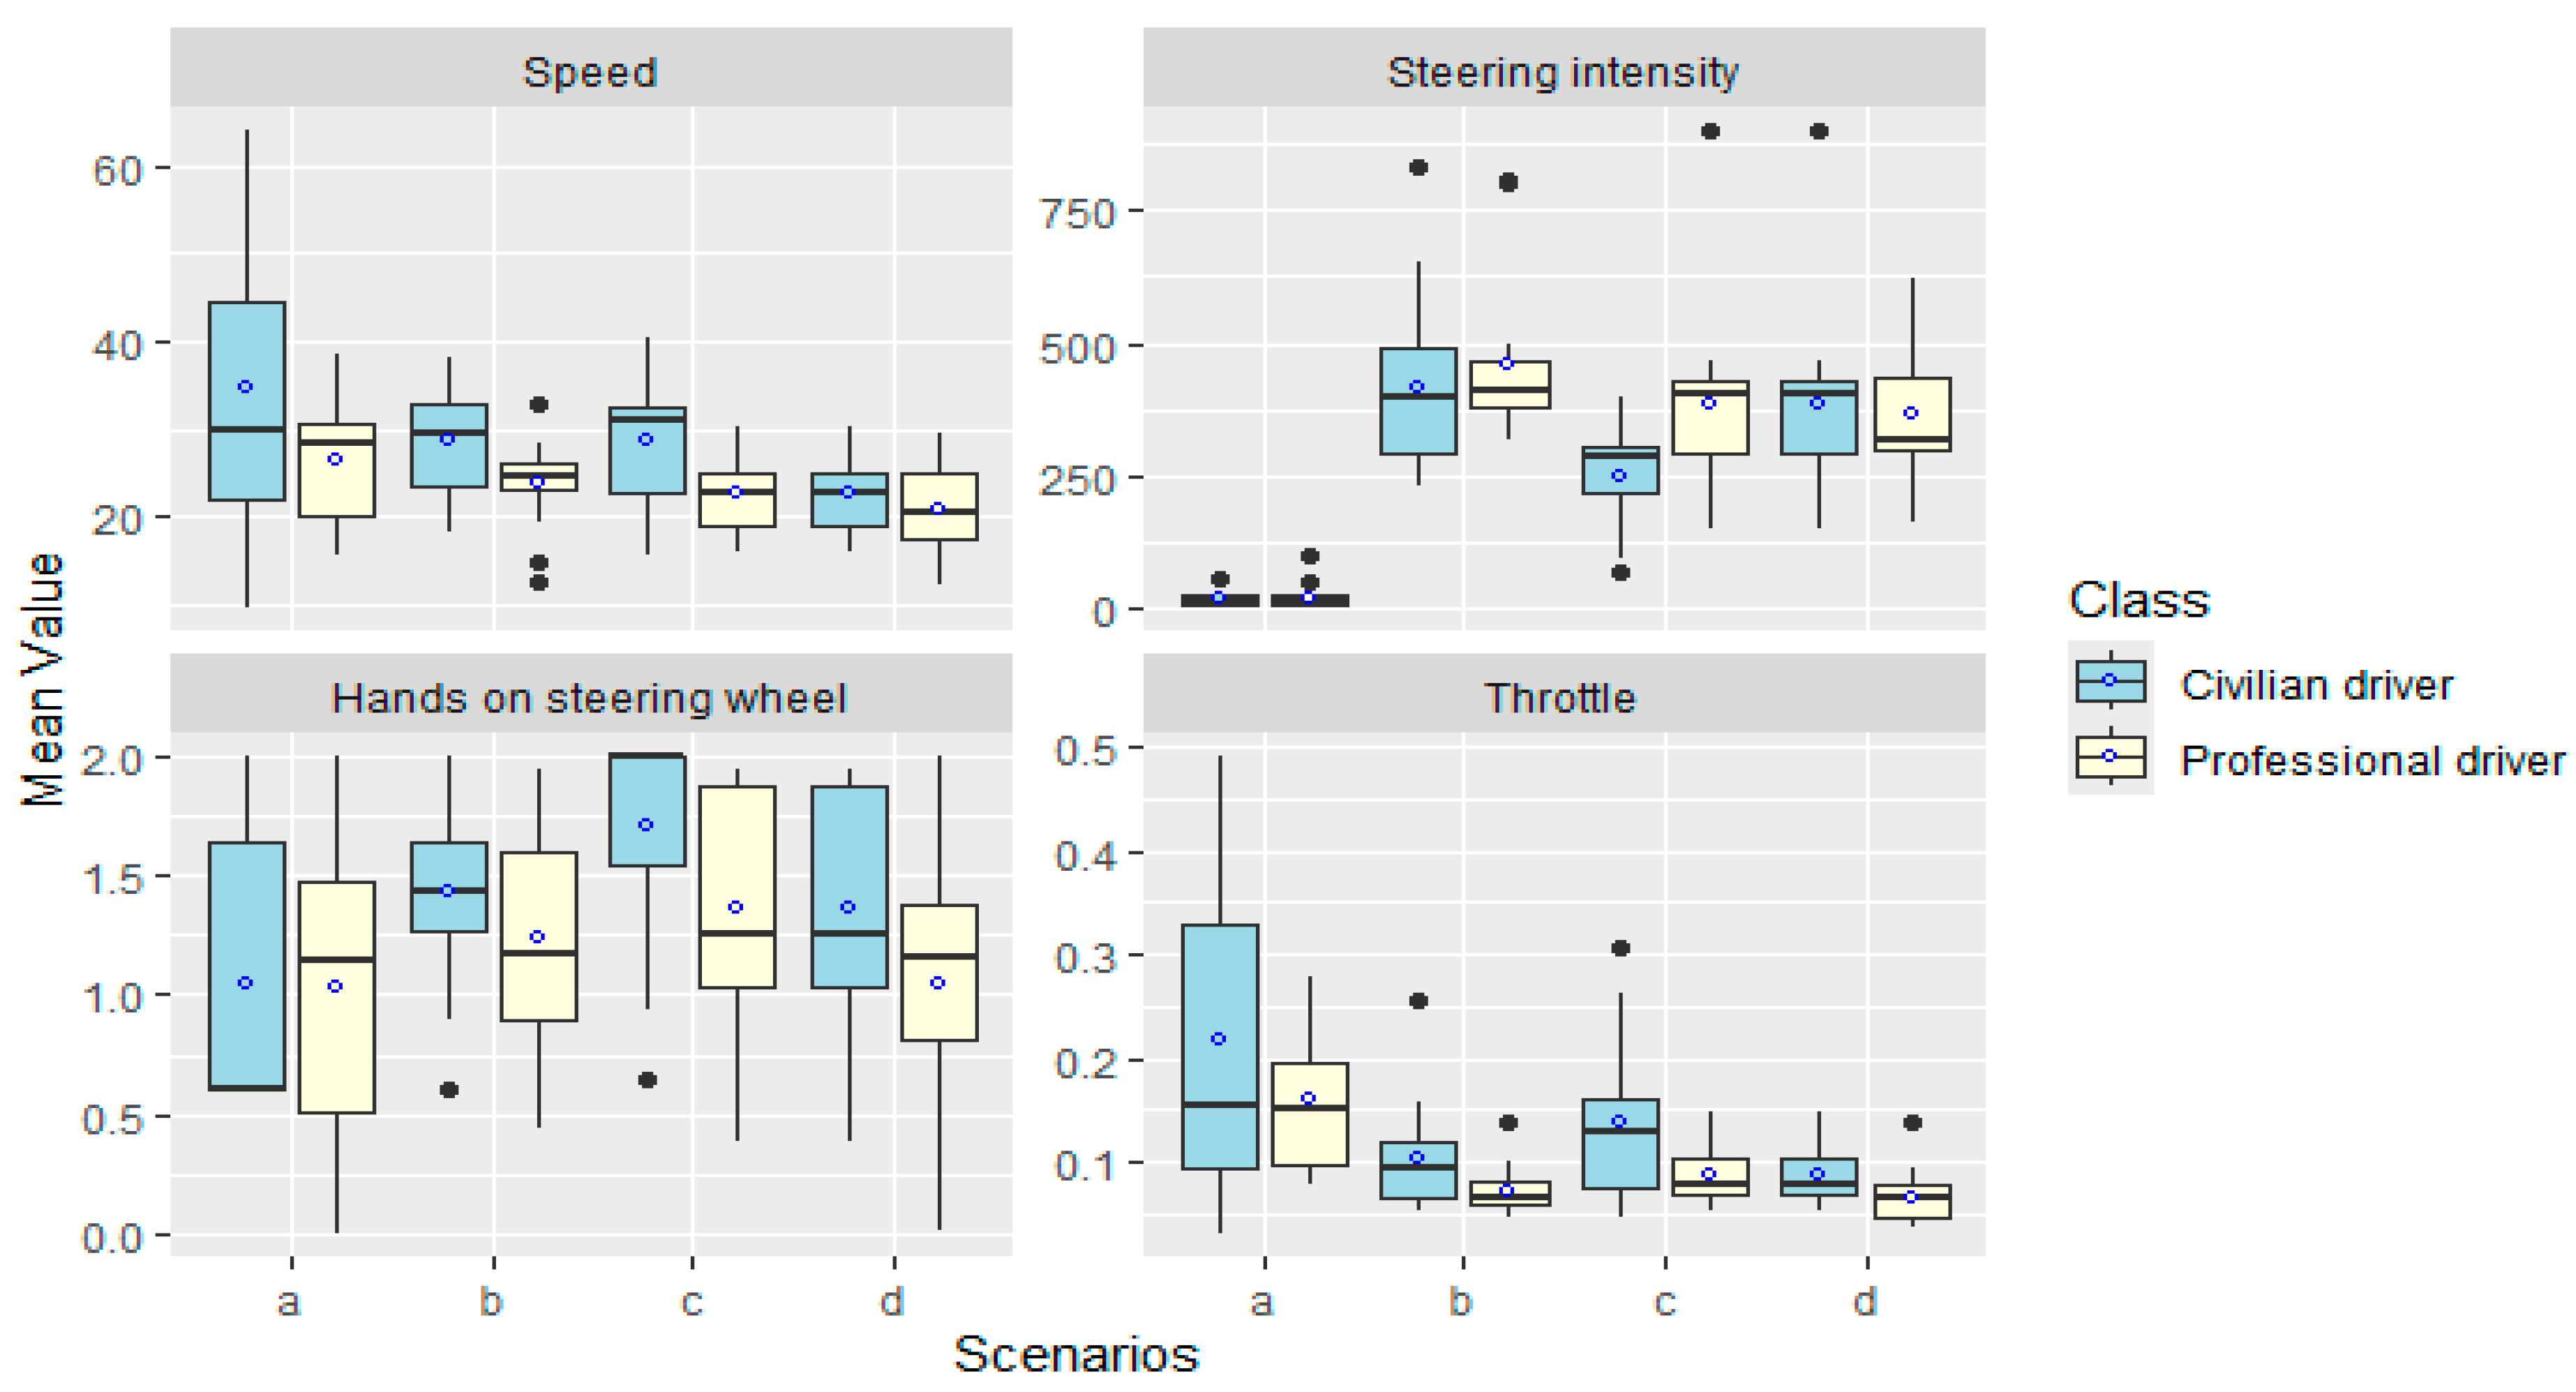
Our speed model results (Table 6) indicate a significant effect of the drivers’ classes on speed (F(1,28) = 8.19; p = 0.008). The scenario also had a significant effect on speed (F (3,80) = 9.65; p < 0.001). Thus, speed was significantly different across all the scenarios. The interaction between the class and scenario variables was not significant (F(3,80) = 1.57; p = 0.204). Both driver groups followed a similar pattern of change across scenarios. Regarding age, the interaction term scenario x age was significant (F(3,80) = 6.46; p < 0.001), which means that the relationship between age and speed differed across scenarios. Based on the post hoc pairwise comparison of the estimated marginal means of the speed for each scenario within each group, among civilians, only scenario (d) scored significantly higher than scenario (c) (estimated difference = 5.77; p = 0.044). Again, scenario (d) scored significantly higher than the two other scenarios (a) and (b) among professional drivers (estimated difference = 11.15 (p = 0.008) and estimated difference = 6.58 (p = 0.002), respectively. Regarding age’s influence on speed, it depended on the scenario. The results of the estimated marginal trend analysis indicated a negative effect in scenarios (a) and (b), where older participants had lower speeds. No significant effect of age was noticed across scenarios (c) and (d).
In terms of the steering intensity modeling results, there was no significant mean difference between professional and civilian drivers in steering intensity scores across the four scenarios (p = 0.2404 > 0.05). However, group differences were notable in only scenario (c), where professional drivers showed a significantly higher steering intensity than civilian drivers (estimate = 131.70; p = 0.0098). Thus, the difference between the two groups was scenario-based, where the scenario was the key factor (p < 0.0001). In this case, the age effect was not significant.
Regarding the ‘hands on steering wheel’ metric, our modeling results revealed that this metric was only significantly influenced by the scenario to which the data belonged (p < 0.0001). Class membership and age had no significant effect on the metric. Professional drivers tended to have slightly lower values for hands on the steering wheel on average compared with civilian drivers (estimated at 0.116), but the difference was not statistically reliable. Pairwise comparisons indicated that scenario (c) differed significantly from scenario (a) (estimated difference = 0.5; p = 0.009).
As for the throttle metric, the mixed ANCOVA results (Table 6) indicate that class membership and scenario independently affected the score (p = 0.0014 and p < 0.0001, respectively). Following pairwise comparisons, it was revealed that scenarios (b, c, and d) scored significantly lower on throttle metrics compared with scenario (a). This can be visually seen from the distribution of the throttle score in Figure 6. However, the class × scenario interaction had no significant effect on the throttle metric (p = 0.4544), indicating that professional and civilian drivers’ effects did not differ across the four scenarios. In this current model, age showed a non-significant marginal negative effect (p = 0.076). Although it was not entirely reliable, the age trend suggests that throttle decreased slightly with older participants.
Driving Performance Metrics
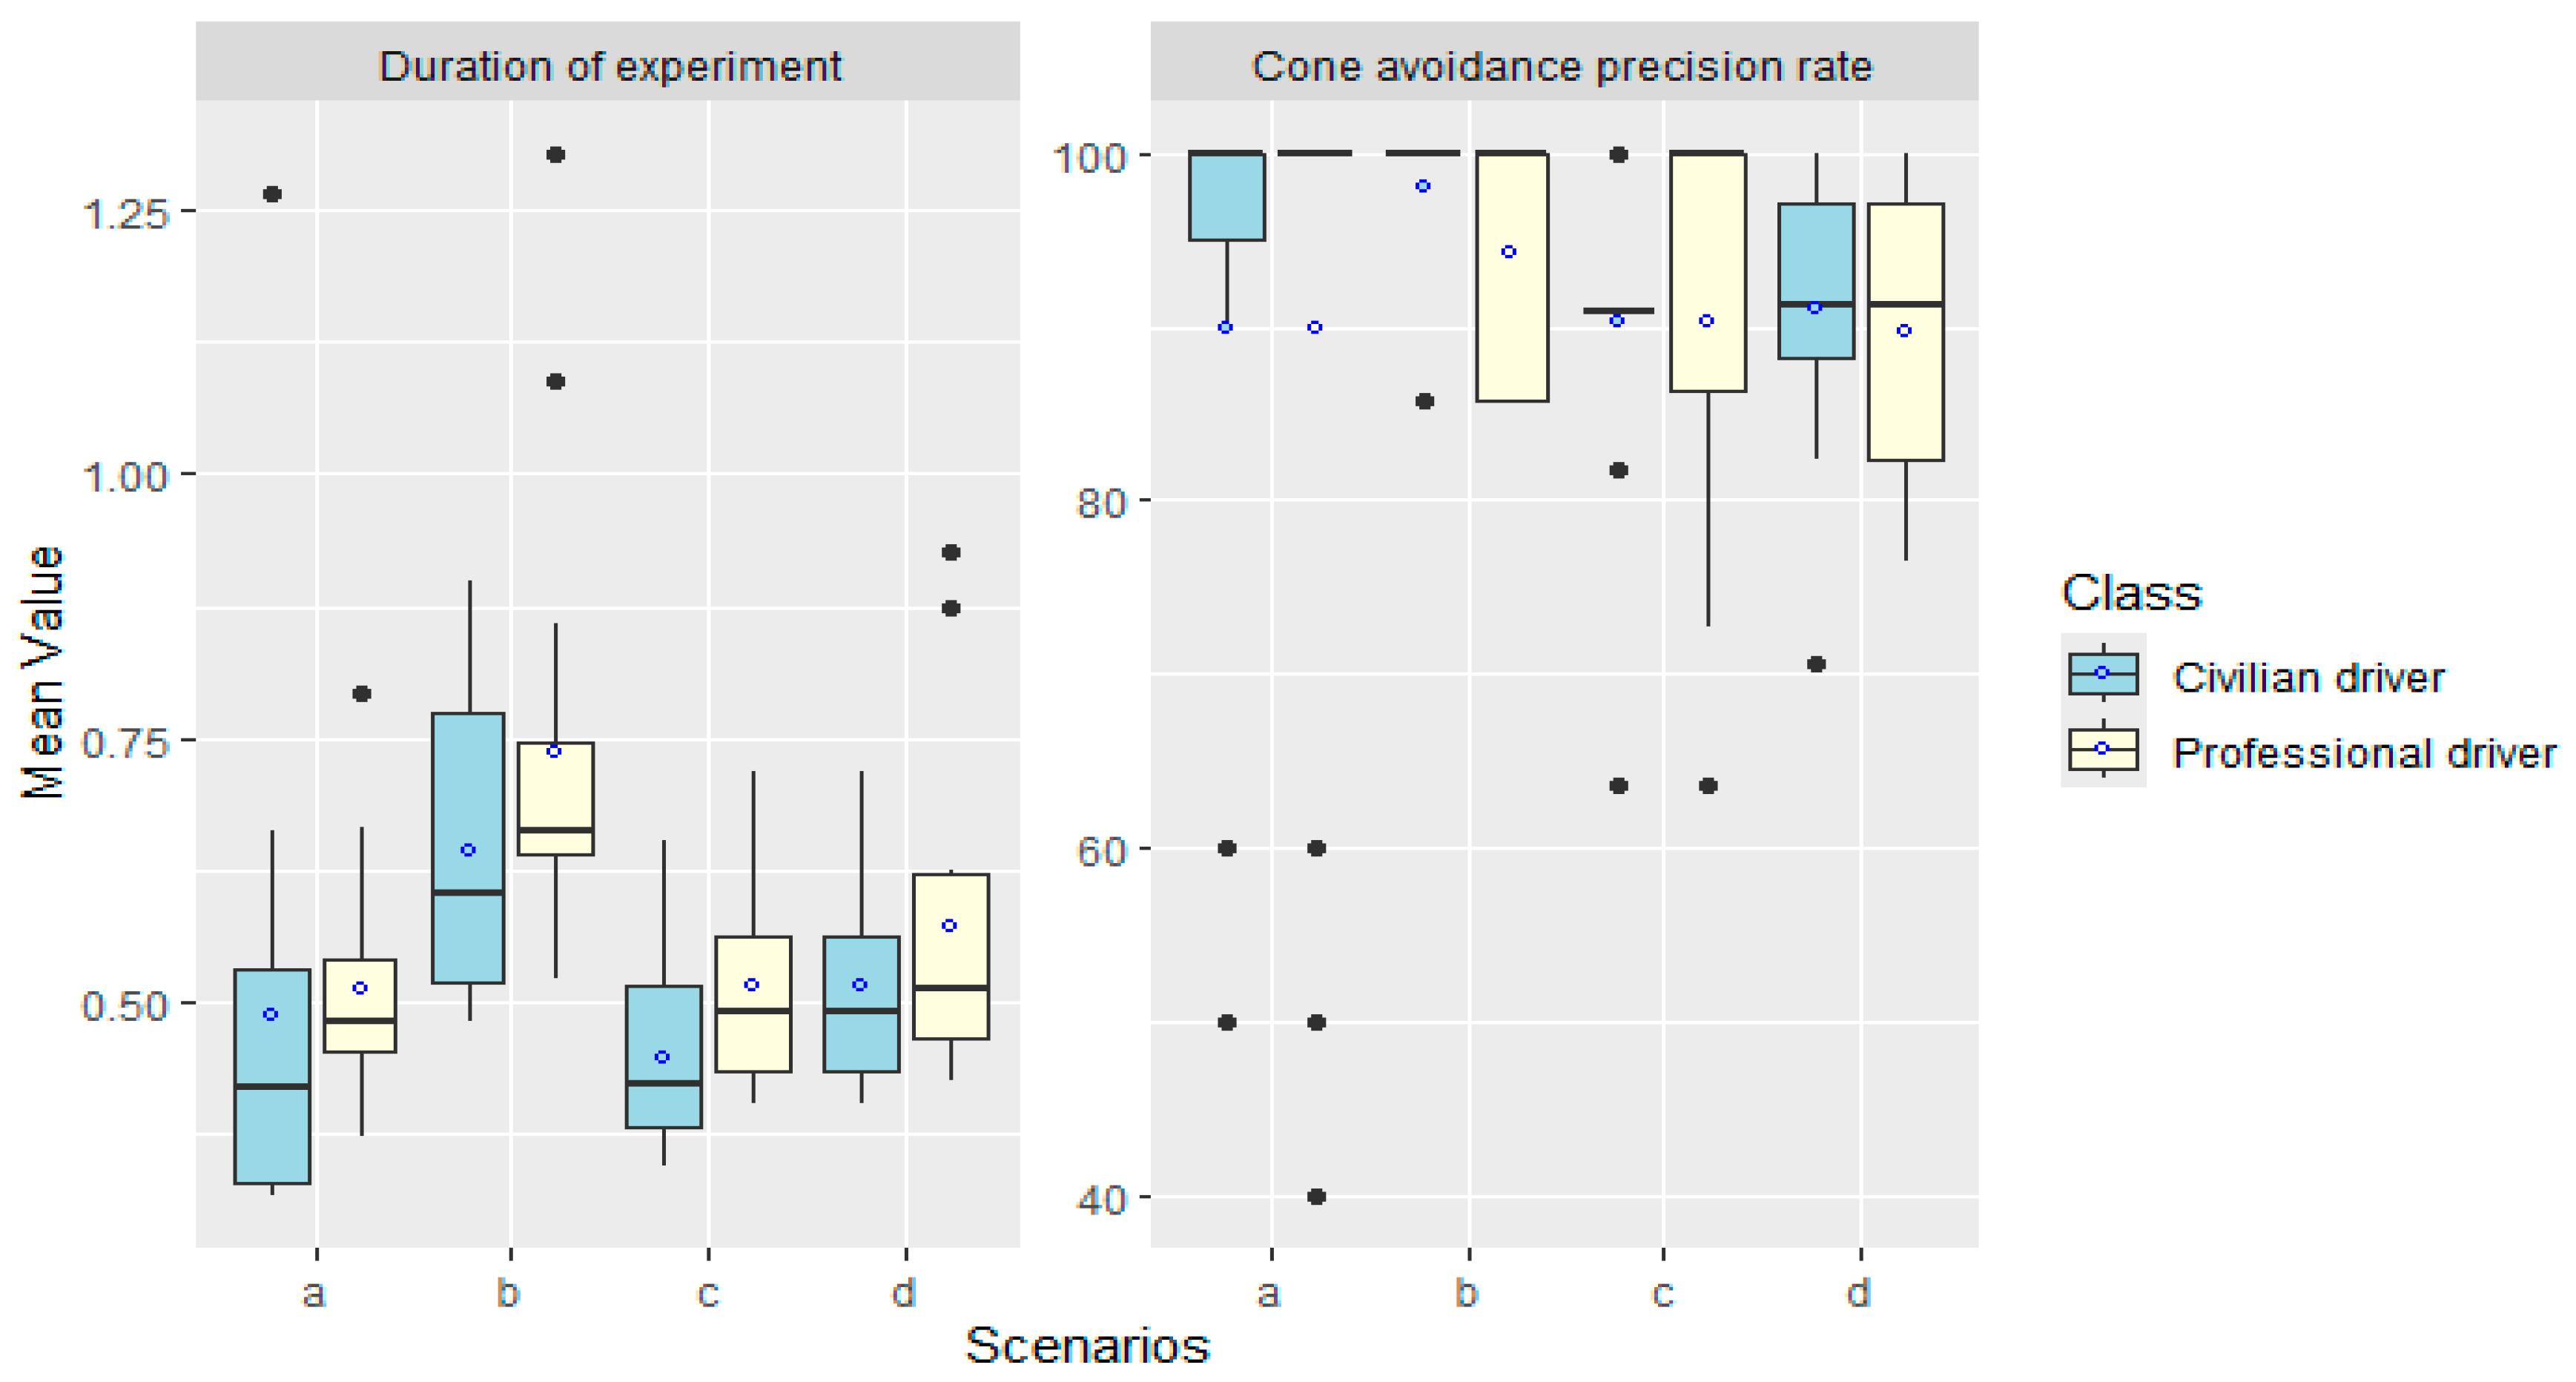
The cone avoidance precision rate directly reflects how successful a driver is. The metric distribution for each driver class per scenario is illustrated in Figure 7. The results of scenarios (a) and (b) show that both classes achieved high performance through high avoidance rates, with different variabilities. In the last scenario (the most difficult one), both classes performed similarly. Although professional drivers’ cone avoidance precision rate was characterized by higher variability than that of civilians, overall, their scores did not appear different. This visualization is supported by the results of the mixed ANCOVA, illustrated in Table 6. The main effect of class on the precision rate was not significant (p = 0.1863). Furthermore, the interaction between class and scenario was not significant (p = 0.7661), which means professionals and civilians had similar patterns throughout the scenarios. Notably, the scenario had a significant effect on the cone avoidance precision rate (p = 0.0022). Based on the post hoc pairwise comparisons, the significance for the scenario was driven mainly by the elevation of scenario (b) relative to the others, as scenario (b) consistently produced a higher score than scenarios (a), (c), and (d). Regarding age, it was a strong negative predictor of this metric (p = 0.0052). As age increased, the cone avoidance precision rate decreased significantly.
As for the duration of the experiment, the mixed-design ANCOVA results revealed similar results to those on speed. Where the effects of both class and scenario were significant (p = 0.034 and p <0.0001, respectively). The duration of the experiment differed significantly between the groups and across the four scenarios. Our pairwise comparisons revealed that among civilians, only scenario (b) scored substantially higher than scenarios (c) and (d) (estimated difference = 0.26 (p < 0.0001) and estimated difference = 0.21 (p = 0.0033), respectively). Furthermore, among professional drivers, scenario (b) scored significantly higher than scenarios (c) and (a) (estimated difference = 0.15 (p = 0.02) and estimated difference = 0.23 (p = 0.0030), respectively). The group effect was consistent across scenarios, as the class x scenario interaction was not significant. Like speed, the effect of age on the experiment duration differed across scenarios. Simple slope analyses indicated that age positively predicted the duration of the experiment in scenario (a) (slope = 0.011, 95% CI: [0.003, 0.018], and p < 0.01), and scenario (b) (slope = 0.009, 95% CI: [0.001, 0.016], and p < 0.05), but not in scenarios (c) or (d) (ps > 0.10). As age increased, the duration of the experiment increased significantly in scenarios (a) and (b).
Driving Visual Behavior and Physiological Response Metrics
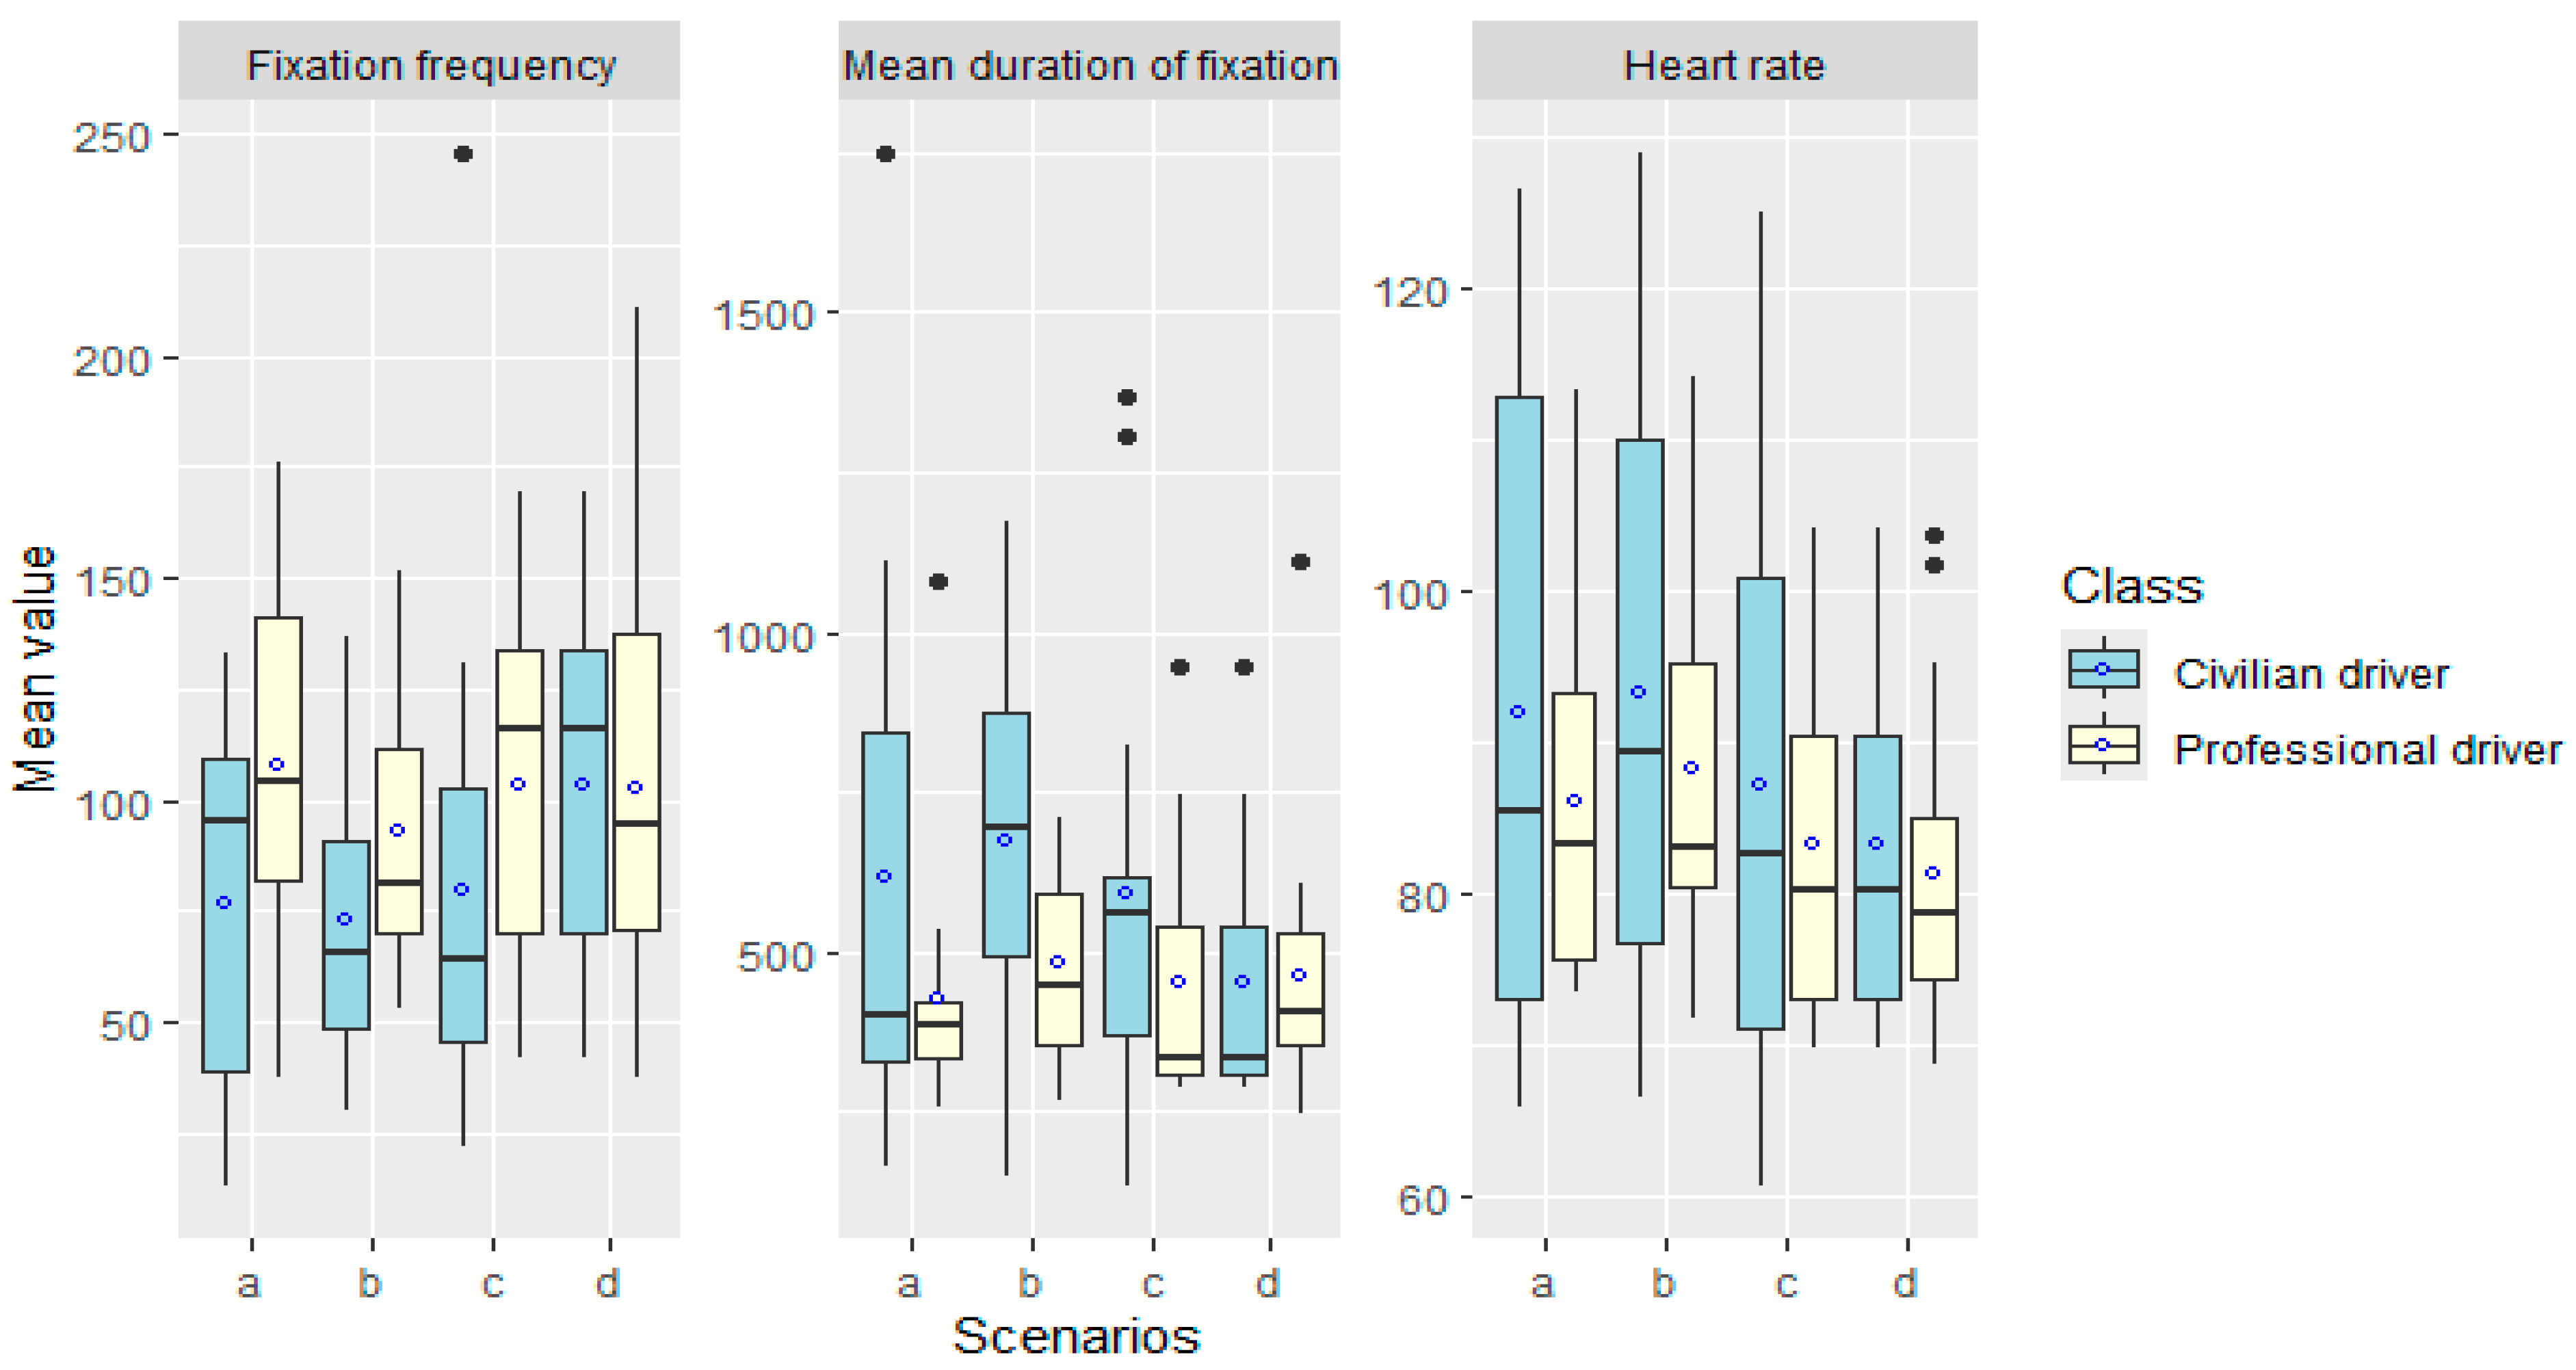
In terms of visual behavior, the modeling results indicate that the scenario and age main effects were not significant for fixation frequency and the mean duration of fixation. The interaction between class and scenario also had no statistically significant effect on both metrics (p = 0.4526 and p= 0.1298). Overall, the visual behavior of both driver groups had the same pattern across the four scenarios. The distribution of the visual metrics, as depicted in Figure 7, clearly illustrated this pattern. Notably, the mean fixation frequency differed significantly between the two groups (p = 0.0441). However, the post hoc pairwise comparison between civilian and professional drivers did not reach statistical significance (estimate = −14.3, SE = 12.9, t (27) = −1.11, and p = 0.28). Professionals showed a higher mean fixation frequency than civilians, even though the difference between the two classes was not strong enough to be statistically significant.
Regarding the heart rate results, both groups had no significant difference (p = 0.3453). However, the heart rate mean was significantly different across scenarios (p = 0.0021), with lower values in scenarios (c) and (d) compared with (a). The post hoc pairwise comparisons were not significant, though the contrast between scenarios (b) and (d) approached significance (p = 0.055). Furthermore, the class × scenario interaction had no significant effect on the mean heart rate (p = 0.8392), suggesting similar patterns between both groups across all the scenarios (Figure 8). For this metric, age was a strong negative predictor of heart rate (p = 0.0188). Consequently, the interaction between scenario and age had a significant effect on heart rate (p = 0.0001). The relationship between age and heart rate depended on the scenario. The model estimates indicated that, despite older participants exhibiting lower heart rates in scenario (a), they demonstrated relatively higher heart rate scores in scenarios (b), (c), and (d) compared with younger participants.

3.3. Motorway Test Scenario

Since the motorway scenario was a longer and more complicated task, involving the management of an unexpected event, it was analyzed separately. Except for the cone avoidance precision rate, the same metrics as cone avoidance scenarios were collected and analyzed. Moreover, the brake metric was analyzed. The descriptive statistics, parametric and non-parametric analyses, and subjective assessments are presented as follows.

3.3.1. Descriptive Statistics of Motorway Task

For the comparison of civilian and professional drivers in the motorway scenario, the descriptive statistics (means, medians, and standard deviations) are summarized in Table 8. Overall, the mean values of the driving metrics of civilian drivers were close to those of professional ones.
Based on the participants’ recorded videos, we identified four cases of how drivers managed the unexpected event. The cases are illustrated in Table 9. Interestingly, 20% of civilian drivers and professional drivers collided even with the use of brakes. Disregarding the braking maneuvers, 73% of civilians and 60% of professionals succeeded in the task by avoiding the accident from the left. While only 1 civilian driver broke and then passed in the same lane, 20% of professionals followed the same management.

3.3.2. Inferential Analysis

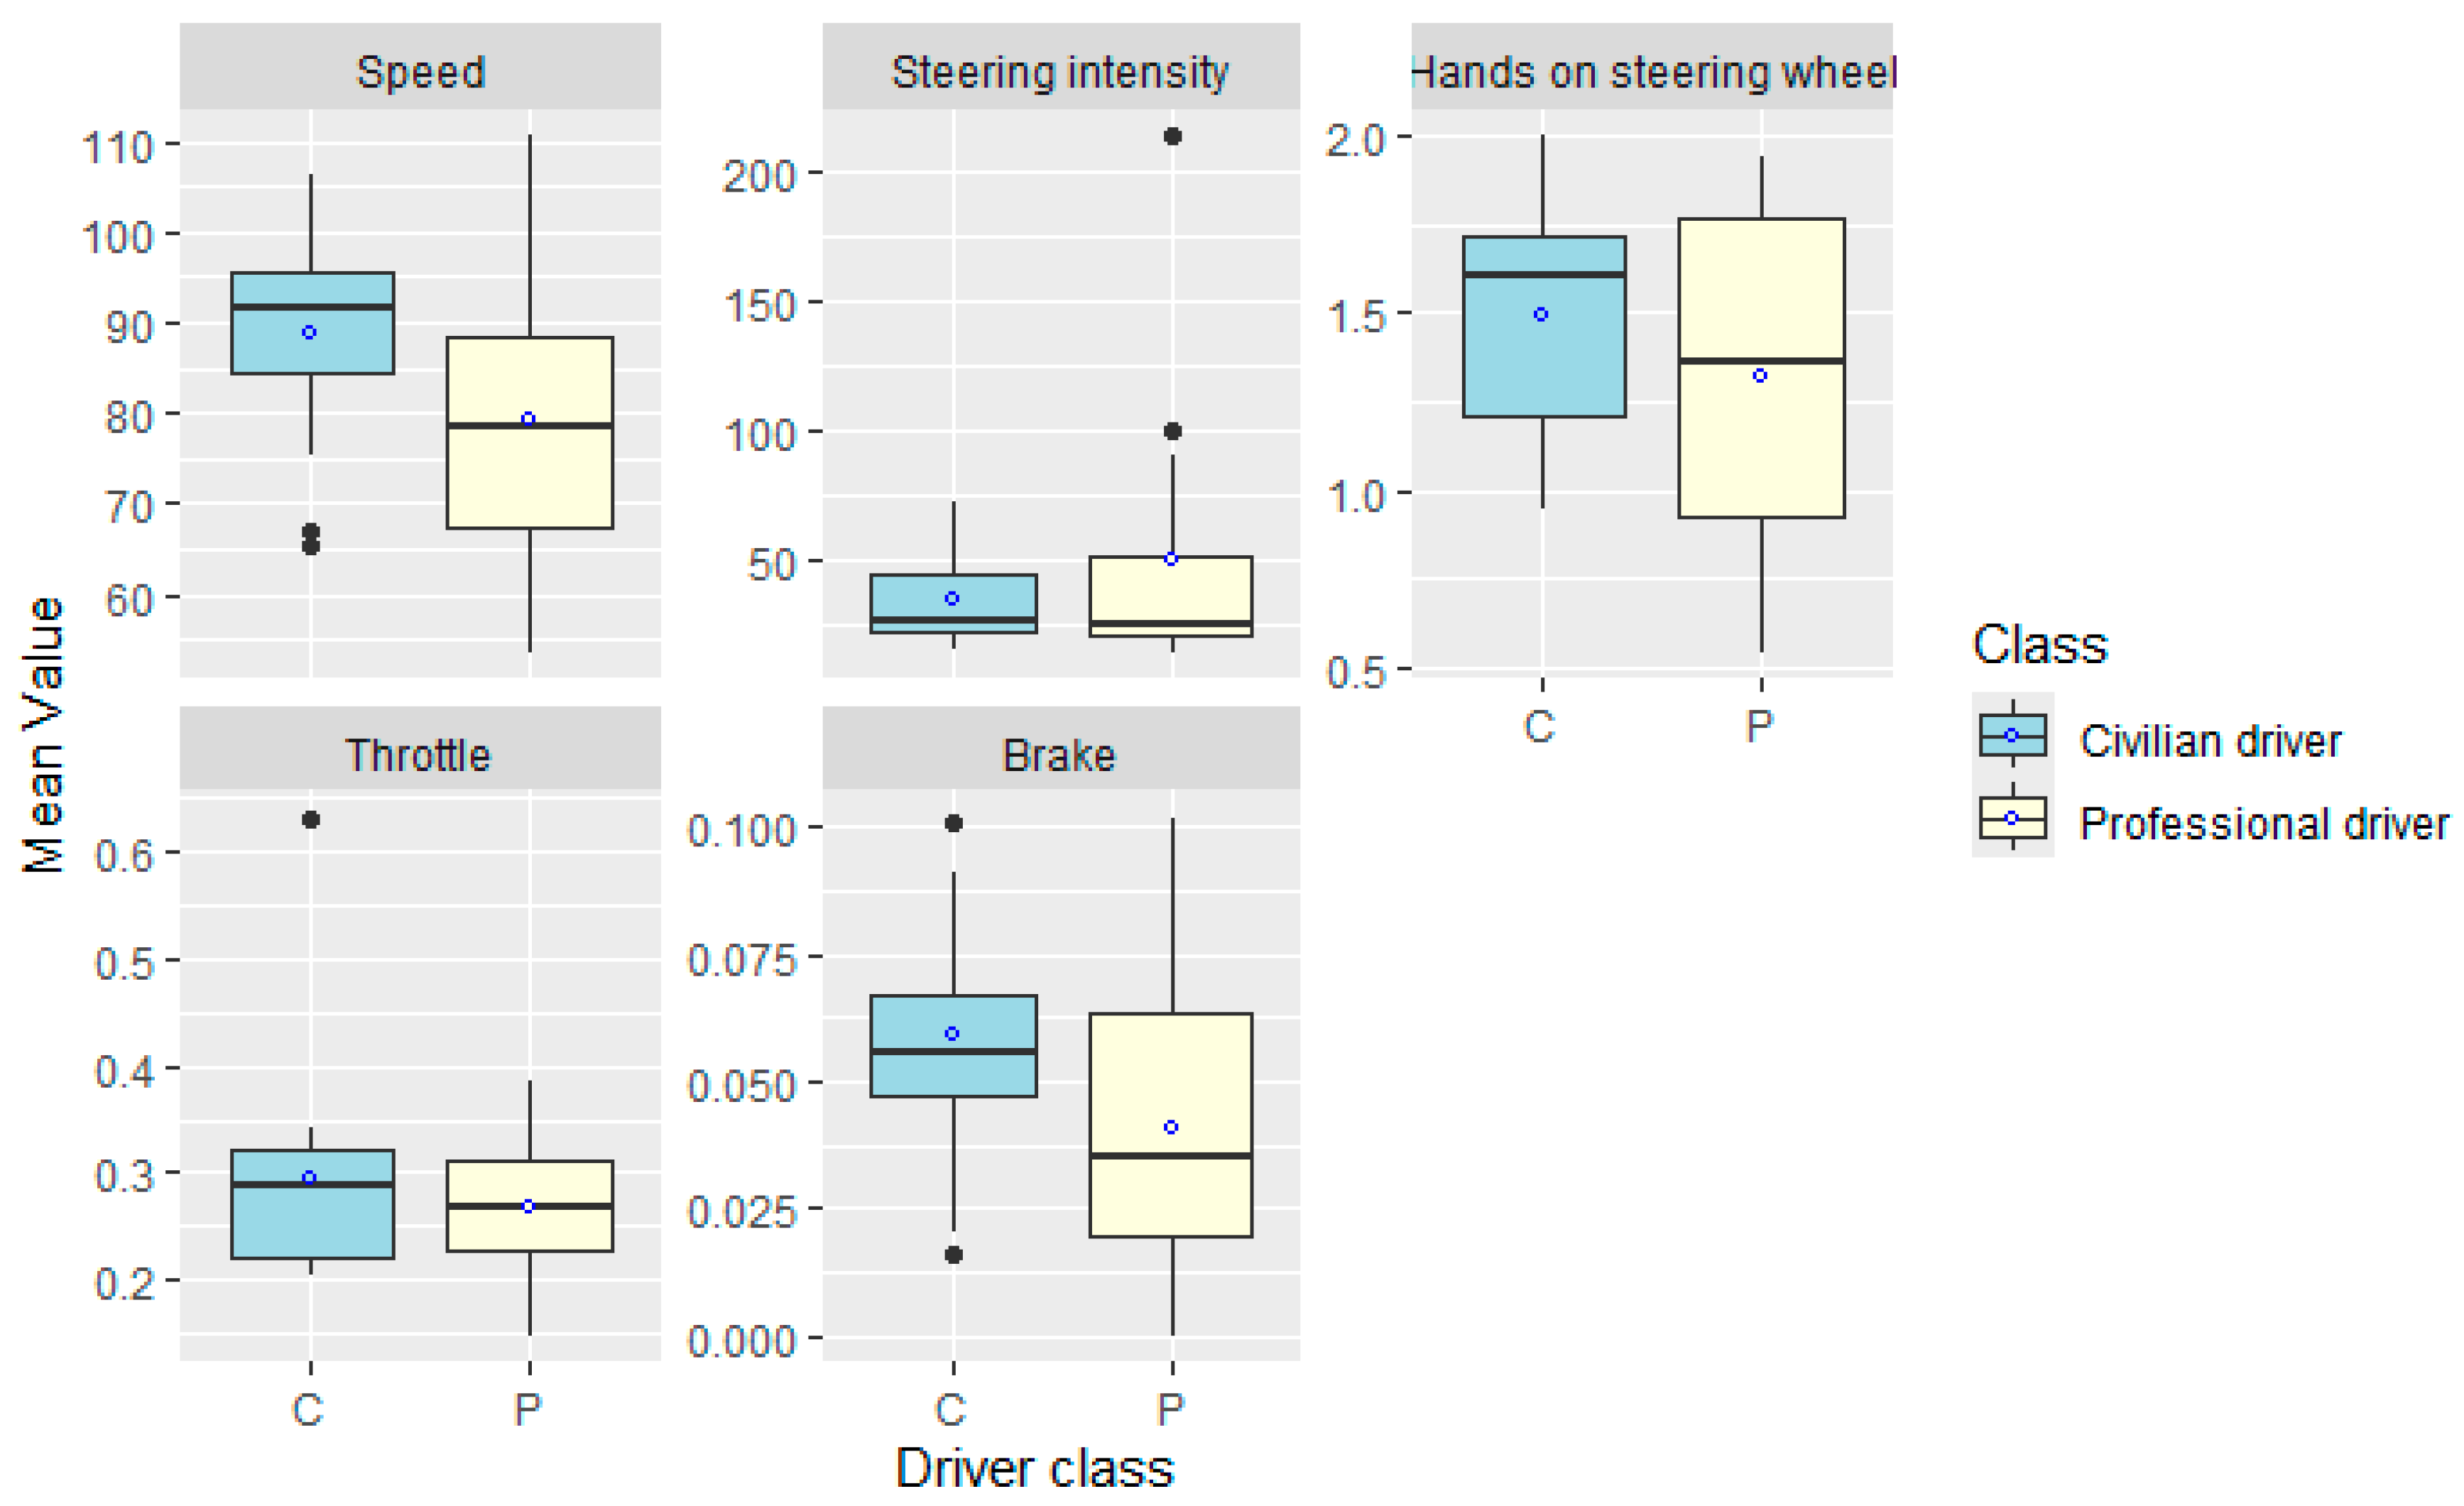
Interestingly, none of the statistical tests revealed a significant difference between the two driver groups in terms of driving metrics (Table 10). On average, professionals required more time to complete the motorway segment (M = 1.14 min) than civilians (M = 0.97 min), an approximate 17.5% increase. Civilians maintained a higher mean speed (M = 88.7 km/h) compared with professionals (M = 79.2 km/h), a 12% increase that did not reach statistical significance (p = 0.08). Based on the speed distribution illustrated in Figure 9, professionals also had higher variability. These findings indicate that professionals reduced their speed, resulting in longer completion times and suggesting a more controlled driving strategy.
As for the remaining set of indicators, including steering, throttle, braking, and hands-on-wheel behaviors, professionals demonstrated a 40% increase in steering intensity, a 7% reduction in throttle input, and a 33% decrease in braking activity compared with civilians. While most group differences did not reach statistical significance, braking behavior showed a marginal trend (p = 0.08). This finding suggests that professionals used less sudden deceleration, consistent with anticipatory control and smoother vehicle handling. Hands-on-wheel contact was 12% lower among professionals, indicating a more relaxed grip, although this difference was not statistically significant. Overall, higher variability could be noticed among professionals compared with civilian drivers.
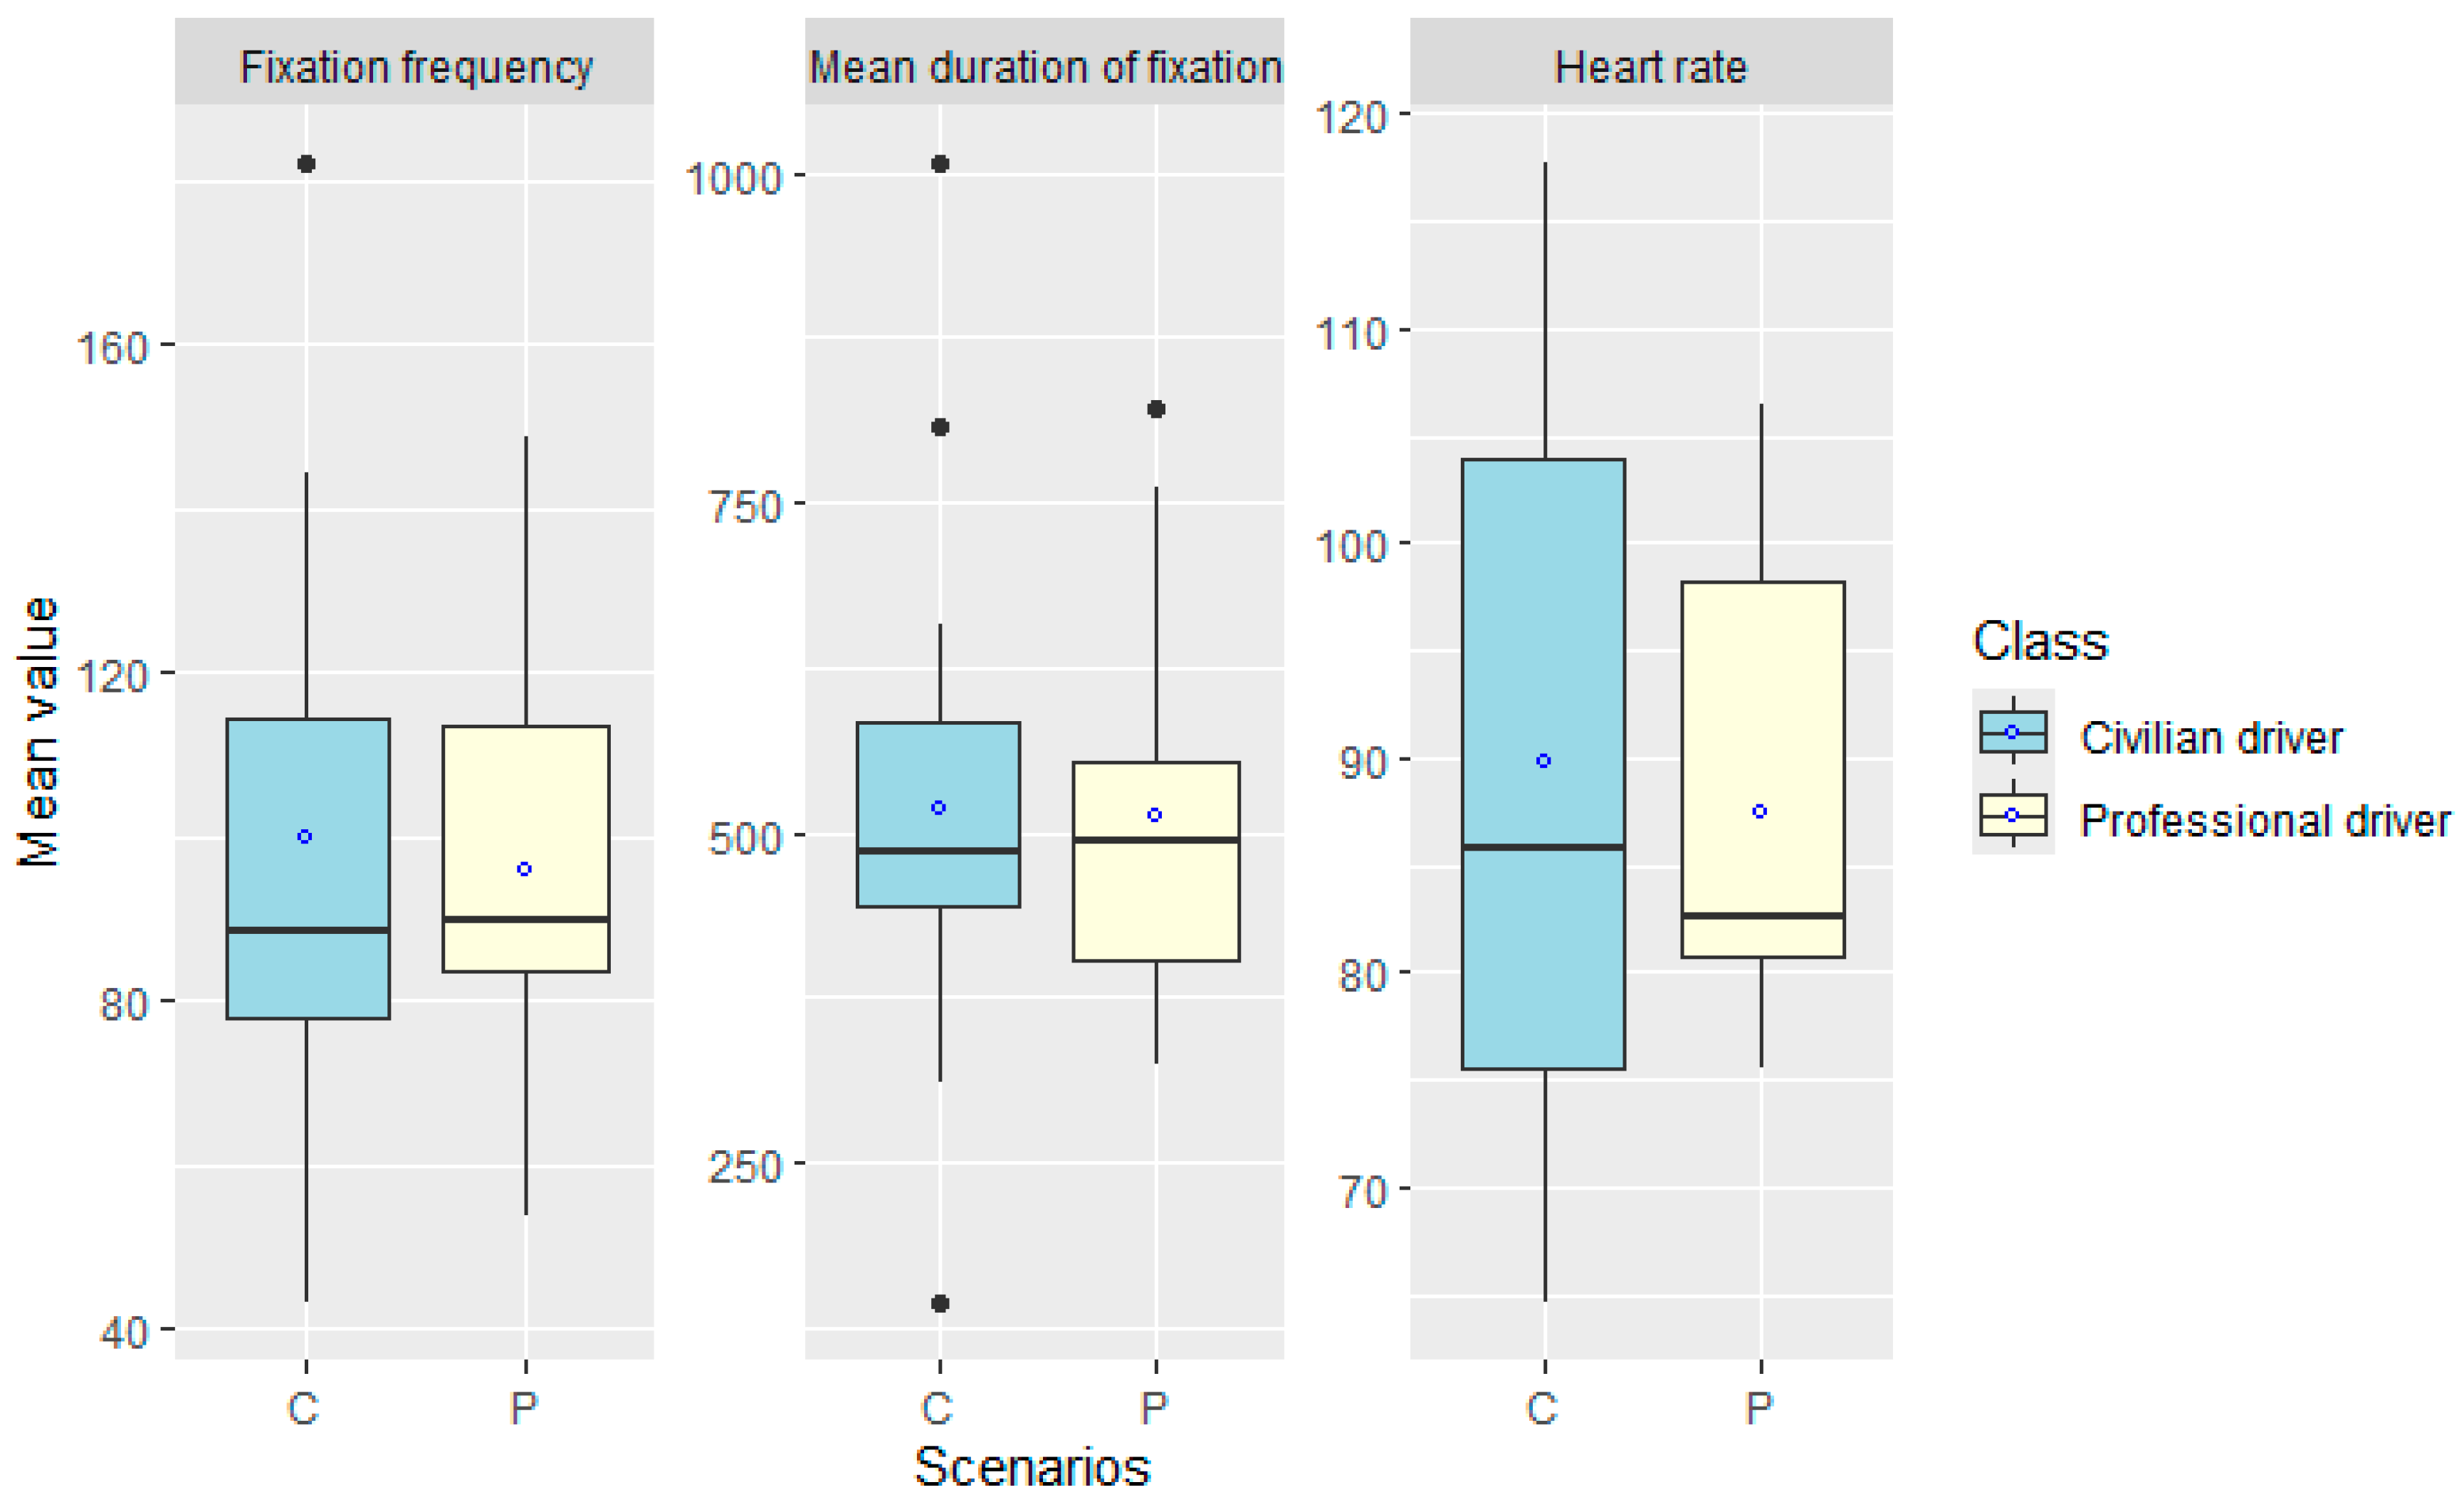
For physiological measures, professionals exhibited a 3% lower mean heart rate, a difference that was not statistically significant (p = 0.67523). Fixation metrics showed nearly identical mean fixation durations (518 ms for professionals and 513 ms for civilians). This scanning pattern was consistent with enhanced situational awareness. The fixation frequency per minute was 4% lower than for professionals, likely due to their longer task durations. Graphically, the distribution of these metrics among civilians was approximately like that of professionals, with higher variability among professionals (Figure 10).

3.3.3. Subjective Assessment

Overall, participants rated the motorway test higher than the cone avoidance scenarios. With an average score of (5.23/7), participants rated their performance success. Figure 11 illustrates the average scores of participants’ subjective assessments of the realism of the scenario, subjective control over the vehicle, and self-assessed success on a seven-point Likert scale. In terms of the realism of the scenario, the results of the Wilcoxon rank-sum test revealed a statistically significant difference between the driver groups (p-value = 0.017 < 0.05). Professional drivers showed a larger increase in the rating from the cone avoidance scenarios to the motorway scenario compared with civilian drivers. As for subjective control over the vehicle, the Wilcoxon rank-sum test indicated no statistically significant difference between the driver groups in how they rated the cone avoidance and motorway tests (p-value = 0.49 > 0.05). Similar results were found for the self-assessed success scores (p-value = 0.20 > 0.05).

4. Discussion

The main goal of this study was to thoroughly compare the driving performance, behavior, and underlying physiological and visual responses of civilian and professional drivers in a high-fidelity simulated environment. To achieve this, we used a new, two-part approach, including (I) a structured cone avoidance test designed to challenge technical maneuvering skills, and (II) a realistic motorway test that incorporated both NDRT and UEM. In the next section, we examine the data in light of our initial hypotheses to draw conclusions about how experience differently affects various driving demands.

4.1. Hypotheses

4.1.1. Hypothesis 1: Civilian Drivers Have Lower Driving Performance than Professional Drivers

The results from both case (I) and case (II) collectively present a significant and unexpected finding: contrary to the established literature on the benefits of extensive driving experience, civilian drivers performed comparably to their professional counterparts in terms of overall precision and collision rate. Although professional drivers possessed twice the average years of experience, the cone avoidance precision rates were statistically close, and in the motorway test, collision rates were identical. This finding necessitates a deep exploration into the specific constraints of the experimental design that may have suppressed the expected advantage of professional expertise.
The lack of difference in performance is primarily explained by the interaction between scenario difficulty and participant characteristics, as shown by the mixed ANCOVA results (Table 7). Case (I) scenarios were likely insufficiently difficult or too short in duration to fully activate the complex, long-term anticipation and planning skills that define professional driving. Specifically, the cone avoidance test functioned more as a measure of acute vehicle control and reaction rather than strategic navigation. Scenario (b), which required the most technical precision and was the first complex task, consistently yielded a higher score. Psychologically, this novelty may have boosted the motivation and engagement of the civilian group, compensating for their lack of experience. Furthermore, civilians’ tendency to finish tasks faster than professionals suggests a distinct motivation: prioritizing speed over deliberate precision, which happened to yield comparable success in the low-consequence simulated environment [32].
A critical factor obscuring the professional/civilian distinction was the high variability in age and the inherent limitations of the driving simulator. Our findings, in line with Lee and Kawabata’s findings, show that increasing age significantly and negatively impacts driving skills, with older participants exhibiting lower cone avoidance precision and longer task durations due to reduced reaction times [32,33]. Crucially, the limited ecological validity of the simulator may have disproportionately affected older participants, who may struggle more with the unfamiliar controls, display systems, or the lack of vestibular feedback, thus compounding age-related performance decline, regardless of their professional status [32]. The simulator’s characteristics, therefore, acted as a confounding variable that attenuated the expected benefit of professional experience.
This result—the failure of professionals to significantly outperform civilians—contrasts sharply with foundational studies in driving expertise, which have often found that professionals demonstrate superior hazard detection, scanning strategies, and vehicle stability [34]. The difference suggests a ceiling effect for the performance metrics measured, particularly in case (II), where all participants successfully managed the NDRT and subsequent collision event. The task design, emphasizing quick, localized maneuvers, rather than long-term hazard prediction, likely failed to capture the superior mental models and risk perception habits that professional training instills [35]. This warrants future research using tasks specifically calibrated to stress the high-level strategic and anticipatory skills of experts.

4.1.2. Hypothesis 2: In Terms of Driving Behavior, Civilian Drivers Maintain Significantly Lower Control and Stability Compared with Professional Drivers

The results of case (I) reveal distinct findings. Civilians’ speed and throttle metrics were significantly higher than those of professional drivers. Both the class membership and the scenario were the main factors explaining the significance. Regarding age’s effect on speed, it depended on the scenario. In scenarios (a) and (b), older participants had lower speed. No significant effect of age was noticed across scenarios (c) and (d). A possible explanation of this pattern is the progression of the experiment, where participants tended to begin cautiously and later became more engaged and confident. Regarding the steering intensity and hands on steering wheel modeling results, there was no significant mean difference between professional and civilian drivers in scores across the four scenarios. However, the significant inconsistency in the steering intensity between scenarios is logical given the nature of the scenarios. In the first scenario, there was no cone to avoid in the middle of the path, and the driver only needed to drive in a straight line, requiring minimal steering input. However, in the other scenarios, the tasks involved avoiding cones, resulting in making turns and following curves, which naturally required greater use of the steering wheel. Professional drivers had a higher mean steering intensity in scenarios (b) and (c), which showed the more precise and tactile control of the vehicle based on their experience.
In terms of metrics, the findings suggest that professional drivers approached the motorway scenario with greater deliberation and control, as indicated by slightly longer completion times and reduced braking. Civilians prioritized speed, as shown by higher values and increased reliance on braking.

4.1.3. Hypothesis 3: Civilian Drivers Have Significantly Lower Visual Attention and Higher Heart Rate Responses Compared with Professional Drivers

The physiological and oculomotor data demonstrate that professionals maintained a calmer physiological state (lower heart rate) and employed a scanning strategy with more frequent fixations. However, the low heart rate is attributable not only to participants’ confidence or experience but also to an age-related reduction in heart rate [36]. Despite older participants exhibiting lower heart rates in scenario (a), they demonstrated relatively higher heart rate scores in scenarios (b), (c), and (d) compared with younger participants. This pattern may be explained by the complexity of the latter scenarios, the challenging driving, and the increasing perceived risk. Furthermore, professionals showed a higher mean fixation frequency than civilians, even though the difference between the two classes was not strong enough to be statistically significant. These results support the conclusion that professional drivers emphasize anticipation, stability, and safety, whereas civilians display a faster and more reactive driving style. In the motorway scenario, mainly the visual behaviors and physiological responses revealed no significant differences between the groups.

4.2. Self-Assessment

Subjectively, in terms of the realistic assessment, professional drivers showed a significant increase in the rating from the cone avoidance scenarios to the motorway scenario compared with the civilian drivers. This difference may reflect the familiarity and experience of professionals with motorway conditions. Professional drivers reported longer driving distances. Their experience on motorways helped them to be accustomed to sustained focus and rapid decision making. Another potential explanation is the order effect. Since the motorway scenario was tested after the cone avoidance scenarios, these latter scenarios may have facilitated the cognitive activation of participants, serving as a “warm-up”. Furthermore, the recency effect may have affected participants’ ratings, as professionals may have remembered the last scenario more precisely and rated it higher [37].

4.3. Limitations and Future Work

The findings of this study should be viewed in light of several important methodological limitations. First, our non-randomized recruitment led to a small and uneven sample size, resulting in a high degree of variability and notable group differences between professional and civilian drivers, especially regarding age and baseline experience. This high potential for age bias is a critical concern, as older participants were overrepresented in certain groups. Although we attempted to reduce the effect of age by including it as a covariate in the ANCOVA, the lack of initial control limits the broader applicability of the results.
Second, relying on a simulator raises concerns about limited real-world relevance. Despite the high-fidelity setup, the simulated environment could not fully capture the complex sensory and psychological demands of actual driving. This limitation might have particularly affected the performance and physiological responses of older drivers or professionals familiar with a vehicle’s specific tactile feedback.
Third, due to data collection limitations, we were unable to measure reaction times during the critical motorway scenario, which is a significant gap in understanding cognitive processing speed related to hazard avoidance (UEM). Finally, the need to evaluate cone avoidance scenarios collectively in the subjective assessment may have overlooked subtle perceptual differences tied to the complexity of individual scenarios.
Future work should aim to address these limitations by recruiting a more representative sample. Considering balanced gender representation would serve a more comprehensive analysis. Additionally, we should incorporate reaction time measurement to gain a comprehensive understanding of cognitive and behavioral responses. Since Hypothesis 1 was not supported (yielding a similar performance), future work should explicitly test a scenario with greater complexity or longer duration that could better distinguish experienced professional drivers. Because visual attention (fixation frequency) showed a non-significant trend (Hypothesis 3), future research should propose using a more sensitive eye-tracking metric (e.g., pupil diameter and scan path complexity) to detect subtle differences. It would also be valuable to test the effect of several types of NDRTs. Lastly, it would be beneficial to have more structured qualitative measures that enhance the applicability of the research findings.

5. Conclusions

This exploratory study conducted a comprehensive behavioral and performance analysis of civilian and professional drivers in a high-fidelity simulated environment. Our findings revealed a degree of performance and physiological similarity between the two groups that largely contradicted our initial hypotheses. In the cone avoidance scenarios, civilian drivers exhibited comparable precision, visual behavior, and physiological responses, with significant differences noted only in metrics such as speed and throttle input. Crucially, the ecologically valid motorway scenario yielded no significant differences across most key metrics, including collision rates.
While these findings—derived from a sample with heterogeneity in age and experience—do not invalidate professional training, they highlight the specific conditions under which expertise manifests or is obscured. The observed interaction between participant age and simulator performance strongly suggests that the simulation environment acted as a confounding variable, attenuating the expected benefits of professional experience. Furthermore, the task design, which emphasized acute maneuvering over strategic planning, may have failed to fully capture the superior mental models and risk anticipation that professional training aims to instill.
These results have significant practical implications for driver evaluation and training design. Training curricula should shift their focus from simple, technical precision drills toward complex, prolonged, and ecologically valid scenarios to specifically target and strengthen the advanced strategic planning and risk management skills that differentiate experts in real-world driving. Accordingly, driver evaluation protocols should move beyond basic task completion rates to incorporate more sensitive behavioral indicators of deliberation and control (e.g., consistent speed management and minimal unnecessary braking) as primary markers of professional competency. To validate these preliminary results, future research must prioritize large, age-matched cohorts and employ tasks with a significantly higher cognitive load and longer duration. This approach will help overcome potential ceiling effects and allow for the detection of subtle differences through more sensitive physiological measures (e.g., pupil metrics), ultimately leading to actionable recommendations for revising training programs and better supporting older professional drivers.
Author Contributions

Conceptualization, V.N., Á.P.S., G.K., H.E., and G.P.; methodology, V.N., Á.P.S., and G.K.; software, Á.P.S.; validation, V.N., G.K., H.E., and G.P.; formal analysis, V.N. and Á.P.S.; investigation, V.N., Á.P.S., and H.E.; resources, V.N. and Á.P.S.; data curation, V.N. and Á.P.S.; writing—original draft preparation, V.N. and Á.P.S.; writing—review and editing, V.N., G.K., and G.P.; visualization, V.N.; supervision, G.K., H.E., and G.P.; project administration, V.N.; funding acquisition, V.N. and G.P. All authors have read and agreed to the published version of the manuscript.

Funding

This research received no external funding.

Institutional Review Board Statement

Science Ethics Committee of the Scientific Advisory Board, Széchenyi István University, SZE/ETT-69/2025.

Informed Consent Statement

Written informed consent was obtained from the participants to publish this paper.

Data Availability Statement

The original contributions presented in this study are included in this article. Further inquiries can be directed to the corresponding author.

Acknowledgments

This research was supported by the European Union within the framework of the National Laboratory for Artificial Intelligence (RRF-2.3.1-21-2022-00004) and Next-Generation EU through the National Centre for HPC, Big Data and Quantum Computing, Mission 4 Component 2, Investment 1.4, CUP E63C22001000006.

Conflicts of Interest

The authors declare no conflicts of interest.

Appendix A

Table A1. Assumptions of statistical models.
Dependent VariablesLinearityHomogeneity of Regression SlopesNormalityOutliersHomogeneity of Variance of Model
Cone avoidance precision rateYesYesQ–Q plot of normalized residuals indicated approximate normality; deviations at the tails were observed, but no extreme outliers were present.No extreme outliersp-value < 0.05. The homogeneity of variance assumption was not met. Therefore, the model with variance structure was the more appropriate model.
Duration of experimentYesNoResidual diagnostics indicated approximate normality; minor deviations that are unlikely to affect model estimates.No extreme outliersp-value < 0.05. The homogeneity of variance assumption was not met. Therefore, the model with variance structure was the more appropriate model.
Speed (km/h)YesNoQ–Q plot of normalized residuals indicated approximate normality; minor deviations at the tails were observed, but no extreme outliers were present.No extreme outliersp-value < 0.05. The homogeneity of variance assumption was not met. Therefore, the model with variance structure was the more appropriate model.
Steering intensityYesNoResidual diagnostics indicated approximate normality; minor deviations that are unlikely to affect model estimates.No extreme outliersp-value < 0.05. The homogeneity of variance assumption was not met. Therefore, the model with variance structure was the more appropriate model.
Hands on steering wheelYesYesResidual diagnostics indicated normality.No extreme outliersp-value > 0.05 → no evidence against homogeneity.
ThrottleYesYesQ–Q plot of normalized residuals indicated approximate normality; deviations at the tails were observedNo extreme outliersp-value < 0.05. The homogeneity of variance assumption was not met. Therefore, the model with variance structure was the more appropriate model.
Mean duration of fixationYesYesQ–Q plot of normalized residuals indicated approximate normality; deviations at the tails were observed.No extreme outliersp < 0.05. The homogeneity of variance assumption was not met. Therefore, the model with variance structure was the more appropriate model.
Fixation frequencyYesYesResidual diagnostics indicated approximate normality and no subject-level outliers; only one deviation.No extreme outliersp < 0.05. The homogeneity of variance assumption was not met. Therefore, the model with variance structure was the more appropriate model.
Heart rateYesNoResidual diagnostics indicated approximate normality and no subject-level outlier; only one deviation.No extreme outliersp < 0.05. The homogeneity of variance assumption was not met. Therefore, the model with variance structure was the more appropriate model.
Table A2. Assumption of Methods.
LinearityHomogeneity of Regression SlopesNormalityOutliersHomogeneity of Variance of Model
MethodWe performed a graphical check of the linearity of the covariate with the dependent variable.We checked if the relationship between the covariate (age) and the dependent variable was the same across groups and scenarios. If the slope differed significantly by group/scenario, the assumption was violated. We retained the interaction term in the mixed ANCOVA model, refitted the model, and continued checking the remaining assumptions.shapiro.test() was only used as a rough guide (it is very sensitive to n, and our sample was small), but, mainly, we focused on the Q–Q plot of normalized residuals.We used standardized (Pearson) residuals from the mixed model. Residuals greater than |3| were considered as outliers. Moreover, visually, we inspected fitted values versus Pearson residuals. Also, per subject, we computed the mean residuals.We carried out a graphical check of the variance and compared the fit of the homoscedastic model vs. the heteroscedastic model (model with variance).

References

  1. Regan, M.A.; Lee, J.D.; Young, K.L. Driver Distraction Theory, Effects, and Mitigation; CRC Press: Boca Raton, FL, USA, 2009; ISBN 978-0-8493-7426-5. [Google Scholar]
  2. Regan, M.A.; Hallett, C. Driver Distraction: Definition, Mechanisms, Effects, and Mitigation; Elsevier: Amsterdam, The Netherlands, 2011; ISBN 9780123819840. [Google Scholar]
  3. Kircher, K.; Ahlstrom, C. Minimum Required Attention: A Human-Centered Approach to Driver Inattention. Hum. Factors 2017, 59, 471–484. [Google Scholar] [CrossRef] [PubMed]
  4. Ito, H.; Atsumi, B.; Uno, H.; Akamatsu, M. Visual Distraction While Driving. IATSS Res. 2001, 25, 20–28. [Google Scholar] [CrossRef]
  5. Victor, T. Analysis of Naturalistic Driving Study Data: Safer Glances, Driver Inattention, and Crash Risk; The National Academies Press: Washington, DC, USA, 2014. [Google Scholar] [CrossRef]
  6. The Royal Society for the Prevention of Accidents (ROSPA) Road Safety Factsheet: Driver Distraction. 2024. Available online: https://www.rospa.com/siteassets/pages/health-and-safety/health-and-safety-news/distracted-driver/distraction-factsheet-0524_1.pdf (accessed on 4 November 2025).
  7. Kchour, F.; Cafiso, S.; Pappalardo, G. Understanding Cyclists’ Visual Behavior Using Eye-Tracking Technology: A Systematic Review. Sensors 2025, 25, 22. [Google Scholar] [CrossRef]
  8. Underwood, G.; Chapman, P.; Brocklehurst, N.; Underwood, J.; Crundall, D. Visual Attention While Driving: Sequences of Eye Fixations Made by Experienced and Novice Drivers. Ergonomics 2003, 46, 629–646. [Google Scholar] [CrossRef]
  9. Liu, Y.-C. Comparative Study of the Effects of Auditory, Visual and Multimodality Displays on Drivers’ Performance in Advanced Traveller Information Systems. Ergonomics 2001, 44, 425–442. [Google Scholar] [CrossRef] [PubMed]
  10. Nagy, V.; Kovács, G.; Földesi, P.; Kurhan, D.; Sysyn, M.; Szalai, S.; Fischer, S. Testing Road Vehicle User Interfaces Concerning the Driver’s Cognitive Load. Infrastructures 2023, 8, 49. [Google Scholar] [CrossRef]
  11. Purucker, C.; Naujoks, F.; Prill, A.; Neukum, A. Evaluating Distraction of In-Vehicle Information Systems While Driving by Predicting Total Eyes-off-Road Times with Keystroke Level Modeling. Appl. Ergon. 2017, 58, 543–554. [Google Scholar] [CrossRef]
  12. Madlenak, R.; Masek, J.; Madlenakova, L.; Chinoracky, R. Eye-Tracking Investigation of the Train Driver’s: A Case Study. Appl. Sci. 2023, 13, 2437. [Google Scholar] [CrossRef]
  13. Bitkina, O.V.; Park, J.; Kim, H.K. The Ability of Eye-Tracking Metrics to Classify and Predict the Perceived Driving Workload. Int. J. Ind. Ergon. 2021, 86, 103193. [Google Scholar] [CrossRef]
  14. Le, A.S.; Suzuki, T.; Aoki, H. Evaluating Driver Cognitive Distraction by Eye Tracking: From Simulator to Driving. Transp. Res. Interdiscip. Perspect. 2020, 4, 100087. [Google Scholar] [CrossRef]
  15. Marquart, G.; Cabrall, C.; De Winter, J. Review of Eye-Related Measures of Drivers’ Mental Workload. Procedia. Manuf. 2015, 3, 2854–2861. [Google Scholar] [CrossRef]
  16. Mahanama, B.; Jayawardana, Y.; Rengarajan, S.; Jayawardena, G.; Chukoskie, L.; Snider, J.; Jayarathna, S. Eye Movement and Pupil Measures: A Review. Front. Comput. Sci. 2022, 3, 733531. [Google Scholar] [CrossRef]
  17. Biondi, F.N.; Saberi, B.; Graf, F.; Cort, J.; Pillai, P.; Balasingam, B. Distracted Worker: Using Pupil Size and Blink Rate to Detect Cognitive Load during Manufacturing Tasks. Appl. Ergon. 2023, 106, 103867. [Google Scholar] [CrossRef] [PubMed]
  18. Biondi, F.; Coleman, J.R.; Cooper, J.M.; Strayer, D.L. Average Heart Rate for Driver Monitoring Systems. Int. J. Hum. Factors Ergon. 2016, 4, 282–291. [Google Scholar] [CrossRef]
  19. Yaqoob, S.; Morabito, G.; Cafiso, S.; Pappalardo, G.; Ullah, A. AI-Driven Driver Behavior Assessment Through Vehicle and Health Monitoring for Safe Driving—A Survey. IEEE Access 2024, 12, 48044–48056. [Google Scholar] [CrossRef]
  20. Tarabay, R.; Abou-Zeid, M. A Dynamic Hybrid Choice Model to Quantify Stress in a Simulated Driving Environment. IEEE Trans. Intell. Transp. Syst. 2022, 23, 6390–6405. [Google Scholar] [CrossRef]
  21. Zhang, T.; Yang, J.; Liang, N.; Pitts, B.J.; Prakah-Asante, K.; Curry, R.; Duerstock, B.; Wachs, J.P.; Yu, D. Physiological Measurements of Situation Awareness: A Systematic Review. Hum. Factors 2023, 65, 737–758. [Google Scholar] [CrossRef]
  22. Wang, X.; Xu, R.; Zhang, S.; Zhuang, Y.; Wang, Y. Driver Distraction Detection Based on Vehicle Dynamics Using Naturalistic Driving Data. Transp. Res. Part C Emerg. Technol. 2022, 136, 103561. [Google Scholar] [CrossRef]
  23. Razzaghi, A.; Afshari, A.; Shahsavarinia, K.; Yazdani, M.; Nouri, A. Distraction and Related Risk Factors among Professional and Non-Professional Drivers. Heliyon 2024, 10, e31530. [Google Scholar] [CrossRef]
  24. Karimi, S.; Aghabayk, K.; Moridpour, S. Impact of Driving Style, Behaviour and Anger on Crash Involvement among Iranian Intercity Bus Drivers. IATSS Res. 2022, 46, 457–466. [Google Scholar] [CrossRef]
  25. Gershon, P.; Shinar, D.; Oron-Gilad, T.; Parmet, Y.; Ronen, A. Usage and Perceived Effectiveness of Fatigue Countermeasures for Professional and Nonprofessional Drivers. Accid. Anal. Prev. 2011, 43, 797–803. [Google Scholar] [CrossRef] [PubMed]
  26. Dorn, L.; Barker, D. The Effects of Driver Training on Simulated Driving Performance. Accid. Anal. Prev. 2005, 37, 63–69. [Google Scholar] [CrossRef]
  27. Berthelon, C.; Damm, L. Skills of Novices Early Trained or Traditionaly Trained versus Experienced Drivers Confronted to Simulated Urban Accidents’ Scenarios. Work 2012, 41, 4907–4909. [Google Scholar] [CrossRef]
  28. Kerruish, L.; Cheng, A.S.K.; Ting, K.H.; Liu, K.P.Y. Exploring the Sustained and Divided Attention of Novice versus Experienced Drivers. Transp. Res. Interdiscip. Perspect. 2022, 16, 100702. [Google Scholar] [CrossRef]
  29. Zou, Z.; Alnajjar, F.; Lwin, M.; Ali, L.; Al Jassmi, H.; Mubin, O.; Swavaf, M. A Preliminary Simulator Study on Exploring Responses of Drivers to Driving System Reminders on Four Stimuli in Vehicles. Sci. Rep. 2025, 15, 4009. [Google Scholar] [CrossRef]
  30. Zhang, N.; Yang, C.; Fard, M. Measured Increases in Steering Entropy May Predict When Performance Will Degrade: A Driving Simulator Study. Transp. Res. Part F Traffic Psychol. Behav. 2022, 91, 87–94. [Google Scholar] [CrossRef]
  31. Baumann, C.; Dierkes, K. Neon Accuracy Test Report—An Evaluation of Lab and In-The-Wild Performance; Pupil Labs: Berlin, Germany, 2023. [Google Scholar] [CrossRef]
  32. Lee, H.C.; Lee, A.H.; Cameron, D.; Li-Tsang, C. Using a Driving Simulator to Identify Older Drivers at Inflated Risk of Motor Vehicle Crashes. J. Saf. Res. 2003, 34, 453–459. [Google Scholar] [CrossRef] [PubMed]
  33. Kawabata, K.; Nakajima, Y.; Fujita, K.; Sato, M.; Hayashi, K.; Kobayashi, Y. Pilot Study on Gaze Characteristics of Older Drivers While Watching Driving Movies. Geriatrics 2024, 9, 132. [Google Scholar] [CrossRef]
  34. Garay-Vega, L.; Fisher, D.; Pollatsek, A. Hazard Anticipation of Novice and Experienced Drivers: Empirical Evaluation on a Driving Simulator in Daytime and Nighttime Conditions. Transp. Res. Rec. 2007, 2009, 1–7. [Google Scholar] [CrossRef]
  35. Paxion, J.; Galy, E.; Berthelon, C. Mental Workload and Driving. Front. Psychol. 2014, 5, 1344. [Google Scholar] [CrossRef] [PubMed]
  36. Santos, M.A.A.; Sousa, A.C.S.; Reis, F.P.; Santos, T.R.; Lima, S.O.; Barreto-Filho, J.A. Envelhecer Altera Relevantemente a Frequência Cardíaca Média? Arq. Bras. Cardiol. 2013, 101, 388–397. [Google Scholar] [CrossRef] [PubMed]
  37. Baddeley, A.D. The Recency Effect: Implicit Learning with Explicit Retrieval? Mem. Cogn. 1993, 21, 146–155. [Google Scholar] [CrossRef] [PubMed]
Figure 1. Cone avoidance tests: (a) narrow passage; (b) slalom; (c) center of gravity displacement; and (d) double obstacle avoidance.
Applsci 15 12024 g001
Figure 2. Motorway test scenario layout (1: stationary truck and dropped cargo (accident); 2: stationary passenger cars; 3, 4: moving traffic, avoiding 1; and 5: participant’s car trying to keep its lane without collision).
Applsci 15 12024 g002
Figure 3. Motorway test: the participant is performing an NDRT while a vehicle shifts into the inner lane due to an accident (with stationary vehicles blocking the outer lane).
Applsci 15 12024 g003
Figure 4. Average value of driven distance per driver category.
Applsci 15 12024 g004
Figure 5. Radar charts illustrating cone avoidance tasks’ (a to d) analyzed metrics.
Applsci 15 12024 g005
Figure 6. Driving behavior metrics by class and scenario (blue circle: mean value; black dot: outliers).
Applsci 15 12024 g006
Figure 7. Driving performance metrics by class and scenario (blue circle: mean value; black dot: outliers).
Applsci 15 12024 g007
Figure 8. Driving visual behavior and physiological response metrics by class and scenario (blue circle—mean value; black dot: outliers).
Applsci 15 12024 g008
Figure 9. Motorway driving behavior metrics by class (blue circle: mean value; black dot: outliers).
Applsci 15 12024 g009
Figure 10. Motorway driving visual behavior and physiological response metrics by class (blue circle: mean value; black dot: outliers).
Applsci 15 12024 g010
Figure 11. Mean subjective assessment scores for scenario tasks across driver groups.
Applsci 15 12024 g011
Table 1. Collected measurement metrics’ descriptions.
MetricDescriptionUnit/Scale
Cone avoidance precision ratePercentage of cones a driver did not hit out of the total cones faced-
Duration of experimentTime consumed to finish the taskmin
SpeedMean vehicle speed during each taskkm/h
Steering intensityRange of steering wheel rotation in absolute value (max − min)Degrees
Hands on steering wheelPresence of hands on steering wheel, coded as 2 = both hands, 1 = one hand, or 0 = no hand0–2 scale
(categorical, averaged)
ThrottlePercentage of accelerator pedal engagement-
Fixation frequencyTotal number of gaze fixations per minutefrequency
Mean duration of fixationAverage time spent with eyes remaining fixedms
Heart rate (HR)Mean heart beats per minutebpm
Table 2. Collected metrics’ descriptive statistics of civilian drivers per scenario.
(a)(b)(c)(d)
MetricMeanMedianSDMeanMedianSDMeanMedianSDMeanMedianSD
Avoidance precision rate910019.398.11005.0390.3090.98.749191.28.05
Duration of experiment0.4850.4190.2420.6410.6030.1410.4460.4210.0920.5150.4910.096
Speed (km/h)34.730.116.528.629.56.3728.931.17.622.822.94.94
Steering intensity (max–min)16.813.413.441939716125128389.1388406169
Hands on steering wheel1.040.6110.6101.431.430.3851.7120.4411.371.250.475
Throttle0.2190.1560.1540.1050.0960.05350.1370.130.0720.0870.080.0252
Mean duration of fixation619399441675696285590561354451335199
Fixation frequency76.895.141.373.265.132.679.964.356.710311643.2
Heart rate9285.421.193.289.320.587.282.619.683.280.312.4
Table 3. Collected metrics’ descriptive statistics of professional drivers per scenario.
(a)(b)(c)(d)
MetricMeanMedianSDMeanMedianSDMeanMedianSDMeanMedianSD
Avoidance precision rate901002194.291007.2490.3010013.589.8091.28.60
Duration of experiment0.513 0.4810.1080.7360.6630.2080.5150.4910.0960.5710.5110.150
Speed (km/h)26.428.66.7523.824.75.0322.822.94.942120.55.34
Steering intensity (max–min)22.413.524.3460.2409147388406169369316134
Hands on steering wheel1.031.150.7011.241.160.4541.371.250.4751.051.160.649
Throttle0.160.1520.0670.0740.0670.0240.0870.080.0250.0670.0650.026
Mean duration of fixation427387195483445149451335199464408212
Fixation frequency10810440.792.781.230.910311643,210394.445.9
Heart rate86.283.412.188.38312.483.280.312.481.478.611
Table 4. Summary table of Wilcoxon rank-sum test significance (p-value).
Scenario
Metric(a)(b)(c)(d)
Cone avoidance precision rate0.8010.11030.38560.6747
Duration of experiment0.130.11980.0343 *0.2452
Speed (km/h)0.21330.08140.0278 *0.4066
Steering intensity0.64820.43060.00322 **0.6481
Hands on steering wheel0.83480.29970.0201 *0.2446
Throttle0.61860.051160.0264 *0.016
Mean duration of fixation0.45530.0381 *0.31930.9009
Fixation frequency0.07440.06790.0850.8682
Heart rate (bpm)0.83570.61860.67820.7088
Significance: ‘*’ 0.05, ‘**’, 0.01.
Table 5. Mixed ANCOVA results examining the effects of class and scenario, controlling for age, on driving behavior.
NumDfdenDFF-Valuep-Value
Speed(Intercept)1801139.1604<0.0001
Class1288.19070.0079
Scenario3809.6489<0.0001
Class–scenario3801.56600.2041
Scenario–age4806.45780.0001
Steering intensity(Intercept)184116.9714<0.0001
Class1271.440.2404
Scenario384169.918<0.0001
Class–scenario1270.19880.6592
Scenario–age3842.520.0633
Hands on steering wheel(Intercept)184467.737<0.0001
Class1273.3330.0790
Scenario3845.615400.0015
Age1270.98310.3302
Class–scenario3840.69730.5563
Throttle(Intercept)184487.7320<0.0001
Class12712.68650.0014
Scenario38411.9197<0.0001
Age1273.40170.0761
Class–scenario3840.88100.4544
Table 6. Mixed ANCOVA results examining the effects of class and scenario, controlling for age, on the drivers’ performance.
NumDfdenDFF-Valuep-Value
Cone avoidance precision rate(Intercept)18411,960.355<0.0001
Class1271.8390.1863
Scenario3845.2820.0022
Age1279.2450.0052
Class–scenario3840.3820.7661
Experiment duration(Intercept)1801316.7613<0.0001
Class1284.96520.0341
Scenario38015.6297<0.0001
Class–scenario3800.26400.8512
Scenario–age4804.340.0031
Table 7. Mixed ANCOVA results examining the effects of class and scenario, controlling for age, on visual behavior and physiological responses.
NumDfdenDFF-Valuep-Value
Fixation frequency(Intercept)184363.1857<0.0001
Class1274.45930.0441
Scenario3841.72210.1687
Age1270.24260.6263
Class–scenario3840.88460.4526
Mean duration of fixation(Intercept)184303.16332<0.0001
Class1272.820210.1046
Scenario3842.253200.0881
Age1270.366120.5502
Class–scenario3841.937150.1298
Heart rate(Intercept)1811087.3465<0.0001
Class1270.92280.3453
Scenario3815.31650.0021
Age1276.25110.0188
Class–scenario3810.28060.8392
Scenario–age3818.39470.0001
Table 8. Motorway scenario-related measured metrics.
MetricCivilianProfessional
MeanMedianSDMeanMedianSD
Duration of experiment (minutes)0.970.960.11.141.010.26
Speed (km/h)88.7391.4712.1779.1978.416.45
SI (steering intensity: max − min)35.4726.8617.8149.725.4152.34
Throttle (%)0.290.290.110.270.270.06
Brake (%)0.060.060.020.040.040.03
Hands on steering wheel (0–2)1.51.60.351.321.370.48
Mean duration of fixation [ms]518.0485.06205.82513.33494.17144.87
Fixation frequency (fixations/min)99.888.4535.5495.8889.9627.11
Heart rate (bpm)89.7985.6817.6287.5382.510.85
Table 9. Motorway scenario case outcomes.
CaseCivilianProfessional
1Braking, passing13
2Braking, avoidance from the left54
3No braking, avoidance from the left 65
4Collision (with braking)33
Table 10. Motorway scenario-related statistical values.
p-Value
MetricWilcoxont-Test
Duration of experiment (minutes)0.0675-
Speed (km/h)-0.08246
SI (steering intensity: max–min)0.9674-
Throttle (%)0.7399-
Brake (%)-0.08051
Hands on steering wheel (0–2)-0.2436
Mean duration of fixation [ms]-0.94322
Fixation frequency (fixations/min)-0.73537
Heart rate (bpm)-0.67523
Disclaimer/Publisher’s Note: The statements, opinions and data contained in all publications are solely those of the individual author(s) and contributor(s) and not of MDPI and/or the editor(s). MDPI and/or the editor(s) disclaim responsibility for any injury to people or property resulting from any ideas, methods, instructions or products referred to in the content.