Article

IoT-Based Off-Grid Solar Power Supply: Design, Implementation, and Case Study of Energy Consumption Control Using Forecasted Solar Irradiation

1
Faculty of Electrical Engineering and Computer Science, University of Maribor, Koroška Cesta 46, 2000 Maribor, Slovenia
2
Faculty of Logistics, University of Maribor, Mariborska Cesta 7, 3000 Celje, Slovenia
*
Author to whom correspondence should be addressed.
Appl. Sci. 2025, 15(22), 12018; https://doi.org/10.3390/app152212018
Submission received: 20 October 2025 / Revised: 5 November 2025 / Accepted: 10 November 2025 / Published: 12 November 2025
(This article belongs to the Special Issue Advanced IoT/ICT Technologies in Smart Systems)

Abstract

This article presents the development and implementation of an IoT-enabled, off-grid solar power supply prototype designed to power a range of electrical devices. The developed system comprises a Photovoltaic panel, a Maximum Power Point Tracking (MPPT) charger, a 2.5 kWh/24 V high-performance LiFePO4 battery bank with a Battery Management System, an embedded controller with IoT connectivity, and DC/DC and DC/AC converters. The PV panel serves as the primary energy source, with the MPPT controller optimizing battery charging, while the DC/DC and DC/AC converters supply power to the connected electrical devices. The article includes a case study of a developed platform for powering an information and advertising system. The system features a predictive energy management algorithm, which optimizes the appliance operation based on daily solar irradiance forecasts and real-time battery State-of-Charge monitoring. The IoT-enabled controller obtains solar irradiance forecasts from an online meteorological service via API calls and uses these data to estimate energy availability for the next day. Using this prediction, the system schedules and prioritizes the operations of connected electrical devices dynamically to optimize the performance and prevent critical battery discharge. The IoT-based controller is equipped with both Wi-Fi and an LTE modem, enabling communication with online services via wireless or cellular networks.

1. Introduction

In recent decades we have witnessed the intensive development of photovoltaic module technology, which has achieved ever-better efficiency [1,2,3]. This is why solar power plants are now one of the cheapest and most widespread ways of obtaining clean, green energy. Solar energy is undoubtedly the best option for meeting future energy demand, as it offers better availability, accessibility, capacity, efficiency, and cost-effectiveness compared to other renewable energy sources. In the coming decades solar technology is expected to continue to develop, primarily in the direction of lowering costs, increasing efficiency further, and meeting humanity’s ever-increasing energy needs, while maintaining awareness of the need to preserve nature and the entire planet [4]. However, the main disadvantage of solar power plants remains unchanged: they only produce electricity during the day when exposed to sunlight, while consumers need electricity at all times, including at night and on days without sunshine. This disadvantage can be overcome by adding an electricity storage device.
Various technologies can be used to store electrical energy [5,6,7,8]. In [5], the authors present a systematic methodology for energy storage technologies, focusing on their role in supporting the electricity grid and comparing the advantages and disadvantages of these technologies. Study [6] provides a clear comparison of alternative approaches to electricity storage, focusing the analysis on the specific technical characteristics of individual solutions. The work in [7] discusses energy storage technologies in individual regions of the world, while [8] provides a comprehensive overview of commercially viable technologies for long-term energy storage, including a comparative analysis of their equivalent efficiency, taking into account standby losses.
Given the current state of technology, storing electrical energy in battery banks based on electrochemical storage batteries is a modern technological solution, especially for small and medium-sized energy systems. During the day, a solar power plant converts solar radiation into electrical energy, which is used to power electrical consumers, while excess energy is stored in a battery storage system. This ensures a supply of energy to power electrical consumers, even at night and on days with little or no sunlight. Self-sufficient power plant systems with added energy storage are therefore also suitable for remote consumers who cannot connect to the electricity grid and can function as independent energy islands. Most electrical devices require 100% operational reliability, so they must have a continuous and reliable supply of electrical energy. However, there are other categories of electrical devices for which a constant power supply is desirable for most of the operating time. Still, the device’s functionality is not limited significantly by any of the rare outages that may occur under unfavorable solar conditions [9]. Examples of such devices include illuminated information/advertising boards, as well as advertising/information panels with screens. The disadvantage of photovoltaic power supply systems with an added battery storage unit is their dependence on the amount of solar radiation, and, consequently, the amount of electrical energy received. This value varies significantly throughout the calendar year, with the lowest value occurring in the winter months when (1) the total solar radiation time is shortest, (2) the solar zenith angle is the smallest, and (3) there is generally more cloudy weather and precipitation in the winter [10]. The result of insufficient energy supply from solar panels is a drop in the State-of-Charge (SoC) value of the battery storage system, and, consequently, a collapse of the power supply system. To prevent this from happening, several measures can be taken to eliminate the described weaknesses partially. The first option is to increase the total area of solar panels significantly, thereby ensuring sufficient energy daily, even under unfavorable conditions. The second option is to increase the capacity of the energy storage system significantly, so that it is sufficient for a more extended period, during which days with more favorable weather conditions will occur statistically. The third option for improving energy yield in winter involves installing solar panels at an optimal angle specific to this time of year.
It follows from the above that the field of studying the optimal operation of photovoltaic sources in combination with battery energy storage systems presents numerous demanding challenges. To conduct an in-depth analysis and test different approaches effectively, a powerful and flexible test system is needed that enables accurate measurement, reliable data recording, and repeatable testing of different operating scenarios.
This article presents the design and implementation of a powerful test system for studying the operation of photovoltaic sources in combination with battery energy storage systems. The presented system can be used to perform various studies and experiments, e.g., (1) studying the annual energy efficiency of a solar panel at our location with the possibility of variable tilt angle adjustment, (2) testing different types of solar chargers, (3) testing the battery system, including the Battery Management System (BMS) unit, (4) using semiconductor Metal–Oxide–Semiconductor Field-Effect Transistor (MOSFET) power switches, it is possible to control energy flows for different types of electrical consumers. The presented system includes a microcontroller-based computer that enables data logging of all key internal system signals. It also enables control of the energy flows to loads via output interfaces. In addition to the USB and serial communication, the microcontroller system also enables IoT connectivity and remote data and command transfer via Wireless Fidelity (Wi-Fi), Long Term Evolution (LTE), and Bluetooth interfaces. Designed in this manner, the universal test system enables a wide range of different experiments to be conducted. In addition, the article also includes an example of the practical application of the presented system for powering an energy self-sufficient information and advertising system, which includes a Liquid-Crystal Display (LCD) television, as well as a Light-Emitting Diode (LED)-illuminated advertising board. Using modern technologies, the system monitors solar radiation forecasts automatically and manages the consumption of the connected consumers based on the current battery status and estimated available solar energy. During periods of low sunlight the system limits the operation of less critical components temporarily, which reduces the system’s functionality slightly, but contributes significantly to its stable and reliable operation.
This paper is organized as follows: Section 2 reviews and analyzes related work. Section 3 introduces the system architecture and outlines the software and hardware configurations of the proposed solution. Section 4 presents a case study demonstrating the use of the developed hardware. Finally, Section 5 concludes the paper by summarizing the key findings and outlining future improvements to the proposed system.

2. Related Works

The assessment of solar radiation distribution is crucial for the operation, design, and economic evaluation of solar panels and/or photovoltaic power plants designed to operate in different climatic conditions, at different tilt angles, and in different geographical locations. A general analytical calculation of the optimal angle of the panels is given in [11]. Using an anisotropic model that takes into account the influence of the tilt angle and temperature, it is possible to determine the optimal parameters for maximum electricity production based on the study [12]. In cases where a solar power plant supplies an isolated off-grid system, in most cases, it is not so important to maximize the annual yield of energy received, but rather to set the tilt angle of the panels optimally for the time of year when the amount of solar radiation, and, consequently, the amount of electricity generated is the lowest. In this case, other circumstances must also be taken into account, such as the length of daily sunshine and local weather conditions [13]. Self-sufficient solar power plants require battery storage systems to supply electrical loads when solar energy is not available. The role of a solar charger is to transfer as much of the available electrical energy from the solar panel to the battery as possible. Decades ago, a charging principle was developed that adapts to changes in solar irradiance dynamically by searching for the optimal operating point at which the solar panel operates. The Maximum Power Point Tracking (MPPT) algorithm began to be used extensively in solar chargers with the increase in solar panel production, and, above all, with the development of microcontroller technology [14]. Currently, MPPT technology has been developed to maturity, and has become the standard mode of operation for commercial solar chargers. The operating principle of MPPT is described in [15], while the operation of a power switching circuit used to track the maximum power point is discussed in [16].
With the development of solar panel technology, particularly the recent intensive development of IoT technology, several devices have been designed and developed for mobile use and operation in areas without access to the power grid. In [17], the authors presented a portable solar storage device that integrates all the essential components of an off-grid solar power system. The device is designed for outdoor enthusiasts such as hikers and campers. It can store up to 16,000 mAh of energy per charge for powering electronic devices like mobile phones, Bluetooth speakers, power banks, LED lights, and laptops. The device is based on an Arduino UNO microcontroller, and the key variables can be monitored via an LCD, as well as through a smartphone using the Blynk mobile interface. Solar power is often utilized in sensor device applications, as seen in [18,19]. In [18], the authors presented an air quality monitoring system powered by a lithium battery charged through a solar panel. The system integrates an STM32F103RC microcontroller, an LPWA (Low-Power Wide-Area) transmitter module, and a PMS5003 air quality sensor. The presented solution acquires air quality data continuously, transmits them via the LPWA network, and processes and analyzes them in the IoT cloud. The Bluetooth Low Energy (BLE) beacon, which updates its advertising payload dynamically with environmental measurement data acquired from a digital ambient light sensor, a temperature and relative humidity sensor, a gas sensor, and a digital barometer, is presented in [19]. The system is powered by a rechargeable accumulator that is charged continuously using solar cells. An advertisement scanner application, running on mobile devices, acts as a gateway, by receiving the transmitted beacon data and forwarding it to a cloud platform for storage, visualization, and further analysis.
Low-cost open-source IoT-based SCADA systems have also emerged considering the low prices of the components (solar panels, batteries, and powerful microcontrollers) [20]. The presented solution is based on IoT technology and uses ESP32 and the Arduino IoT Cloud. The system utilizes various sensors to measure the current, voltage, temperature, and humidity, then sends the data to the cloud via a Wi-Fi connection. It enables monitoring through a control panel and a mobile application.
The implementation of a power supply system based on the solar-battery principle is particularly suitable for powering electronic devices intended for information and promotional activities. These devices have two essential characteristics: (1) they consume relatively small amounts of energy depending on the technology used for their operation, and (2) in many cases, mobility is required, or, due to their remote location, they cannot be connected to the electricity grid. One such solution is presented in [21]. The presented portable, solar-powered, multi-purpose digital display board consists of two LED matrices built from commercially available LED strips and controlled by a Raspberry Pi 4. The Raspberry Pi runs Python programs (version 3.10) that utilize its General-Purpose Input/Output (GPIO) pins, Wi-Fi connectivity, and web server hosting capabilities to provide a local web-based application interface. The entire setup is powered by a 50 Ah Lithium Iron Phosphate (LiFePO4) battery system, which is charged by a 175 W solar photovoltaic panel. In [22], the authors presented a solar-powered advertising light box with automatic rotation and poster cycling, which reduces energy use and enhances display variety. The system comprises three components: the box rotation system, the poster scrolling system, and the single-axis sun tracking system, which, collectively, enhance the solar energy efficiency and reduce energy consumption. In addition, completely new, innovative products with enhanced functionalities have also been launched, made possible by the advantages of photovoltaic technology [23].
The integration of the Internet of Things (IoT) into solar energy measurement systems enables the monitoring of small Photovoltaic (PV) off-grid power supply systems via an internet connection. A smart data logger that enables real-time monitoring of small stand-alone PV systems is presented in [24]. The smart data logger measures the electrical parameters (such as the PV output voltage and current, battery and load voltages and currents) as well as meteorological parameters (including irradiance, temperature, humidity, wind speed, and rainfall), providing detailed information on energy production and daily consumption. The system is built on an Arduino UNO with an Ethernet shield, while a nano router with a 3G modem transmits the collected data to the ThingSpeak cloud. Allafi and Iqbal [25] presented a web server–based monitoring system for small photovoltaic (PV) power setups using an ESP32 microcontroller, low-cost sensors, Wi-Fi, and an SD card. The presented system acquires the current and voltage from the PV and battery and stores them on the SD card. The ESP32 hosts a web page that allows users to access and download the recorded data remotely. Wibowo, et al. [26] presented an IoT-based monitoring system for on-grid photovoltaic power plants that provides real-time and highly accurate measurements of the key electrical parameters. The system employs the PZEM004T sensor module and the NodeMCU ESP8266 microcontroller, which transmits the collected data to the Blynk IoT server via an internet connection. In [27], the authors presented a low-cost and straightforward IoT-based photovoltaic parameter monitoring system that was developed using a NodeMCU ESP8266 board with integrated Wi-Fi. The system measures solar irradiance, ambient temperature, PV output voltage, and PV output current using photodiodes, a DHT22 sensor, voltage dividers, and an ACS712 current sensor. ThingSpeak is used as a cloud-based platform for data storage and real-time monitoring. According to the authors, the system is highly accurate, reliable, user-friendly, and cost-effective. He, et al. [28] presented an IoT-based open-source SCADA system for monitoring photovoltaic installations. The system integrates voltage and current sensors, a battery, and a load. An ESP32-E microcontroller collects the measurement data and transmits it to a Banana Pi M4 Berry via Wi-Fi using the Message Queuing Telemetry Transport (MQTT) protocol. The ESP32-E functions as the MQTT publisher, while the BPI-M4 Berry acts as the MQTT broker. Node-RED, installed locally on the BPI-M4 Berry, is used for creating customizable dashboards that serve as human–machine interfaces (HMIs) for real-time monitoring of the PV system.
According to the literature review, modern off-grid photovoltaic systems are based increasingly on affordable and highly adaptable microcontrollers, such as ESP32, ESP8266, Raspberry Pi, and Arduino. These enable wireless communication, automate load switching, and facilitate remote data collection and processing via various communication protocols, including Wi-Fi, LTE, and MQTT. Despite their widespread use, existing systems are, in most cases, designed solely for monitoring and tracking process variables such as voltage, current, power, and battery status. More advanced functionalities, such as energy consumption optimization or predictive management based on solar radiation forecasts, are not yet available.

3. Materials and Methods

3.1. System Architecture

Figure 1 shows a block diagram of the implemented prototype, which includes the following essential components: (1) Photovoltaic (PV) panel, (2) Maximum Power Point Tracking (MPPT) charger, (3) Lithium Iron Phosphate (LiFePO4) battery, (4) Battery Management System (BMS), (5) IoT controller, (6) DC/DC converter (24 V/12 V), (7) MOSFET switches, (8) DC/AC converter (24/230 V), and (9) Ambient light sensor.
A PV panel converts solar energy into direct current (DC) electricity. An MPPT charger ensures that the PV panel always operates at its maximum power point, supplying the battery system via a DC voltage line (24 V DC). The energy is stored in a LiFePO4 battery, whose operation and energy flows are monitored by a BMS. The electrical energy stored in the battery is used to power two types of consumers. The DC load is powered via a DC/DC converter with adjustable output voltage, which the IoT controller regulates via a Pulse Width Modulation (PWM) signal. The alternating current (AC) load is powered via a DC/AC converter, whose operation (on/off) is controlled by the IoT controller via a digital output.
The central element of the system is an IoT controller that performs the following functions:
  • Captures the measurement data from the SmartShunt module (SoC, voltage, current, power).
  • Obtains data from online sources.
  • Based on a combination of locally captured and online data, it executes an algorithm for automatic control of the DC and AC loads.
  • Sends selected processed data to the IoT web platform for further analysis and visualization.
The IoT controller used includes both Wi-Fi and LTE modems, enabling two-way communication with online platforms via a local wireless or mobile network, depending on the network availability and quality.

3.2. Hardware

3.2.1. Battery System

Given the current state of rechargeable battery technology, lithium-ion technology is the primary choice. Several established and widely used technologies exist, depending on the various active Li-ion materials. The IEEE Guide for the Characterization and Evaluation of Lithium-Based Batteries in Stationary Applications [29] was used as a guide for selecting the technology.
When selecting the technology for the laboratory test energy storage device, we chose between the most commercially available technologies, including NMC, NCA, LMO, and LFP.
The key criteria for selecting the type or technology of battery cells available on the market were primarily the following: (1) safety in use, (2) service life, (3) environmental impact during production, (4) availability, and (5) price. Due to the intensive development of battery cell technology, its properties are constantly improving; however, each technology has its advantages and disadvantages. A key safety feature is sensitivity to thermal runaway, which depends on the chemistry used. Experimental studies conclude that LTO and LFP technologies have an advantage in terms of safety, while NMC and NMA technologies are more sensitive to thermal runaway [30]. A comparative study [31] of NMC, NMA, and LFP technologies reveals that LFP technology offers higher thermal stability, making it safer for laboratory experimental systems than NMC and NMA technologies. A study addressing battery useful life, health, and safety, including statistical data on fire incidents caused by various factors, is presented in [32]. The State of Health (SoH) metric expresses the remaining battery capacity as a percentage of its original capacity when new, serving as an indicator of battery aging. Although SoH depends on numerous factors, it can be estimated from specific battery characteristic parameters [33]. While it is possible to assess a battery’s overall lifetime, predicting its cycle life and the effects of different operating conditions remains a greater challenge. An approach to lifetime prediction based on aging analysis and operational conditions is described in [34]. One of the main advantages of LFP technology is its ability to endure a large number of charge–discharge cycles, contributing to its extended overall lifetime. Furthermore, studies [35] indicate that LFP technology has a lower environmental impact compared to competing NMC technology.
Considering the advantages and disadvantages of each technology and our requirements, such as stationary use, safety, long cycle life, stable voltage, and the fact that a slightly lower specific energy value is not a disadvantage, we opted for LFP technology in the form of cylindrical cells.
LFP technology uses lithium iron phosphate (LiFePO4) as the cathode material. Iron and phosphate are more readily available as cathode materials for LFP, and are also cheaper than cobalt, which is used in NMC batteries. The materials in LFP batteries are also less toxic than those in NMC batteries, making them easier to recycle at the end of their life. There are other key advantages, notably the improved thermal stability of LFP batteries, as iron phosphate is not prone to overheating and thermal runaway. As a result, LFP batteries are more stable, and less likely to catch fire or explode in adverse conditions. Another advantage of LFP technology is its significantly longer service life or number of charge/discharge cycles, depending on the conditions of use. This number is typically around 3000, but can be as high as 6000 cycles.
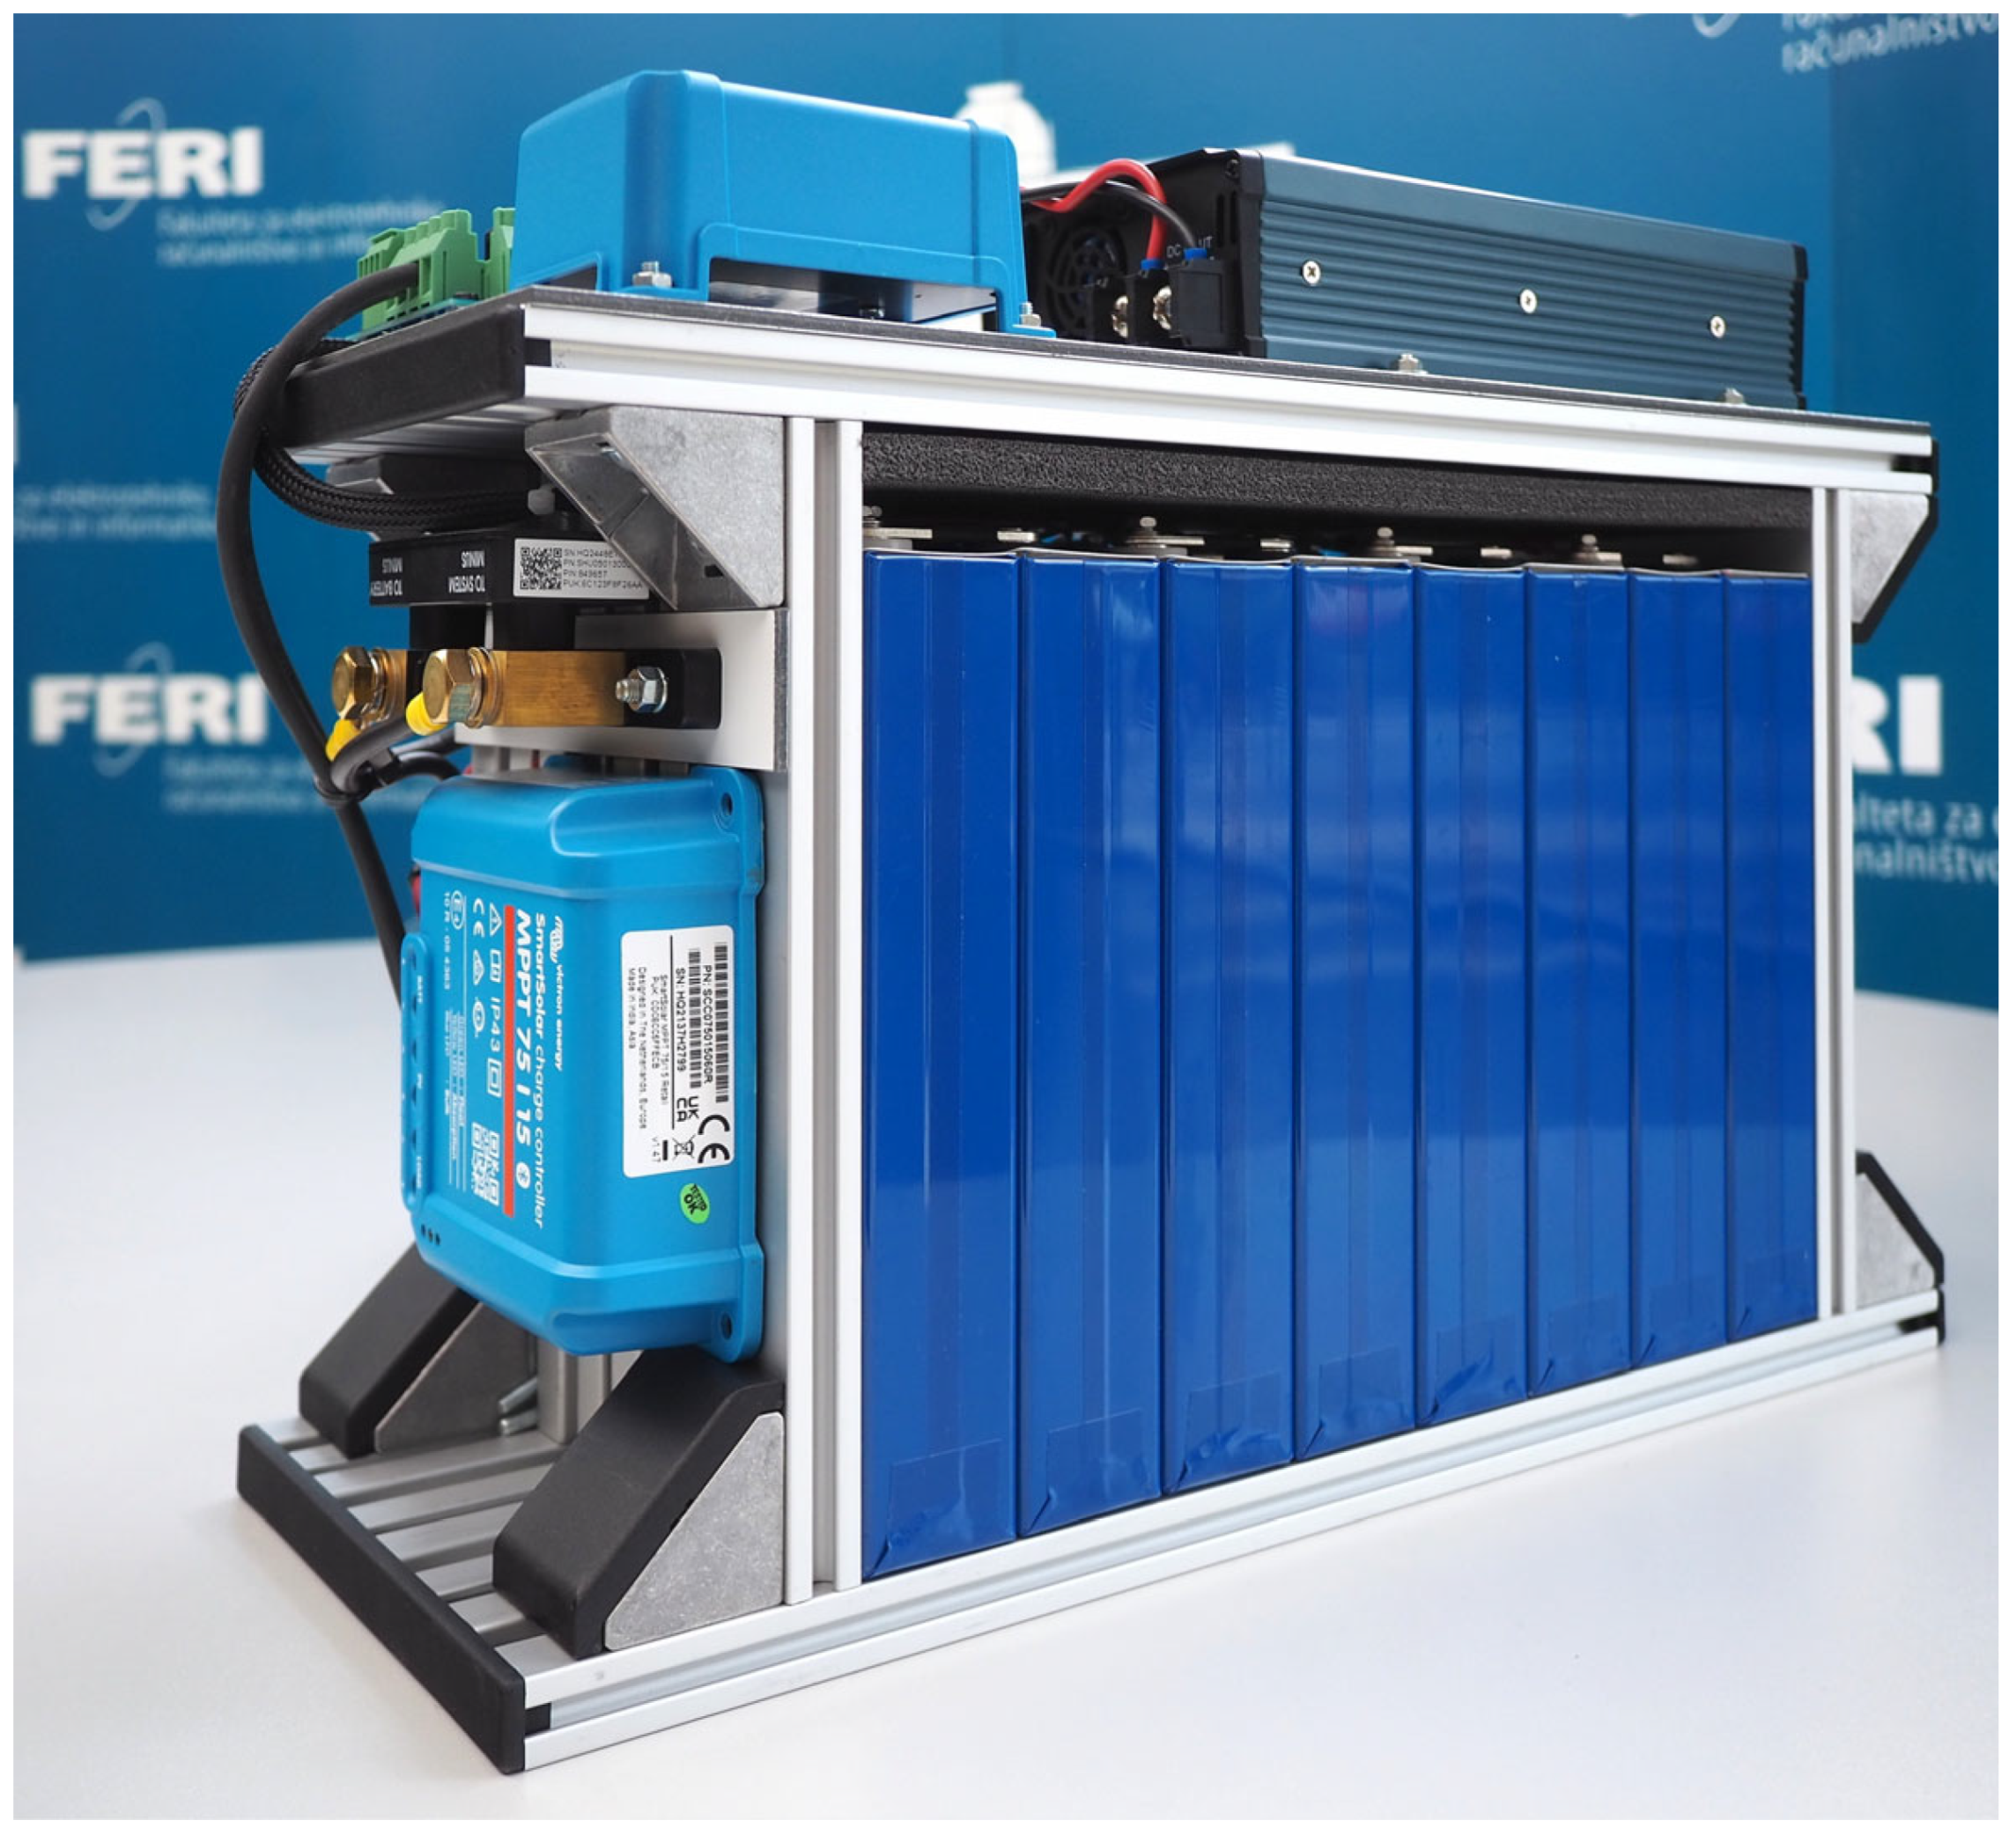
A dedicated battery pack was built for laboratory testing of the described concept. It was also necessary to select the battery cell technology, primarily for safe and thermally stable operation, as well as for a long service life. The currently dominant LiFePO4 technology in the form of prismatic cells was selected in our case.
The criteria for determining the capacity of the storage tank are as follows: the required amount of stored energy should be in the order of magnitude of energy consumption over a period of one day. Based on the total power of electrical consumers with Pmax = 100 W, the required amount of stored energy Wmax was determined to be in the order of magnitude of 2.4 kWh. The nominal voltage of the battery is determined by the 8S configuration (a series connection of 8 cells) and LiFePO4 technology and is Vnom = 25.6 V (Vmax = 29.2 V, Vmin = 20.0 V). Prismatic LiFePO4 cells of type LF105—105 Ah manufactured by EVE Energy Co., Ltd. (Huizhou, Guangdong, China) [36] were selected based on the current market offer.
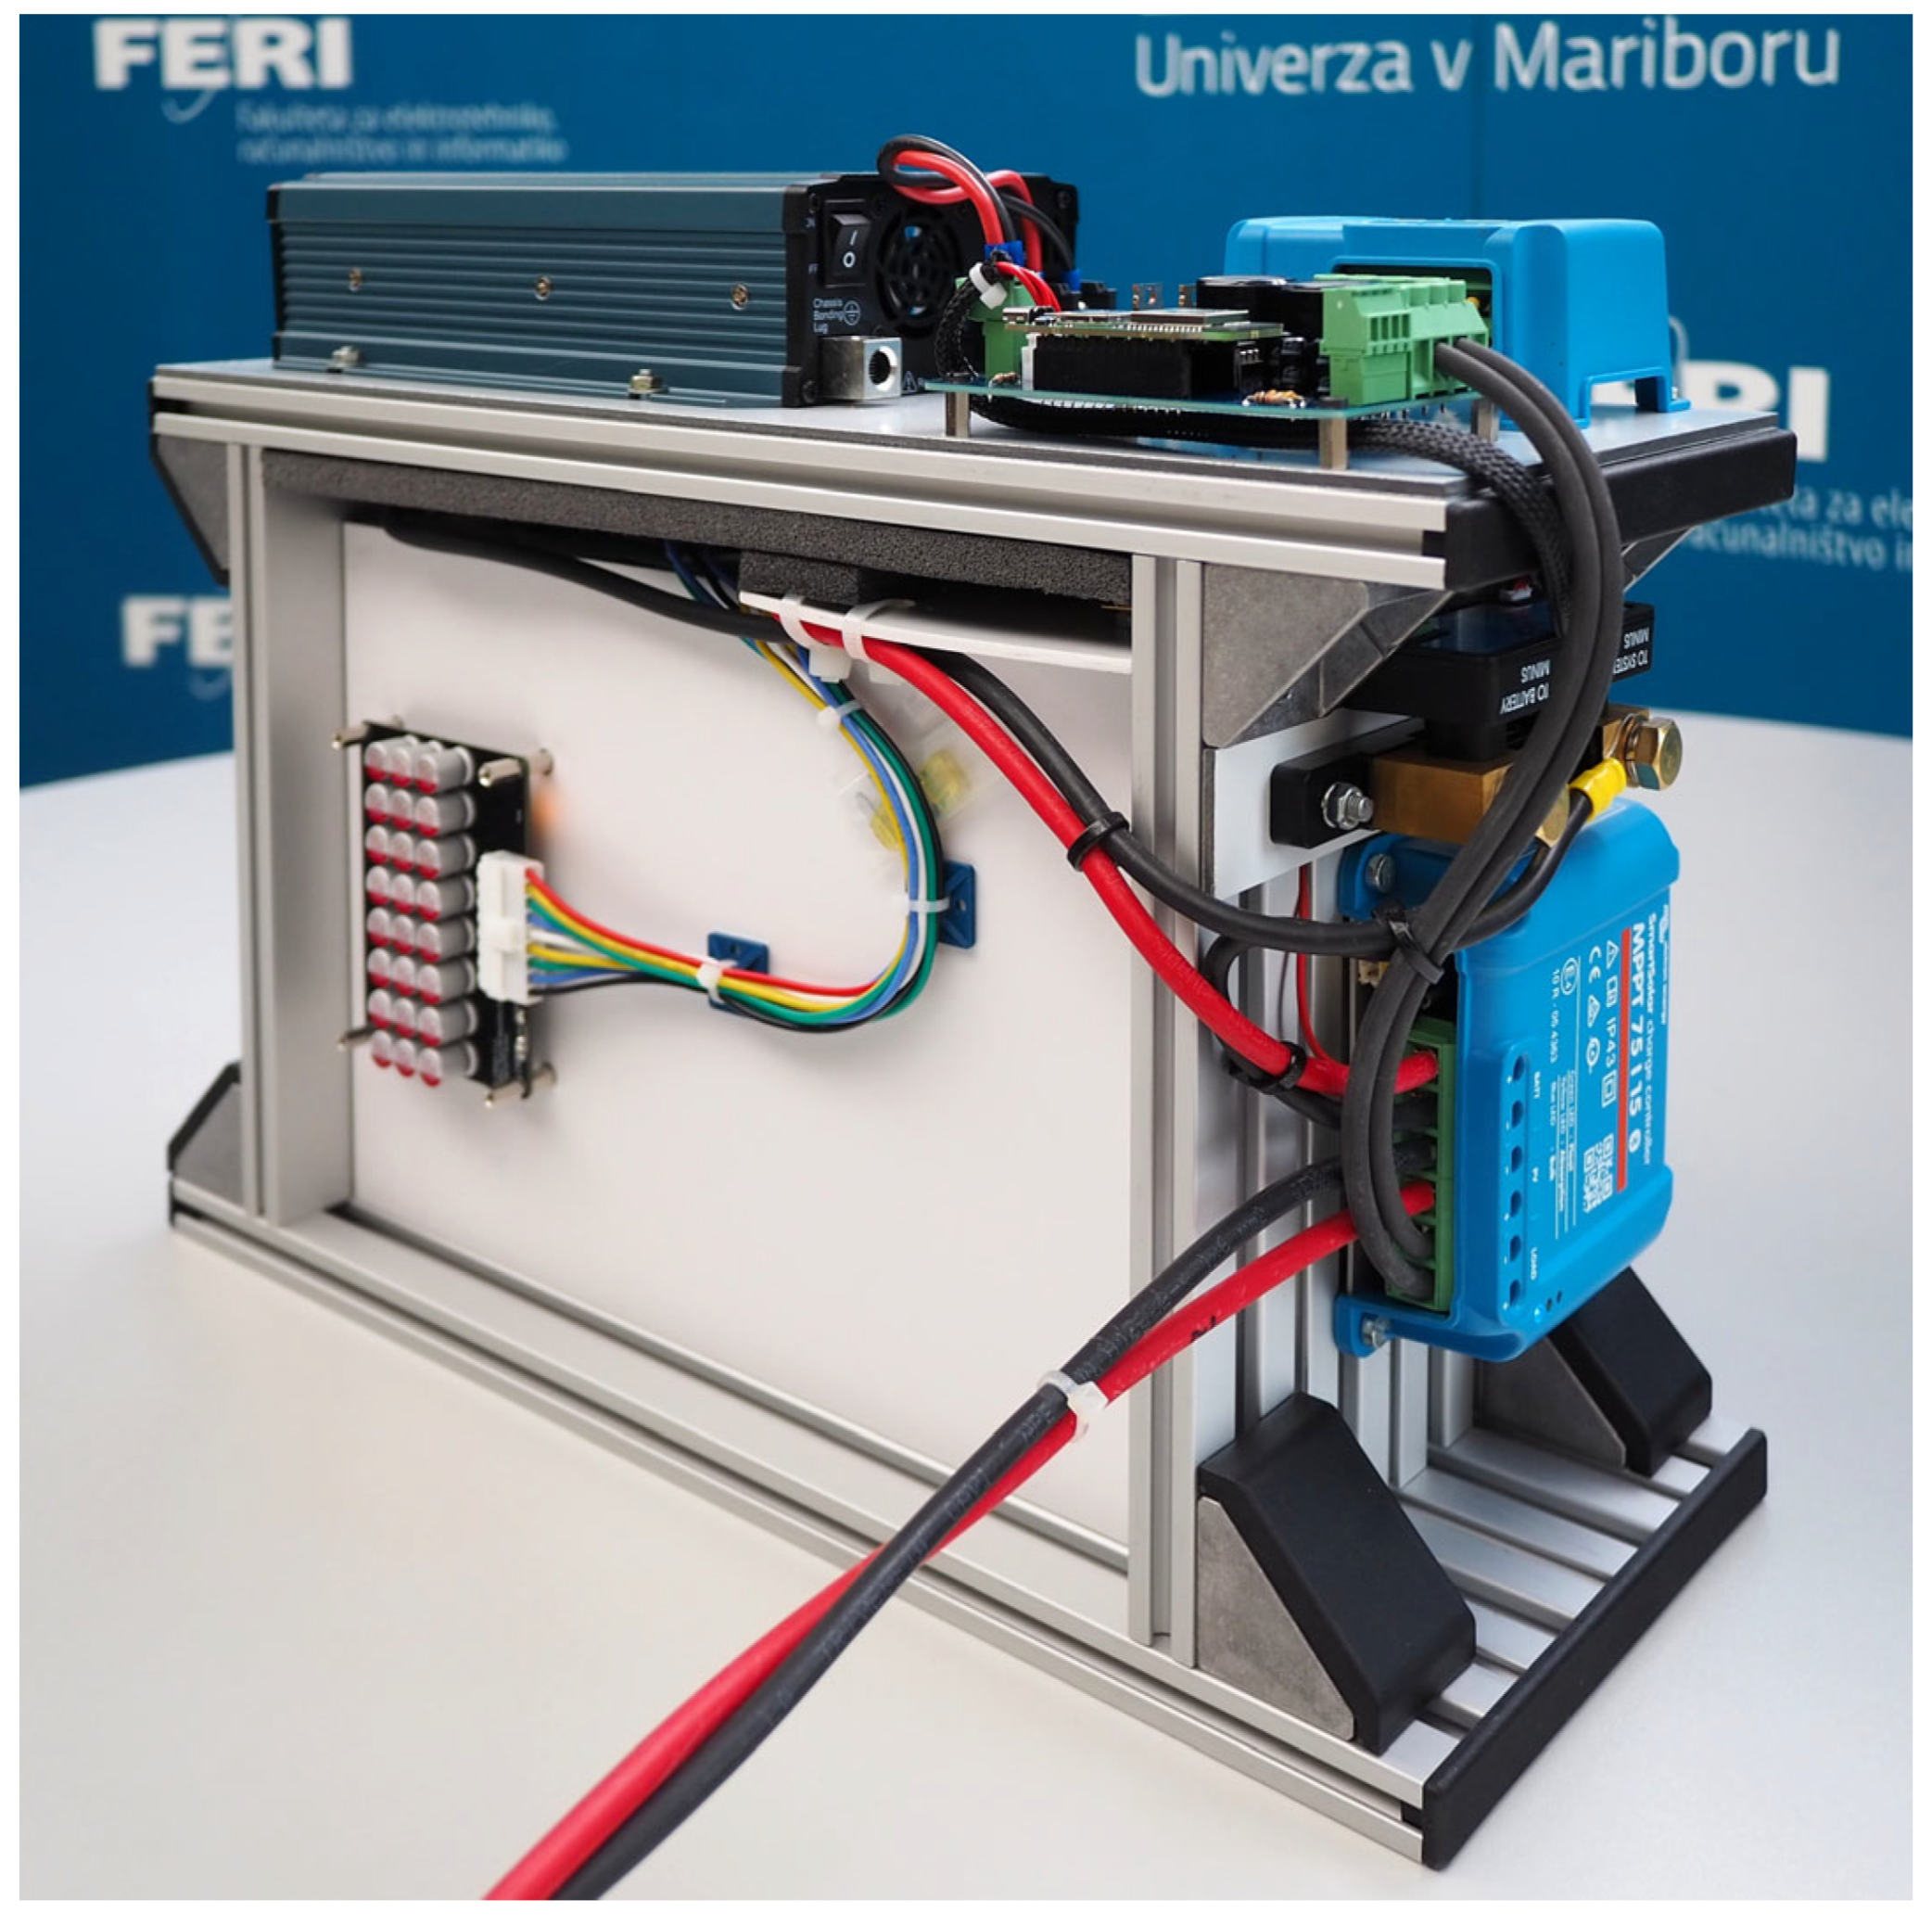
Prismatic LiFePO4 cells are sensitive to deformation (swelling) [37]. To protect the cells from deformation, a rigid housing made of aluminum structural profiles was designed and manufactured specifically for our laboratory battery. The design of the laboratory test battery is shown in Figure 2 and Figure 3.
When connecting lithium cells into larger assemblies and during the final cyclic use of the battery, specific conditions must be met due to the battery’s charging/discharging technology, which is managed by the BMS. In our case, the BMS function was divided between two electronic assemblies, ensuring proper charging/discharging, controlling the operating conditions (especially the temperature) of the “smart” charger, and a circuit for voltage equalization. The function of voltage control and protection against overvoltage during charging and undervoltage during battery discharge is implemented in the solar charger, and it is programmable. A dedicated active equalization circuit is used to equalize the voltage between individual cells, which always remains active, not just during battery charging/discharging. The principle of operation is described in [38,39]. Active balancing circuits are used to balance or transfer energy between individual series-connected cells, using switching circuits that operate on the principle of a switched capacitor circuit [40]. Several electronic circuit configurations are used to actively balance the state of charge of multiple series-connected battery cells. An overview of the different configurations is described in [41]. An active balancing circuit ensures the effective equalization of the series-connected cells with a voltage difference between cells of no more than 10 mV. This results in stable battery operation across the entire operating voltage range (2.5 V to 3.65 V) and at various states of charge. The selection of this unconventional battery cell balancing system was justified by the consideration that, in our case, the battery will not typically follow a standard charging cycle up to full charge, the point at which balancing is usually performed in conventional systems. In the case of our laboratory battery, we have specified that the equalization function must operate continuously throughout the entire range of charge states, regardless of the battery’s state of charge. A commercially available active balancing circuit [42] has been used.

3.2.2. Solar Panel

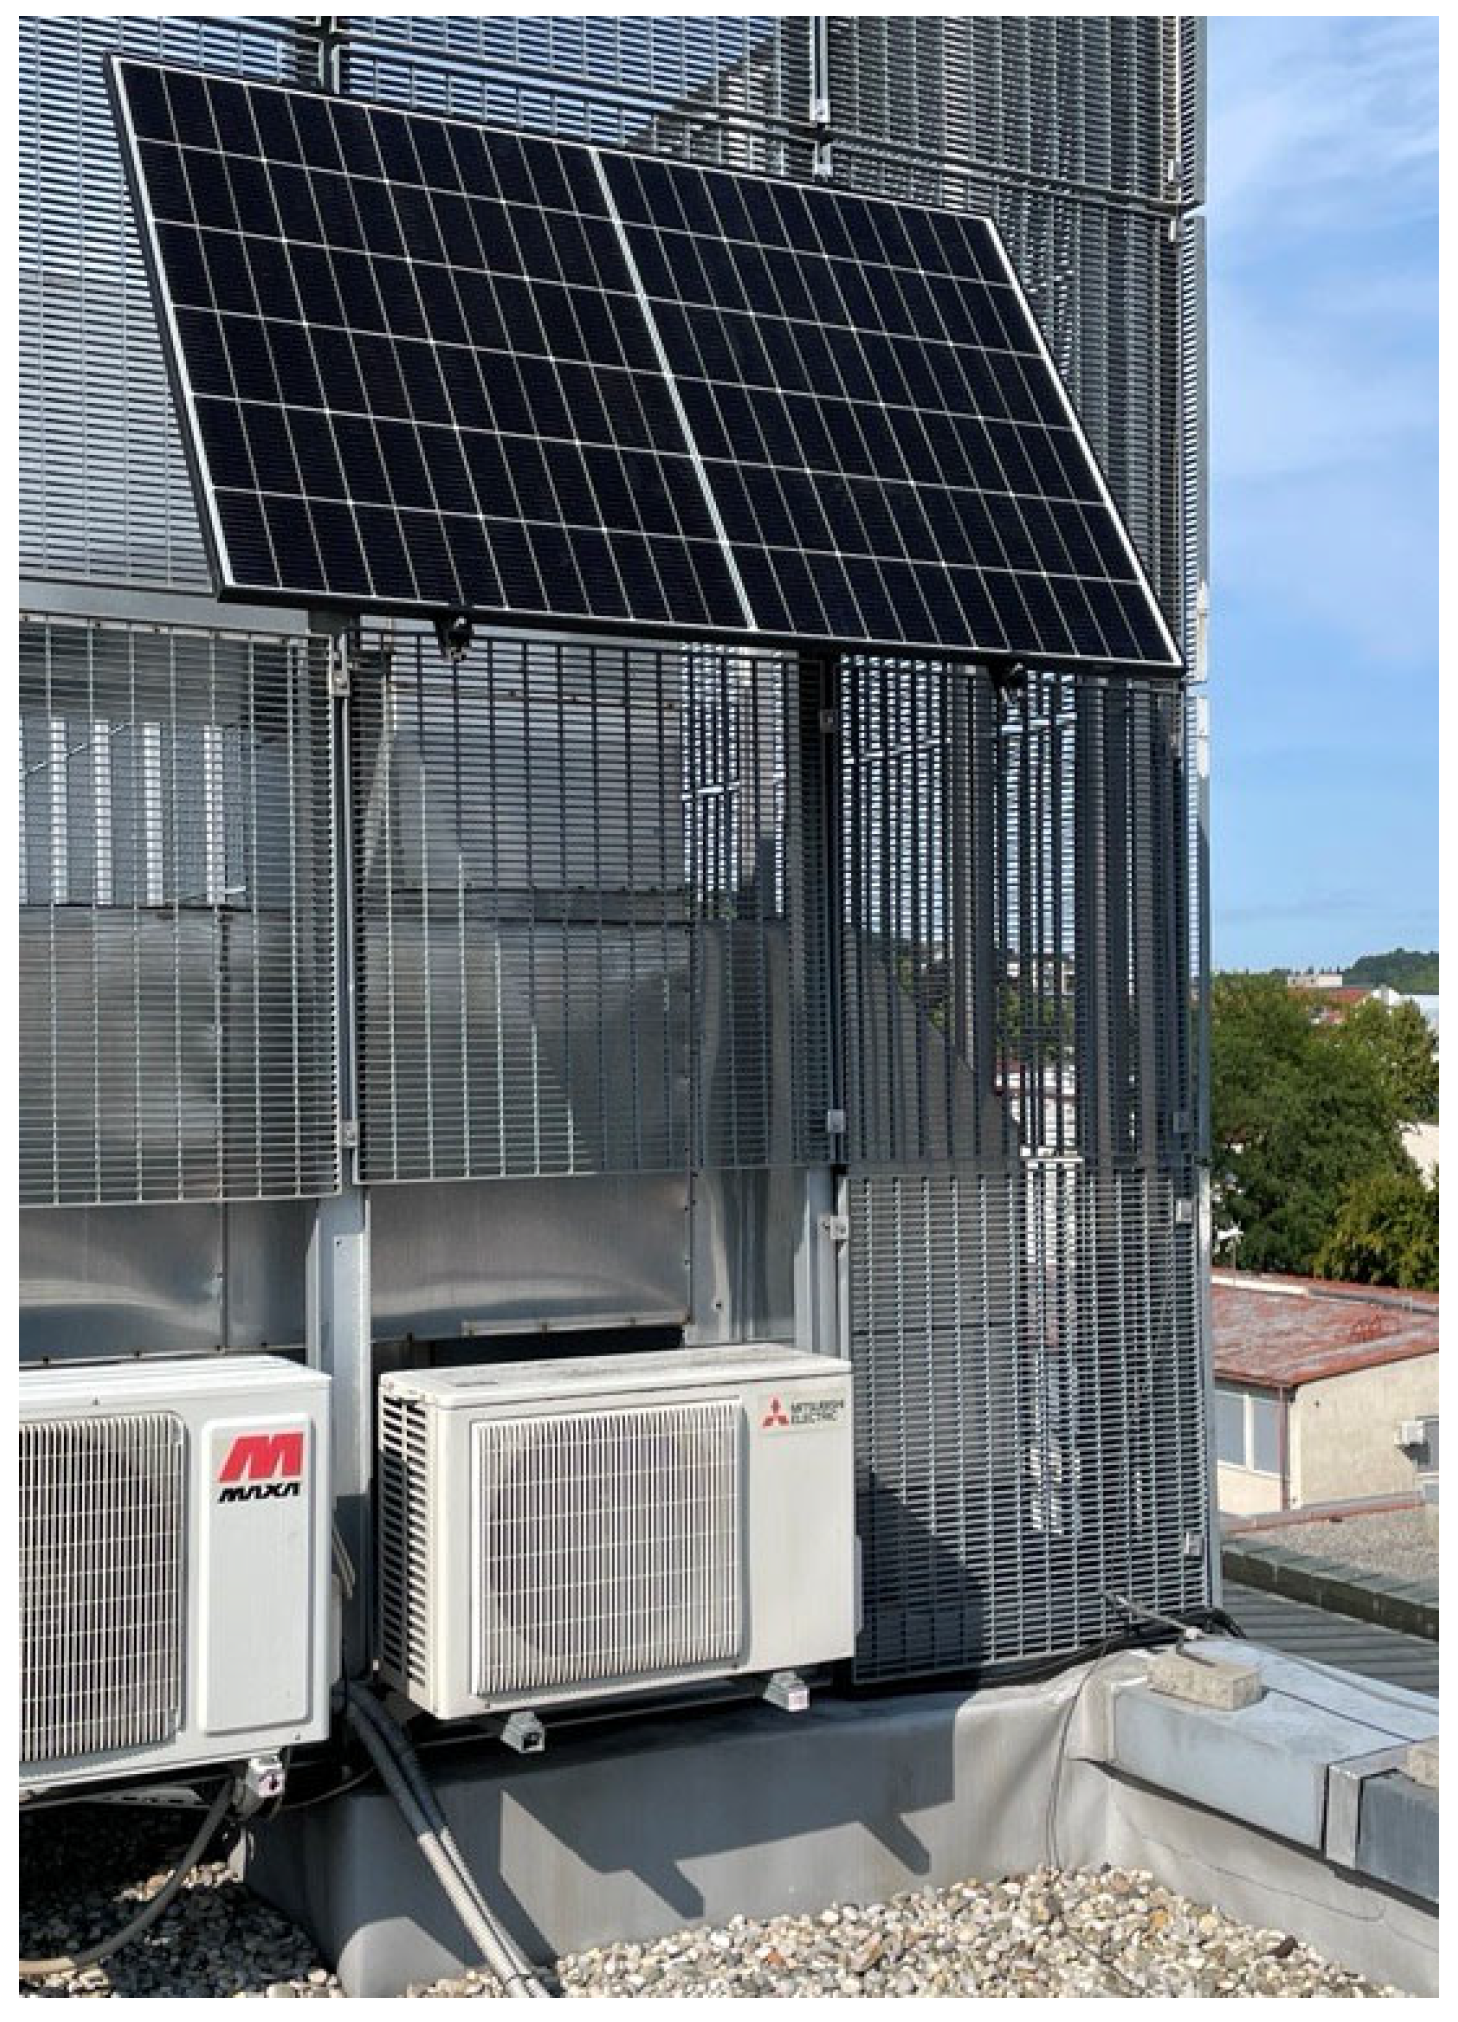
The primary energy source is a high-quality solar panel with an area of 2 m2, featuring monocrystalline cell technology, with a maximum power Pmax = 445 W and efficiency of 22.8% [43]. The capacity of the solar panel was selected based on the electrical requirements of the load and the battery energy storage system’s capacity.
To achieve the best possible use of solar energy, the panel is installed on the roof of the faculty building (Figure 4), where conditions are optimal—no shading and facing exactly south. The mounting structure allows the angle of inclination to be adjusted between 0° and 90°. The optimal tilt angle was calculated based on a simulation of the annual sun movement for our location (Maribor, latitude 46.5547, longitude 15.6467). The minimum power function occurs in December and January, so the tilt angle was set for winter and is 60°. The same findings are also described in articles by other authors.
The solar panel is installed on the roof of the faculty building, while the battery storage unit and other electronic components of the test system are in the laboratory. The power connection is 40 m long. Standard solar cables with a length of 2 × 40 m and a copper conductor cross-section of 6 mm2 were used as the connecting cables. The total series electrical resistance of the electrical conductors is 0.228 Ω. At full illumination of 1000 W/m2, the output current of the panel exceeds 10 A, resulting in dissipative losses on the conductors of up to 22.8 W of power.
The installation of the solar panel on the roof of the faculty building was carried out in accordance with the instructions of the architect and the building maintenance staff. In addition to installing the panel in an open space facing directly south. The panel has been mounted on a stable steel structure that is part of the existing building’s structure. A specialized mounting bracket for solar panels with an adjustable tilt angle has been used. The bracket is made of aluminum profiles and is certified according to ISO 9001 and CE standards. The installation was carried out by a professionally qualified installer from a company specializing in solar system installations. The electrical installation was technically challenging. Grounding was performed locally. Two 6 mm2 cables with a total length of 2 × 40 m were laid in non-flammable installation pipes.
The PV panel is mounted on the roof of the faculty building, while all other components are located inside the laboratory, where they are protected from weather conditions and temperature variations. The only external component of the system is the PV panel, which has a nominal operating temperature range of −40 °C to +85 °C. Temperatures in our environment never exceed these limits.

3.2.3. MPPT Controller

A commercial Victron MPPT75/15 solar charger was used to charge the LiFePO4 battery from the solar panel [44]. The MPPT 75/15 is an advanced solar charge controller from Victron Energy that utilizes Maximum Power Point Tracking (MPPT) technology to optimize energy from solar panels. The MPPT 75/15 model supports solar panel voltages of up to 75 V and a maximum charging current of 15 A, making it suitable for both 12 V and 24 V battery systems. The controller parameters can be set using the Victron Communication Protocol (VE.Direct) Bluetooth Smart dongle interface via the VictronConnect app, which also allows you to monitor current values such as voltage and current.

3.2.4. SmartShunt

SmartShunt [45] is a compact, commercially available meter designed for accurate battery monitoring. SmartShunt measures the voltage, current, power, SoC, and other key battery parameters. The device has very low current consumption and high measurement accuracy (an accuracy of current measurement ±0.4%, and accuracy of voltage measurement ±0.3%). It is designed to operate in a voltage range of 6.5 V to 70 V DC, allowing it to be used in 12 V, 24 V, and 48 V systems. SmartShunt does not have a built-in display—data can be obtained via a Bluetooth connection to the VictronConnect app, or via the VE.Direct communication interface. In our laboratory test system, we utilized it to monitor the key battery status parameters, including voltage, current, and battery SoC.

3.2.5. Control Circuit

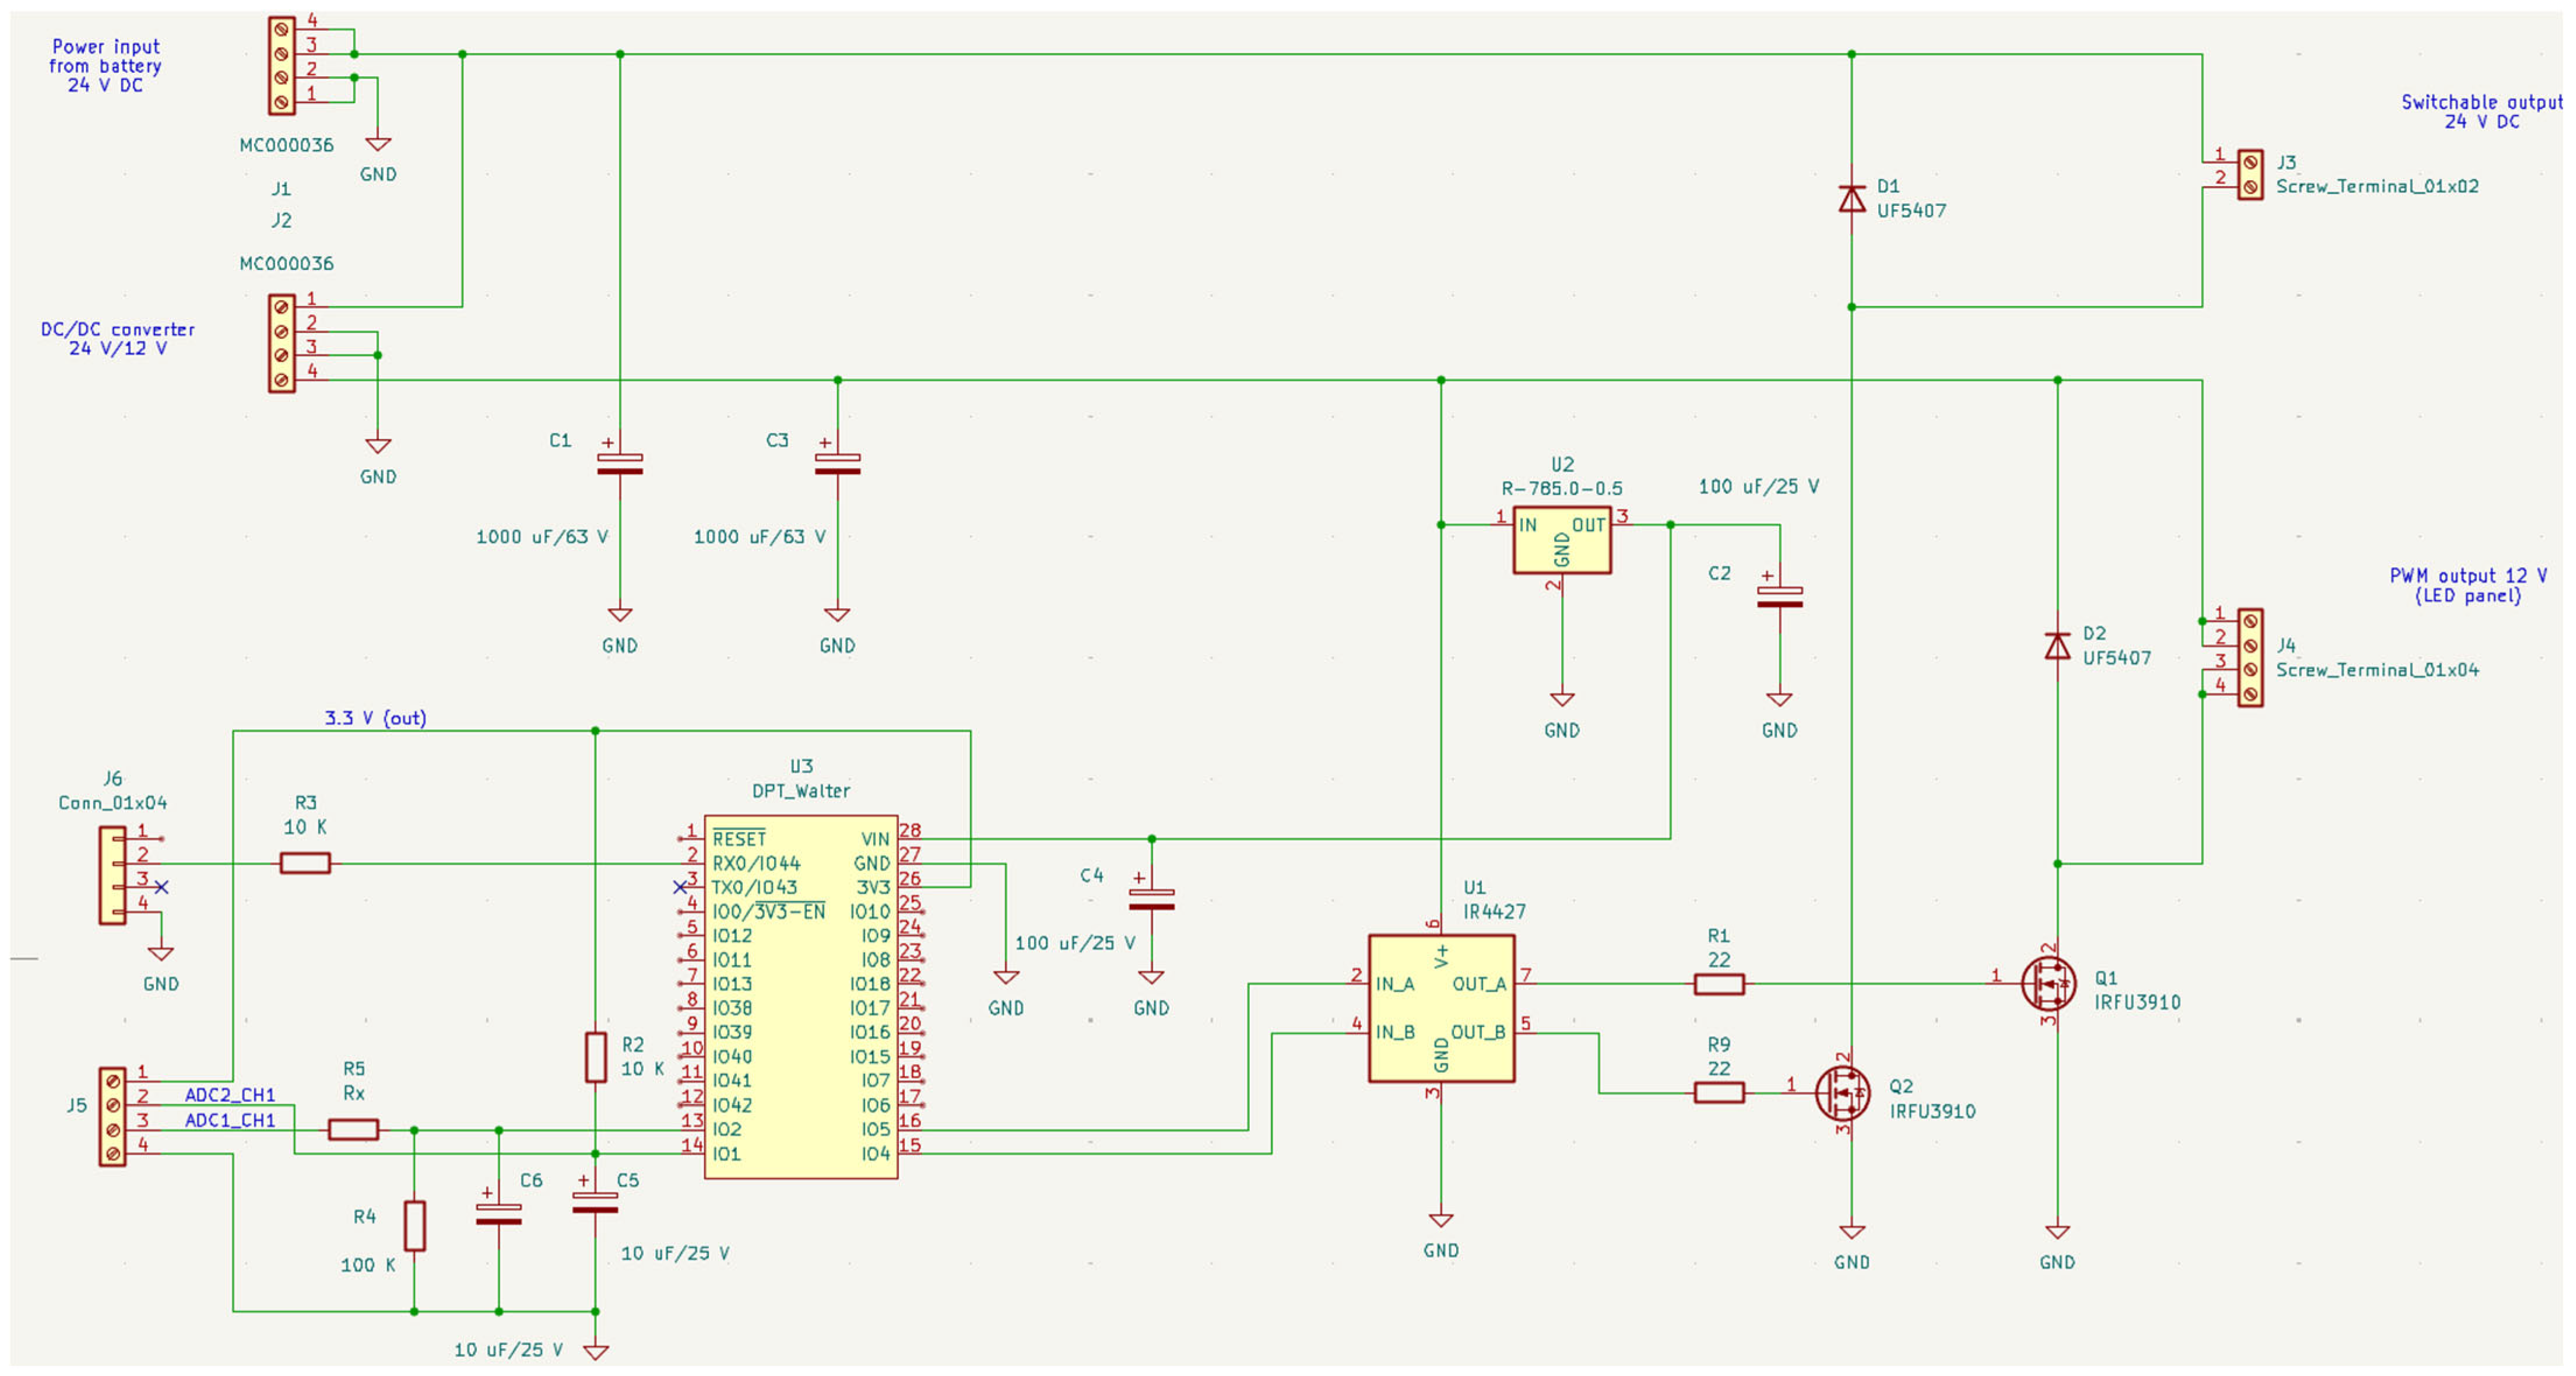
For easy connection and control of loads and installation of the IoT controller, a dedicated control circuit (Figure 5) was developed, which enables efficient control and monitoring of the operation of the connected consumers. The control circuit consists of the following electronic components: (1) an IoT controller, (2) power connectors for connecting the battery system and electrical loads, (3) connection terminals for the analog sensor and (4) a signal connector for VE.Direct communication, (5) a circuit for adjusting and filtering the input signals, (6) power MOSFET switching elements, and (7) a drive control stage.
The basis of the system is the ESP32 microcontroller module, which obtains all the necessary process data via the input peripheral units and controls the connected loads via output peripheral units based on the implemented algorithm.
The designed system features two distinct power outputs and accommodates the connection of two different types of electrical loads. For each type of load, the IoT controller generates a dedicated output control signal:
  • The AC Load power output is intended for loads with constant operating intensity (e.g., a standard LCD TV screen). The IoT controller generates a digital switching signal (0—the load is off, 1—the load is on). The MOSFET switch Q2 is switched on by the drive stage U2B, thereby transferring the 24 V(DC)battery voltage to the True Sine Wave DC-AC Power Inverter [46], which provides a standard sine wave voltage of 230 V/5 Hz and a maximum load power of up to 400 W at its output.
  • Power output “DC Load” for loads with a nominal voltage of 12 VDC and adjustable operating power (e.g., a light board with LED lighting). The battery voltage is reduced and stabilized to 12.5 V using a buck converter. The operating power of the load varies proportionally with the PWM level, whereby the duty cycle can be set in the range from 0 to 100%. The IoT controller generates a PWM output signal, which controls the MOSFET switch Q1 via the U2A drive stage.
An integrated dual low-side gate driver U1 is used for effective switching of the MOSFET switches. The microcontroller circuit (IoT controller) is powered by a 5 V stabilized Buck switching converter, U2. The MOSFET elements Q1 and Q2 used are of the IRF-3808 type (75 V, 140 A, 7 mΩ) and were selected based on the required current capacity. The MOSFET switching elements are protected against overvoltage spikes during shutdowns by fast Schottky diodes D1 and D2.
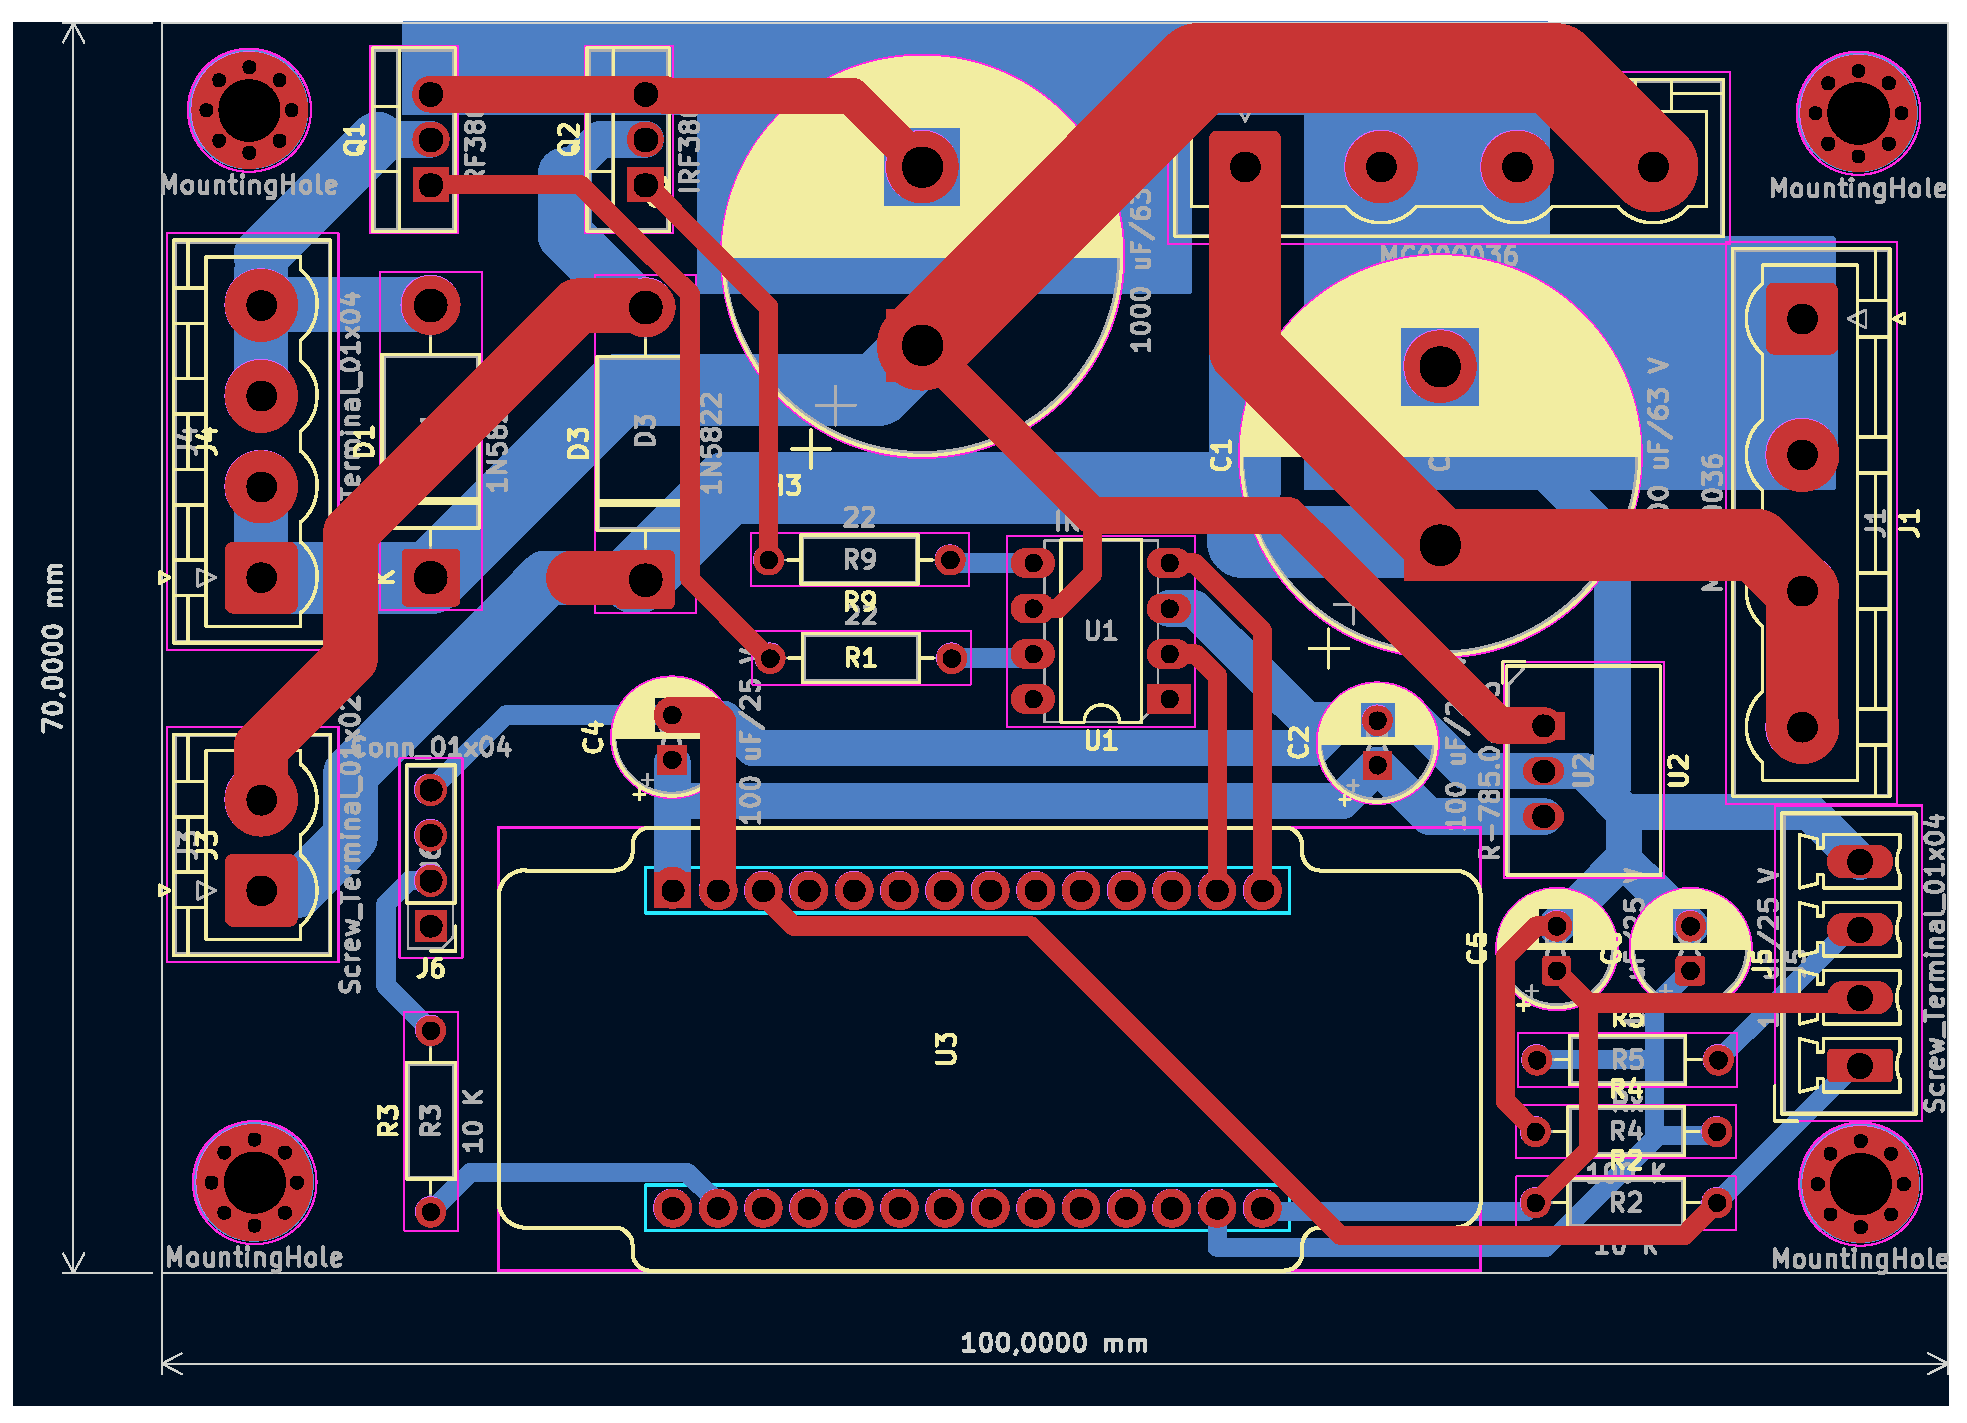
The entire electronic circuit was implemented in the form of a printed circuit board, with a focus on robust connections and sufficient current capacity. The schematic of the constructed Printed Circuit Board (PCB) is shown in Figure 6, and a photo of the manufactured control circuit is shown in Figure 7.

3.2.6. Overall System Efficiency

The overall system efficiency is determined by the combined efficiencies of the individual components that constitute the energy transfer chain. The overall system efficiency has been calculated using the following equations.
η L C D   T V = η w i r e s · η M P P T · η B A T · η D C / A C
η L E D   P A N E L = η w i r e s · η M P P T · η B A T · η D C / D C
where
η w i r e s Efficiency of power transmission through wires
η L C D   T V Power efficiency of AC load (LCD TV)
η L E D   P A N E L Power efficiency of the DC load (LED panel)
η M P P T Efficiency of MPPT controller
η D C / D C Efficiency of DC/DC converter
η D C / A C Efficiency of DC/AC converter
η B A T Efficiency of the LFP battery
The efficiency of power transmission through wires measures the proportion of electricity generated by the PV panel that reaches the MPPT controller, accounting for heat losses due to the wire’s resistance.
η w i r e s = 1 P w i r e s P P V = 1 22.8 450 = 0.9493
According to the manufacturer’s specifications, the efficiency of the used MPPT controller is 98%. Under low-load operating conditions (below 0.1C), the total charge–discharge efficiency of the LFP battery ranges from 98.5% to 99%, indicating minimal internal losses. The MOSFET switching circuit demonstrates an efficiency of 99.72% when supplying a combined load of 94 W (TV and media player) at an operating voltage of 27 V. At this operating point, a voltage drop of 75 mV was measured across the MOSFET element, confirming negligible conduction losses within the switching stage. The Mean Well NTS-450 pure sine wave DC/AC inverter exhibits an estimated efficiency of 88% at 20% of its rated load, which is consistent with the manufacturer’s specifications and typical performance characteristics of inverters operating at partial load.
Considering the above data, the calculated overall system efficiency is as follows:
η L E D _ P A N E L = 0.9138
η L C D   T V = 0.806
These efficiency calculations indicate that the dominant efficiency losses occur during the DC/AC conversion stage, while the battery and switching components maintain near-ideal performance under the tested conditions.

3.2.7. IoT Controller

The IoT controller is based on the ESP32 microcontroller, which is used increasingly due to its performance and reliability and has been implemented successfully in numerous IoT solutions [47,48,49,50,51,52,53,54,55,56]. For this project we chose Walter [57], which is an advanced IoT module that features a powerful processor (ESP32-S3), and supports various communication technologies, including Wireless Fidelity (Wi-Fi), Bluetooth Low Energy (BLE), Narrowband Internet of Things (NB-IoT), Long Term Evolution for Machines (LTE-M), and Global Navigation Satellite System (GNSS) for determining position.
The ESP32-S3 [58], developed by Espressif Systems (Shanghai, China), is a powerful and cost-effective microcontroller platform. It offers a well-balanced combination of processing performance, wireless connectivity, low power consumption, and rich peripheral support, making it suitable for a wide variety of applications.
The ESP32-S3 includes a dual-core Tensilica XTensa LX7 microprocessor, capable of operating at frequencies up to 240 MHz. One of the main features of the ESP32-S3 is its integrated wireless connectivity. The chip includes built-in support for 2.4 GHz Wi-Fi, compliant with the 802.11 b/g/n Standards, as well as Bluetooth 5 (LE). This integrated wireless capability enables the ESP32 to connect easily to local networks, cloud services, or other devices, without requiring external modules. The ESP32-S3 is also equipped with many GPIO (General Purpose Input/Output) pins, which can be used to interface with various external components, such as sensors, actuators, switches, or displays.

3.3. Software

ESP32 controllers can be programmed using various development tools, such as the Arduino IDE, Espressif ESP-IDF (Espressif IoT Development Framework), and PlatformIO. In our case, we used the Arduino IDE development tool and the Arduino support package for ESP32.
The built-in Arduino environment functions were used to access the analog and digital inputs/outputs (including PWM signal generation) and Wi-Fi connectivity. The “Walter modem library for Arduino” (WalterModem by Daan Pape version 1.4.3.) [59] was used for communication via the LTE modem.
The “VeDirectFrameHandler” software library by Chris Terwilliger [60] was used to establish communication between the SmartShunt module and the IoT controller, which runs via the VE.Direct protocol [61]. VE.Direct is a communication protocol developed by Victron Energy for exchanging data between their devices. The protocol is text-based and relies on the UART (Universal Asynchronous Receiver-Transmitter) serial interface, which enables two-way communication between devices. The VE.Direct protocol is used to transfer data, such as voltage, current, power, and battery status, as well as to configure the Victron Energy devices.

4. Case Study

4.1. Case Description

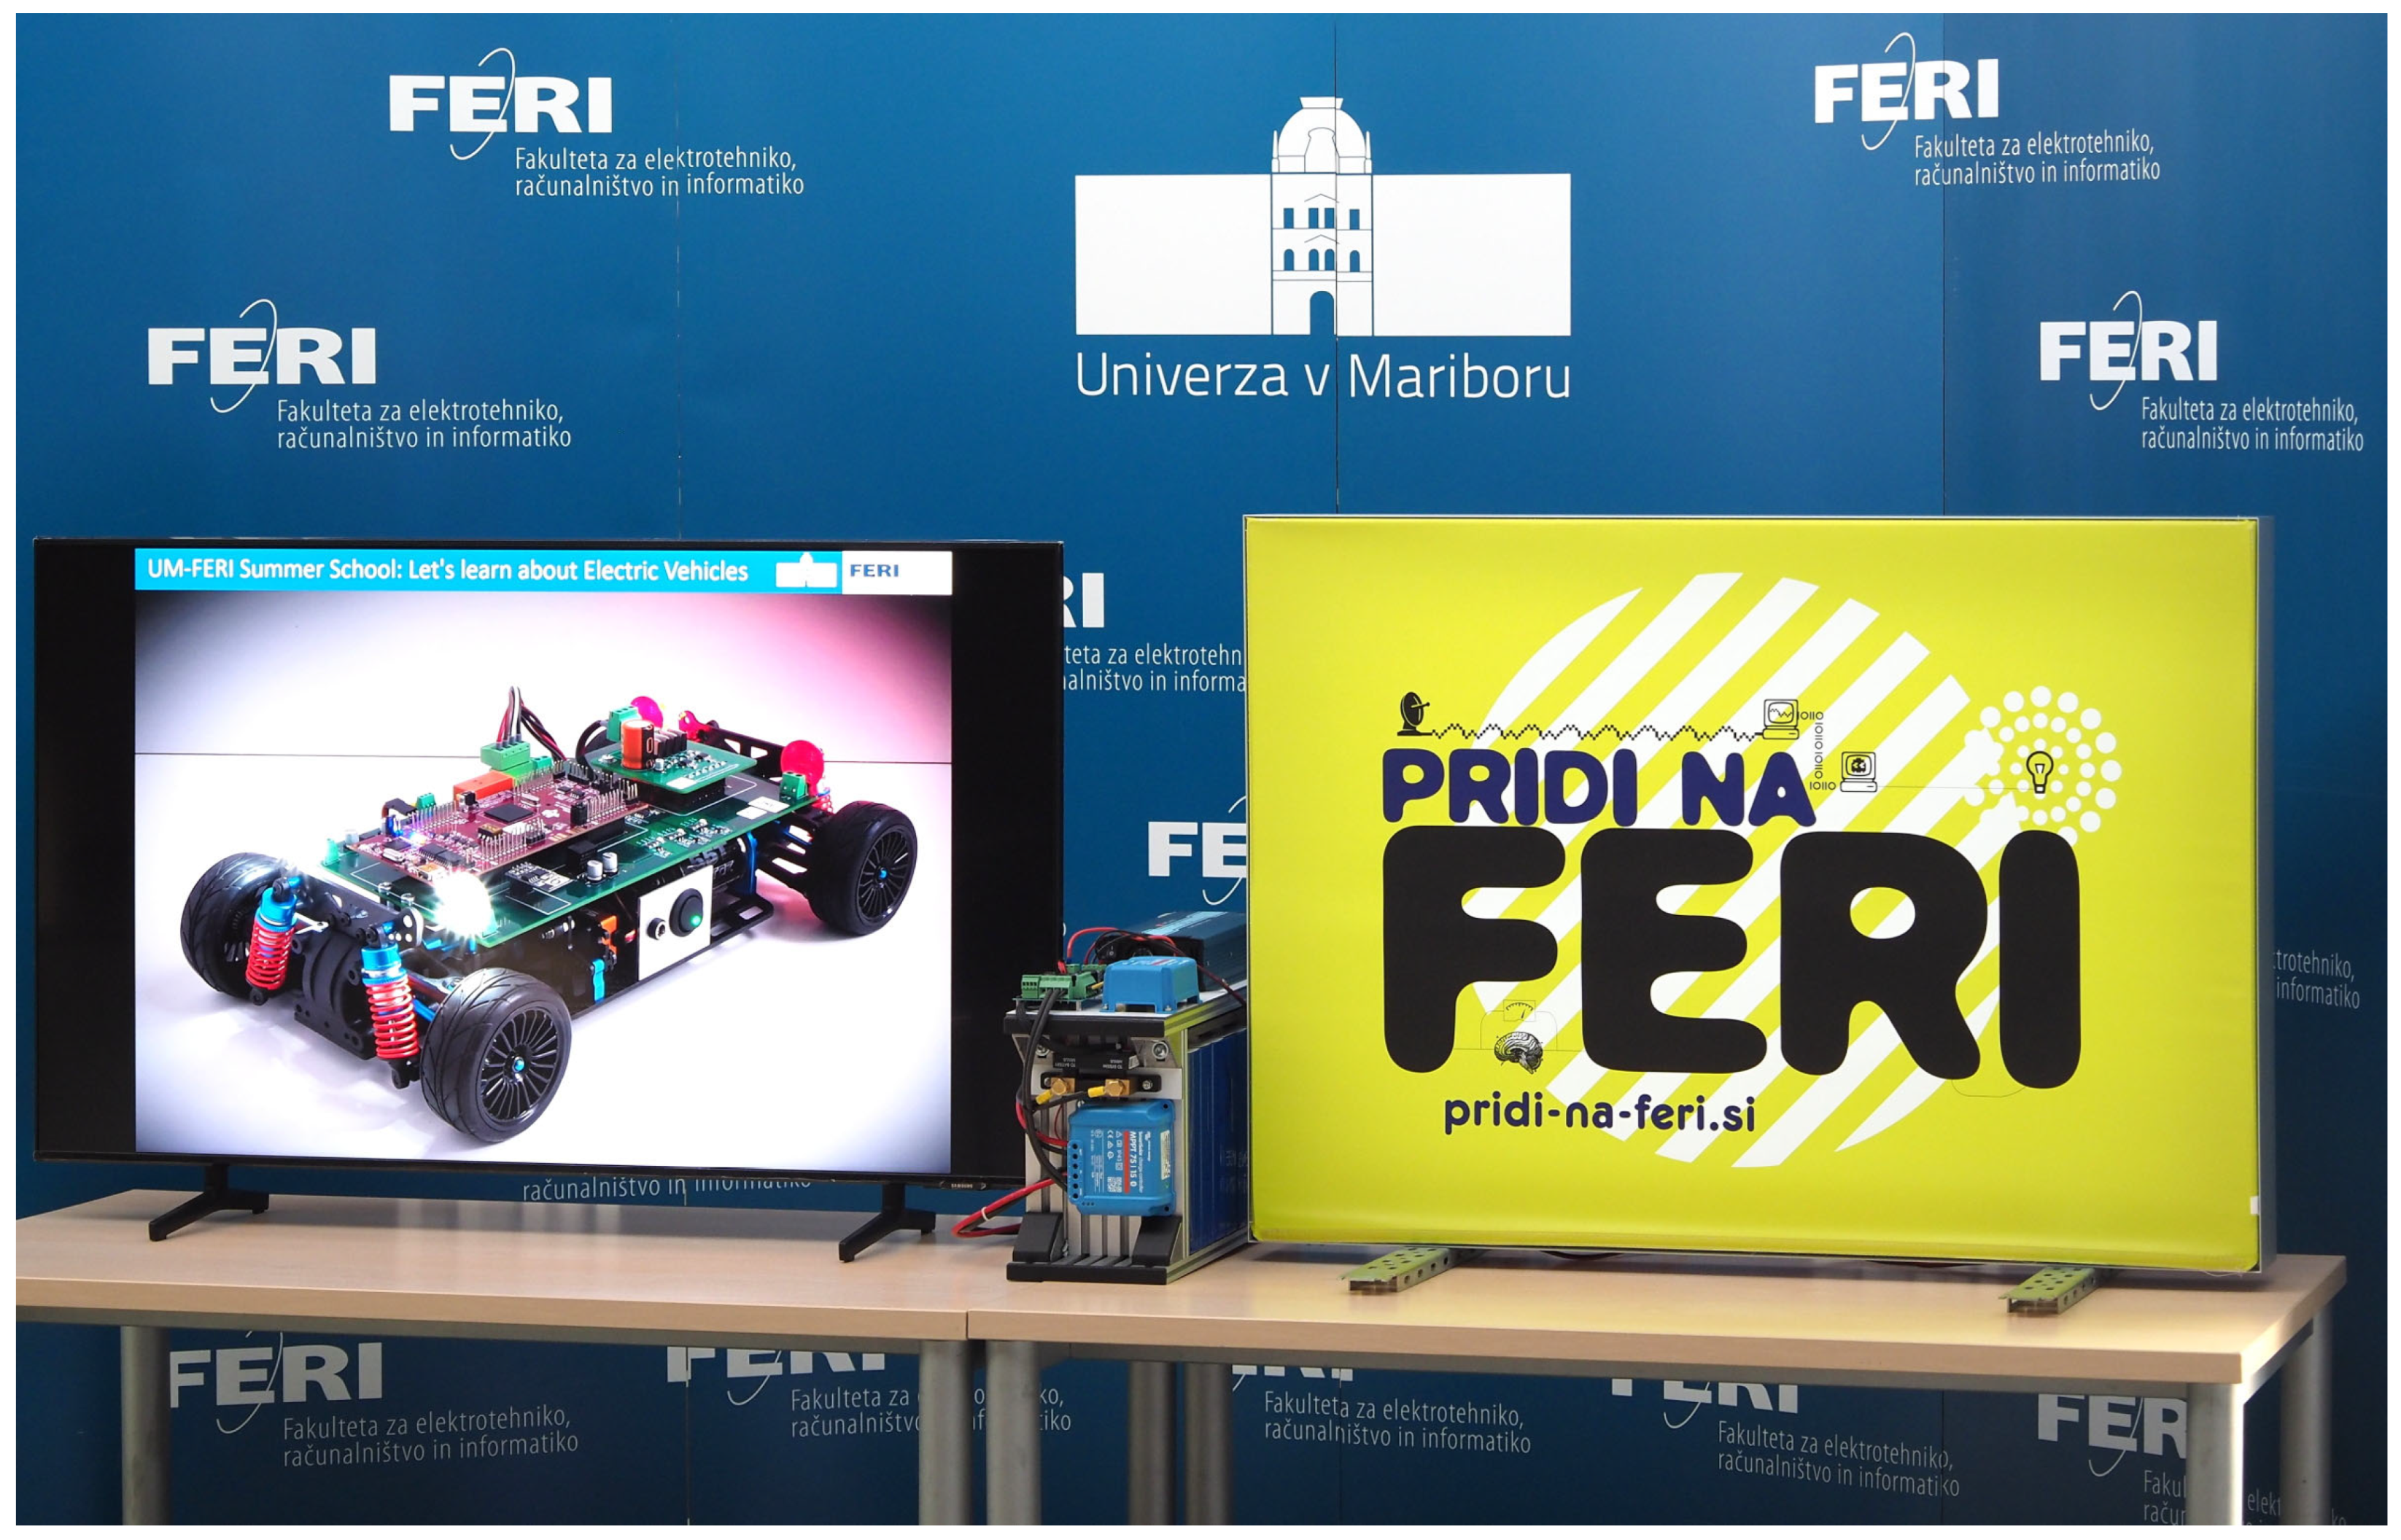
The case study examines the use of the presented prototype for powering an energy self-sufficient information/advertising system. The power supply system, based on a solar power plant and a local battery storage unit, functions as an island power plant. The light information system includes an LCD TV and an LED-illuminated advertising billboard (Figure 8).
The LCD TV screen is powered by the alternating current output (AC Load) of the control circuit, representing a constant load that can only be switched on or off. The LCD TV used has a screen diagonal of 127 cm (50 inches), a rated voltage of 230 V 50 Hz, and an average power of 80 W. The LED-illuminated billboard has a rated voltage of 12 VDC and a power of 40 W at full brightness. The advertising board is connected to the DC Load (Figure 9) output of the control circuit, allowing the intensity of the LED lighting to be varied continuously by adjusting the duty cycle value of the PWM signal. The frequency of the PWM signal is determined by a compromise between the frequency of flickering that is perceptible to the human eye [62] and the upper limit at which the current peaks during MOSFET switching increase significantly due to the capacitance of the circuit in the LED modules. The appropriate frequency band for the switching frequency was estimated to be between 100 Hz and 2000 Hz; in our case, a value of 500 Hz was selected. Based on the lighting efficiency, the duty cycle range, between 10% and 100%, was determined experimentally.
In the presented case study we used the developed system and implemented algorithm to pursue the goal of optimizing the system operation based on the daily forecast of available solar energy. Based on data on the predicted daily solar energy obtained from the Open-Meteo online platform (Figure 9), the algorithm determines the optimal schedule and the appropriate operating power of the connected loads. In doing so, it considers several interrelated objectives, namely:
  • the longest possible operating time of both loads,
  • maintaining the battery SoC above a predetermined minimum threshold, and
  • respecting the hierarchy between loads, whereby the operation of the TV takes precedence over the LED lighting.

4.2. Control Algorithm

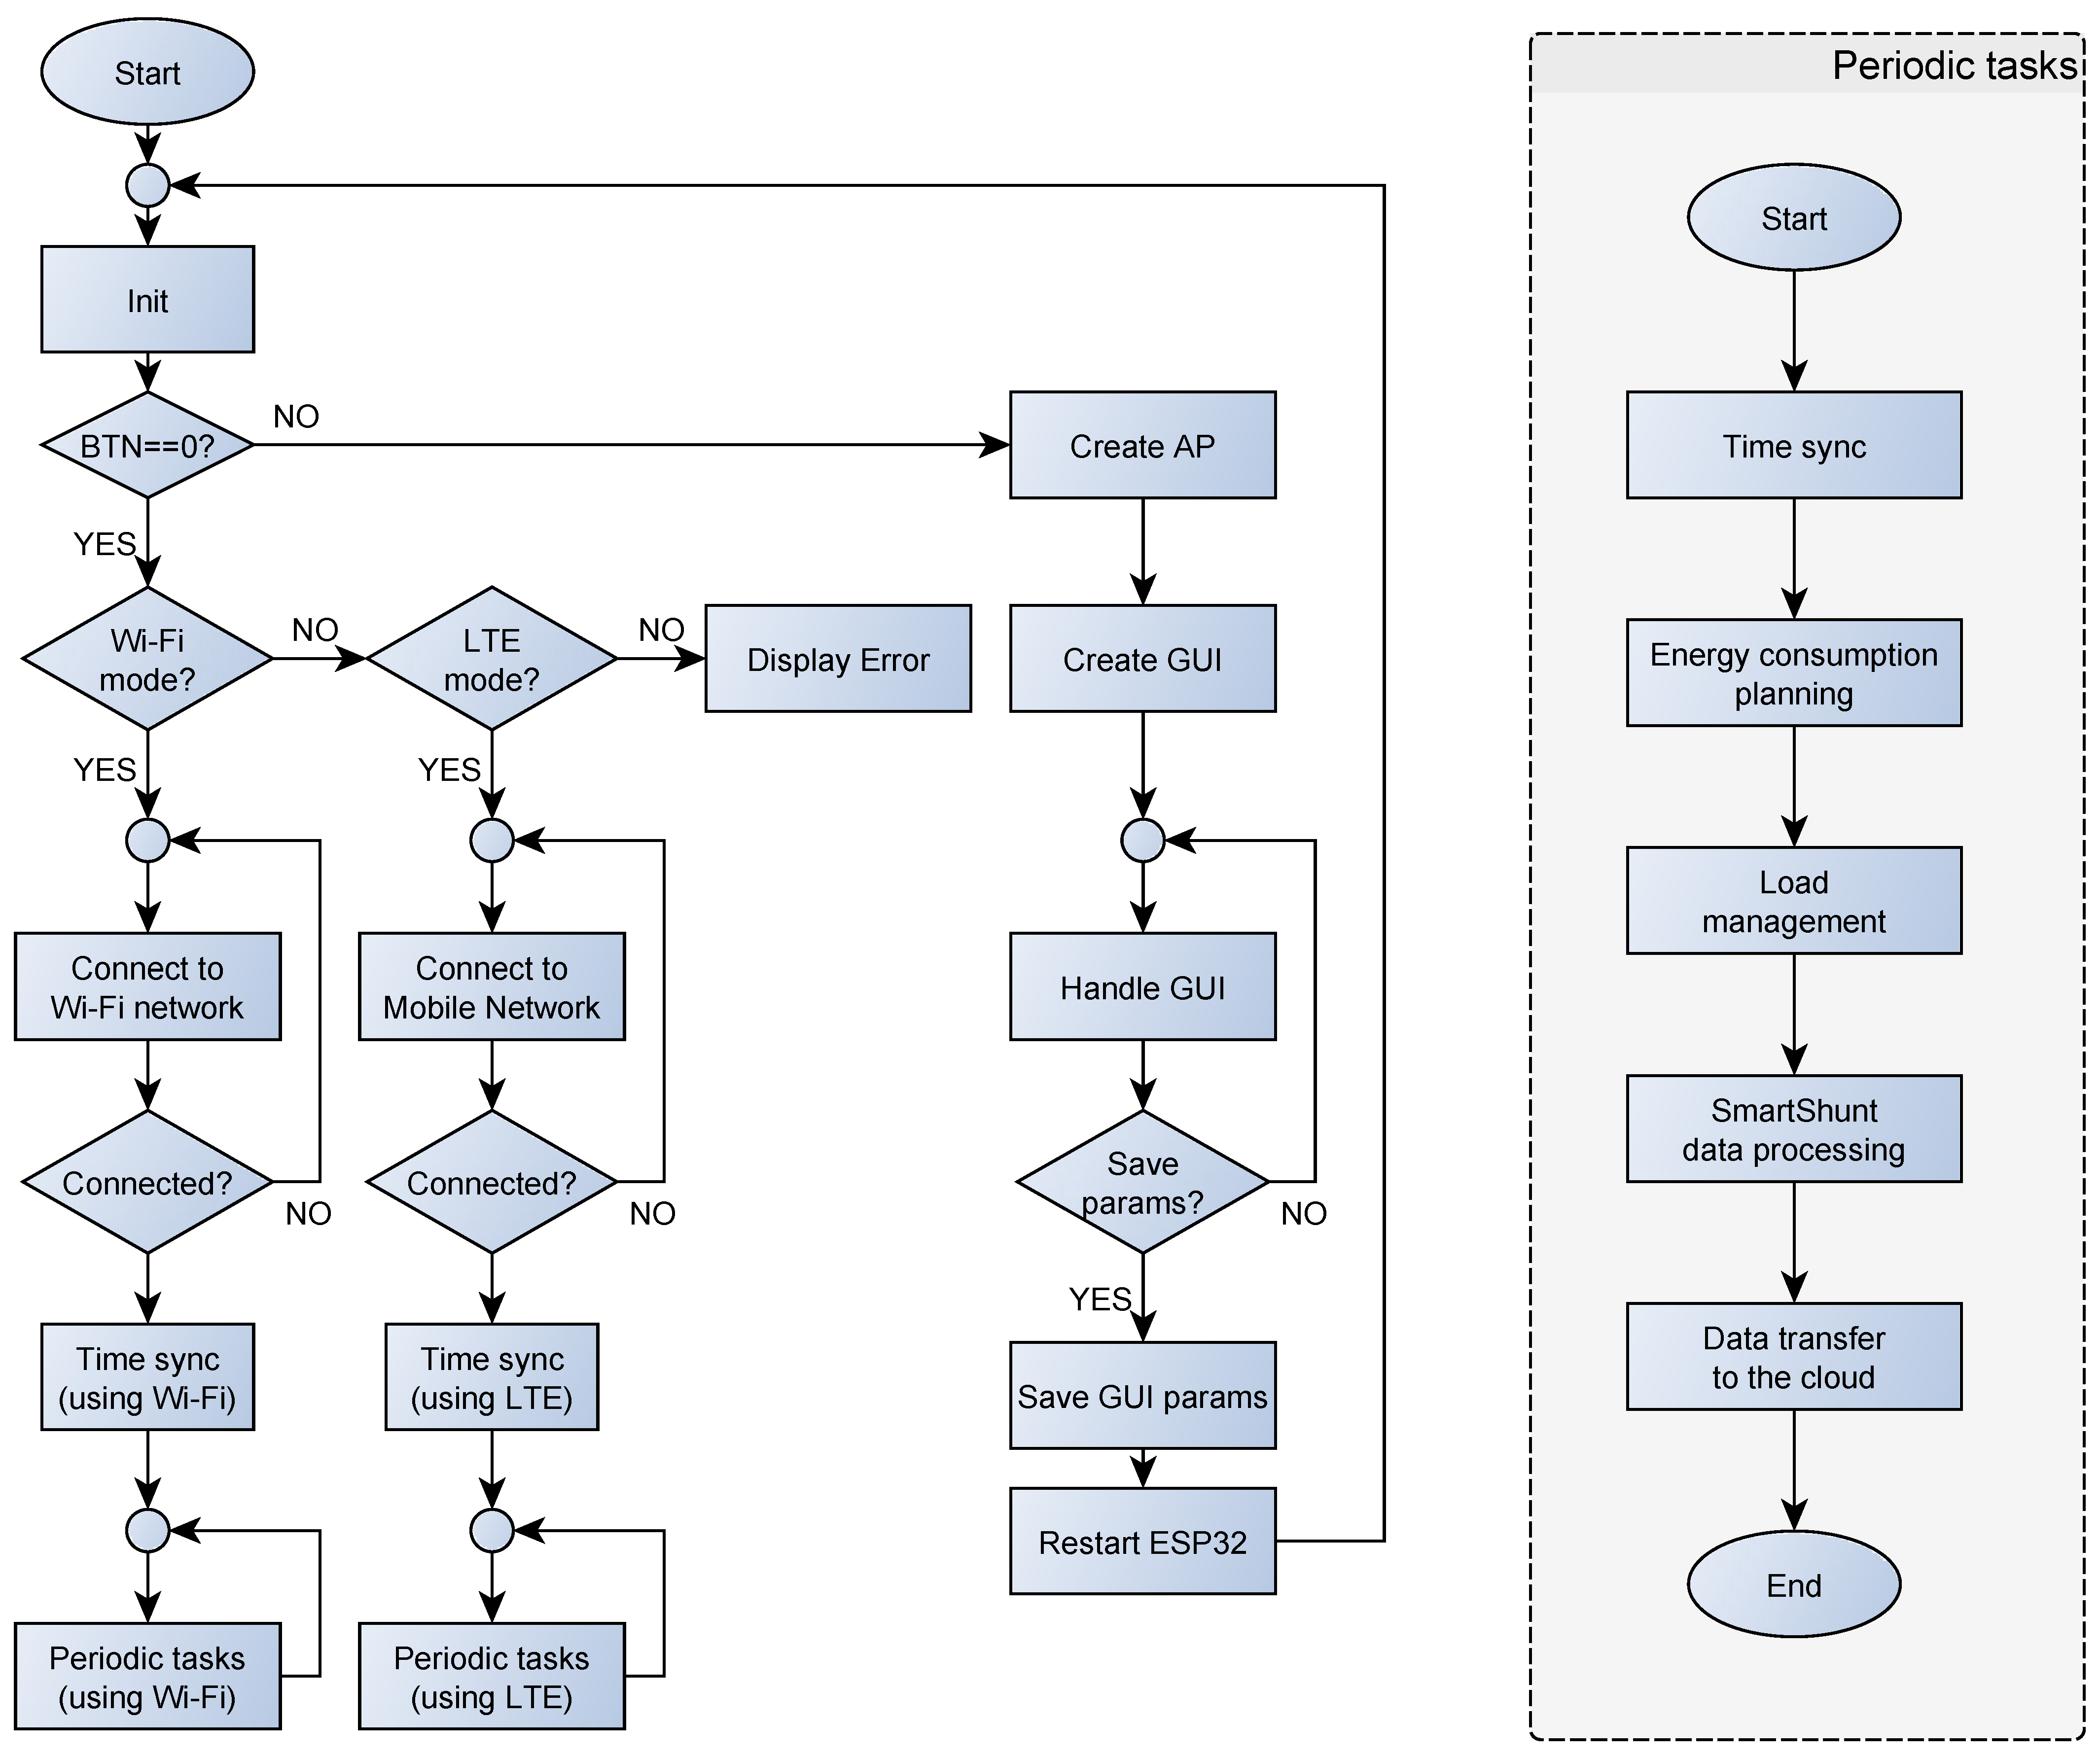
During the initialization phase, the controller first initializes the local and global variables and communication interfaces (Figure 10). After the initialization is complete, the controller checks whether a specific button is pressed at startup. If the key is pressed the controller creates a wireless access point and starts a web server through which selected system parameters can be set, such as the communication mode (Wi-Fi or LTE).
If the button is not pressed the controller connects to the existing Wi-Fi network or mobile network automatically, as specified in the stored settings. The internal clock is synchronized once the connection is established successfully. During this process the controller sends a Network Time Protocol (NTP) request to the server, which returns the current Coordinated Universal Time (UTC). The controller then adjusts its local clock to match the time received.
After the initialization is complete, the controller enters an infinite loop, within which it performs the following tasks periodically (Figure 10):
  • Time sync: Once a day, the controller synchronizes its internal clock with an NTP server to ensure accurate system timing.
  • Energy consumption planning: At the start of each day, the controller queries about the predicted solar energy. Based on this forecast and the current battery SoC, it determines the optimal timing for switching the connected loads on and off, thereby optimizing the use of the available energy.
  • Load management: Every hour, the controller adjusts the brightness of the LEDs (via PWM settings) and the status of the LCD according to the planned operating schedule of the system.
  • SmartShunt data processing: At specific time intervals, the controller obtains data from the SmartShunt device via the UART interface. Communication between the devices is carried out using the VE.Direct protocol, which enables the reliable transmission of the measurement data. From the data received the controller extracts key information about the battery system’s status, including the voltage, current, power, and battery SoC.
  • Data transfer to the cloud: At specific intervals the controller sends the process data to the ThingSpeak web platform, where they are stored and displayed in graphical form.
The most important part of the algorithm is the “Energy Consumption Planning” module, which calculates the optimal distribution of electricity consumption in the PV-battery system for each day (by hour). The purpose of the algorithm is to ensure the uninterrupted operation of the primary consumer (the TV) and maximum utilization of surplus energy for the secondary consumer—the LED lighting. This algorithm is divided into 5 phases, namely:
  • Data acquisition and electricity production forecast
In the first phase the IoT controller from the Open-Meteo web platform obtains hourly data on the predicted solar radiation for the entire day. Based on these data and the known parameters of the photovoltaic system, the algorithm calculates an hourly forecast of the electricity production of the PV modules. The calculation includes a correction of the MPPT charger efficiency, as well as the conversion and battery charging efficiencies.
2.
Energy consumption forecast and distribution
In the next step the algorithm estimates the hourly energy consumption for all the connected consumers. The TV screen has absolute priority, so its energy needs are always met before those of the LED lighting. Based on the initial battery state of charge and the predicted PV production, the available energy is determined for each hour of the day.
If the predicted production is sufficient for the entire operating period of the TV (e.g., between 7:00 a.m. and 2:00 p.m.), it is included in the entire time window. Otherwise, the algorithm shortens the operating time adaptively, so that the battery’s SoC never falls below the minimum allowed value (SoCmin). The start and end times of the TV’s operation are adjustable parameters, while the SoC is a measured value obtained via the SmartShunt sensor.
3.
Secondary consumer management (LED lighting)
Once the TV’s operated time and consumed energy are calculated, the algorithm continues to control the LED lighting, which is treated as an optional consumer. Its operation depends on the available surplus energy. Based on the predicted PV production and estimated TV consumption, a daily energy budget for the LED is determined, which is divided into two priority time windows: (1) the evening period (e.g., 6:00 p.m. to midnight) has a higher priority, (2) the night period (e.g., midnight to 6:00 a.m.) has a lower priority. The evening switch-on and morning switch-off times are not fixed parameters but are calculated from the Open-Meteo data. The evening switch-on occurs when the solar radiation reaches zero, and the morning switch-off occurs when the solar radiation becomes non-zero again.
4.
Determining the LED brightness
For each time window the algorithm determines the appropriate PWM duty cycle, which determines the brightness level of the LEDs. If the predicted energy is sufficient the LEDs operate at 100% PWM. In the event of limited energy, the PWM is reduced proportionally, so that the lighting does not compromise the power supply to the primary consumer. Special attention is paid to the night-time operation, as improper LED control can reduce the energy available for the morning TV operation. If the SoC is low at the start of the day, the algorithm reduces the PWM, so that the SoC does not fall below SoCmin; if the SoC is very low, the LEDs are switched off at night.
5.
Output vectors and control
The Energy Consumption Planning algorithm creates a vector with 24 elements for each consumer, describing its operation at each hour of the day:
  • TV vector: logical values (on/off),
  • LED vector: real values from 0 to 100 (PWM signal width).
Based on these vectors, the Load Management module updates the digital output and PWM output every hour according to the corresponding elements of both vectors.

Communication Error and Low SOC Handling

In the event of an LTE or Wi-Fi communication failure, the system automatically switches to offline operating mode, ensuring continued functionality even without network connectivity. In this mode, the load control is based on the battery SoC. The system operates normally if the SoC is greater than 60%. When SoC values are between 20% and 60%, lower-priority loads (LEDs) are disabled to reduce energy consumption. When the SOC drops below 20%, the system enters a critical mode in which all loads (LED and LCD) are turned off, maintaining only the microcontroller’s core control functions. This preserves essential operation and ensures that communication can be re-established once signal conditions improve. The functionality of local data storage in the event of an LTE or Wi-Fi connection failure has not been implemented.
All loads are also switched off when communication is established, but the SoC falls below SoCmin (currently set to 10%). Data acquisition from SmartShunt and communication with online services remain active, enabling the prompt detection of SOC-related issues. The appropriateness of this SoC threshold (SoCmin) will be further assessed during the upcoming winter testing period, when solar energy availability is expected to be significantly lower.

4.3. Configuration Utility

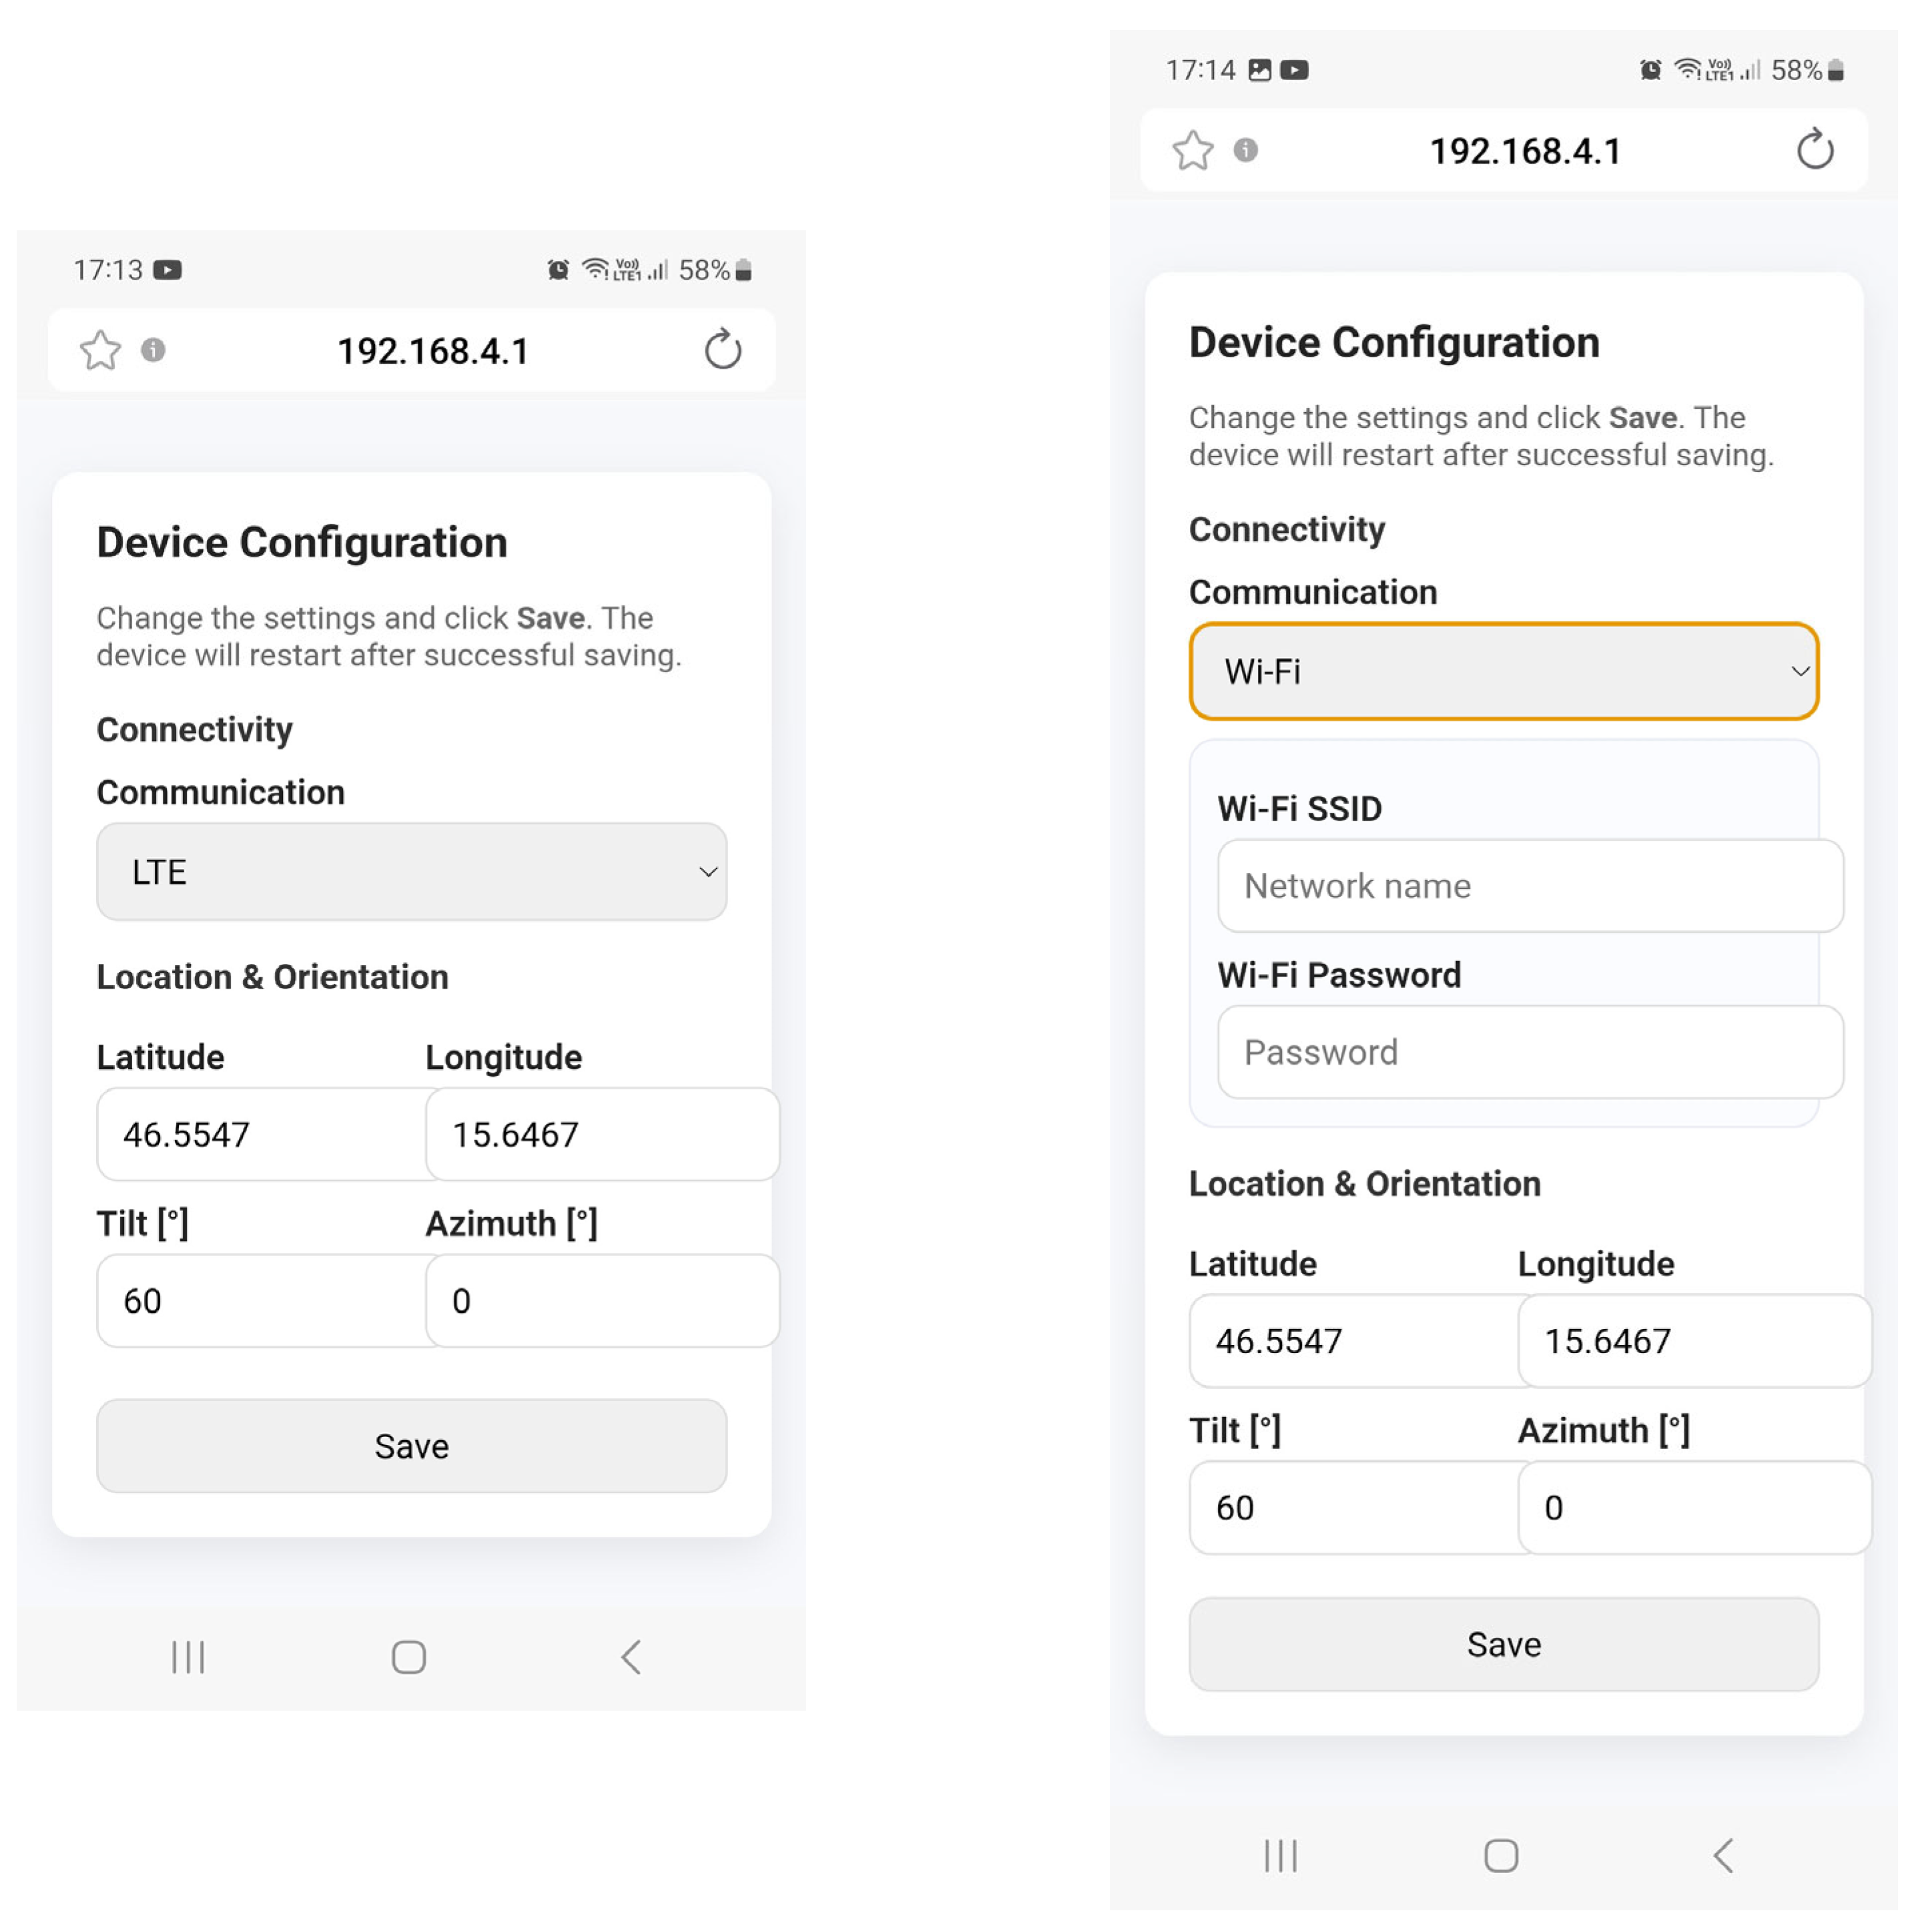
The specific parameters of the implemented algorithm can be set via the configuration user interface (Figure 11). This is enabled when the program is started, if the appropriate key is pressed at the same time. In this case, the IoT controller creates an access point and starts the web server. After logging into the access point, the user is presented with a web configuration interface through which they can set key system parameters. In the current version, the following parameters can be set (Figure 11):
  • Communication interface: This can be Wi-Fi or LTE. If Wi-Fi is selected, the user is presented with input fields for the Service Set Identifier (SSID) name of the selected wireless network and the corresponding password. If LTE is selected, no additional settings are required, as the IoT controller connects to the mobile network automatically based on the SIM card data. A SIM card from ThingsMobile was used in our case.
  • Geographic data: The user enters the latitude and longitude of the panel’s location, as well as the azimuth and tilt of its position.
After confirming the set parameters, they are stored permanently in the IoT controller and used automatically the next time the microcontroller is started.

4.4. Data Visualization

The ThingSpeak and ThinksBoard web platforms have been used to display and store the measured data. Both platforms are designed for processing, visualizing, and analyzing data within the Internet of Things (IoT) systems. The IoT controller periodically sends data to ThingSpeak using HTTP (Hypertext Transfer Protocol) requests and to ThinksBoard using MQTT protocol.
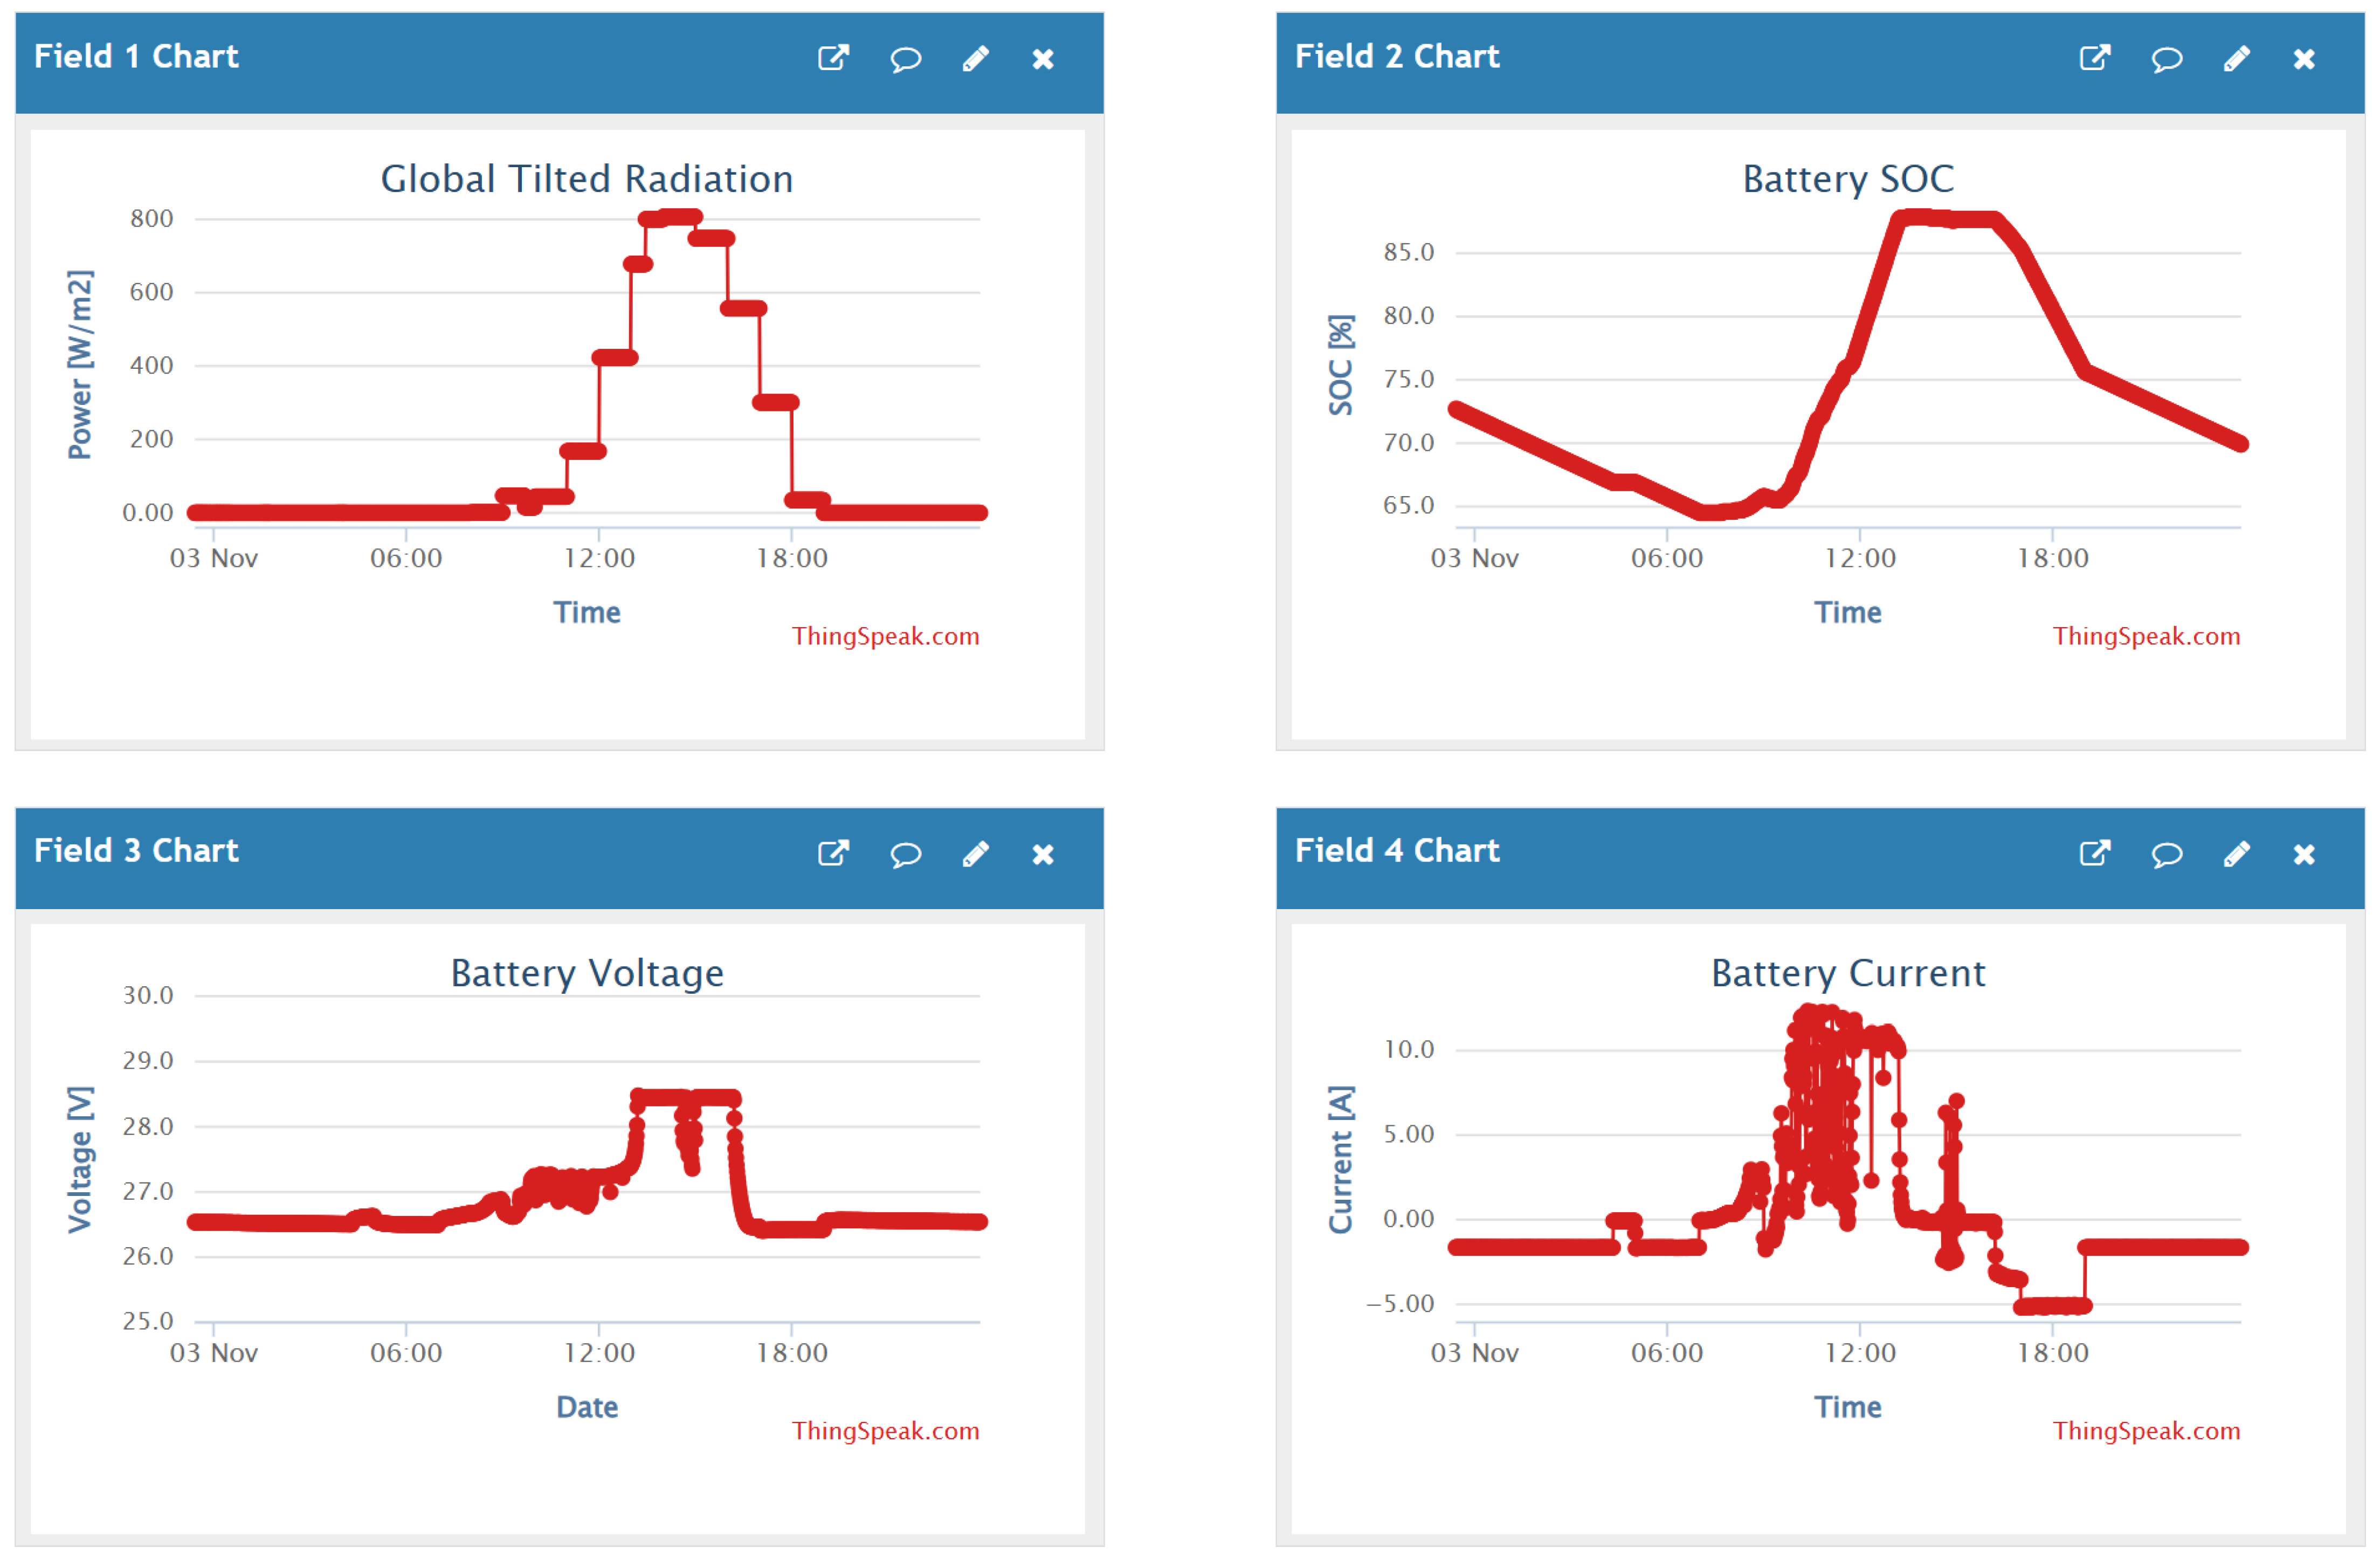
In the ThingSpeak platform the data are organized into channels, where each channel represents a separate data set. Each channel can contain up to eight fields, in which individual measurements or variables are stored. In addition to basic storage, ThingSpeak also enables the graphical display of data in various forms, such as line or bar charts, allowing for quick visual monitoring of the process data. For more advanced analysis, ThingSpeak also enables MATLAB (version R2021b) integration, allowing the users to run their own scripts, perform statistical processing, or generate custom graphs.
In our case we used one ThingSpeak channel, to which the following data are sent periodically (Figure 12): (1) Global Tiled Radiation [W/m2], (2) Battery SoC [%], (3) Battery Voltage [V], (4) Battery Current [A], (5) TV State, (6) LED PWM.
ThingSpeak has several limitations when it comes to displaying data and using graphs. Users cannot interact with graphs, such as zooming or panning, so the displays are static. The options for customizing the axis and displaying historical data are also quite limited. However, the platform has one significant advantage—it allows additional data analysis to be performed using MATLAB scripts.
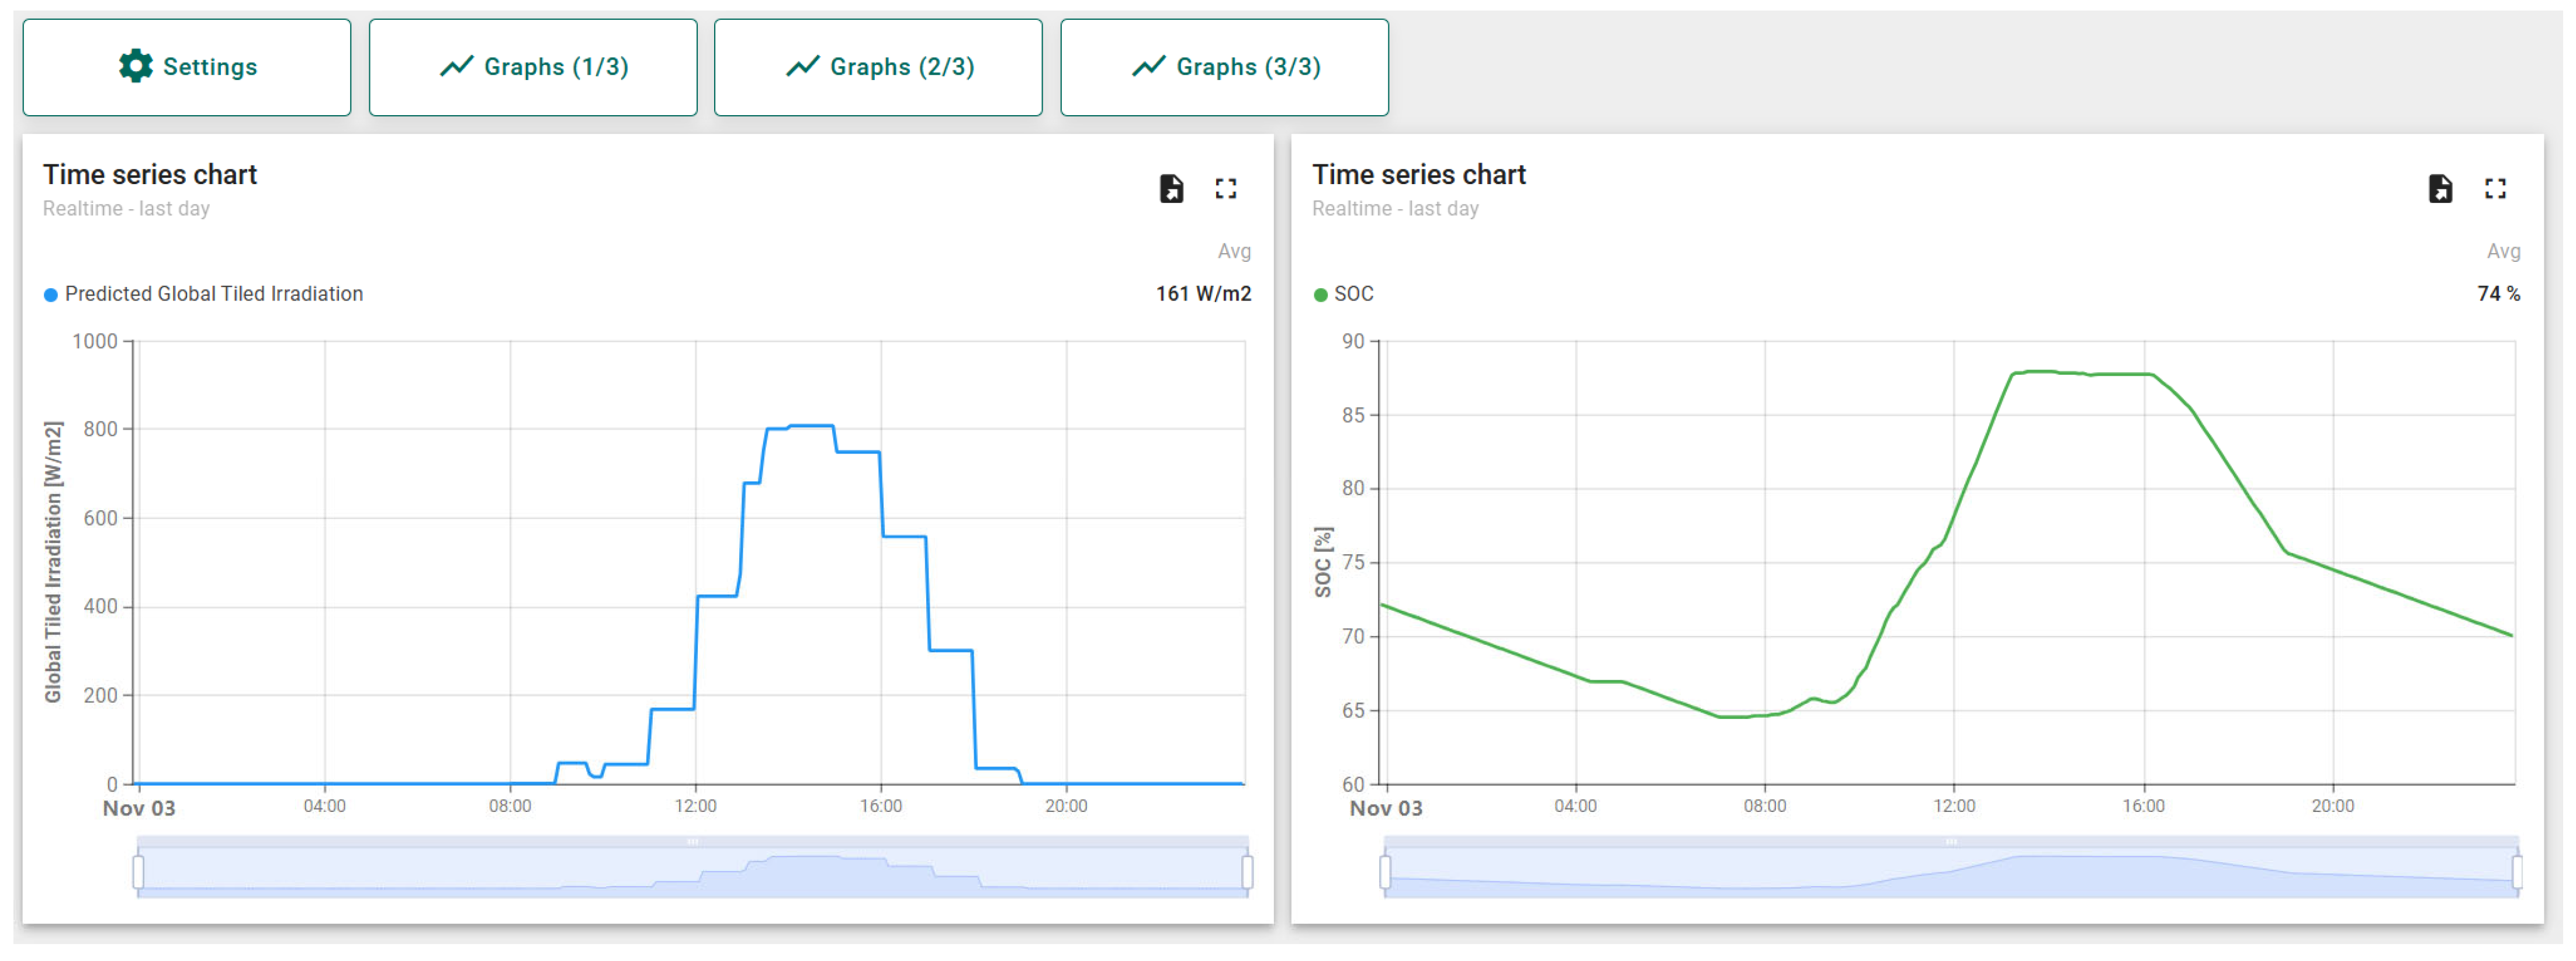
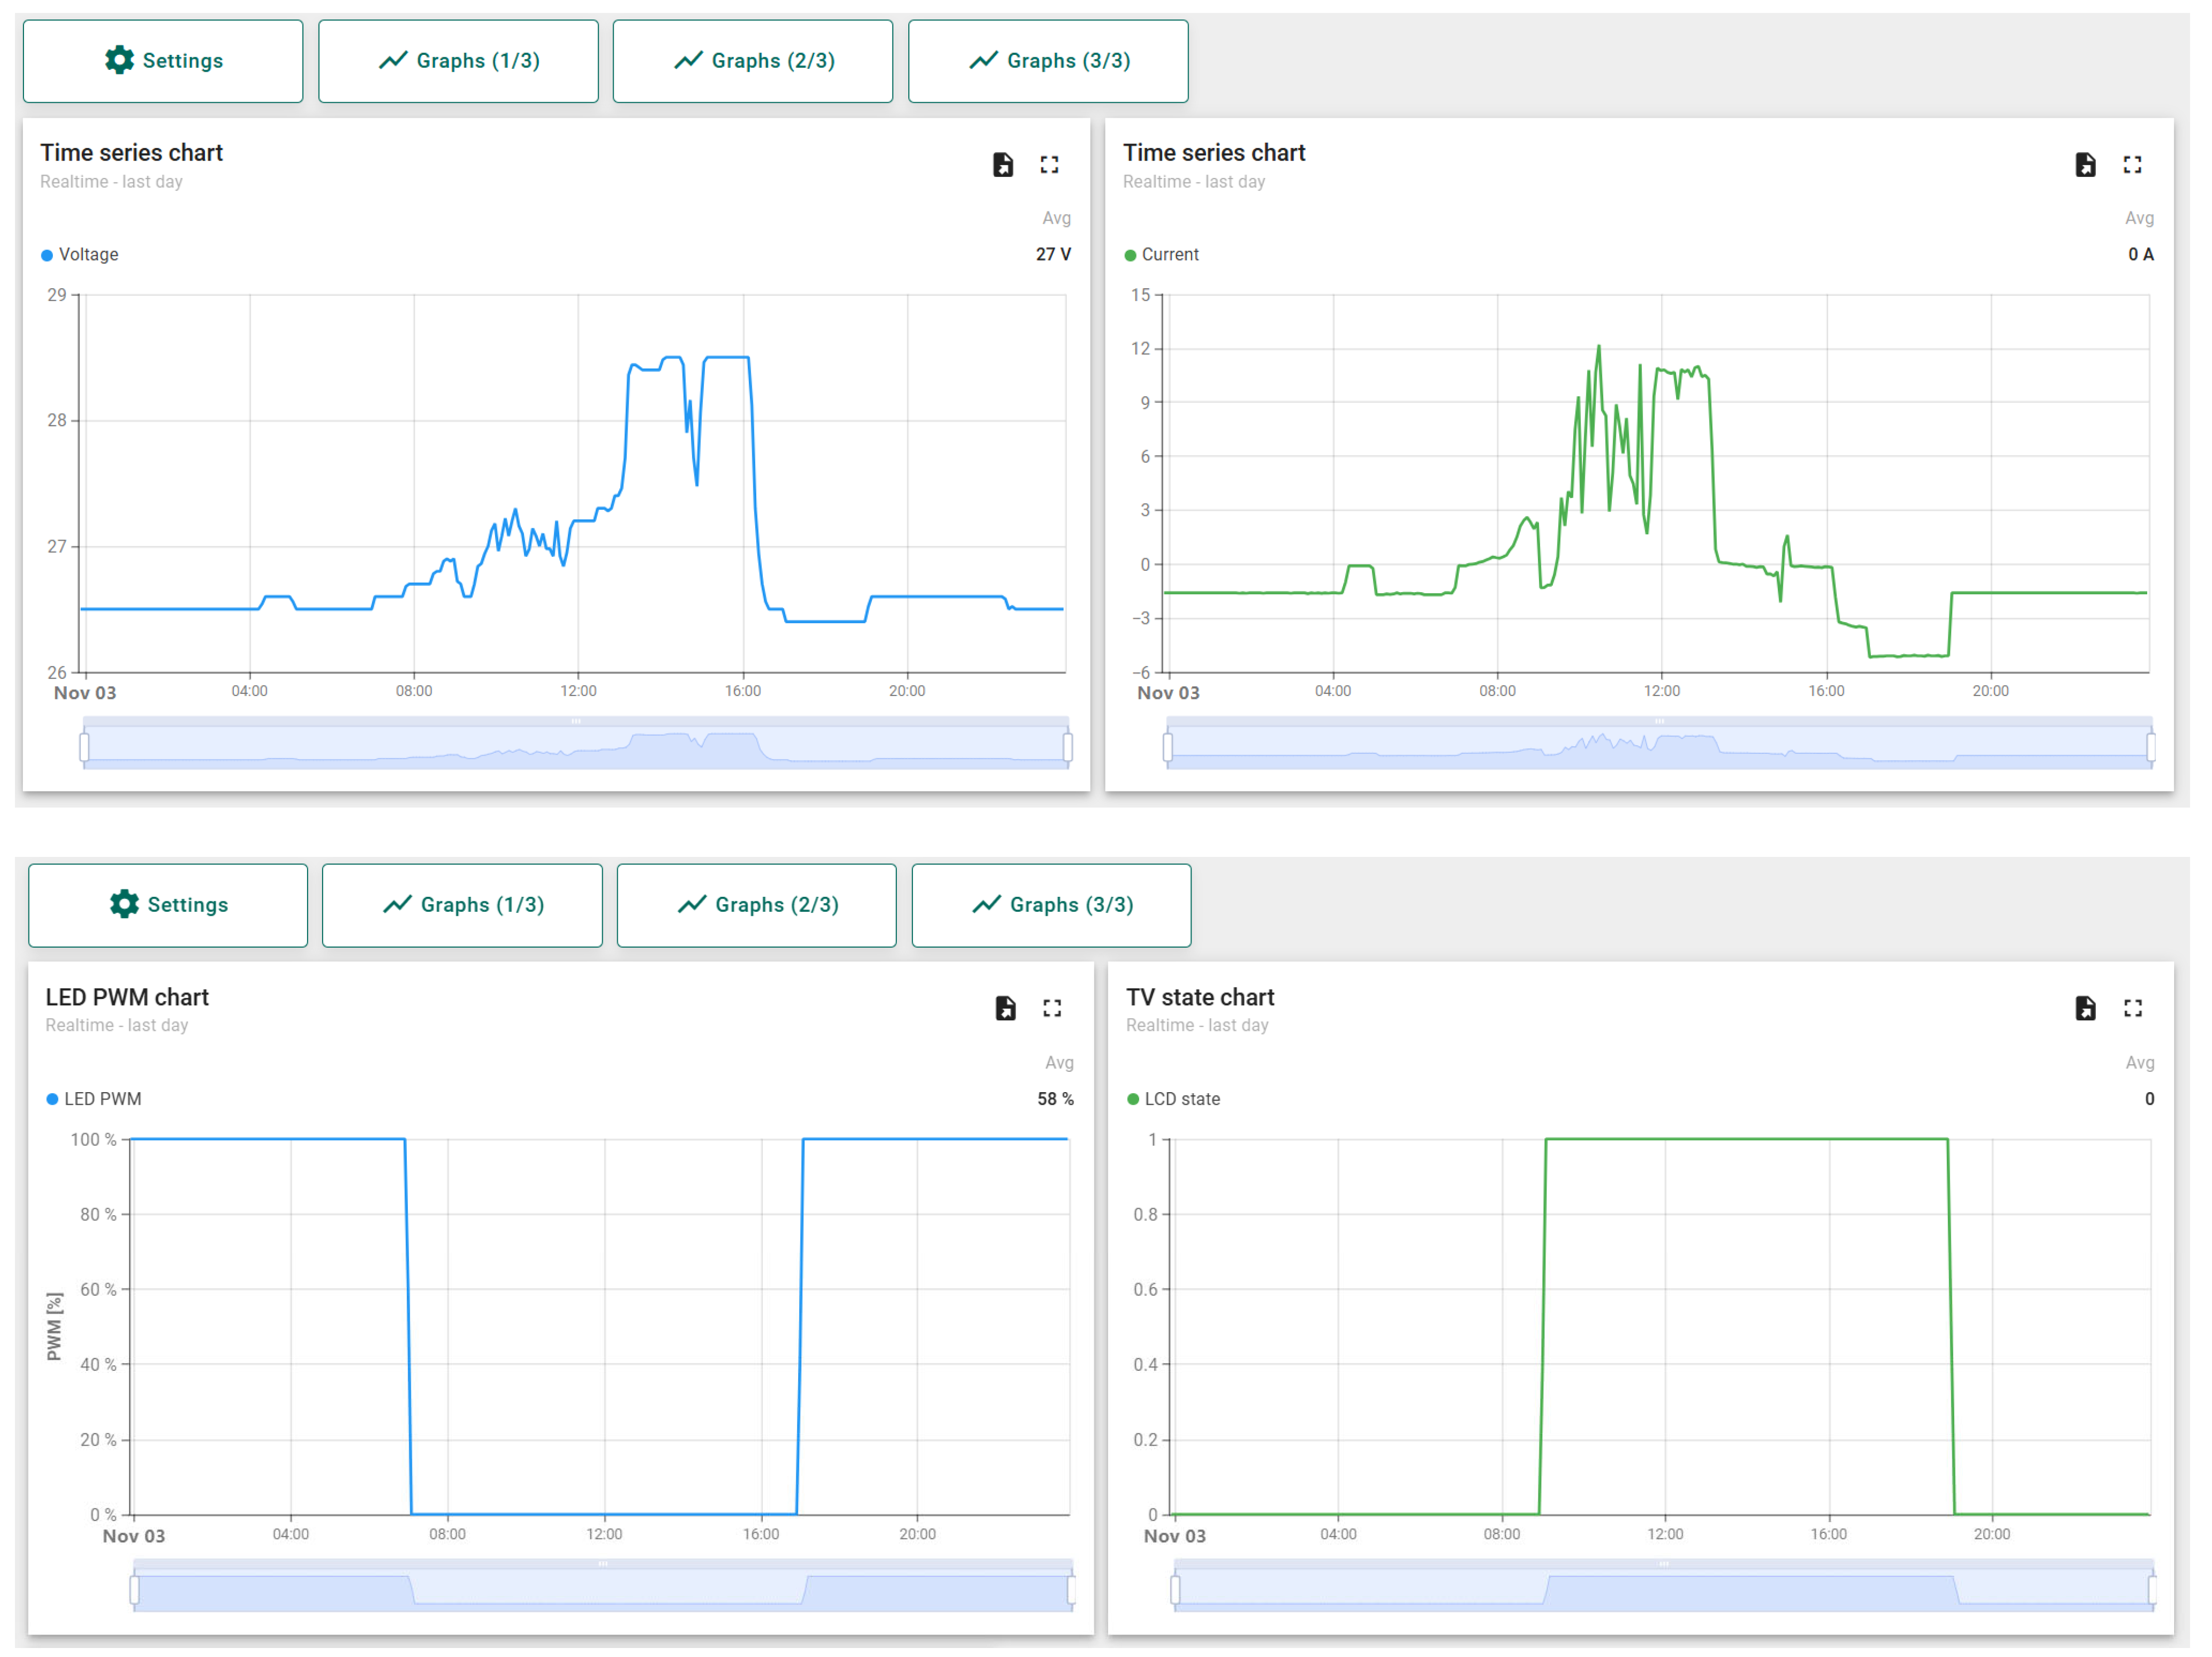
Due to certain limitations of the ThingSpeak platform, we have also implemented data transmission to the ThingsBoard web platform. ThingsBoard offers significantly more advanced data visualization options. Its graphs are interactive, allowing users to zoom in, pan, and view the values of individual data points in detail. Additionally, it provides easy access to historical data and the ability to customize displays according to user needs.
The IoT controller sends the same data to the ThingsBoard web platform as to ThingSpeak (Figure 13).

4.5. Results

The “Energy Consumption Planning” algorithm was first designed and tested in MATLAB and later implemented on the ESP32 controller. The results of its operation in some borderline cases are shown below.
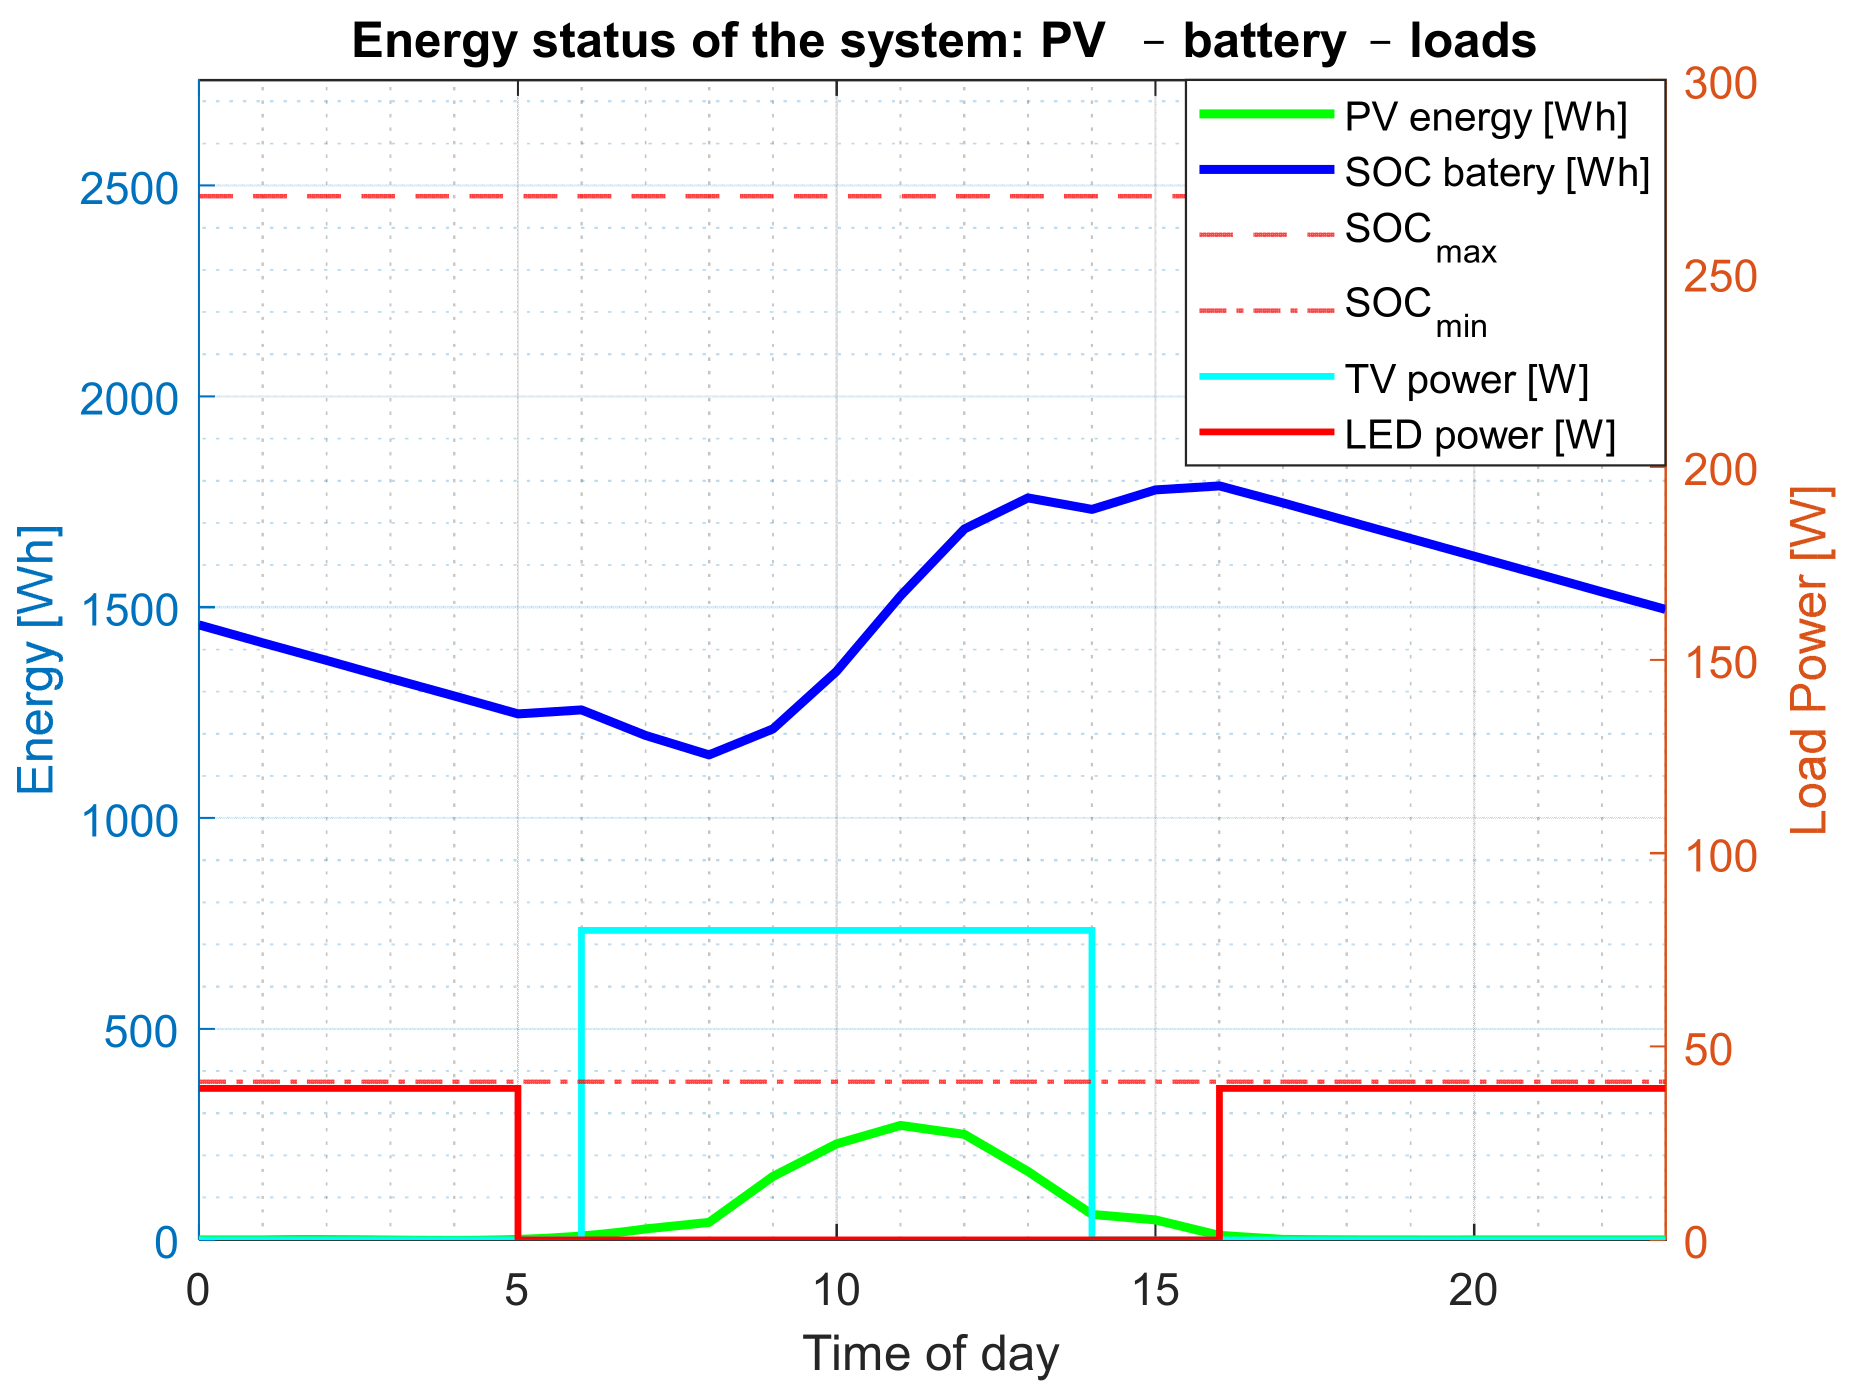
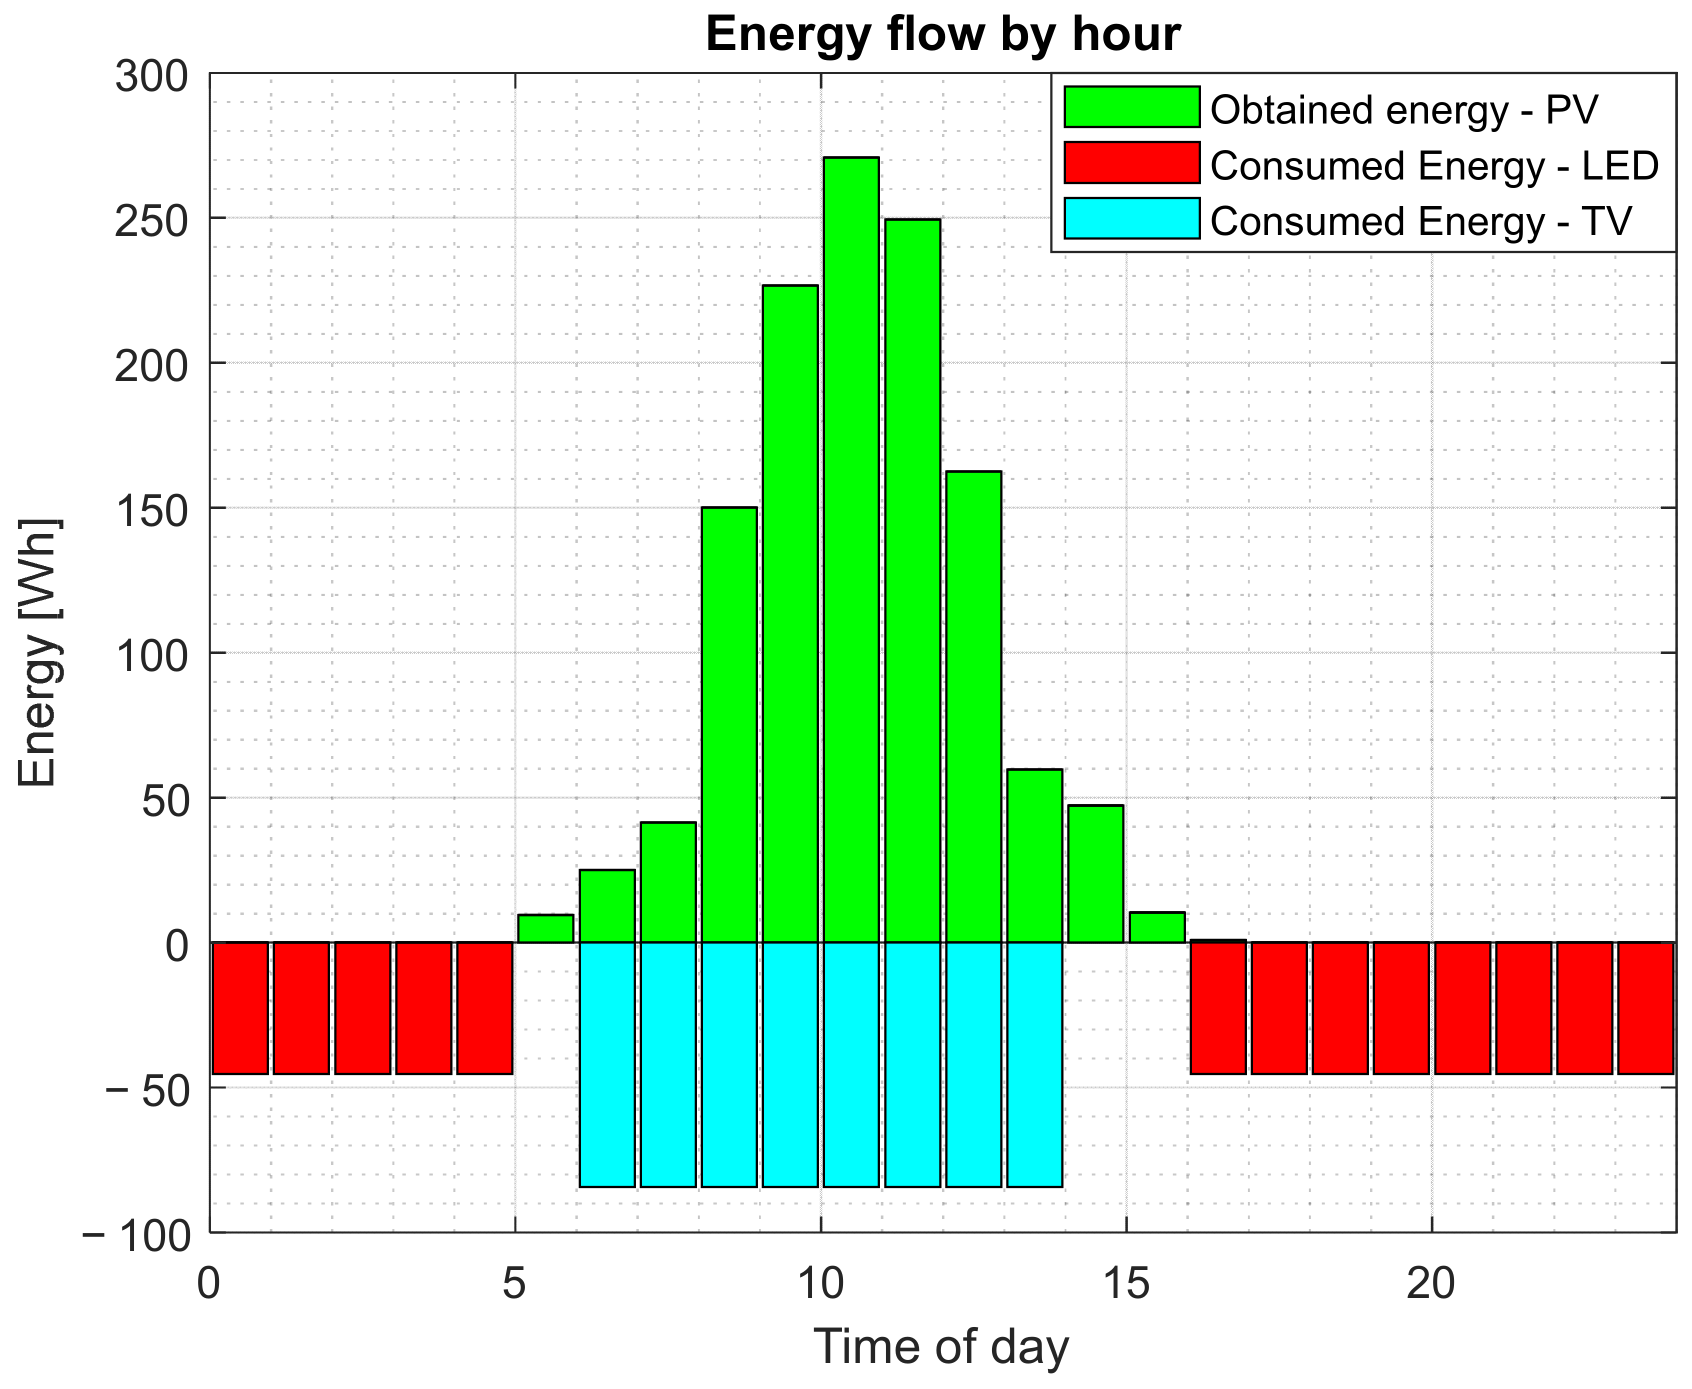
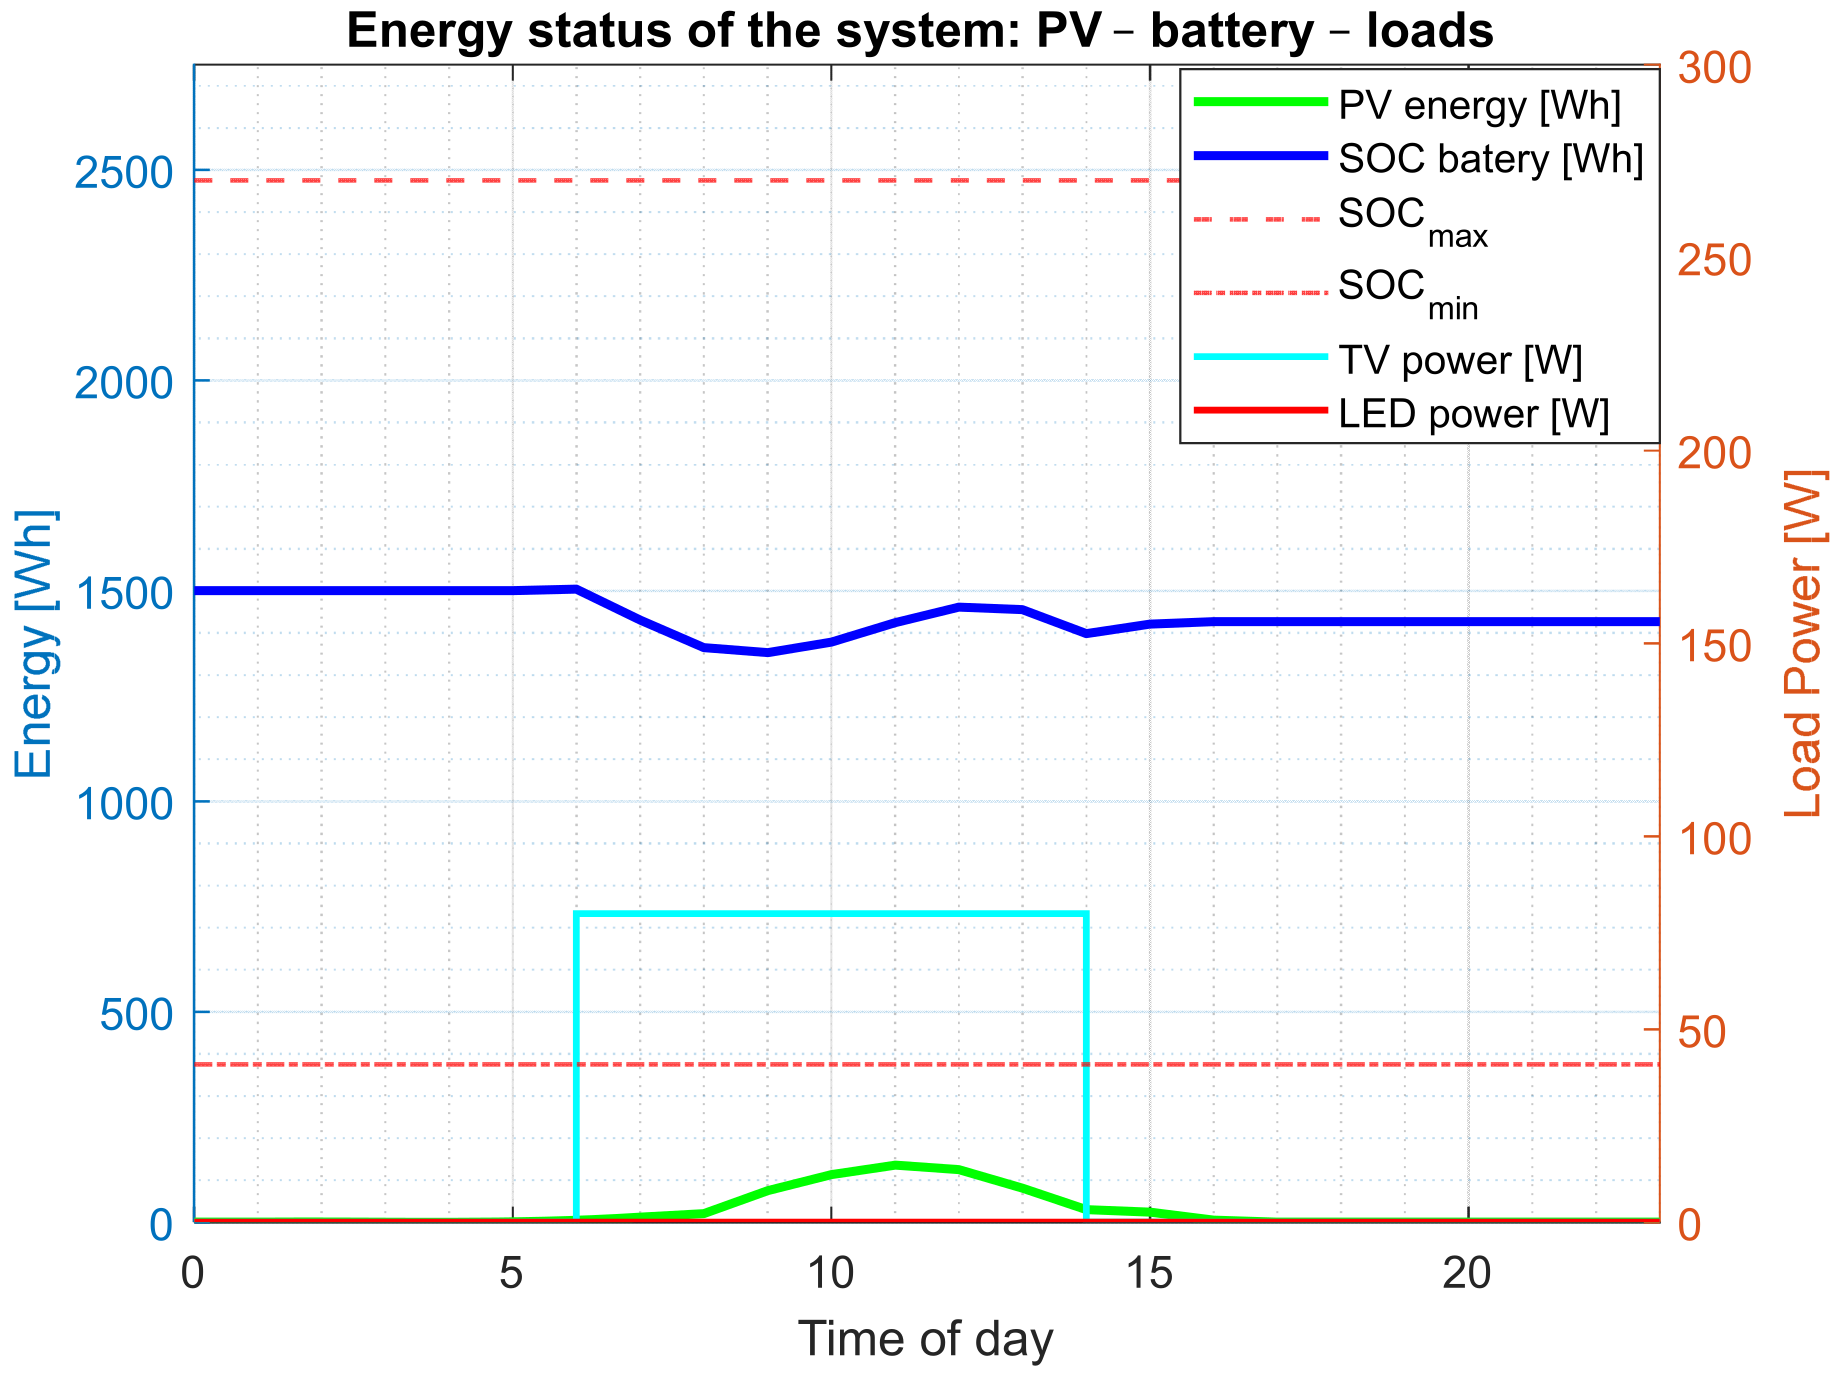
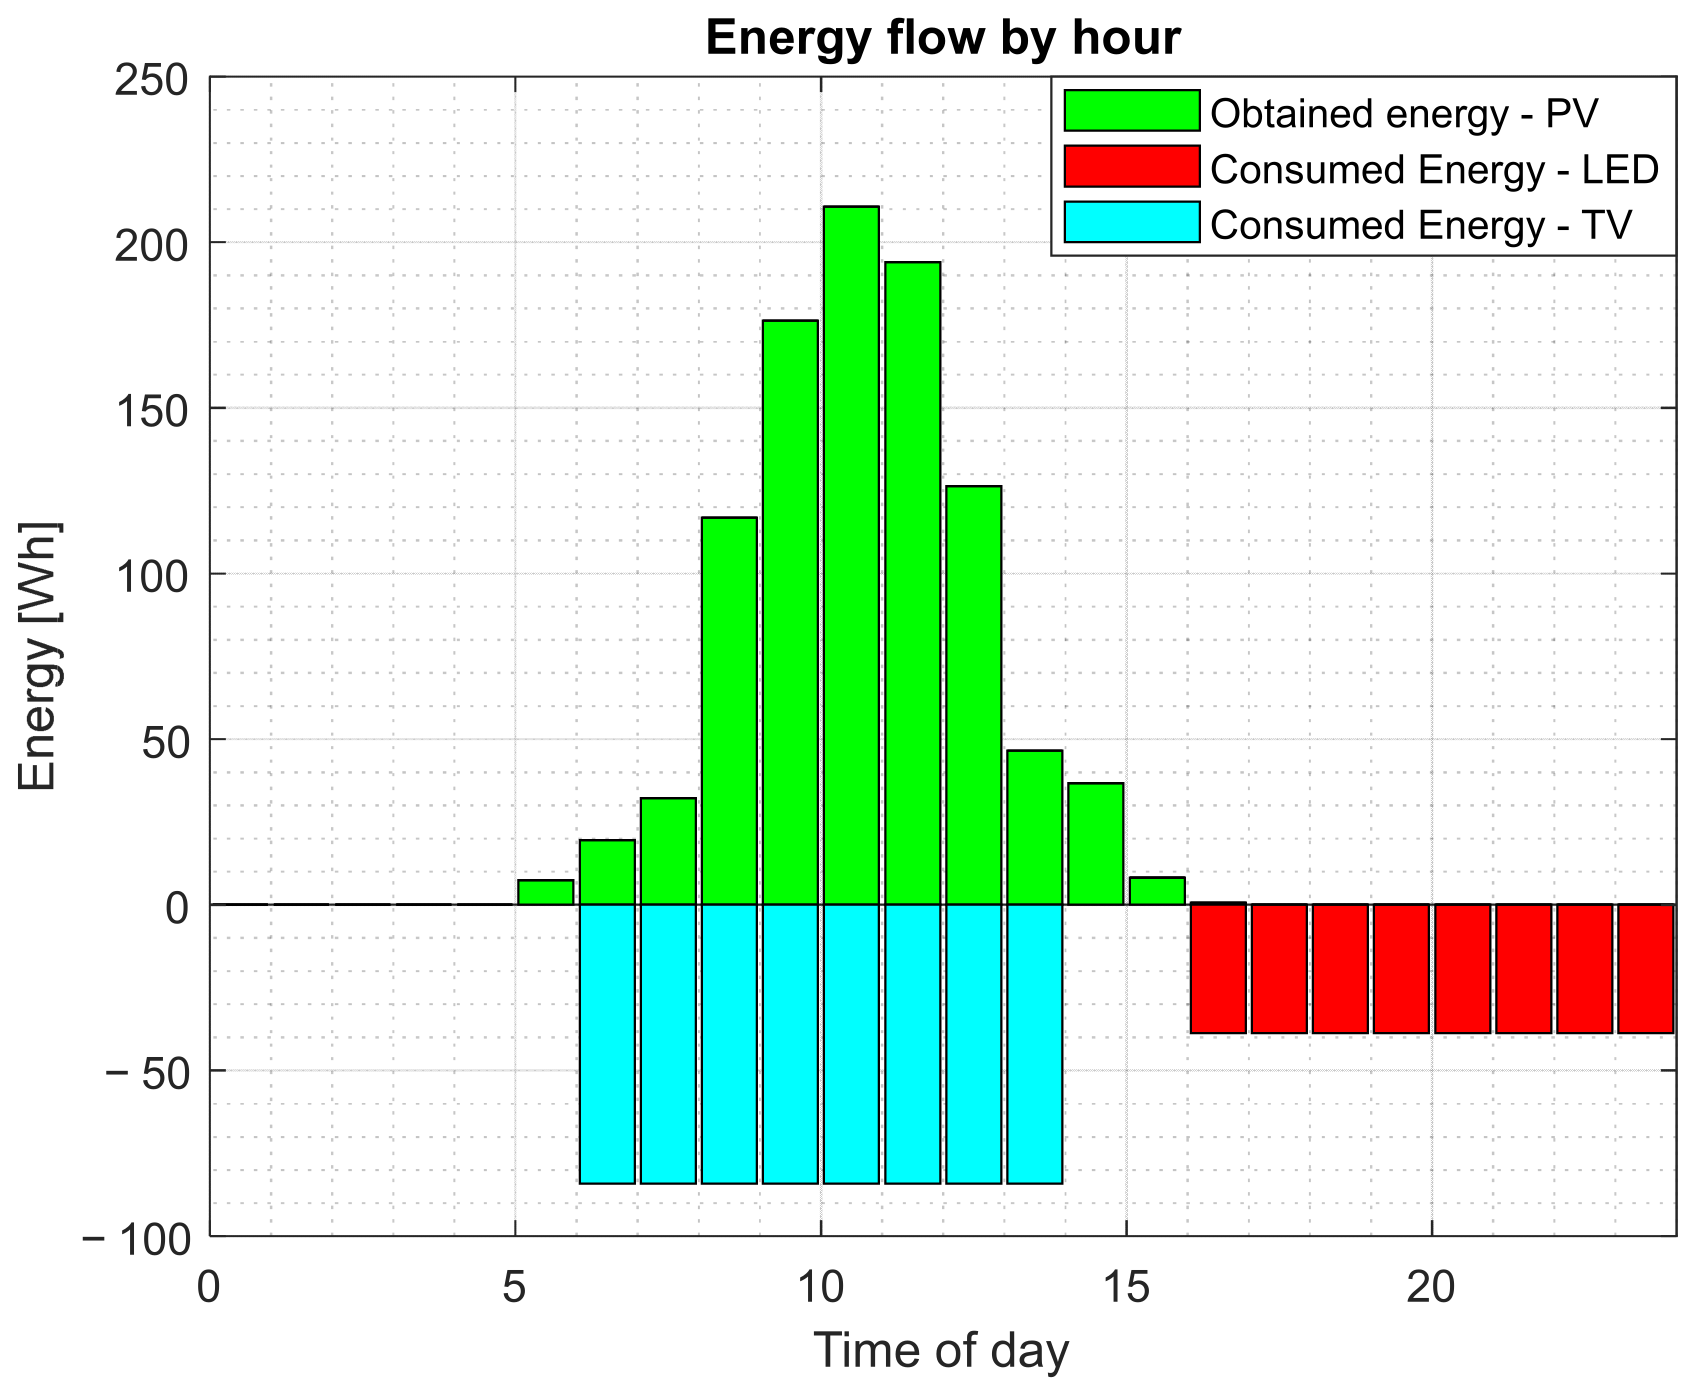
Normal operation: The initial SoC is high enough, while the predicted daily energy obtained from PV is greater than the maximum total consumption (Figure 14 and Figure 15). As a result, the TV screen is switched on throughout the entire time interval between 6:00 and 14:00, while the LED lighting operates at maximum power (PWM = 100%) in the evening and at night.
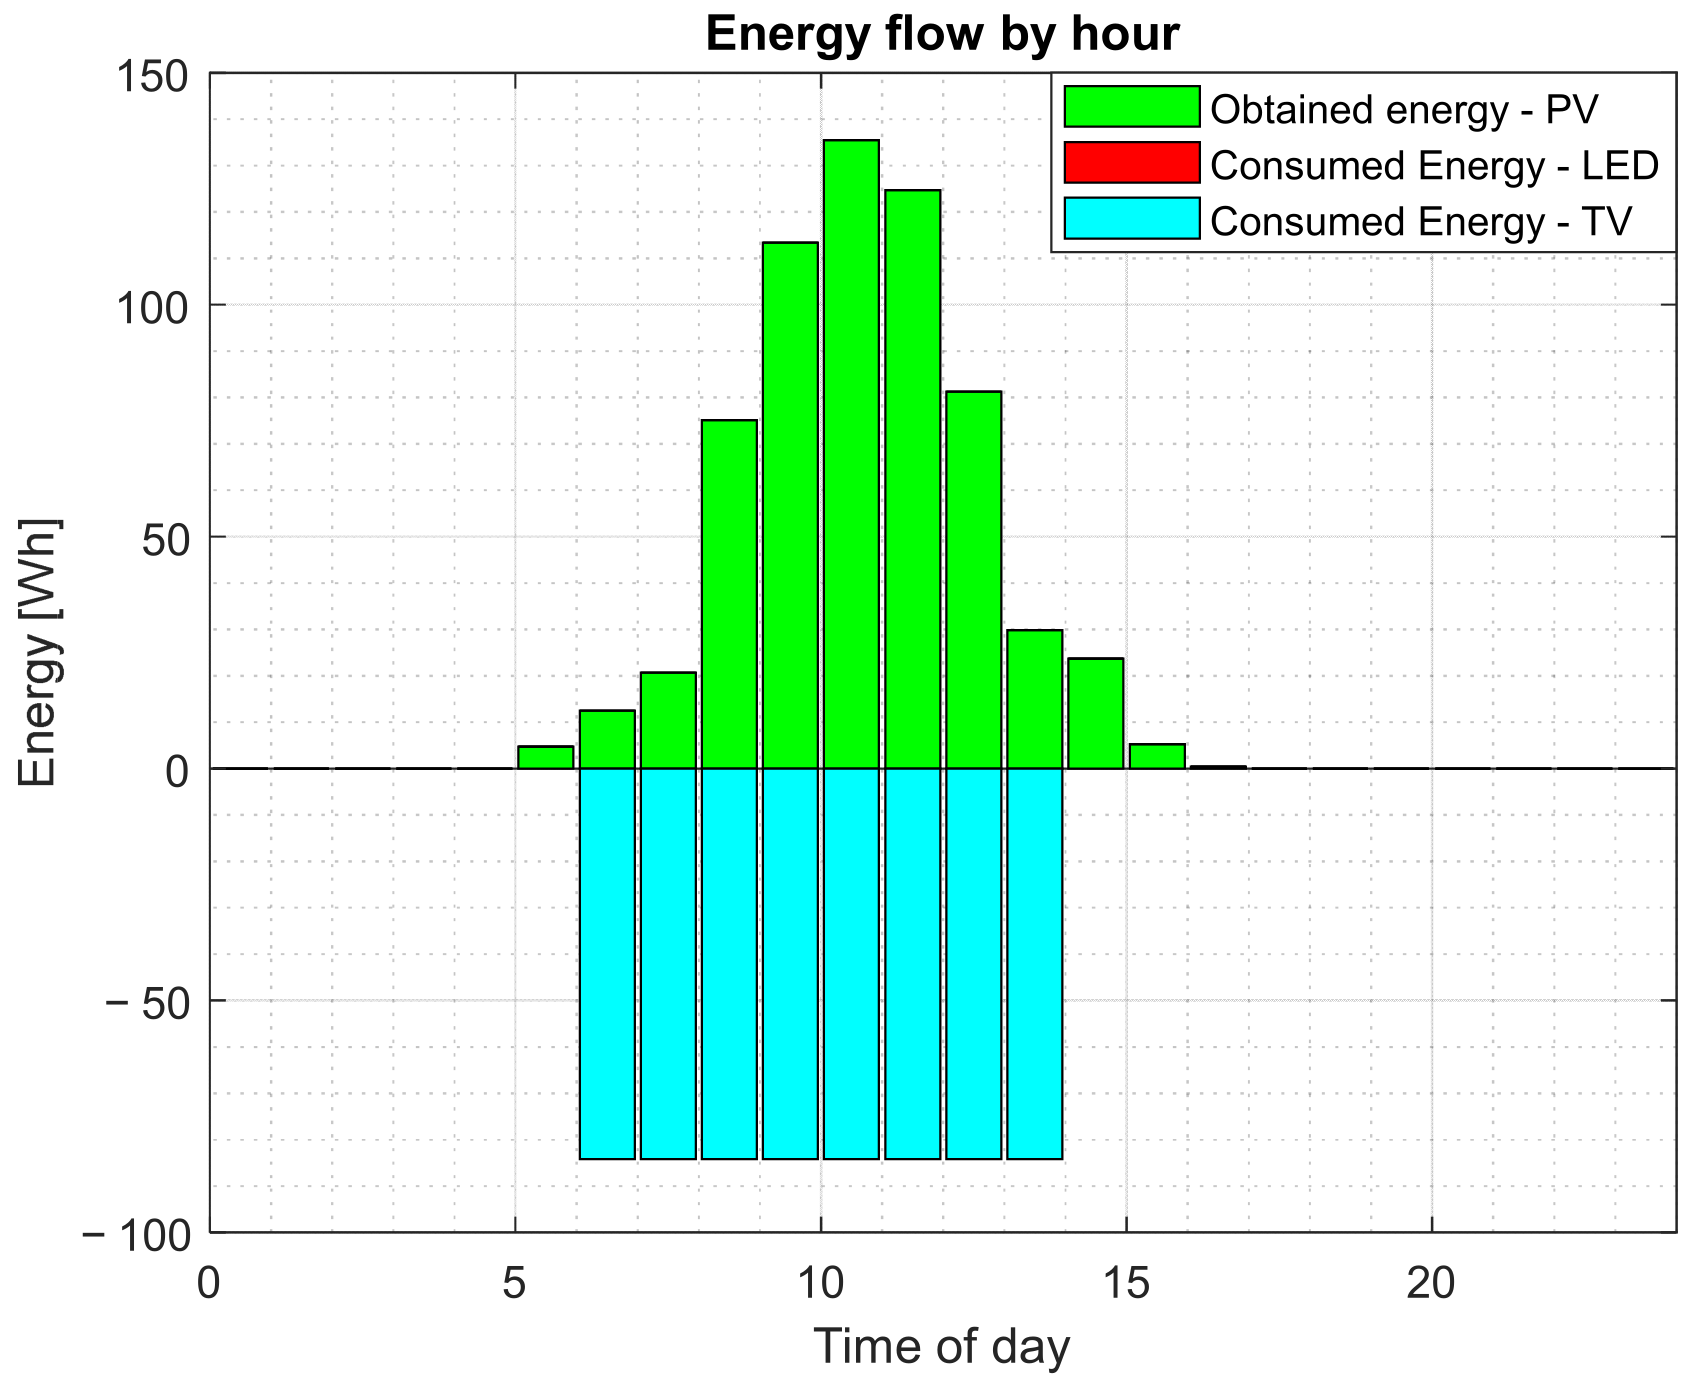
Low predicted energy: The initial SoC is high enough, but the predicted daily energy is relatively low. The algorithm therefore calculates that the TV screen could operate throughout the entire interval, while the LED lighting is switched off (Figure 16 and Figure 17). If the available energy is even lower, the algorithm further reduces the TV’s operating time.
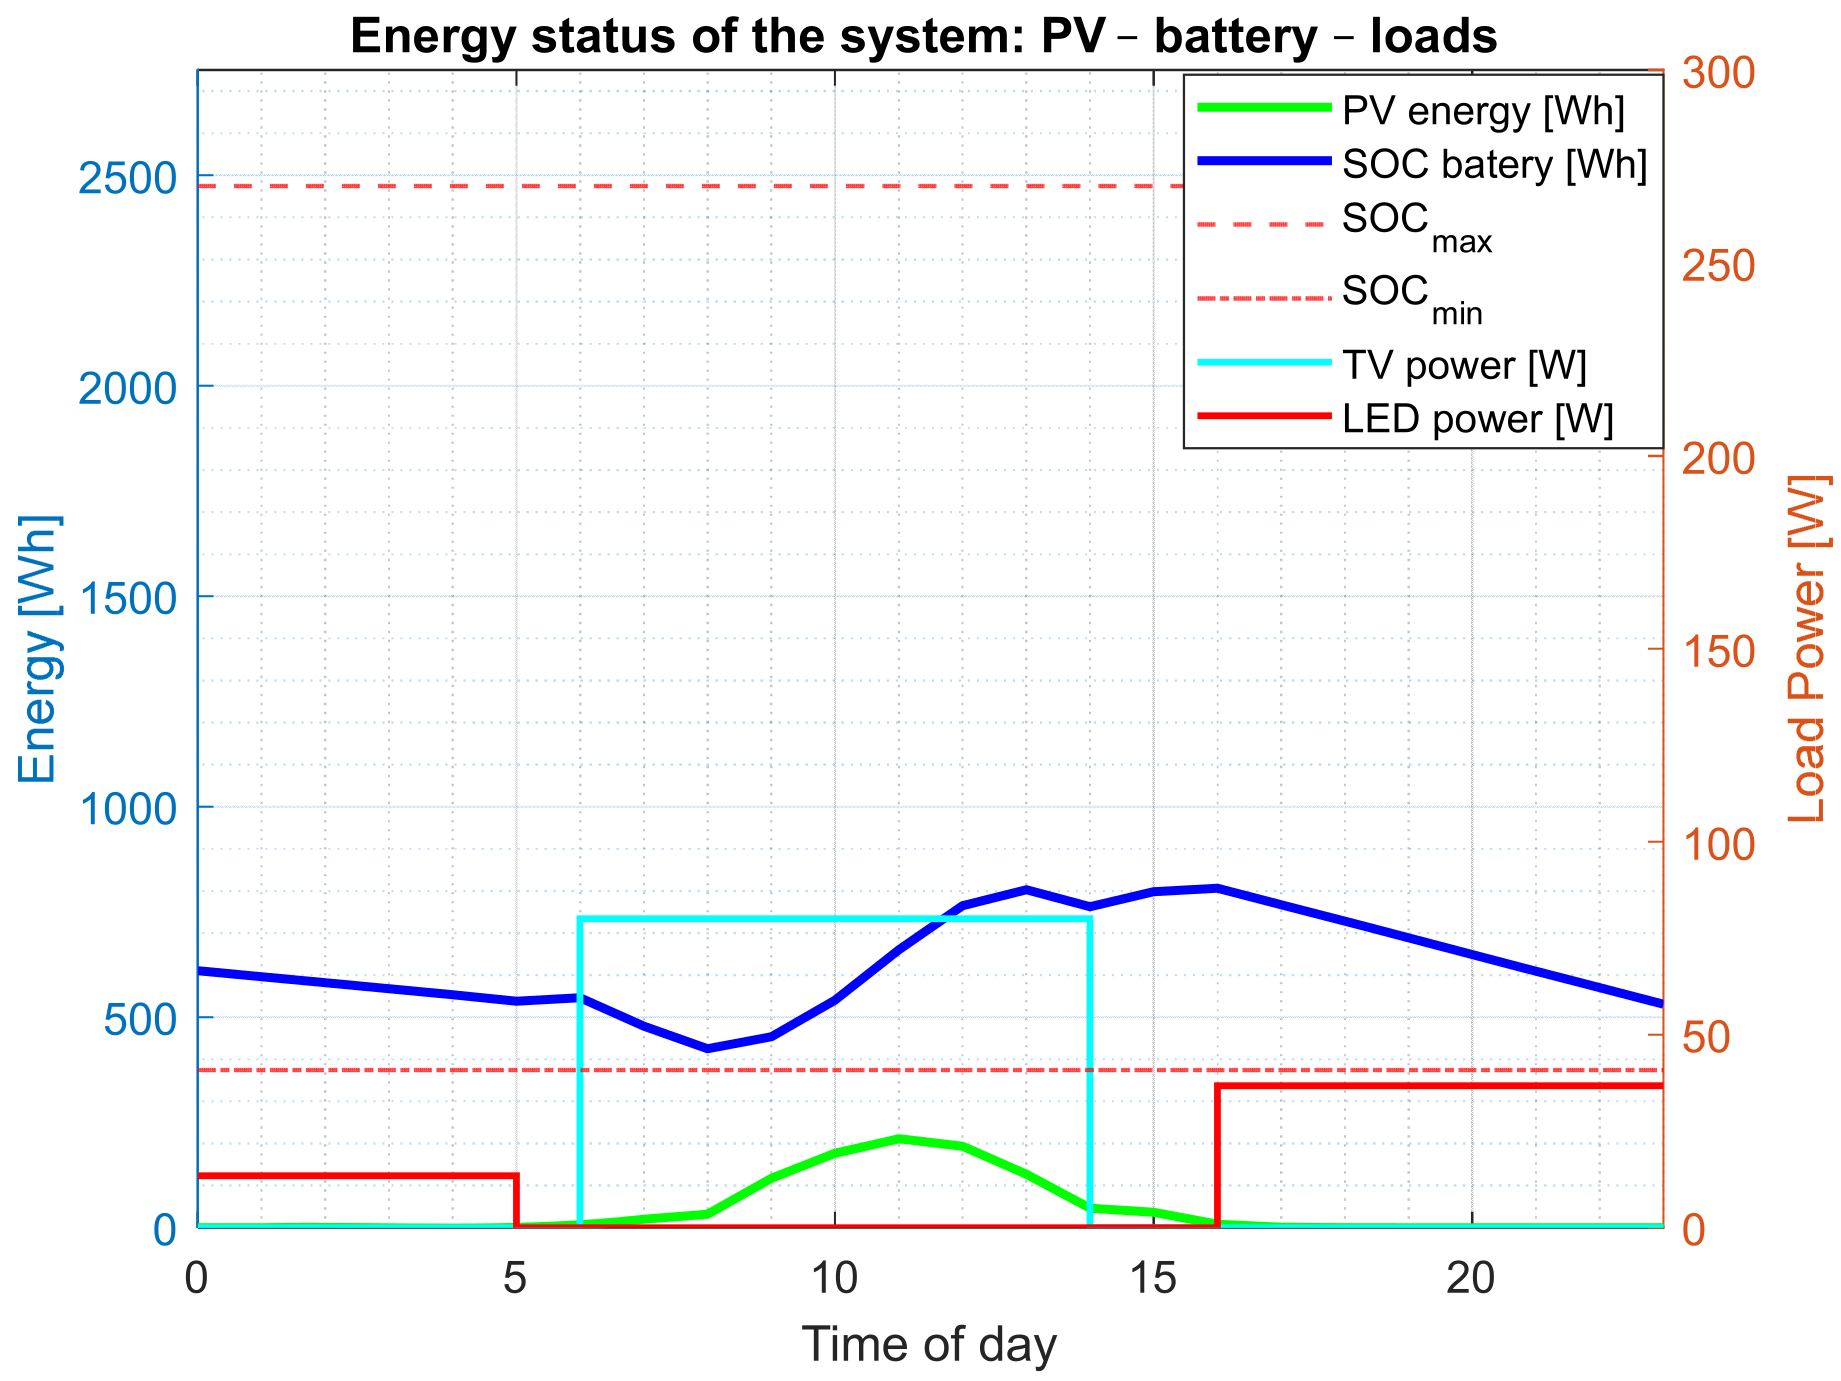
Low initial SoC: The initial SoC is low, while the estimated daily energy is sufficient. Since operating LED lighting at full power at night would cause the SoC to fall below the minimum permissible value, the LEDs operate at reduced brightness at night (Figure 18 and Figure 19). If the initial SoC is even lower, the LEDs are switched off completely at night (Figure 20 and Figure 21).

5. Conclusions

This article presents a versatile and high-performance laboratory model of a solar power supply system with integrated battery energy storage. The system is designed as a universal research platform that supports comprehensive testing and validation of solar technologies and energy management strategies. It enables research ranging from photovoltaic (PV) production and charger efficiency to advanced control of energy flows between source, storage, and load. The system is based on a powerful IoT microcontroller that enables real-time data acquisition, monitoring, and communication with various cloud platforms using a Wi-Fi or LTE connection.
The system is primarily built from commercially available components, with custom development not being the primary focus at this stage. Its modular, reconfigurable design allows easy replacement of commercial parts with custom hardware or control modules, offering strong potential for further research, particularly in advanced MPPT methods, SoC management, and control strategies at both hardware and software levels.
As part of a case study, the system was utilized to evaluate an advanced method for predictive energy consumption management, which leverages the current battery charge status and solar irradiance forecasts for the following day. The results showed that such an algorithm offers significant advantages over existing solutions that only consider current and past values of process variables. In such systems, where operational reliability and long-term performance are essential, ensuring a long battery lifetime is of particular importance. According to the manufacturer’s documentation [63], under normal operating conditions, at a temperature of 25 ± 2 °C and with charge and discharge current of 1C (105 A), the cells achieve at least 3500 cycles before their usable capacity drops to approximately 80% of the initial value (SOH). In our case, the battery is charged and discharged once a day, which means approximately 3500/365 ≈ 9–10 years of operation until the 80% capacity limit is reached. However, the lifetime will be even longer, as the charging and discharging currents in our system are significantly lower than 1C (charging 0.15C, discharging up to 0.05C at full load), which further reduces the load on the cells and slows down their aging. In addition, there will be no “deep-cycle” operation, but rather daily “cycling” of around 20% of the battery’s SoC value.
Despite its many good features, the system described also has some limitations. A key condition in planning is the proper dimensioning of all the components, especially solar panels and battery storage, to ensure that the system operates reliably under normal solar conditions. In addition, the accuracy of the algorithm is highly dependent on the reliability of the solar radiation forecasts and the stability of the power supply.
In the future, longer, possibly year-round, testing of the system is planned, which will enable a comprehensive assessment of its performance and confirmation of the advantages of the developed predictive algorithm for energy management. Further development will also focus on upgrading the algorithm, particularly by incorporating multi-day forecasts and introducing functionality for real-time adjustment of the device’s operating schedule, which the user can set via the configuration user interface.

Author Contributions

Conceptualization, M.Š., M.T. and D.H.; methodology, M.Š., M.T. and D.H.; software, D.H.; validation, M.Š. and D.H.; formal analysis, M.Š. and D.H.; writing—original draft preparation, M.Š., M.T. and D.H.; writing—review and editing, M.Š., M.T. and D.H.; visualization, M.Š. and D.H.; supervision, D.H.; project administration, D.H.; funding acquisition, M.T. All authors have read and agreed to the published version of the manuscript.

Funding

The research work was supported by the Slovenian Research and Innovation Agency (ARIS) with a program grant P2-0028.

Institutional Review Board Statement

Not applicable.

Informed Consent Statement

Not applicable.

Data Availability Statement

Data are contained within the article.

Conflicts of Interest

The authors declare no conflicts of interest.

Abbreviations

The following abbreviations are used in this manuscript:
ACAlternating Current
BLEBluetooth Low Energy
BMSBattery Management System
DCDirect Current
DC-ACDirect Current to Alternating Current
GPIOGeneral Purpose Input/Output
HTTPHypertext Transfer Protocol
HTTPSHypertext Transfer Protocol Secure
LCDLiquid-Crystal Display
LEDLight-Emitting Diode
LFP Lithium Iron Phosphate
LiFePO4Lithium Iron Phosphate
LTELong Term Evolution
LTE-MLong Term Evolution for Machines
MOSFETMetal–Oxide–Semiconductor Field-Effect Transistor
MPPTMaximum Power Point Tracking
NB-IoTNarrowband Internet of Things
NCANickel Cobalt Aluminum
NMCNickel Manganese Cobalt
NTPNetwork Time Protocol
PCBPrinted Circuit Board
PVPhotovoltaic
PWMPulse Width Modulation
SoCState-of-Charge
SoHState-of-Health
SSIDService Set Identifier
UTCCoordinated Universal Time
VDCDirect Current Voltage
VE.DirectVictron communication protocol
Wi-FiWireless Fidelity

References

  1. Nakamura, M.; Yamaguchi, K.; Kimoto, Y.; Yasaki, Y.; Kato, T.; Sugimoto, H. Cd-Free Cu(In,Ga)(Se,S)2 Thin-Film Solar Cell with Record Efficiency of 23.35%. IEEE J. Photovolt. 2019, 9, 1863–1867. [Google Scholar] [CrossRef]
  2. Taguchi, M.; Yano, A.; Tohoda, S.; Matsuyama, K.; Nakamura, Y.; Nishiwaki, T.; Fujita, K.; Maruyama, E. 24.7% Record Efficiency HIT Solar Cell on Thin Silicon Wafer. IEEE J. Photovolt. 2014, 4, 96–99. [Google Scholar] [CrossRef]
  3. Hayat, M.B.; Ali, D.; Monyake, K.C.; Alagha, L.; Ahmed, N. Solar energy—A look into power generation, challenges, and a solar-powered future. Int. J. Energy Res. 2019, 43, 1049–1067. [Google Scholar] [CrossRef]
  4. Kannan, N.; Vakeesan, D. Solar energy for future world: A review. Renew. Sustain. Energy Rev. 2016, 62, 1092–1105. [Google Scholar] [CrossRef]
  5. Ibrahim, H.; Ilinca, A.; Perron, J. Energy storage systems—Characteristics and comparisons. Renew. Sustain. Energy Rev. 2008, 12, 1221–1250. [Google Scholar] [CrossRef]
  6. Ferreira, H.L.; Garde, R.; Fulli, G.; Kling, W.; Lopes, J.P. Characterisation of electrical energy storage technologies. Energy 2013, 53, 288–298. [Google Scholar] [CrossRef]
  7. Wang, D.; Liu, N.; Chen, F.; Wang, Y.; Mao, J. Progress and prospects of energy storage technology research: Based on multidimensional comparison. J. Energy Storage 2024, 75, 109710. [Google Scholar] [CrossRef]
  8. Shan, R.; Reagan, J.; Castellanos, S.; Kurtz, S.; Kittner, N. Evaluating emerging long-duration energy storage technologies. Renew. Sustain. Energy Rev. 2022, 159, 112240. [Google Scholar] [CrossRef]
  9. Serchenko, M.; Bekh, Y.; Serdiuk, T. Dynamic Simulation of a Hybrid Solar Power System Under Fluctuating Irradiance Conditions. In Proceedings of the 2025 IEEE International Conference on Environment and Electrical Engineering and 2025 IEEE Industrial and Commercial Power Systems Europe (EEEIC/I&CPS Europe), Crete, Greece, 15–18 July 2025; pp. 1–5. [Google Scholar]
  10. Dyvak, M.; Petryshyn, N.; Kindzerskyi, O.; Papa, O.; Franko, Y.; Opalko, O. Modeling of the Efficiency of Electricity Generation Processes by a Solar Power Plant Research Using the Example of a 570 W Model. In Proceedings of the 2025 15th International Conference on Advanced Computer Information Technologies (ACIT), Šibenik, Croatia, 17–19 September 2025; pp. 92–97. [Google Scholar]
  11. George, A.; Anto, R. Analytical and experimental analysis of optimal tilt angle of solar photovoltaic systems. In Proceedings of the 2012 International Conference on Green Technologies (ICGT), Kerala, India, 18–20 December 2012; pp. 234–239. [Google Scholar]
  12. Mansour, R.B.; Khan, M.A.M.; Alsulaiman, F.A.; Mansour, R.B. Optimizing the Solar PV Tilt Angle to Maximize the Power Output: A Case Study for Saudi Arabia. IEEE Access 2021, 9, 15914–15928. [Google Scholar] [CrossRef]
  13. Khan, A.H.; Islam, M.; Islam, A.; Rahman, M.S. A systematic approach to find the optimum tilt angle for meeting the maximum energy demand of an isolated area. In Proceedings of the 2015 International Conference on Electrical Engineering and Information Communication Technology (ICEEICT), Dhaka, Bangladesh, 21–23 May 2015; pp. 1–6. [Google Scholar]
  14. Abdel-Salam, M.; EL-Mohandes, M.-T.; Goda, M. History of maximum power point tracking. In Modern Maximum Power Point Tracking Techniques for Photovoltaic Energy Systems; Springer: Berlin, Germany, 2019; pp. 1–29. [Google Scholar]
  15. Femia, N.; Petrone, G.; Spagnuolo, G.; Vitelli, M. Optimization of perturb and observe maximum power point tracking method. IEEE Trans. Power Electron. 2005, 20, 963–973. [Google Scholar] [CrossRef]
  16. Gules, R.; Pacheco, J.D.P.; Hey, H.L.; Imhoff, J. A maximum power point tracking system with parallel connection for PV stand-alone applications. IEEE Trans. Ind. Electron. 2008, 55, 2674–2683. [Google Scholar] [CrossRef]
  17. Mariadass, S.P.; Al-Humairi, S.N.S.; Daud, R.J. Design a Portable Solar Mobile System with an IoT Integration-based. In Proceedings of the 2021 IEEE 12th Control and System Graduate Research Colloquium (ICSGRC), Shah Alam, Malaysia, 7–8 August 2021; pp. 40–45. [Google Scholar]
  18. Zheng, K.; Zhao, S.; Yang, Z.; Xiong, X.; Xiang, W. Design and Implementation of LPWA-Based Air Quality Monitoring System. IEEE Access 2016, 4, 3238–3245. [Google Scholar] [CrossRef]
  19. Folea, S.C.; Mois, G.D. Lessons Learned From the Development of Wireless Environmental Sensors. IEEE Trans. Instrum. Meas. 2020, 69, 3470–3480. [Google Scholar] [CrossRef]
  20. Oton, C.N.; Iqbal, M.T. Low-Cost Open Source IoT-Based SCADA System for a BTS Site Using ESP32 and Arduino IoT Cloud. In Proceedings of the 2021 IEEE 12th Annual Ubiquitous Computing, Electronics & Mobile Communication Conference (UEMCON), New York, NY, USA, 1–4 December 2021; pp. 0681–0685. [Google Scholar]
  21. Fuentes, G.C.; Milov, J.M.; Do, T.V.; Garcia, J.S.; Shojaee, M.; Blinder, A.; Azizi, M. Board 110: Portable Solar-Powered Wireless Display Board. In Proceedings of the 2024 ASEE Annual Conference & Exposition, Portland, OR, USA, 23–26 June 2024. [Google Scholar]
  22. Zhu, Q.Y.; Wen, C.L.; Xie, W.Y.; Ye, J.J.; Yin, H. Solar Powered Automatic Controlled Advertising Light Box System. Appl. Mech. Mater. 2012, 148, 101–105. [Google Scholar] [CrossRef]
  23. Reinders, A.H.; de Boer, A.; de Winter, A.; Haverlag, M. Designing PV powered LED products-Integration of PV technology in innovative products. In Proceedings of the 24th European Photovoltaic Solar Energy Conference and Exhibition, EU PVSEC, Hamburg, Germany, 21–25 September 2009; pp. 3179–3183. [Google Scholar]
  24. LÓpez-Vargas, A.; Fuentes, M.; Vivar, M. On the application of IoT for real-time monitoring of small stand-alone PV systems: Results from a new smart datalogger. In Proceedings of the 2018 IEEE 7th World Conference on Photovoltaic Energy Conversion (WCPEC) (A Joint Conference of 45th IEEE PVSC, 28th PVSEC & 34th EU PVSEC), Waikoloa, HI, USA, 10–15 June 2018; pp. 605–607. [Google Scholar]
  25. Allafi, I.; Iqbal, T. Design and implementation of a low cost web server using ESP32 for real-time photovoltaic system monitoring. In Proceedings of the 2017 IEEE Electrical Power and Energy Conference (EPEC), Saskatoon, SK, Canada, 22–25 October 2017; pp. 1–5. [Google Scholar]
  26. Wibowo, L.; Wahyusari, R.; Yuwono, T.; Shofia, A. IoT-based high-accuracy monitoring system for on-grid photovoltaic power system using NodeMCU ESP8266 and PZEM004T. J. Mechatron. Electr. Power Veh. Technol. 2024, 15, 230–241. [Google Scholar] [CrossRef]
  27. Sutikno, T.; Purnama, H.S.; Pamungkas, A.; Fadlil, A.; Alsofyani, I.M.; Jopri, M.H. Internet of things-based photovoltaics parameter monitoring system using NodeMCU ESP8266. Int. J. Electr. Comput. Eng. 2021, 11, 5578–5587. [Google Scholar] [CrossRef]
  28. He, W.; Baig, M.J.A.; Iqbal, M.T. An Open-Source Supervisory Control and Data Acquisition Architecture for Photovoltaic System Monitoring Using ESP32, Banana Pi M4, and Node-RED. Energies 2024, 17, 2295. [Google Scholar] [CrossRef]
  29. 1679.1-2017; IEEE Guide for the Characterization and Evaluation of Lithium-Based Batteries in Stationary Applications. IEEE: Washington, DC, USA, 2018. [CrossRef]
  30. Zheng, S.; Wang, L.; Feng, X.; He, X. Probing the heat sources during thermal runaway process by thermal analysis of different battery chemistries. J. Power Sources 2018, 378, 527–536. [Google Scholar] [CrossRef]
  31. Brand, M.; Gläser, S.; Geder, J.; Menacher, S.; Obpacher, S.; Jossen, A.; Quinger, D. Electrical safety of commercial Li-ion cells based on NMC and NCA technology compared to LFP technology. In Proceedings of the 2013 World Electric Vehicle Symposium and Exhibition (EVS27), Barcelona, Spain, 17–20 November 2013; pp. 1–9. [Google Scholar]
  32. Elmahallawy, M.; Elfouly, T.; Alouani, A.; Massoud, A.M. A Comprehensive Review of Lithium-Ion Batteries Modeling, and State of Health and Remaining Useful Lifetime Prediction. IEEE Access 2022, 10, 119040–119070. [Google Scholar] [CrossRef]
  33. Wei, J.; Dong, G.; Chen, Z. Remaining Useful Life Prediction and State of Health Diagnosis for Lithium-Ion Batteries Using Particle Filter and Support Vector Regression. IEEE Trans. Ind. Electron. 2018, 65, 5634–5643. [Google Scholar] [CrossRef]
  34. Li, R.; Bao, L.; Chen, L.; Zha, C.; Dong, J.; Qi, N.; Tang, R.; Lu, Y.; Wang, M.; Huang, R.; et al. Accelerated aging of lithium-ion batteries: Bridging battery aging analysis and operational lifetime prediction. Sci. Bull. 2023, 68, 3055–3079. [Google Scholar] [CrossRef]
  35. Quan, J.; Zhao, S.; Song, D.; Wang, T.; He, W.; Li, G. Comparative life cycle assessment of LFP and NCM batteries including the secondary use and different recycling technologies. Sci. Total Environ. 2022, 819, 153105. [Google Scholar] [CrossRef]
  36. EVE Energy Co. EVE Lithium LF105 Prismatic Lithium Iron Phosphate Battery 3.2V 105Ah Utility ESS Power Battery UPS Engineering Machinery Marine Power Battery. Available online: https://www.evemall.eu/power-battery/prismatic-lfp-cell/lf105 (accessed on 10 October 2025).
  37. Polóni, T.; Figueroa-Santos, M.A.; Siegel, J.B.; Stefanopoulou, A.G. Integration of Non-monotonic Cell Swelling Characteristic for State-of-Charge Estimation. In Proceedings of the 2018 Annual American Control Conference (ACC), Milwaukee, WI, USA, 27–29 June 2018; pp. 2306–2311. [Google Scholar]
  38. Tang, X.; Zou, C.; Wik, T.; Yao, K.; Xia, Y.; Wang, Y.; Yang, D.; Gao, F. Run-to-Run Control for Active Balancing of Lithium Iron Phosphate Battery Packs. IEEE Trans. Power Electron. 2020, 35, 1499–1512. [Google Scholar] [CrossRef]
  39. Wang, S.; Yang, S.; Yang, W.; Wang, Y. A New Kind of Balancing Circuit with Multiple Equalization Modes for Serially Connected Battery Pack. IEEE Trans. Ind. Electron. 2021, 68, 2142–2150. [Google Scholar] [CrossRef]
  40. Einhorn, M.; Roessler, W.; Fleig, J. Improved Performance of Serially Connected Li-Ion Batteries with Active Cell Balancing in Electric Vehicles. IEEE Trans. Veh. Technol. 2011, 60, 2448–2457. [Google Scholar] [CrossRef]
  41. Marcin, D.; Lacko, M.; Bodnár, D.; Pancurák, L.; Stach, L. Overview of Active Balancing Methods and Simulation of Capacitor Based Active Cell Balancing for Battery Pack in EV. In Proceedings of the 2023 International Conference on Electrical Drives and Power Electronics (EDPE), High Tatras, Slovakia, 25–27 September 2023; pp. 1–8. [Google Scholar]
  42. EnerKey BMS Technology Co. 4s 8s 16s BMS Active Cell Balancer 5A Lithium Lead Acid Battery Balancer Equalizer for Electrical Tools. Available online: https://www.enerkeybms.com/sale-43691918-4s-8s-16s-bms-active-cell-balancer-5a-lithium-lead-acid-battery-balancer-equalizer-for-electrical-to.html (accessed on 15 October 2025).
  43. TrinaSolar Co. Ltd. Vertex S+ 470W TSM—NEG9R.28. Available online: https://www.trinasolar.com/eu-en/product/VertexS-NEG9R.28 (accessed on 10 October 2025).
  44. Victron Energy B.V. BlueSolar Charge Controllers MPPT 75/10, 75/15, 100/15, 100/20-48V. Available online: https://www.victronenergy.com/upload/documents/Datasheet-Blue-Solar-Charge-Controller-MPPT-75-10,-75-15,-100-15,-100-20_48V-EN-.pdf (accessed on 13 October 2025).
  45. Victron Energy B.V. SmartShunt. Available online: https://www.victronenergy.com/battery-monitors/smart-battery-shunt (accessed on 15 October 2025).
  46. MEAN WELL Enterprises Co. 450W High Reliable True Sine Wave DC-AC Power Inverter. Available online: https://www.meanwell.com/webapp/product/search.aspx?prod=NTS-450 (accessed on 15 October 2025).
  47. Hercog, D.; Lerher, T.; Truntič, M.; Težak, O. Design and implementation of ESP32-based IoT devices. Sensors 2023, 23, 6739. [Google Scholar] [CrossRef]
  48. El-Khozondar, H.J.; Mtair, S.Y.; Qoffa, K.O.; Qasem, O.I.; Munyarawi, A.H.; Nassar, Y.F.; Bayoumi, E.H.; Abd El, A.A.E.B. A smart energy monitoring system using ESP32 microcontroller. e-Prime-Adv. Electr. Eng. Electron. Energy 2024, 9, 100666. [Google Scholar] [CrossRef]
  49. Khalid, W.; Jamil, M.; Khan, A.A.; Awais, Q. Open-source internet of things-based supervisory control and data acquisition system for photovoltaic monitoring and control using HTTP and TCP/IP protocols. Energies 2024, 17, 4083. [Google Scholar] [CrossRef]
  50. Rahmadani, A.A.; Syaifudin, Y.W.; Setiawan, B.; Panduman, Y.Y.F.; Funabiki, N. Enhancing campus environment: Real-time air quality monitoring through iot and web technologies. J. Sens. Actuator Netw. 2024, 14, 2. [Google Scholar] [CrossRef]
  51. Kairuz-Cabrera, D.; Hernandez-Rodriguez, V.; Schalm, O.; Martinez, A.; Laso, P.M.; Alejo-Sánchez, D. Development of a unified IoT platform for assessing Meteorological and Air Quality Data in a Tropical Environment. Sensors 2024, 24, 2729. [Google Scholar] [CrossRef]
  52. Aghenta, L.O.; Iqbal, M.T. Low-Cost, Open Source IoT-Based SCADA System Design Using Thinger.IO and ESP32 Thing. Electronics 2019, 8, 822. [Google Scholar] [CrossRef]
  53. Marques, G.; Pitarma, R. An Indoor Monitoring System for Ambient Assisted Living Based on Internet of Things Architecture. Int. J. Environ. Res. Public Health 2016, 13, 1152. [Google Scholar] [CrossRef]
  54. Stolojescu-Crisan, C.; Crisan, C.; Butunoi, B.-P. An IoT-Based Smart Home Automation System. Sensors 2021, 21, 3784. [Google Scholar] [CrossRef] [PubMed]
  55. Taştan, M.; Gökozan, H. Real-Time Monitoring of Indoor Air Quality with Internet of Things-Based E-Nose. Appl. Sci. 2019, 9, 3435. [Google Scholar] [CrossRef]
  56. Marques, G.; Pitarma, R. A Cost-Effective Air Quality Supervision Solution for Enhanced Living Environments through the Internet of Things. Electronics 2019, 8, 170. [Google Scholar] [CrossRef]
  57. DPTechnics. Walter, Open Source Cellular, GPS, and WiFi/BLE Module. Available online: https://www.dptechnics.com/en/products/walter.html (accessed on 14 October 2025).
  58. Espressif Systems. ESP32-S3. Available online: https://www.espressif.com/en/products/socs/esp32-s3 (accessed on 14 October 2025).
  59. QuickSpot. Walter Modem Library for Arduino. Available online: https://github.com/QuickSpot/walter-arduino (accessed on 14 October 2025).
  60. Chris Terwilliger. Ve Direct Frame Handler. Available online: https://github.com/cterwilliger/VeDirectFrameHandler (accessed on 14 October 2025).
  61. Victron Energy B.V. VE.Direct Protocol. Available online: https://www.victronenergy.com/upload/documents/VE.Direct-Protocol-3.34.pdf (accessed on 14 October 2025).
  62. Brundrett, G.W. Human sensitivity to flicker. Light. Res. Technol. 1974, 6, 127–143. [Google Scholar] [CrossRef]
  63. EVE Energy Co. LF105 Product Specification. Available online: https://www.gobelpower.com/download/EVE-LF105-LiFePO4-Battery-Cell-Product-Specification-20191202.pdf (accessed on 4 November 2025).
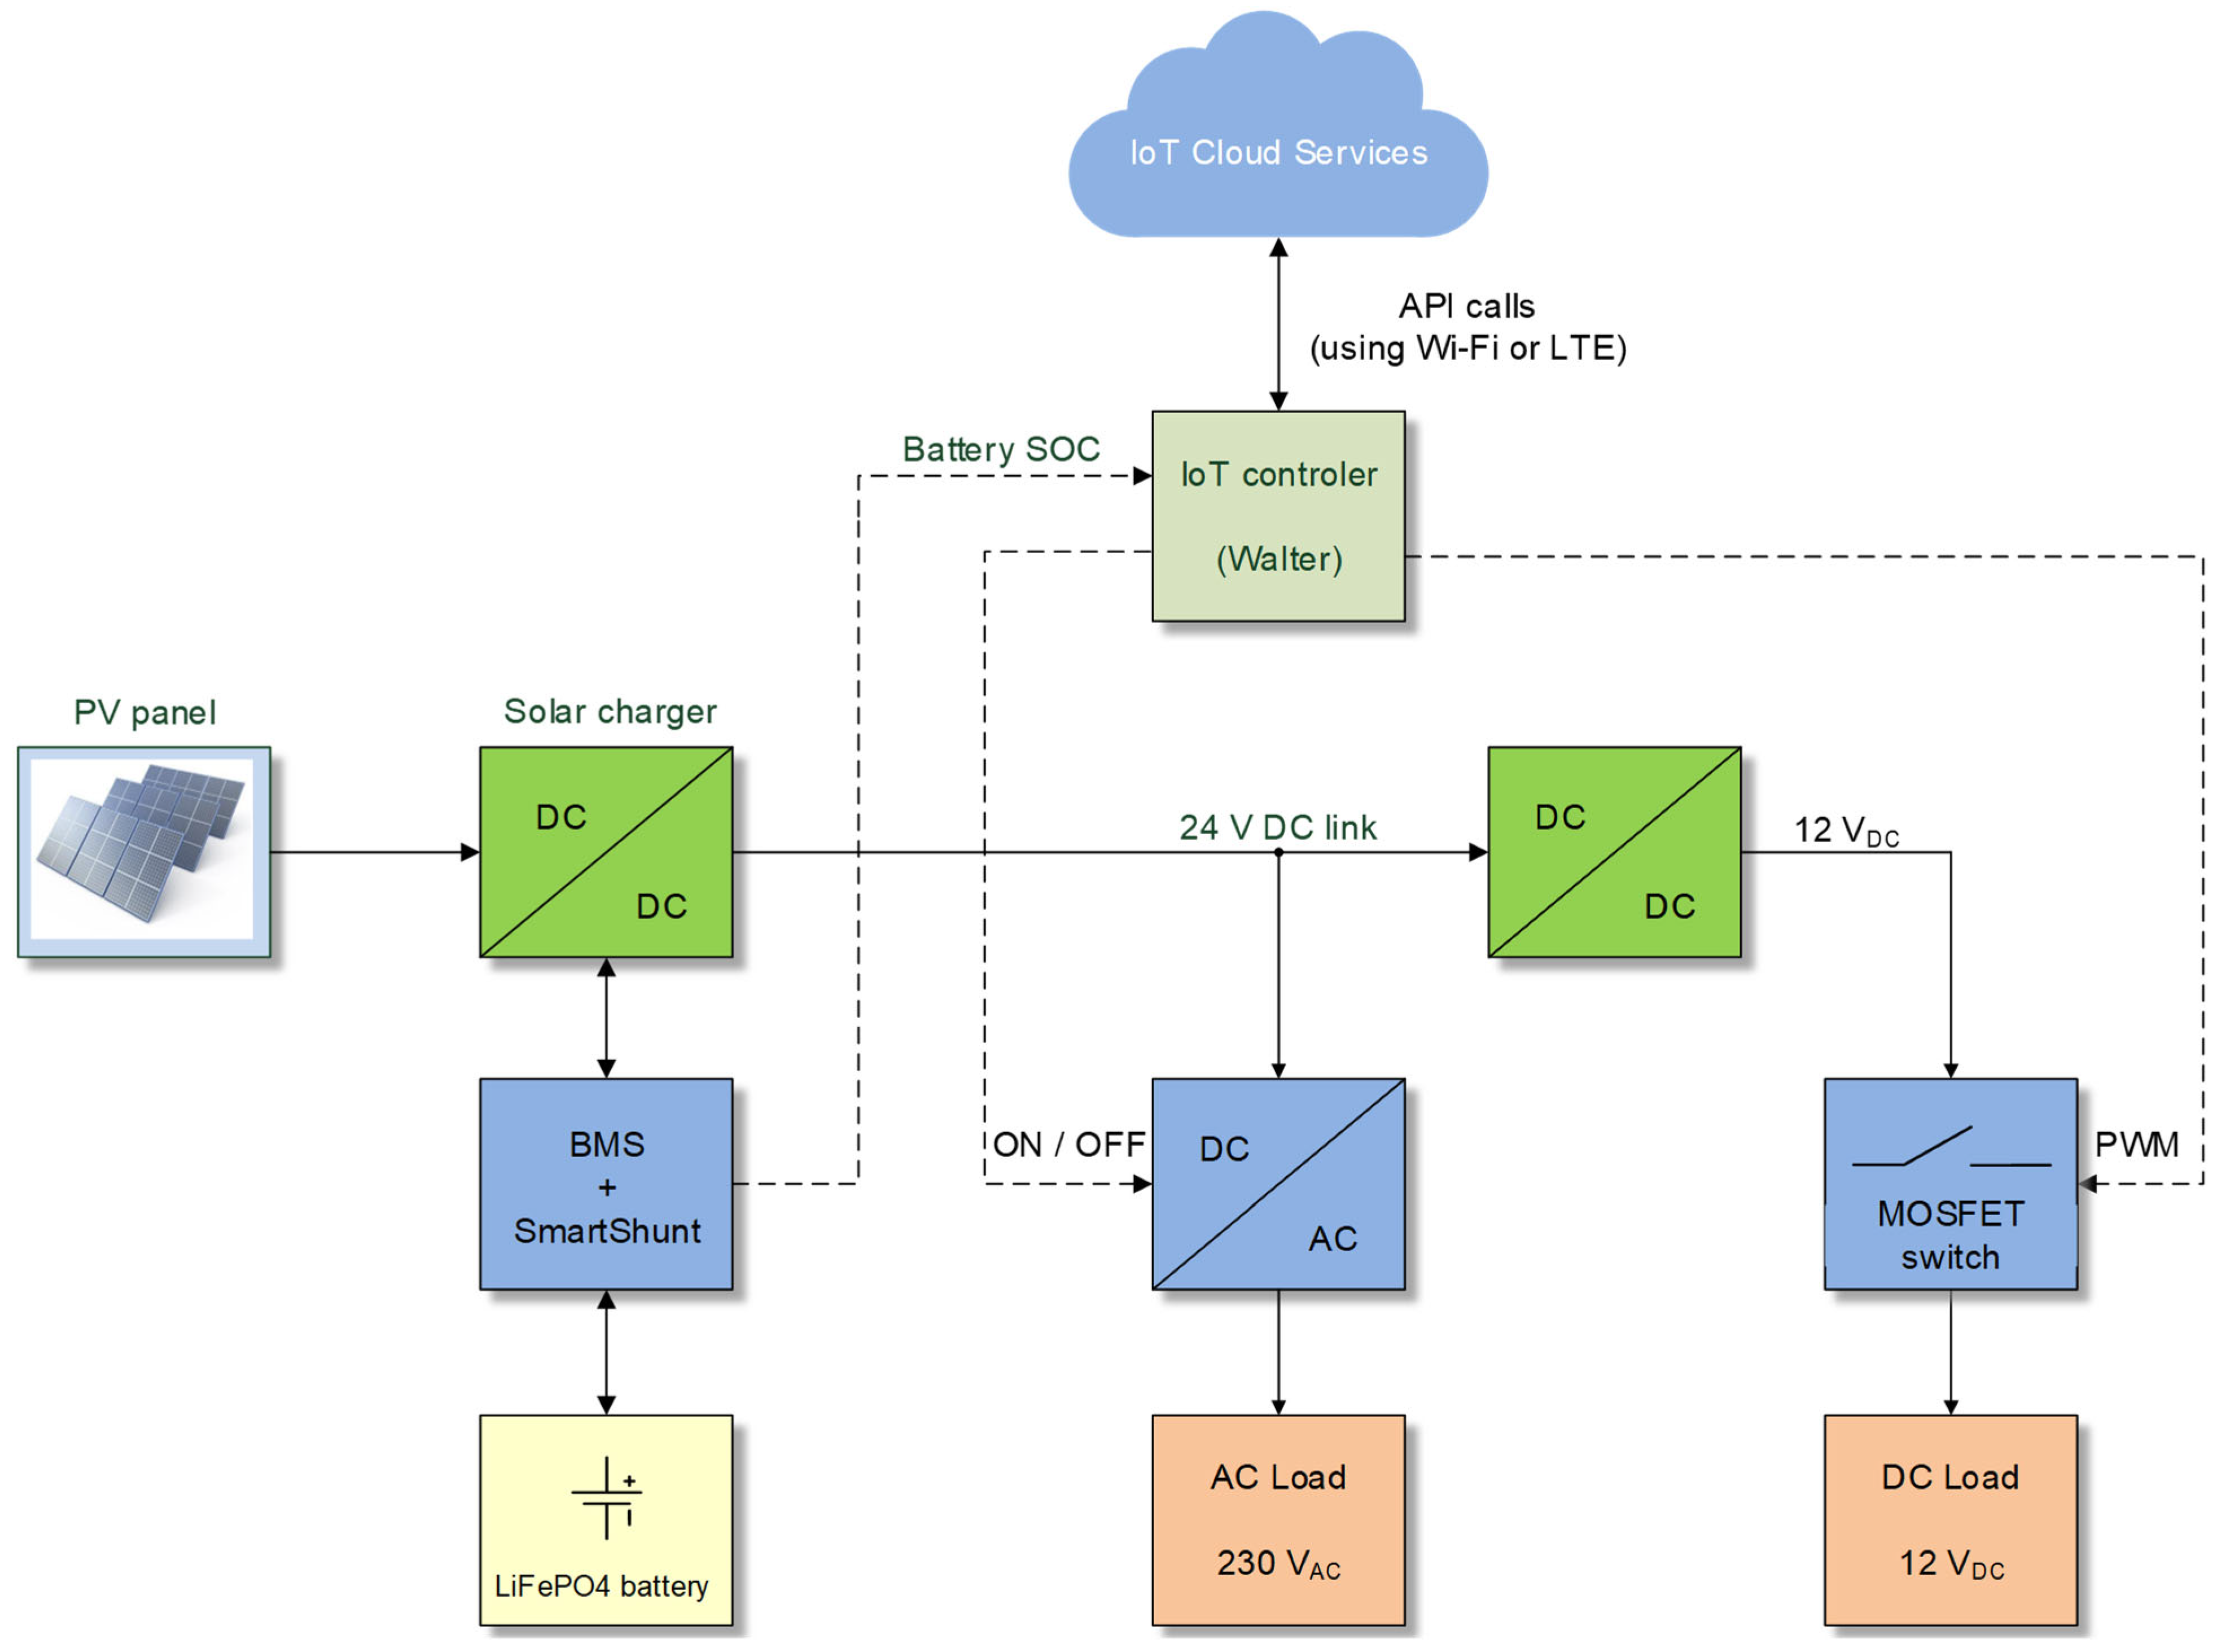
Figure 1. System architecture.
Applsci 15 12018 g001
Figure 2. LiFePO4 prismatic cells battery system.
Applsci 15 12018 g002
Figure 3. Power Supply.
Applsci 15 12018 g003
Figure 4. Solar panel.
Applsci 15 12018 g004
Figure 5. Control Circuit—Schematic.
Applsci 15 12018 g005
Figure 6. Control Circuit—Printed Circuit Board.
Applsci 15 12018 g006
Figure 7. Control Circuit—Photo.
Applsci 15 12018 g007
Figure 8. LCD TV (left), Power Supply (in the middle) and LED advertising billboard (right).
Applsci 15 12018 g008
Figure 9. Case Study Block Scheme.
Applsci 15 12018 g009
Figure 10. Algorithm Flowchart.
Applsci 15 12018 g010
Figure 11. Configuration Utility.
Applsci 15 12018 g011
Figure 12. Data visualization in ThingSpeak.
Applsci 15 12018 g012aApplsci 15 12018 g012b
Figure 13. Data visualization in ThingsBoard.
Applsci 15 12018 g013aApplsci 15 12018 g013b
Figure 14. System energy and power at normal operation.
Applsci 15 12018 g014
Figure 15. System energy flow by hour at normal operation.
Applsci 15 12018 g015
Figure 16. System energy and power at low predicted energy.
Applsci 15 12018 g016
Figure 17. System energy flow by hour at low predicted energy.
Applsci 15 12018 g017
Figure 18. System energy and power at low initial SoC (example 1).
Applsci 15 12018 g018
Figure 19. System energy flow by hour at low initial SoC (example 1).
Applsci 15 12018 g019
Figure 20. System energy and power at low initial SoC (example 2).
Applsci 15 12018 g020
Figure 21. System energy flow by hour at low initial SoC (example 2).
Applsci 15 12018 g021
Disclaimer/Publisher’s Note: The statements, opinions and data contained in all publications are solely those of the individual author(s) and contributor(s) and not of MDPI and/or the editor(s). MDPI and/or the editor(s) disclaim responsibility for any injury to people or property resulting from any ideas, methods, instructions or products referred to in the content.