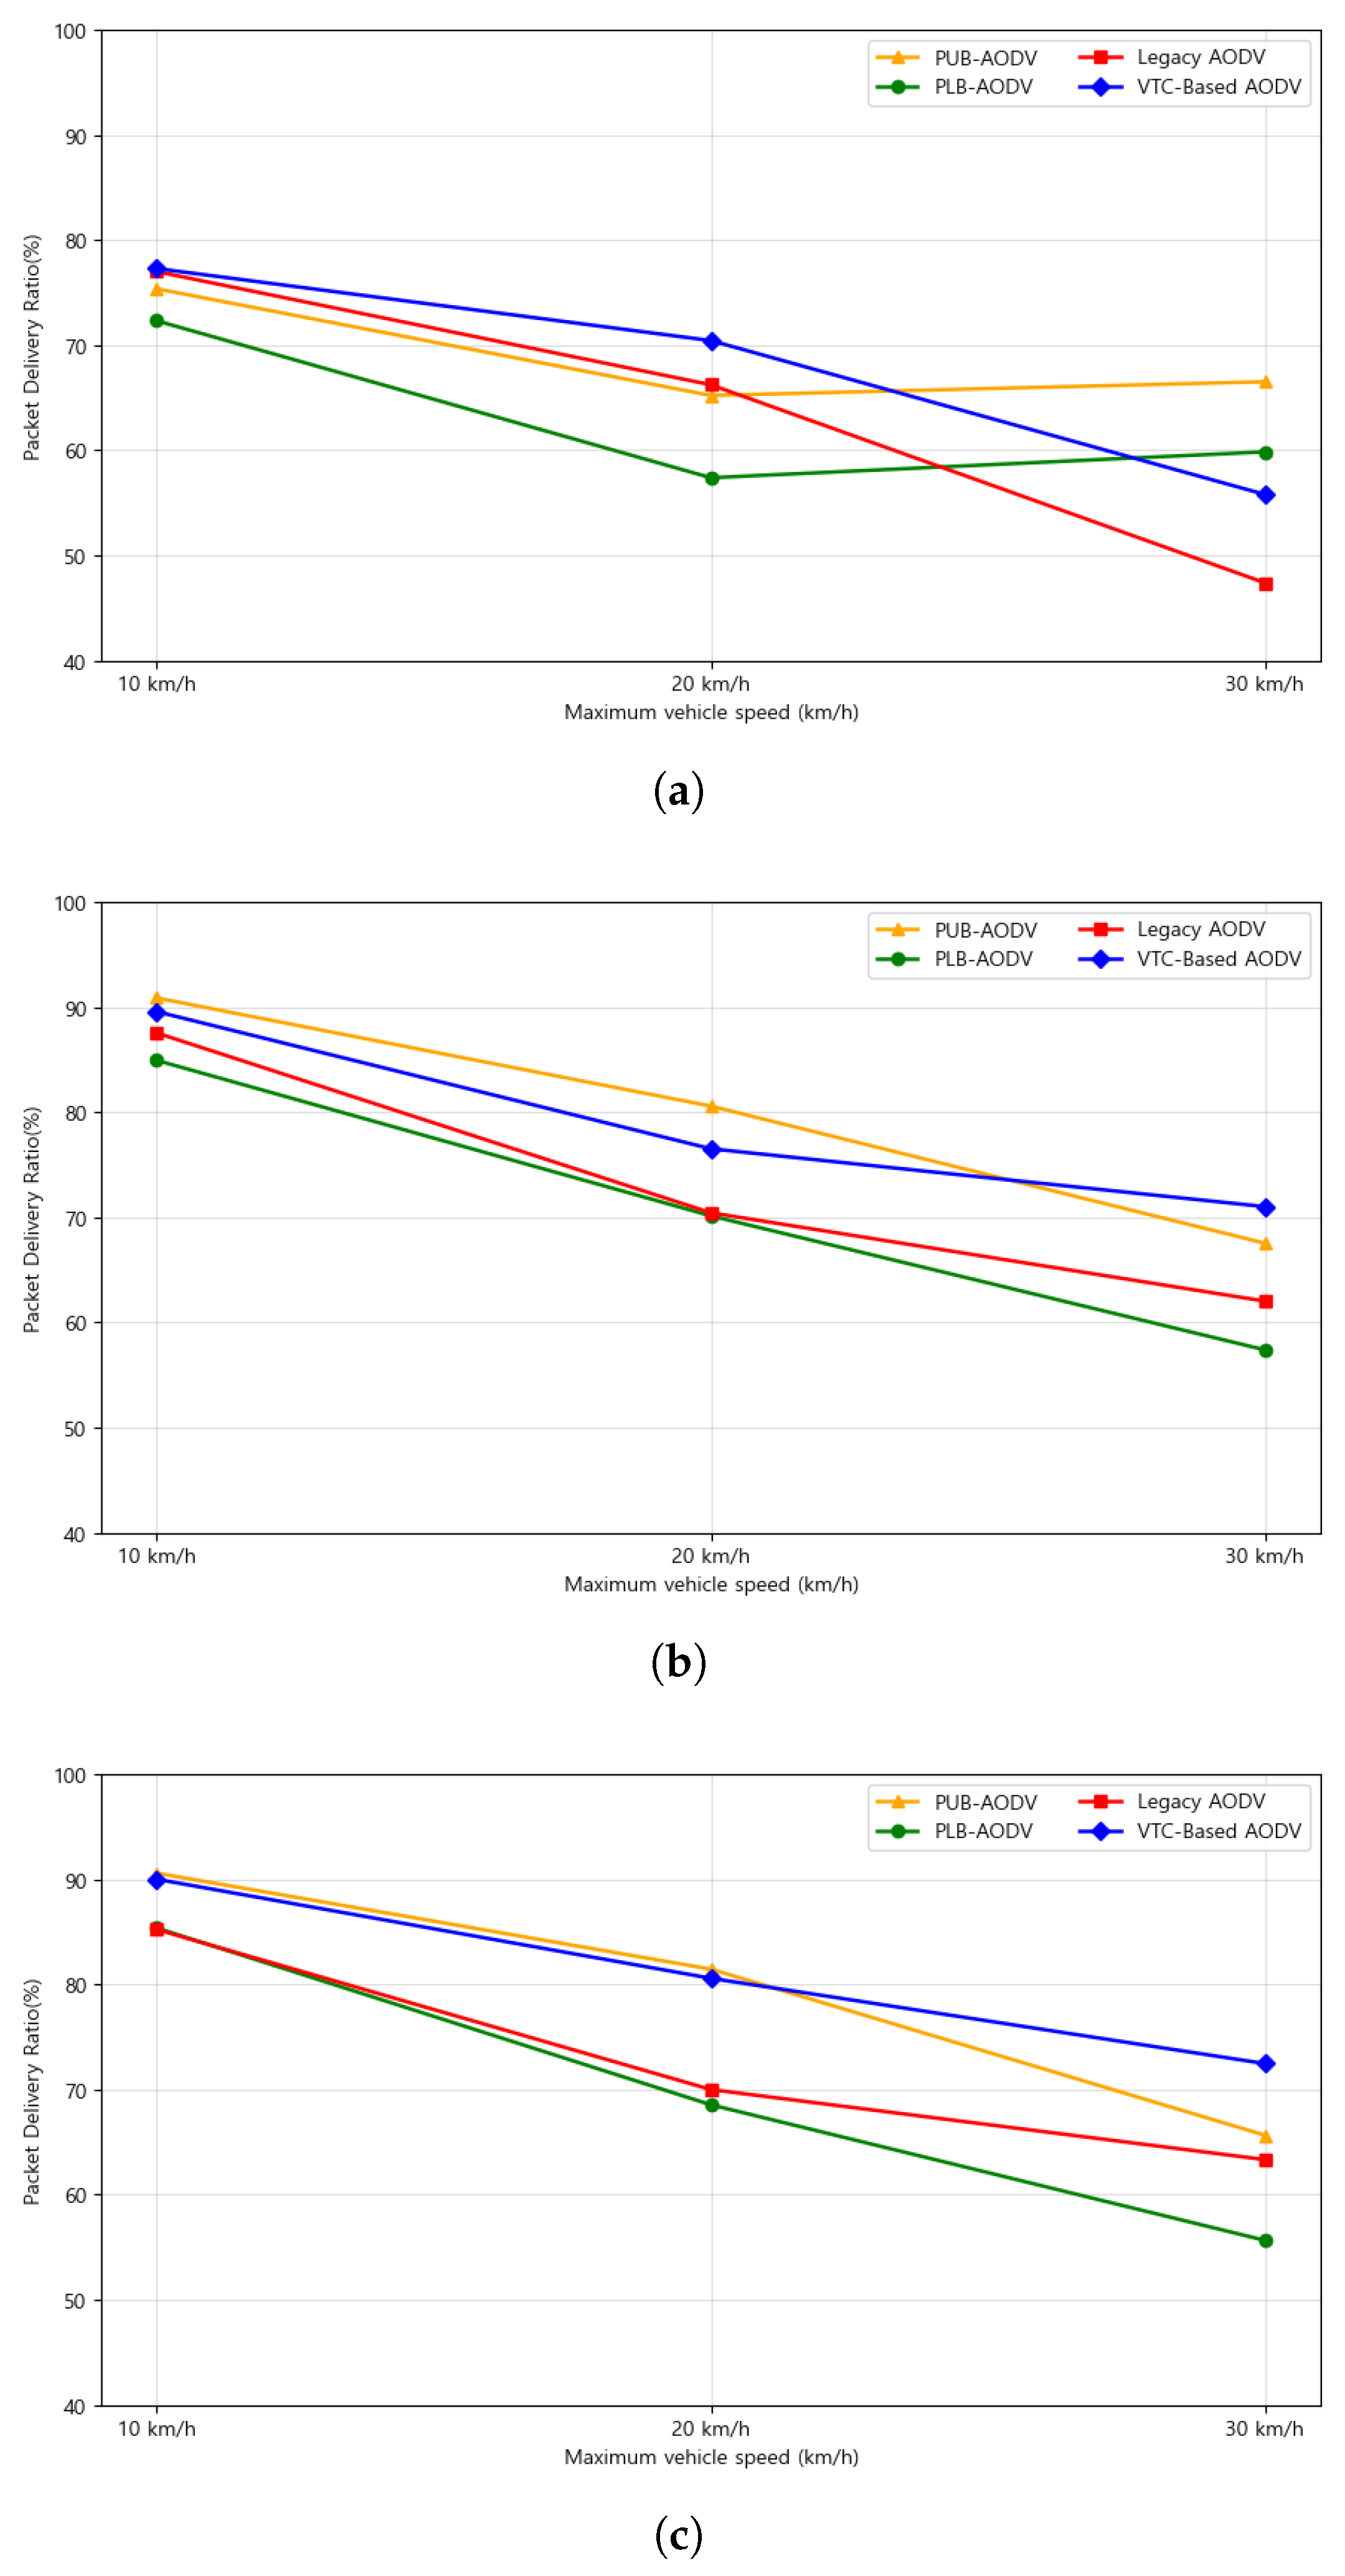
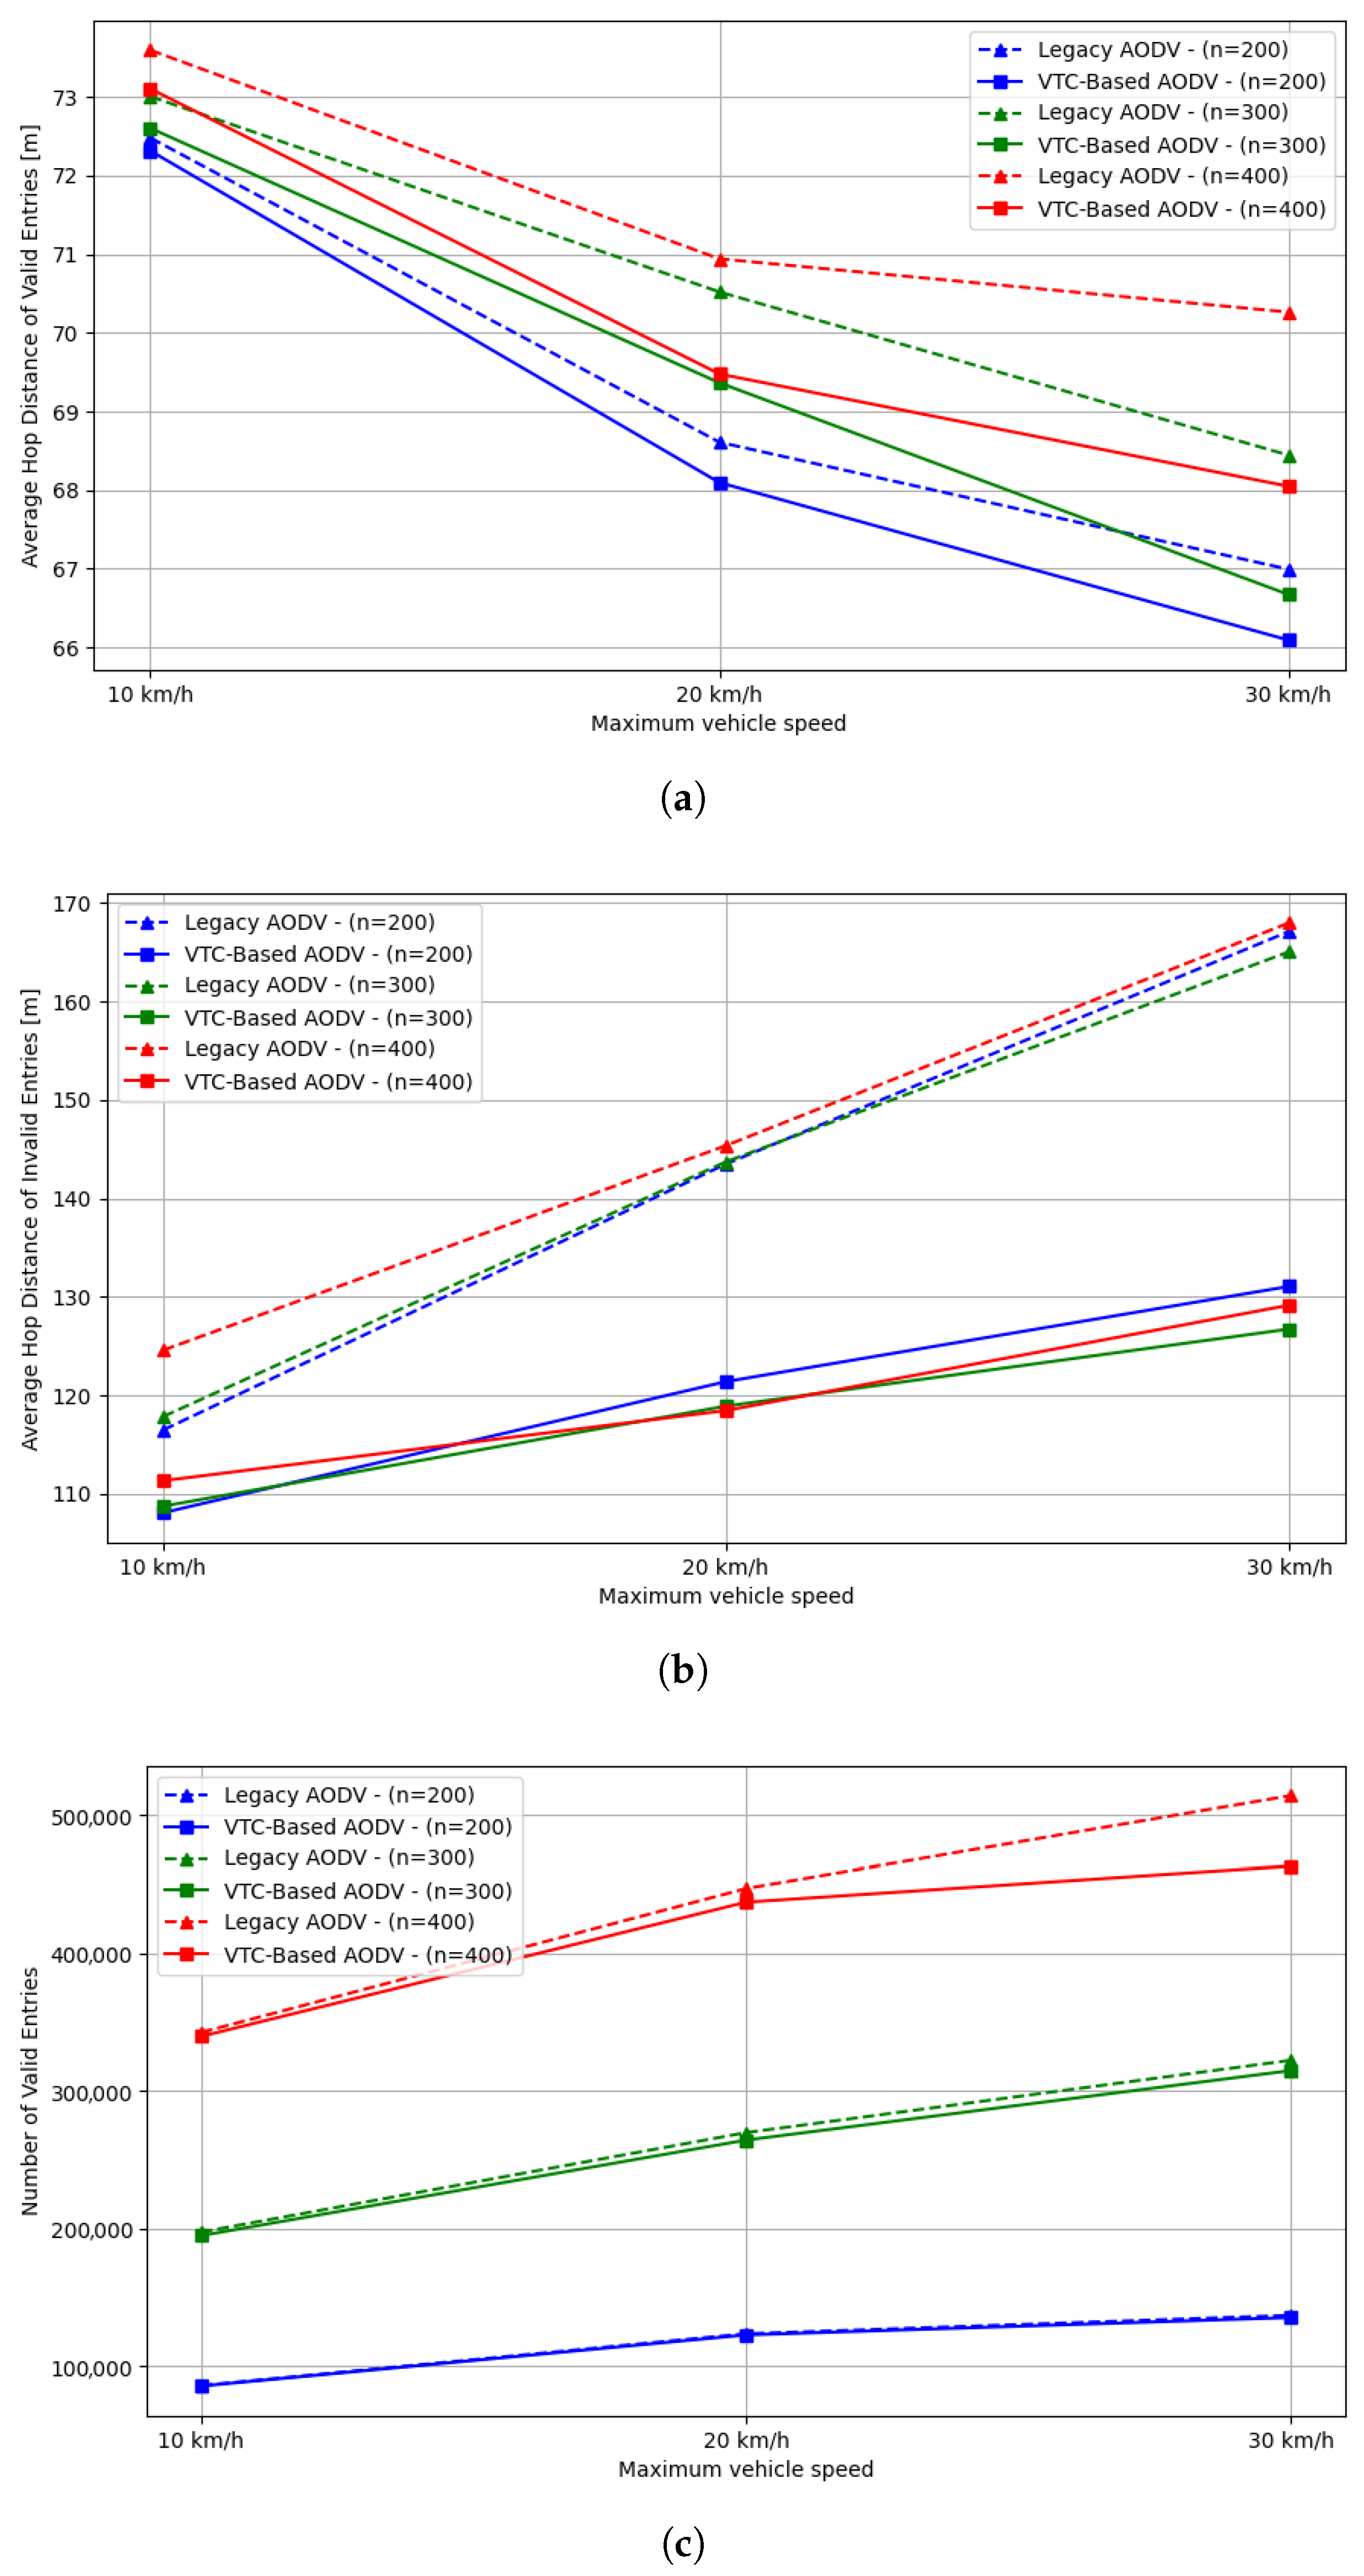
4.1. Design Rationale of the Proposed Scheme Based on Vehicular Traffic Conditions
We use an OSM and SUMO simulator to generate map-based traffic with a fixed total number of vehicle nodes
and a per-scenario speed limit
. Even with a fixed
s, the average speed of vehicle nodes changes over time because vehicles slow down at intersections, short stop-and-go waves appear, and groups of vehicles naturally bunch up and later spread out.
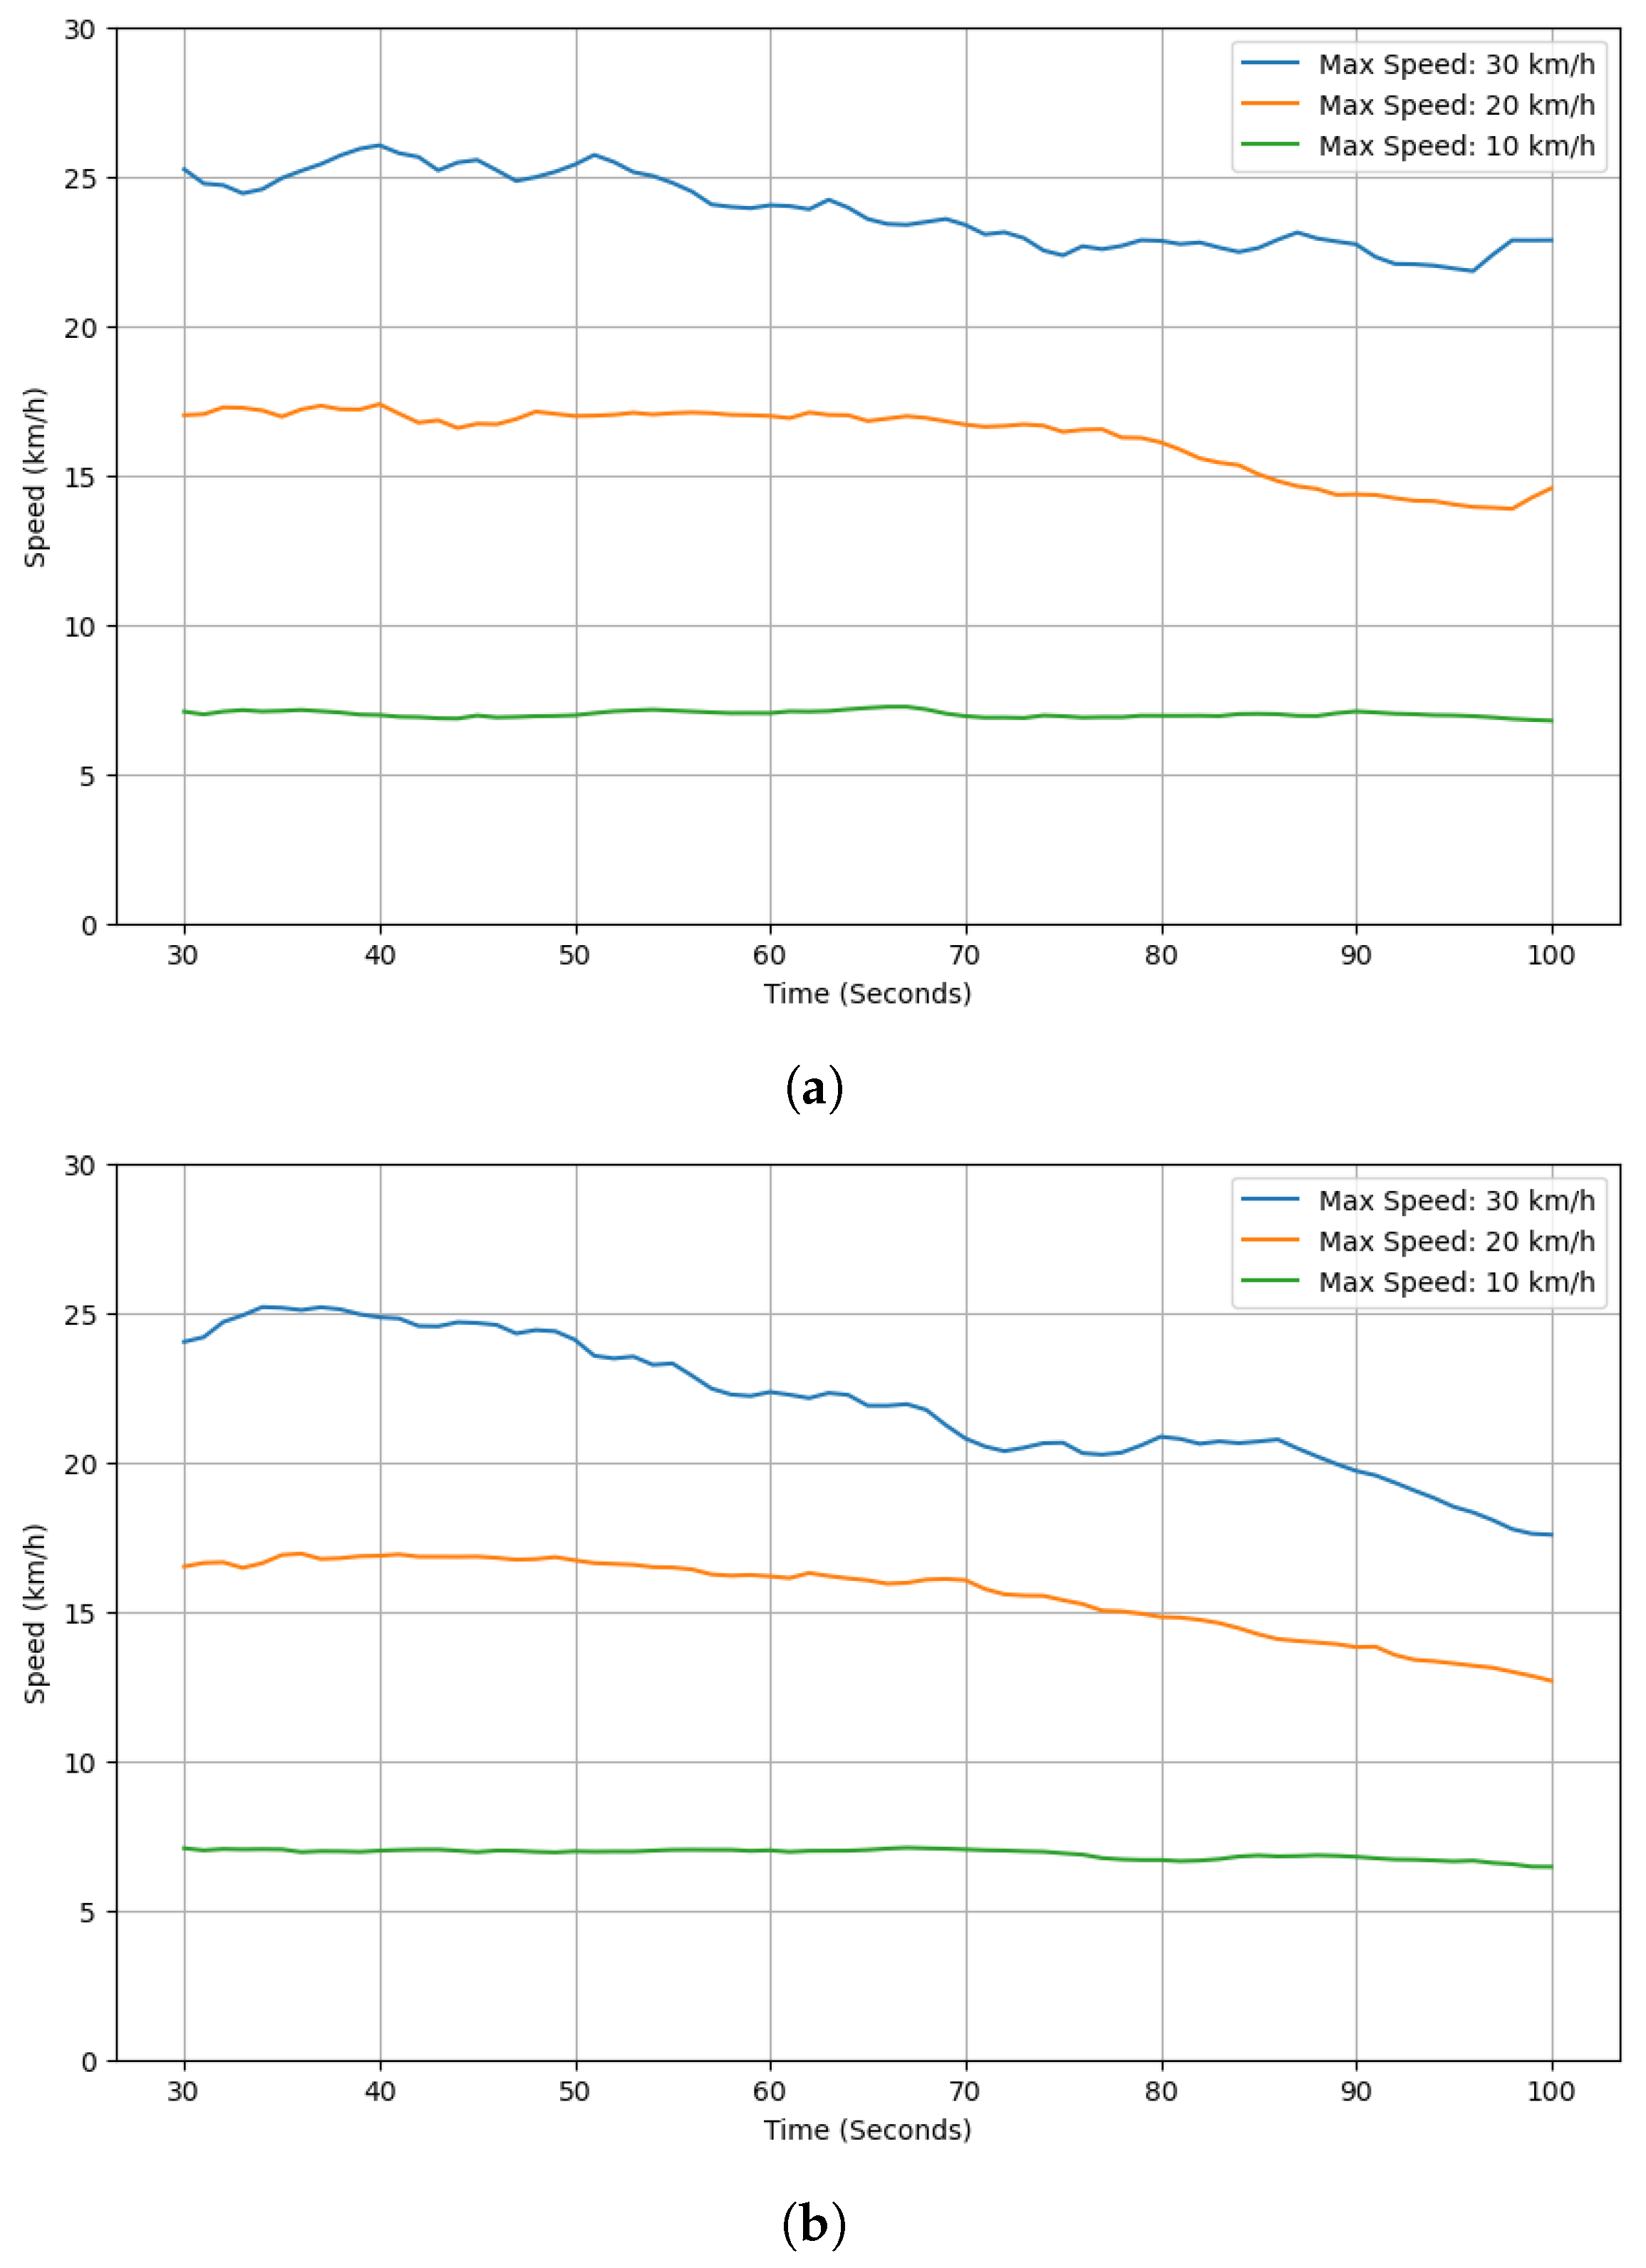
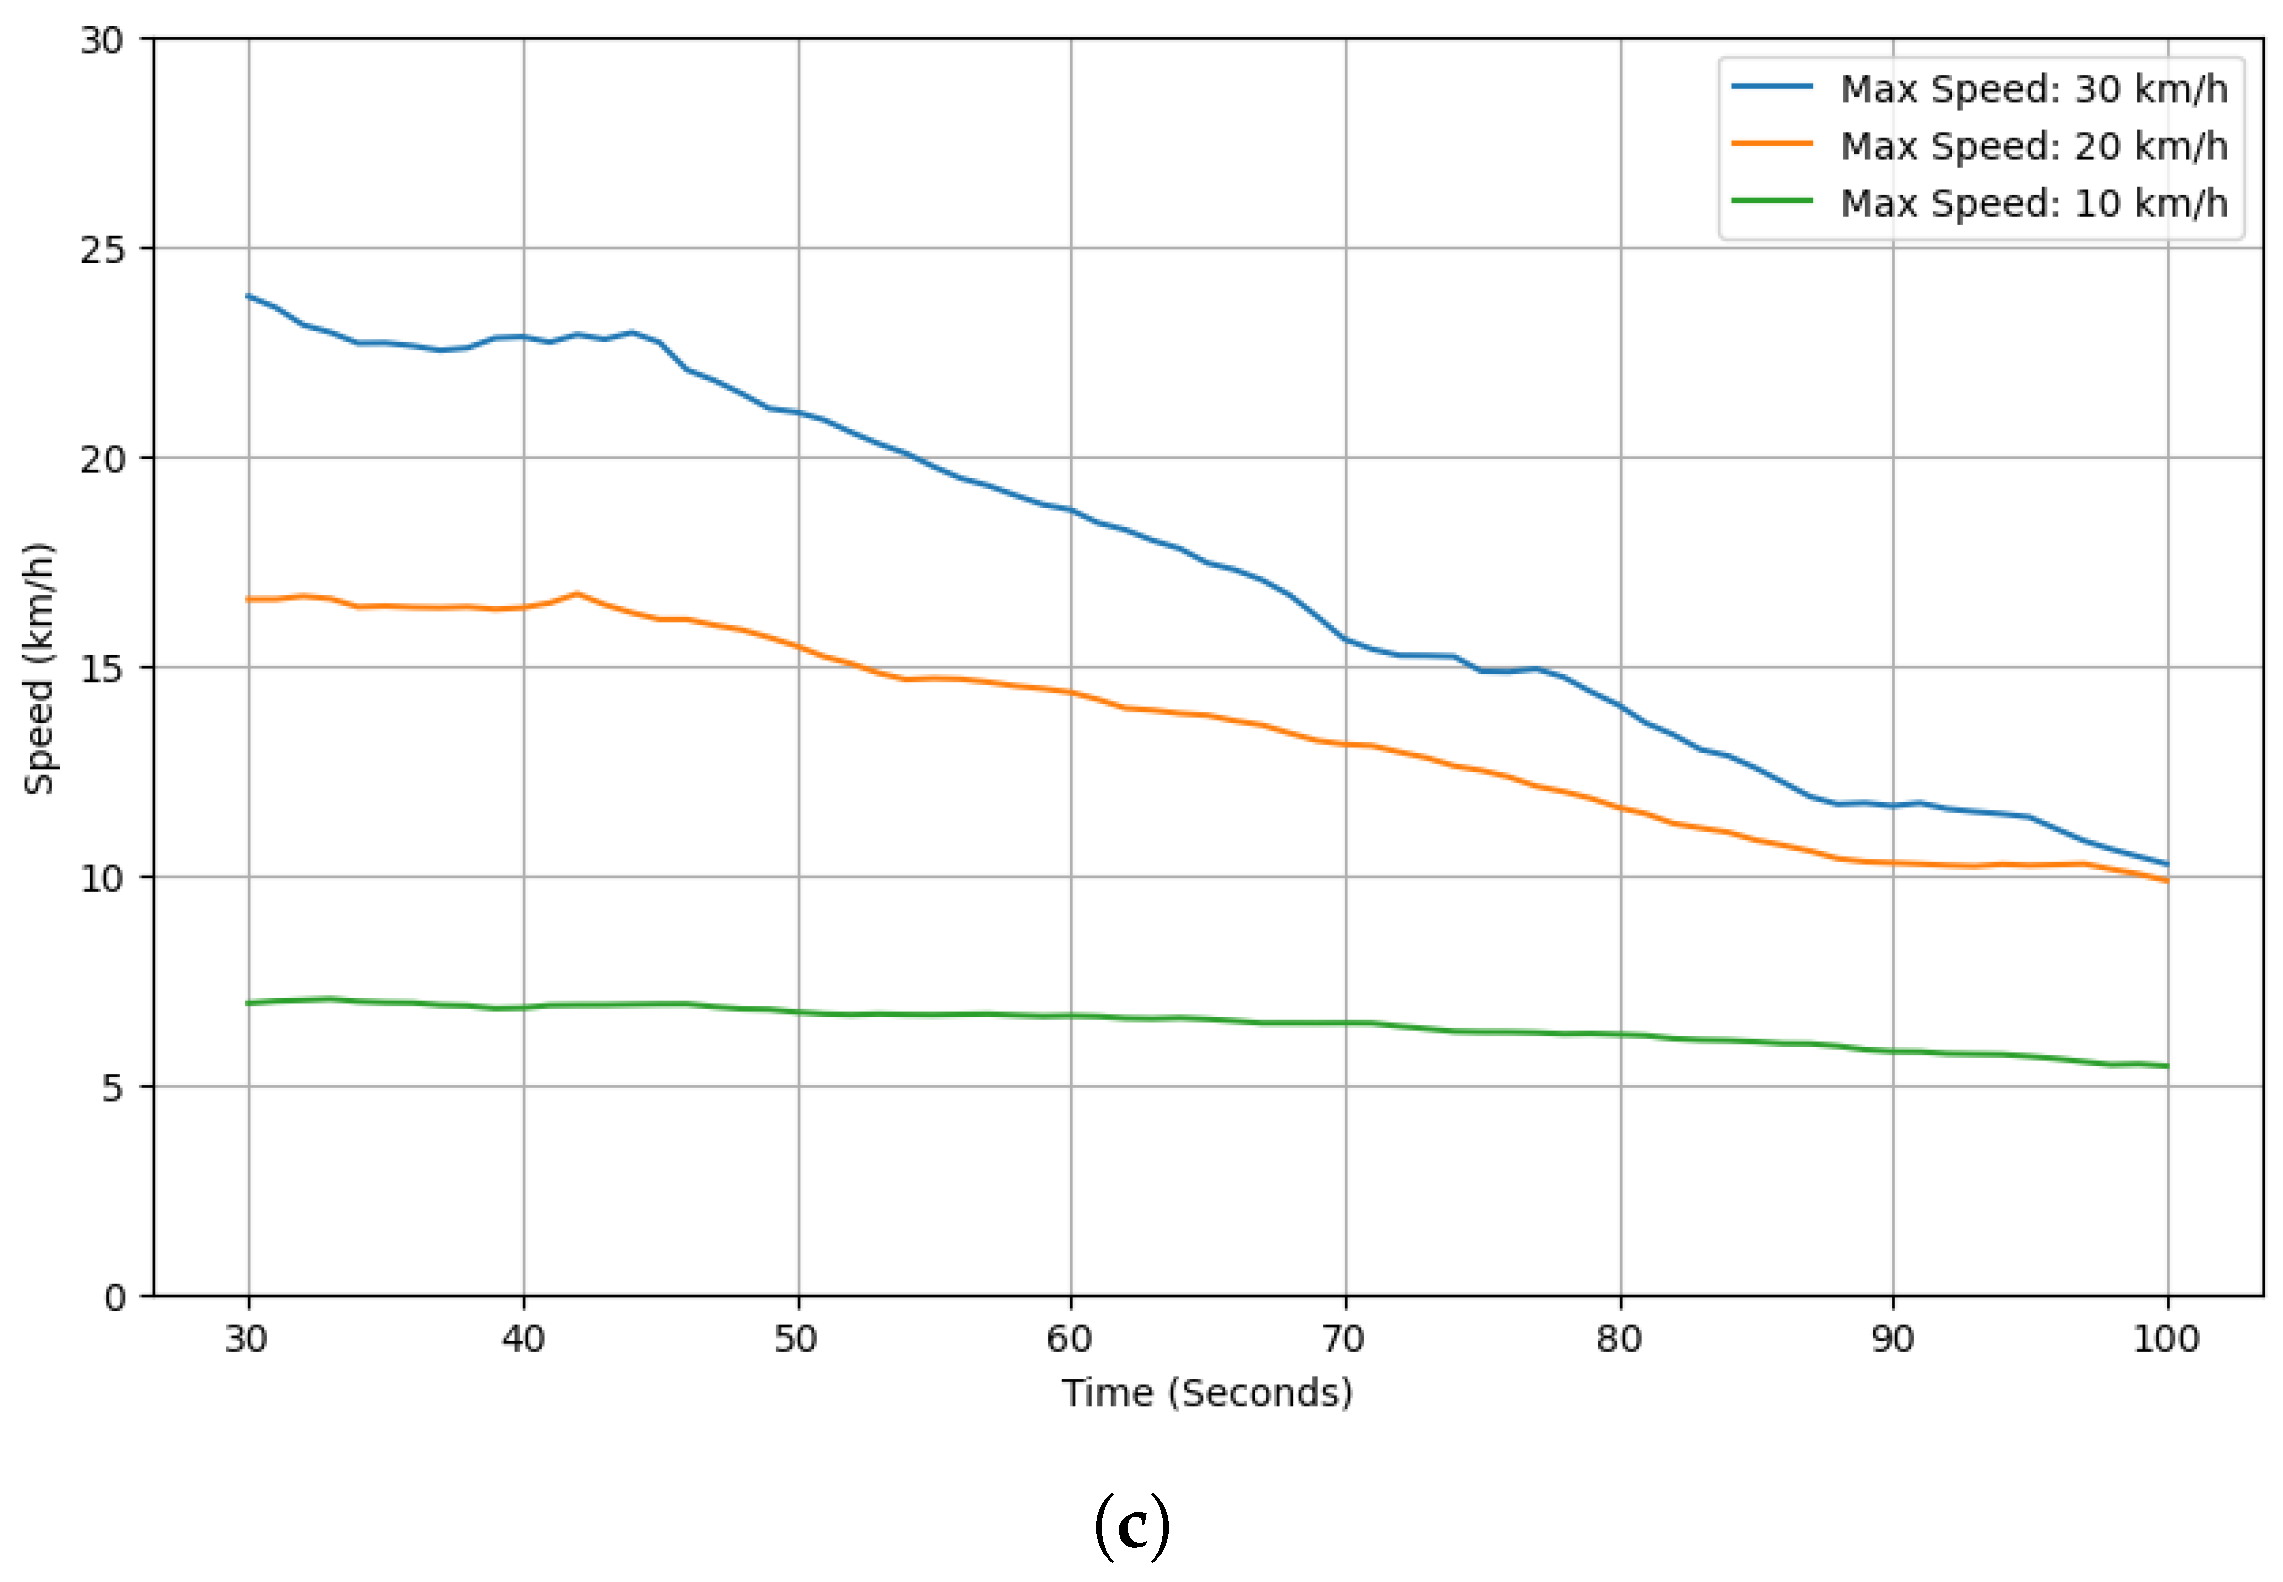
Figure 2 summarizes how this average speed evolves over time for the three densities.
Figure 2 reveals three consistent patterns. First, at the lowest density (
), the average speed is relatively stable with only a mild downward drift when
s is 30 or 20 km/h, whereas the 10 km/h case remains nearly flat. Second, at a medium density (
), all curves show a clearer decline—approximately linear after about 50 s—indicating that congestion gradually builds up even without external incidents. Third, at the highest density (
), the decline becomes pronounced and monotonic across all
s settings, which indicates sustained pressure on road capacity; a larger
s merely shifts the curve upward but does not eliminate the downward trend.
At the beginning of each SUMO run, the network is empty and vehicles are injected over time until the target fleet size is reached. To exclude this transient ramp-up phase from our analysis, we control the experiment so that RSU transmissions and routing measurements start only after the number of active vehicles stabilizes at the configured
n. Consequently, the warm-up interval (vehicle injection period) is excluded from all statistics and protocol updates, and all speed trajectories in
Figure 2 as well as subsequent evaluation results are taken after the fleet size reaches its steady operating level.
These observations establish that the vehicular traffic condition (VTC), parameterized by , produces time-varying effective mobility; the network undergoes a slow drift in the average speed of vehicle nodes as density increases. As a result, any routing-lifetime configuration that remains static over time (for example, a fixed pair ) can become mismatched as the average speed evolves. This motivates a VTC-conditioned, online lifetime controller that adapts to the evolving speed profile rather than to the nominal speed limit s alone.
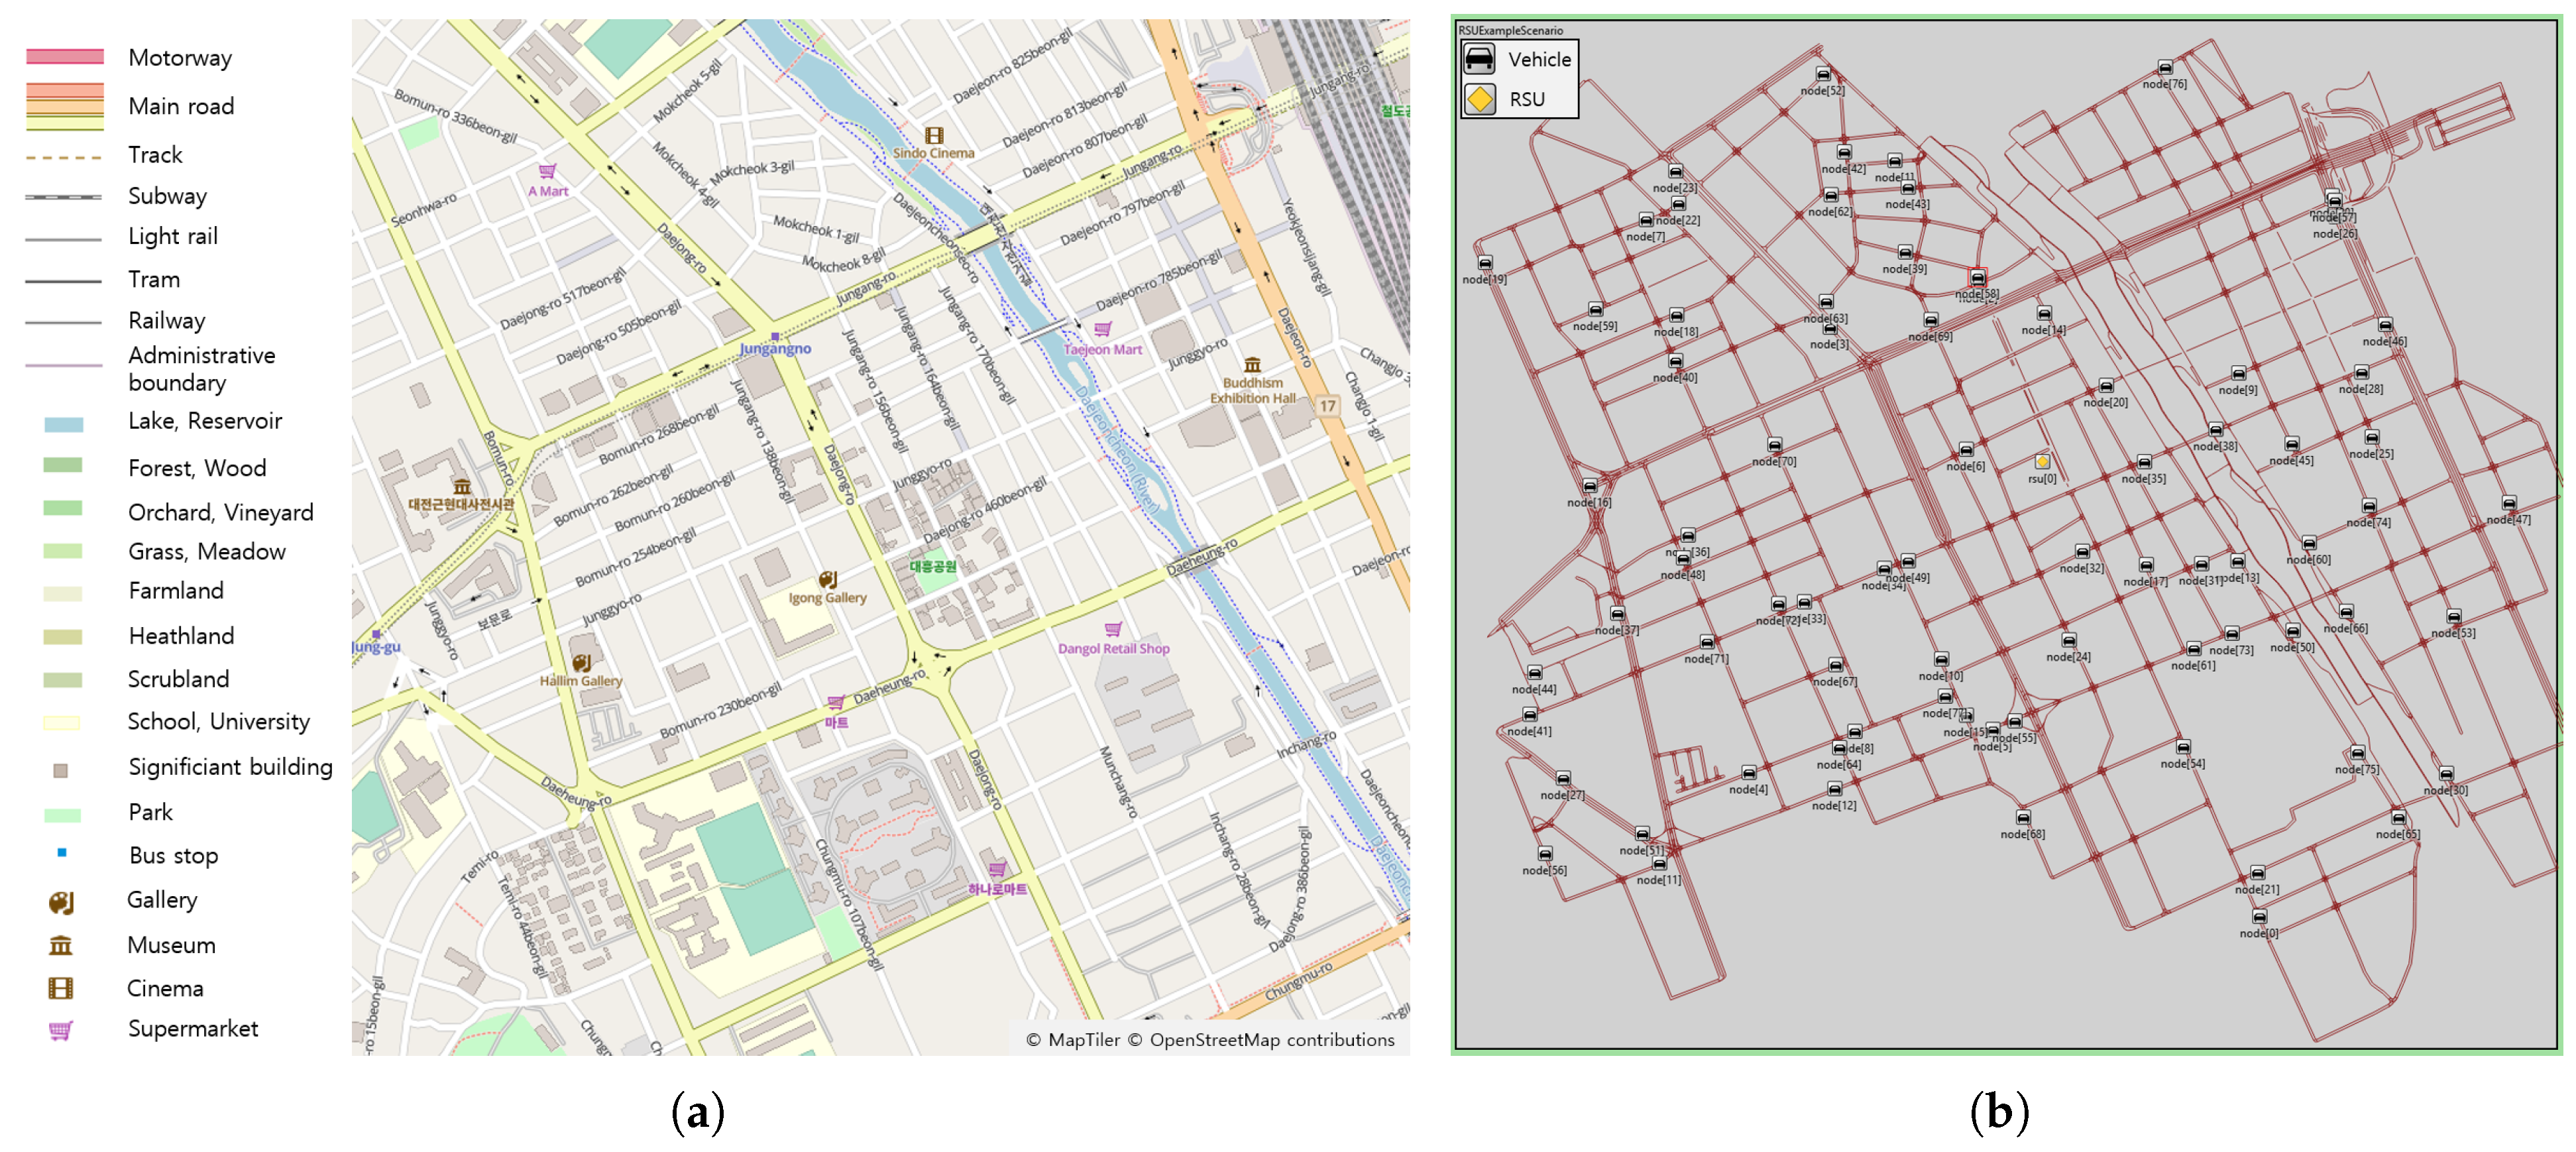
To check whether the relationship between local neighbor density and motion is map–agnostic, we examined four OSM-derived SUMO road layouts.
Figure 3 presents four OSM-derived road layouts: two urban (A, B) and two suburban (C, D), with clearly different intersection densities and block structures. We use these layouts to examine whether the relationship between the neighbor count
and the average vehicle speed generalizes across heterogeneous street patterns. Here,
denotes the number of neighbors observed upon reception of the
t-th HELLO packet.
For each layout we measured, after the warm-up phase, how the average speed of neighbor vehicle nodes (i.e., average vehicle speed) varies as a function of the current number of neighbors
around a node. The results are shown in
Figure 4, where the blue curve denotes the mean speed for each
and the red bars indicate the speed drop between adjacent
intervals.
Across all four maps, a common pattern emerges. First, when
, the mean speed decreases but the per-interval drop is relatively small and irregular. Second, in the transition band
(vertical dashed markers in
Figure 4), the speed reduction per
step is largest, i.e., the average speed changes most rapidly as neighbor density increases. Third, for
, the curve settles into a slower, almost monotonic decline with smaller incremental drops. This pattern is observed not only on the urban map used in this study (
Figure 4a; its base map is
Figure 3a) but also on three different maps (
Figure 4b–d) with distinct intersection layouts and block structures, indicating that the 15–20 band is consistently where mobility changes fastest.
These observations directly inform the design of the proposed scheme. Because routing-table lifetimes should react to how quickly the local topology changes, we set the update rule to be most responsive when , adjusting more aggressively in this band to track fast-changing neighborhoods.
Importantly, does not always move in one direction; therefore the controller permits both decreases and increases of depending on the local trend—shortening when the neighborhood changes rapidly and extending when it relaxes.
Outside this band, updates remain more conservative: when we avoid excessive changes, and when we apply gradual adjustments to prevent overreaction in already dense conditions. Thus the choice is grounded in evidence that the 15–20 region marks the steepest mobility variation across diverse road environments, and the controller controls lifetimes rather than merely shortening them.
Figure 5 presents, for four maps (A–D), the cumulative distribution function (CDF) of the speed-change magnitude
, where
denotes the current speed reported in a HELLO message at time
t and
is the speed reported in the previous HELLO from the same node. Thus,
is computed at each HELLO reception with interval
(i.e., not strictly every second), after excluding zero-speed samples. Across Maps A–D, most samples lie within
, while the upper tail extends to about
. The similar CDF shapes across different street layouts indicate that a single set of controller parameters can be applied robustly across maps.
4.2. Basic Operation of VTC-Based AODV Scheme
Our design choices are grounded in the empirical patterns in
Section 4.1: the steep mobility change observed in the
band (
Figure 4) and the distribution of speed-change magnitudes across maps (
Figure 5).
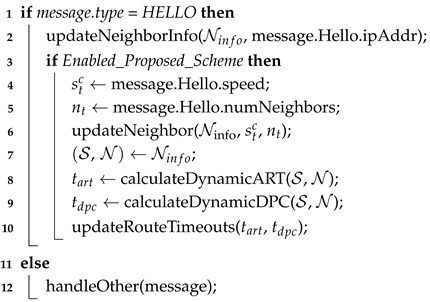
Algorithm 1 represents the procedure by which the VTC-Based AODV operates upon receiving a HELLO message in the existing AODV protocol, expressed in pseudocode form. When a node receives a HELLO message from the AODV protocol, it first calls updateNeighborInfo(
, message.Hello.ipAddr) to update the routing table
. Here, the second argument, message.Hello.ipAddr, denotes the IP address of the node that sent the HELLO message.
| Algorithm 1: VTC-Based AODV: Hello-Based and Dynamic Adjustment |
![Applsci 15 12017 i001 Applsci 15 12017 i001]() |
When the VTC-Based AODV is enabled, the HELLO message additionally includes the sender vehicle’s speed () and the number of neighboring nodes (). The receiving node extracts this information and then calls updateNeighbor(, , ) to update the vehicle speed and neighbor count information. The vehicle speed information is stored together with its previous value to enable computation of the vehicle speed variation in subsequent procedures.
In the standard AODV protocol, HELLO messages are primarily used to detect the presence of neighboring nodes and update the routing table. While conventional AODV employs HELLO messages solely for neighbor detection and route activation when no new route information is required, the VTC-Based AODV performs additional procedures to update (Active Route Timeout) and (Delete Period Constant).
Line 7 in Algorithm 1 extracts the vehicle speed list () and the neighbor count list () of surrounding nodes from the routing table. Lines 8–9 correspond to the process of using these as input parameters for calculateDynamicART() and calculateDynamicDPC() to compute the values of and . The computed and values are then applied to the routing table in line 10 and are subsequently utilized for route maintenance and management.
The detailed procedures of calculateDynamicART() and calculateDynamicDPC() are described in detail beginning from Equation (
1) in the following section.
The Active Route Timeout (ART) is the key parameter controlled in the VTC-Based AODV, determining the maximum duration for which a route remains valid. During this period, the route is considered active in the routing table. When the number of neighboring nodes is small, vehicles are spaced farther apart and relative movement is minimal, reducing the likelihood of route disruption. In such conditions, a longer ART is assigned to minimize unnecessary route rediscovery and maintain stable paths. Conversely, as increases, frequent relative movements and directional changes among adjacent vehicles increase the risk of route disruption. This effect is particularly prominent in urban and intersection-dense environments, where frequent direction changes and vehicle speed variations cause rapid topology fluctuations. In these cases, a shorter ART is assigned to prevent the persistence of disrupted routes, allowing rapid updates and timely establishment of new routes.
The ART duration
is calculated as follows.
Next, the Delete Period Constant (DPC) is a core parameter of AODV that is controlled alongside ART in the VTC-Based AODV. It determines the duration for which a route remains in the routing table after the ART period expires, before being removed. In other words, during the DPC period, routes whose ART has expired are not deleted immediately but are retained for a defined time interval.
When vehicle density is low (), the spacing between vehicles is wide, and topology changes occur infrequently. In such scenarios, re-routing to the same destination may occur at short intervals. If the previously established route is deleted immediately, unnecessary route discovery procedures could be repeatedly triggered. Therefore, setting a longer DPC allows expired ART routes to be maintained for a certain period, reducing redundant re-routing processes when the same destination is accessed again within a short interval.
Conversely, in high vehicle density environments (), vehicles are located in close proximity, and frequent stops, starts, lane changes, and even direction reversals occur. As a result, the relative positions and movement directions of vehicles change much more frequently than in low vehicle density conditions, leading to increased path disruptions. If the DPC remains long under such conditions, already disconnected routes may persist in the routing table, delaying the discovery of new valid routes. Thus, assigning a shorter DPC enables expired routing entries to be promptly removed once the ART period ends, allowing the rapid establishment of new paths using adjacent routing entries that correspond to the current vehicle’s direction of movement.
, representing DPC, is calculated using the following formula:
In Equation (
2),
denotes the baseline value of the Delete Period Constant (DPC), and
represents the final adjustment coefficient that reflects the effects of vehicle density and speed conditions. The computation method of
is described in detail in the following section. Finally, the baseline values
and
for the Active Route Timeout (ART) and DPC, respectively, share the same range, bounded between the minimum value
and the maximum value
.
Equation (
5) is defined based on the relationship between the number of observed neighbors
and the average speed, as shown in
Figure 4. Observations indicate that the average vehicle speed decreased most significantly in the range
to 20. The proposed scheme uses this range as the reference interval for ART and DPC calculations. To express this mathematically, the
value is normalized to the interval 15–20, setting
when
and
when
. Therefore,
t increases linearly as
increases from 15 to 20, and this value is used to interpolate the base values of ART and DPC in Equations (
3) and (
4).
In Equation (
5), the definition is grounded in the relationship between the observed number of neighbors
and the average vehicle speed shown in
Figure 4.
The observations indicate that the most pronounced decrease in average vehicle speed occurs over
–20. The proposed scheme adopts this interval as the reference range for ART and DPC calculations. To formalize this,
is normalized over the interval 15–20, with
clamped to the interval endpoints outside this range. Accordingly,
increases linearly as
varies from 15 to 20, and this value is used to interpolate the base ART and DPC in Equations (
3) and (
4); this choice follows the consistently steep slope observed across Maps A–D in
Figure 4.
Next, the vehicle density
denotes the number of vehicles within the communication range
R at time
t and serves as an input when computing ART and DPC in the proposed scheme. The vehicle density is calculated as follows.
In Equation (
6),
denotes the number of vehicles within a radius
R; in the experiments,
R was fixed at 110 m as the transmission range.
represents the saturation level of the segment in which the vehicle is located. In complex road environments—such as congested urban areas with high saturation—changes in the vehicle’s heading occur more frequently; accordingly, ART and DPC are configured to shorter values. Conversely, in low-saturation environments—such as highways—inter-vehicle spacing is wider, and relative position changes and heading variations occur less frequently than in congested urban settings; thus, ART and DPC are configured to longer values.
Therefore, quantitatively characterizes local saturation, enabling shorter ART/DPC in heavily loaded segments and longer values in lightly loaded segments.
The rate of change of vehicle speed denotes the relative variation in speed between two time instants and serves as an input when computing ART and DPC in the proposed scheme.
The rate of change is calculated as follows.
In Equation (
7),
and
denote the vehicle’s speed at the current and previous instants, respectively. When
, the rate of change between the two instants is computed; when
, it is defined as zero to avoid a division-by-zero denominator.
Larger
indicates faster variation in the vehicle’s speed, increasing the likelihood of substantial short-term changes in relative positions among vehicles. Accordingly, the VTC-Based AODV reduces ART and DPC as
increases, promoting rapid route updates. Conversely, when
is small, relative position changes are gradual, and ART/DPC are maintained at comparatively longer values.
Next, in Equation (
8), the final adjustment coefficient
is obtained by a linear combination of the vehicle speed- and vehicle density-related terms.The associated constants were determined through simulations conducted in the map environment used in this study. These four elements do not operate independently; rather, they jointly determine the direction and magnitude of ART/DPC adjustment in a complementary manner.
The speed coefficient normalizes the current vehicle speed and modulates the response intensity of the speed-based weight used in subsequent steps. As the vehicle speed increases, decreases, rendering more sensitive in high-speed operation. In high-speed zones, relative motion between vehicles is large; accordingly, even small speed differences or slight heading changes induce rapid variation in inter-vehicle distance. Under such conditions, path maintenance becomes challenging; therefore, the influence of is emphasized, yielding a larger adjustment magnitude in the ensuing ART/DPC update stages.
Conversely, in low-speed sections, increases, attenuating the response of . The effect of speed changes on distance variation or path retention is comparatively smaller. Hence, functions as a reference that tunes the sensitivity of according to the current vehicle speed: relatively higher speeds, even small deviations substantially affect , whereas at low vehicle speeds, spacing changes are minor and the impact on is relatively limited.
The speed-based weight quantifies the adjustment amplitude applied to ART and DPC based on the vehicle’s speed variation. When the vehicle speed variation is large, decreases, thereby narrowing the adjustment range of ART and DPC. When the variation is small, increases, broadening the adjustment range of ART and DPC. In effect, promotes shorter route retention under irregular vehicle speed patterns and longer retention under stable speed. The constants were calibrated through simulations in the study’s map environment, taking into account traffic density and road-structure characteristics.
The vehicle density coefficient captures the instantaneous concentration of vehicles around a given vehicle, quantifying inter-vehicle proximity. This value increases as the number of surrounding vehicles grows. Because multi-hop routes are more susceptible to disruption under higher local vehicle density, larger yields smaller ART and DPC. Conversely, decreases as the number of surrounding vehicles declines; with wider spacing, routes tend to remain stable, and ART/DPC are computed to larger values. Accordingly, serves as a reference for adjusting the magnitude of ART and DPC as a function of surrounding vehicle density.
The vehicle density-based weight takes as input and determines the strength with which its influence is applied. As the number of surrounding vehicles increases, grows, amplifying the effect of and yielding smaller ART and DPC. Conversely, when fewer vehicles are present, decreases, attenuating the influence of and producing comparatively larger ART and DPC. In other words, provides the input reflecting the local vehicle count, while controls the degree to which that input is reflected in the actual ART/DPC calculations.
Specifically, accounts for both the saturation level of the traffic environment and deviations of vehicle density from its average. It adjusts the ART/DPC durations so that the speed-based correction effect remains balanced with the observed vehicle-distribution characteristics.
In this process, is formed as a single adjustment coefficient by summing the vehicle speed term and the vehicle density term . The resulting is applied as a multiplicative factor in the ART and DPC formulas, directly tuning their final values according to the speed vehicle and vehicle density inputs. Detailed calculation procedures for each element are provided below.
The speed-based weight
is an adjustment parameter that governs the variation of ART and DPC by reflecting the influence of the vehicle’s speed characteristics on route stability. This weight is computed as follows.
In Equation (
9),
denotes the baseline for the speed-based weighting, and changes in the vehicle’s driving state are incorporated via two correction terms. Here,
is a global scaling constant that adjusts the overall magnitude of the speed-based weighting while preserving the relative contributions of the individual correction terms. The final outcome is constrained to the admissible range
.
The first correction term, , uses the absolute deviation of the current vehicle speed from the average vehicle speed . A larger deviation indicates a mismatch between the vehicle’s motion state and the surrounding traffic flow, which increases the likelihood of link disconnection. Accordingly, a negative coefficient with value is applied, decreasing . That is, as the disparity between the current and average vehicle speeds grows, decreases and ART/DPC are adjusted to shorter values, reducing route lifetime. To avoid excessive reduction under large vehicle speed deviations, the contribution of this term is clipped to .
The second correction term
reflects the temporal rate of change of vehicle speed
. Because link stability degrades with frequent acceleration or deceleration,
decreases under the negative coefficient
with value
. Accordingly, larger rates of speed change yield smaller
, and ART/DPC are adjusted to shorter values, enabling faster route updates. The influence of this term is clipped to
to prevent transient, abrupt speed fluctuations from exerting excessive impact on ART/DPC adjustments. These distributions motivate the scaling and clipping ranges applied to the speed-variation term;
Section 4.1’s CDFs are explicitly reused here when setting update sensitivity (see
Figure 5).
Consequently, increases when the current speed and both its deviation from, and rate of change relative to, the average vehicle speed are small; in this case, ART and DPC are set longer, extending route lifetime.
Conversely, decreases when the current speed and its deviation are large or when the rate of change is high; ART and DPC are then shortened, prompting early updates of unstable routes. In sum, this formulation linearly adjusts ART and DPC according to the magnitude of variation in speed characteristics, thereby enabling dynamic control of route lifetime.
The vehicle density-based weight
is an adjustment factor used in ART and DPC calculations, reflecting the local saturation level of surrounding vehicles at the time a HELLO message is received. This value is recomputed whenever a node updates adjacent-vehicle information via a HELLO message and is defined as follows.
Here, is the default weight, and denotes the current vehicle’s saturation level measured at the instant the HELLO message is received. denotes the contemporaneous average saturation level of vehicles within the communication range, representing the typical local saturation. Accordingly, indicates how much the saturation at the current vehicle’s position deviates from the surrounding average.
The correction term adjusts to reflect this deviation. To avoid abrupt changes in the weight between HELLO reception intervals—even under substantial saturation variation—the correction contribution is clipped to . Here, and the final admissible range are identical to those used for the speed-based weight .
If the current saturation exceeds the surrounding average , the vehicle is situated in a densely packed segment. Since , decreases, yielding shorter ART and DPC. Conversely, if the current saturation is lower than the surrounding average , the vehicle is in a more sparsely populated segment; increases, producing longer ART and DPC.
Accordingly, adapts at each HELLO reception to reflect local saturation dynamics—shortening ART/DPC in highly saturated segments and lengthening them in lightly saturated segments.
The vehicle speed coefficient
and the vehicle density coefficient
normalize the vehicle’s travel speed and the surrounding vehicle density state, respectively, and serve as reference values that regulate the reflection intensity of the speed-based weight
and the vehicle density-based weight
applied in subsequent steps. These coefficients map vehicle speed and vehicle density—quantities with different units—into a common ratio form and calibrate them so that absolute environmental magnitudes do not unduly dominate the adjustment range of ART (Active Route Timeout) and DPC (Delete Period Constant). The definitions are as follows.
The vehicle speed coefficient
in Equation (
11) is defined as an inverse-proportional function of the current vehicle speed
. As the vehicle’s speed increases,
decreases, thereby limiting any increase in ART and DPC even when
is applied. Conversely, at lower vehicle speeds,
increases, allowing the effect of
to be reflected more strongly.
Accordingly, acts as a threshold that governs how much is actually reflected based on the absolute vehicle speed magnitude. This prevents unnecessary route retention for fast-moving vehicles and suppresses ART/DPC from becoming excessively short for slow-moving vehicles. The upper and lower bounds of and , respectively, constrain to avoid abrupt ART/DPC fluctuations due to transient vehicle speed changes.
The vehicle density coefficient
in Equation (
12) is a normalized quantity obtained by dividing the instantaneous vehicle density
by the baseline vehicle density
. This coefficient quantifies local saturation and calibrates
to avoid excessive influence of absolute vehicle density levels during application. Although
increases with higher saturation, it is applied effectively as an inverse weight in practice, resulting in shorter ART and DPC.
Conversely, at lower vehicle density, is smaller, thereby maintaining longer ART and DPC to support route stability where available paths are limited. The upper and lower bounds, and , respectively, provide a stabilization range that prevents unrealistic ART/DPC fluctuations under abrupt vehicle density changes.
Consequently, and , respectively, normalize the absolute magnitudes of vehicle speed and vehicle density, thereby regulating the sensitivity of the subsequent weights and . Specifically, the F coefficients set the baseline adjustment magnitude for ART and DPC as a function of the current vehicle speed and saturation level, whereas the W coefficients encode the rate-of-change effects that determine the direction and amplitude of the adjustments. Together, these two classes of coefficients ensure that ART and DPC adapt in accordance with observed variations in vehicle speed and vehicle density within the traffic environment.
Figure 6 presents the calculation results for ART (Active Route Timeout) and DPC (Delete Period Constant). The x-axis denotes the number of neighboring vehicles
within a radius
, and each curve corresponds to a current vehicle speed interval
. Each point represents the computed ART or DPC value for the
combination, while the y-axis reports ART and DPC.
As
increases, both ART and DPC decrease overall. In particular, over
nt = 15–20, the reduction in average speed is pronounced, consistent with the largest drop observed in
Figure 4. For
, ART and DPC are computed to larger values, whereas for
, they are computed to smaller values.
Each curve uses the
values computed in
Figure 5 as inputs.
denotes the difference between the current speed and the previous speed maeasured earlier, with its distribution over the entire interval concentrated in the 0–4 km/h range. For the calculations, values segmented at 1 km/h increments within this range were applied. At the same
, larger
yields smaller computed values for both ART and DPC. Conversely, for the same
and the same
, lower
results in relatively larger ART and DPC.
