Article

A Vehicular Traffic Condition-Based Routing Lifetime Control Scheme for Improving the Packet Delivery Ratio in Realistic VANETs

Department of the Computer Science and Engineering, Kongju National University, Cheonan 31080, Republic of Korea
*
Authors to whom correspondence should be addressed.
Appl. Sci. 2025, 15(22), 12017; https://doi.org/10.3390/app152212017 (registering DOI)
Submission received: 24 September 2025 / Revised: 31 October 2025 / Accepted: 6 November 2025 / Published: 12 November 2025
(This article belongs to the Special Issue Autonomous Vehicles and Robotics—2nd Edition)

Abstract

Packet delivery in vehicular ad hoc networks degrades under realistic road dynamics, where mobility and local density vary over time and across road layouts. This study revisits route lifetime control in AODV and introduces Vehicular Traffic Condition-Based AODV, which adjusts the Active Route Timeout and the Delete Period Constant online at each HELLO reception using locally observable cues on neighbor density and short-term speed variation. The design is empirically informed by OpenStreetMap and SUMO mobility with OMNeT++/Veins/INET co-simulation. The analysis highlights two recurrent patterns that guide the method: (i) an intermediate neighbor-density range—roughly from the mid-teens to about twenty neighbors—where average speed tends to vary more rapidly; and (ii) a distribution of short-term speed-change magnitudes, sampled at the instants of HELLO reception, that is concentrated within a narrow interval with a light upper tail. Accordingly, the proposed method increases or decreases route-entry lifetimes with heightened responsiveness inside this density range, while applying conservative updates elsewhere to mitigate oscillations. Evaluation across multiple vehicular-traffic conditions spanning three fleet sizes (200, 300, 400 vehicles) and three speed-limit settings (10, 20, 30 km/h) demonstrates consistent packet delivery ratio gains over conventional AODV and close tracking of the best static lifetime configurations identified per condition. The gains are attributable to timely pruning of unstable paths and sustained retention of stable paths, which increases valid forwarding opportunities without centralized coordination.

1. Introduction

Vehicular ad hoc networks (VANETs) constitute a core enabler of connected and automated mobility, smart-city services, and contemporary traffic management [1]. In operational deployments, Roadside Units (RSUs) facilitate vehicle-to-infrastructure (V2I) communication for safety-critical notifications and traveler information, while vehicle-to-vehicle (V2V) links enhance local situational awareness. Typical RSU-supported functions include location-aware guidance (e.g., fuel stations, parking) [2,3], hazard and work-zone warnings [4,5], and targeted information delivery to vehicles within coverage [6,7].
The effectiveness of these applications depends critically on the packet delivery ratio (PDR), which is highly sensitive to mobility and local node density in realistic road networks. High speeds reduce RSU–vehicle contact duration and increase variability in link quality; sparse traffic limits relay opportunities; and congestion elevates contention, thereby increasing loss probability. Under such conditions, a routing protocol must balance the retention of routes that remain valid for a sufficient horizon against the timely removal of routes likely to become stale as topology evolves.
This paper revisits route lifetime control in AODV with an emphasis on two parameters: the Active Route Timeout (ART), which bounds the validity horizon of active entries, and the Delete Period Constant (DPC), which determines post-expiration purge latency. We formalize vehicular traffic conditions as VTC ( n , s ) , where n denotes the number of vehicles and s the speed limit (km/h).
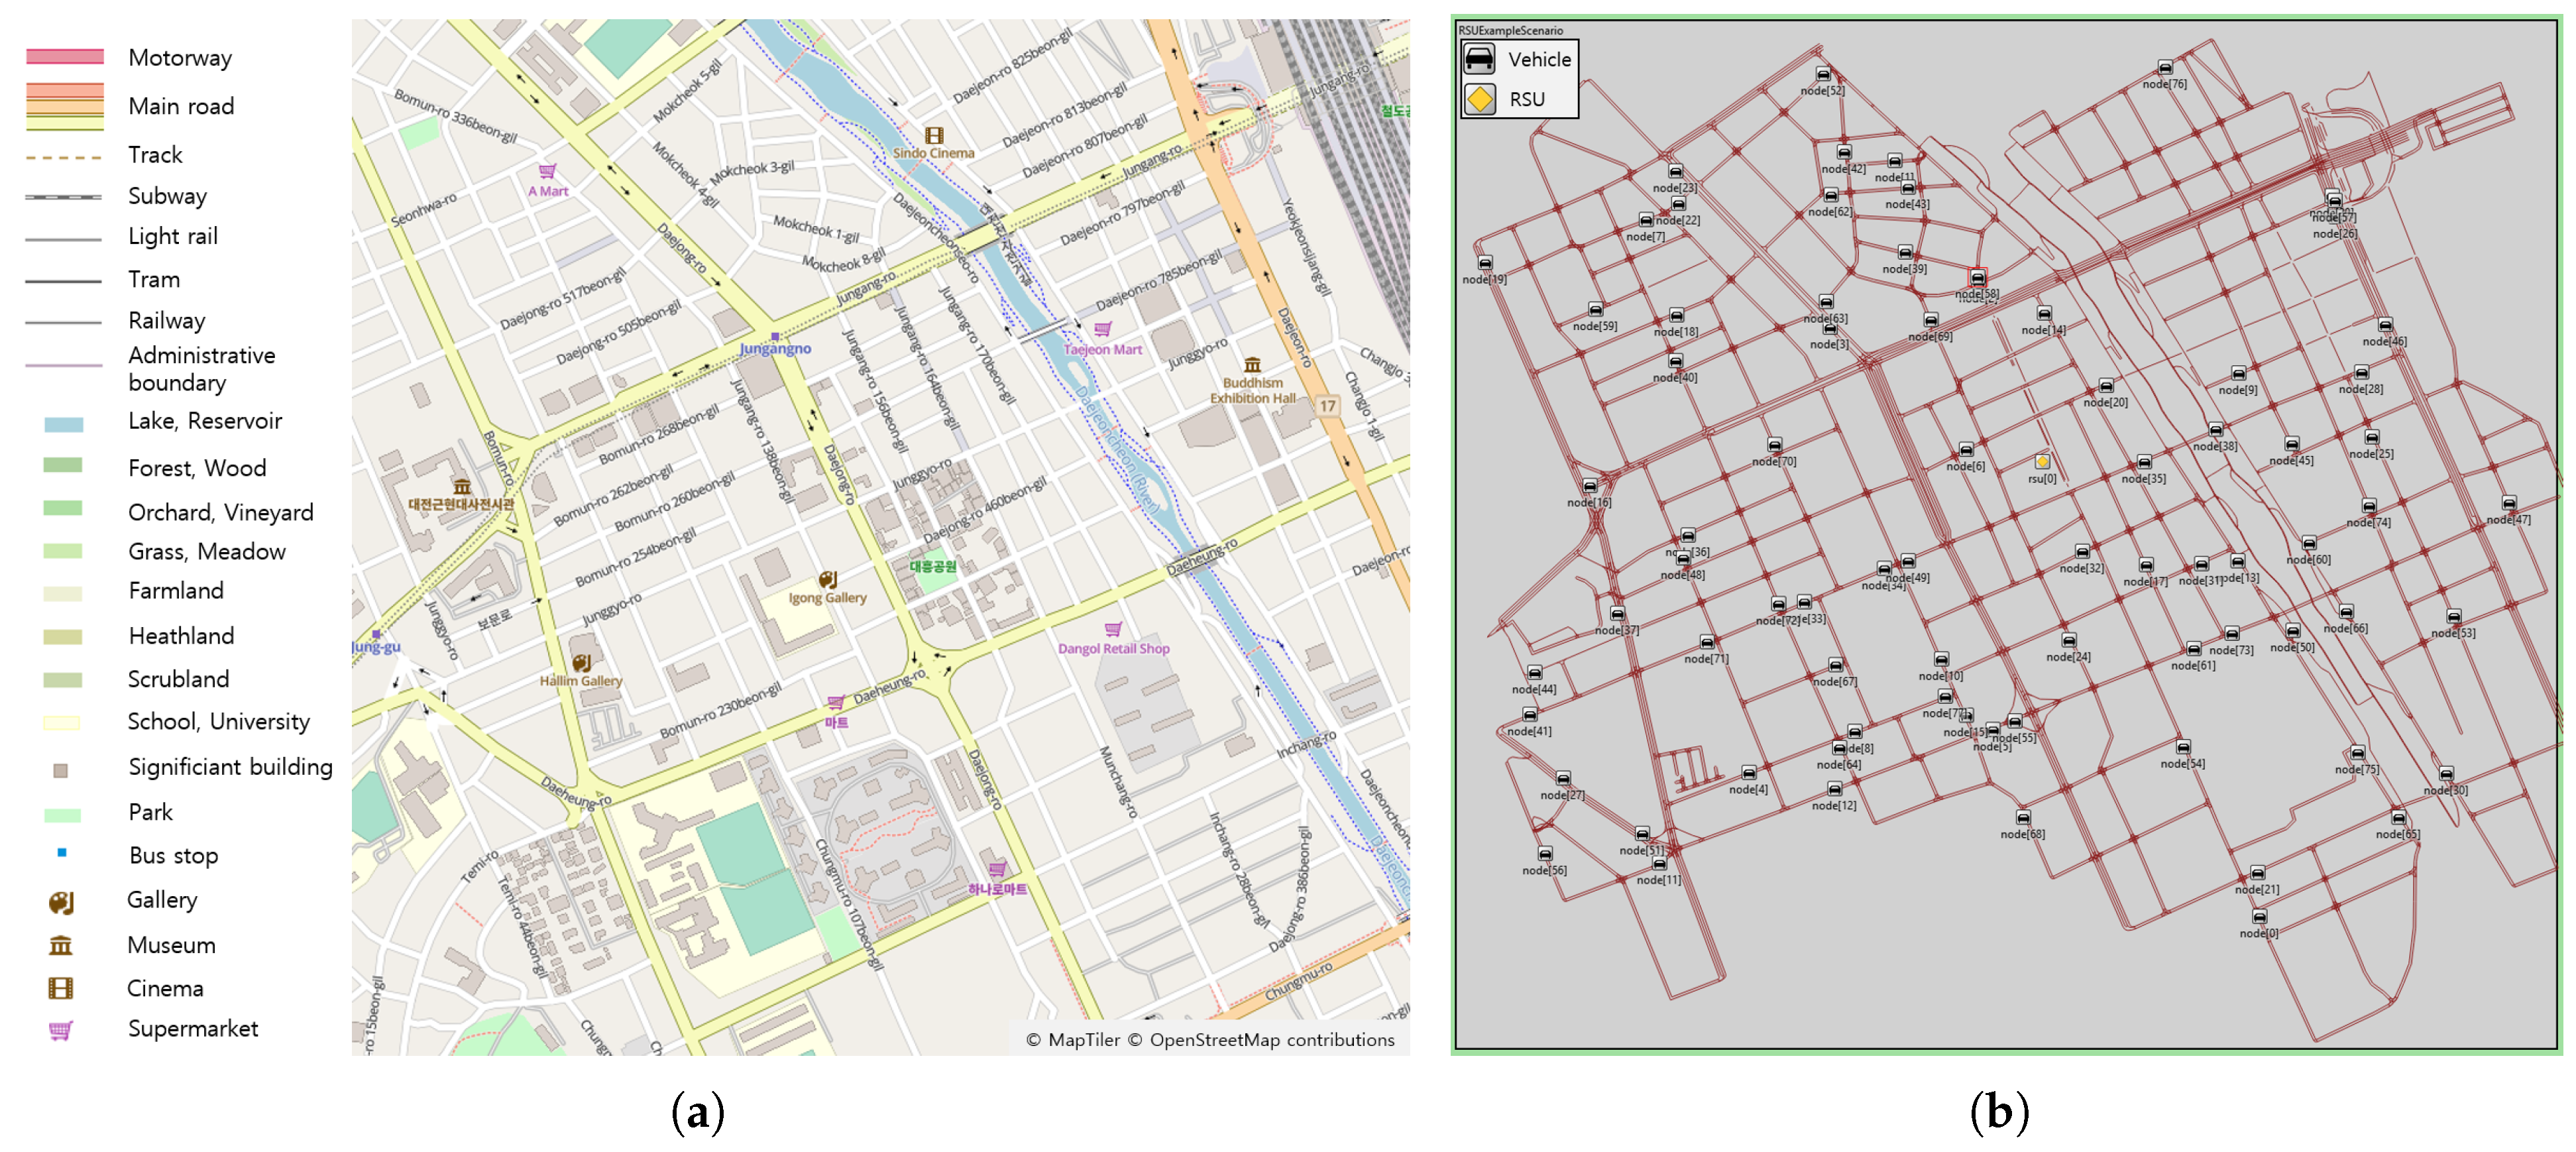
As illustrated in Figure 1, using OSM and SUMO mobility and OMNeT++/Veins/INET communication co-simulation on a realistic city map [8,9,10], we empirically observe that the ART–DPC pair maximizing PDR varies across VTC ( n , s ) settings; moreover, the performance dispersion among static pairs within a single condition is non-negligible, indicating scope for adaptive control.
Motivated by these observations, we propose a VTC-conditioned lifetime control scheme that adjusts (i.e., increases or decreases) ART and DPC online at each HELLO reception. The controller exploits information available during HELLO processing—specifically, the local neighbor count measured at the t-th HELLO and speed-variation cues—to regulate entry retention and purge aggressiveness.
Two empirical regularities distilled from our map-based analysis inform the design: (i) a transition band of neighbor density ( 15 < n t 20 ) in which the neighbor-count–speed relationship changes most rapidly across heterogeneous urban/suburban layouts, and (ii) a distribution of short-term speed-change magnitudes, sampled at the instants of HELLO reception, that is concentrated within a narrow range with a light upper tail. Accordingly, the proposed scheme is configured to be most responsive within the transition band and to apply calibrated scaling and clipping to the speed-variation term, while remaining conservative outside that regime.
We evaluate the scheme via OSM/SUMO–OMNeT++ co-simulation on a realistic road network [8,9,10]. The results show consistent PDR improvements over conventional AODV across diverse VTC ( n , s ) conditions, attributable to improved alignment between route retention and local mobility/density dynamics.
The main contributions are:
  • We provide map-based evidence that a single static ART–DPC setting is not uniformly optimal across realistic VTC ( n , s ) conditions, revealing non-trivial headroom for adaptation.
  • We design a HELLO-triggered, VTC-conditioned lifetime controller that adjusts ART and DPC using local neighbor count and speed-variation signals, permitting both increases and decreases to track evolving topology.
  • We identify a map-agnostic neighbor-density transition band and a stable distribution of speed-change magnitudes, and we incorporate these as design priors for responsiveness and stability.
  • We demonstrate PDR gains over baseline AODV in city-scale OSM/SUMO–OMNeT++ co-simulations.
The structure of this paper is organized as follows. Section 2 reviews related work. Section 3 formalizes the problem under VTC ( n , s ) and summarizes empirical findings motivating adaptation. Section 4 specifies the proposed VTC-conditioned lifetime control and its HELLO-based operation. Section 5 presents the evaluation setup and results. Section 6 concludes the paper and outlines directions for future work.

2. Related Work

Existing VANETs research has analyzed network performance across diverse environments and conducted simulations under various scenarios to develop new routing protocols. Many studies have constructed experimental environments based on simplified road models to evaluate protocol stability and efficiency under rapidly changing mobility and network topologies inherent to VANETs. While these simulation environments are useful for understanding basic protocol performance and identifying areas for improvement, they have the limitation of not sufficiently reflecting the complexity of real-world traffic situations.
For example, ref. [11] used a simple 3x3 grid-based urban road model. This model consists of intersections and two-way roads and was designed to evaluate performance in a limited scenario rather than a realistic urban environment. Experimental results show that the improved IAODV protocol achieved a 52.7% reduction in packet loss rate and a 33.9% decrease in average end-to-end delay compared to the original AODV. However, these results were obtained in a relatively simplified traffic environment, making it difficult to achieve consistent performance in actual complex urban settings.
Furthermore, the study [12] compared the performance of several protocols, including AODV and DSDV, using a simple linear road model. Experiments were conducted across four scenarios with Road Side Units (RSUs) placed at various locations, measuring each protocol’s throughput, packet loss rate, and delay. Experimental results showed that AODV’s packet transmission rate increased from 250 packets/s to 600 packets/s during the simulation period, while DSDV gradually increased from 120 packets/s to 600 packets/s. However, DSDV suffered from frequent packet loss, limiting its ability to provide stable data transmission. While this simplified experimental environment was advantageous for comparing protocol characteristics, it failed to reflect diverse urban intersections or unpredictable vehicle movement patterns, making performance differences in real-world scenarios highly likely.
Thus, while previous studies simulated VANETs using simple road environments, they failed to adequately reflect realistic traffic conditions. Subsequent research requires more realistic performance evaluation using simulation models that incorporate complex road environments and varying vehicle densities, rather than relying on simple road environments. Meanwhile, among existing studies, research actively focused on improving typical routing techniques used in VANETs, such as the AODV (Ad hoc On-demand Distance Vector) protocol. Among these, studies addressing the performance degradation and high routing overhead issues arising in large-scale networks using AODV include the following.
First, ref. [13] proposed an enhanced protocol that mitigates the shortcomings of AODV. This study increased data transmission reliability through Road Side Units (RSUs) and was designed to enable efficient data transmission even in large-scale network environments. RSUs periodically transmit traffic information and warning messages, compensating for the instability of vehicle-to-vehicle communication.
In urban areas, vehicle network connectivity frequently fluctuates. To address this, ref. [14] proposed the Adaptive Connection-Aware Routing (ACAR) technique. This protocol dynamically selects optimal routing paths by utilizing vehicle density and real-time traffic information, focusing on improving network connectivity and data delivery rates. ACAR is designed to reduce the likelihood of network disconnections during path selection by relying on statistical data from real-time vehicle density collection, enabling it to maintain high data delivery rates even in urban environments.
Ref. [15] proposed a scenario-based parameter optimization method to enhance the routing efficiency of the AODV protocol. This study suppressed excessive control message propagation and simultaneously improved the packet delivery ratio and network stability by adjusting key parameters such as ART (Active Route Timeout), Hello Interval, and MaxJitter to suit urban and highway environments. Simulation results showed that the proposed optimized AODV model achieved up to an 18% improvement in PDR and a 10–15% reduction in average delay compared to the original AODV, demonstrating that environment-adaptive parameter adjustment effectively enhances VANETs performance.
Subsequently, studies aimed at improving routing efficiency by incorporating environmental factors were proposed. Ref. [16] proposed a path selection method considering adjacent node vehicle density, improving the control overhead and transmission delay issues of the AODV protocol. The proposed Density-based AODV (CND-AODV) calculates the number of neighboring nodes within each node’s communication range and utilizes this as a metric for path selection, prioritizing paths with higher average node density. Simulation results show that the proposed method reduces control message overhead compared to conventional AODV in high vehicle density network environments while improving PDR, and also shortens the average transmission delay.
Meanwhile, ref. [17] proposed the Junction-Based Routing (JBR) technique to enhance routing path efficiency by considering the junction-centric urban road structure. This method applies the Intelligent Water Drops (IWD) algorithm to comprehensively evaluate factors such as road segment connection duration, transmission delay, and node density, and is designed to select routes with high stability in junction segments. Simulation results showed that the proposed technique improved PDR by 2.55% to a maximum of 33.47% compared to existing JBR, GPSR, and AODV, while reducing both average delay and control overhead.
Ref. [18] proposed a reliability-based routing technique (AODV-R) that selects paths based on the sustainability of inter-vehicle communication links. The proposed method probabilistically calculates the reliability of each link using vehicle location, movement direction, and speed information. It defines the reliability value of the entire path as the product of the link reliability values at each hop and selects the path with the highest value. OMNeT++-based simulation results show that the proposed AODV-R achieves approximately a 15% improvement in PDR compared to the existing AODV, while reducing the number of link disconnections by approximately 40%.
Finally, Refs. [19,20] proposed methods to minimize path disruption and enhance data transmission efficiency by predicting link and route lifetimes using relative speed and distance information between vehicles. Ref. [19]’s AODV-LP (Route Lifetime Prediction) calculates link lifetime based on relative velocity ( Δ V ) and distance (D) by including the vehicle’s velocity vector and position coordinates in RREQ messages, then synthesizes this to compute route lifetime. In contrast, ref. [20] extends the lifetime prediction concept, proposing a model that simultaneously predicts both route maintenance time and end-to-end delay. This technique demonstrated efficient path selection even in high-speed mobile environments by comprehensively considering each link’s duration and transmission delay factors. Both studies confirmed the effectiveness of reducing path rediscovery frequency compared to the existing AODV, while improving packet loss rate and average delay time.
One major issue in VANETs is the degradation of data transmission quality due to frequent network disconnections. Previous studies have proposed various connectivity models and transmission quality evaluation techniques to address this problem. Research [13] enhanced transmission quality using RSUs, while the “ACAR” [14] study developed a connectivity model utilizing traffic density and vehicle speed data. ACAR’s transmission quality model was designed to select the path with the highest transmission quality during routing, considering node-to-node interference and transmission collisions.
Among existing studies on the AODV protocol, research has analyzed the impact of key parameters for managing routing table entries—My Route Timeout (MRT), Active Route Timeout (ART), and Delete Period Constant (DPC)—on VANETs performance.
My Route Timeout (MRT) is the default validity period during which a route, once established in the routing table, remains active even if it is not currently in use. Therefore, a short MRT value may cause the established route to expire before data transmission begins, making it difficult to deliver packets to the destination.
Active Route Timeout (ART) is a factor determining the lifetime of a routing entry, similar to MRT. Here, the lifeTime of a routing entry is a time value indicating how long the route remains valid, and ART serves as the criterion for renewing this lifeTime. That is, whenever the route is used—either through data transmission or control messages (like HELLO or RREP)—the lifeTime is extended by the ART value. If the route remains unused for a certain period, it expires.
In other words, MRT is the initial guaranteed lifetime when a route is first created, while ART focuses on whether the route has been used recently. Finally, the Delete Period Constant (DPC) determines the waiting period before expired routes are finally removed from the routing table. During this period, nodes propagate the invalidation of the route via RERR (Routing Error) messages. Nodes receiving RERR can then begin searching for new routes.
First, ref. [21] analyzed the impact of ART and DPC values on PDR and throughput in AODV. Simulations conducted in an environment with 50 nodes in a network measuring 1000 m horizontally and vertically revealed that PDR performance varied by 1–2% depending on the ART and DPC values. However, it has limitations: the observed performance difference in PDR based on ART and DPC values was not significant, and the study only examined the impact of a narrow range of ART and DPC values within a constrained environment with limited key environmental factors like network scale and number of nodes.
Ref. [22] is a study that quantitatively analyzes how the performance of the AODV routing protocol varies with changes in the Active Route Timeout (ART) and Delete Period Constant (DPC). This study expanded the parameter range proposed in [21], performing simulations on combinations of ART from 0.5 to 10 and DPC from 3 to 7. The experimental environment consisted of a network with 50 nodes uniformly distributed within a 1000 m × 1000 m area. Analysis results showed that both the packet delivery ratio (PDR) and throughput reached their maximum values at the combination of ART = 2.5 and DPC = 5.
Another research paper, ref. [23], analyzed the impact of MRT and ART values in the AODV-ETX protocol. Here, AODV-ETX is an extended version of AODV that uses ETX (Expected Transmission Count), which represents the average number of transmissions required to successfully deliver a packet, as the path metric instead of hop count. This study evaluated the performance of the AODV-ETX protocol with MRT and ART values ranging from approximately 1 to 100 s, depending on the node’s mobility level. Simulation results showed that in a stationary environment, optimal throughput was achieved when MRT and ART were set between 10 and 15 s. Beyond 60 s, throughput performance remained stable, neither improving nor deteriorating. Furthermore, in environments with randomly moving nodes, throughput performance was observed to stabilize without improvement or deterioration when MRT and ART were set to approximately 80 s or higher. However, controlling the MRT and ART values at high levels of node mobility improved PDR performance by up to approximately 20%. Therefore, it can be concluded that appropriately controlling MRT and ART values according to the level of node mobility can be expected to improve network performance. However, this paper has limitations: it did not observe the effect of the number of nodes, making it difficult to confirm the impact of vehicle density. Furthermore, it set the maximum node speed—a key factor determining node mobility—to 1.38 m/s, the average pedestrian speed, making it difficult to verify the effect of MRT and ART values in vehicle networks requiring higher speeds.
Beyond studies that merely examine the impact of MRT and ART in the AODV routing protocol on network performance, ref. [24] represents research aiming to enhance network performance by directly controlling ART. The technique proposed in this paper, Active Route Timeout AODV (ART-AODV), dynamically controls the ART value based on fuzzy logic, utilizing the number of hops to the destination node, the node’s speed, and the remaining battery energy. Simulation results in an environment with a fixed number of nodes showed that ART-AODV successfully increased the number of received packets by approximately 1.4 times compared to AODV.
Meanwhile, recent research has expanded beyond AODV-centric routing techniques to enhance the overall efficiency and stability of VANETs. Ref. [25] proposes a method to increase the success rate of computational offloading between vehicles based on a link lifetime prediction model. Ref. [26] minimizes routing delay and control overhead by applying a software-defined network (SDN) concept to the vehicle network architecture. Furthermore, refs. [27,28] quantitatively analyzed the impact of physical layer and MAC layer improvements on VANETs communication quality by comparing IEEE 802.11p [29] with the next-generation standard IEEE 802.11bd [30].
The key differentiators between the existing studies referenced in this section and the present research are as follows. Prior work has largely been confined to observing the impact of AODV parameters—ART, MRT, and DPC—on network performance, with some reports (based on limited experiments) suggesting pessimistically that the effects of ART or DPC control are insignificant. In contrast, this study designs a proposed scheme that dynamically controls ART and DPC, and confirms Packet Delivery Ratio (PDR) improvements of up to 20%. Furthermore, whereas prior studies insufficiently examined the influence of node density or speed on performance (e.g., fixed small node counts, pedestrian-level maximum speeds), the present study employs OSM and SUMO to reflect actual urban road structures and vehicular movement characteristics. OSM reproduces the city road environment, while SUMO simulates vehicle movement upon it; notably, SUMO can realize realistic traffic flow by incorporating factors such as traffic signals and headway within the specified maximum speed range.

3. Problem Statement

This section formalizes the problem and motivates the need for VTC-conditioned lifetime control in AODV. Section 3.1 introduces the background, clarifies the lifetime parameters (ART and DPC), and defines the Vehicular Traffic Condition (VTC). Section 3.2 then presents map-based simulation evidence on the Daejeon road network showing that the PDR-maximizing ART–DPC pair alternates across VTCs, indicating that a single static pair is not uniformly robust. For clarity, this section concludes with a concise given–to–find summary that states the assumptions and the optimization target used in our subsequent development.

3.1. Background, Definitions, and Prior Findings

In on-demand routing protocols such as AODV, spatio-temporal variations in vehicle speed and local node density cause rapid topology changes, thereby invalidating routing-table entries before they can be effectively exploited.
This volatility motivates explicit management of the lifetime of routing-table entries. In AODV, the Active Route Timeout (ART) and the Delete Period Constant (DPC) determine, respectively, the validity period of an active route and the waiting period before an expired route is finally purged.
Here, ART specifies the time threshold during which a route is considered valid, whereas DPC is a coefficient used to compute the deletion waiting time once a route has expired. In common implementations of AODV, this waiting time is taken to be proportional to DPC and is scaled by a reference timescale given by whichever is larger between the Hello Interval and the ART.
Meanwhile, studies [21,22] have reported that replacing AODV’s default ART–DPC pair with an alternative static combination can improve performance. In particular, ref. [22] observed that packet delivery ratio (PDR) is maximized around ( ART , DPC ) = ( 2.5 , 5 ) under a fixed network configuration.
However, those results rely on a simple mobility model (Random Waypoint) and a fixed scenario configuration, and they provide limited uncertainty reporting across vehicle speed and vehicle density conditions, random seeds, or different city maps. Consequently, whether a single static combination remains uniformly optimal under realistic map- and traffic-induced condition changes requires further verification.
To rigorously assess this premise under a realistic road environment, we construct a road-traffic and VANET co-simulation by importing an OpenStreetMap (OSM) network into SUMO and coupling SUMO with OMNeT++ via TraCI through Veins, with protocol stacks provided by INET. All experiments use the Daejeon, Korea area as the target map (shown as Figure 1 in Section 1).
We specify the main experimental variables using the Vehicular Traffic Condition VTC ( n , s ) , where n denotes the number of vehicles and s the maximum vehicle speed (km/h). In this study, we evaluate nine settings with n { 200 , 300 , 400 } and s { 10 , 20 , 30 } km / h . For each VTC ( n , s ) , we sweep static ( ART , DPC ) pairs and report PDR outcomes in the next Section 3.2.

3.2. Empirical Evidence on the Limitations of Static ART and DPC Pairs Under Map-Based VTCs

As summarized in Table 1, the (ART, DPC) pair ( t art , t dpc ) attaining the highest PDR varies across map-based vehicular traffic conditions VTC ( n , s ) . For example, VTC ( 200 , 10 ) favors ( t art , t dpc ) = ( 2.0 , 6 ) with 75.4 % ; VTC ( 300 , 20 ) admits ( t art , t dpc ) = ( 2.5 , 5 ) and ( t art , t dpc ) = ( 3.0 , 5 ) as joint maxima with 80.6 % ; whereas VTC ( 400 , 20 ) favors ( t art , t dpc ) = ( 2.0 , 4 ) with 81.4 % .
Hence, within the evaluated map (Figure 1) and across the nine traffic conditions VTC ( n , s ) , no single static setting (e.g., ( t art , t dpc ) = ( 2.5 , 5 ) ) is uniformly optimal. This is consistent with the maximum-occurrence counts F PDR max , where ( t art , t dpc ) = ( 2.0 , 6 ) appears three times and ( t art , t dpc ) = ( 3.0 , 5 ) twice (others 1 ) across the nine VTC ( n , s ) .
For each vehicular traffic condition VTC ( n , s ) , we define Δ PDR n , s max as the difference (in percentage points) between the largest and the smallest value of PDR n , s observed over all evaluated static timeout pairs ( t art , t dpc ) S t art , t dpc .
Across the nine VTC ( n , s ) settings, we also report F PDR max and F PDR min , the numbers of times a given pair ( t art , t dpc ) attains, respectively, the row-wise maximum and minimum PDR (ties counted for all tied pairs).
Table 1 further shows that the pair attaining the minimum PDR is likewise VTC ( n , s ) -dependent: ( t art , t dpc ) = ( 3.0 , 4 ) most frequently attains the minimum with F PDR min = 4 , and ( t art , t dpc ) = ( 3.0 , 6 ) follows with F PDR min = 2 .
Notably, a single pair can be maximal in one VTC ( n , s ) yet minimal in another; e.g., ( t art , t dpc ) = ( 3.0 , 5 ) is maximal at VTC ( 300 , 20 ) (80.6% PDR) but minimal at VTC ( 200 , 10 ) (72.3% PDR).
The spreads Δ PDR n , s max are often substantive—12.9 pp at VTC ( 400 , 20 ) , 10.1 pp at VTC ( 300 , 30 ) , and 10.0 pp at VTC ( 400 , 30 ) —indicating meaningful headroom for VTC ( n , s ) -aware tuning of ( t art , t dpc ) .
Conversely, small spreads (e.g., 3.0 pp at VTC ( 200 , 10 ) , 5.2 pp at VTC ( 400 , 10 ) ) arise under relatively stable connectivity (low speeds and/or high effective link persistence), where different static settings yield similar PDR; thus, the gain from dynamic control is expected to be smaller in such cases. Overall, these findings motivate differentiated control of ( t art , t dpc ) conditioned on VTC ( n , s ) .
Table 2 summarizes factor–wise (marginal) PDR sensitivity to ART and DPC; these results serve as the basis for our subsequent argument regarding the necessity of joint control of ART and DPC. To isolate factor-wise effects, we average PDR across one parameter while sweeping the other. When DPC is marginalized (ART-only view), several VTC ( n , s ) settings show modest yet non-negligible spreads; for example, Δ PDR n , s max = 5.07  pp at VTC(400,20) ( 75.6 % 70.5 % across t art { 2 , 2.5 , 3 } ) and 3.57  pp at VTC(200,30) ( 61.9 % 65.5 % ), while other settings appear nearly insensitive to ART alone (e.g., 0.58  pp at VTC(300,30) and 0.68  pp at VTC(200,20)).
Symmetrically, when ART is marginalized (DPC-only view), the spreads are often larger: 8.55  pp at VTC(300,30) ( 58.6 % 67.1 % ), 6.09  pp at VTC(300,20) ( 73.4 % 79.5 % ), 6.04  pp at VTC(400,20), and 5.51  pp at VTC(400,30). Near-flat cases also exist for DPC alone (e.g., 0.82  pp at VTC(200,30) and 0.97  pp at VTC(200,10)). These results indicate that the dominant contributor to PDR can shift between ART and DPC depending on the vehicular traffic condition.
Beyond marginal effects, the full joint matrix in Table 1 reveals up to 12.9  pp of row-wise spread Δ PDR n , s max and multiple instances in which the ART value that maximizes PDR depends on the chosen DPC (and vice versa). Notably, although the marginal averages might suggest ( t art , t dpc ) = ( 2.0 , 5 ) as a generally favorable setting, the joint evaluation shows that this pair attains the maximum PDR in only one VTC ( n , s ) ; other conditions favor ( 2.0 , 6 ) , ( 3.0 , 5 ) , or ( 2.0 , 4 ) . Thus, marginal preferences do not translate into joint optimality.
Conceptually, this variability arises because the effective link lifetime under AODV is determined by the combination of the active-route validity horizon t art and the post-expiration purge latency governed by t dpc . Their effects compound along mobility-induced link breakages and route rediscovery cycles, so controlling only one parameter cannot capture the operational trade-offs. Consequently, co-tuning ( t art , t dpc ) in a VTC ( n , s ) -aware manner is warranted, while acknowledging that in comparatively stable conditions (e.g., VTC(200,10), VTC(400,10)) with small marginal spreads the benefit of adaptation is correspondingly limited.

3.3. Problem Summary

For clarity, we summarize the problem statement in a given–to–find form: we first describe the assumptions, variables, and empirical premises, and then articulate the objective that guides the subsequent design and evaluation.
We first state what is given for the problem definition. We consider a map-based VANET co-simulation on the Daejeon, Korea road network (OSM and SUMO, coupled with OMNeT++/Veins/INET). The vehicular traffic condition VTC ( n , s ) denotes the pair of the number of vehicles n and the maximum speed s (km/h); nine settings are used with n { 200 ,   300 ,   400 } and s { 10 ,   20 ,   30 } . The route-entry lifetime is controlled by two parameters: the active-route validity horizon t art and the post-expiration purge-latency factor t dpc . Performance is measured by the packet delivery ratio PDR n , s ( t art , t dpc ) .
Empirical evidence in Table 1 shows that the VTC ( n , s ) -specific PDR maximizer alternates across ( t art , t dpc ) , that minimum-PDR pairs likewise vary by VTC ( n , s ) and can coincide with maximizers under different conditions, and that row-wise spreads Δ PDR n , s max reach up to 12.9 pp. Marginal analyses in Table 2 further indicate that the dominant contributor to PDR can shift between t art and t dpc depending on VTC ( n , s ) , and that marginally favorable settings (e.g., simple averaging suggests ( 2.0 , 5 ) ) do not guarantee joint optimality in the full ( t art , t dpc ) space.
Based on this, what the proposed method must find can be summarized as follows. The objective is to maximize the network-wide average PDR by controlling, at each node, the pair ( t art , t dpc ) in a VTC ( n , s ) -aware manner so that the achieved performance meets or closely approaches the per- VTC ( n , s ) maximum PDR attained by the best static pairs in Table 1. Equivalently, we seek a selection rule
ϕ : VTC ( n , s ) ( t art , t dpc )
that, on the evaluated map and traffic settings, maximizes PDR n , s ( t art , t dpc ) while avoiding VTC ( n , s ) -dependent low-PDR pairs identified in Table 1.

4. A Vehicular Traffic Condition-Based Routing Lifetime Control Scheme

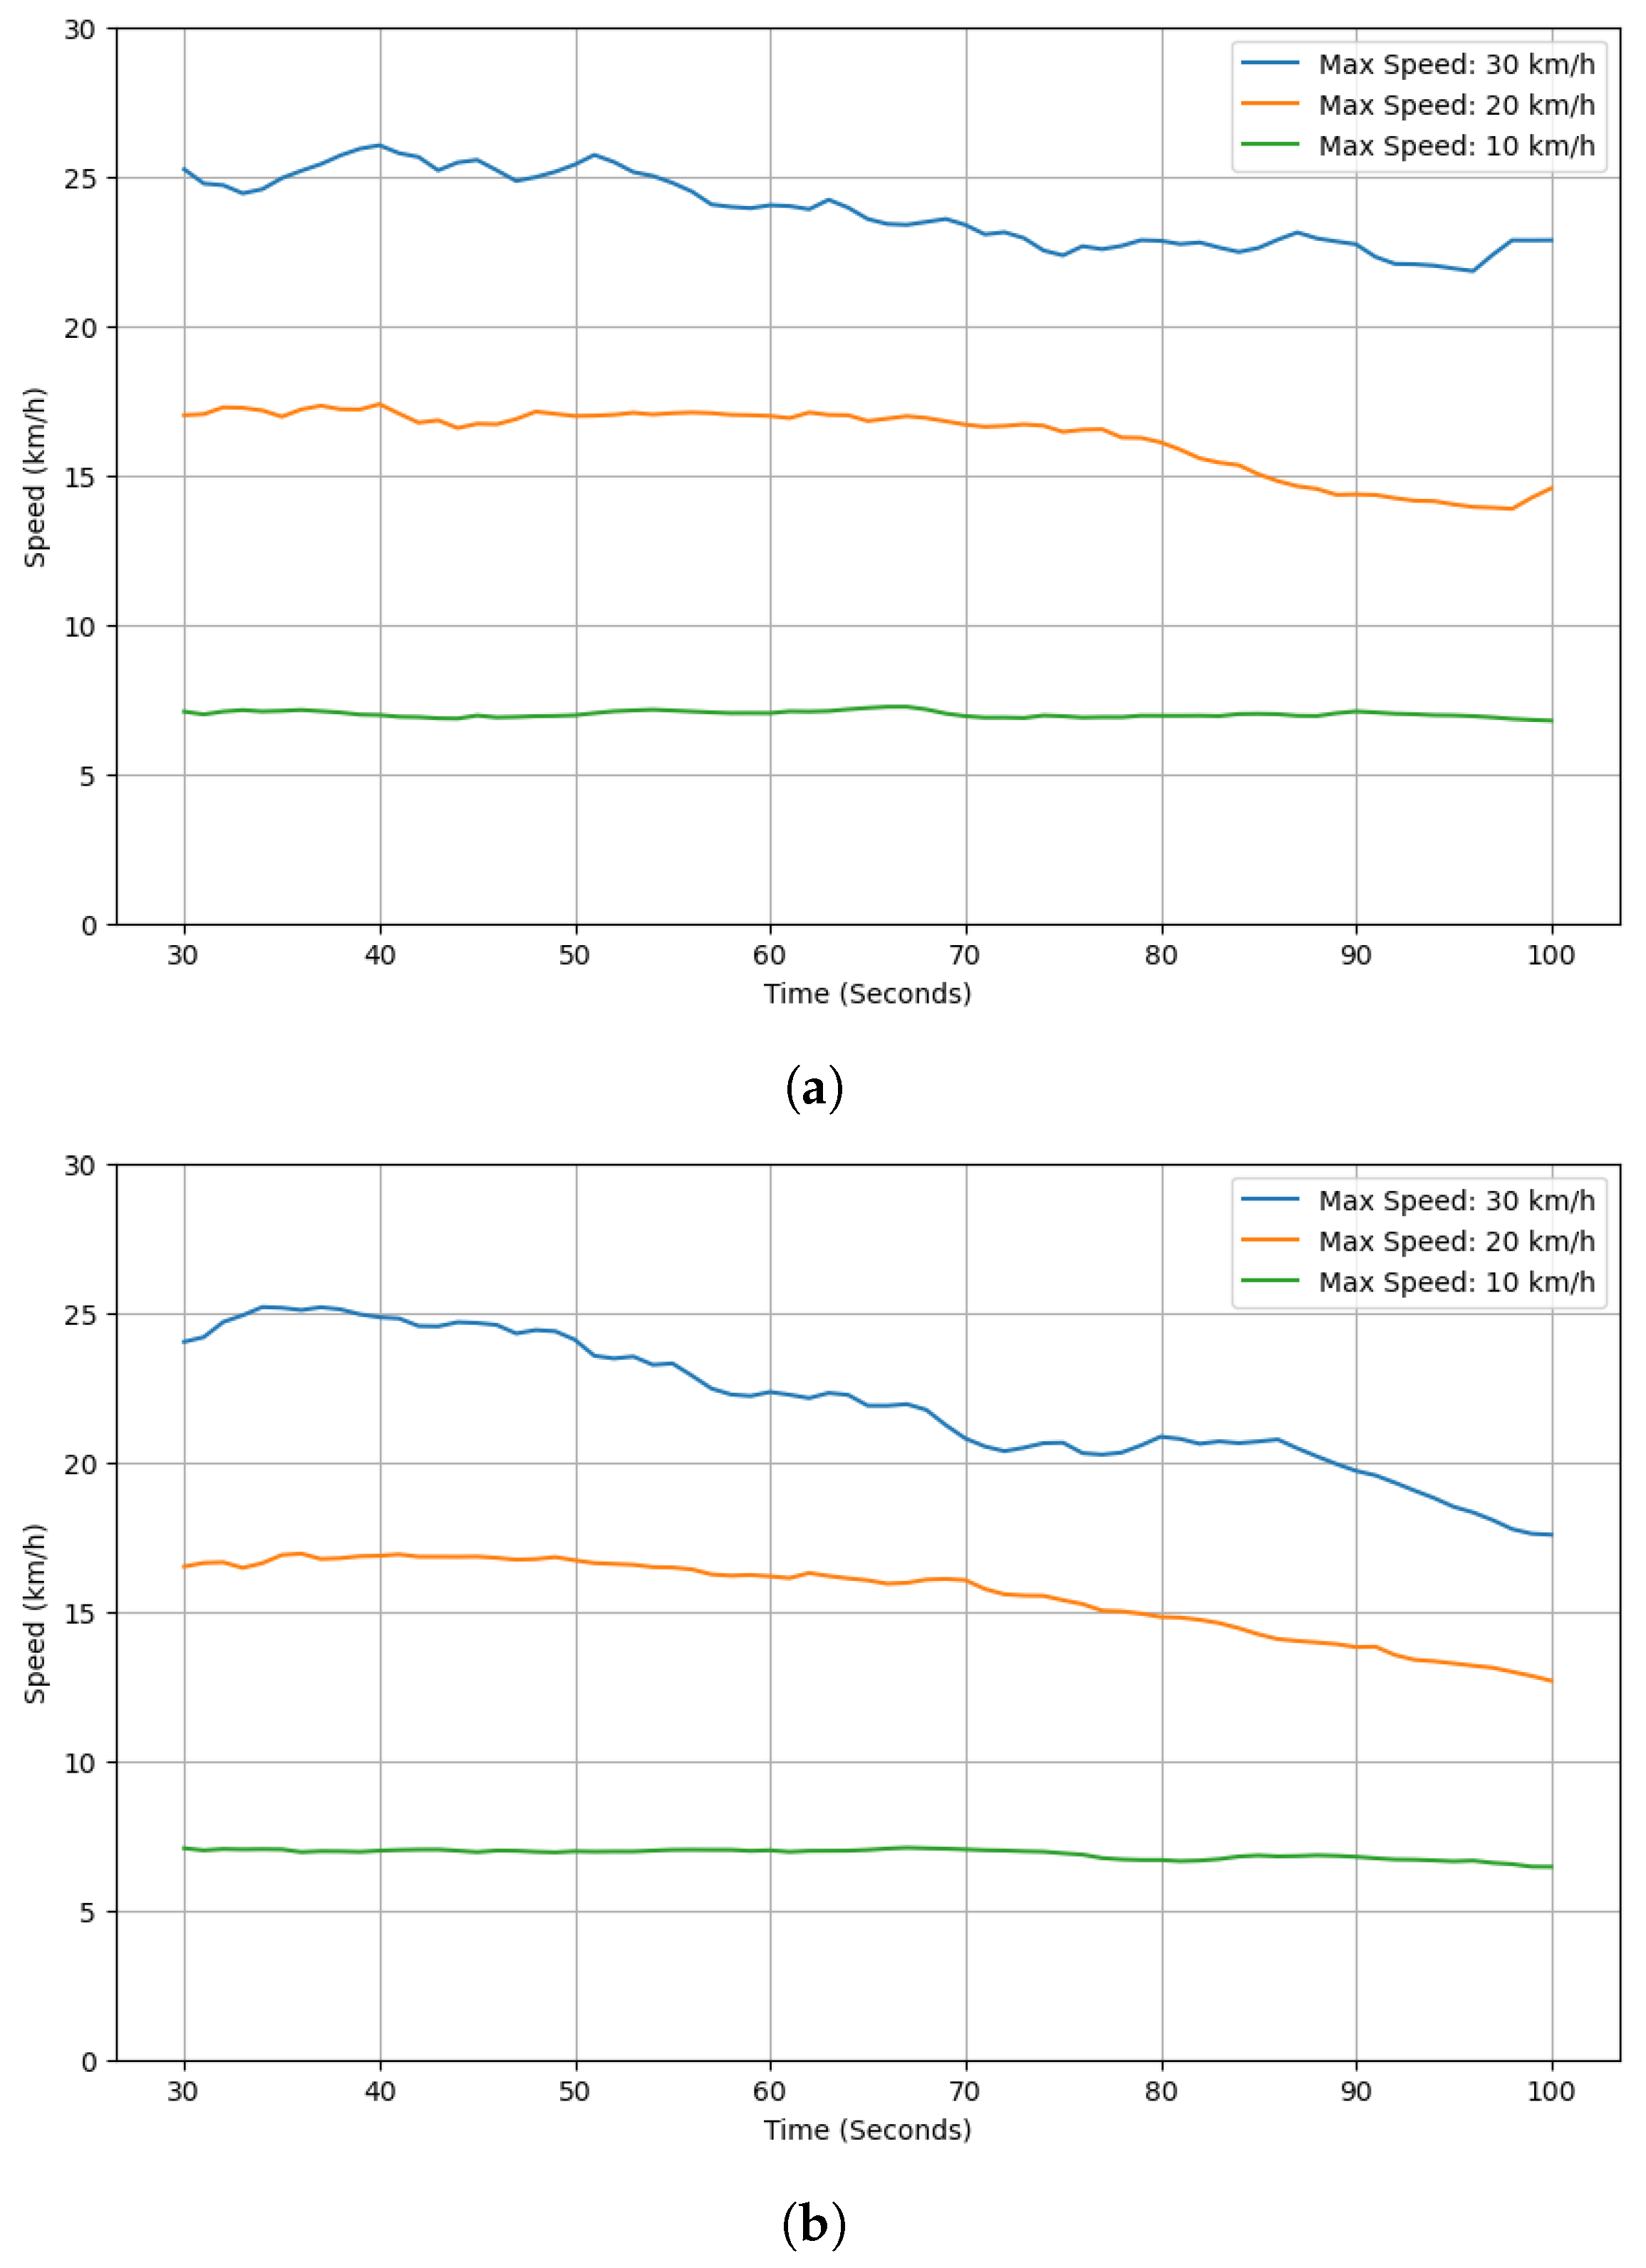
This section first summarizes empirical traffic characteristics observed on OSM-derived SUMO maps—time-varying average vehicle speed under fixed ( n , s ) (Figure 2), a common transition band where the neighbor-count–speed relation changes most rapidly ( 15 < n t 20 ) across four distinct road layouts (Figure 3 and Figure 4), and the HELLO-triggered distribution of speed-change magnitudes Δ s t (Figure 5)—and then uses these observations as design rationale for a VTC-conditioned lifetime controller (i.e., proposed scheme).
Grounded in these findings, the proposed scheme (Section 4.2) updates ( ART , DPC ) online at each HELLO reception by adjusting (both increasing and decreasing) route lifetimes according to local neighbor count n t (measured at the t-th HELLO), instantaneous speed variation, and density cues, with heightened responsiveness in the 15 < n t 20 band and conservative behavior outside it. This linkage ensures that parameter updates reflect realistic, map-agnostic mobility patterns rather than nominal speed limits, improving robustness across heterogeneous street layouts.

4.1. Design Rationale of the Proposed Scheme Based on Vehicular Traffic Conditions

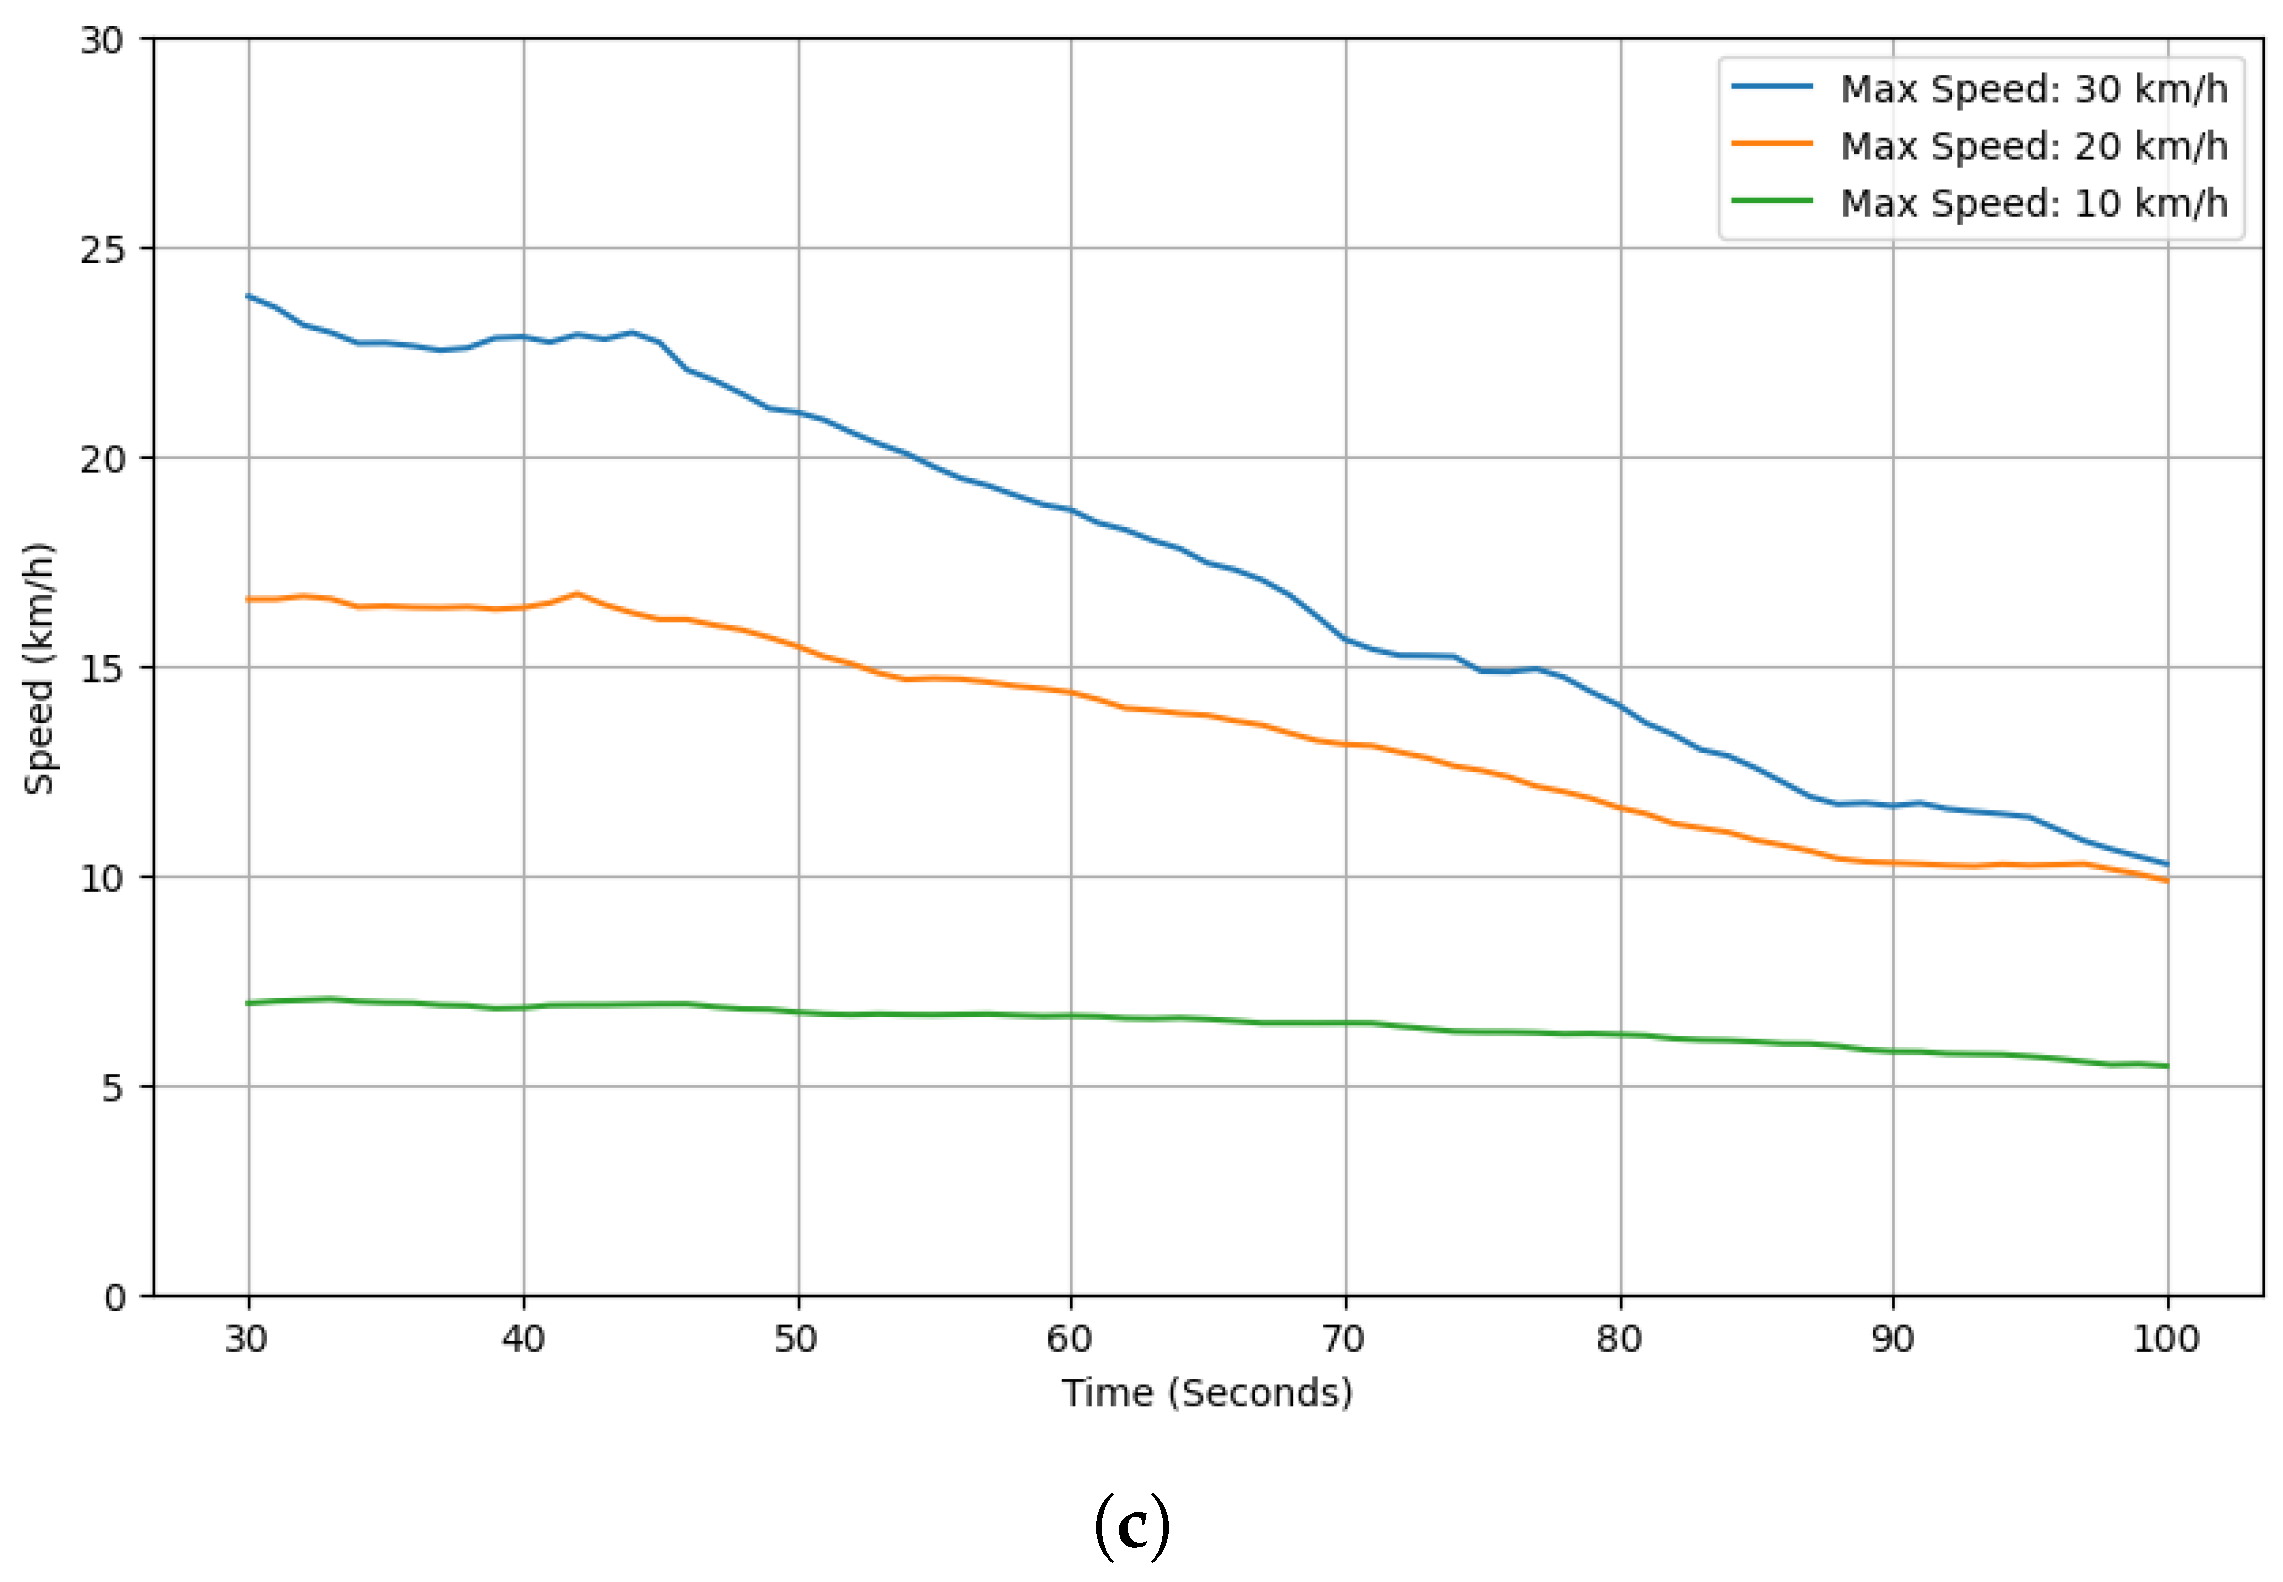
We use an OSM and SUMO simulator to generate map-based traffic with a fixed total number of vehicle nodes n { 200 ,   300 ,   400 } and a per-scenario speed limit s { 10 ,   20 ,   30 } km / h . Even with a fixed s, the average speed of vehicle nodes changes over time because vehicles slow down at intersections, short stop-and-go waves appear, and groups of vehicles naturally bunch up and later spread out. Figure 2 summarizes how this average speed evolves over time for the three densities.
Figure 2 reveals three consistent patterns. First, at the lowest density ( n = 200 ), the average speed is relatively stable with only a mild downward drift when s is 30 or 20 km/h, whereas the 10 km/h case remains nearly flat. Second, at a medium density ( n = 300 ), all curves show a clearer decline—approximately linear after about 50 s—indicating that congestion gradually builds up even without external incidents. Third, at the highest density ( n = 400 ), the decline becomes pronounced and monotonic across all s settings, which indicates sustained pressure on road capacity; a larger s merely shifts the curve upward but does not eliminate the downward trend.
At the beginning of each SUMO run, the network is empty and vehicles are injected over time until the target fleet size is reached. To exclude this transient ramp-up phase from our analysis, we control the experiment so that RSU transmissions and routing measurements start only after the number of active vehicles stabilizes at the configured n. Consequently, the warm-up interval (vehicle injection period) is excluded from all statistics and protocol updates, and all speed trajectories in Figure 2 as well as subsequent evaluation results are taken after the fleet size reaches its steady operating level.
These observations establish that the vehicular traffic condition (VTC), parameterized by ( n , s ) , produces time-varying effective mobility; the network undergoes a slow drift in the average speed of vehicle nodes as density increases. As a result, any routing-lifetime configuration that remains static over time (for example, a fixed pair ( ART , DPC ) ) can become mismatched as the average speed evolves. This motivates a VTC-conditioned, online lifetime controller that adapts ( ART , DPC ) to the evolving speed profile rather than to the nominal speed limit s alone.
To check whether the relationship between local neighbor density and motion is map–agnostic, we examined four OSM-derived SUMO road layouts. Figure 3 presents four OSM-derived road layouts: two urban (A, B) and two suburban (C, D), with clearly different intersection densities and block structures. We use these layouts to examine whether the relationship between the neighbor count n t and the average vehicle speed generalizes across heterogeneous street patterns. Here, n t denotes the number of neighbors observed upon reception of the t-th HELLO packet.
For each layout we measured, after the warm-up phase, how the average speed of neighbor vehicle nodes (i.e., average vehicle speed) varies as a function of the current number of neighbors n t around a node. The results are shown in Figure 4, where the blue curve denotes the mean speed for each n t and the red bars indicate the speed drop between adjacent n t intervals.
Across all four maps, a common pattern emerges. First, when n t 15 , the mean speed decreases but the per-interval drop is relatively small and irregular. Second, in the transition band 15 < n t 20 (vertical dashed markers in Figure 4), the speed reduction per n t step is largest, i.e., the average speed changes most rapidly as neighbor density increases. Third, for n t > 20 , the curve settles into a slower, almost monotonic decline with smaller incremental drops. This pattern is observed not only on the urban map used in this study (Figure 4a; its base map is Figure 3a) but also on three different maps (Figure 4b–d) with distinct intersection layouts and block structures, indicating that the 15–20 band is consistently where mobility changes fastest.
These observations directly inform the design of the proposed scheme. Because routing-table lifetimes should react to how quickly the local topology changes, we set the update rule to be most responsive when 15 < n t 20 , adjusting ( ART , DPC ) more aggressively in this band to track fast-changing neighborhoods.
Importantly, n t does not always move in one direction; therefore the controller permits both decreases and increases of ( ART , DPC ) depending on the local trend—shortening when the neighborhood changes rapidly and extending when it relaxes.
Outside this band, updates remain more conservative: when n t 15 we avoid excessive changes, and when n t > 20 we apply gradual adjustments to prevent overreaction in already dense conditions. Thus the choice is grounded in evidence that the 15–20 region marks the steepest mobility variation across diverse road environments, and the controller controls lifetimes rather than merely shortening them.
Figure 5 presents, for four maps (A–D), the cumulative distribution function (CDF) of the speed-change magnitude Δ s t | s t c s t p | , where s t c denotes the current speed reported in a HELLO message at time t and s t p is the speed reported in the previous HELLO from the same node. Thus, Δ s t is computed at each HELLO reception with interval Δ t H (i.e., not strictly every second), after excluding zero-speed samples. Across Maps A–D, most samples lie within [ 0 ,   4 ] km / h , while the upper tail extends to about 5   km / h . The similar CDF shapes across different street layouts indicate that a single set of controller parameters can be applied robustly across maps.

4.2. Basic Operation of VTC-Based AODV Scheme

Our design choices are grounded in the empirical patterns in Section 4.1: the steep mobility change observed in the 15 < n t 20 band (Figure 4) and the distribution of speed-change magnitudes across maps (Figure 5).
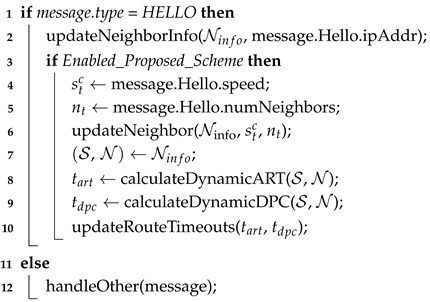
Algorithm 1 represents the procedure by which the VTC-Based AODV operates upon receiving a HELLO message in the existing AODV protocol, expressed in pseudocode form. When a node receives a HELLO message from the AODV protocol, it first calls updateNeighborInfo( N i n f o , message.Hello.ipAddr) to update the routing table N i n f o . Here, the second argument, message.Hello.ipAddr, denotes the IP address of the node that sent the HELLO message.
Algorithm 1: VTC-Based AODV: Hello-Based t a r t and t d p c Dynamic Adjustment
Applsci 15 12017 i001
When the VTC-Based AODV is enabled, the HELLO message additionally includes the sender vehicle’s speed ( s t c ) and the number of neighboring nodes ( n t ). The receiving node extracts this information and then calls updateNeighbor( N i n f o , s t c , n t ) to update the vehicle speed and neighbor count information. The vehicle speed information is stored together with its previous value to enable computation of the vehicle speed variation Δ s in subsequent procedures.
In the standard AODV protocol, HELLO messages are primarily used to detect the presence of neighboring nodes and update the routing table. While conventional AODV employs HELLO messages solely for neighbor detection and route activation when no new route information is required, the VTC-Based AODV performs additional procedures to update t a r t (Active Route Timeout) and t d p c (Delete Period Constant).
Line 7 in Algorithm 1 extracts the vehicle speed list ( S ) and the neighbor count list ( N ) of surrounding nodes from the routing table. Lines 8–9 correspond to the process of using these as input parameters for calculateDynamicART() and calculateDynamicDPC() to compute the values of t a r t and t d p c . The computed t a r t and t d p c values are then applied to the routing table in line 10 and are subsequently utilized for route maintenance and management.
The detailed procedures of calculateDynamicART() and calculateDynamicDPC() are described in detail beginning from Equation (1) in the following section.
The Active Route Timeout (ART) is the key parameter controlled in the VTC-Based AODV, determining the maximum duration for which a route remains valid. During this period, the route is considered active in the routing table. When the number of neighboring nodes n t is small, vehicles are spaced farther apart and relative movement is minimal, reducing the likelihood of route disruption. In such conditions, a longer ART is assigned to minimize unnecessary route rediscovery and maintain stable paths. Conversely, as n t increases, frequent relative movements and directional changes among adjacent vehicles increase the risk of route disruption. This effect is particularly prominent in urban and intersection-dense environments, where frequent direction changes and vehicle speed variations cause rapid topology fluctuations. In these cases, a shorter ART is assigned to prevent the persistence of disrupted routes, allowing rapid updates and timely establishment of new routes.
The ART duration t a r t is calculated as follows.
t a r t = clip [ t a r t min , t a r t max ] t a r t , 0 · f a d j u s t
Next, the Delete Period Constant (DPC) is a core parameter of AODV that is controlled alongside ART in the VTC-Based AODV. It determines the duration for which a route remains in the routing table after the ART period expires, before being removed. In other words, during the DPC period, routes whose ART has expired are not deleted immediately but are retained for a defined time interval.
When vehicle density is low ( n t 15 ), the spacing between vehicles is wide, and topology changes occur infrequently. In such scenarios, re-routing to the same destination may occur at short intervals. If the previously established route is deleted immediately, unnecessary route discovery procedures could be repeatedly triggered. Therefore, setting a longer DPC allows expired ART routes to be maintained for a certain period, reducing redundant re-routing processes when the same destination is accessed again within a short interval.
Conversely, in high vehicle density environments ( n t > 20 ), vehicles are located in close proximity, and frequent stops, starts, lane changes, and even direction reversals occur. As a result, the relative positions and movement directions of vehicles change much more frequently than in low vehicle density conditions, leading to increased path disruptions. If the DPC remains long under such conditions, already disconnected routes may persist in the routing table, delaying the discovery of new valid routes. Thus, assigning a shorter DPC enables expired routing entries to be promptly removed once the ART period ends, allowing the rapid establishment of new paths using adjacent routing entries that correspond to the current vehicle’s direction of movement.
t d p c , representing DPC, is calculated using the following formula:
t d p c = clip [ t min , t max ] t d p c , 0 · f a d j u s t
In Equation (2), t d p c , 0 denotes the baseline value of the Delete Period Constant (DPC), and f a d j u s t represents the final adjustment coefficient that reflects the effects of vehicle density and speed conditions. The computation method of f a d j u s t is described in detail in the following section. Finally, the baseline values t a r t , 0 and t d p c , 0 for the Active Route Timeout (ART) and DPC, respectively, share the same range, bounded between the minimum value t min = 2 and the maximum value t max = 100 .
t art , 0 = 60 ( 1 τ ) + 40 τ
t d p c , 0 = 160 · ( 1 τ ) + 140 · τ
Equation (5) is defined based on the relationship between the number of observed neighbors n t and the average speed, as shown in Figure 4. Observations indicate that the average vehicle speed decreased most significantly in the range n t = 15 to 20. The proposed scheme uses this range as the reference interval for ART and DPC calculations. To express this mathematically, the n t value is normalized to the interval 15–20, setting t = 0 when n t 15 and t = 1 when n t 20 . Therefore, t increases linearly as n t increases from 15 to 20, and this value is used to interpolate the base values of ART and DPC in Equations (3) and (4).
τ = clip [ 0 , 1 ] n t 15 20 15
In Equation (5), the definition is grounded in the relationship between the observed number of neighbors n t and the average vehicle speed shown in Figure 4.
The observations indicate that the most pronounced decrease in average vehicle speed occurs over n t = 15 –20. The proposed scheme adopts this interval as the reference range for ART and DPC calculations. To formalize this, n t is normalized over the interval 15–20, with τ clamped to the interval endpoints outside this range. Accordingly, τ increases linearly as n t varies from 15 to 20, and this value is used to interpolate the base ART and DPC in Equations (3) and (4); this choice follows the consistently steep slope observed across Maps A–D in Figure 4.
Next, the vehicle density ρ t denotes the number of vehicles within the communication range R at time t and serves as an input when computing ART and DPC in the proposed scheme. The vehicle density is calculated as follows.
ρ t = n t π R 2 × 10
In Equation (6), n t denotes the number of vehicles within a radius R; in the experiments, R was fixed at 110 m as the transmission range.
ρ t represents the saturation level of the segment in which the vehicle is located. In complex road environments—such as congested urban areas with high saturation—changes in the vehicle’s heading occur more frequently; accordingly, ART and DPC are configured to shorter values. Conversely, in low-saturation environments—such as highways—inter-vehicle spacing is wider, and relative position changes and heading variations occur less frequently than in congested urban settings; thus, ART and DPC are configured to longer values.
Therefore, ρ t quantitatively characterizes local saturation, enabling shorter ART/DPC in heavily loaded segments and longer values in lightly loaded segments.
The rate of change of vehicle speed Δ s denotes the relative variation in speed between two time instants and serves as an input when computing ART and DPC in the proposed scheme.
The rate of change is calculated as follows.
Δ s = | s t c s t p | s t p , if s t p 0 0 , otherwise
In Equation (7), s t c and s t p denote the vehicle’s speed at the current and previous instants, respectively. When s t p 0 , the rate of change between the two instants is computed; when s t p = 0 , it is defined as zero to avoid a division-by-zero denominator.
Larger Δ s indicates faster variation in the vehicle’s speed, increasing the likelihood of substantial short-term changes in relative positions among vehicles. Accordingly, the VTC-Based AODV reduces ART and DPC as Δ s increases, promoting rapid route updates. Conversely, when Δ s is small, relative position changes are gradual, and ART/DPC are maintained at comparatively longer values.
f a d j u s t = w s t · f s t + w ρ t · f ρ t
Next, in Equation (8), the final adjustment coefficient f adjust is obtained by a linear combination of the vehicle speed- and vehicle density-related terms.The associated constants were determined through simulations conducted in the map environment used in this study. These four elements do not operate independently; rather, they jointly determine the direction and magnitude of ART/DPC adjustment in a complementary manner.
The speed coefficient f s t normalizes the current vehicle speed and modulates the response intensity of the speed-based weight w s t used in subsequent steps. As the vehicle speed increases, f s t decreases, rendering w s t more sensitive in high-speed operation. In high-speed zones, relative motion between vehicles is large; accordingly, even small speed differences or slight heading changes induce rapid variation in inter-vehicle distance. Under such conditions, path maintenance becomes challenging; therefore, the influence of w s t is emphasized, yielding a larger adjustment magnitude in the ensuing ART/DPC update stages.
Conversely, in low-speed sections, f s t increases, attenuating the response of w s t . The effect of speed changes on distance variation or path retention is comparatively smaller. Hence, f s t functions as a reference that tunes the sensitivity of w s t according to the current vehicle speed: relatively higher speeds, even small deviations substantially affect w s t , whereas at low vehicle speeds, spacing changes are minor and the impact on w s t is relatively limited.
The speed-based weight w s t quantifies the adjustment amplitude applied to ART and DPC based on the vehicle’s speed variation. When the vehicle speed variation is large, w s t decreases, thereby narrowing the adjustment range of ART and DPC. When the variation is small, w s t increases, broadening the adjustment range of ART and DPC. In effect, w s t promotes shorter route retention under irregular vehicle speed patterns and longer retention under stable speed. The constants were calibrated through simulations in the study’s map environment, taking into account traffic density and road-structure characteristics.
The vehicle density coefficient f ρ t captures the instantaneous concentration of vehicles around a given vehicle, quantifying inter-vehicle proximity. This value increases as the number of surrounding vehicles grows. Because multi-hop routes are more susceptible to disruption under higher local vehicle density, larger f ρ t yields smaller ART and DPC. Conversely, f ρ t decreases as the number of surrounding vehicles declines; with wider spacing, routes tend to remain stable, and ART/DPC are computed to larger values. Accordingly, f ρ t serves as a reference for adjusting the magnitude of ART and DPC as a function of surrounding vehicle density.
The vehicle density-based weight w ρ t takes f ρ t as input and determines the strength with which its influence is applied. As the number of surrounding vehicles increases, w ρ t grows, amplifying the effect of f ρ t and yielding smaller ART and DPC. Conversely, when fewer vehicles are present, w ρ t decreases, attenuating the influence of f ρ t and producing comparatively larger ART and DPC. In other words, f ρ t provides the input reflecting the local vehicle count, while w ρ t controls the degree to which that input is reflected in the actual ART/DPC calculations.
Specifically, f ρ t accounts for both the saturation level of the traffic environment and deviations of vehicle density from its average. It adjusts the ART/DPC durations so that the speed-based correction effect remains balanced with the observed vehicle-distribution characteristics.
In this process, f adjust is formed as a single adjustment coefficient by summing the vehicle speed term w s t · f s t and the vehicle density term w ρ t · f ρ t . The resulting f adjust is applied as a multiplicative factor in the ART and DPC formulas, directly tuning their final values according to the speed vehicle and vehicle density inputs. Detailed calculation procedures for each element ( f s t , f ρ t , w s t , w ρ t ) are provided below.
The speed-based weight w s t is an adjustment parameter that governs the variation of ART and DPC by reflecting the influence of the vehicle’s speed characteristics on route stability. This weight is computed as follows.
w s t = clip [ w min , w max ] ( C · [ W s , 0 + clip [ 0.03 , 0.03 ] | s t c s ¯ | K s + clip [ 0.02 , 0.02 ] Δ s K f ] )
In Equation (9), W s , 0 = 0.037 denotes the baseline for the speed-based weighting, and changes in the vehicle’s driving state are incorporated via two correction terms. Here, C = 2.2 is a global scaling constant that adjusts the overall magnitude of the speed-based weighting while preserving the relative contributions of the individual correction terms. The final outcome is constrained to the admissible range [ 0.022 ,   0.22 ] .
The first correction term, | s t c s ¯ | · ( 0.003 ) , uses the absolute deviation of the current vehicle speed s t c from the average vehicle speed s ¯ . A larger deviation indicates a mismatch between the vehicle’s motion state and the surrounding traffic flow, which increases the likelihood of link disconnection. Accordingly, a negative coefficient K s ( < 0 ) with value 0.003 is applied, decreasing w s t . That is, as the disparity between the current and average vehicle speeds grows, W S decreases and ART/DPC are adjusted to shorter values, reducing route lifetime. To avoid excessive reduction under large vehicle speed deviations, the contribution of this term is clipped to [ 0.03 ,   0.03 ] .
The second correction term Δ s · K f reflects the temporal rate of change of vehicle speed Δ s . Because link stability degrades with frequent acceleration or deceleration, w s t decreases under the negative coefficient K f ( < 0 ) with value 0.03 . Accordingly, larger rates of speed change yield smaller w s t , and ART/DPC are adjusted to shorter values, enabling faster route updates. The influence of this term is clipped to [ 0.02 , 0.02 ] to prevent transient, abrupt speed fluctuations from exerting excessive impact on ART/DPC adjustments. These distributions motivate the scaling and clipping ranges applied to the speed-variation term; Section 4.1’s CDFs are explicitly reused here when setting update sensitivity (see Figure 5).
Consequently, w s t increases when the current speed and both its deviation from, and rate of change relative to, the average vehicle speed are small; in this case, ART and DPC are set longer, extending route lifetime.
Conversely, w s t decreases when the current speed and its deviation are large or when the rate of change is high; ART and DPC are then shortened, prompting early updates of unstable routes. In sum, this formulation linearly adjusts ART and DPC according to the magnitude of variation in speed characteristics, thereby enabling dynamic control of route lifetime.
The vehicle density-based weight w ρ t is an adjustment factor used in ART and DPC calculations, reflecting the local saturation level of surrounding vehicles at the time a HELLO message is received. This value is recomputed whenever a node updates adjacent-vehicle information via a HELLO message and is defined as follows.
w ρ t   =   clip [ w min , w max ] C · W ρ , 0 + clip [ 0.5 , 0.5 ] ( ρ t ρ t ¯ ) f ρ t
Here, W ρ , 0 = 0.027 is the default weight, and ρ t denotes the current vehicle’s saturation level measured at the instant the HELLO message is received. ρ ¯ denotes the contemporaneous average saturation level of vehicles within the communication range, representing the typical local saturation. Accordingly, ρ t ρ ¯ indicates how much the saturation at the current vehicle’s position deviates from the surrounding average.
The correction term ( ρ t ρ ¯ ) · f ρ adjusts w ρ t to reflect this deviation. To avoid abrupt changes in the weight between HELLO reception intervals—even under substantial saturation variation—the correction contribution is clipped to [ 0.5 , 0.5 ] . Here, C and the final admissible range [ w min , w max ] are identical to those used for the speed-based weight w s t .
If the current saturation exceeds the surrounding average ( ρ t > ρ ¯ ) , the vehicle is situated in a densely packed segment. Since f ρ t > 0 , w ρ t decreases, yielding shorter ART and DPC. Conversely, if the current saturation is lower than the surrounding average ( ρ t < ρ ¯ ) , the vehicle is in a more sparsely populated segment; w ρ t increases, producing longer ART and DPC.
Accordingly, w ρ t adapts at each HELLO reception to reflect local saturation dynamics—shortening ART/DPC in highly saturated segments and lengthening them in lightly saturated segments.
The vehicle speed coefficient f s t and the vehicle density coefficient f ρ t normalize the vehicle’s travel speed and the surrounding vehicle density state, respectively, and serve as reference values that regulate the reflection intensity of the speed-based weight w s t and the vehicle density-based weight w ρ t applied in subsequent steps. These coefficients map vehicle speed and vehicle density—quantities with different units—into a common ratio form and calibrate them so that absolute environmental magnitudes do not unduly dominate the adjustment range of ART (Active Route Timeout) and DPC (Delete Period Constant). The definitions are as follows.
f s t   =   clip [ 0.9 , 1.1 ] 35.0 s t c ,
f ρ t   =   clip [ 0.08 , 10.2 ] ρ t 0.05 ,
The vehicle speed coefficient f s t in Equation (11) is defined as an inverse-proportional function of the current vehicle speed s t c . As the vehicle’s speed increases, f s t decreases, thereby limiting any increase in ART and DPC even when w s t is applied. Conversely, at lower vehicle speeds, f s t increases, allowing the effect of w s t to be reflected more strongly.
Accordingly, f s t acts as a threshold that governs how much w s t is actually reflected based on the absolute vehicle speed magnitude. This prevents unnecessary route retention for fast-moving vehicles and suppresses ART/DPC from becoming excessively short for slow-moving vehicles. The upper and lower bounds of 1.1 and 0.9 , respectively, constrain f s t to avoid abrupt ART/DPC fluctuations due to transient vehicle speed changes.
The vehicle density coefficient f ρ t in Equation (12) is a normalized quantity obtained by dividing the instantaneous vehicle density ρ t by the baseline vehicle density 0.05 . This coefficient quantifies local saturation and calibrates w ρ t to avoid excessive influence of absolute vehicle density levels during application. Although f ρ t increases with higher saturation, it is applied effectively as an inverse weight in practice, resulting in shorter ART and DPC.
Conversely, at lower vehicle density, f ρ t is smaller, thereby maintaining longer ART and DPC to support route stability where available paths are limited. The upper and lower bounds, 10.2 and 0.08 , respectively, provide a stabilization range that prevents unrealistic ART/DPC fluctuations under abrupt vehicle density changes.
Consequently, f s t and f ρ t , respectively, normalize the absolute magnitudes of vehicle speed and vehicle density, thereby regulating the sensitivity of the subsequent weights w s t and w ρ t . Specifically, the F coefficients set the baseline adjustment magnitude for ART and DPC as a function of the current vehicle speed and saturation level, whereas the W coefficients encode the rate-of-change effects that determine the direction and amplitude of the adjustments. Together, these two classes of coefficients ensure that ART and DPC adapt in accordance with observed variations in vehicle speed and vehicle density within the traffic environment.
Figure 6 presents the calculation results for ART (Active Route Timeout) and DPC (Delete Period Constant). The x-axis denotes the number of neighboring vehicles n t within a radius R = 110 m , and each curve corresponds to a current vehicle speed interval s t c . Each point represents the computed ART or DPC value for the ( s t c , n t ) combination, while the y-axis reports ART and DPC.
As n t increases, both ART and DPC decrease overall. In particular, over nt = 15–20, the reduction in average speed is pronounced, consistent with the largest drop observed in Figure 4. For n t 15 , ART and DPC are computed to larger values, whereas for n t > 20 , they are computed to smaller values.
Each curve uses the s t c s t p values computed in Figure 5 as inputs. | s t c s t p | denotes the difference between the current speed and the previous speed maeasured earlier, with its distribution over the entire interval concentrated in the 0–4 km/h range. For the calculations, values segmented at 1 km/h increments within this range were applied. At the same n t , larger | s t c s t p | yields smaller computed values for both ART and DPC. Conversely, for the same n t and the same | s t c s t p | , lower s t c results in relatively larger ART and DPC.
5. Simulation Results

This section evaluates the proposed Vehicular Traffic Condition-Based AODV against two static baselines. The comparison set comprises (i) Legacy AODV, (ii) PDR Upper-Bound AODV (PUB AODV), and (iii) PDR Lower-Bound AODV (PLB AODV). PUB AODV is an oracle-style static baseline that, for each vehicular traffic condition VTC ( n , s ) , instantiates the static ART/DPC pair that achieves the highest packet delivery ratio among the combinations enumerated in Section 3 (Table 1); conversely, PLB AODV selects, for each VTC ( n , s ) , the static ART/DPC pair that yields the lowest packet delivery ratio in the same table. These two baselines provide empirical upper and lower bounds for static lifetime tuning under each condition and serve as reference points for assessing the proposed adaptive method.
Simulations were conducted on a city-scale map built with OpenStreetMap and SUMO, co-simulated with OMNeT++/Veins/INET (environment introduced in Figure 1); additional configuration details are summarized in Table 3.

Performance Evaluation of the Proposed Scheme

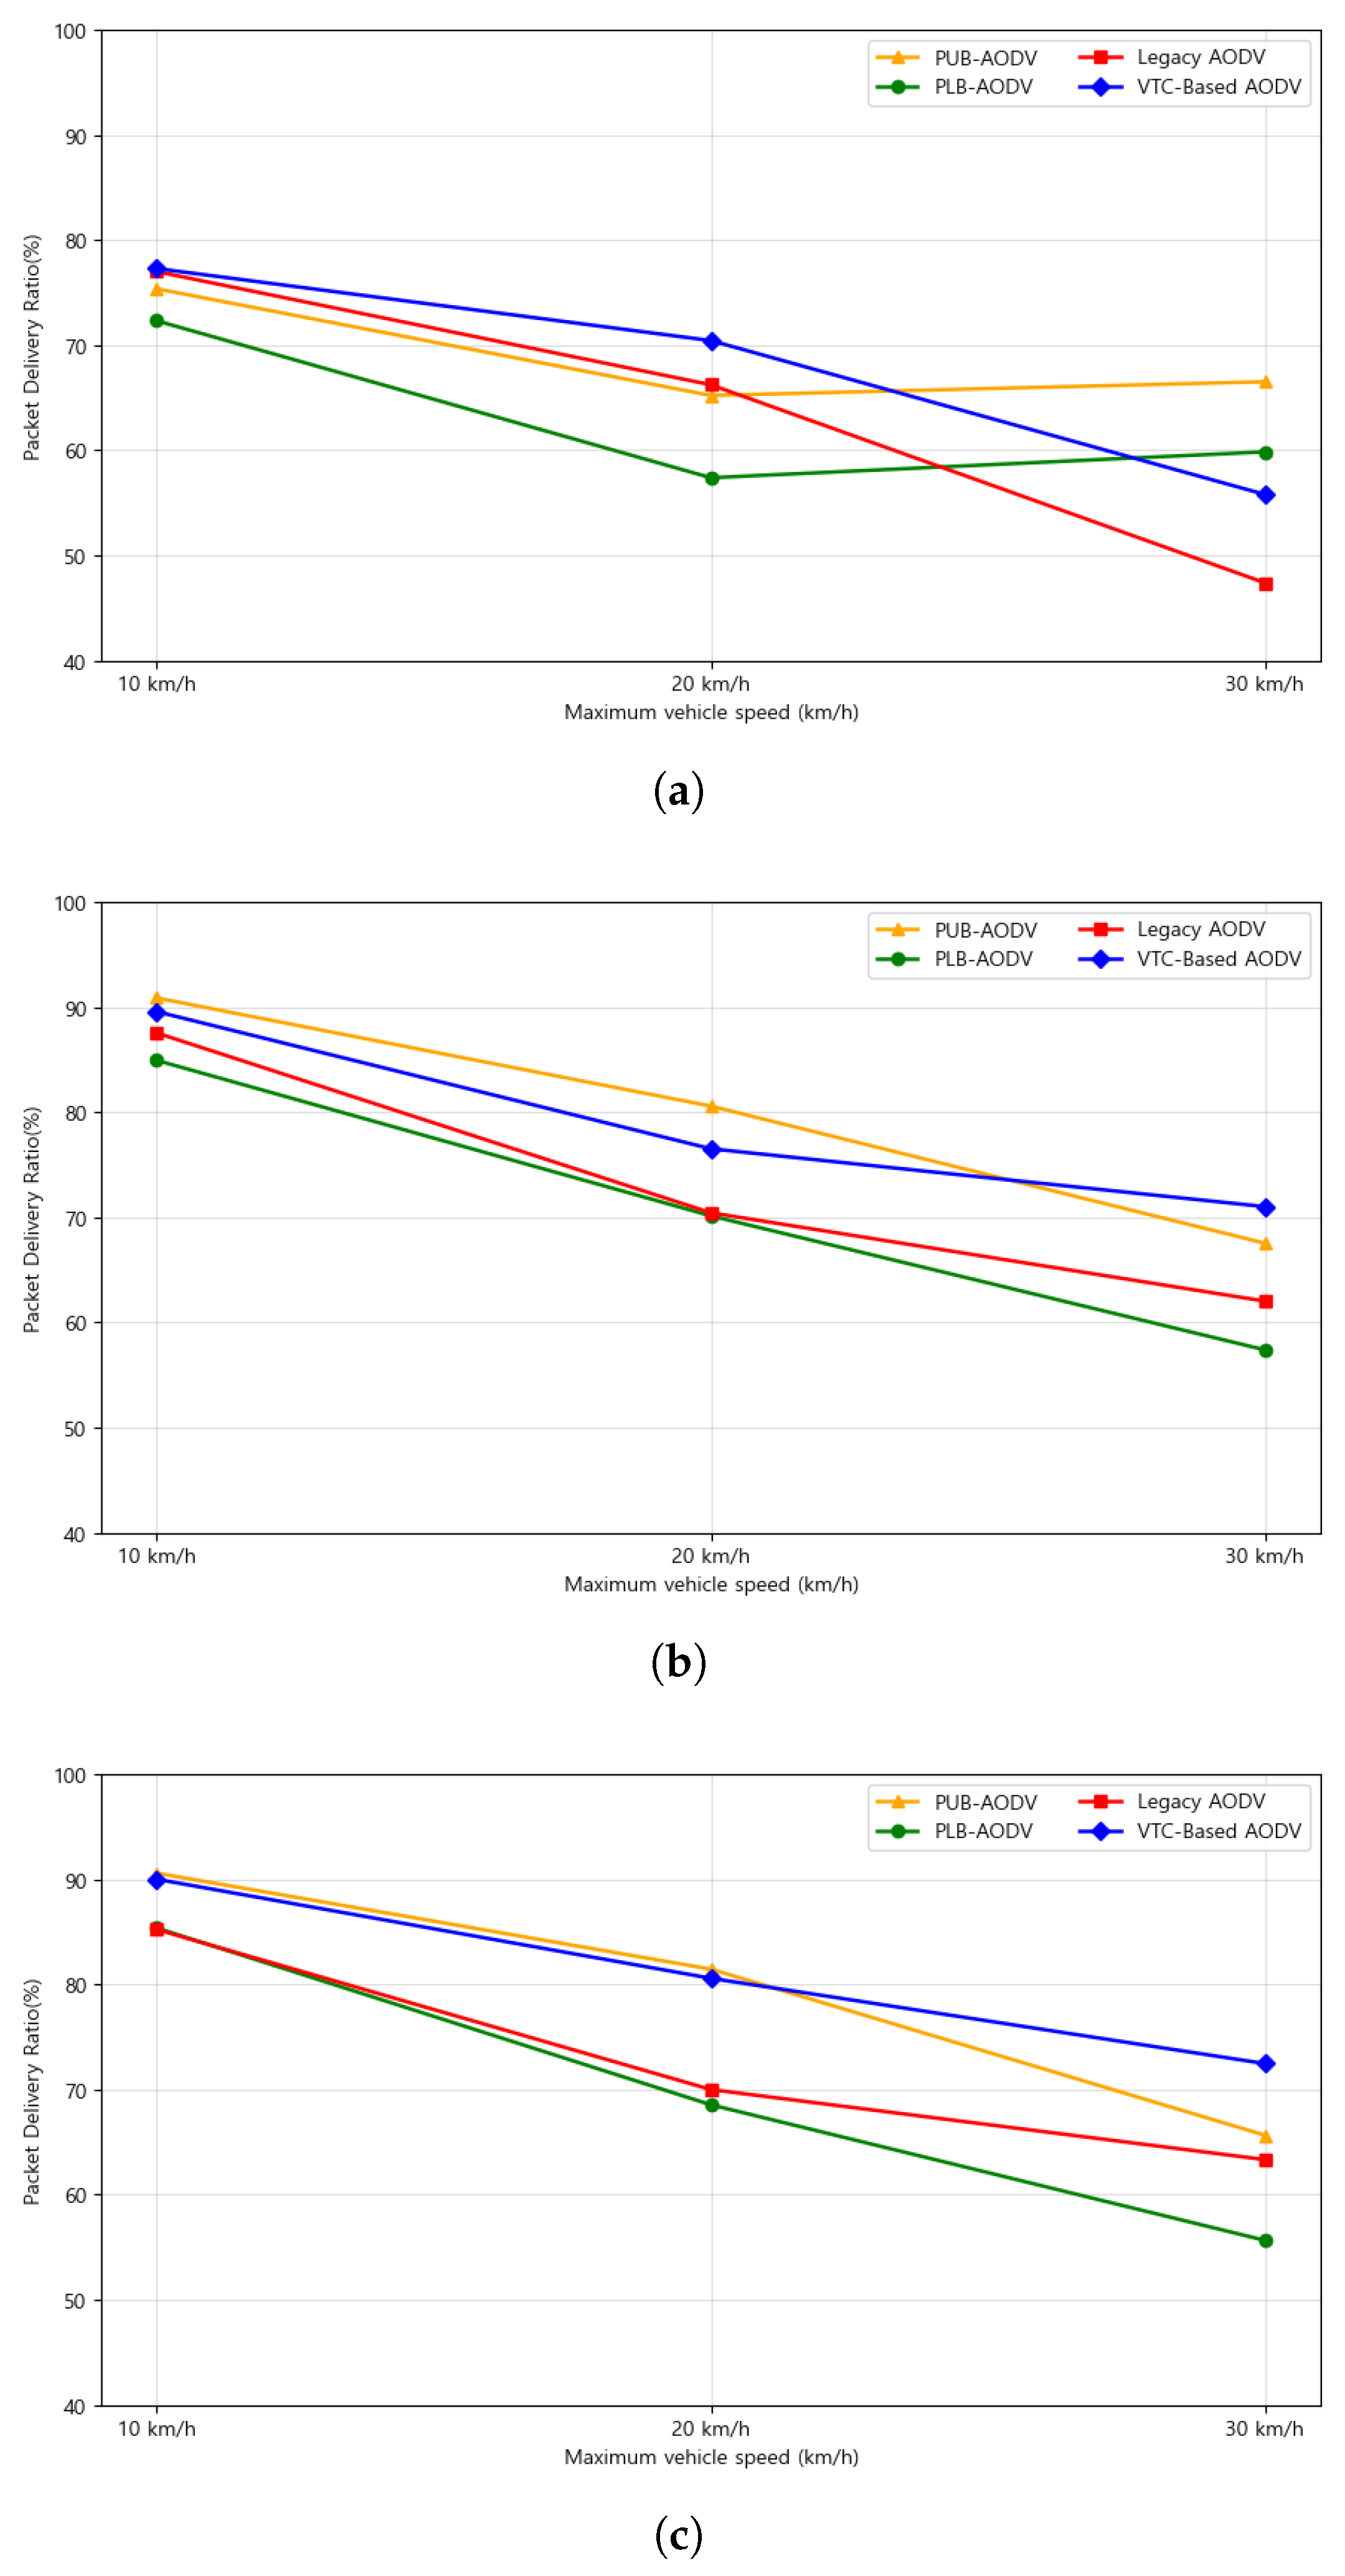
Figure 7 compares the packet delivery ratio (PDR) measured across three vehicle environments—200, 300, and 400 vehicles—and three vehicle maximum speeds—10, 20, and 30 km/h. The PDR results of the Legacy AODV and the VTC-Based AODV are compared, while the inter-vehicle variance in each environment is represented by the baseline range defined by PUB AODV (PDR Upper-Bound AODV) and PLB–AODV (PDR Lower-Bound AODV). Here, PUB AODV and PLB AODV represent the highest and lowest average PDR values, respectively, calculated from all combinations of ART and DPC used in the experiment under the same number of vehicles and vehicle maximum speed (2.0, 4/2.0, 6/2.5, 4/2.5, 5/2.5, 6/3.0, 5/3.0, 6). This definition served as a benchmark for quantitatively evaluating the influence of ART and DPC configuration changes on PDR under equivalent environments.
The analysis showed that PDR generally decreased for both PUB AODV/PLB AODV and the two routing schemes as vehicle maximum speed increased. However, the VTC-Based AODV consistently achieved higher PDR values than the Legacy AODV across all environments, often approaching or exceeding the upper bound represented by PUB AODV. For instance, in the 400-vehicle environment with varying vehicle maximum speeds, the PDR of the VTC-Based AODV reached 72.5%, approximately 6.8% higher than PUB AODV (65.7%) and 9.2% higher than the Legacy AODV (63.3%). In the 300-vehicle environment with a vehicle maximum speed of 30 km/h, the VTC-Based AODV achieved a PDR of 71.0%, which was 3.5% higher than PUB AODV (67.5%) and 9.0% higher than the Legacy AODV. Conversely, in the 200-vehicle environment with a vehicle maximum speed of 10 km/h, the PDR difference between the two schemes was only 0.3%, with both values converging near the upper bound of PUB AODV (75.4%). These results indicate that even as vehicle maximum speed increased, the VTC-Based AODV maintained PDR performance closest to the upper bound represented by PUB AODV, despite the overall downward trend in PDR.
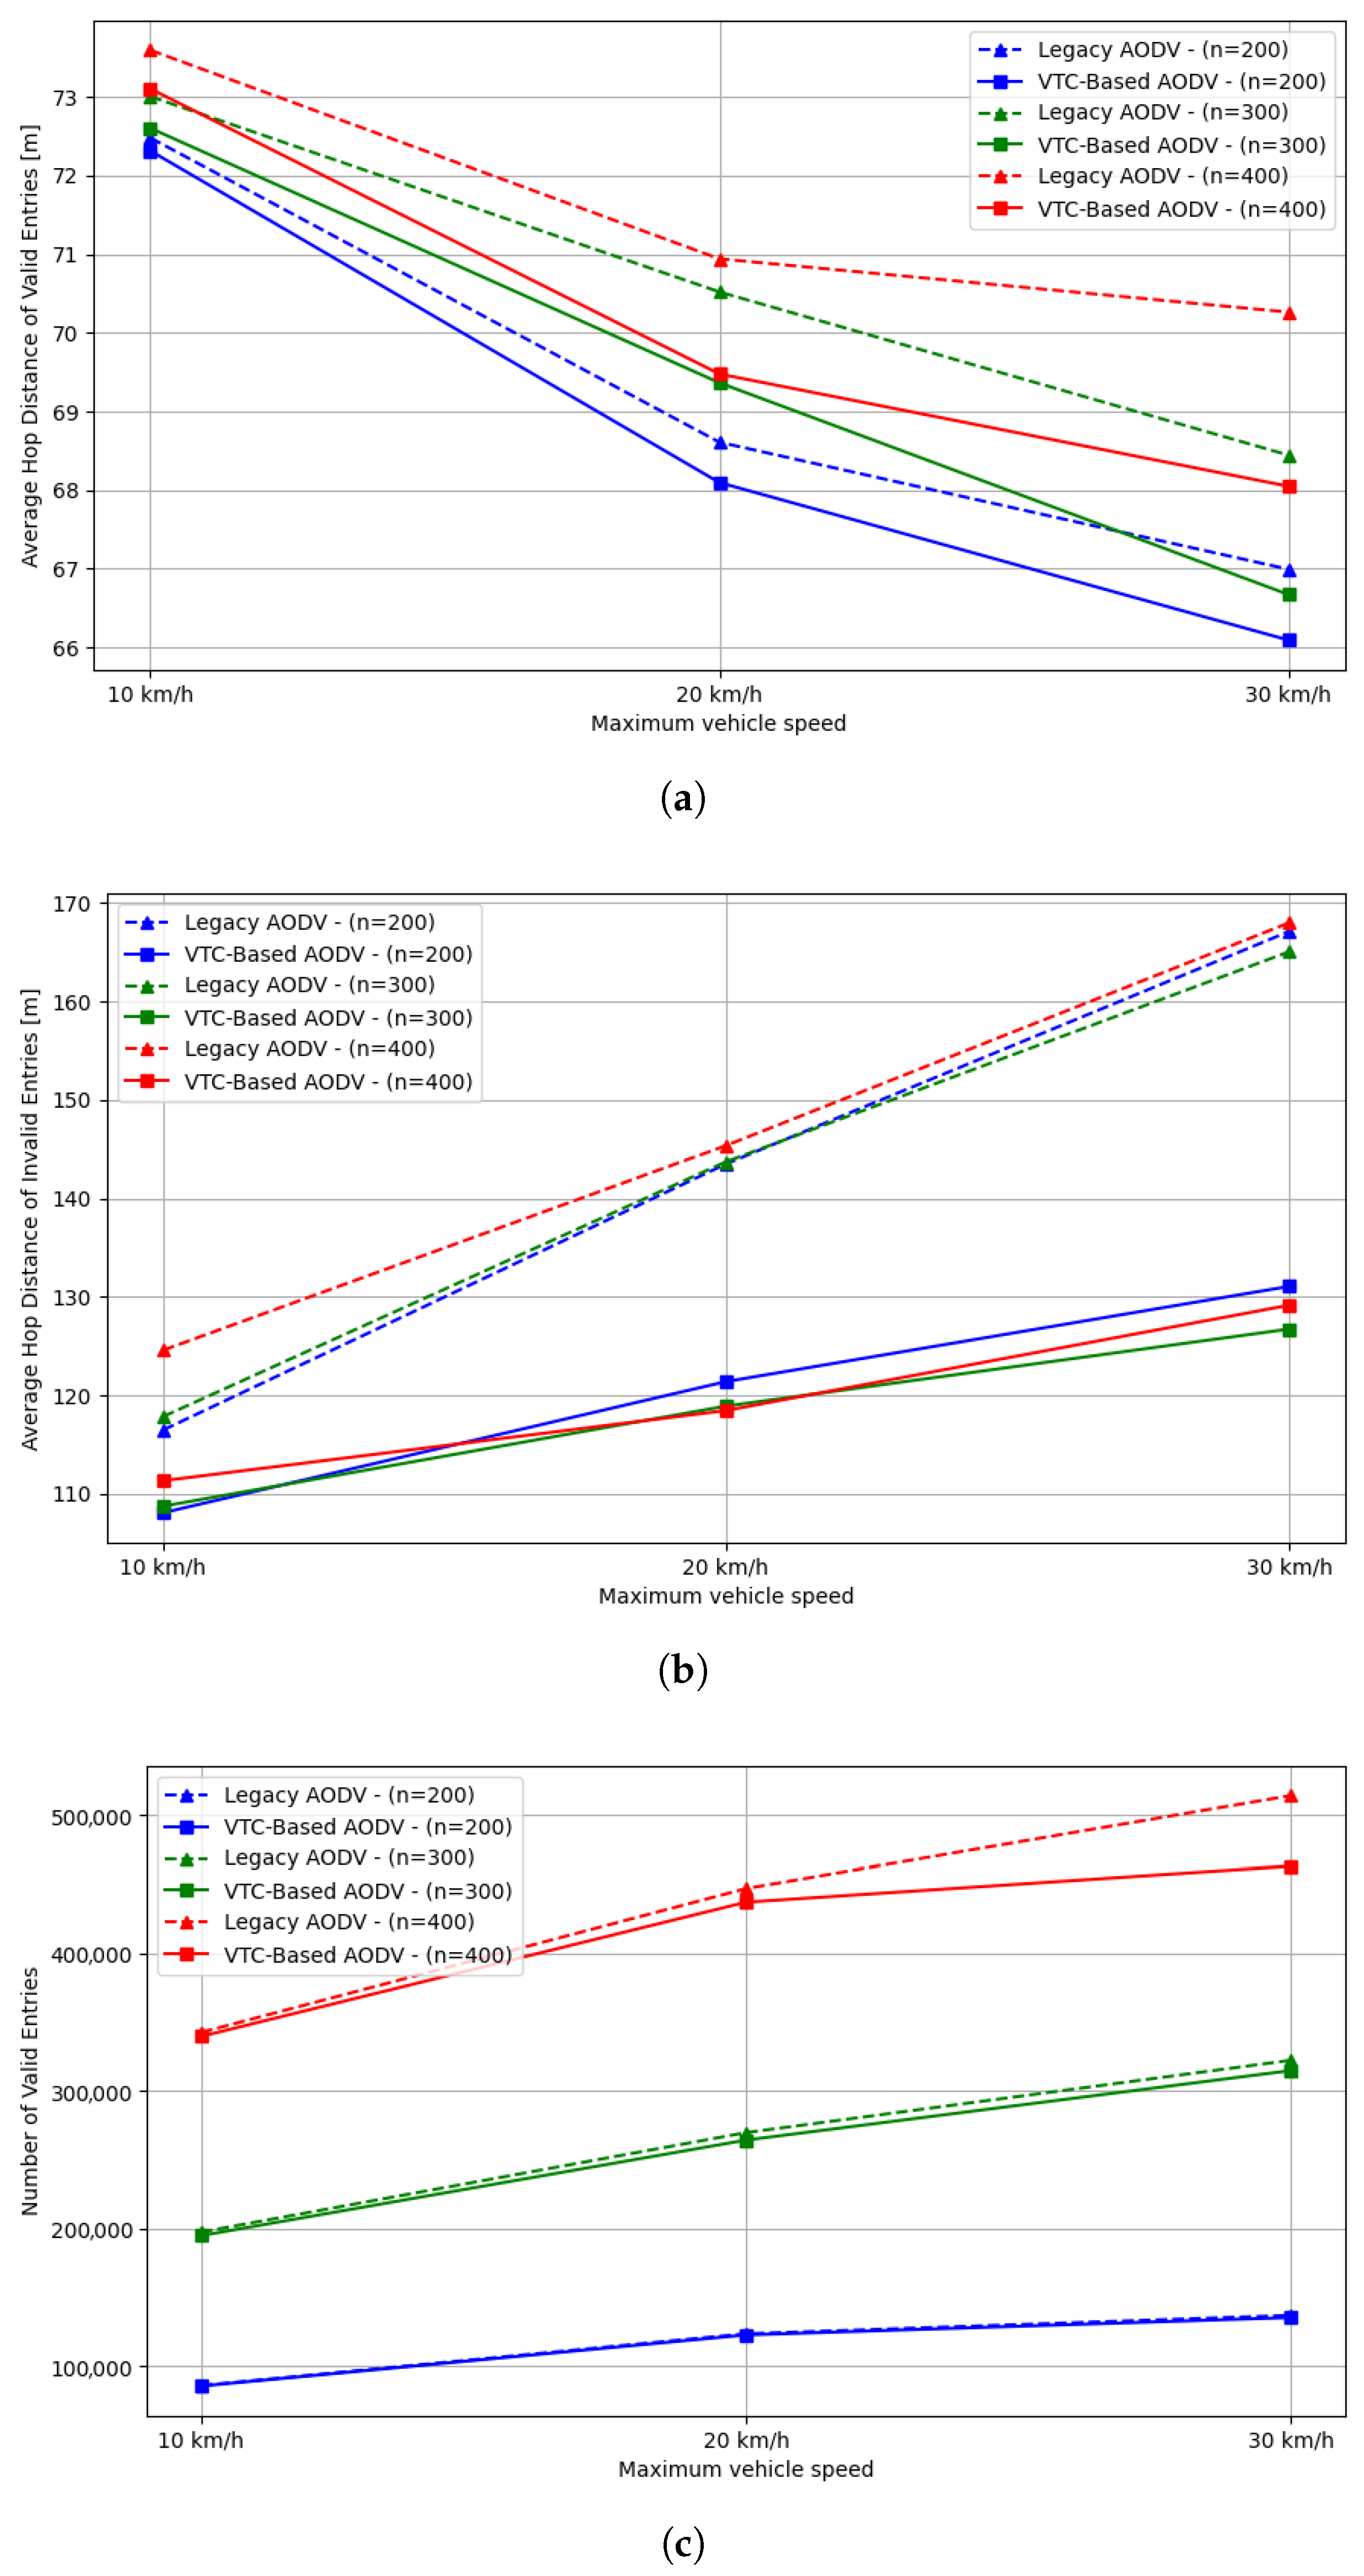
When the vehicle maximum speed was 10 km/h, the PDR difference between the two schemes was negligible because vehicle movement was minimal and variations in vehicle density were small, limiting the effectiveness of the VTC-Based AODV’s ART/DPC adjustment mechanism. Consequently, the average hop distance of valid entries did not decrease significantly, resulting in a similarly small improvement in overall PDR. These variations in average distance and the number of valid entries are discussed in detail in Figure 8.
A similar trend was observed when comparing results across different vehicle environments. With 200 vehicles, the PDR difference between the two schemes averaged 4.3%, increasing to approximately 5.7% with 300 vehicles and about 8.2% with 400 vehicles. In the 300-vehicle and 400-vehicle environments, the PDR of the VTC-Based AODV was significantly higher than that of the Legacy AODV, showing values nearly identical to the upper bound represented by PUB AODV. This indicates that although overall PDR decreases as the number of vehicles increases, the VTC-Based AODV maintained relatively high performance even under such environments.
The baseline range represents the difference between PUB AODV and PLB AODV for each case, indicating the degree of PDR variation under equivalent environments. With 200 vehicles and a vehicle maximum speed of 10 km/h, this range was small at approximately 3.0%, but it expanded to about 12.9% with 400 vehicles and a vehicle maximum speed of 20 km/h. That is, as the vehicle maximum speed and network saturation increased, the PDR variation among vehicles became larger. Nevertheless, the average PDR of the VTC-Based AODV remained close to or exceeded the upper bound represented by PUB–AODV in most cases, maintaining stable and high delivery performance even with 400 vehicles and a vehicle maximum speed of 30 km/h.
Overall, these results demonstrate two key findings. First, although overall PDR decreases as the vehicle maximum speed increases, the VTC-Based AODV maintains a performance level close to or exceeding the upper bound represented by PUB AODV. Second, the relative advantage of the VTC-Based AODV becomes more evident in environments with both high vehicle saturation and high vehicle maximum speed, consistently achieving higher PDR than the Legacy AODV across most scenarios, ranging from 200 to 400 vehicles and vehicle maximum speeds between 10 and 30 km/h.
Table 4 presents the average PDR performance obtained under different experimental conditions defined by the number of vehicles (200, 300, 400) and the maximum vehicle speed (10, 20, and 30 km/h). This table enables a comparative examination of the PDR values achieved by the Legacy AODV, the VTC-Based AODV, and, for reference, the additional benchmark values of PUB AODV and PLB AODV.
PUB AODV and PLB AODV represent, respectively, the highest and lowest average PDR values obtained from ART and DPC combination experiments conducted under the same density–speed configuration. These values serve as baselines for assessing the relative stability and upper-bound performance of the VTC-Based AODV.
When the number of vehicles was 200 and the maximum speed was 10 km/h, the PDR values of Legacy AODV ranged from 48% to 93%, while those of the VTC-Based AODV ranged from 48% to 93%. The corresponding minimum and maximum PDR values of PUB AODV and PLB AODV were 49–91% and 49–88%, respectively, indicating a comparable performance range. When the maximum speed was 20 km/h, the PDR values of Legacy AODV ranged from 45% to 97%, and those of the VTC-Based AODV ranged from 41% to 97%. The minimum and maximum PDR values of PUB AODV and PLB AODV were 39–96% and 14–96%, respectively, showing a slightly lower minimum value. At a maximum speed of 30 km/h, the PDR values of Legacy AODV ranged from 33% to 72%, and those of the VTC-Based AODV ranged from 33% to 78%. The minimum and maximum PDR values of PUB AODV and PLB AODV were 38–99% and 36–99%, respectively, representing the widest range among all conditions.
When the number of vehicles was 300 and the maximum speed was 10 km/h, the PDR values of Legacy AODV ranged from 83% to 91%, while those of the VTC-Based AODV ranged from 86% to 94%. The corresponding minimum and maximum PDR values of PUB AODV and PLB AODV were 83–94% and 72–94%, respectively, maintaining consistently high performance levels. At a maximum speed of 20 km/h, the PDR values of Legacy AODV ranged from 54% to 88%, and those of the VTC-Based AODV ranged from 51% to 90%. The minimum and maximum PDR values of PUB AODV and PLB AODV were 72–93% and 38–87%, respectively. At a maximum speed of 30 km/h, the PDR values of Legacy AODV ranged from 48% to 81%, and those of the VTC-Based AODV ranged from 57% to 86%. The minimum and maximum PDR values of PUB AODV and PLB AODV were 41–93% and 29–80%, respectively.
When the number of vehicles was 400 and the maximum speed was 10 km/h, the PDR values of Legacy AODV ranged from 67% to 97%, while those of the VTC-Based AODV ranged from 81% to 97%. The corresponding minimum and maximum PDR values of PUB AODV and PLB AODV were 75–99% and 29–99%, respectively. At a maximum speed of 20 km/h, the PDR values of Legacy AODV ranged from 33% to 99%, and those of the VTC-Based AODV ranged from 59% to 99%. The minimum and maximum PDR values of PUB AODV and PLB AODV were 49–100% and 16–100%, respectively, showing the largest deviation between the two. At a maximum speed of 30 km/h, the PDR values of Legacy AODV ranged from 46% to 78%, while those of the VTC-Based AODV ranged from 61% to 78%. The minimum and maximum PDR values of PUB AODV and PLB AODV were 29–78% and 17–75%, respectively, indicating the smallest deviation for the VTC-Based AODV.
In summary, the VTC-Based AODV generally exhibited reduced PDR deviation compared to the Legacy AODV under the 400-vehicle condition. The most significant improvement in stability, with an approximate 26% reduction in deviation, was observed when the maximum speed was 20 km/h. In contrast, when the number of vehicles was 200 or 300, the deviation increased at certain speed conditions, and there were instances where the lower-bound PDR values were below those of PLB AODV. Nevertheless, the VTC-Based AODV maintained PDR performance close to the upper bound represented by PUB AODV, even in scenarios where the Legacy AODV structurally exhibited large PDR deviations, particularly under the 400-vehicle condition with vehicle maximum speeds of 20 km/h and 30 km/h.
The results shown in Figure 8 demonstrate that the VTC-Based AODV consistently enhanced route stability compared to the Legacy AODV when the number of vehicles was 200 and 400.
Each entry in the AODV routing table contains an active field, based on which the entry’s state is classified as either Valid or Invalid. If a route is established through RREP reception or its usage is confirmed via data delivery or HELLO message exchange, the active value is set to true, placing the entry in the Valid state. Conversely, when the lifetime expires, a link failure with a neighboring vehicle is detected, or an RERR message is received, the active value is set to false, transitioning the entry to the Invalid state. Invalid entries are not immediately deleted but remain in the table for a fixed period before being removed. This study analyzed the characteristics of Valid and Invalid entries in both the Legacy AODV and the VTC-Based AODV based on this classification.
When there were 200 vehicles, as shown in Figure 8c, the number of valid entries in the VTC-Based AODV remained at a level similar to that of the Legacy AODV, while Figure 8a revealed a decrease in the average hop distance. This indicates that, in scenarios with a limited number of vehicles where the overall number of available routes cannot significantly change, the VTC-Based AODV tends to select and update routes with relatively shorter hop distances compared to the Legacy AODV. Such route selection increases the likelihood of maintaining stable connections through nearby neighboring vehicles, reducing the risk of propagation fading or link failures. However, when the maximum vehicle speed was 10 km/h, the average hop distance of valid entries did not decrease significantly in either scheme, resulting in only a marginal improvement in PDR performance.
When there were 400 vehicles, as shown in Figure 8a,b, the proportion of long-distance routes in the VTC-Based AODV decreased, while short-distance routes became dominant. At the same time, the number of valid entries increased compared to the Legacy AODV, as illustrated in Figure 8c. This can be interpreted as a result of the VTC-Based AODV suppressing vulnerable long-distance routes through adaptive ART and DPC adjustments while maintaining a greater number of short-distance routes that are better suited to the surrounding environment. Long-distance routes typically lead to issues such as signal attenuation, interference, increased delay, and potential link disruption. Therefore, reducing their proportion while maintaining sufficient valid routes contributes to improving overall route stability.
In summary, the VTC-Based AODV demonstrated the ability to maintain relatively stable routes when there were 200 vehicles and to further enhance route stability when there were 400 vehicles by suppressing vulnerable long-distance routes and increasing the number of valid entries, outperforming the Legacy AODV in both cases.

6. Conclusions

This work revisited route lifetime control in AODV under realistic vehicular traffic conditions and introduced a VTC-conditioned controller that adjusts ART and DPC online at each HELLO reception using locally observed neighbor count and speed-variation signals. The design was empirically grounded in OSM to SUMO mobility and OMNeT++/Veins/INET co-simulation, from which two regularities were distilled and operationalized: (i) a map-agnostic transition band of neighbor density ( 15 < n t 20 ) where mobility evolves most rapidly, and (ii) a HELLO-triggered distribution of instantaneous speed-change magnitudes concentrated within a narrow range. These insights were incorporated to modulate responsiveness within the transition band while retaining conservative behavior outside it, thereby regulating route-entry lifetimes in a manner consistent with local topology dynamics.
Evaluation across diverse VTC ( n , s ) settings showed consistent PDR gains over conventional AODV and close tracking of the best static ART–DPC pairs identified per condition. The improvements are attributable to better alignment between entry retention and the prevailing mobility/density regime: unstable paths are purged in a timely fashion, whereas stable paths are preserved long enough to be exploited for forwarding, increasing the availability of valid routes without centralized coordination.
Meanwhile, this study instantiated an 802.11p-compatible PHY/MAC. Next, we will (a) replicate the evaluation under IEEE 802.11bd to assess the impact of enhanced Doppler robustness, wider channelization, and higher-order modulations; (b) conduct a systematic sensitivity analysis of PHY/MAC parameters that materially affect PDR (e.g., MCS, bandwidth, transmit power, EDCA AIFS/ CW min / CW max /TXOP, retry limits, HELLO/beacon periodicity, payload sizes); and (c) perform comparative experiments with 3GPP C-V2X and NR V2X sidelink (PC5), including sensing-based resource selection modes, to quantify how access technology influences absolute performance and the responsiveness–stability trade-offs of the proposed controller. Although the controller logic is designed to be link-agnostic by conditioning on local n t and speed-variation cues, establishing technology-specific bounds and best practices remains an important objective.

Author Contributions

Conceptualization, J.C., Y.K. and S.O.; Methodology, J.C. and Y.K.; Software, J.C.; Validation, Y.K. and S.O.; Formal analysis, S.O.; Data curation, J.C.; Writing—original draft, J.C.; Writing—review & editing, Y.K. and S.O.; Visualization, J.C.; Supervision, Y.K. and S.O.; Project administration, Y.K. and S.O.; Funding acquisition, Y.K. and S.O. All authors have read and agreed to the published version of the manuscript.

Funding

This research was supported by Basic Science Research Program through the National Research Foundation of Korea (NRF) funded by the Ministry of Education (No. NRF-2021R1I1A1A0104763011). This work was supported by the research grant of Kongju National University in 2022.

Institutional Review Board Statement

Not applicable.

Informed Consent Statement

Not applicable.

Data Availability Statement

The original contributions presented in this study are included in the article. Further inquiries can be directed to the corresponding authors.

Acknowledgments

The authors used [ChatGPT-5 Thinking model (OpenAI, San Francisco, CA, USA)] to assist in improving the language and readability of the manuscript. The authors confirm that all intellectual content and scientific conclusions are their own, and AI was not used for data analysis, interpretation, or drawing scientific conclusions.

Conflicts of Interest

The authors declare no conflicts of interest.

References

  1. Hartenstein, H.; Laberteaux, L. A tutorial survey on vehicular ad hoc networks. IEEE Commun. Mag. 2008, 46, 164–171. [Google Scholar] [CrossRef]
  2. Papadimitratos, P.; Buttyan, L.; Holczer, T.; Schoch, E.; Freudiger, J.; Raya, M.; Ma, Z.; Kargl, F.; Kung, A.; Hubaux, J.P. Secure vehicular communication systems: Design and architecture. IEEE Commun. Mag. 2008, 46, 100–109. [Google Scholar] [CrossRef]
  3. Eichler, S. Performance evaluation of the IEEE 802.11 p WAVE communication standard. In Proceedings of the 2007 IEEE 66th Vehicular Technology Conference, Baltimore, MD, USA, 30 September–3 October 2007; pp. 2199–2203. [Google Scholar] [CrossRef]
  4. Liu, K.; Lee, V.C.S. RSU-based real-time data access in dynamic vehicular networks. In Proceedings of the 13th International IEEE Conference on Intelligent Transportation Systems (ITSC), Funchal, Portugal, 19–22 September 2010; pp. 1051–1056. [Google Scholar] [CrossRef]
  5. Yin, J.; ElBatt, T.; Yeung, G.; Ryu, B.; Habermas, S.; Krishnan, H.; Talty, T. Performance evaluation of safety applications over DSRC vehicular ad hoc networks. In Proceedings of the 1st ACM International Workshop on Vehicular AD Hoc Networks, Philadelphia, PA, USA, 1 October 2004; pp. 1–9. [Google Scholar] [CrossRef]
  6. Ye, F.; Roy, S.; Wang, H. Efficient data dissemination in vehicular ad hoc networks. IEEE J. Sel. Areas Commun. 2012, 30, 769–779. [Google Scholar] [CrossRef]
  7. Masmoudi, A.; Mnif, K.; Zarai, F. A survey on radio resource allocation for V2X communication. Wirel. Commun. Mob. Comput. 2019, 2019, 1–12. [Google Scholar] [CrossRef]
  8. OpenStreetMap. Available online: https://www.openstreetmap.org (accessed on 20 October 2024).
  9. Krajzewicz, D.; Erdmann, J.; Behrisch, M.; Bieker, L. Recent development and applications of SUMO-Simulation of Urban MObility. Int. J. Adv. Syst. Meas. 2012, 5, 128–138. [Google Scholar]
  10. Varga, A.; Hornig, R. An overview of the OMNeT++ simulation environment. In Proceedings of the SIMUTOOLS 2008, Marseille, France, 3–7 March 2008. [Google Scholar] [CrossRef]
  11. Sutariya, D.; Pradhan, S. An improved AODV routing protocol for VANETs in city scenarios. In Proceedings of the IEEE-International Conference on Advances in Engineering, Science and Management (ICAESM-2012), Nagapattinam, India, 30–31 March 2012; pp. 575–581. Available online: https://ieeexplore.ieee.org/document/6215907 (accessed on 5 November 2025).
  12. Ali, F.; Shaikh, F.K.; Ansari, A.Q.; Mahoto, N.A.; Felemban, E. Comparative analysis of VANET routing protocols: On road side unit placement strategies. Wirel. Pers. Commun. 2015, 85, 393–406. [Google Scholar] [CrossRef]
  13. Yang, L.; Liu, H. A data transmitting scheme based on improved AODV and RSU-assisted forwarding for large-scale VANET. Wirel. Pers. Commun. 2016, 91, 1489–1505. [Google Scholar] [CrossRef]
  14. Yang, Q.; Lim, A.; Li, S.; Fang, J.; Agrawal, P. ACAR: Adaptive connectivity aware routing for vehicular ad hoc networks in city scenarios. Mob. Netw. Appl. 2010, 15, 36–60. [Google Scholar] [CrossRef]
  15. Dafhalla, A.K.Y.; Elobaid, M.E.; Tayfour Ahmed, A.E.; Filali, A.; SidAhmed, N.M.O.; Attia, T.A.; Mohajir, B.A.I.; Altamimi, J.S.; Adam, T. Computer-Aided Efficient Routing and Reliable Protocol Optimization for Autonomous Vehicle Communication Networks. Computers 2025, 14, 13. [Google Scholar] [CrossRef]
  16. Li, X.; Bian, X.; Li, M. Routing selection algorithm for mobile ad hoc networks based on neighbor node density. Sensors 2024, 24, 325. [Google Scholar] [CrossRef] [PubMed]
  17. Azzoug, Y.; Boukra, A. Improved junction-based routing for VANETs using a Bio-inspired route stability approach. Ad Hoc Netw. 2024, 153, 103346. [Google Scholar] [CrossRef]
  18. Eiza, M.H.; Ni, Q.; Owens, T.; Min, G. Investigation of routing reliability of vehicular ad hoc networks. EURASIP J. Wirel. Commun. Netw. 2013, 2013, 179. [Google Scholar] [CrossRef]
  19. Kulla, E.; Morita, S.; Katayama, K.; Barolli, L. Route lifetime prediction method in VANET by using AODV routing protocol (AODV-LP). In Proceedings of the Conference on Complex, Intelligent, and Software Intensive Systems, Matsue, Matsue, Japan, 4–6 July 2018; pp. 3–11. [Google Scholar] [CrossRef]
  20. Nabil, M.; Hajami, A.; Haqiq, A. Predicting the route of the longest lifetime and the data packet delivery time between two vehicles in VANET. Mob. Inf. Syst. 2019, 2019, 2741323. [Google Scholar] [CrossRef]
  21. Agrawal, N.; Fatima, M. Impact of Active Route Time Out and Delete Period Constant on AODV Performance. Int. J. Comput. Appl. 2016, 147, 19–25. [Google Scholar] [CrossRef]
  22. Gupta, S.K.; Sharma, R.; Saket, R.K. Effect of variation in active route timeout and delete period constant on the performance of AODV protocol. Int. J. Mob. Commun. 2014, 12, 177–191. [Google Scholar] [CrossRef]
  23. Purnomo, A.; Widyawan; Najib, W.; Hartono, R.; Hartatik. Effect of variation in active route timeout and my route timeout on the performance of AODV-ETX protocol in mobile adhoc network. In Proceedings of the International Conference on Advanced Materials for Better Future, Surakarta, Indonesia, 4–5 September 2017; Available online: https://iopscience.iop.org/article/10.1088/1757-899X/333/1/012107 (accessed on 5 November 2025).
  24. Mallick, B.B.; Pramanik, D.; Das, R. Adaptive Fuzzy Route Lifetime for Ad-Hoc On-Demand Distance Vector (AODV) Routing Protocol. Int. J. Eng. Res. Technol. (IJERT) 2013, 2, 1196–1202. [Google Scholar]
  25. Rocha, P.; Souza, A.; Maia, G.; Mattos, C.; Silva, F.A.; Rego, P.; Nguyen, T.A.; Lee, J.W. Evaluating link lifetime prediction to support computational offloading decision in vanets. Sensors 2022, 22, 6038. [Google Scholar] [CrossRef] [PubMed]
  26. Wijesekara, P.A.D.S.N.; Gunawardena, S. A machine learning-aided network contention-aware link lifetime-and delay-based hybrid routing framework for software-defined vehicular networks. Telecom 2023, 4, 393–458. [Google Scholar] [CrossRef]
  27. Xue, S.; Gong, S.; Li, X. A Comparative Study of IEEE 802.11 bd and IEEE 802.11 p on the Data Dissemination Properties in Dynamic Traffic Scenarios. Appl. Sci. 2024, 14, 2099. [Google Scholar] [CrossRef]
  28. Jacob, R.; Anwar, W.; Schwarzenberg, N.; Franchi, N.; Fettweis, G. System-level Performance Comparison of IEEE 802.11 p and 802.11 bd Draft in Highway Scenarios. In Proceedings of the 2020 27th International Conference on Telecommunications (ICT), Bali, Indonesia, 5–7 October 2020; pp. 1–6. [Google Scholar] [CrossRef]
  29. IEEE 802.11p; IEEE Standard for Information technology—Local and Metropolitan Area Networks—Specific Requirements—Part 11Wireless LAN Medium Access Control (MAC) and Physical Layer (PHY) Specifications Amendment 6: Wireless Access in Vehicular Environments. IEEE SA: Piscataway, NJ, USA, 2010. Available online: https://standards.ieee.org/ieee/802.11p/3953/ (accessed on 5 November 2025).
  30. IEEE 802.11bd; IEEE Standard for Information Technology—Telecommunications and Information Exchange Between Systems Local and Metropolitan Area Networks—Specific Requirements Part 11: Wireless LAN Medium Access Control (MAC) and Physical Layer (PHY) Specifications Amendment 5: Enhancements for Next Generation V2X. IEEE SA: Piscataway, NJ, USA, 2022. Available online: https://standards.ieee.org/ieee/802.11bd/7451/ (accessed on 5 November 2025).
Figure 1. Simulation environment of OMNeT++ based on the Daejeon, Korea area: (a) OSM of Daejeon, Korea area; (b) OMNeT++ simulation environment constructed using the same OSM.
Applsci 15 12017 g001
Figure 2. Temporal evolution of vehicle speed (km/h) according to various Vehicle Traffic Conditions: total number of vehicle nodes (a) 200, (b) 300, and (c) 400.
Applsci 15 12017 g002aApplsci 15 12017 g002b
Figure 3. OSM (OpenStreetMap) map images for four SUMO environments, where black lines indicate the roads used for vehicle movement: (a) Urban A (Dunsan-dong, Seo-gu, Daejeon, Korea; this study), (b) Urban B (Gagyeong-dong, Cheongju, Chungcheongbuk-do, Korea), (c) Suburban C (Bihwa-dong, Heungdeok-gu, Cheongju, Chungcheongbuk-do, Korea), (d) Suburban D (Sinheung-ri, Jochiwon-eup, Sejong, Korea).
Applsci 15 12017 g003
Figure 4. Relationship between the number of neighbors n t and average speed of neighbors. Measured in (a) City A, (b) City B, (c) Suburb C, (d) Suburb D. Curve: average speed as a function of n t ; bars: speed reduction per n t interval.
Applsci 15 12017 g004
Figure 5. Comparison of the cumulative distribution functions (CDFs) of speed-change magnitudes Δ s t = | s t c s t p | computed at each HELLO reception across Maps A–D.
Applsci 15 12017 g005
Figure 6. Comparison of computed ART and DPC across combinations of current vehicle speed ( s t c ) and number of neighboring vehicles ( n t ) : (a) ART results; (b) DPC results.
Applsci 15 12017 g006
Figure 7. Comparison of PDR with respect to Vehicle Speed and Number of Vehicles. (a) 200 vehicles, (b) 300 vehicles, (c) 400 vehicles. X-axis: Maximum speed (km/h), Y-axis: PDR (%). PUB AODV/PLB AODV: Observation range, Legacy AODV, VTC-based AODV.
Applsci 15 12017 g007
Figure 8. Comparison of routing table characteristics between Legacy AODV and the proposed scheme: (a) average hop distance of valid routing entries, (b) average hop distance of invalid routing entries, and (c) average number of valid routing entries over time.
Applsci 15 12017 g008
Table 1. PDR (%) for static ( ART , DPC ) across vehicular traffic conditions VTC ( n , s ) . Row-wise maxima (green, bold) and minima (red, underlined) are indicated. Footer rows report the counts of maximum/minimum occurrences across the nine VTC ( n , s ) settings (ties counted).
VTC ( n , s ) ( ART , DPC ) = ( t art , t dpc ) Δ PDR n , s max
(2.0, 4) (2.0, 5) (2.0, 6) (2.5, 4) (2.5, 5) (2.5, 6) (3.0, 4) (3.0, 5) (3.0, 6)
(200, 10)74.574.575.474.174.175.172.372.373.33.0
(200, 20)62.562.861.058.163.862.357.465.262.97.8
(200, 30)59.961.764.266.566.463.665.565.963.86.7
(300, 10)90.190.190.990.090.090.990.090.084.95.9
(300, 20)77.077.478.773.280.677.770.180.678.510.4
(300, 30)67.466.257.466.567.159.167.565.459.310.1
(400, 10)89.789.990.689.789.985.489.789.989.75.2
(400, 20)81.474.370.973.869.470.973.269.768.612.9
(400, 30)56.765.760.961.361.763.255.762.862.010.0
F PDR max 103110120
F PDR min 101001412
Table 2. Marginal PDR (%) per VTC ( n , s ) . Left block averages over DPC (ART-only effect); right block averages over ART (DPC-only effect). Row-wise maxima (green, bold) and minima (red, underlined) are indicated.
VTC ( n , s ) ART-OnlyDPC-Only
t art = 2.0 2.5 3.0 Δ PDR n , s max t dpc = 4 5 6 Δ PDR n , s max
(200, 10)74.874.472.72.1373.673.674.60.97
(200, 20)62.161.461.80.6859.363.962.14.59
(200, 30)61.965.565.13.5764.064.763.90.82
(300, 10)90.490.388.32.0890.090.088.91.16
(300, 20)77.777.176.41.2773.479.578.36.09
(300, 30)63.764.364.10.5867.166.258.68.55
(400, 10)90.088.389.81.7489.789.988.61.30
(400, 20)75.671.470.55.0776.171.270.16.04
(400, 30)61.162.160.11.9357.963.462.05.51
Table 3. Simulation Configurations.
ParameterValue
Simulation time100 s
MAC ProtocolIEEE 802.11p
Packet Length10 byte
Packet Arrival Interval1.0 s
Transport ProtocolUDP
Channel ModelSimpleObstacleShadowing
Data rate6 Mbps
Noise Floor−98 dBm
Transmitter Power7.5 mW
Receiver Sensitivity−80 dBm
RSU Bandwidth10 MHz
RSU Radio Band5.9 GHz
Table 4. Minimum and Maximum PDR (%) of AODV, VTC-Based AODV, PUB–AODV, and PLB–AODV.
VTC(n, s)Legacy AODVVTC-Based AODVPUB–AODVPLB–AODV
Min Max Min Max Min Max Min Max
(200, 10)48%93%48%93%49%91%49%88%
(200, 20)45%97%41%97%39%96%14%96%
(200, 30)33%72%33%78%38%99%36%99%
(300, 10)83%91%86%94%83%94%72%94%
(300, 20)54%88%51%90%72%93%38%87%
(300, 30)48%81%57%86%41%93%29%80%
(400, 10)67%97%81%97%75%99%29%99%
(400, 20)33%99%59%99%49%100%16%100%
(400, 30)46%78%61%78%29%78%17%75%
Disclaimer/Publisher’s Note: The statements, opinions and data contained in all publications are solely those of the individual author(s) and contributor(s) and not of MDPI and/or the editor(s). MDPI and/or the editor(s) disclaim responsibility for any injury to people or property resulting from any ideas, methods, instructions or products referred to in the content.