Author Contributions
Conceptualization, S.L., F.L., G.L., F.P.M., F.S., A.T., D.A. and J.M.N.A.; methodology, S.L., F.L., G.L., F.P.M., F.S., A.T., D.A., J.M.N.A. and G.C.; formal analysis, S.L., F.L., G.L., F.P.M., F.S., A.T., D.A. and J.M.N.A.; investigation, G.L., F.P.M., F.S., A.T., D.A. and J.M.N.A.; resources, G.L., F.P.M., F.S., A.T., D.A. and J.M.N.A.; writing—original draft preparation, S.L. and F.L.; writing—review and editing, S.L. and F.L.; supervision, G.C.; funding acquisition G.C. All authors have read and agreed to the published version of the manuscript.
Figure 1.
Schematic representation of wrist and forearm movements: (a) flexion–extension; (b) radial–ulnar deviation; (c) pronation–supination.
Figure 1.
Schematic representation of wrist and forearm movements: (a) flexion–extension; (b) radial–ulnar deviation; (c) pronation–supination.
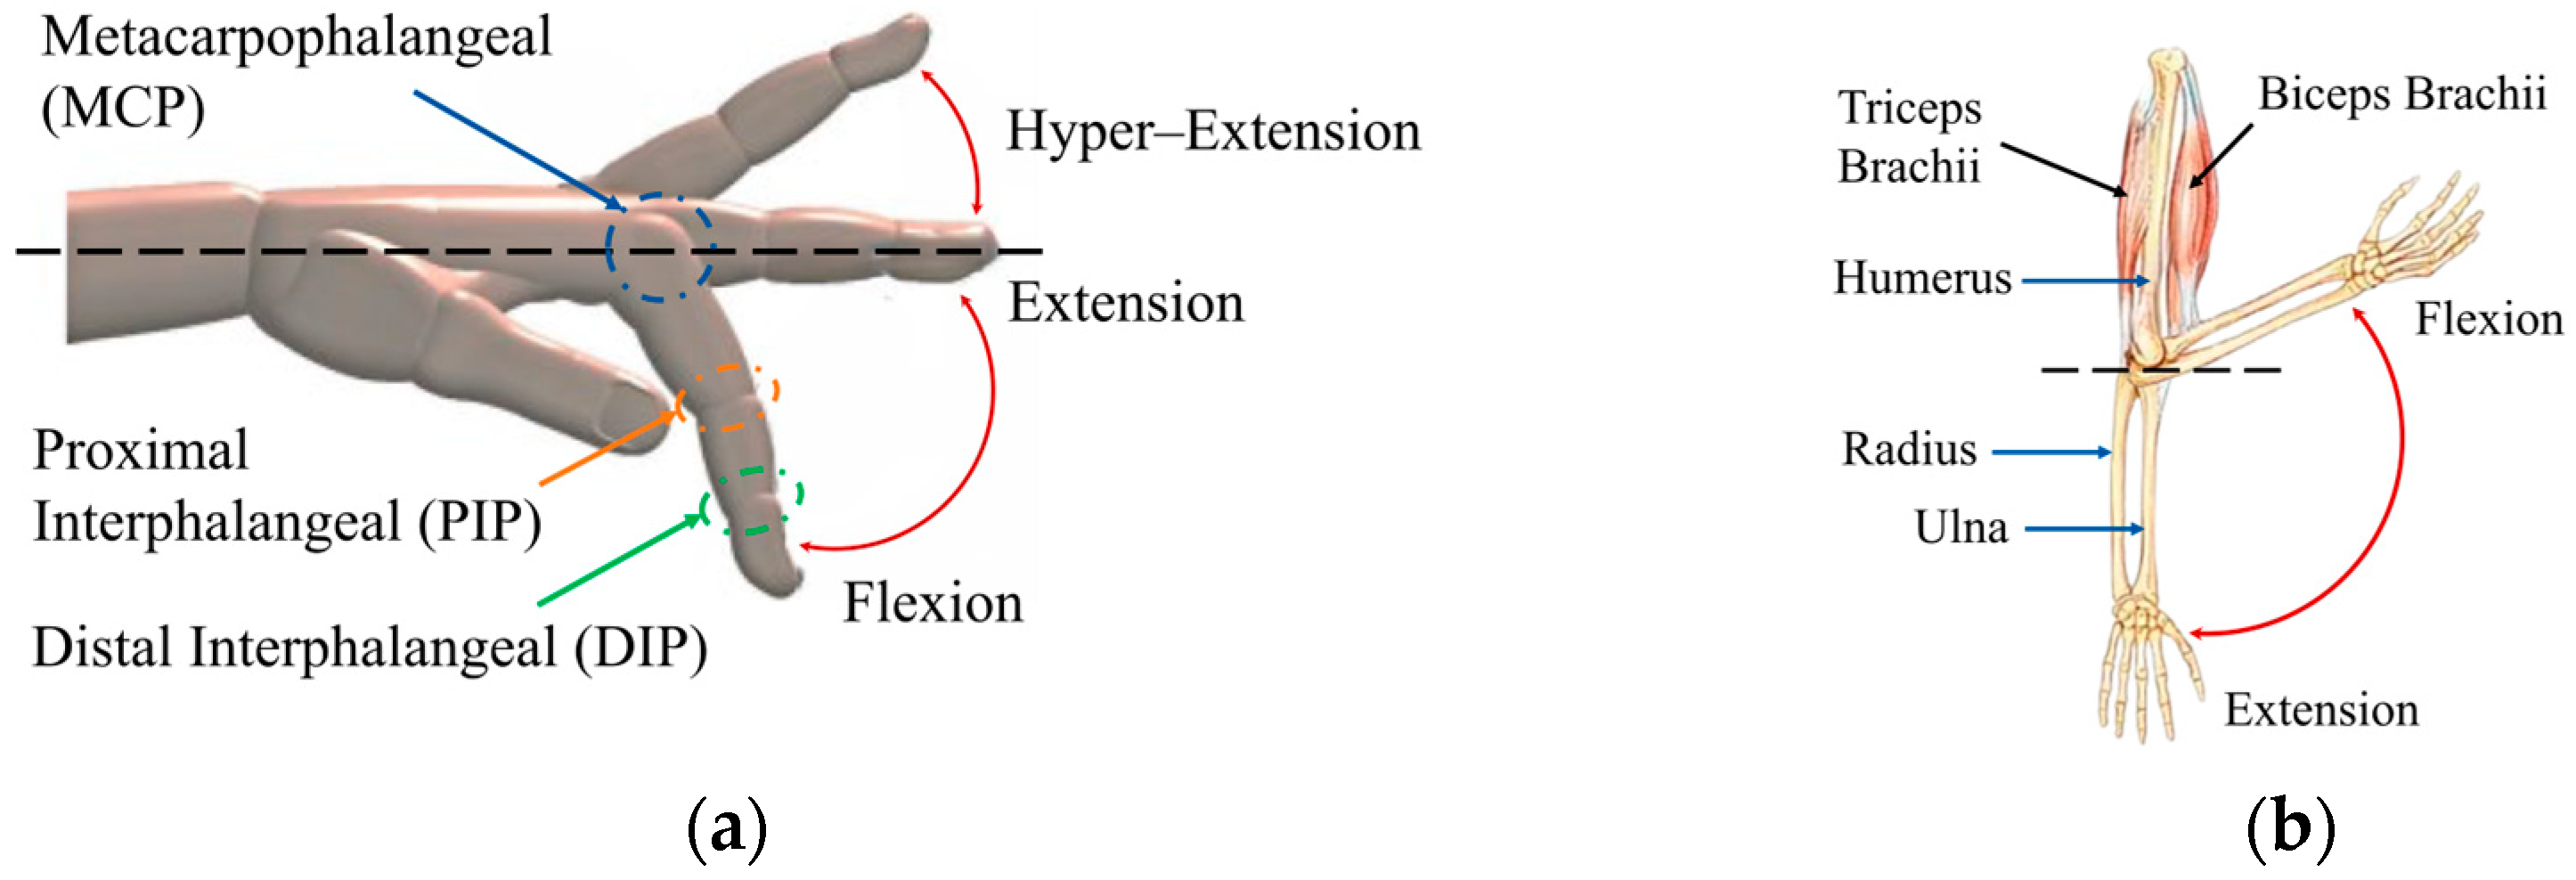
Figure 2.
Schematic representation of finger and elbow movements: (a) flexion–extension of the fingers with main joints; (b) flexion–extension of the elbow showing the muscles and bones involved.
Figure 2.
Schematic representation of finger and elbow movements: (a) flexion–extension of the fingers with main joints; (b) flexion–extension of the elbow showing the muscles and bones involved.
Figure 3.
Two-dimensional scheme of the prototype for the implementation of the elbow: (a) kinematic diagram; (b) initial and final configuration of the mechanism; (c) trend of cable tension over time.
Figure 3.
Two-dimensional scheme of the prototype for the implementation of the elbow: (a) kinematic diagram; (b) initial and final configuration of the mechanism; (c) trend of cable tension over time.
Figure 4.
Complete CAD model of the cable exoskeleton, showing the general layout of the system.
Figure 4.
Complete CAD model of the cable exoskeleton, showing the general layout of the system.
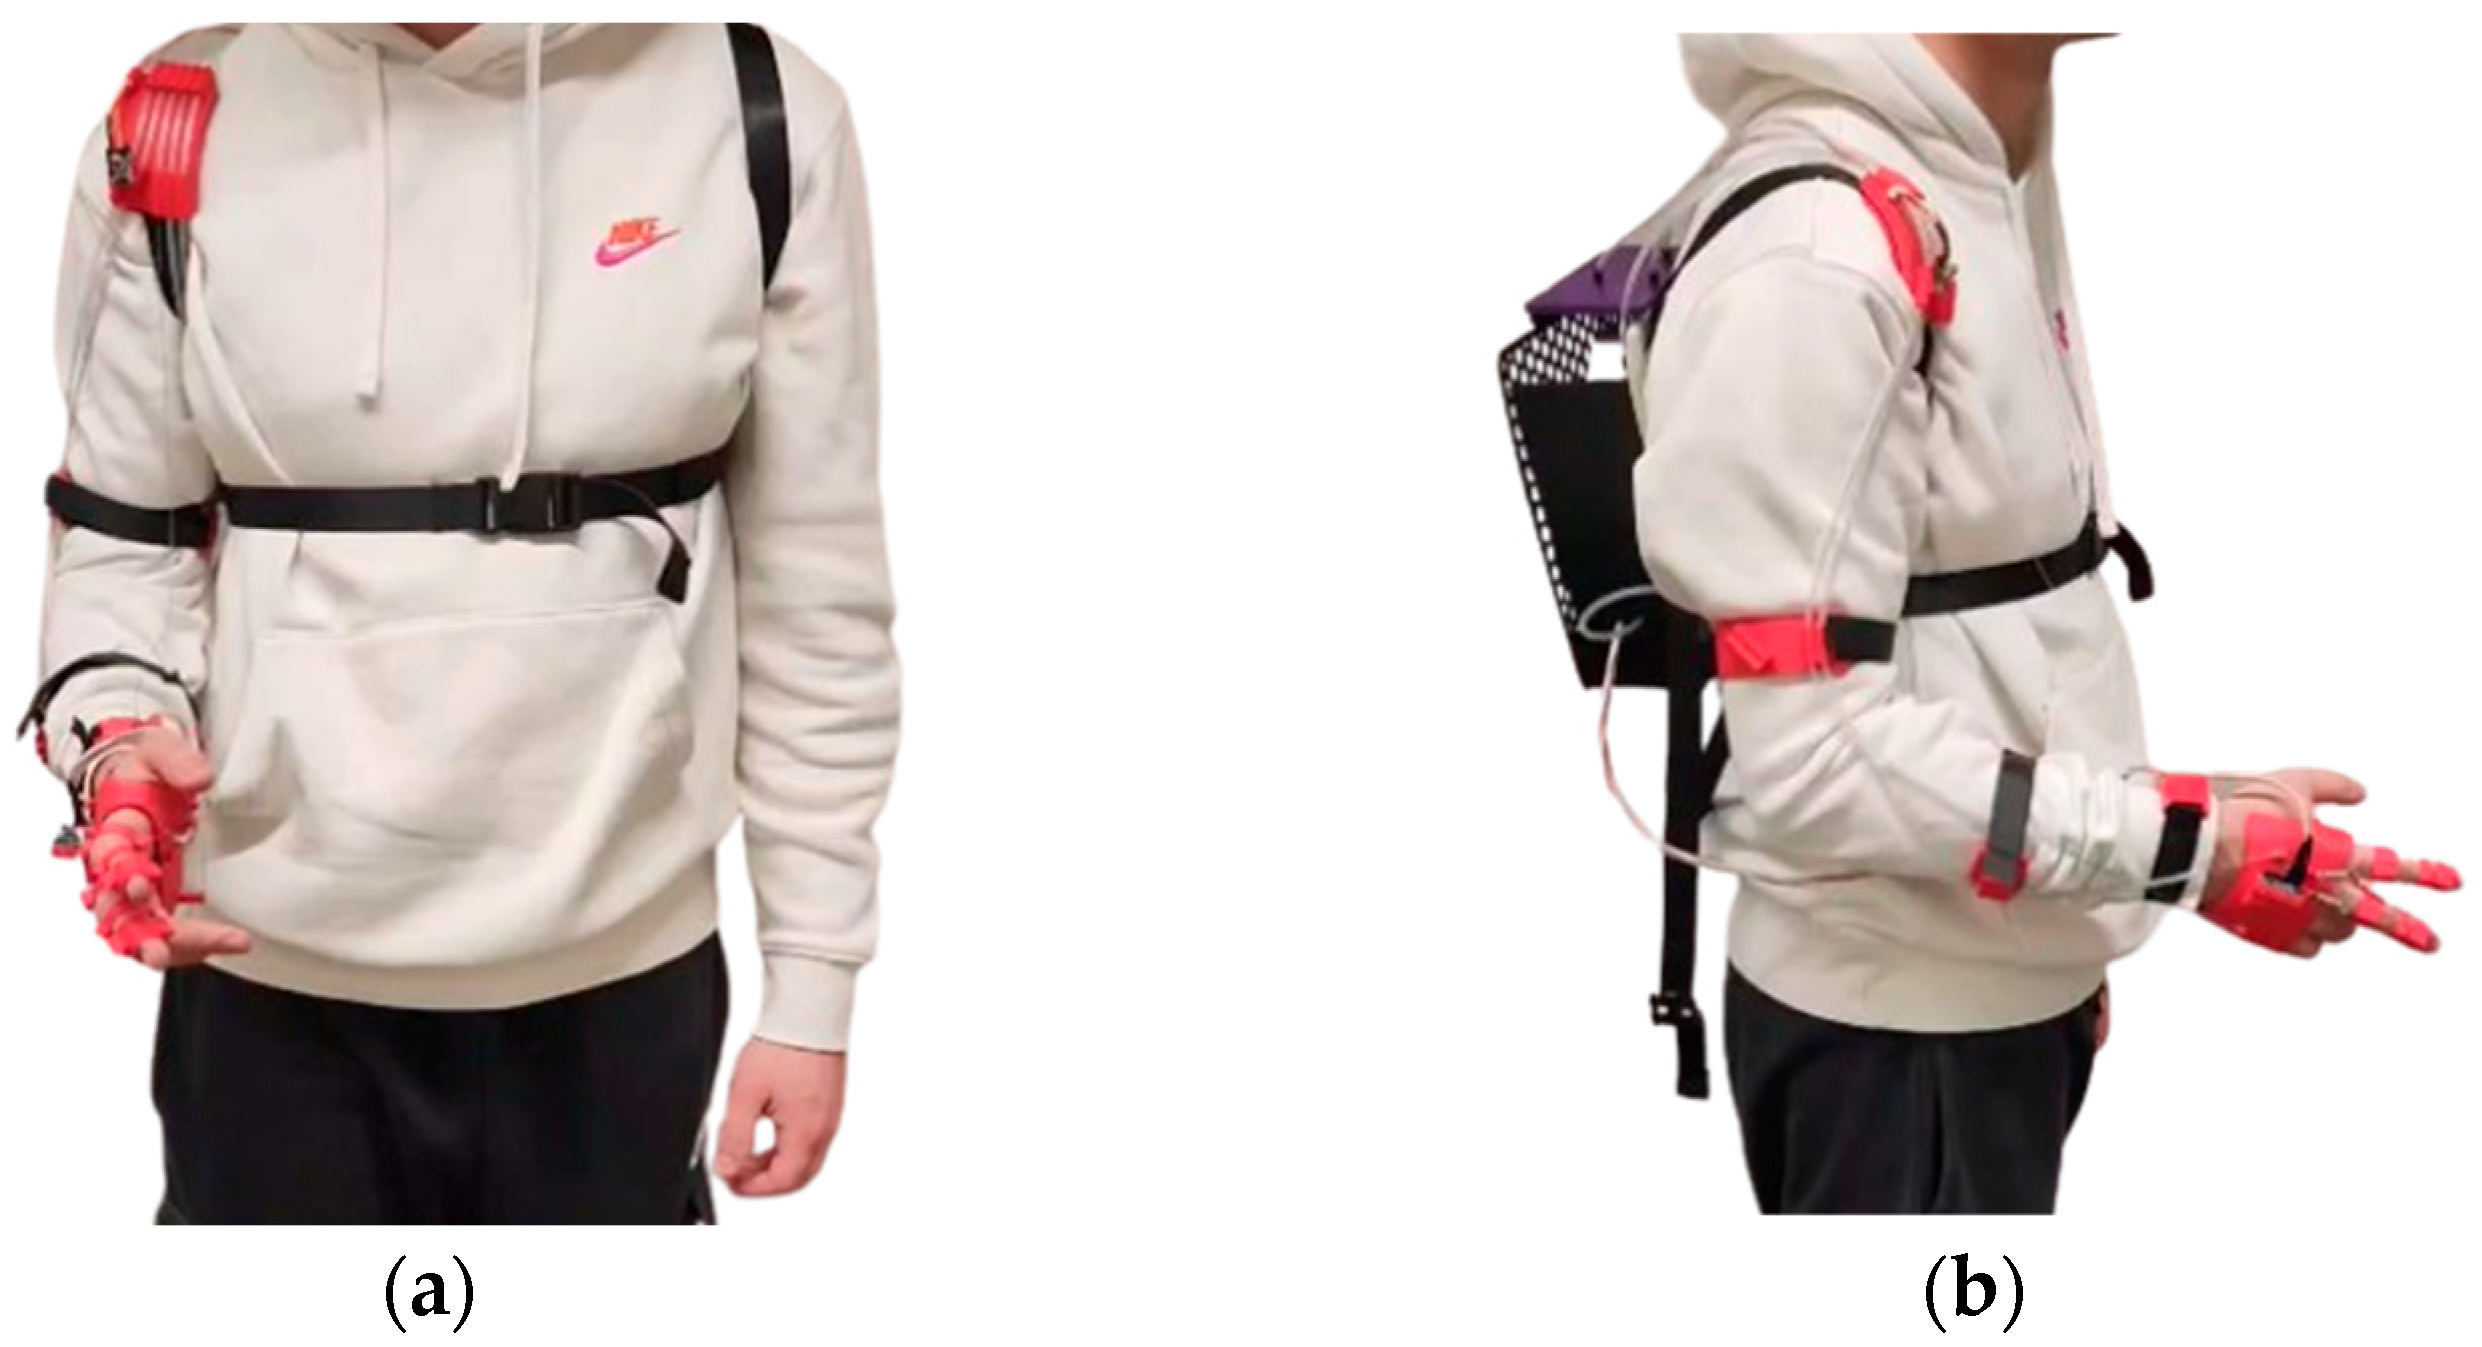
Figure 5.
Physical prototype of the cable-actuated exoskeleton: (a) front view of the worn system; (b) side view of the worn system.
Figure 5.
Physical prototype of the cable-actuated exoskeleton: (a) front view of the worn system; (b) side view of the worn system.
Figure 6.
Detailed view of the 3D models of the individual modules: (a) wrist module; (b) forearm module; (c) biceps module; (d) shoulder module; (e) glove; (f) finger rings.
Figure 6.
Detailed view of the 3D models of the individual modules: (a) wrist module; (b) forearm module; (c) biceps module; (d) shoulder module; (e) glove; (f) finger rings.
Figure 7.
Detailed view of the 3D backpack model: (a) CAD of the flexible TPU plate with honeycomb cover; (b) housing of individual motor modules with functional division highlighted—elbow motor in yellow, finger motors in blue, wrist motors in green.
Figure 7.
Detailed view of the 3D backpack model: (a) CAD of the flexible TPU plate with honeycomb cover; (b) housing of individual motor modules with functional division highlighted—elbow motor in yellow, finger motors in blue, wrist motors in green.
Figure 8.
Three-dimensional models of the power transmission system: (a) front and rear views of the pulleys; (b) manual tensioning tool; (c) pulley anti-unwind mechanisms.
Figure 8.
Three-dimensional models of the power transmission system: (a) front and rear views of the pulleys; (b) manual tensioning tool; (c) pulley anti-unwind mechanisms.
Figure 9.
Block diagram of the exoskeleton control system architecture.
Figure 9.
Block diagram of the exoskeleton control system architecture.
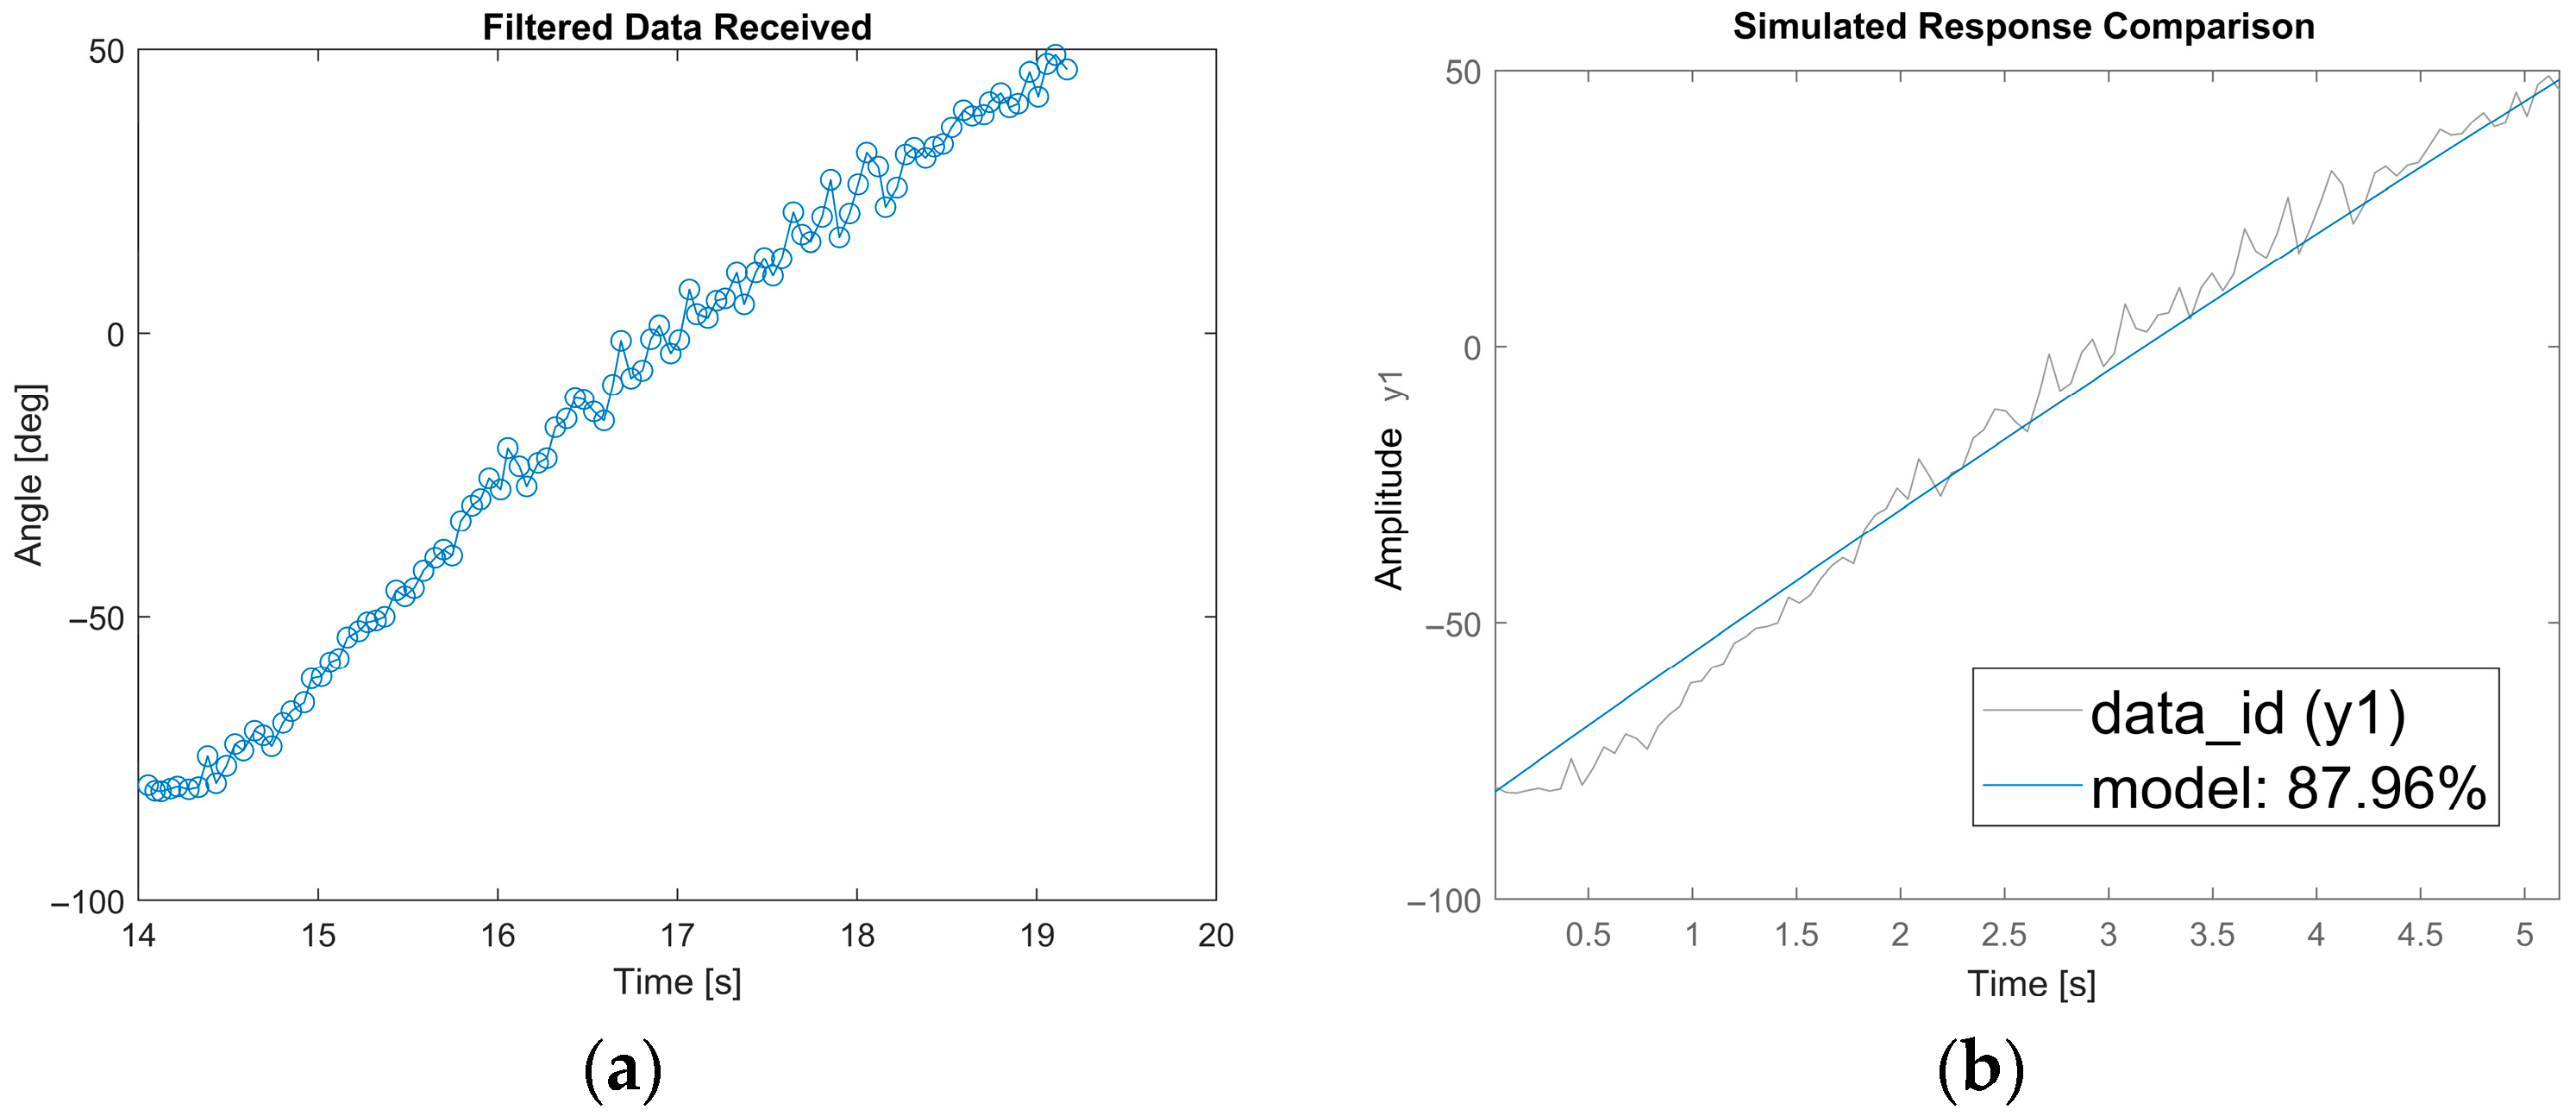
Figure 10.
Experimental results: (a) trend of angles measured as a function of time; (b) validation of the ARMA model by comparing experimental data and simulated output (fit = 87.96%).
Figure 10.
Experimental results: (a) trend of angles measured as a function of time; (b) validation of the ARMA model by comparing experimental data and simulated output (fit = 87.96%).
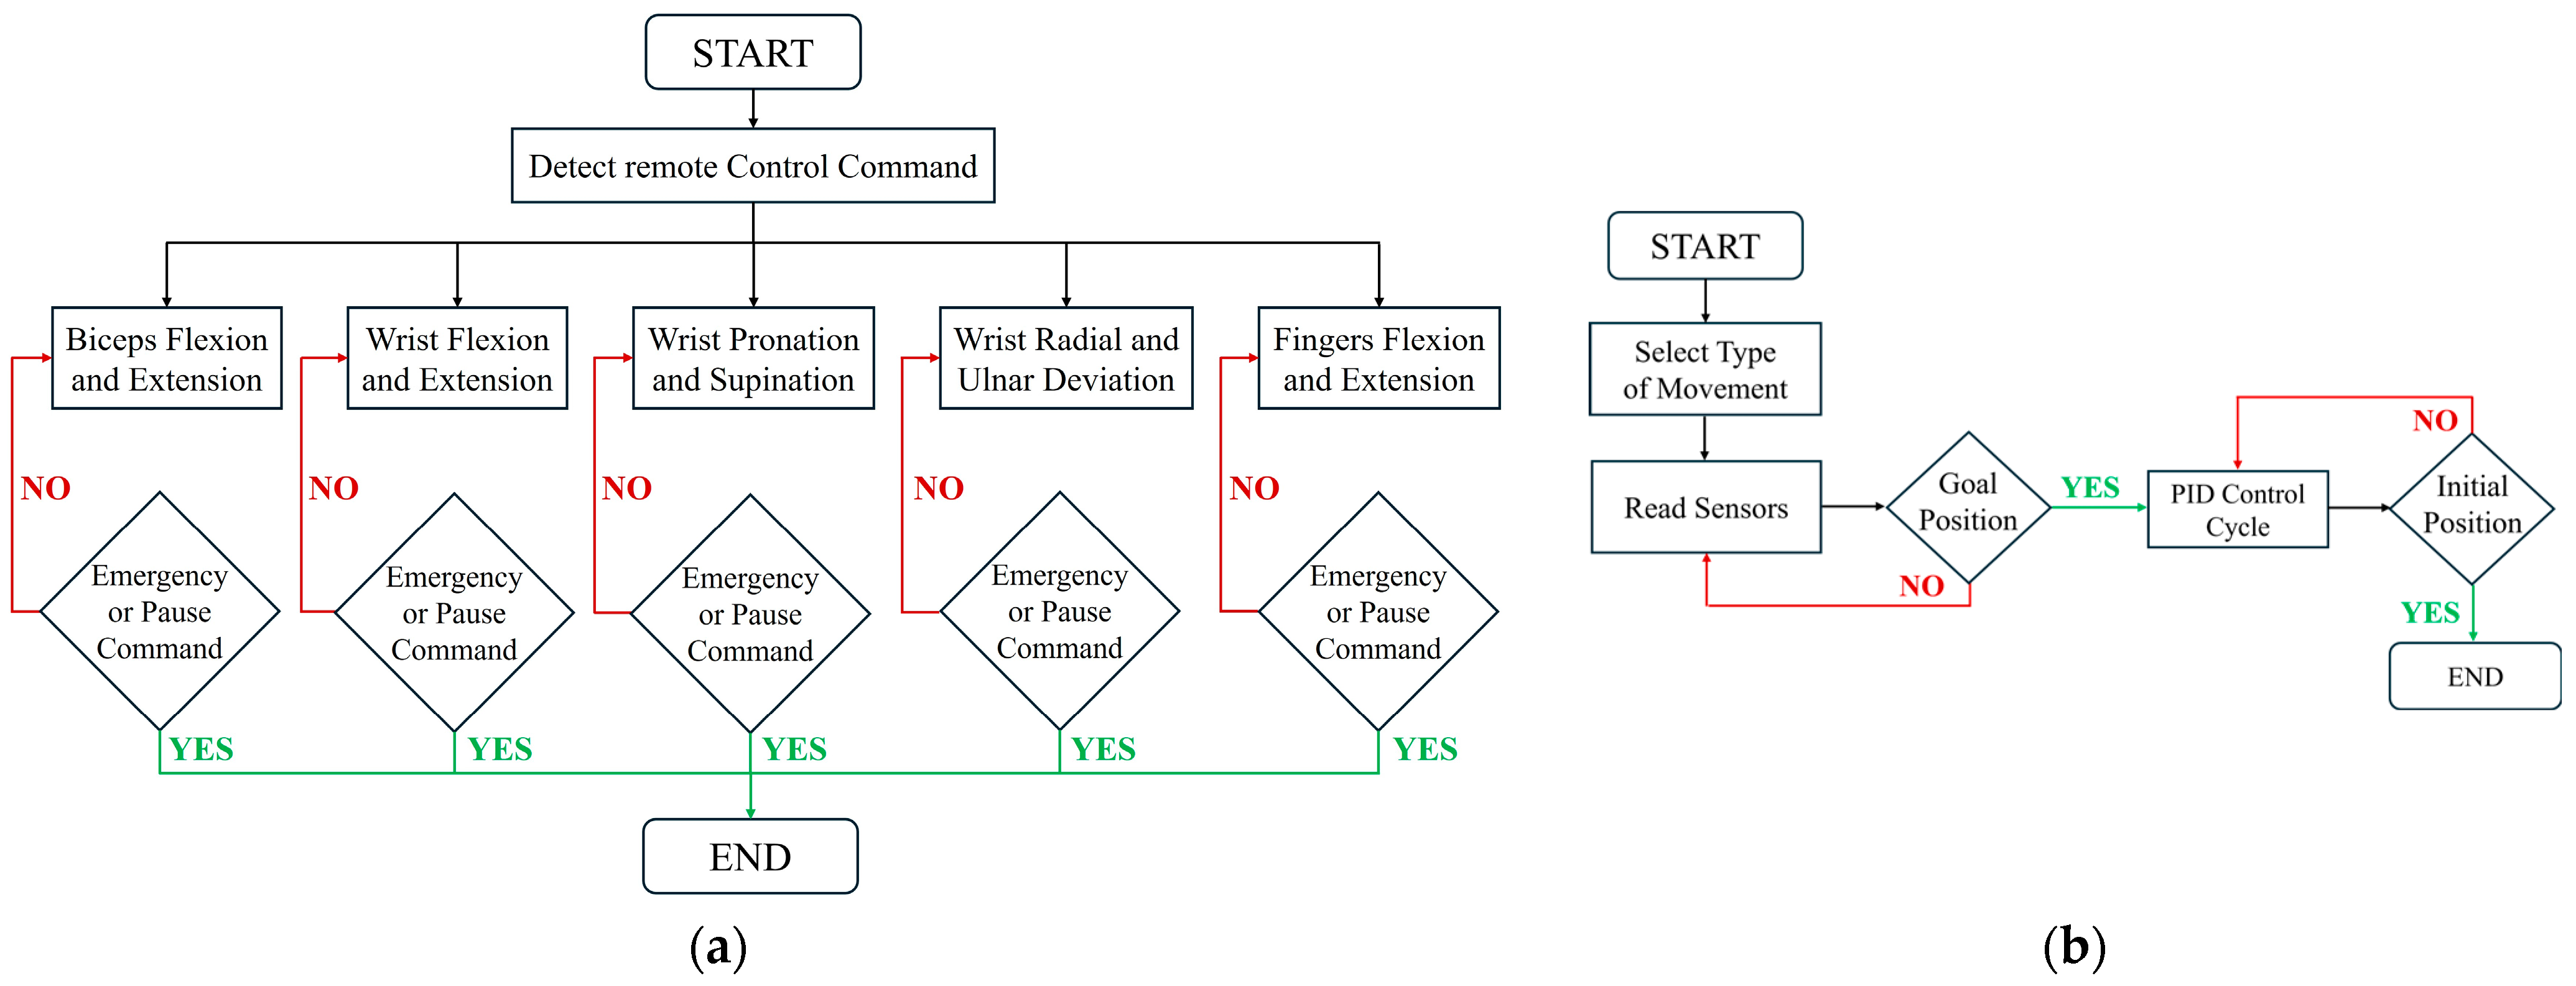
Figure 11.
Control architecture: (a) Master control flowchart; (b) Flowchart showing the operational sequence of the exoskeleton’s five primary movements: elbow flexion/extension, wrist movements, and finger actuation.
Figure 11.
Control architecture: (a) Master control flowchart; (b) Flowchart showing the operational sequence of the exoskeleton’s five primary movements: elbow flexion/extension, wrist movements, and finger actuation.
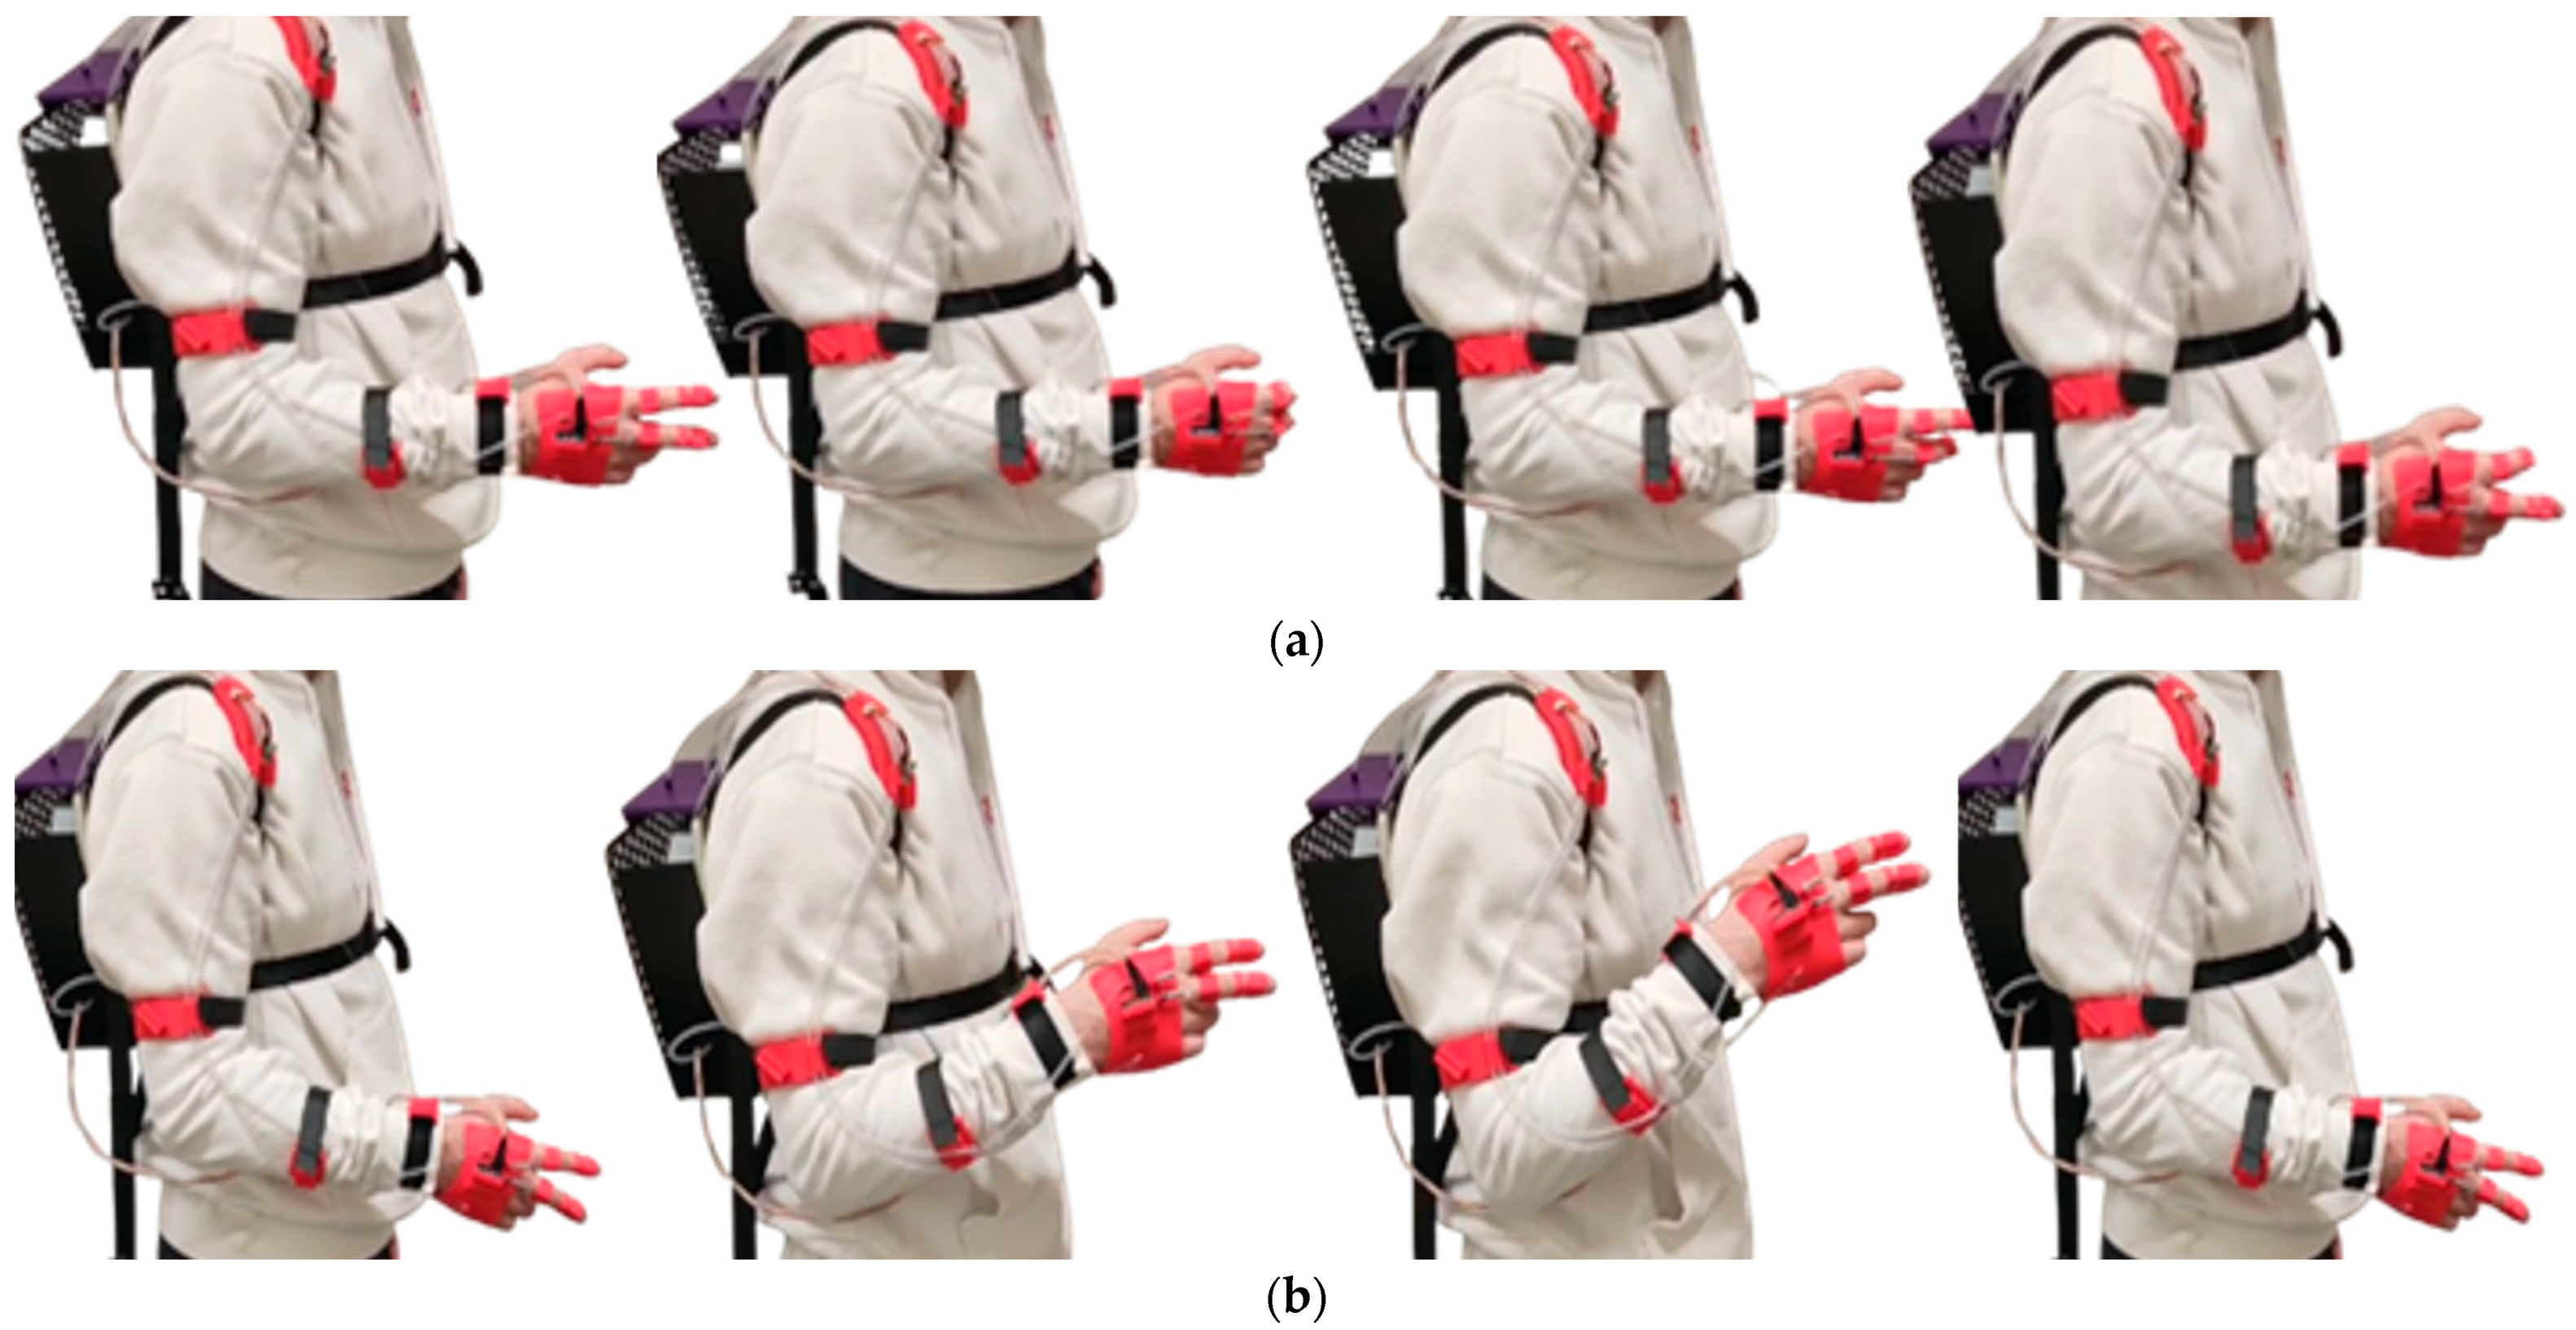
Figure 12.
Execution of motor sequences during the experimental tests: (a) finger flexion and extension; (b) biceps brachii flexion and extension.
Figure 12.
Execution of motor sequences during the experimental tests: (a) finger flexion and extension; (b) biceps brachii flexion and extension.
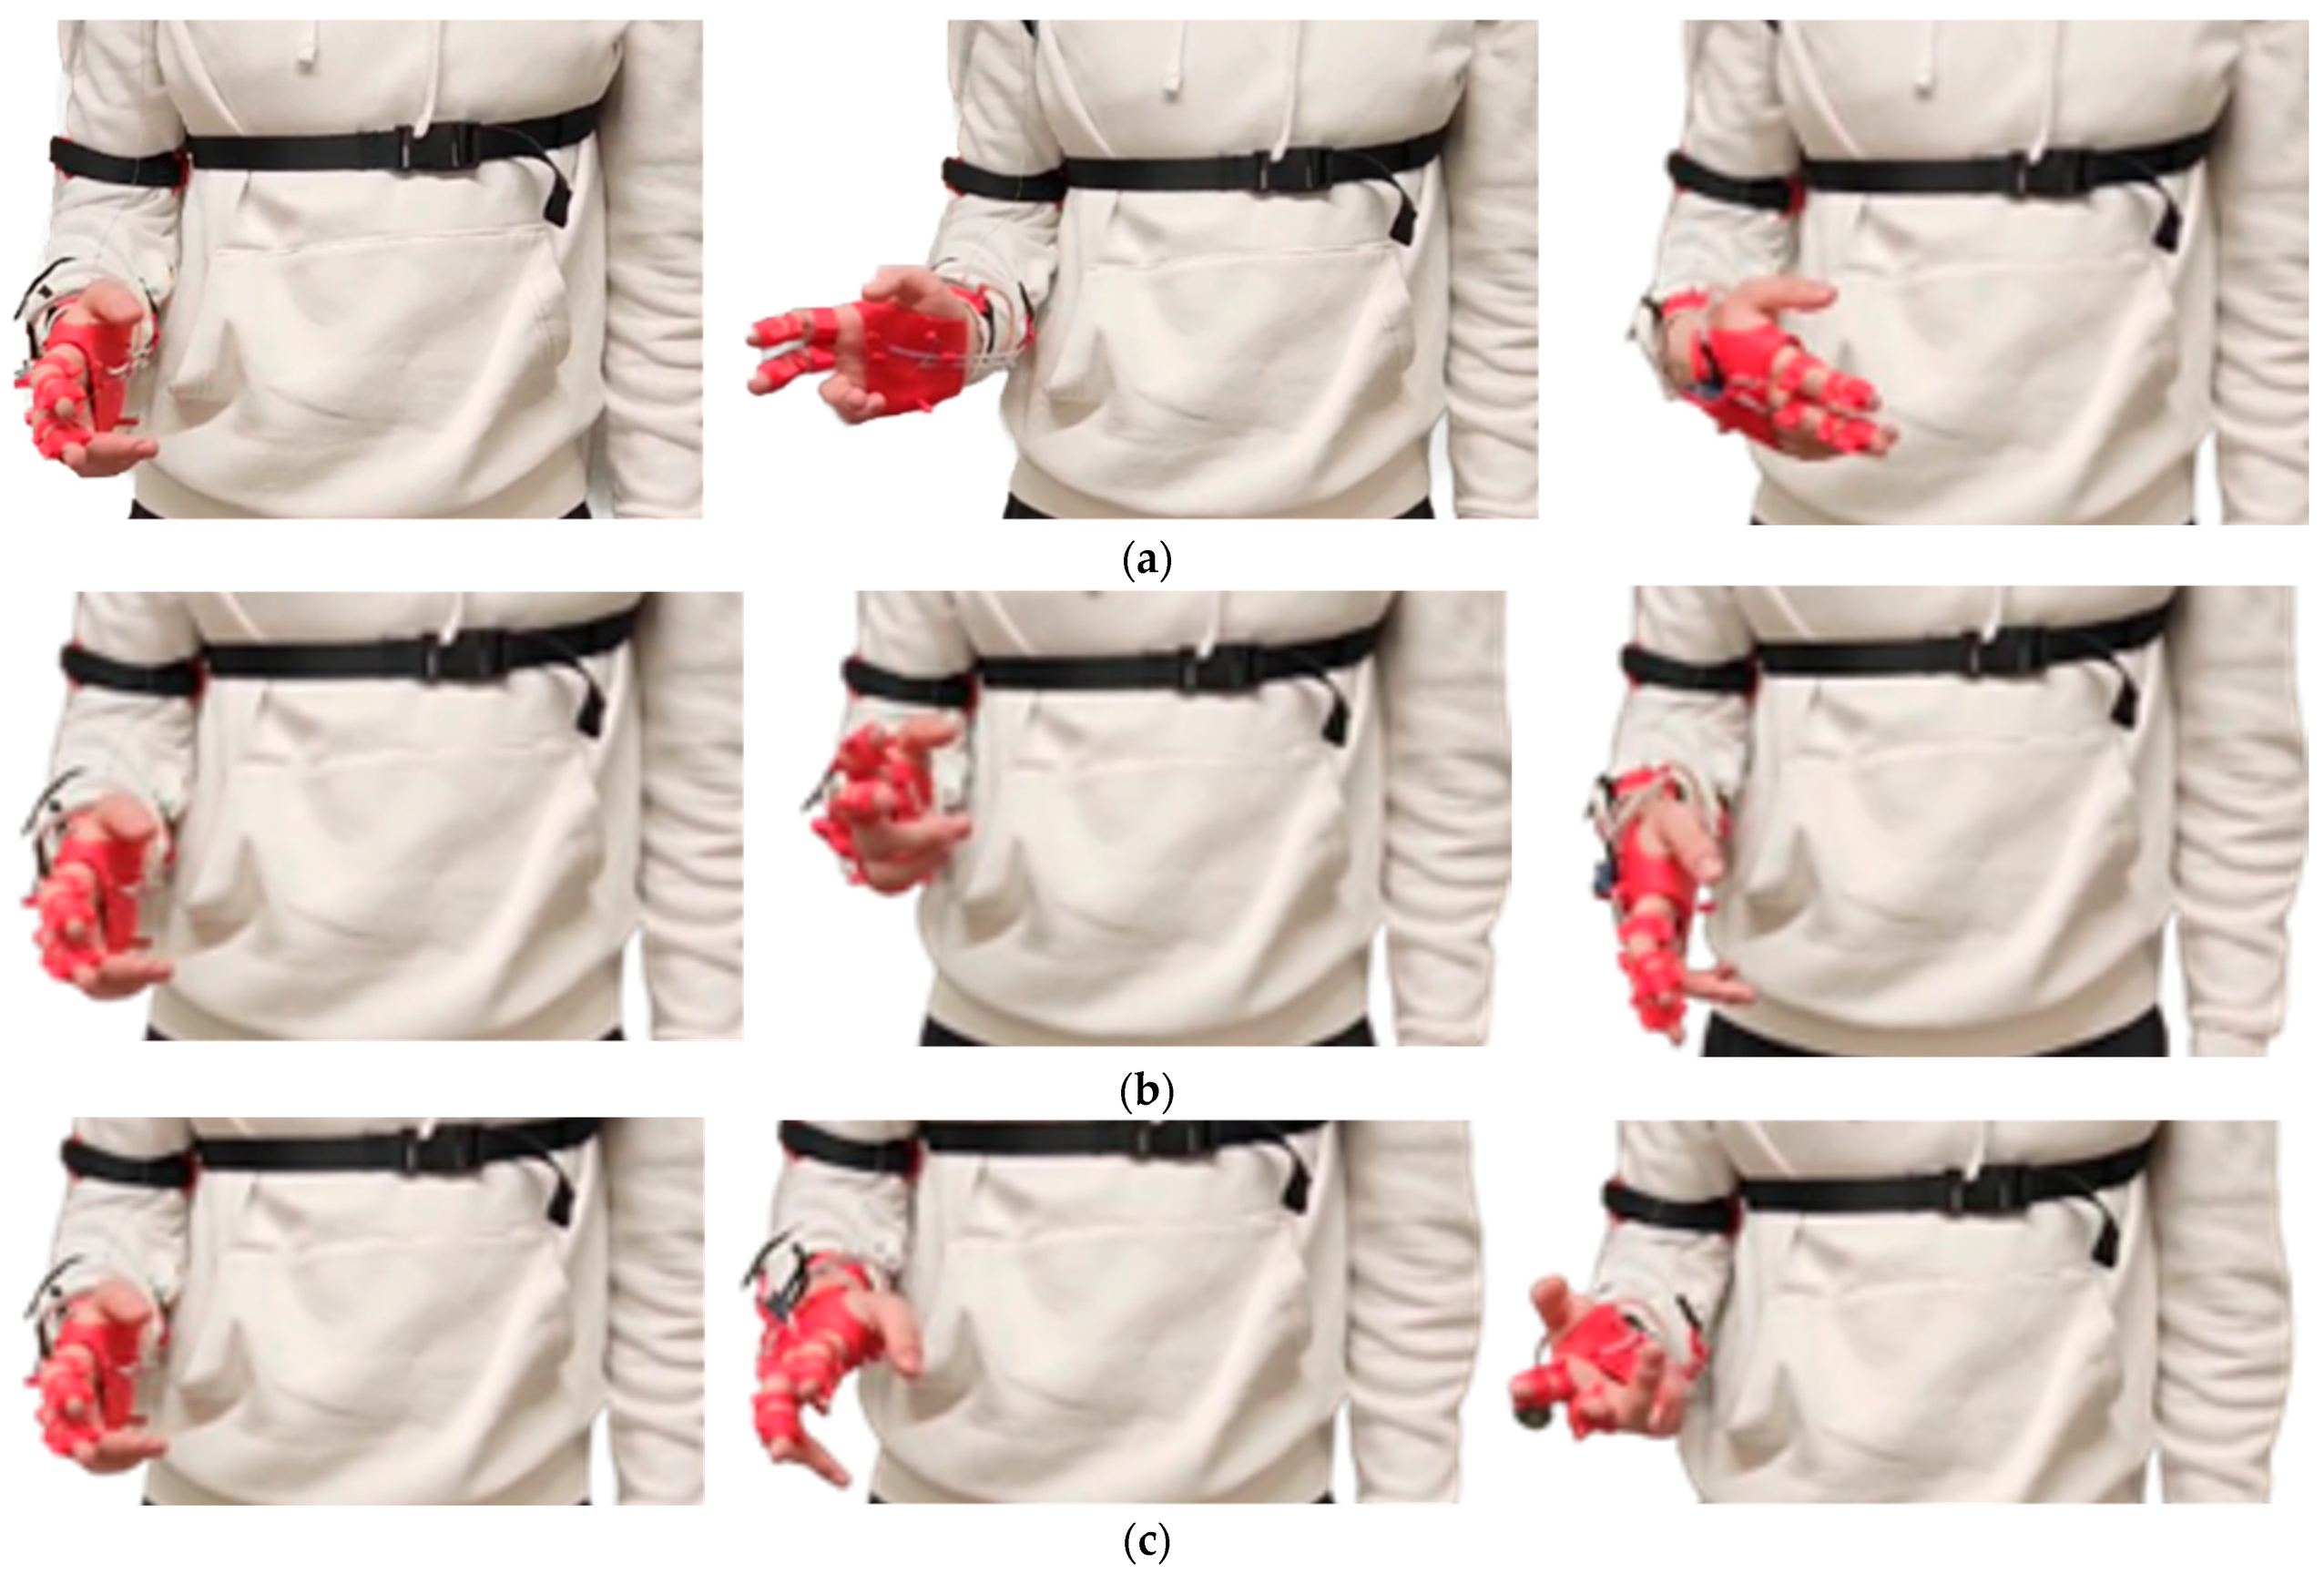
Figure 13.
Execution of motor sequences during the experimental tests: (a) wrist flexion and extension; (b) radial and ulnar deviation of the wrist; (c) wrist pronation and supination.
Figure 13.
Execution of motor sequences during the experimental tests: (a) wrist flexion and extension; (b) radial and ulnar deviation of the wrist; (c) wrist pronation and supination.
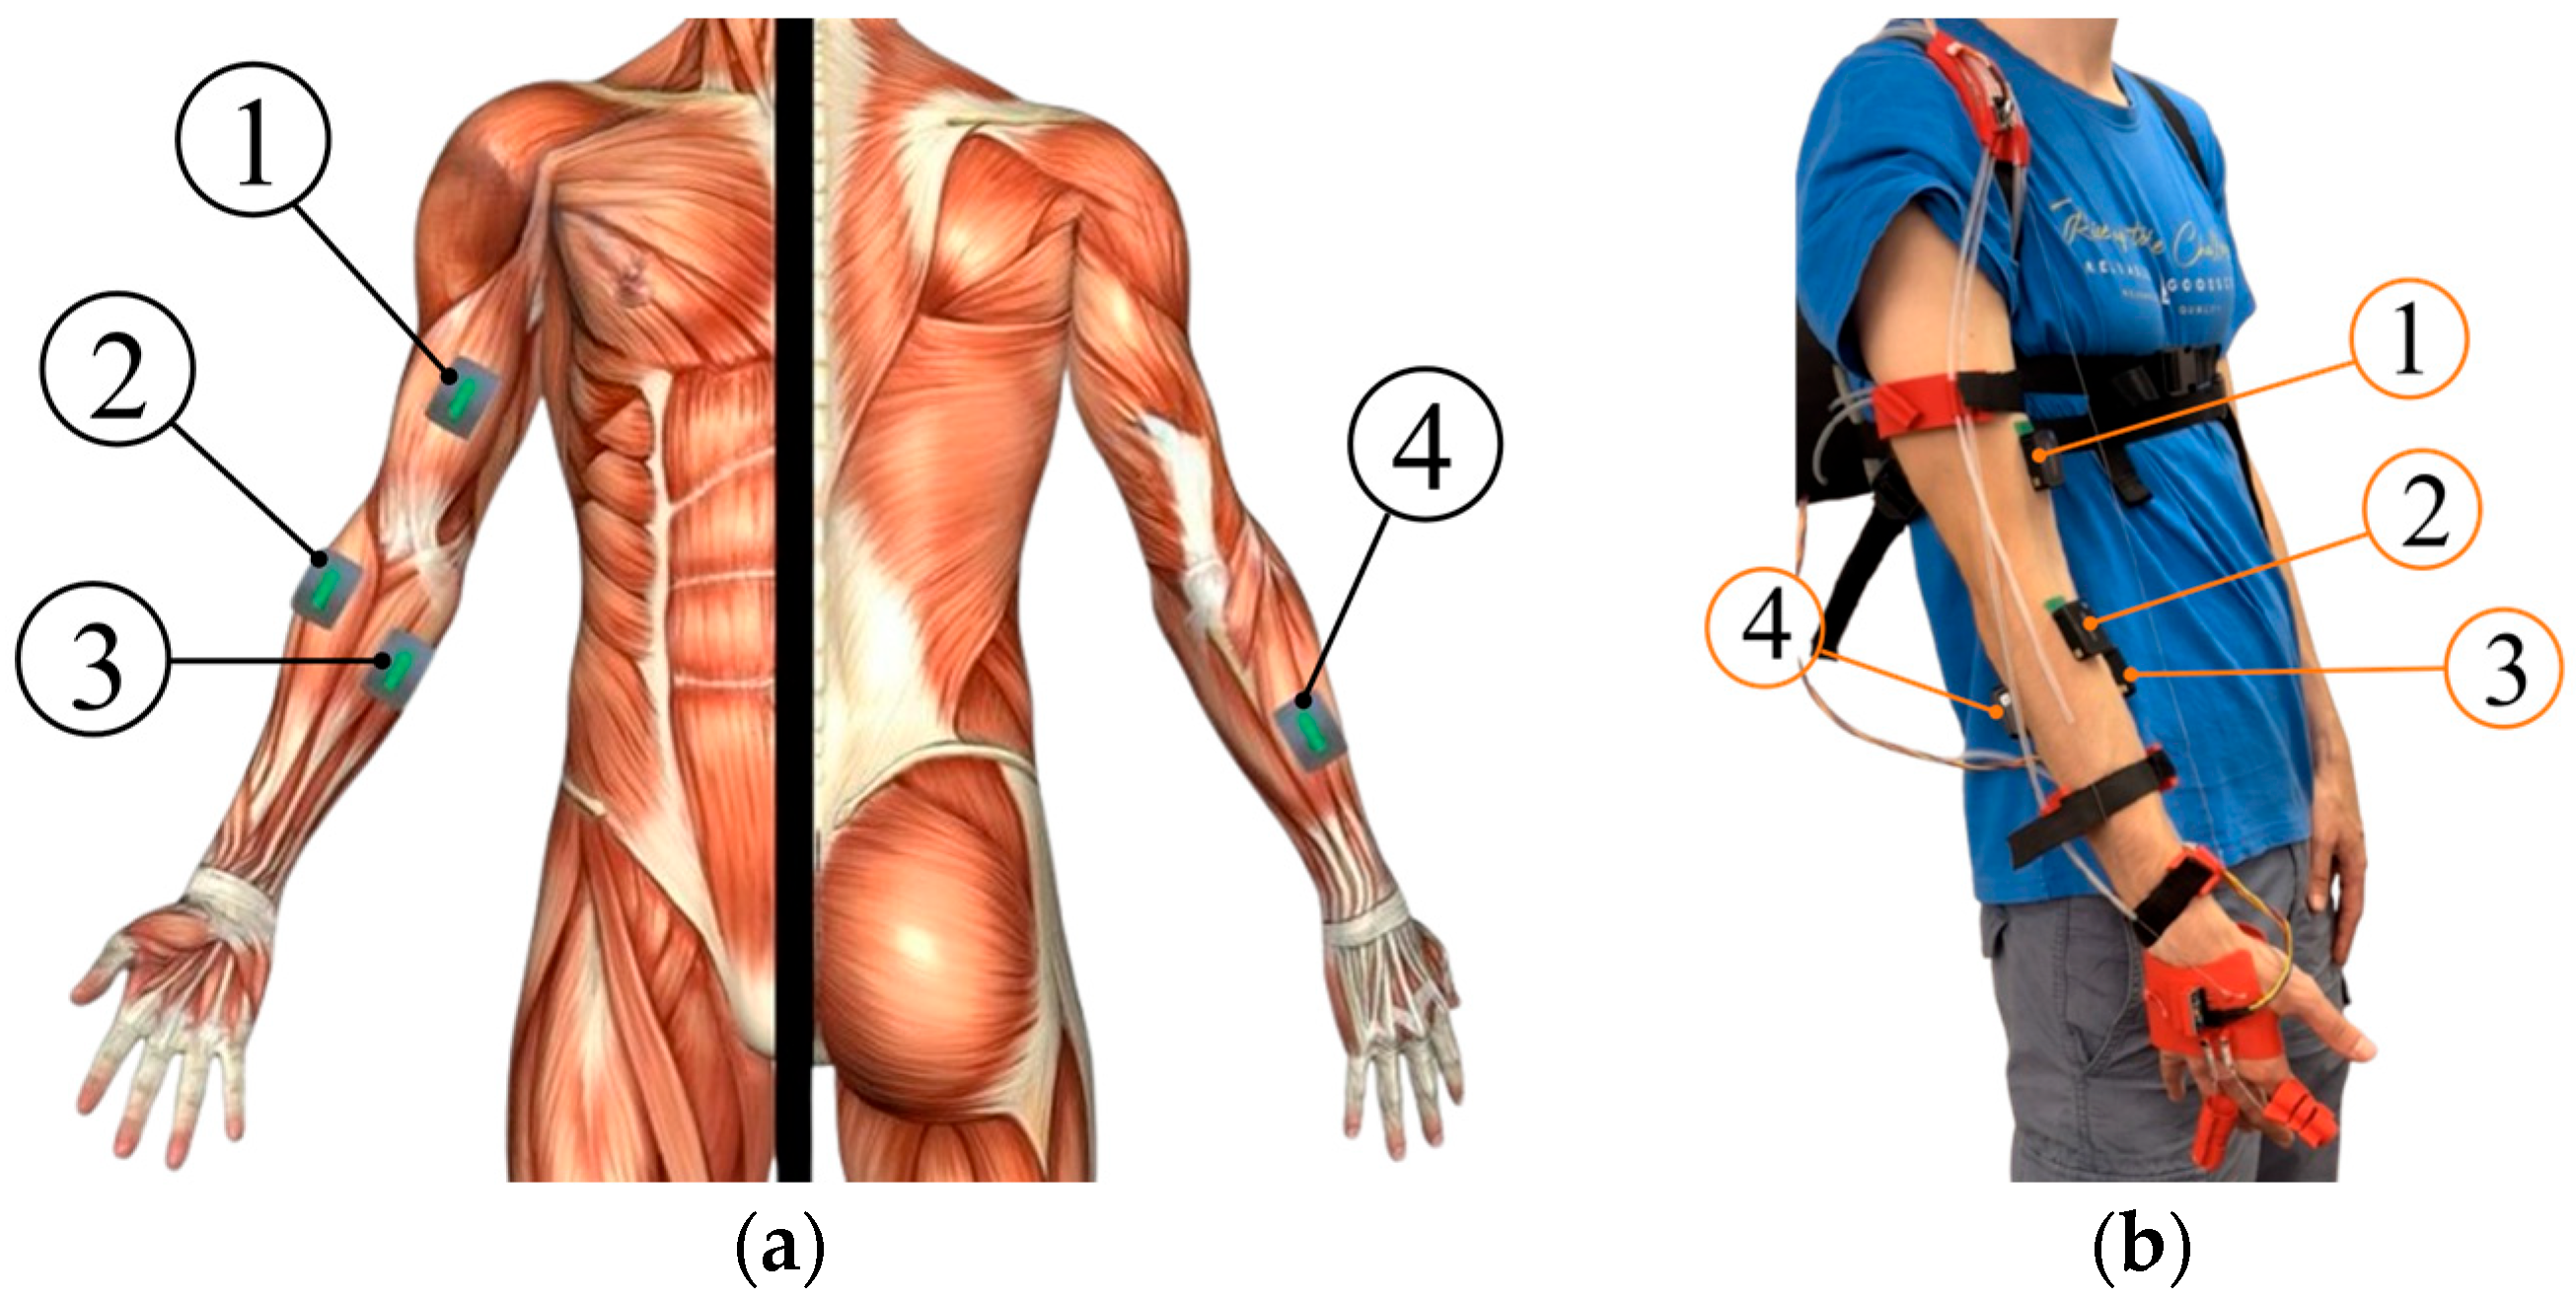
Figure 14.
EMG sensor placement: (a) Anatomical location of acquisition points; (b) Practical application of EMG sensors on the subject (① Biceps Brachii, ② Brachioradialis, ③ Flexor Digitorum Profundus, ④ Extensor Digitorum Communis).
Figure 14.
EMG sensor placement: (a) Anatomical location of acquisition points; (b) Practical application of EMG sensors on the subject (① Biceps Brachii, ② Brachioradialis, ③ Flexor Digitorum Profundus, ④ Extensor Digitorum Communis).
Figure 15.
Global comparison of muscle activation across all exercises. Box plots show RMS distributions for Exo Off vs. Exo On conditions. Boxes represent the 25th–75th percentiles, whiskers extend to 1.5 × IQR, circles denote individual participant means, and diamonds indicate group means (n = 128 per condition; 8 participants × 4 muscles × 4 exercises).
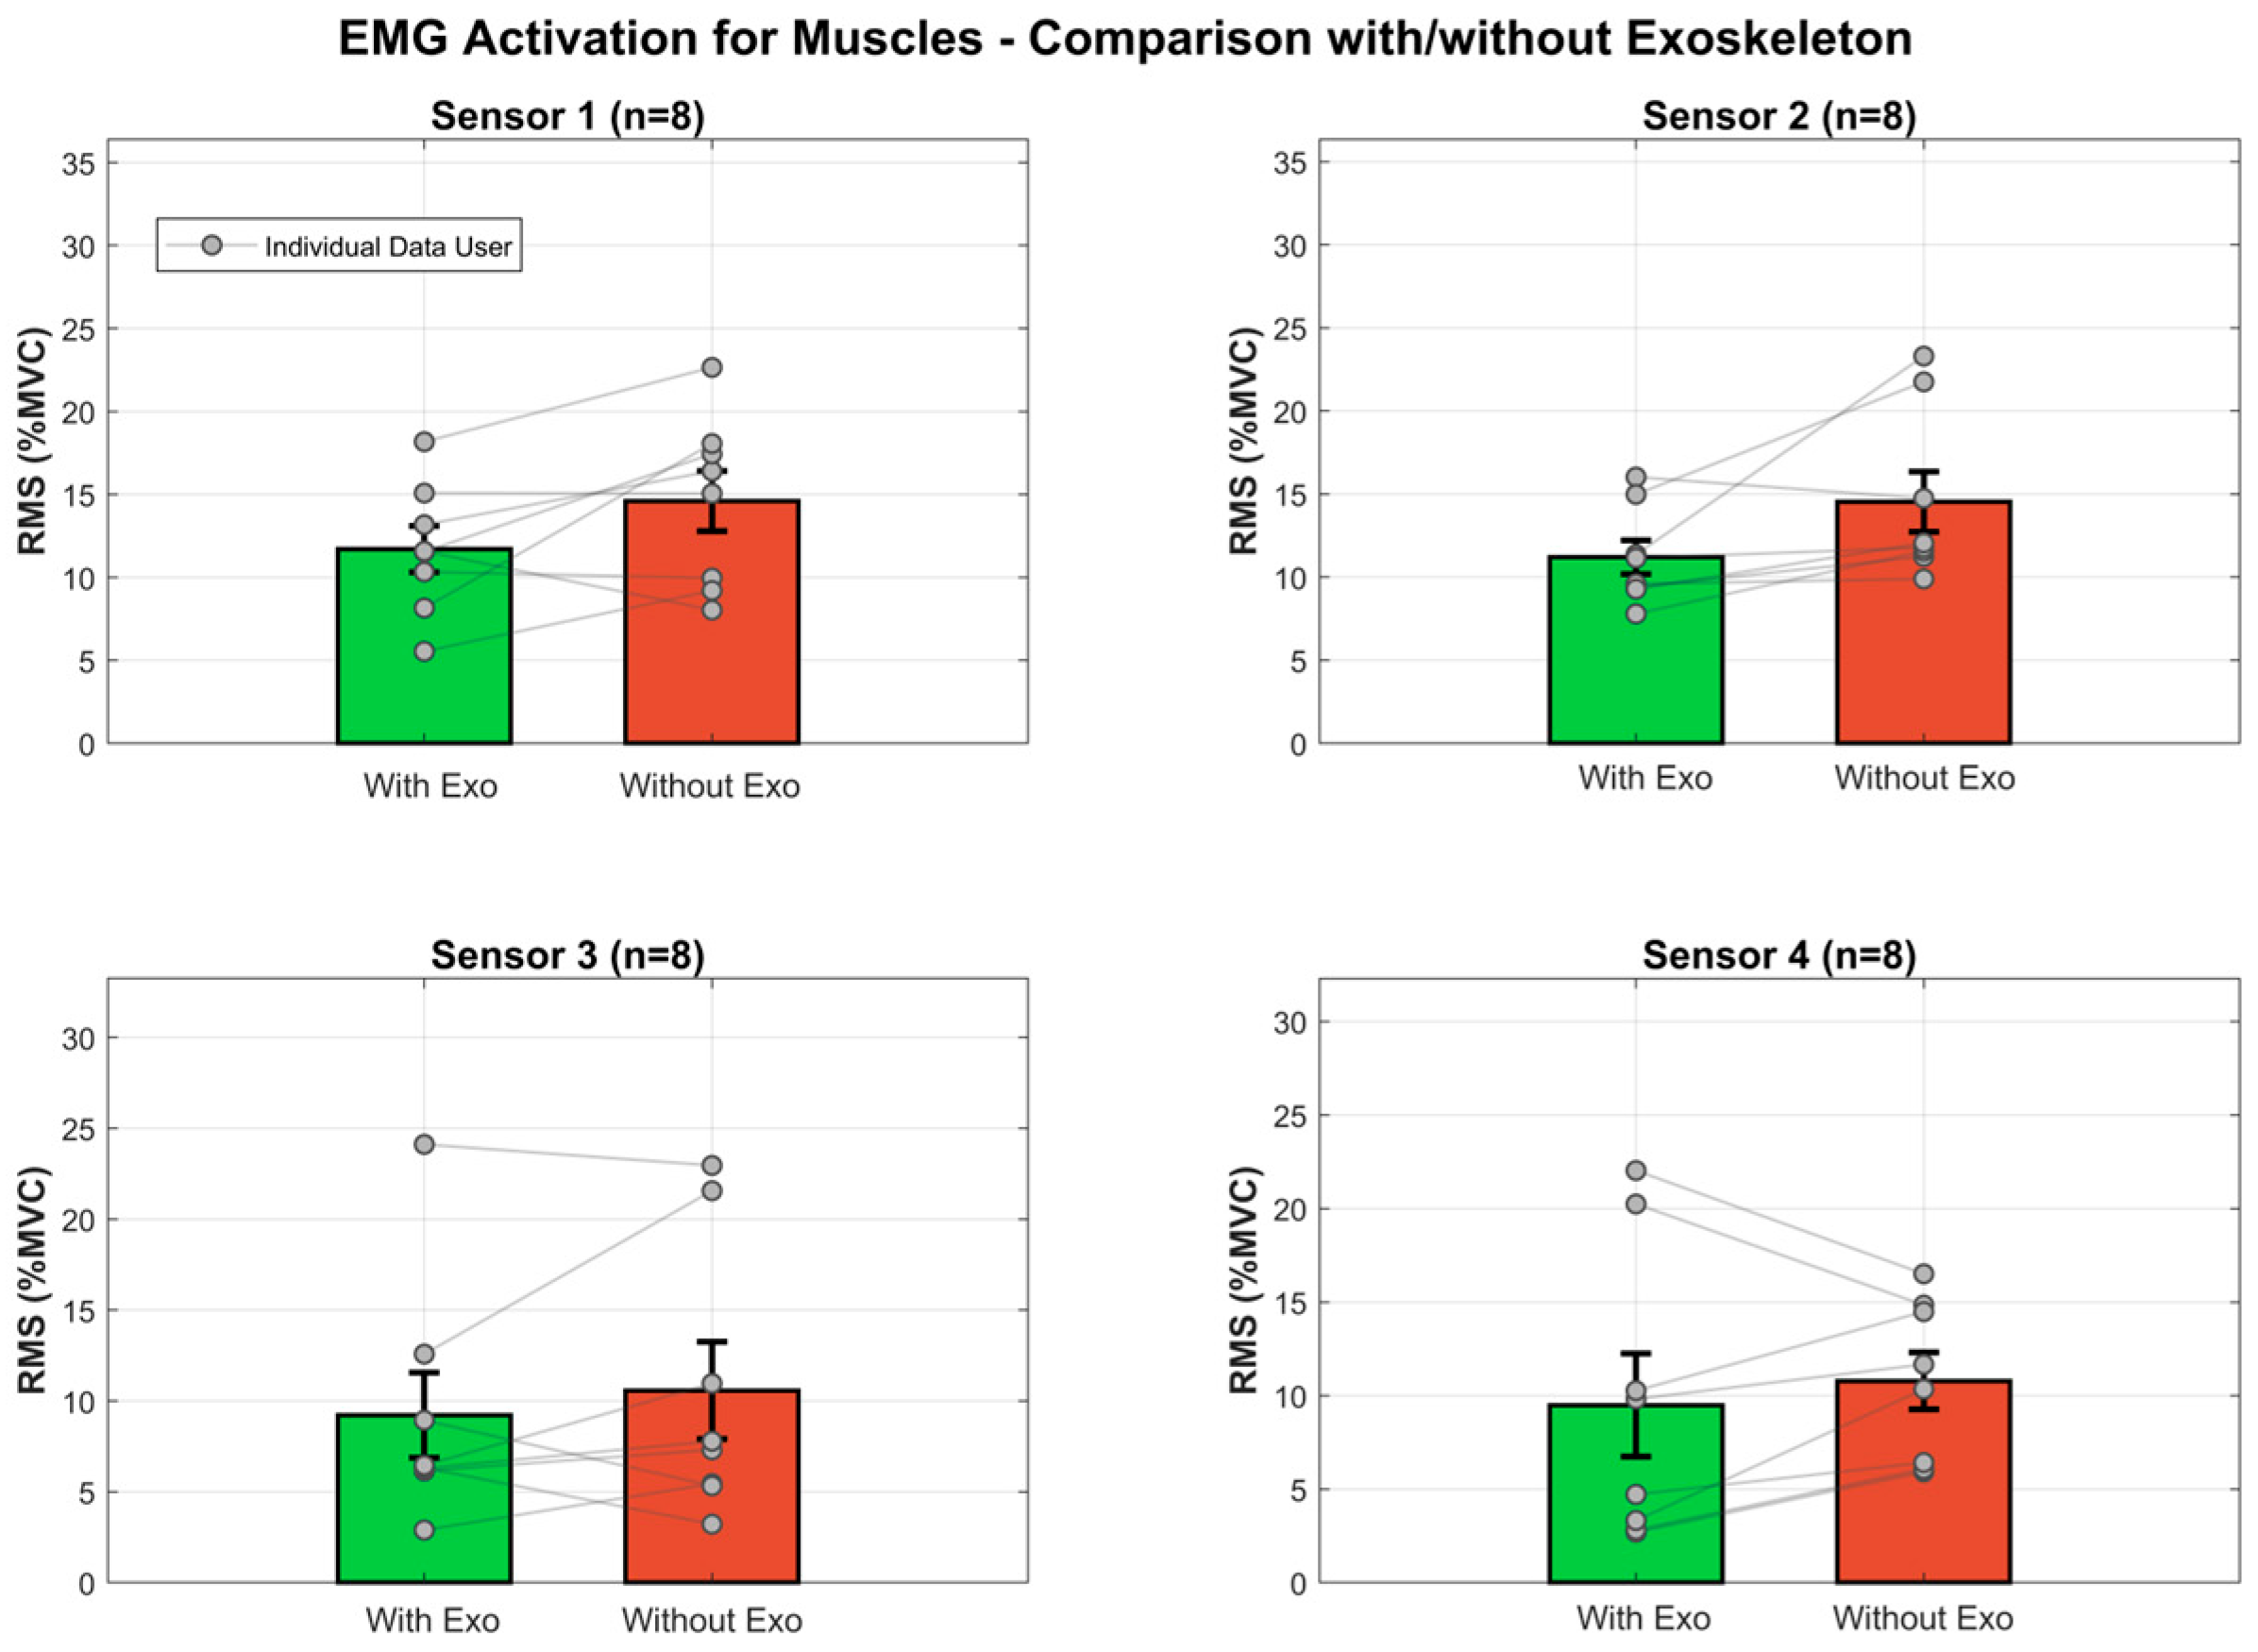
Figure 16.
Muscle activation comparison between Exo Off and Exo On conditions. Bar plots show mean RMS values (±SE) normalized to MVC for the four monitored muscles. Points represent participant means connected by lines to illustrate within-subject changes.
Figure 16.
Muscle activation comparison between Exo Off and Exo On conditions. Bar plots show mean RMS values (±SE) normalized to MVC for the four monitored muscles. Points represent participant means connected by lines to illustrate within-subject changes.
Figure 17.
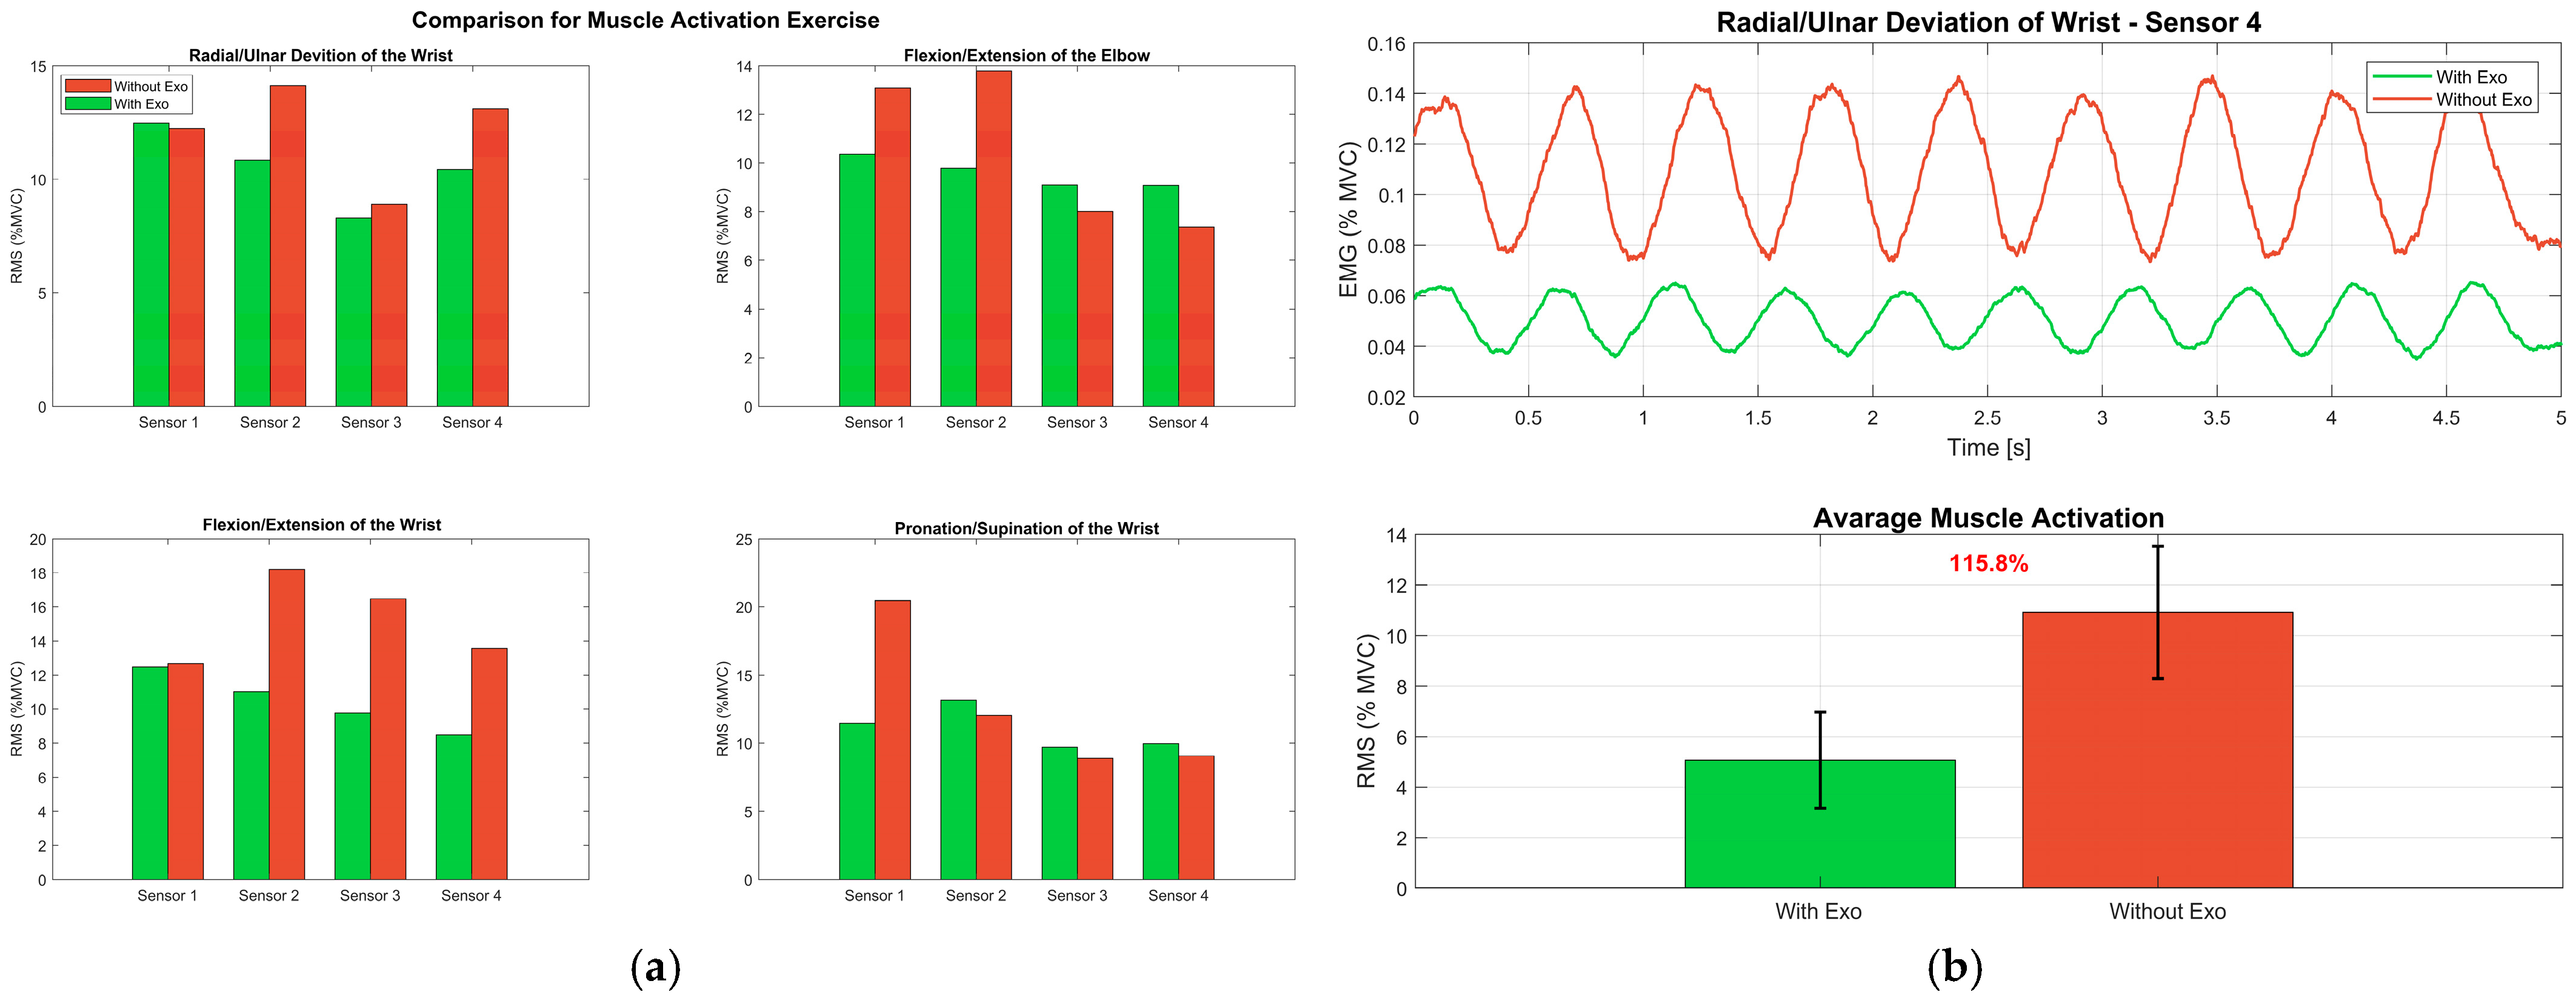
Muscle activity during exercises: (a) Mean RMS values of the four muscles across the four exercises, with bars grouped by condition (Exo Off vs. Exo On); (b) EMG temporal analysis during a representative radial/ulnar deviation test, showing five consecutive repetitions (Rep 1–Rep 5) of the filtered signals of the four monitored muscles.
Table 1.
Coordinates of the attachment points, reported as percentages relative to the total length of the corresponding body segment.
Table 1.
Coordinates of the attachment points, reported as percentages relative to the total length of the corresponding body segment.
| Movement | Extension/Flexion |
| | Hand Attachment Points | Forearm Attachment Points |
| Coordinate Axis | E1h, E2h | F1h, F2h | E1f, E2f | F1F, F2f |
| X | 16, −16 | 16, −16 | 16, −16 | 16, −16 |
| Y | 16, 16 | −16, −16 | 11, 11 | −11, −11 |
| Z | 16, 16 | 16, 16 | −75, −75 | −75, −75 |
| Movement | Ulnar/Radial Deviation |
| Coordinate Axis | U1h, U2h | R1h, R2h | U1f, U2f | R1f, R2f |
| X | −5, −5 | 5, 5 | −5, −5 | 5, 5 |
| Y | 16, −16 | 16, −16 | 11, −11 | 11, −11 |
| Z | 16, 16 | 16, 16 | −75, −75 | −75, −75 |
Table 2.
Maximum forces and cable shortening for wrist movements, obtained from multibody simulations using the optimal attachment configuration.
Table 2.
Maximum forces and cable shortening for wrist movements, obtained from multibody simulations using the optimal attachment configuration.
| Movement | ROM * | Maximum Force | Maximum Shortening |
|---|
| Flexion–Extension | ±60° | 19.0 N | 40 mm |
| Ulnar–Radial Deviation | +18° to −33° | 17.2 N | 7 mm |
| Pronation–Supination | ±60° | 20.27 N | 11 mm |
Table 3.
Product Design Specification (PDS) of the developed device.
Table 3.
Product Design Specification (PDS) of the developed device.
| FUNCTION | Exoskeleton for multi-joint rehabilitation (elbow, wrist, fingers) |
PHYSICAL
SPECIFICATIONS | DIMENSIONS |
| Upper Limb (without Fingers) | 300 × 45 × 30 mm |
| Fingers | 40 × 20 × 20 mm |
| Backpack | 160 × 180 × 2 mm |
| WEIGHT |
| Weight of modules | 0.4–0.6 kg |
| Total Weight | 1.2–1.5 kg |
OPERATING
PARAMETERS | POSITIONING |
| Manual, mounted on the limb and back |
| CONTROL SYSTEM |
| Microcontroller with IMU and IR sensors |
| EXECUTION |
| Autonomous and remote-controlled mode |
| SAFETY |
| Emergency button, force limitation |
| MAINTENANCE |
| Periodic inspection of cables, pulleys, and transmissions |
| CONDITIONS OF USE | Temperature | −20 °C to +20 °C |
| Environments | Home or clinical |
| External Agents | Sheltered and dry |
| MANUFACTURING | Additive Manufacturing (3D Printing) |
| MATERIALS | Modules, Pulleys, Cover | PLA |
| Backpack Plate | TPU |
| Cables | Braided Nylon |
| Fastening System | Velcro |
Table 4.
Calibrated bias values for accelerometer and gyroscope.
Table 4.
Calibrated bias values for accelerometer and gyroscope.
| Accelerometer | Value [m/s2] | Gyroscope | Value [rad/s2] |
|---|
| −8.78 | | −0.03 |
| −8.72 | | 0.02 |
| −9.01 | | −0.01 |
Table 5.
PID controller parameters for different joint controls.
Table 5.
PID controller parameters for different joint controls.
| Control Type | Kp | Ki | Kd | Notes |
|---|
| Elbow | 1.2 | 0.2 | 0 | Closed-loop PID for Flexion/extension |
| Wrist | 0.9 | 0.3 | 0 | PID for pronation/supination and radial/ulnar deviation |
Table 6.
Participant characteristics and anthropometric measurements.
Table 6.
Participant characteristics and anthropometric measurements.
| Participant | Age | Height [m] | Weight [kg] | Arm [cm] | Forearm [cm] | Hand [cm] |
|---|
| 1 | 23 | 1.78 | 65 | 36.5 | 28.0 | 16.5 |
| 2 | 24 | 1.78 | 62 | 35.0 | 26.5 | 18.5 |
| 3 | 26 | 1.65 | 72 | 34.5 | 28.0 | 16.3 |
| 4 | 28 | 1.80 | 64 | 34.5 | 28.0 | 17.0 |
| 5 | 25 | 1.76 | 75 | 36.0 | 27.5 | 18.0 |
| 6 | 29 | 1.75 | 77.5 | 33.8 | 27.5 | 17.0 |
| 7 | 31 | 1.77 | 72 | 36.0 | 28.0 | 21.0 |
| 8 | 29 | 1.78 | 89 | 36.0 | 28.0 | 20.0 |
| Mean ± SD | 26.9 ± 3.7 | 1.76 ± 0.05 | 71.6 ± 8.9 | 35.0 ± 1.0 | 27.7 ± 0.5 | 18.0 ± 1.8 |
Table 7.
Experimental protocol specifications for the four functional upper limb exercises performed under Exo Off and Exo On conditions.
Table 7.
Experimental protocol specifications for the four functional upper limb exercises performed under Exo Off and Exo On conditions.
| Exercise | Target Joint | Movement Plane | ROM [deg] | Reps/Set | Sets | Rest |
|---|
| Flexion/Extension | Elbow | Sagittal | 0° to 90° | 5 | 3 | 1 min |
| Wrist | Sagittal | −60° to +65° | 5 | 3 | 1 min |
| Radial/Ulnar Deviation | Wrist | Frontal | −30° to +15° | 5 | 3 | 1 min |
| Pronation/supination | Forearm | Transverse | −70° to +80° | 5 | 3 | 1 min |
Table 8.
Overview of monitored muscles and their biomechanical functions: BB (Biceps Brachii), BR (Brachioradialis), FDP (Flexor Digitorum Profundus), and EDC (Extensor Digitorum Communis).
Table 8.
Overview of monitored muscles and their biomechanical functions: BB (Biceps Brachii), BR (Brachioradialis), FDP (Flexor Digitorum Profundus), and EDC (Extensor Digitorum Communis).
| Sensor | Muscle Name | Anatomical Location | Primary Function | Target Exercise |
|---|
| 1 | BB | Mid-belly, anterior upper arm | Elbow flexion | Flexion/extension |
| Forearm supination | Pronation/supination |
| 2 | BR | Upper third forearm, lateral | Elbow flexion | All exercises
(stabilizer) |
| Forearm neutral position |
| 3 | FDP | Proximal third forearm, volar | Finger flexion | Wrist movements |
| Wrist flexion | Finger tasks |
| 4 | EDC | Lateral epicondyle region, dorsal | Finger extension | Wrist movements |
| Wrist extension | Finger tasks |
Table 9.
Statistical summary of muscle-specific effects with values expressed as mean ± SD (n = 8).
Table 9.
Statistical summary of muscle-specific effects with values expressed as mean ± SD (n = 8).
| Muscle | Exo On (%MVC) | Exo Off (%MVC) | Difference (%MVC) | Reduction (%) | t-Statistic | p-Value | Cohen’s d | Effect Size |
|---|
| BB | 11.70 ± 3.93 | 14.60 ± 5.10 | 2.90 ± 4.17 | 24.8% | 1.966 | 0.090 | 0.695 | Medium |
| BR | 11.20 ± 2.89 | 14.54 ± 5.13 | 3.34 ± 4.25 | 29.8% | 2.222 | 0.062 | 0.786 | Medium |
| FDP | 9.22 ± 6.63 | 10.57 ± 7.57 | 1.35 ± 4.13 | 14.7% | 0.922 | 0.387 | 0.326 | Small |
| EDC | 9.49 ± 7.79 | 10.78 ± 4.29 | 1.29 ± 4.47 | 13.6% | 0.816 | 0.441 | 0.289 | Small |
Table 10.
Muscle activation by exercise and condition: positive Δ values indicate reduced activation with exoskeleton (Exo Off—Exo On).
Table 10.
Muscle activation by exercise and condition: positive Δ values indicate reduced activation with exoskeleton (Exo Off—Exo On).
| Exercise | Muscle | Exo On (%MVC) | Exo Off (%MVC) | Δ (%MVC) | p-Value | Cohen’s d |
|---|
| Elbow Flexion/Extension | BB | 10.3 | 13.1 | 2.7 | 0.213 | 0.48 |
| BR | 9.8 | 13.8 | 4.0 | 0.074 | 0.74 |
| FDP | 9.1 | 8.0 | −1.1 | 0.545 | −0.22 |
| EDC | 9.1 | 7.4 | −1.7 | 0.646 | −0.17 |
| Radial/Ulnar Deviation of the Wrist | BB | 12.5 | 12.2 | −0.3 | 0.875 | −0.06 |
| BR | 10.8 | 14.1 | 3.3 | 0.045 | 0.86 |
| FDP | 8.3 | 8.9 | 0.6 | 0.467 | 0.27 |
| EDC | 10.4 | 13.1 | 2.7 | 0.340 | 0.36 |
| Wrist Flexion/Extension | BB | 12.5 | 12.7 | 0.2 | 0.901 | 0.05 |
| BR | 11.0 | 18.2 | 7.2 | 0.193 | 0.51 |
| FDP | 9.8 | 16.5 | 6.7 | 0.087 | 0.70 |
| EDC | 8.5 | 13.6 | 5.1 | 0.074 | 0.74 |
| Wrist Pronation/Supination | BB | 11.5 | 20.4 | 9.0 | 0.055 | 0.81 |
| BR | 13.2 | 12.0 | −1.1 | 0.501 | −0.25 |
| FDP | 9.7 | 8.9 | −0.8 | 0.631 | −0.18 |
| EDC | 10.0 | 9.1 | −0.9 | 0.439 | −0.29 |

