3.1. Model Validation
The dehazing network is implemented using PyTorch1.8.0, CUDA10.0, and Python3.8. The training model is completed on a single NVIDIA RTX 4070 (12 GB). The network is trained using 100 epochs, the network input image size is 360 × 128, and the initial learning rate of the model is set as 0.001. We train the network for 100 epochs with a batch size of 16.
To validate the proposed model, the path transmittance of water mist is compared with the absolute temperature error
. Suppose that
is the temperature calculated from the water mist-dehazed billet image
and
is the temperature calculated based on the corresponding mist-free billet image
. Thus,
can be calculated as follows:
We randomly chose one set of casting billet images from the dataset and calculated
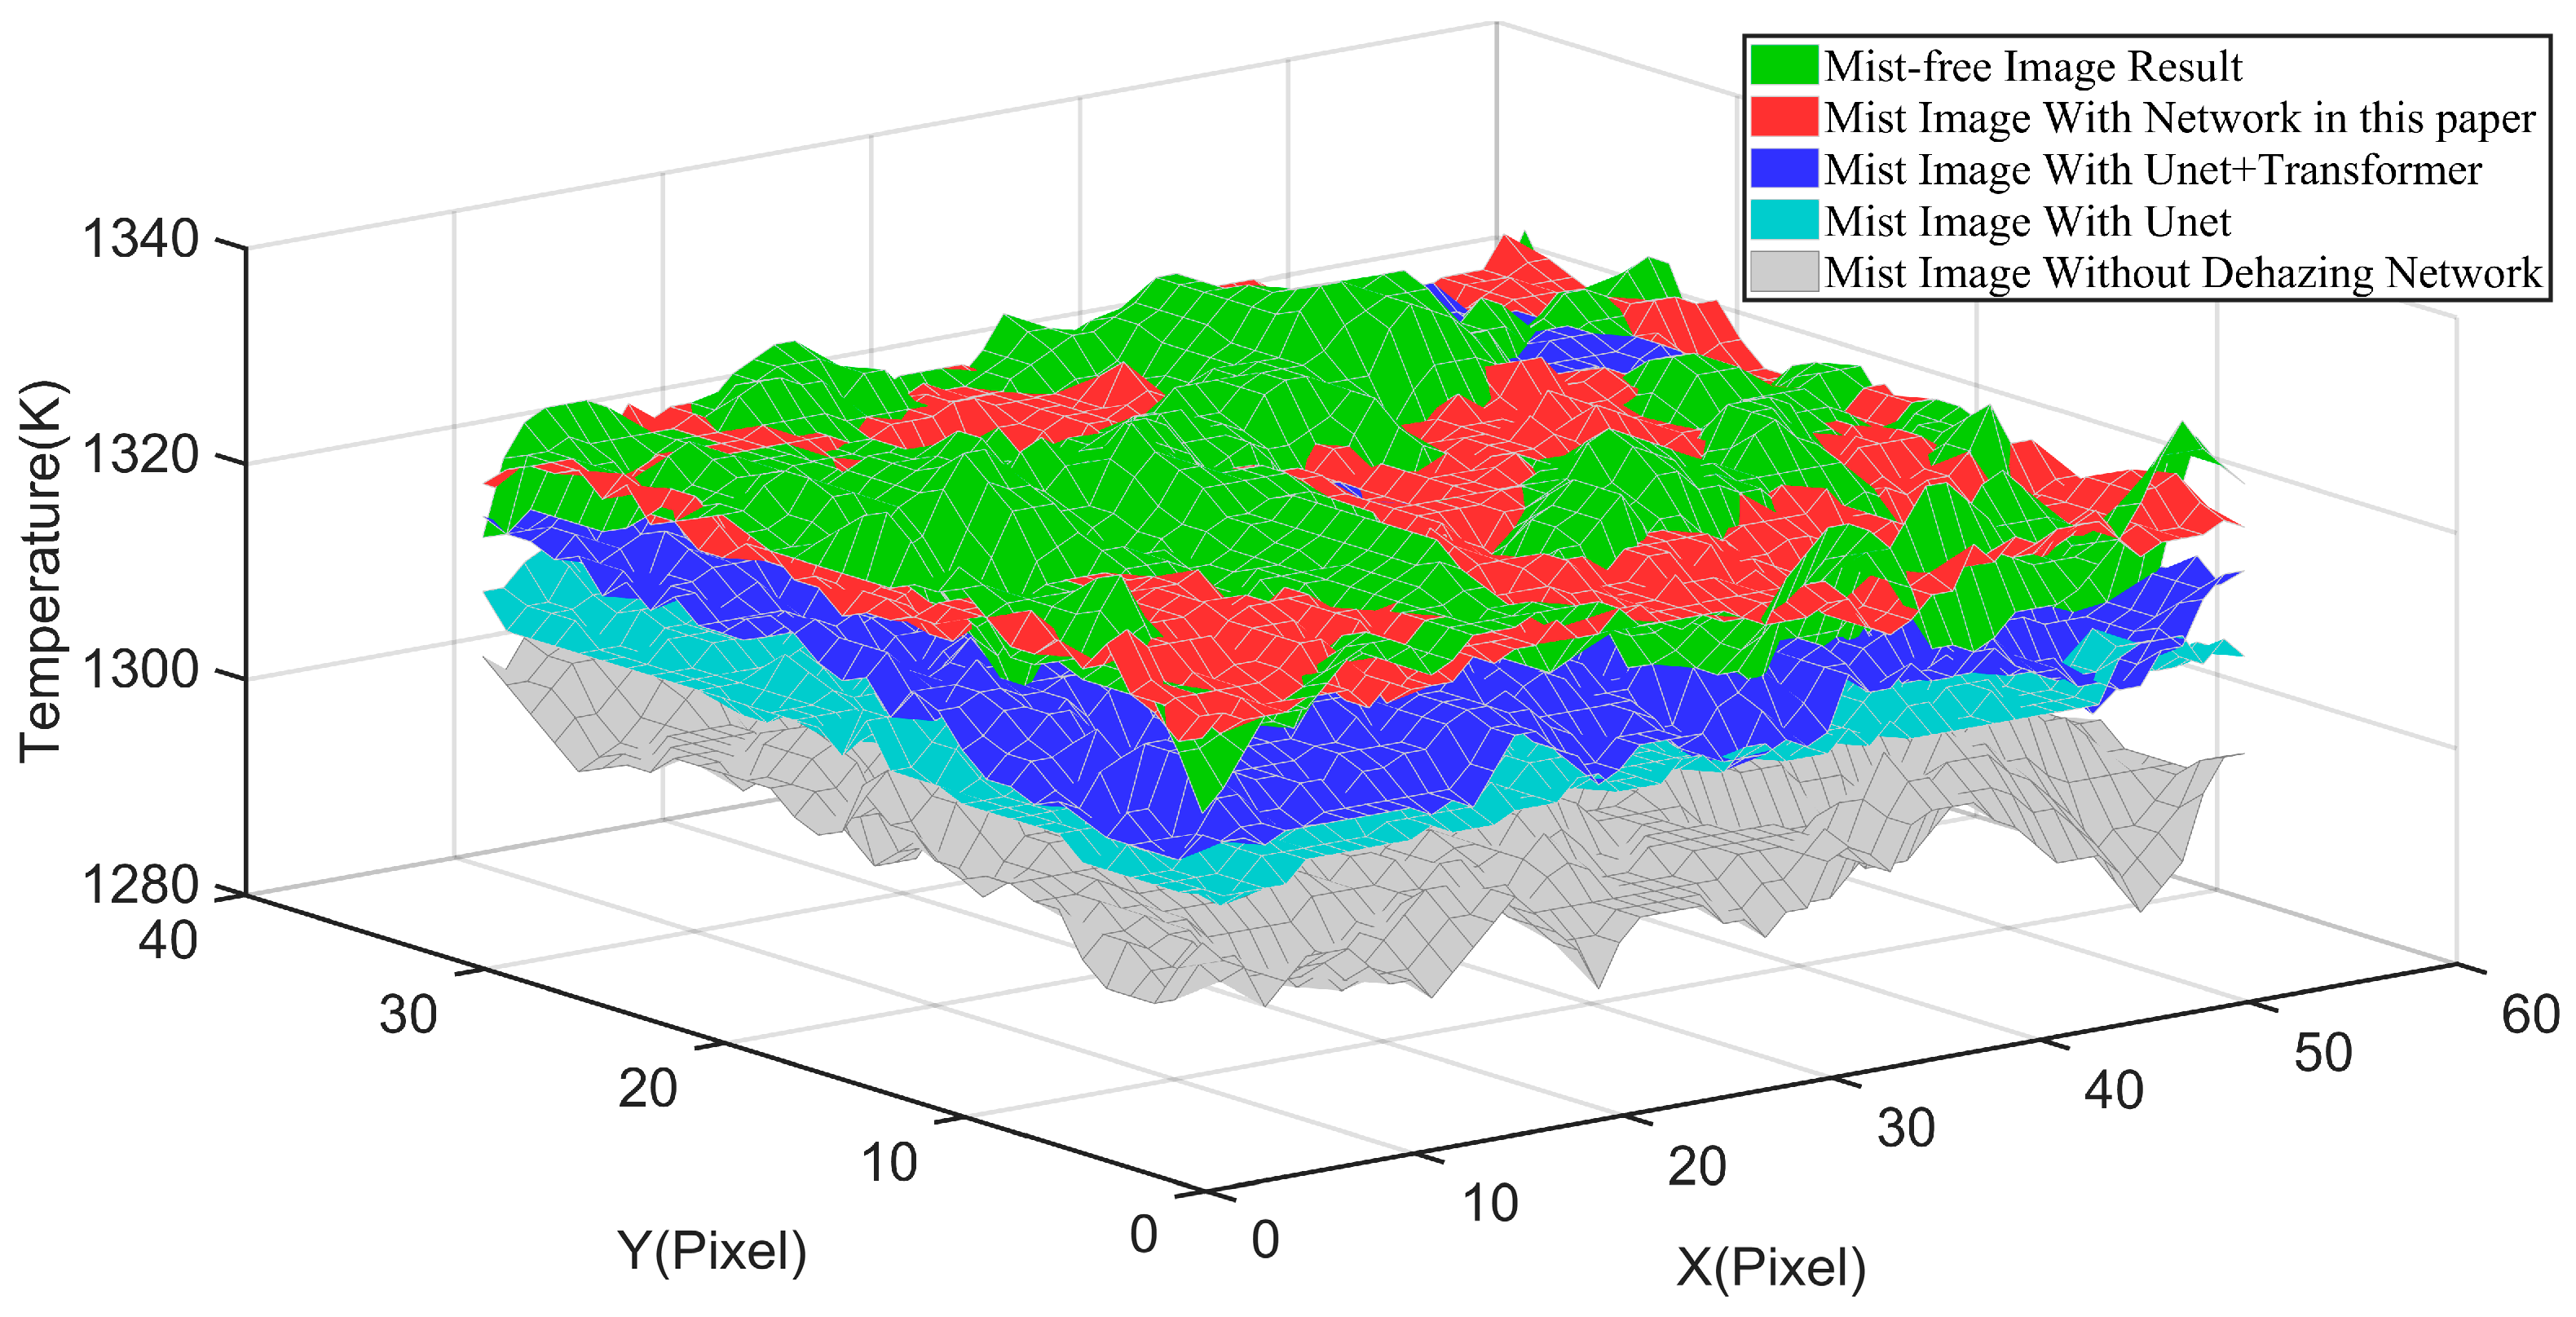
and the corresponding water mist path transmittance prior. Thermal images of the billet surface temperature before and after dehazing are shown in
Figure 9.
Figure 9 shows that the overall temperature of the image post-dehazing was higher than that of the image before dehazing, which indicates that the dehazing network was successful.
To validate the proposed model, the distortion caused by water mist can be calculated using the model as follows:
where
is the image distortion coefficient, vector
is the position of the pixel in the image, and
is the path transmittance of water mist at position
.
After that, we normalize the temperature error matrix as follows:
In Equation (22), the denominator is the normalization constant for each image. Next, we calculate the minimum value
ρ of the correlation coefficients of the corresponding rows of
and
:
In Equation (23), represents row of the image, is the variance, and is the covariance.
The specific calculation process is as follows:
Randomly select 50 sets of dehazed and mist-free images from the test set and use the first set to begin the calculation process.
Based on the mist-free image corresponding to the sequence of the dehazed image, calculate the water mist path transmittance matrix of this set of images.
Calculate the temperature value image Tdehaze (x,y) after dehazing using the method proposed in this paper and compute according to Equation (19).
Perform normalization processing on Terror (X) in accordance with Equation (21).
Calculate the row correlation coefficient corresponding to each row in the image using Equation (22), then take the minimum value of these row correlation coefficients as for this image.
Repeat steps 2–5 to complete the calculation for all 50 sets of images and find the minimum value of among the 50 sets of images.
The value of the row correlation coefficient ranges from −1 to 1. When , it indicates an extremely strong correlation between the two variables; when , it indicates a strong correlation; when , it indicates a moderate correlation; when , it indicates a weak correlation; and when , it indicates an extremely weak correlation or no correlation.
According to our calculations, the minimum value of among the 50 sets of images is 0.97. Therefore, the distortion caused by water mist and the temperature error are strongly correlated, and the proposed billet radiation attenuation model is plausible.
Next, 10% of the visible-light and near-infrared images are randomly selected from the test dataset of water mist and water mist-free billet images with a high matching degree, and the average tensor of the water mist path transmittance of these images is calculated and used as the prior tensor of water mist transmittance in the secondary cooling zone.
3.2. Evaluation Indicators for Billet Image Dehazing for Temperature Measurement
To objectively verify the effect of the water mist dehazing method for billet images, the following indicators are selected for evaluation in this paper.
- (1)
Root Mean Square Error
The Root Mean Square Error (RMSE) is used to measure the similarity between two billet images, and it is calculated as follows:
where
represents the temperature value of the dehazed image and
represents the temperature value of the corresponding mist-free image. The RMSE indicator can reflect the degree of difference in temperatures between the dehazed and mist-free images. The smaller the RMSE value, the smaller the difference between the images.
- (2)
Maximum Temperature Difference
The Maximum Temperature Difference (MTD) is used to measure the maximum absolute deviation of temperature values between the dehazed image and the mist-free image in a specified region, and is defined as follows:
where
represents the temperature value of the dehazed image,
represents the temperature value of the corresponding mist-free image, and
represents the selected evaluation region. This indicator reflects the most extreme error in the temperature recovery of the dehazed image in the local region; the smaller its value, the smaller the extreme deviation, and the closer the restoration of the temperature field is to the real distribution.
- (3)
Average Temperature Difference
The Average Temperature Difference (ATD) reflects the average level of pixel temperature errors in the entire region and is defined as follows:
where
represents the number of pixel points in the evaluation region. This indicator measures the overall temperature deviation of the entire region and is one of the core indicators used to evaluate the accuracy of the billet surface temperature field by the dehazing method. The smaller the ATD is, the smaller the difference between the dehazed image and the mist-free image, which is indicative of a stronger dehazing ability.
- (4)
Relative Temperature Error
Relative Temperature Error (RTE) is the ratio of the absolute value of the absolute error in temperature measurement to the true temperature. The calculation formula for the relative error of the temperature measurement result is as follows:
RE can more comprehensively evaluate the accuracy and precision of measurement results. It can compare errors under different scales without being affected by the magnitude of absolute values.
In summary, the above four indicators jointly construct a comprehensive evaluation system that ranges from local extreme differences to global averages, and from pixel-level errors to relative errors of temperature trends. These indicators can fully assess the effectiveness and robustness of the image dehazing network proposed in this paper in mitigating the impact of water mist in the secondary cooling zone on the temperature measurement of the billet surface.
3.3. Comparison of Temperature Measurement Results After Image Dehazing with Different Network Combinations
This paper selects different regions from billet images and extracts temperature data using the aforementioned multispectral temperature thermometry. Based on the two dimensions of spatial locality and temporal continuity, a quantitative evaluation is conducted on the water mist dehazing effect of different networks. The details are as follows:
- (1)
Single-frame billet image row not covered by oxide scale: Select a row of pixels in the area not blocked by oxide scale and obtain its temperature sequence, which can reflect the horizontal temperature change trend.
- (2)
Rectangular area in a single-frame image not covered by oxide scale: Extract the rectangular area with the largest area and without oxide scale and calculate the temperature values of all pixels in this area, which is used to reflect the overall temperature fluctuation in the local area.
- (3)
Same coordinate in 30 s time series continuous images: Select a fixed coordinate in the image, record the temperature change trend at the position without oxide scale in multiple consecutive frames of images, and evaluate the actual effect of the algorithm in the time dimension.
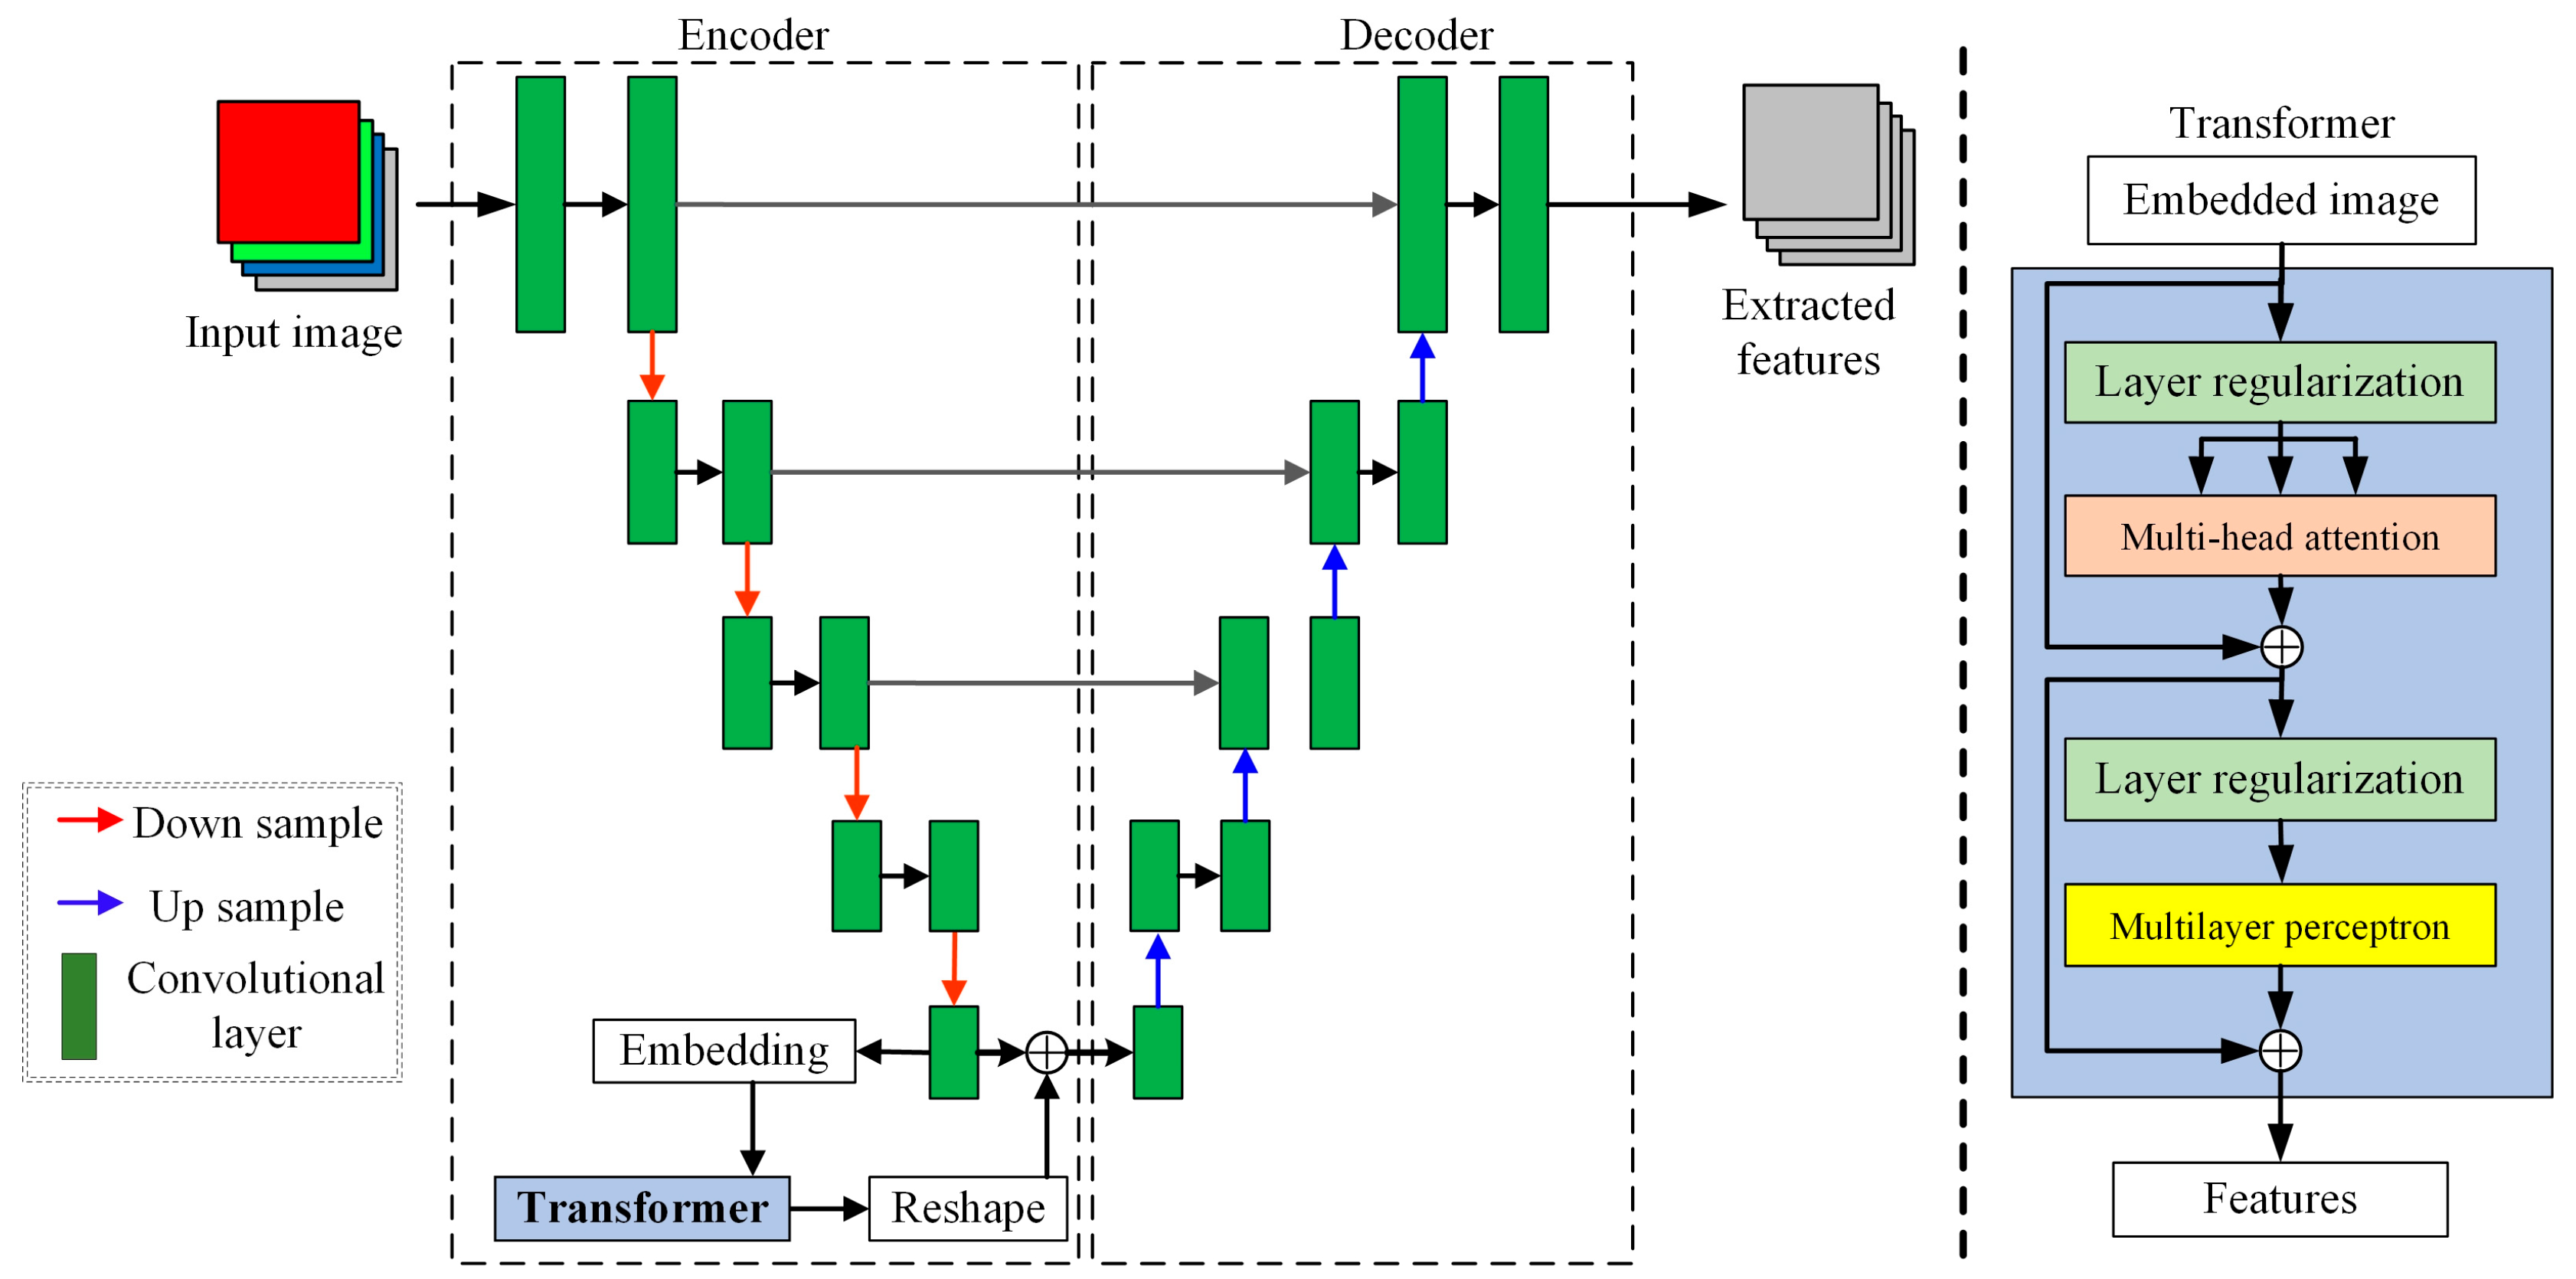
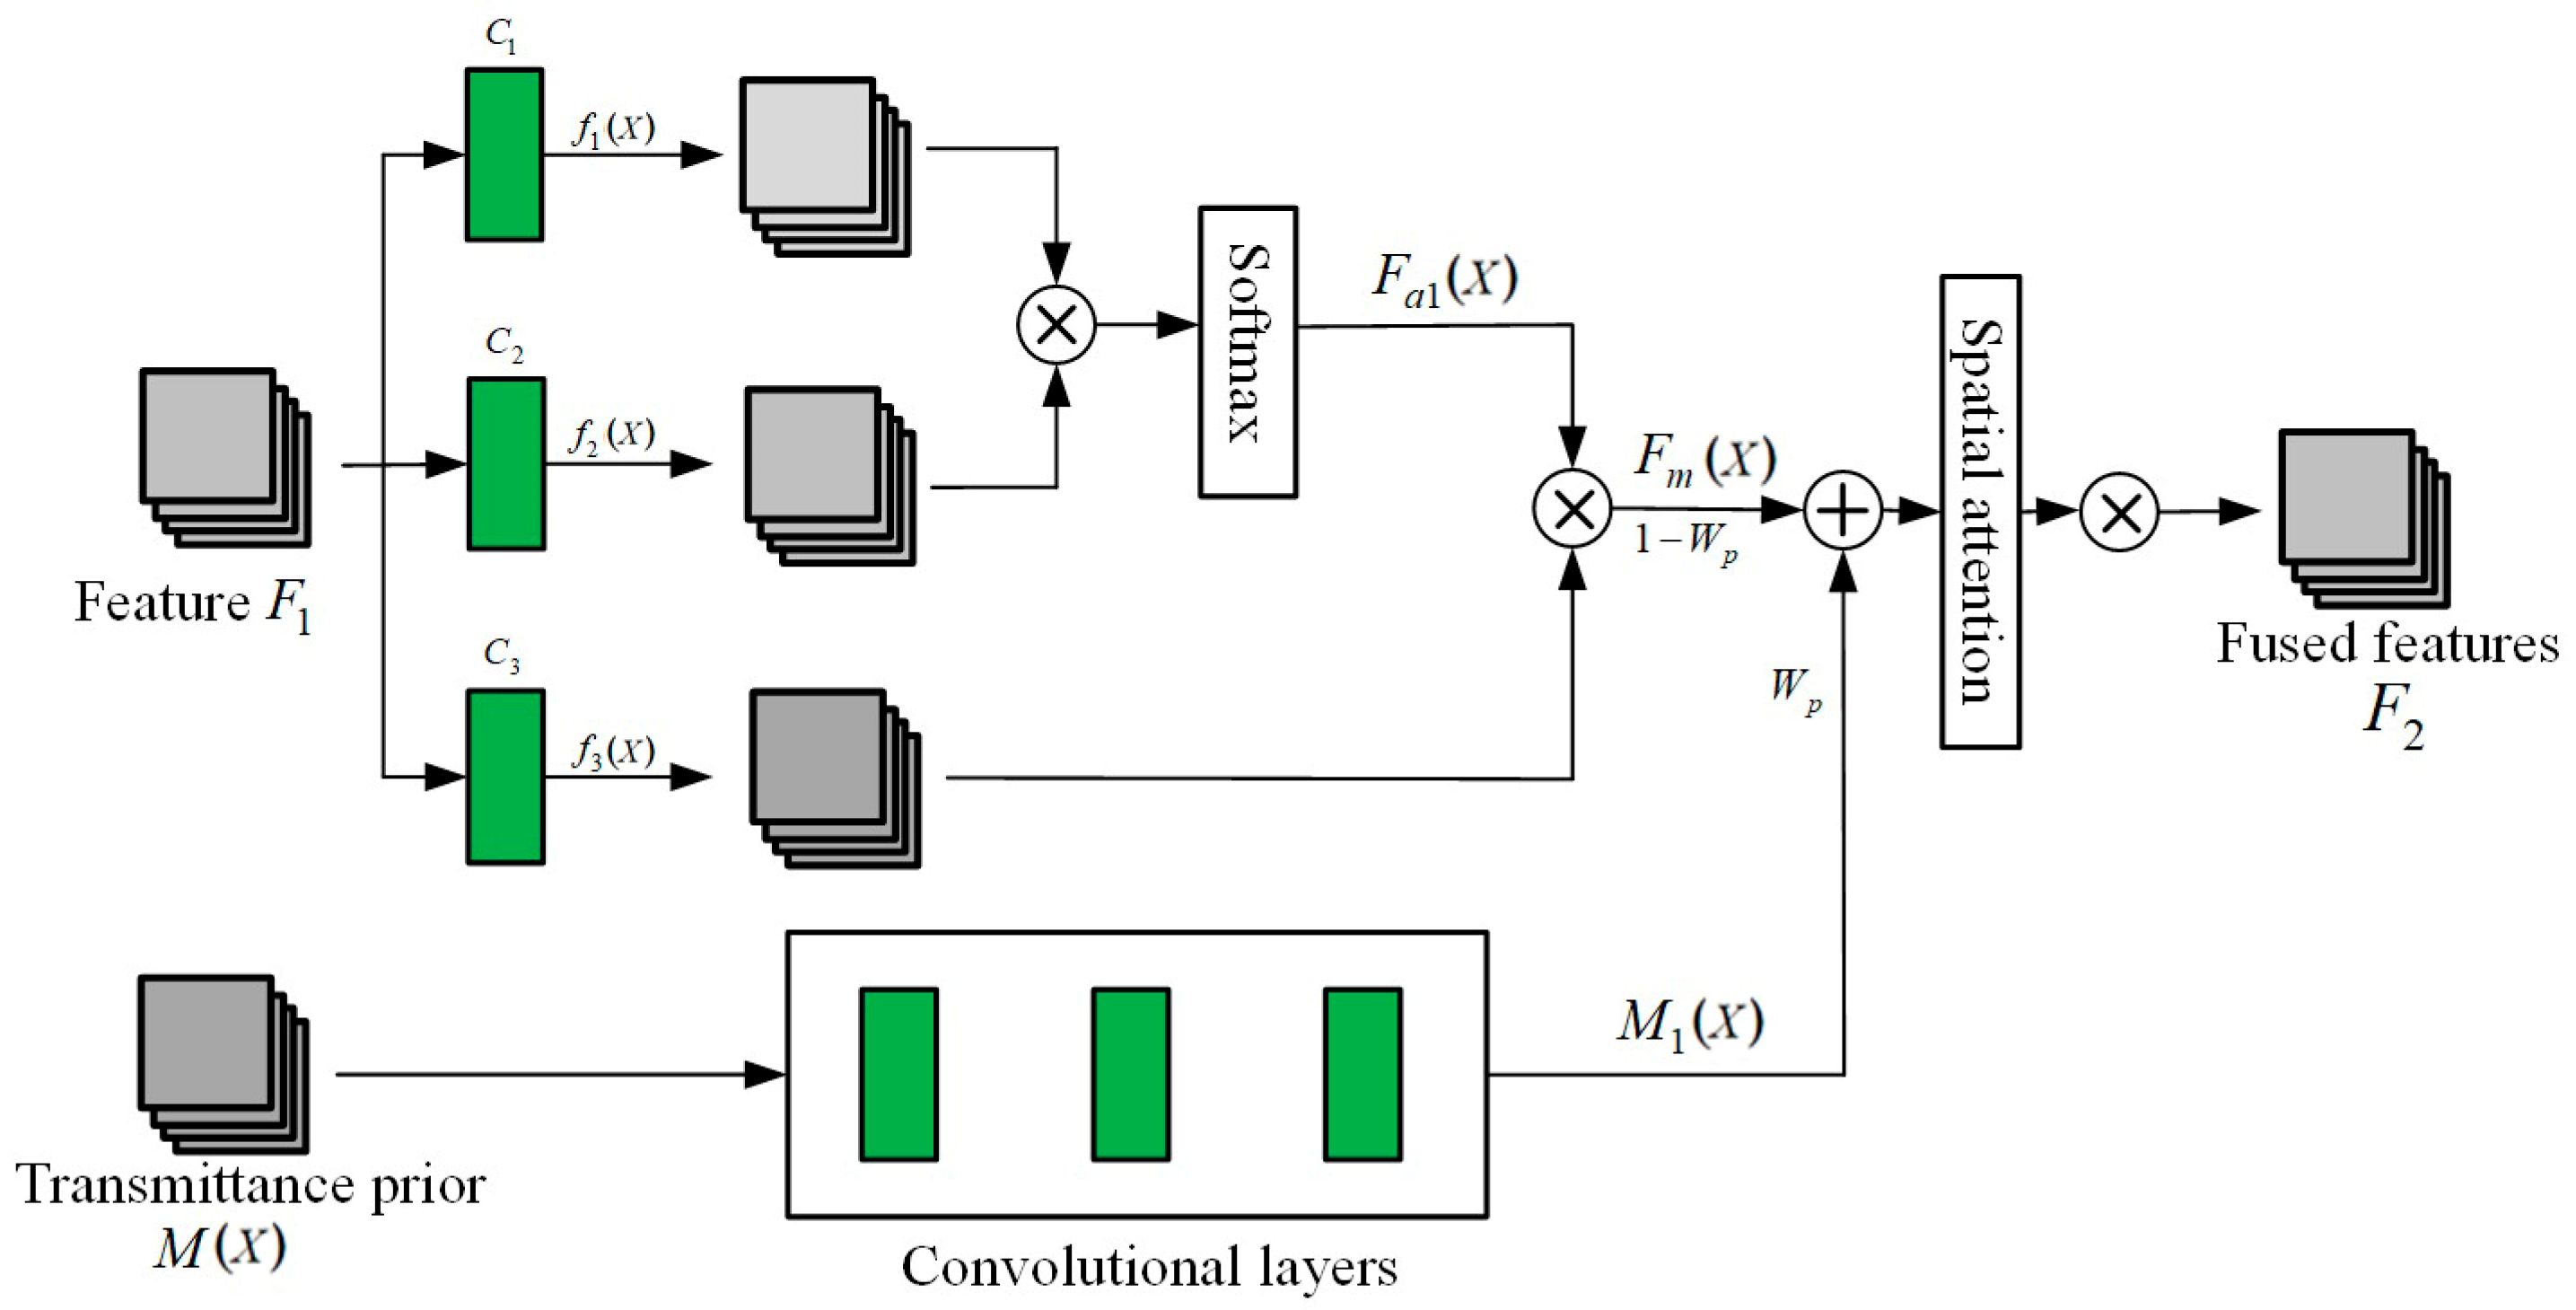
In each type of region, five temperature curves are displayed, respectively: the temperature curve of the mist image, the temperature curve of the mist-free image, the temperature curve when the dehazing network is Unet, the temperature curve when the dehazing network is Unet + Transformer, and the temperature curve of the dehazing method proposed in this paper (Unet + Transformer + transmittance prior).
Quantitative indicators such as RMSE, MTD, ATD, and RTE are calculated and analyzed. Using these indicators, the effectiveness of each dehazing method is evaluated from multiple dimensions, ranging from local details to global trends, to verify the proposed model’s effectiveness in improving the accuracy of temperature measurement and reducing water mist interference.
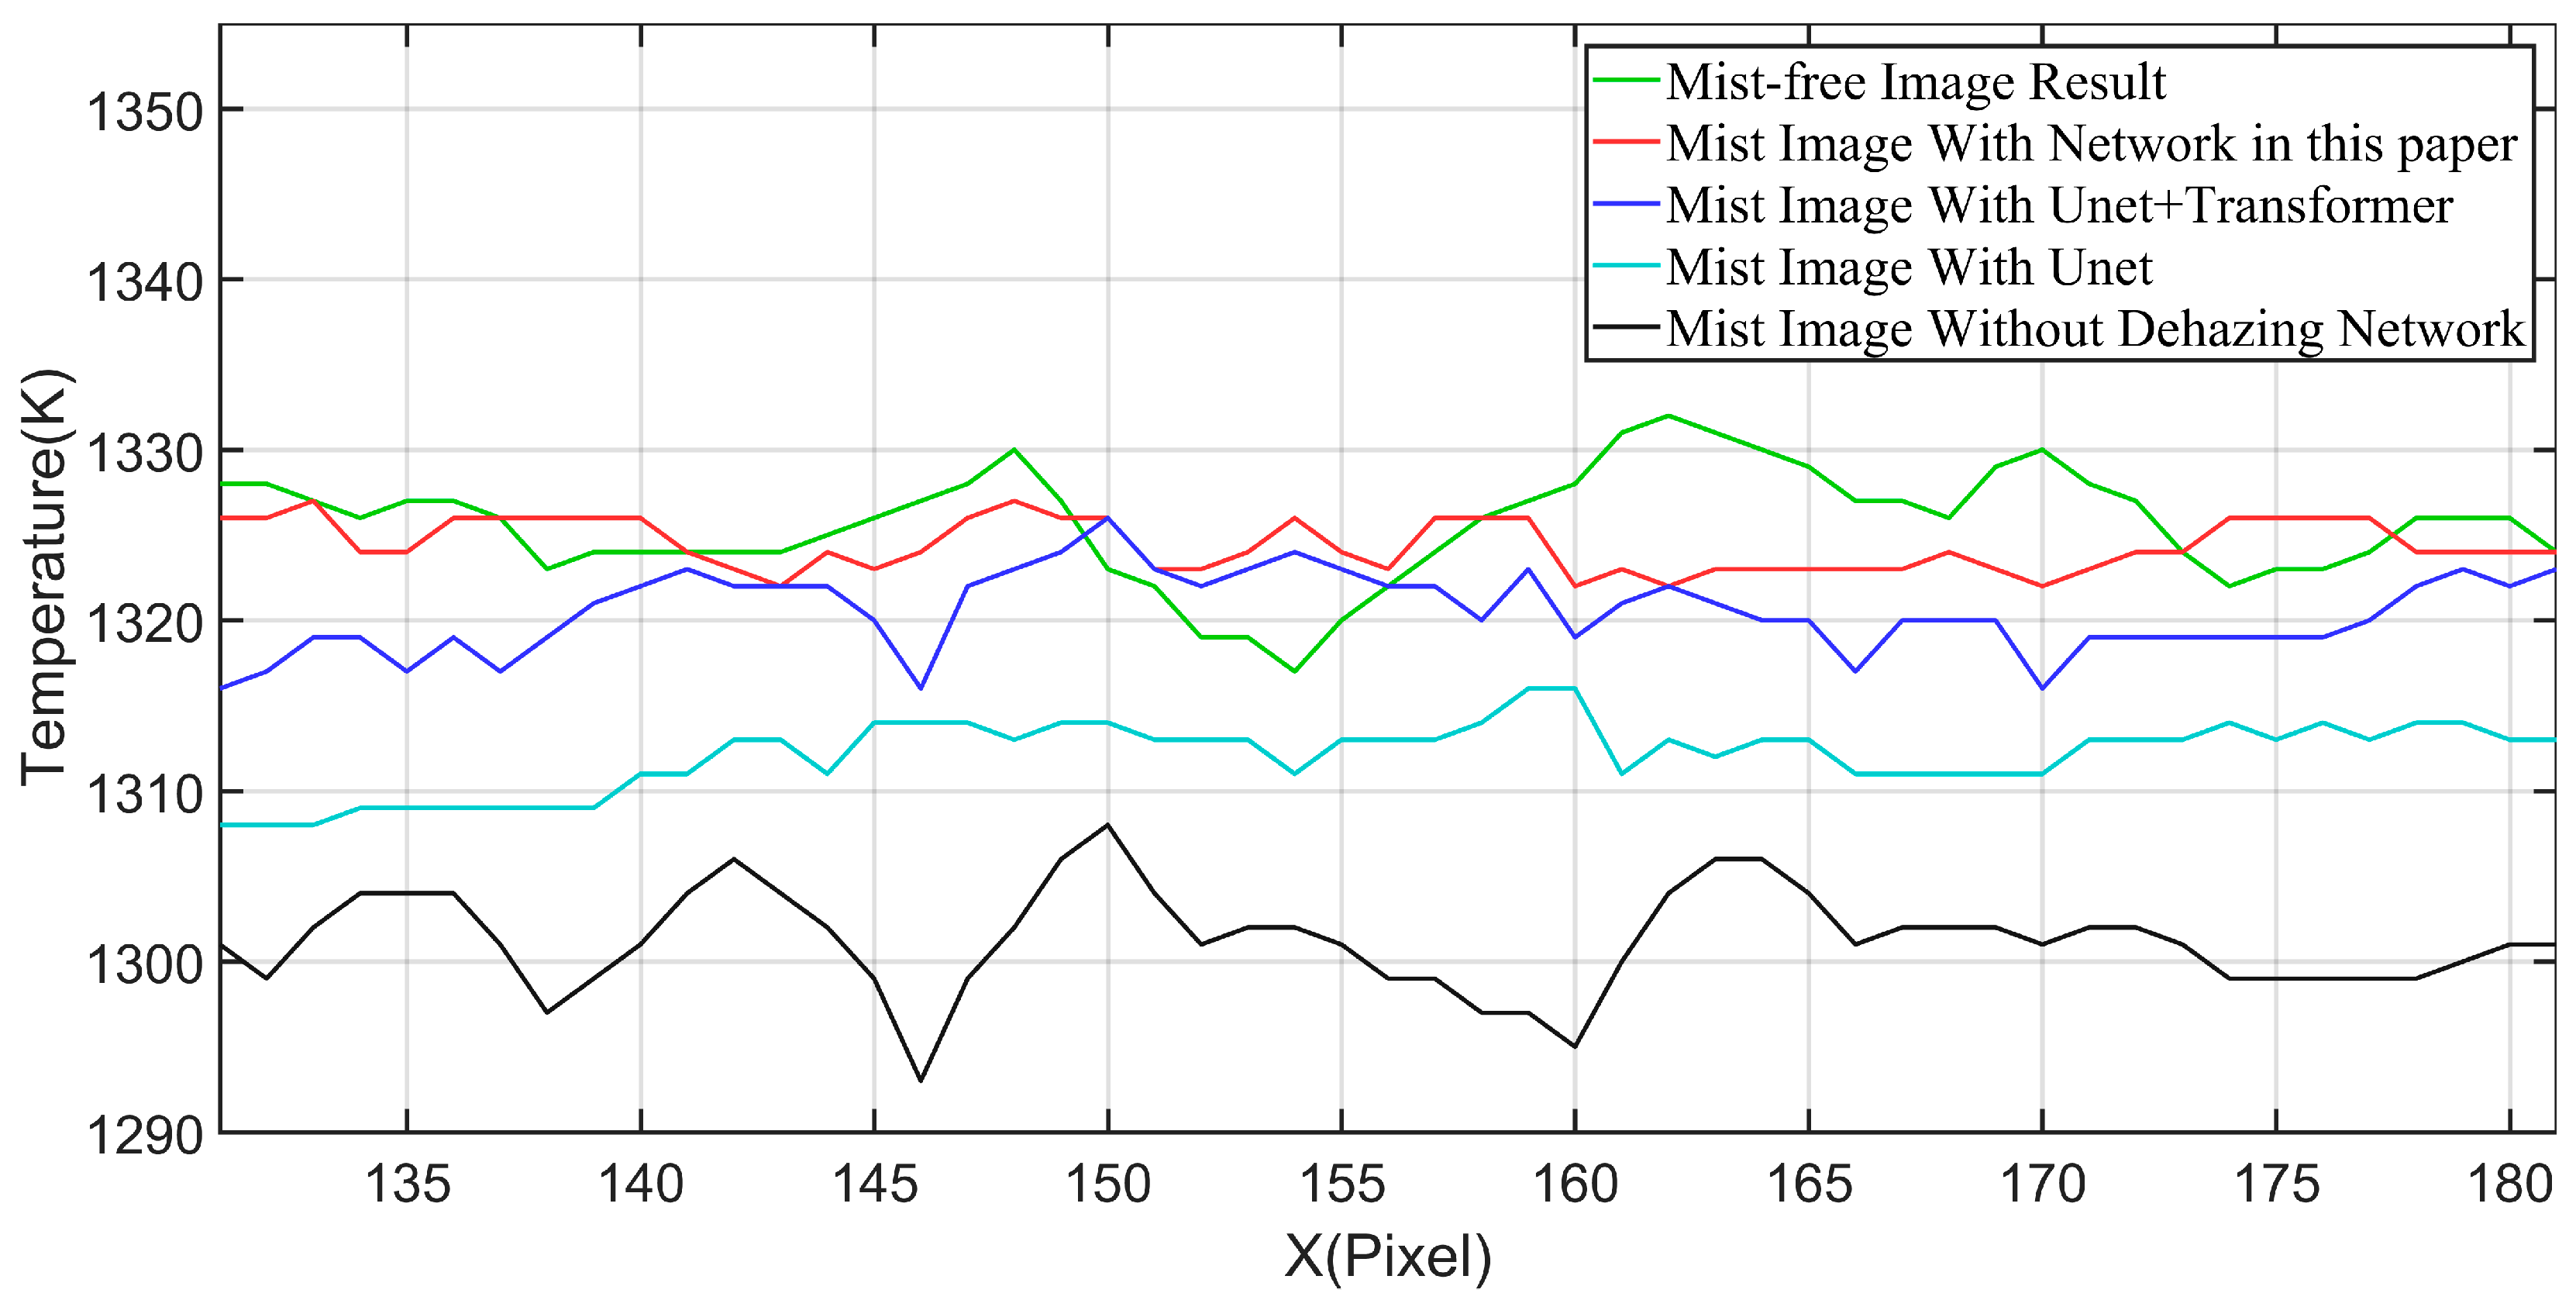
Figure 10 and
Figure 11 show the results obtained by processing randomly selected images from the test set using the method proposed in this paper.
Figure 10 and
Table 2 show the temperature curve and evaluation indicators extracted from a single row of pixels not covered by oxide scale in a single-frame image, aiming to analyze different dehazing methods’ ability to eliminate the interference of water mist medium on the surface temperature measurement of the casting billet.
Figure 10 shows that the water mist medium interferes significantly with the surface temperature measurement of the cast billet. The temperature curve of the image with mist in the figure is at the lowest position, and there is an obvious temperature difference between this curve and that of the mist-free image. The temperature difference between the temperature curve of the Unet network, the temperature curve of the Unet + Transformer network, the temperature curve of the method described in this paper (Unet + Transformer + transmittance prior), and the image without mist decreases gradually.
Table 2 shows that, among the combinations of the three categories, the dehazing network proposed in this paper achieved the best performance across all metrics. The RMSE decreased from 24.7 K (without dehazing) to 6.8 K for the Unet + Transformer dehazing result and to 3.9 K for the proposed method. Both the MTD and the ATD were reduced by approximately 20 K. By calculating the RTE for all pixels and determining the mean, we confirmed that the temperature measurement results of the proposed method were closest to those of the haze-free image, achieving the best dehazing effect. This demonstrates that the water mist transmission prior plays an important role in the model.
Figure 11 and
Table 3 show the temperature curves and related evaluation metrics extracted from the largest rectangular region without oxide scale in a single billet image, aiming to assess the ability of different dehazing methods to suppress water mist interference. In
Table 3, group 1 represents the maximum and average temperature differences between the mist-containing and mist-free images in this region, which can be used as a comparative baseline.
Figure 11 shows that the influence of water mist on the temperature measurement of the billet surface exhibits obvious spatial inhomogeneity, which is specifically reflected in the significant fluctuation of the temperature field in the rectangular region of a single-frame mist image. It also reveals that, through the processing of different dehazing networks, the impact of the water mist medium on the temperature measurement results gradually decreases. The dehazed results obtained using our method coincide with those obtained for the mist-free image, demonstrating the strongest ability to suppress water mist interference.
In
Table 3, the dehazing results of the Unet network reduce the RMSE between the mist and mist-free images from 22.9 K to 12.8 K, the MTD from 41 K to 23 K, and the ATD from 22.1 to 11.9 K, which shows that Unet is effective for image dehazing. After adding the Transformer structure and the transmission prior to Unet, the RMSE, MTD, and ATD are further reduced to 4.7 K, 18 K, and 3.6 K, respectively, while the average RTE is also reduced from 1.67% to 0.27%. Notably, the curve in
Figure 10 corresponds to the results of the tenth row in
Figure 11, and the average RE in
Table 2 is lower than that in
Table 3, which further indicates the spatial inhomogeneity of the water mist distribution.
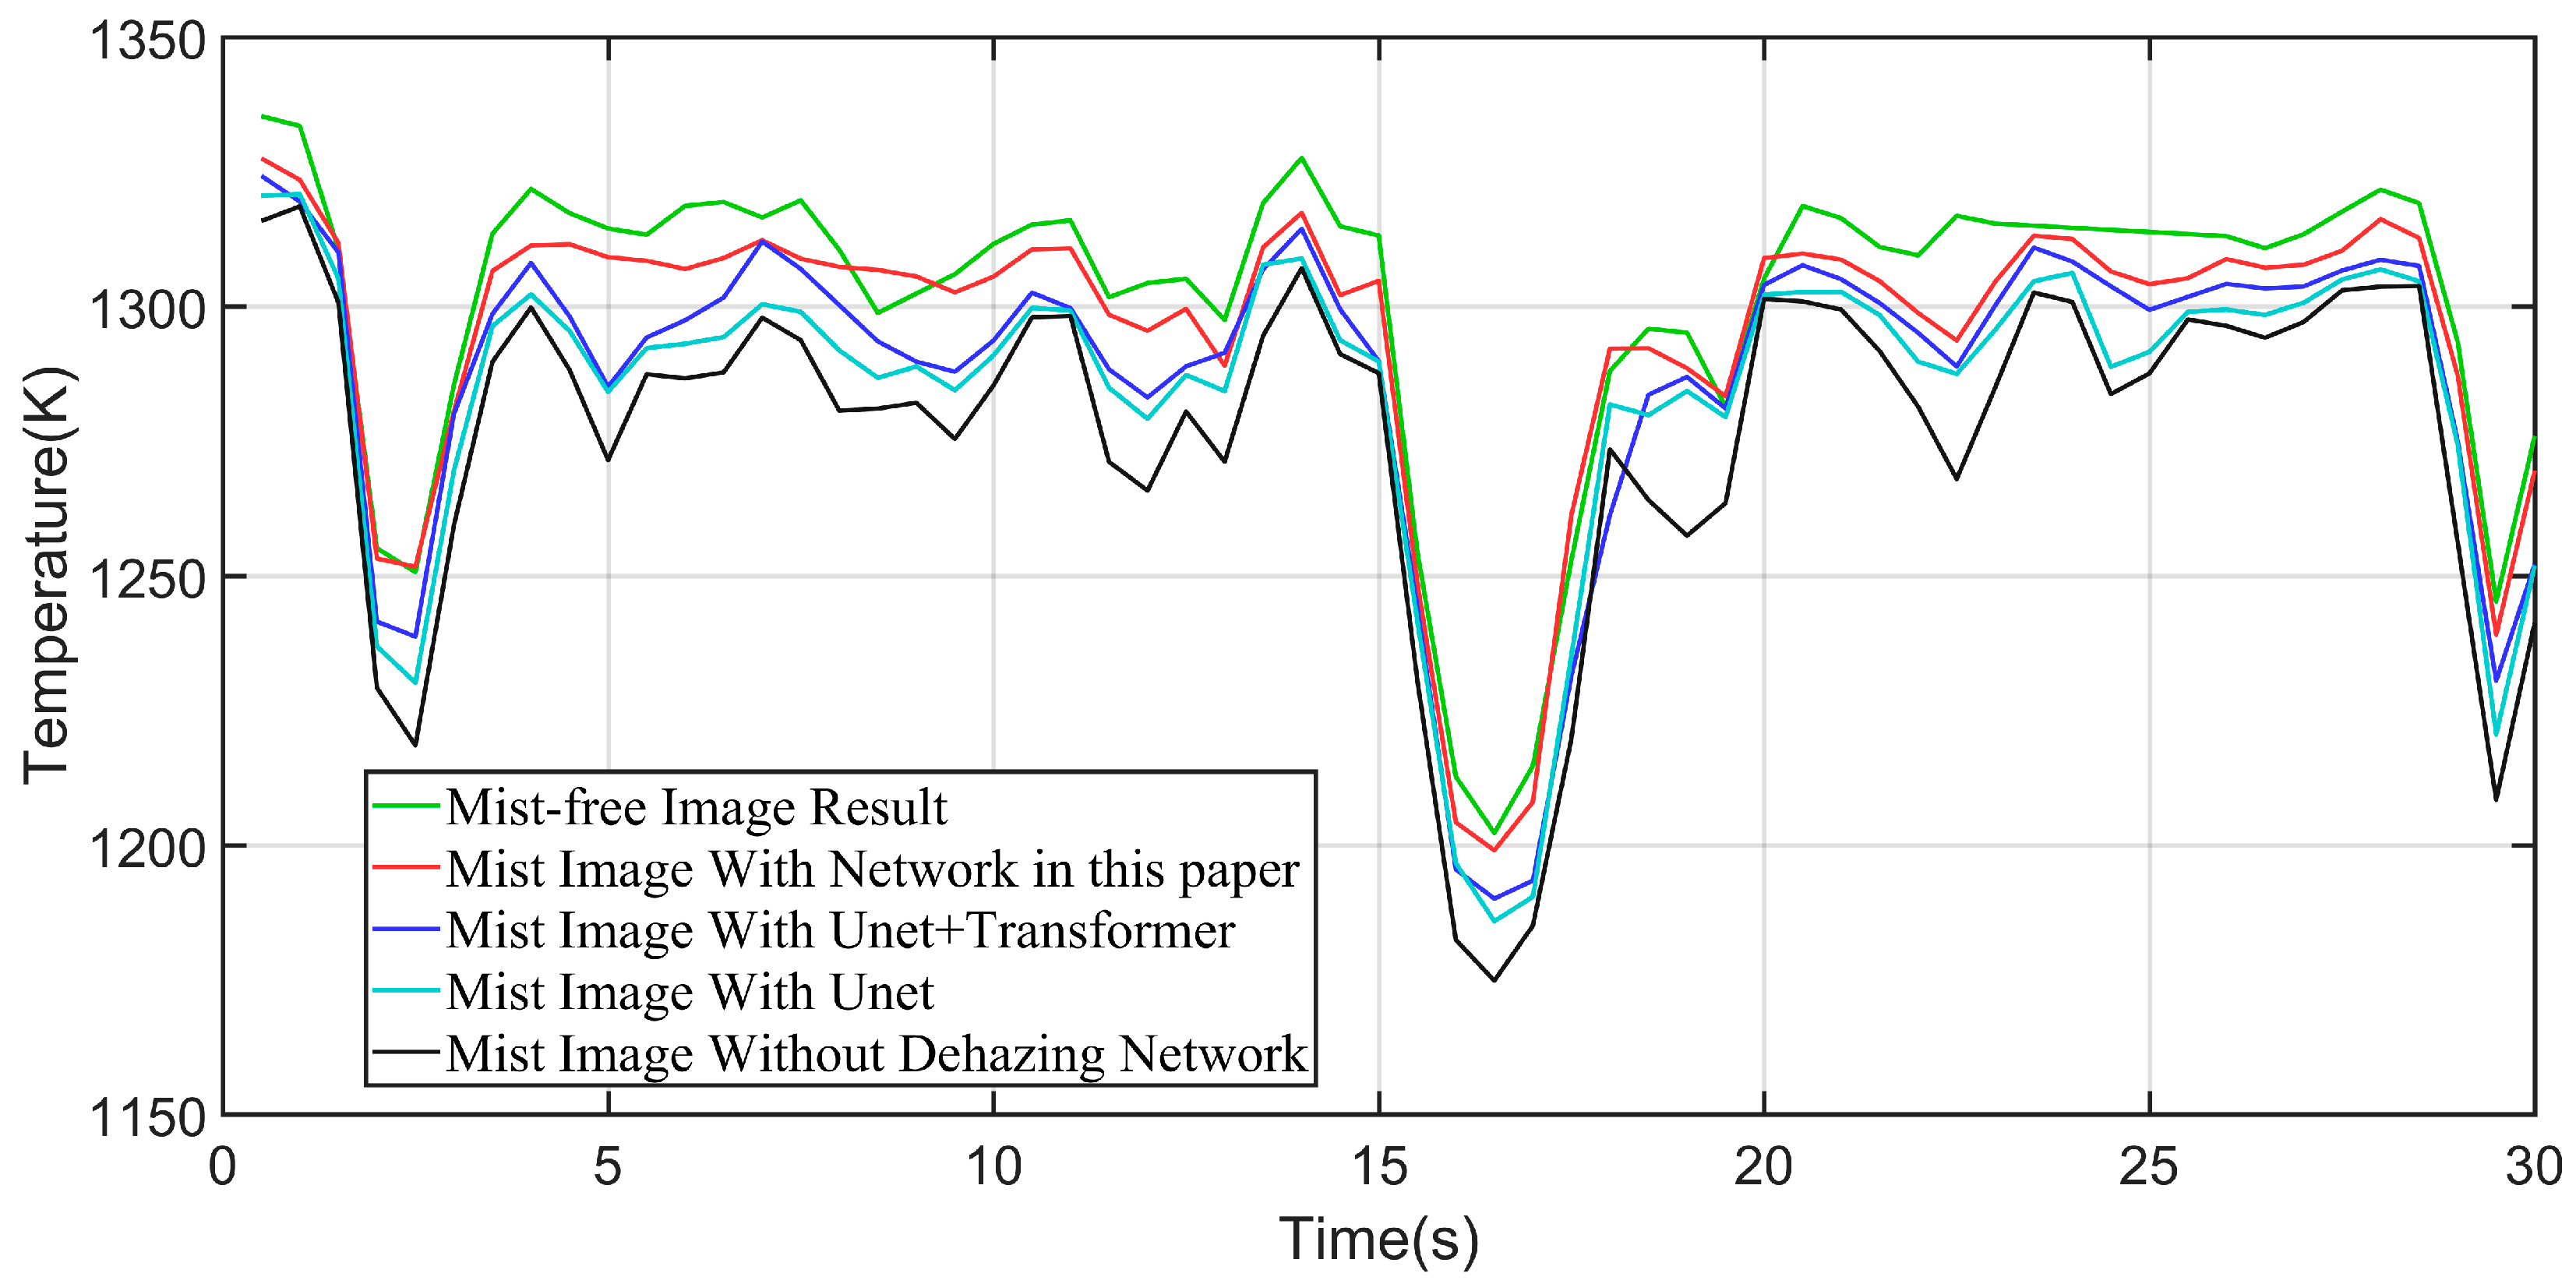
Figure 12 presents the temperature curve extracted from the same fixed coordinate over a 30 s continuous image sequence. The troughs in the curve correspond to temperature fluctuations caused by the thick oxide scale on the billet surface; the evaluation results are shown in
Table 3.
Water mist significantly interfered with the temperature measurement of the billet surface over the time dimension. In each time series, the temperature curves derived from mist images generally appeared at the bottom of the corresponding subplots. After different dehazing models were applied, the interference caused by the water mist medium gradually diminished.
As shown in
Table 4, the dehazing model proposed in this study exhibits excellent dehazing effectiveness along the time dimension. Specifically, the RMSE decreases from 25.9 K to 7.5 K; the MTD drops from the original 48.8 K to 23.1 K; the ATD reduces from 24.5 K to 6.6 K; and the average RTE declines from 1.88% to 0.43%. A comparison of the mist and mist-free images reveals that there are distinct temperature troughs near the 5th, 10th, and 25th seconds, which are caused by the time-varying water mist medium. The dehazing model used in this study produces a smoother temperature profile after dehazing, with these troughs effectively restored, outperforming the temperature measurement results obtained by the Unet and Unet + Transformer networks.
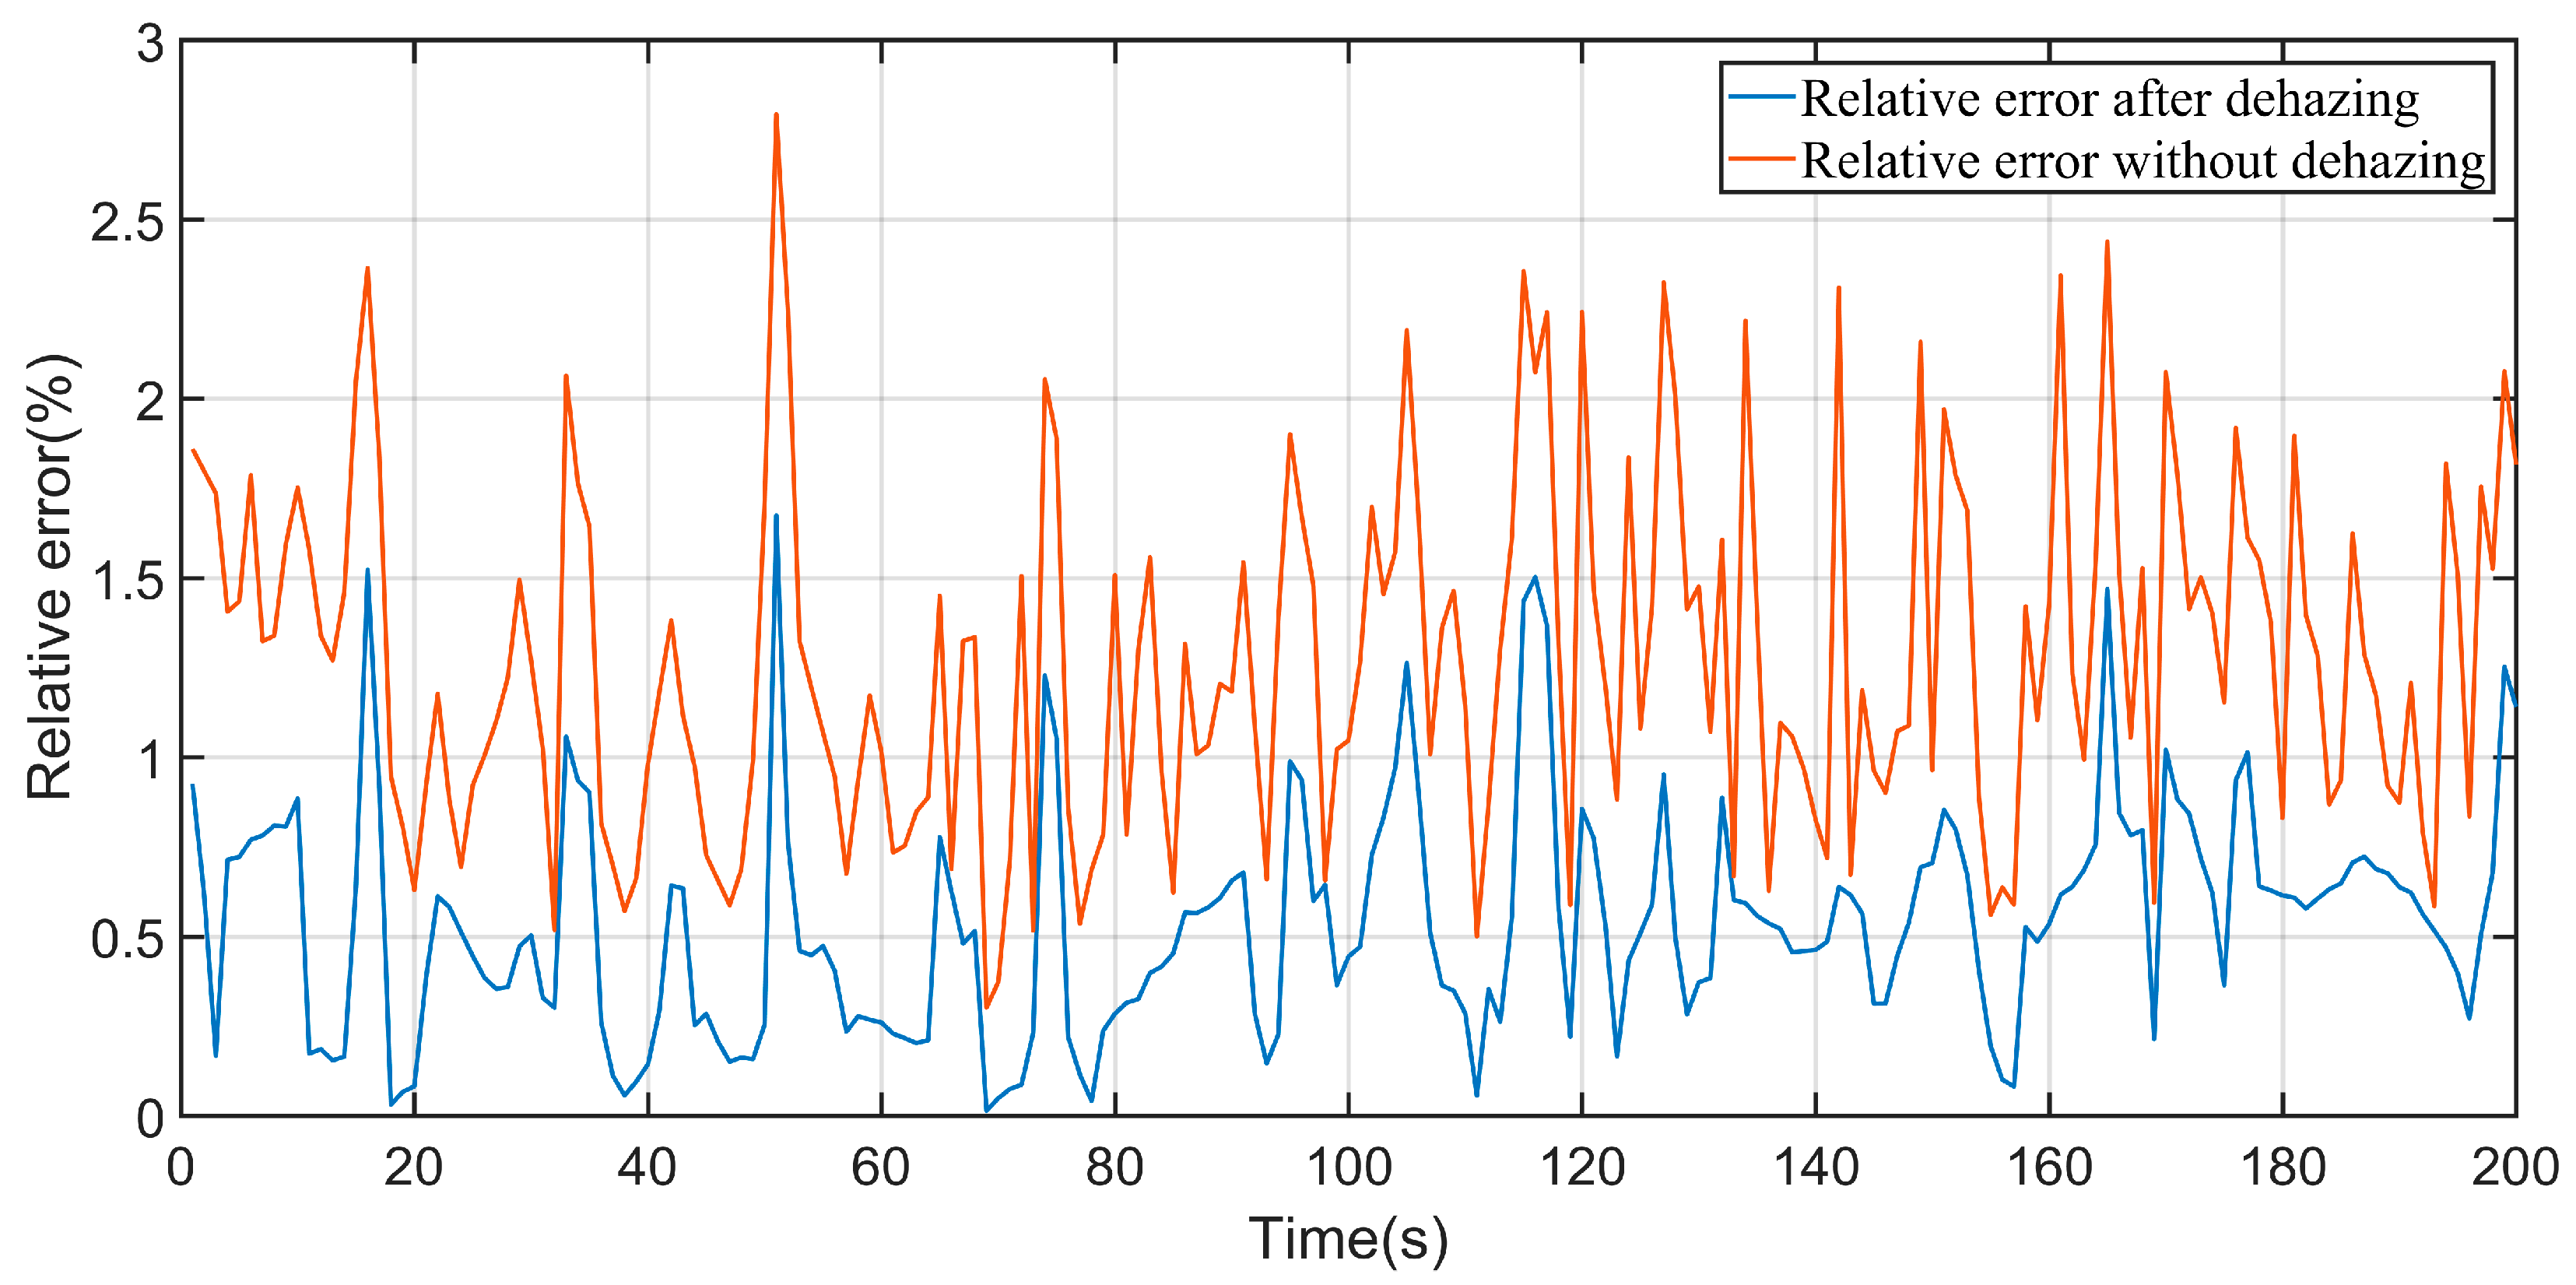
To evaluate the effectiveness of the proposed dehazing method in mitigating the effects of water mist on billet surface temperature measurement in the secondary cooling zone, the same spatial coordinate point was selected from a continuous 200 s sequence of 200 frames. The RTE curves before and after dehazing were plotted to visually demonstrate the actual temperature improvement achieved by the dehazing process for mist images over the time dimension. The Relative Temperature Error curves are shown in
Figure 13.
Before dehazing, the maximum RTE is 2.79%, and the average RTE is 1.27%. After the application of the proposed dehazing method in this paper, the maximum RTE is reduced to 1.67% and the average RTE is reduced to 0.53%. Compared with the results obtained prior to dehazing, the maximum RTE is reduced by 1.73% and the average RTE is reduced by 0.74%. The dehazing method of Unet and Unet + Transformer lies between the two and is not plotted in
Figure 13 for clarity.
Meanwhile, temperature measurement experiments with different steel grades, different casting speeds, and different water flow rates were conducted in the steel plant.
During the actual temperature measurement process, two steel grades representing typical continuous casting processes—high-carbon steel and medium-carbon steel—were selected for the experiment. Their respective designations are GCr15 (bearing steel) and S45CTi (crankshaft steel). The GCr15 steel adopted the hard cooling mode, while the S45CTi steel used the soft cooling mode. The continuous casting process conditions for both materials are detailed in
Table 5. Notably, the cooling water flow rate achieved using the hard cooling mode was higher than that achieved via the soft cooling mode.
Figure 14 presents the measured surface temperature curves of GCr15 and S45CTi billets under stable continuous casting process conditions. The calculation process prevents large pieces of scale from influencing the billet surface.
The figure shows that the GCr15 steel grade adopts the hard cooling mode with a large cooling water flow rate, and the billet temperature ranges from 1250 K to 1290 K. In contrast, the S45CTi steel grade uses the soft cooling mode with a small cooling water flow rate, and its billet temperature ranges from 1300 K to 1330 K. Meanwhile, due to the difference in cooling water flow rates, the influence of the water mist medium on temperature measurement is greater for GCr15 than for S45CTi.
The temperature measurement results of the GCr15 steel grade were selected for analysis, as shown in
Table 6. For a continuous time-series image sequence with a total of 450 frames, in comparison with the Unet + Transformer and Unet methods, the RMSE of the dehazing method proposed in this paper gradually decreases from 22.5 K to 6.0 K, the MTD gradually decreases from 28.2 K to 12.2 K, the ATD gradually decreases from 22.4 K to 5.6 K, and the average RTE gradually decreases from 1.74 to 0.45. This demonstrates the effectiveness of the dehazing algorithm proposed in this paper.
Meanwhile, to investigate whether the billet surface temperature can respond promptly when the continuous casting process parameters change, experimental studies on variable casting speeds and variable water flow rates were also conducted on-site. The experimental results are shown in
Figure 15:
Figure 15a shows that for the GCr15 steel grade, when the water flow rate in zone 4 increased from 6.6 L/min to 6.9 L/min at 100 s, the billet surface temperature decreased from 1283 K to approximately 1275 K as the water flow rate increased. This is mainly because the increase in water cooling led to a rise in the equivalent cooling water flow rate of the billet, thereby causing a temperature drop.
Figure 15b shows that for the S45CTi steel grade, when the casting speed increased from 0.48 m/min to 0.51 m/min at 220 s, the billet surface temperature increased from 1320 K to approximately 1336 K as the casting speed increased. This is mainly because the increase in casting speed resulted in a reduction in the equivalent cooling time of the billet, thereby causing a temperature rise.
The temperature measurement results of the S45CTi steel grade with increased casting speed were selected for analysis, as shown in
Table 7. For a continuous time-series image sequence with a total of 500 frames, the RMSE, MTD, ATD, and average RTE of the dehazing method proposed in this paper, along with those of Unet + Transformer and Unet, all significantly decreased. This demonstrates the effectiveness of our proposed algorithm.
A comparison with the temperature measurement results of the GCr15 steel grade in
Table 7 shows that since the S45CTi steel grade used the soft cooling mode, its cooling water flow rate was lower than that of the GCr15 steel grade, and thus the influence of water mist was weaker, which is consistent with the temperature measurement results.
The above analysis indicates that the proposed network based on Unet + Transformer + transmittance prior effectively reduces the interference caused by water mist on billet surface temperature measurement in both the spatial and temporal dimensions. Compared with the Unet and Unet + Transformer network architectures, the dehazing performance is significantly improved, verifying our proposed model’s practical value and reliability for billet surface temperature measurement tasks.
According to the billet dehazing algorithm studied in this paper, a complete billet surface temperature measurement system can be developed in the future and applied to the secondary cooling zone of continuous casting production sites. This system can provide a billet surface temperature for feedback control in the continuous casting process, realize closed-loop control of the secondary cooling, and improve and stabilize the quality of billet products.


