Article

The Dynamic Behavior of Heavy Vehicles in Cornering Actions: An Assessment of the Problem

by
Francisco Castro
1,2,*,
Francisco Queirós de Melo
1,
David Faria
1,
Nuno Viriato Ramos
1,
Pedro M. G. P. Moreira
1 and
Mário Augusto Pires Vaz
1,2
1
INEGI—Institute of Science and Innovation in Mechanical and Industrial Engineering, 4200-465 Porto, Portugal
2
FEUP—Faculty of Engineering, University of Porto, 4200-465 Porto, Portugal
*
Author to whom correspondence should be addressed.
Appl. Sci. 2025, 15(22), 11959; https://doi.org/10.3390/app152211959
Submission received: 25 September 2025 / Revised: 31 October 2025 / Accepted: 1 November 2025 / Published: 11 November 2025

Abstract

Road accidents cause 1.3 million deaths annually, motivating the United Nations (UN) to develop a strategy seeking to halve this number by 2030. Portugal, with 60 deaths per million inhabitants in 2022, ranks sixth in European Union (EU) road fatalities, although these numbers have been decreasing since 2010. Rollover accidents account for 33% of traffic fatalities in the U.S.; yet, only 3% of crashes involve rollover accidents. These are particularly dangerous and mainly involve medium-to-large-sized vehicles having high centers of gravity (CoG), such as SUVs and heavy vehicles. On the other hand, bus accidents make up only 2% of EU road deaths, often involving vulnerable road users. Road forensic investigations rely on CoG positioning data for accurate accident reconstructions, using key equations for calculating skid and overturning speed limits. To complement the already existing equations, and by using a rigid body system, an equation for the evaluation of the overturning velocity in a curved trajectory is developed and proposed, considering the suspension stiffness properties of a vehicle. Finally, a real-world accident investigation involving a bus overturning is presented, and the method that was developed is applied. The developed formulation showed good results compared to the ones that were obtained during the forensic investigation and reduced the error from 5% to 2% compared to the existing equations.

1. Introduction

1.1. Statistics

According to the World Health Organization (WHO), approximately 1.3 million people die each year as a result of a road accident, which is the leading cause of death for children and young adults aged 5–29 years. Regarding all the statistics presented, the United Nations General Assembly has set a target of halving the global number of deaths and injuries by 2030 (A/RES/74/299) [1].
According to the special report from the European Court of Auditors (ECA), Portugal was the sixth country in the European Union (EU) with the most road deaths in 2022, registering 60 deaths per million inhabitants, surpassing the average mortality rate in the EU of 46 deaths per million inhabitants [2]. Despite the high rate of accidents in 2022, Portugal had a lower number of deaths compared to 2010, the year in which it recorded more than 90 deaths per million inhabitants (see Figure 1).
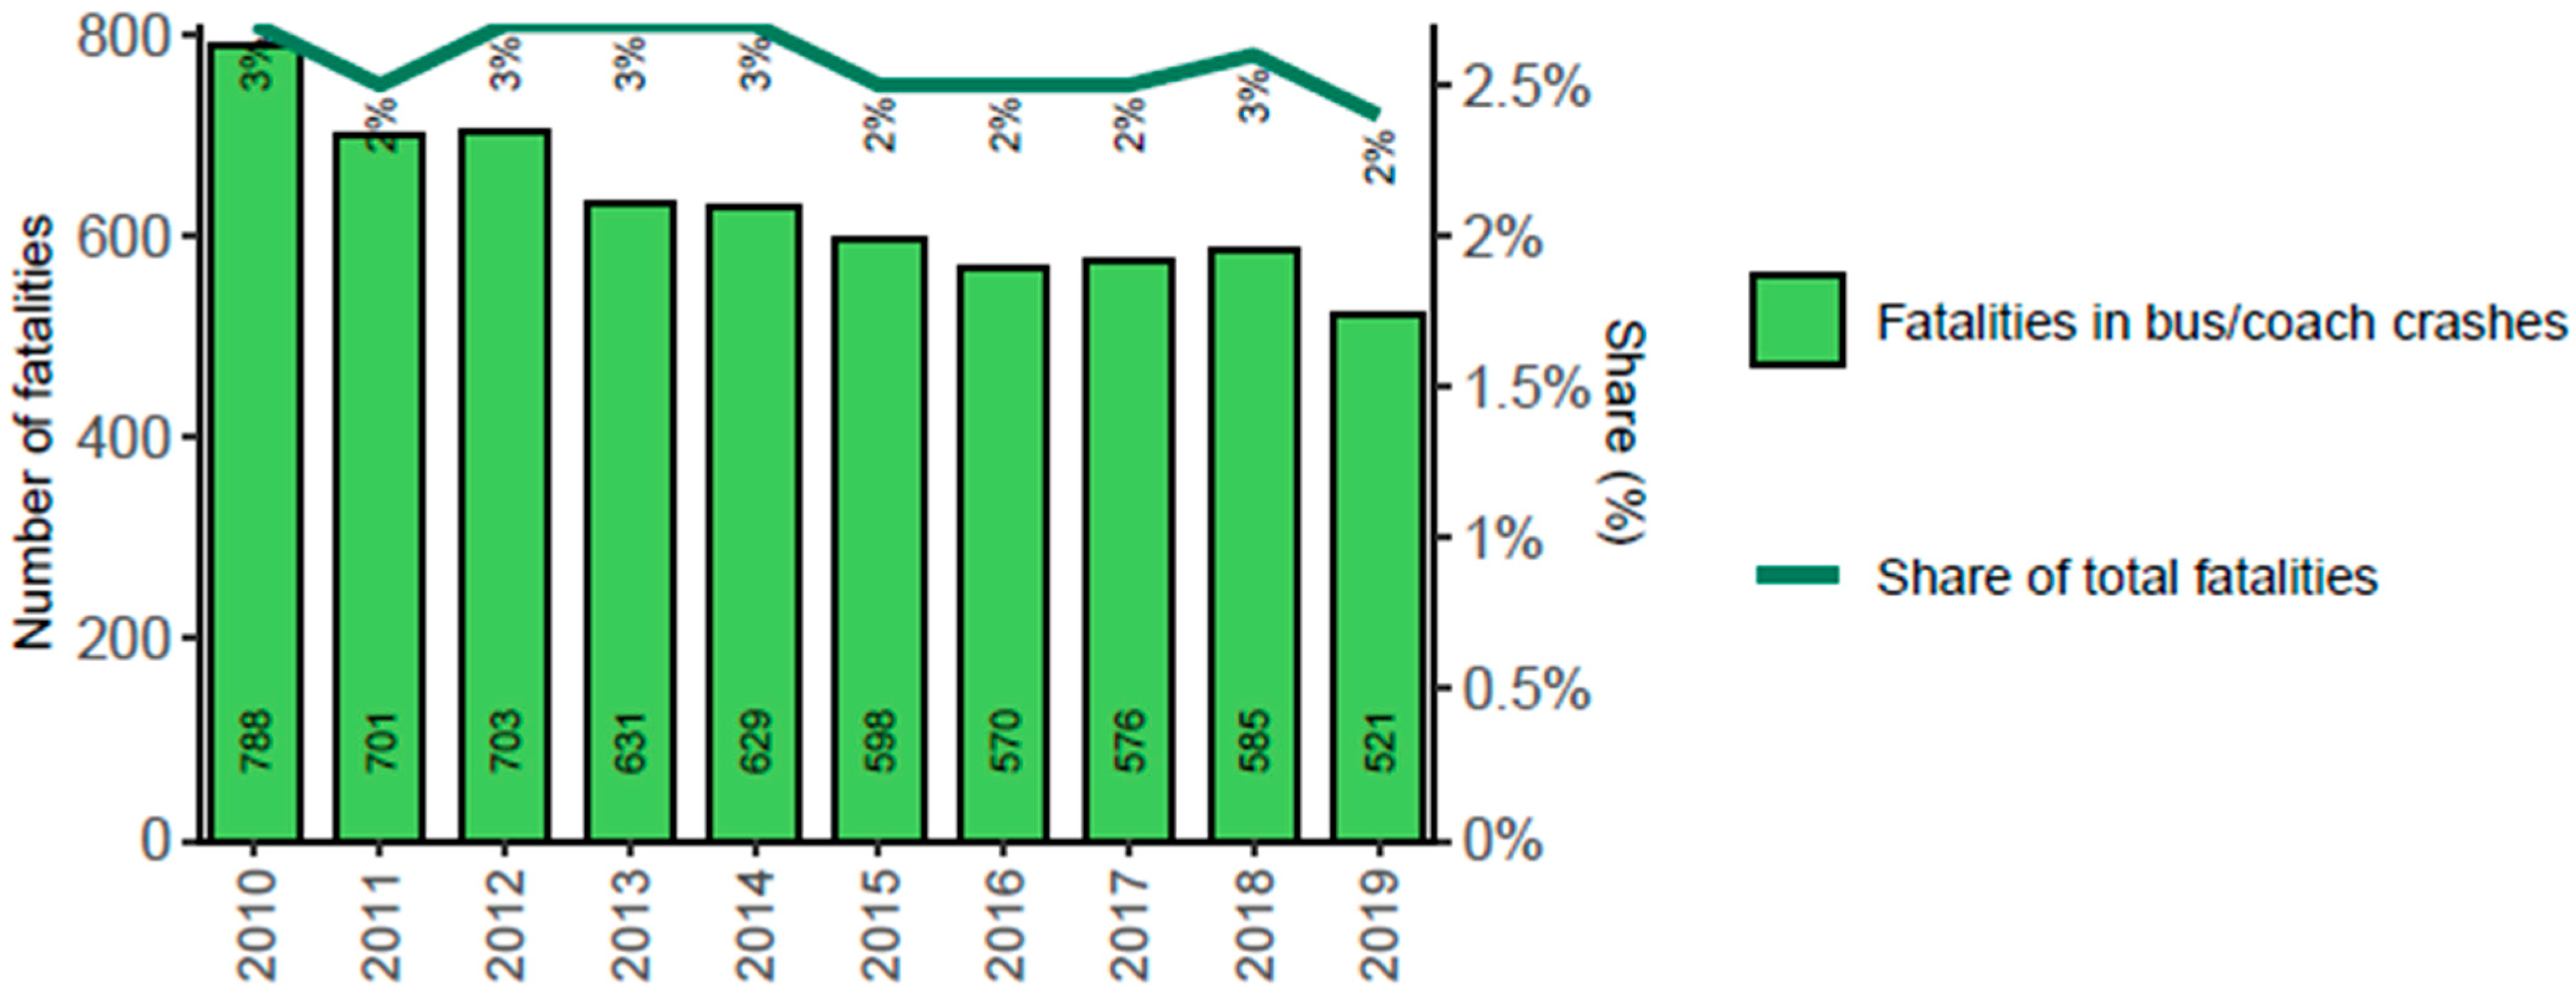
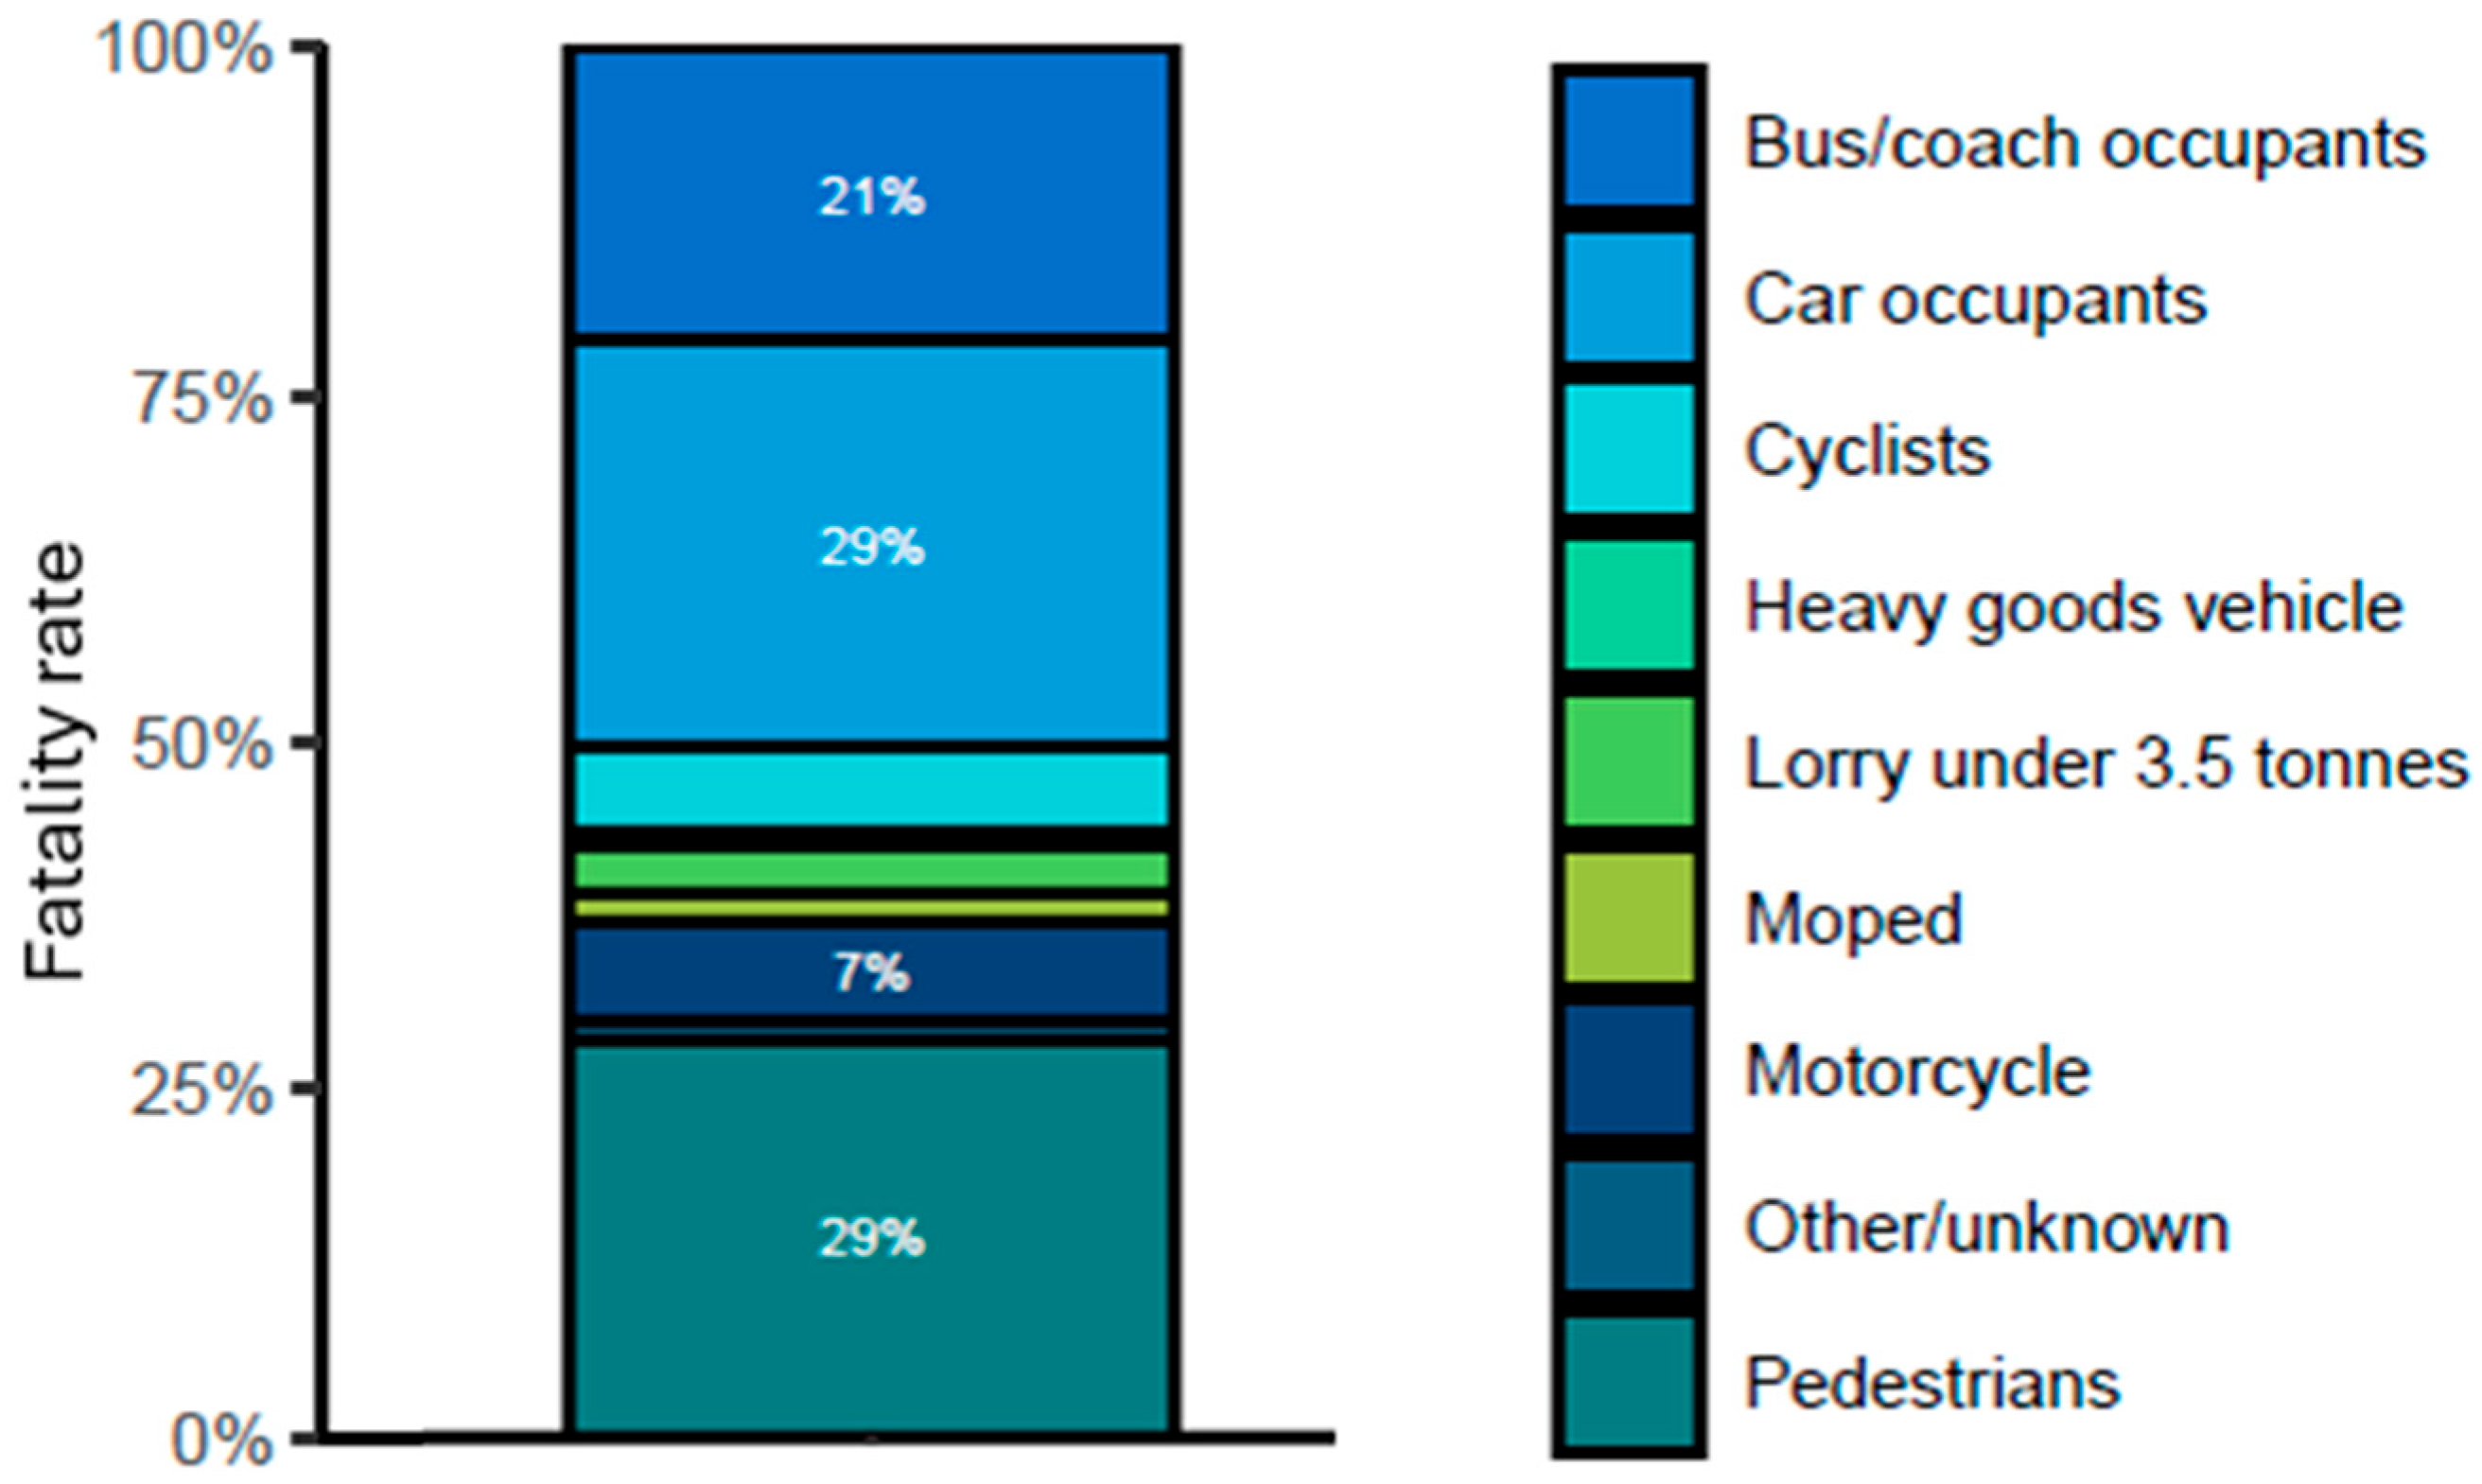
Accidents involving buses, which are related to the real-world accident investigation presented in Section 3, are the least common in the EU, resulting in fewer victims when compared to other types of road accidents. According to the European Road Safety Observatory [4], fatalities involving buses account for only 2% of all road fatalities, and this percentage remained almost stable between 2010 and 2019 (see Figure 2). On the other hand, only 21% of these fatalities account for occupants of the bus/coach itself (see Figure 3 about the percentage of fatalities by type involved in bus/coach accidents). Among those killed, there is a high proportion (about 37%) of vulnerable road users, being highly skewed towards pedestrians (about 29%), which is related to the urban environment in which many buses operate.

1.2. Rollover Event

Rollover accidents are among the most dangerous types of vehicle crashes, resulting in severe injuries and high fatality rates. Regarding the data from the U.S. National Highway Traffic Safety Administration (NHTSA), rollover crashes account for 33% of all traffic fatalities, while only 3% of vehicle crashes involve rollovers [5]. The type of vehicles associated with these types of accidents are vehicles with a high CoG position, especially heavy vehicles or sport utility vehicles (SUVs) [6]. Due to its consequences, especially social costs and human lives, the prevention of heavy vehicle rollover is a United Nations Sustainable Development Goal (SDG No. 9).
Vehicle rollovers can be categorized into two types: tripped and untripped rollovers. Tripped rollovers are caused by external factors, typically caused by collisions, and it is the most common type of rollovers. In contrast, untripped rollovers result from the loss of stability during vehicle cornering, where the vehicle’s CoG shifts excessively due to high lateral forces [7]. In this paper, only untripped rollovers will be studied.
Thus, a rollover is characterized by the loss of stability of a vehicle, occurring when the wheels on one side leave the ground due to the overturning force. The vehicle tips over its side or roof due to an imbalance of the lateral acceleration force, reactions on the tires, and the weight. There are a few reasons for the occurrence of rollovers, such as road factors (the curve radius is too small, the road camber is not adequate, or the friction coefficient is too low), high vehicle speeds (the centrifugal force varies with the square of the speed), improper driver actions (sudden braking or abrupt steering), and high vehicle’s CoG (center of gravity) [8,9].
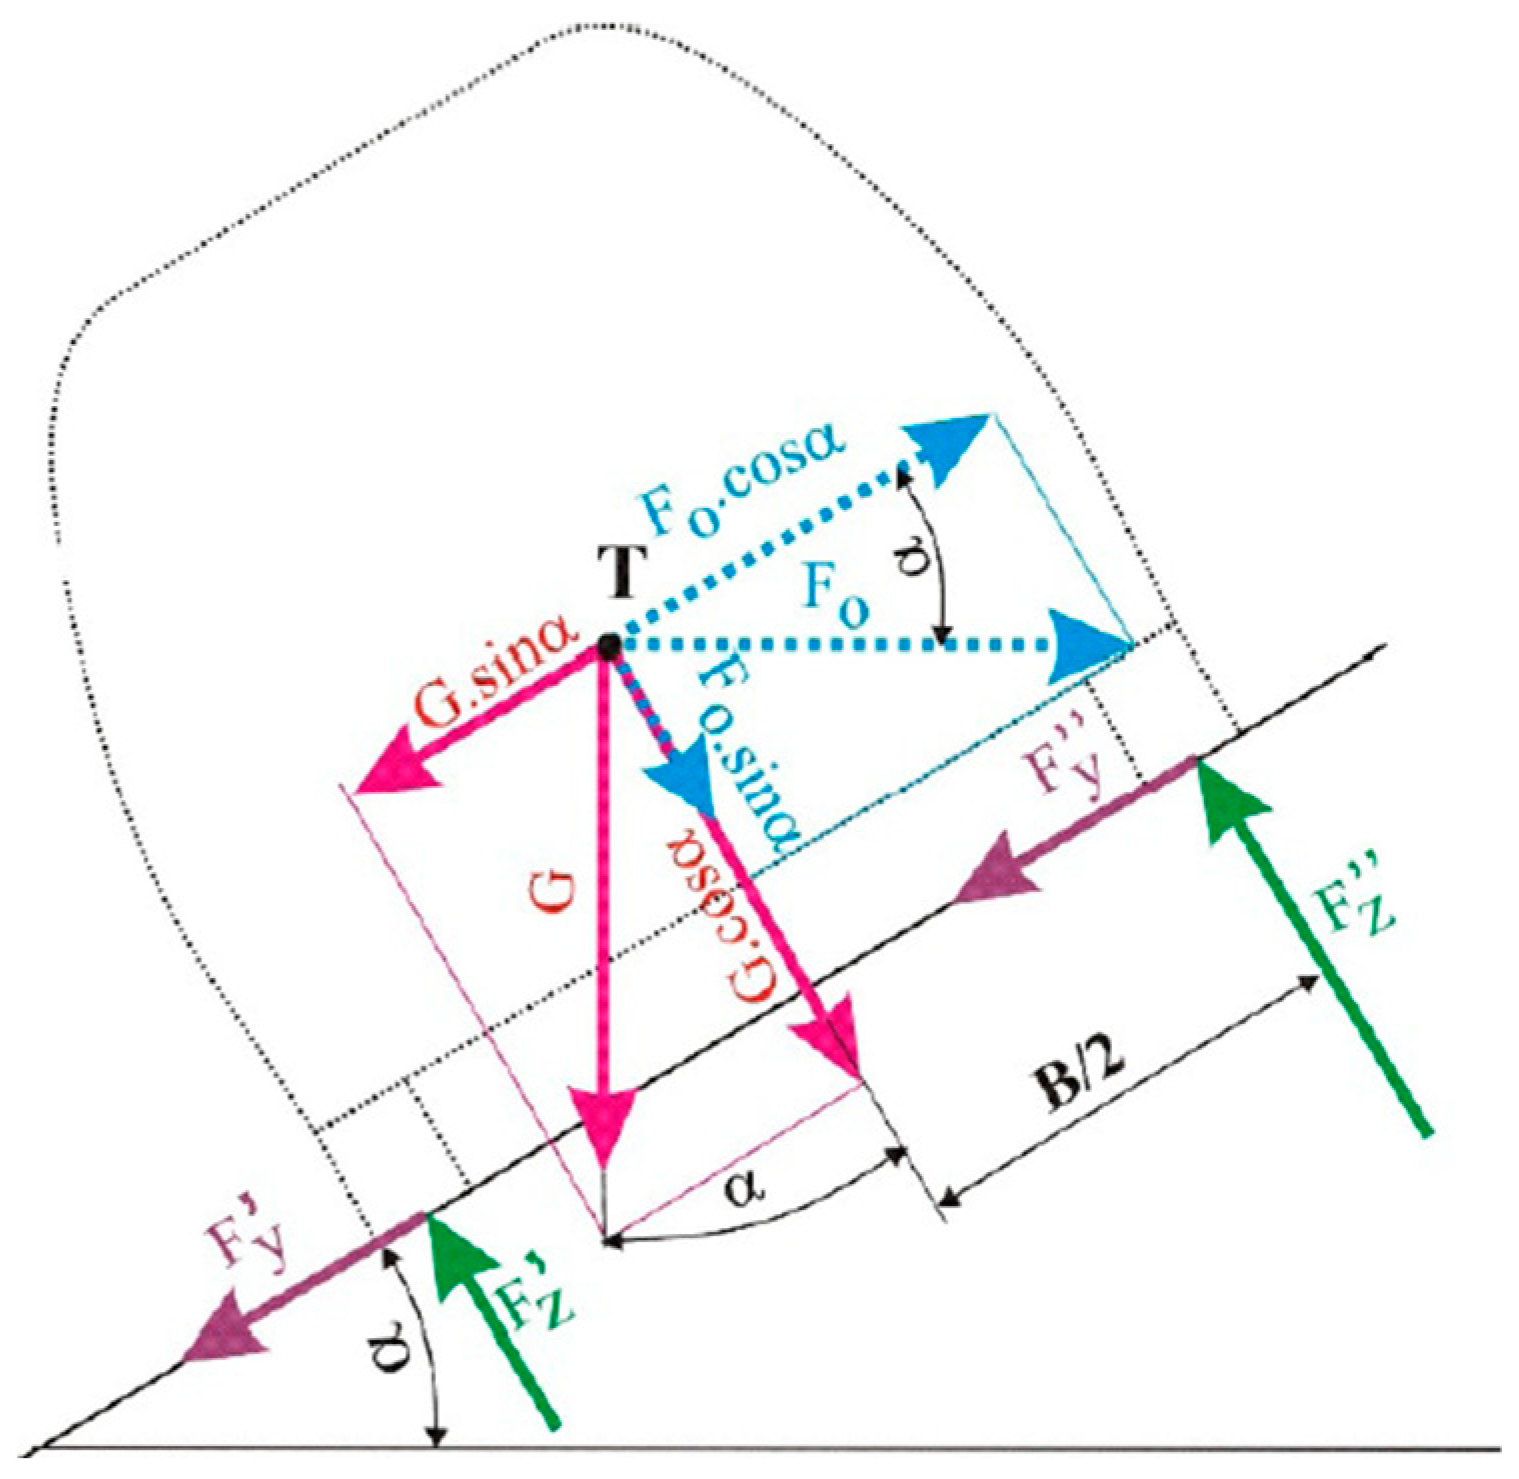
The effect of rollovers is more prone to happen in heavy vehicles, due to their bigger weight and higher CoG position, which are the two most important parameters for the occurrence of rollovers [6]. Hence, it is crucial to analyze the forces acting on vehicles when going around a curve. A diagram of forces acting on a vehicle when describing a banked curve is presented in Figure 4 [9].
When a vehicle is going along a curve, it is subjected to centrifugal force, while friction on wheels or the ground generates forces directed toward the curve’s center, creating the necessary centripetal force for the equilibrium during turning. If these forces are balanced, the vehicle can go around the curve smoothly. However, if the centrifugal force exceeds the centripetal force, the vehicle begins to roll. To maintain stability, the outer wheels must bear more support force than the inner wheels. Excessive speed may cause the inner wheels to lift off, increasing the risk of a rollover. A rollover occurs when the momentum due to the destabilizing forces exceeds the momentum due to the stabilizing forces, i.e., when the vehicle’s lateral acceleration exceeds its critical threshold, and the risk of rollover decreases as the threshold increases relative to the lateral acceleration [8,9]. By balancing the momentum relative to the vehicle’s center of gravity and by evaluating the horizontal and vertical forces, it is possible to determine the stability condition that must be met to prevent a rollover (see Equation (1), where t is the track width, h is the vehicle’s CoG height, a c is the centripetal acceleration, g is the gravitational acceleration, and p is the bank angle in decimal). The expression on the left side of the equation represents the lateral acceleration, while the right side represents the lateral acceleration threshold for the rollover, which is the critical point at which a vehicle becomes unstable and is likely to tip over during a turn or sudden maneuver. The threshold is determined by the interaction of several factors, including the vehicle’s center of gravity (CoG) height, track width, speed, and turn radius. In particular, heavy vehicles typically have a lower rollover threshold compared to passenger cars.
a c g > t 2 h + p
Equation (2) presents the theoretical lateral acceleration that a vehicle is subjected to when prescribing a curve, determined by the centripetal acceleration that allows the vehicle to follow a circular trajectory ( R is the turn radius and V is the vehicle’s velocity) [9].
a c g = V 2 g R p
According to P. Cruz, the Static Stability Factor (SSF) can be used to calculate the maximum lateral acceleration a vehicle is subjected to on a curve and is given by Equation (3) [9]. The SSF is an indicator of the rollover threshold when the bank angle is zero and is applicable to rigid systems [10].
S S F = a c , l i m g = t 2 h
The Kühn model estimates the static rollover threshold for both the outer and inner sides of a curve by applying Equations (4) and (5), respectively. In these equations, the vehicle is modeled as a rigid body without considering the effects of the suspension system [11].
a c , l i m g R i g i d , e x t = t 2 h + p 1 t 2 h p
a c , l i m g R i g i d , i n t = t 2 h p 1 + t 2 h p
On the other hand, the Gillespie model already accounts for the presence of a suspension system in vehicles [12]. As a result, the previous equation can be extended to Equations (6) and (7) by adding the effects of the balancing center height (ho, in m) and the rotation rate (rϕ, in rad/g). The rotation rate is the vehicle’s inclination speed, given by its suspension system when going around a curve. The point where this rotation is measured is referred to as the balancing center, which is located below the vehicle’s center of mass when modeled as a rigid body [9].
a c , l i m g D a m p i n g ,   e x t = t 2 h + p r ϕ 1 h 0 h + 1 + t 2 h p
a c , l i m g D a m p i n g , i n t = t 2 h p r ϕ 1 h 0 h + 1 t 2 h p
Hence, the position of a vehicle’s center of gravity (CoG), which represents the point where all the mass of a vehicle is centered, is an important parameter in vehicle dynamics, and its position affects the vehicle’s stability, handling, rollover potential, and overall safety. In a CoG-centered reference frame, the inertia properties (mass distribution), with respect to each of the three coordinate axes, affect the vehicle’s performance; therefore, it is critical to locate and calculate its position accurately, especially the CoG height, which is the most important factor in untripped rollover events [13]. This is even more important in vehicles like SUVs and military or heavy vehicles, where loading configurations or shifting weights during operations can cause substantial variations in the CoG height. For instance, a study conducted on heavy vehicles found that the CoG height can shift by more than a meter between loaded and unloaded states [10]. Moreover, studies have shown that even a 10% increase in CoG height can lead to significant increases in the roll time and maximum roll angle, potentially leading to accidents during critical maneuvers [14].

1.3. Rollover Index

With increasing awareness of the need to reduce traffic accidents, accurate detection of imminent rollovers has become necessary for implementing effective prevention strategies. To achieve this goal, a real-time rollover index (ROI) and a rollover tendency evaluation system are essential. The ROI is a dimensionless number that quantifies the real-time risk of a vehicle rolling over; thus, it is essential to calculate the ROI accurately to prevent rollovers and to avoid unnecessary activation of the active rollover prevention system [7,15,16]. This metric has already been integrated into safety control systems like electronic stability control (ESC) and roll stability control (RSC) systems [17].
Several ROI calculation methods incorporate the vehicle’s center of gravity (CoG) height; so, inaccuracies in the CoG height can result in significant errors in the rollover index. The nominal CoG height is typically based on the vehicle’s design, but differences arise when additional weight is loaded [7,15]. Given the critical influence of the CoG height on rollover risk, real-time CoG estimation becomes essential to adapt to dynamic changes in vehicle behavior. These estimators can function as driver warning systems or be embedded in active handling and rollover prevention controllers, enhancing overall vehicle stability and passenger safety [6,18]. In complex systems like automobiles, composed of several components and materials, determining the CoG is a complex task. Vehicle manufacturers rarely provide CoG data, and even when they do, it is often related to an empty vehicle with a fixed load distribution. Unlike the longitudinal CoG position (x–y-axes), which can be determined by measuring the weight in each wheel using load cells or scales, there is no direct method for measuring the CoG height (z-axis) [15,19]. The most common methods used to obtain the CoG height are the axle lift, tilt-table, and stable pendulum methods [20]. Static methods generally offer advantages over dynamic ones since they do not require repeated testing with different suspension setups or the complete disassembly of equipment [21]. Nevertheless, a lot of research has been conducted in this field [7,14,22,23,24,25].
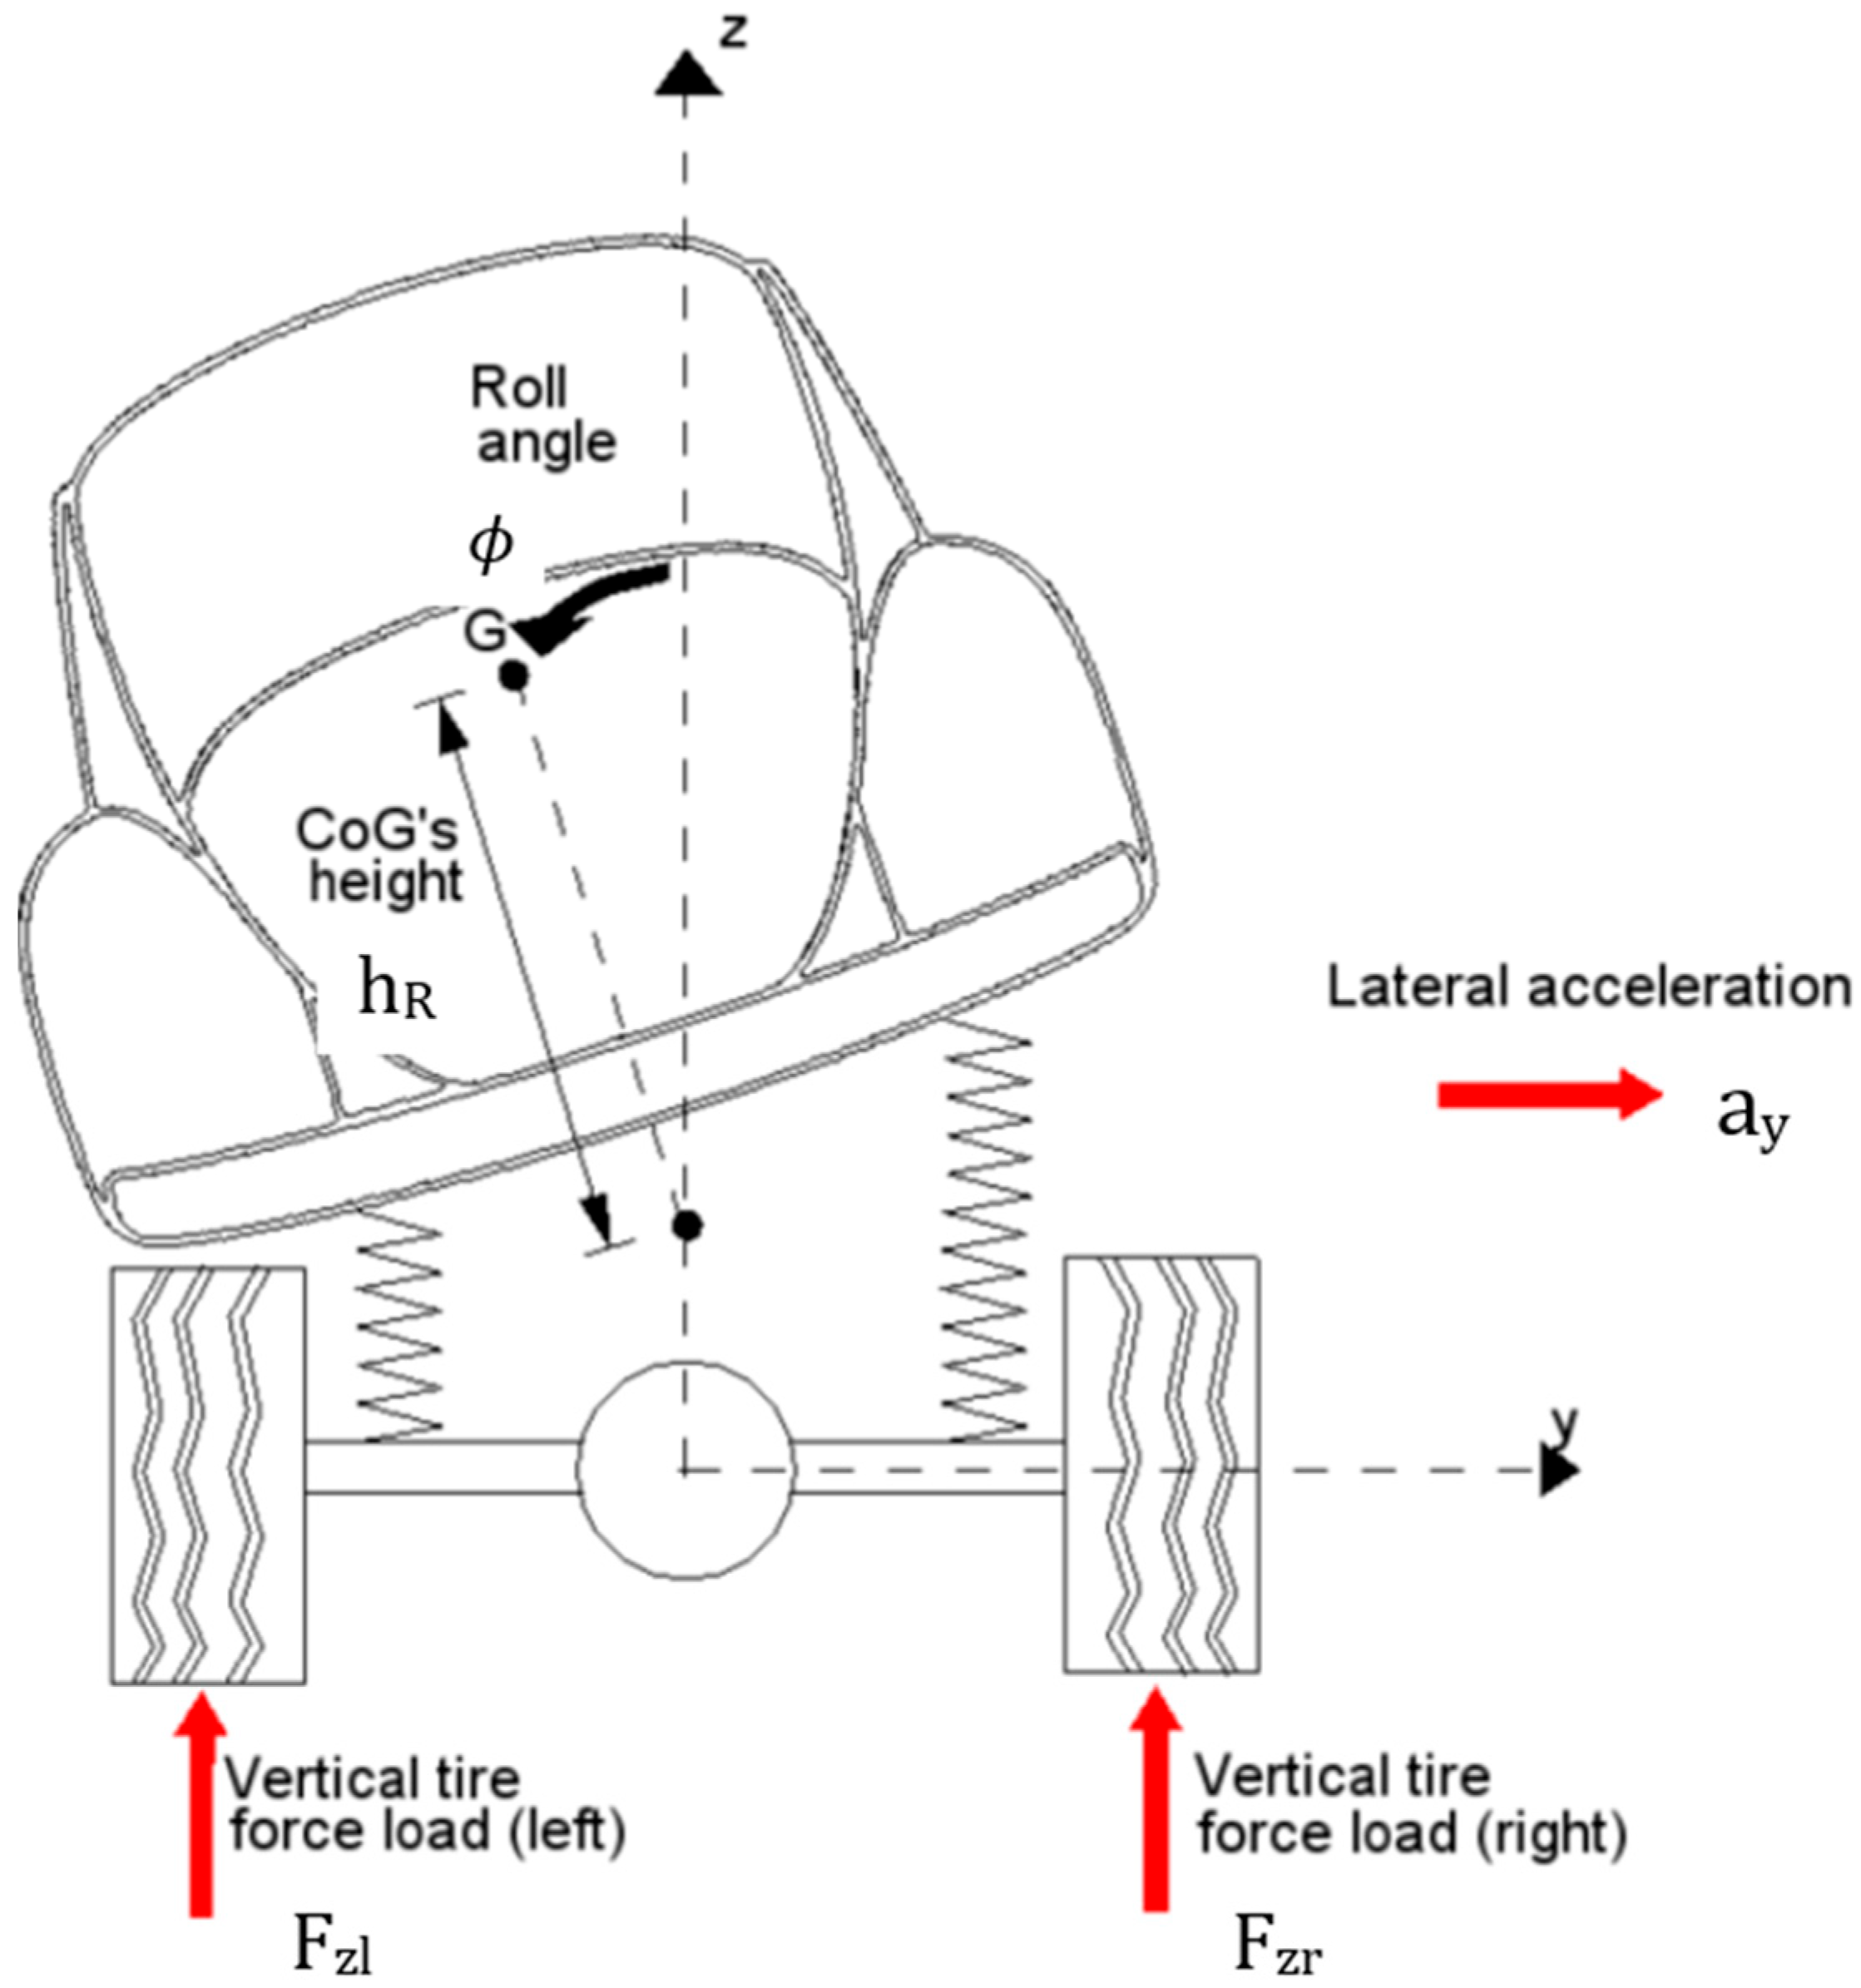
Another method to evaluate the ROI can be defined using the concept of the load transfer ratio (LTR). The LTR quantifies the risk of a rollover by measuring how much of the vehicle’s weight shifts from one side to the other during cornering or when subjected to lateral forces, i.e., the real-time difference in vertical tire loads between the left and right sides of the vehicle (Equation (8)). The LTR varies within the range of [−1, +1]. For a perfectly symmetric vehicle traveling straight, the LTR is 0; on the other hand, the extreme values of +1 or −1 are reached when a wheel lifts off on one side of the vehicle. Figure 5 illustrates a vehicle with a sprung mass undergoing a rolling motion [15,18].
L T R = R = F z l F z r F z l + F z r
Assuming that the rolling motion of the sprung mass is only caused by the vehicle’s lateral acceleration (disregarding road conditions and other external factors), the rollover index from Equation (8) can be expressed as:
R = 2 h R a y cos ϕ + 2 h R sin ϕ l w g cos ϕ
Therefore, the ROI can be expressed by:
R = 2 h R a y l w g
To mitigate rollover risks, efforts have been made to develop roll stability control systems [16]. Examples include the use of active and air suspension systems to improve vehicle roll stability [26,27]. Moreover, active control systems like active front steering and optimal control allocation braking have also been studied for rollover prevention [28,29]. Rothhämel et al. [30] demonstrated that modifying steering feel as a function of rollover risk can effectively increase the cornering speed. Woodrooffe et al. [31] showed, through simulations and field tests, that systems like ESC can significantly reduce rollovers and loss of stability. Further studies indicated that rollover prevention (ROP) systems could potentially lower rollover accidents by 25% and that older and more experienced drivers are statistically less likely to experience rollovers [10,32]. However, as mentioned before, it is important to evaluate the likelihood and conditions of a rollover accurately and in a timely manner before activating these mitigation systems.

1.4. Rollover Forensic Investigation

Understanding the position of a vehicle’s CoG along all three axes is critical not only for improving safety protocols but also in forensic engineering, particularly in reconstructing vehicular accidents.
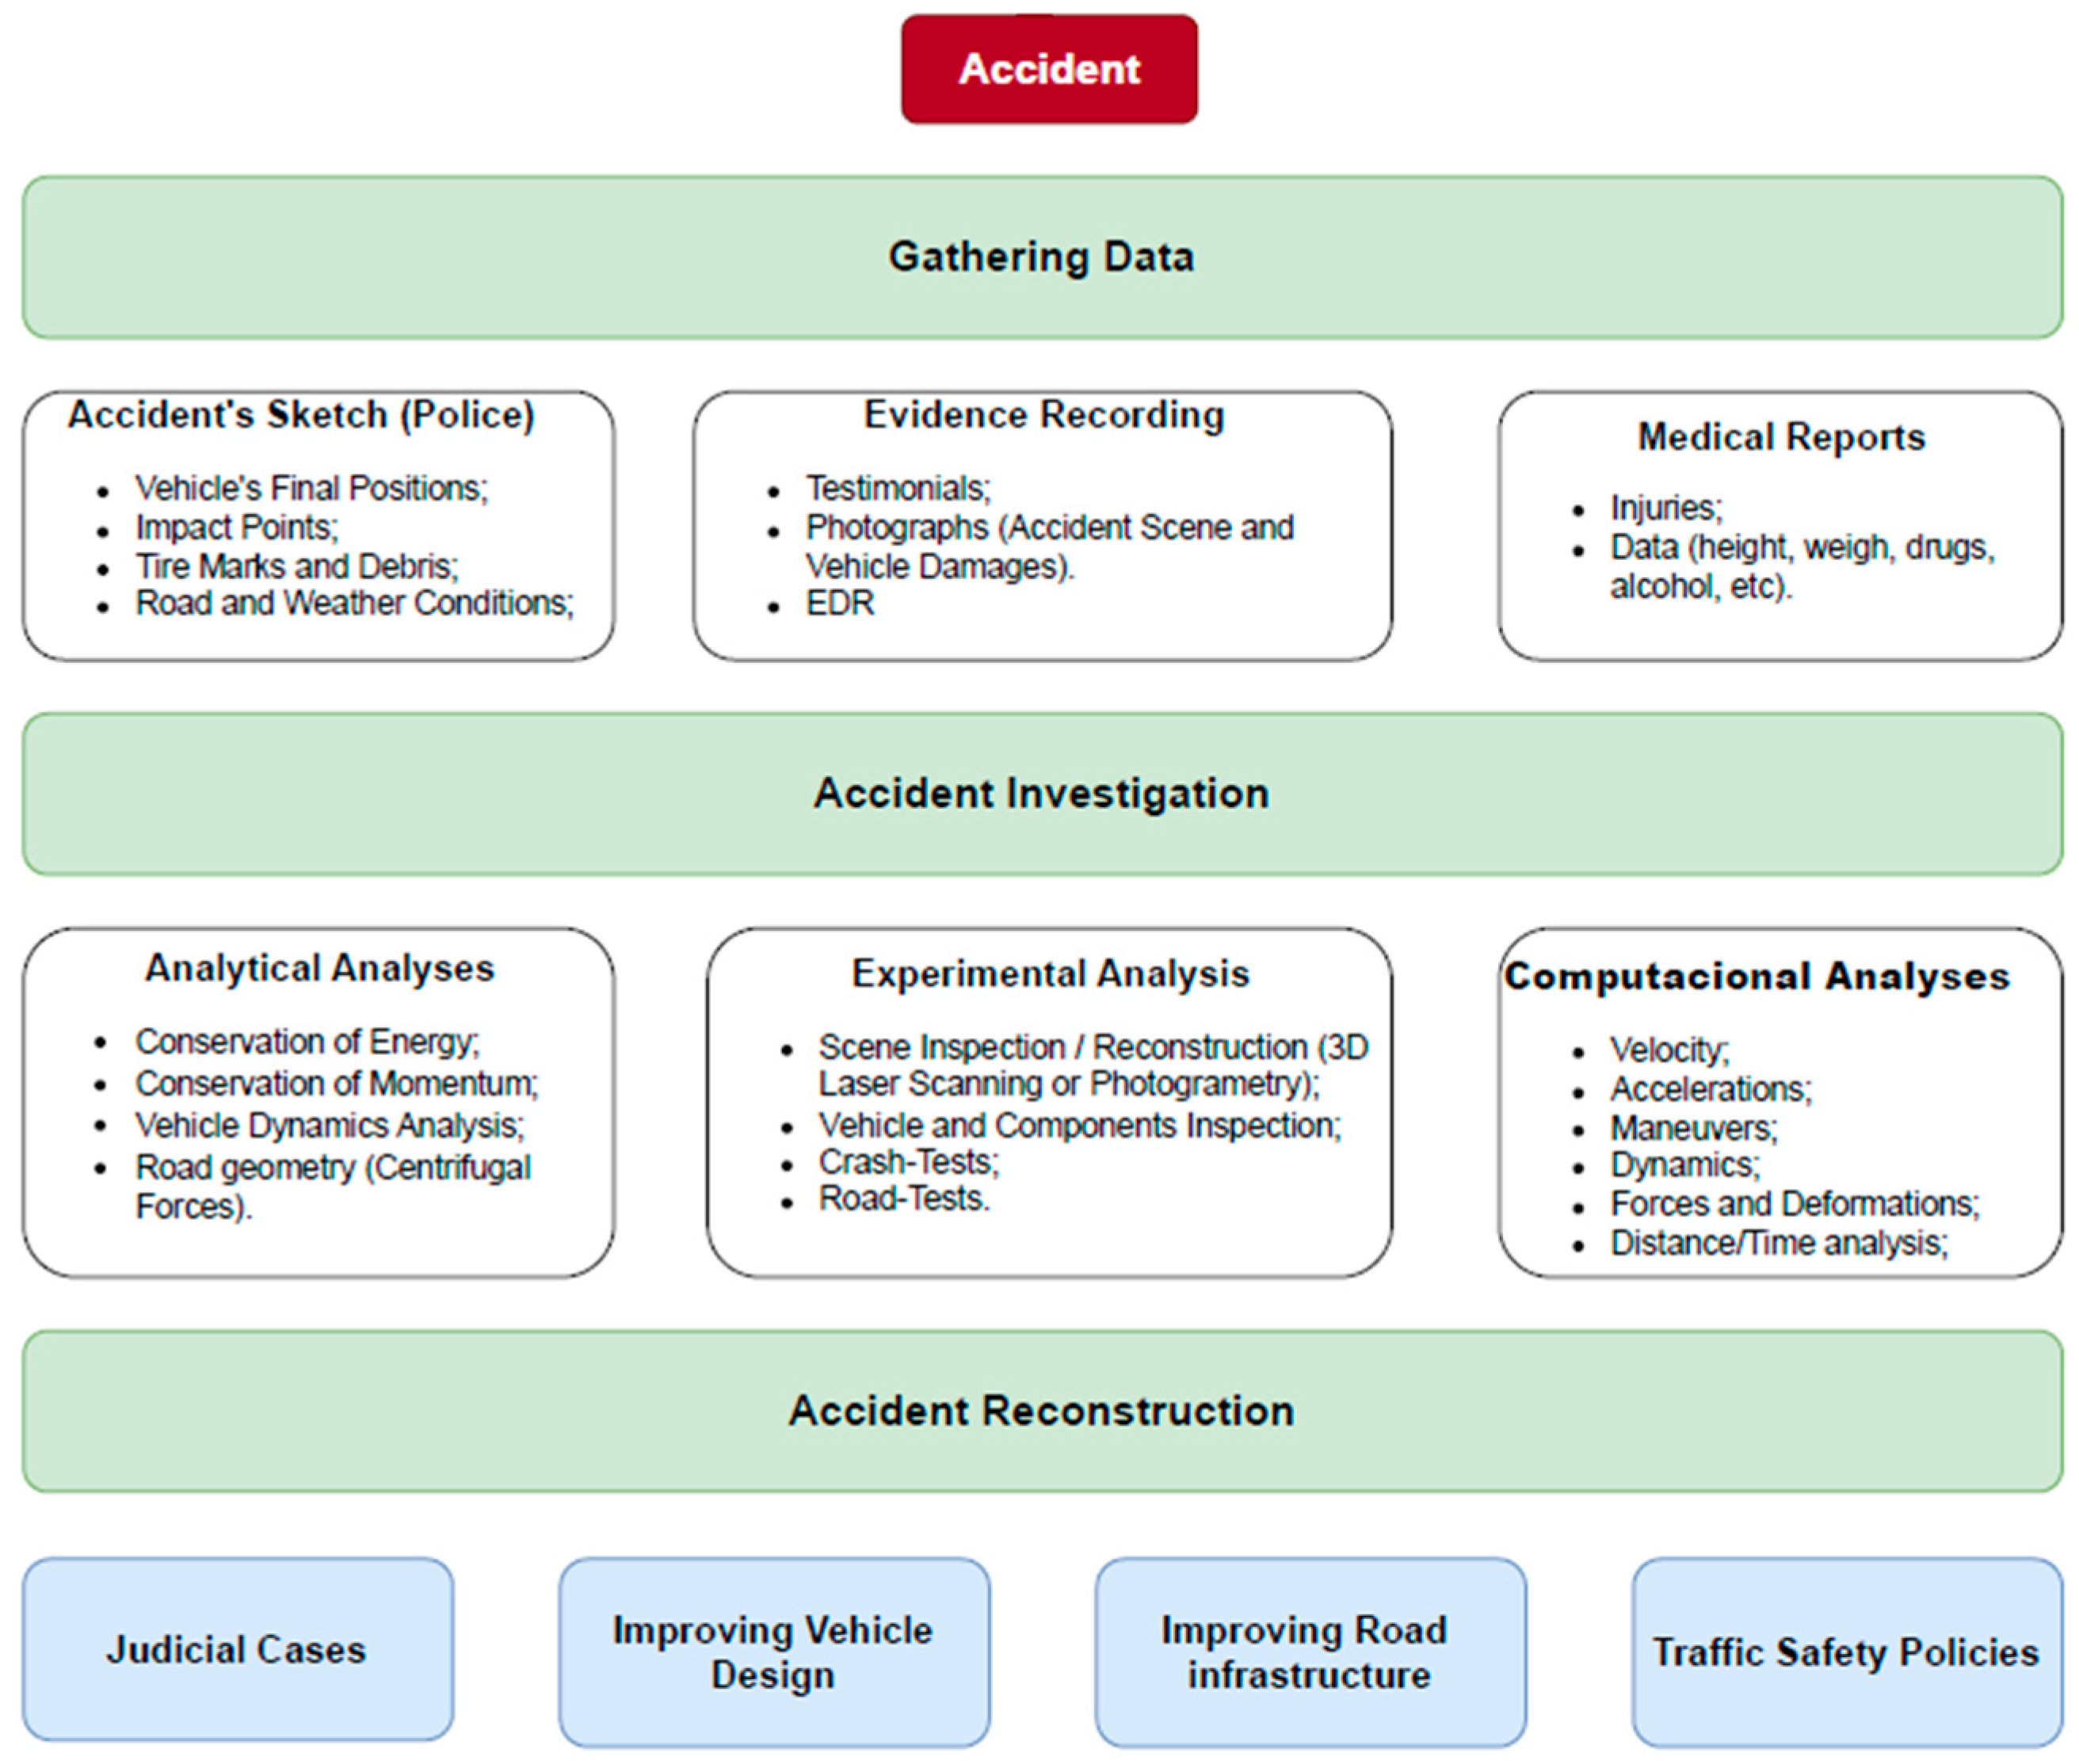
Forensic engineering for the investigation of a road accident event involves a combination of various techniques and technologies to gather evidence, with the main purpose of reconstructing the events leading up to the accident. This way, it is possible to determine its main causes and propose strategies and tools (such as laws or regulations) to prevent future occurrences. The main steps to investigate an accident include data collection to perform scene mapping and reconstruction, vehicle and component analysis, evaluation of human factors, and dynamic simulation and modeling. Recent advances used to reconstruct road accidents and perform other useful tasks regarding road accident investigation include 3D laser scanning and image processing analysis (enabling the accurate documentation and reconstruction of the crash scene), computer-aided design (CAD) programs, vehicle specification databases, momentum and energy analysis, collision simulation programs, and photogrammetry software. Moreover, video cameras and vehicle dash camera devices also play an important role in the reconstruction process of a collision. The methodology presented above is summarized in Figure 6 [33,34].
The CoG location significantly impacts vehicle dynamics before, during, and after an impact. In rollover accidents, an improperly positioned CoG greatly increases the likelihood of a rollover. The vertical distance between the CoG and the point of impact acts as a lever arm, influencing the vehicle’s pitching and rolling motions. Accurately modeling rear axle lift-off, which often occurs in frontal collisions, depends on precise CoG height data. In eccentric collisions, the longitudinal position of the CoG is a key factor, as the distance between the CoG and the impact force defines the lever arm, directly affecting the vehicle’s response. For road accident reconstruction purposes, Equations (11) and (13) can be used to obtain the skid speed limit and the overturning speed limit, respectively [20]. Figure 7 shows all the forces acting on a vehicle going through a curved road in a plane perpendicular to the trajectory that includes the CoG.
V s k i d = R × g × μ + tan α 1 μ × tan α
V o v e r t u r n i n g ,       h o r i z o n t a l   t r a c k = R × g × B 2 × h t
V o v e r t u r n i n g ,       b a n k e d   t r a c k = R × g × h t × tan α + B 2 h t B 2 × tan α
Regarding the equation related to the overturning velocity, as the curve radius (R) and distance between the wheels (B) increase, the velocity (V) increases, while an increase in the vehicle’s CoG height ( h t ) causes V to decrease. Thus, if B and R are constant, a higher CoG leads to a lower critical speed at which a rollover may occur [8]. Note that μ is the tire-road friction coefficient. As a result, determining the maximum safe speed for navigating curves becomes essential. The maximum speed is influenced by both the overturning speed limit and the skid speed limit, with the lower of the two serving as a constraining factor.
In practice, the rollover index and V o v e r t u r n i n g should be considered as complementary approaches, since the rollover indices are dimensionless measures that provide a real-time tendency suitable for supervisory control but do not directly return the critical overturning speed. By contrast, estimating V o v e r t u r n i n g provides an absolute threshold that considers the vehicle and road geometry, enabling an onboard safety system for warnings with the real velocity value that should not be exceeded.
This work presents a novel method for estimating the critical overturning velocity that (i) explicitly incorporates suspension stiffness when compared to the existing equations, bridging classic rigid body thresholds and compliant-suspension behavior; (ii) employs a compact single-macro-element formulation for roll angle estimation; and (iii) is validated against a real-world accident investigation using PC-Crash® software version 11.1.

2. Materials and Methods

An analytical method to investigate the factors that contribute to the overturning phenomenon in buses is presented, since a real-world accident involving this type of vehicle is presented in Section 3. By examining the relationship of several vehicle parameters, such as the CoG height, track width, and suspension properties, with external influences like lateral acceleration, we aim to establish a foundation for determining the critical conditions under which a rollover might occur.

2.1. Design of a Single Macro Finite Element by Numerical Modeling

The dynamic behavior of the passenger vehicle investigated here focuses only on its behavior as a consequence of maneuvers implemented during the vehicle’s driving, such as, for example, braking, accelerating, and sharp cornering for emergency actions.
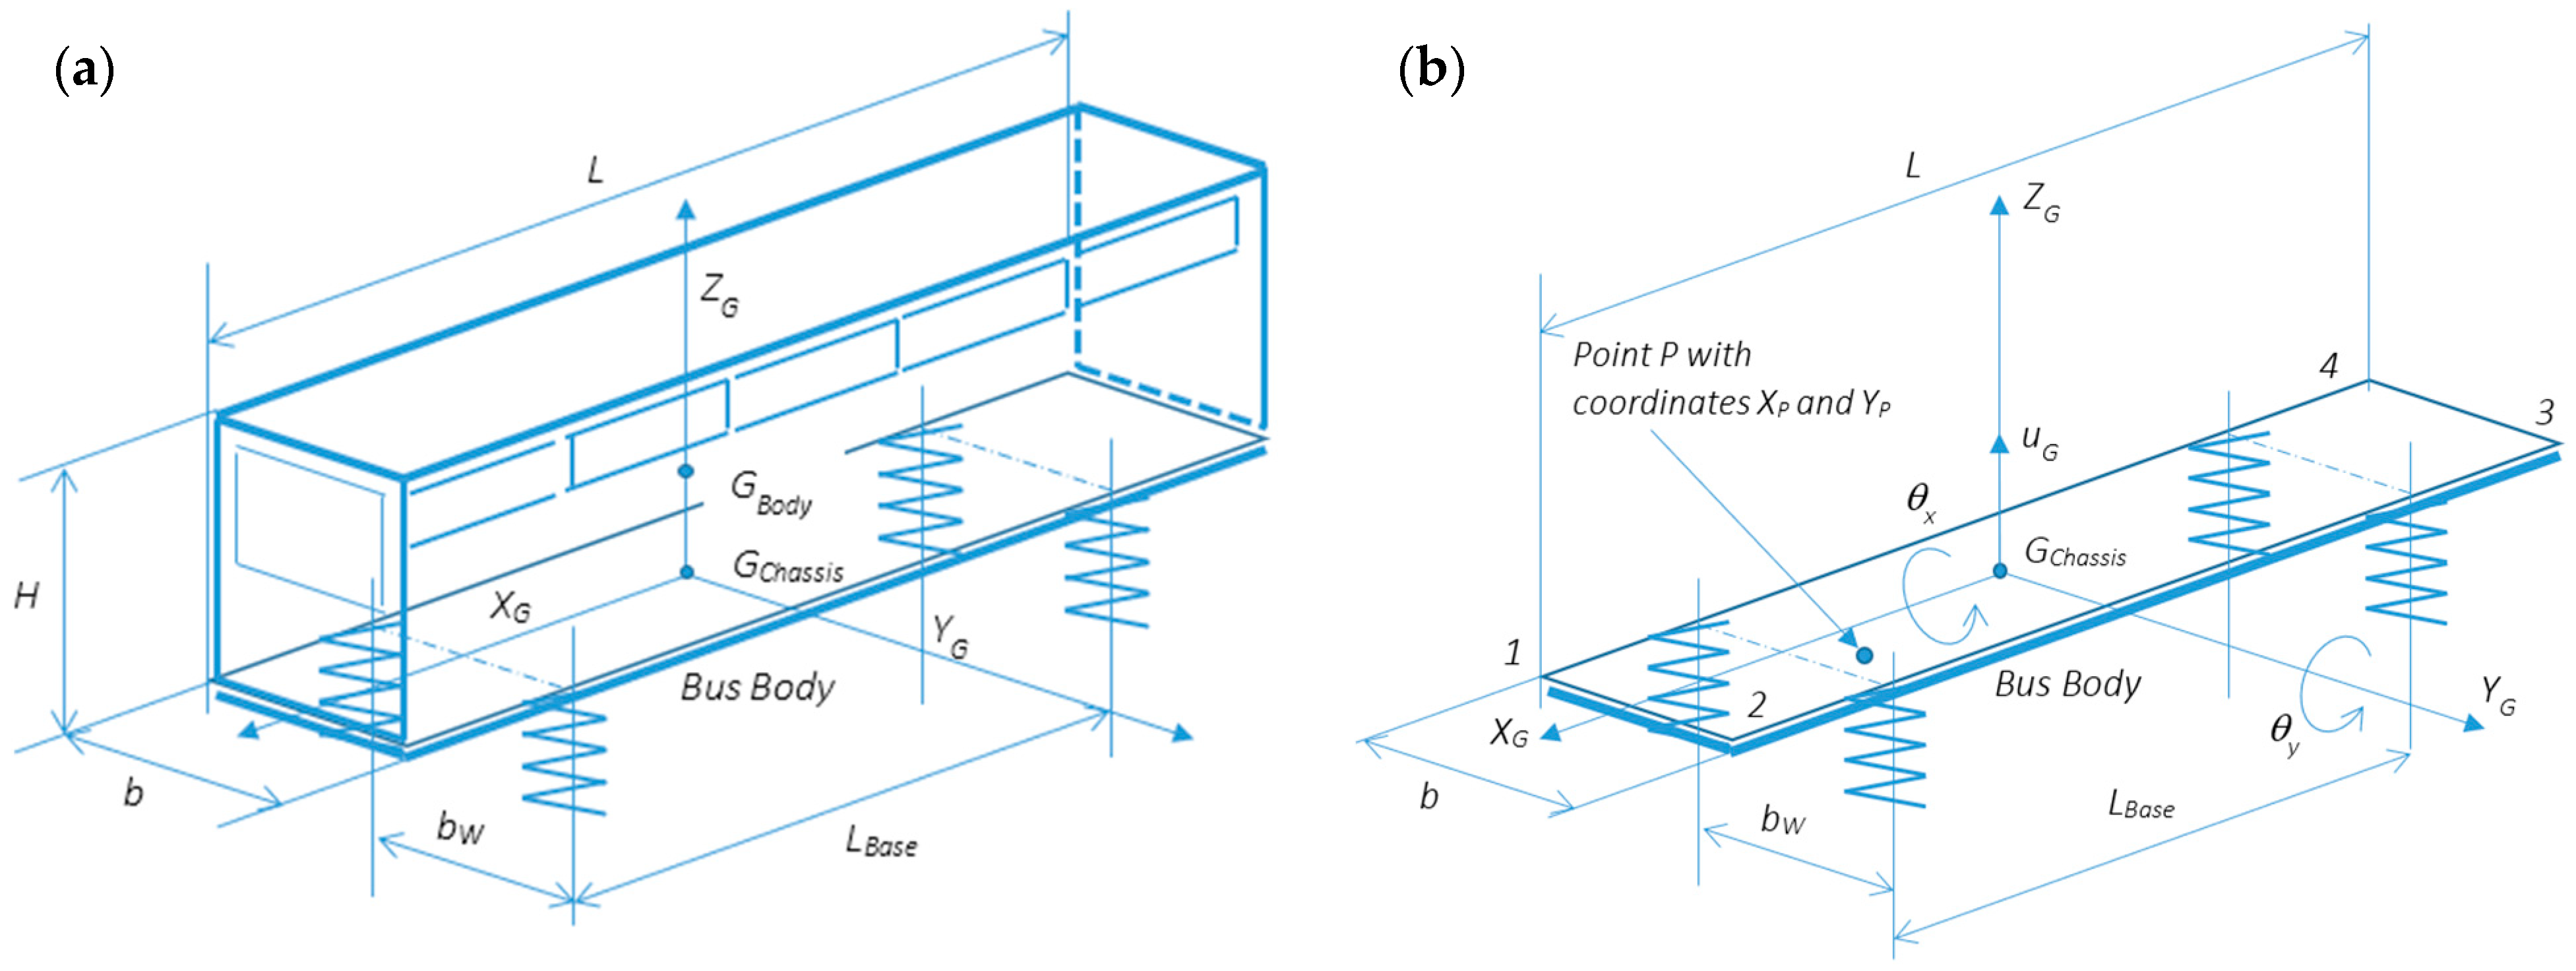
The vehicle model is taken as an equivalent to a rigid rectangular platform (plate) having four springs, one at each wheel hub. Note that, for this study, the contribution of any damping forces will not be considered, because only modal analysis is essential to evaluate an initial dynamic behavior. The mass and moments of inertia are allocated to the center of mass.
The degrees of freedom (DOFs) of this dynamic model are as follows:
  • u G : Vertical (or transverse) displacement of the plate’s center of mass G;
  • θ x : Plate rotation around the XG-axis;
  • θ y : Plate rotation around the YG-axis.
Moreover, elastic and dynamic characteristics need to be assigned to this modular finite element, as follows:
  • The vehicle mass m B u s   and respective dynamic inertial properties are assumed to be concentrated on the vehicle’s center of mass;
  • The spring stiffness, k F r o n t ,   k Re a r   (front and rear axles, respectively, if their suspension has differing stiffness values);
  • The tire stiffness should be associated in series with the suspension spring. Since the tire stiffness is much higher than the stiffness of the suspension, the tire stiffness will be ignored in the series association.
The displacement field of the plate-chassis element is characterized by the superposition of a uniform displacement at the 4 nodes, u G , with an additional displacement field due to rotations about the coordinate axes at the center of mass:
N o d e   1 :   u 1 = u G b w 2 × θ x L b a s e 2 × θ y N o d e   2 :   u 2 = u G + b w 2 × θ x L b a s e 2 × θ y N o d e   3 :   u 3 = u G + b w 2 × θ x + L b a s e 2 × θ y N o d e   4 :   u 4 = u G b w 2 × θ x + L b a s e 2 × θ y
The internal deformation energy due to suspension displacements is given by the following quadratic expression:
U I n t e r n a l = 1 2 k F r o n t × u G   b W / 2 × θ x   L b a s e / 2 × θ y 2 + 1 2 k F r o n t × u G +   b W / 2 × θ x   L b a s e / 2 × θ y 2 x + 1 2 k Re a r × u G +   b W / 2 × θ x +   L b a s e / 2 × θ y 2 + 1 2 k Re a r × u G   b W / 2 × θ x +   L b a s e / 2 × θ y 2
The external work W E x t . is due to the action of external forces or moments exerting work along displacements or rotations, respectively.
The total energy stored in the system is as follows:
U T o t a l = U I n t e r n a l + W E x t .
The matrix equation for the structural equilibrium is obtained by setting the total energy to a minimum in the order of the problem’s parameters.
The first equation of the solution system, related to u G   variation, is as follows:
U I n e r n a l u G = 2 k F r o n t + 2 k Re a r × u G ( 2 k F r o n t 2 k Re a r ) L b a s e / 2 × θ y
The second equation, related to θ x variation, is as follows:
U I n t e r n a l θ x = ( 2 K F r o n t + 2 k Re a r ) × b W / 2 2 × θ x
The third equation, related to θ y variation, is as follows:
U I n t e r n a l θ y = L b a s e / 2 ( 2 k F r o n t 2 k Re a r ) × u G + L b a s e / 2 2 ( 2 k F r o n t + 2 k Re a r ) × θ y
It can also be written in a matrix form:
2 k F r o n t + 2 k Re a r 0 ( L b a s e / 2 ) × ( 2 k F r o n t 2 k Re a r ) 0 b w 2 4 ( 2 k F r o n t + 2 k Re a r ) 0 ( L b a s e / 2 ) × ( 2 k F r o n t 2 k Re a r ) 0 L B a s e 2 4 ( 2 k F r o n t + 2 k Re a r ) u G θ x θ y = F U G M θ x M θ y  

2.2. Development of an Analytical Method to Evaluate the Overturning Velocity

The vehicle was modeled as a rigid plate, where suspensions can be equivalent to spring elements assigned to each node of the rectangular element, giving a good insight into predicting the vehicle’s behavior under external forces, either from the road condition or from driving maneuvers. In the last case, there is a need to accurately model the influence of inertial forces or moments through dynamic actions. This can be obtained by considering a mass focused on the vehicle’s center of mass and assigning the respective moments of inertia for additional masses not located at this point, such as the passengers’ seats, engine, and batteries, in the case of an electric or hybrid vehicle. Smooth driving entails a minimum intensity derived from inertial forces and, consequently, a marginal effect on the vehicle’s suspension height related to the horizontal plane. Sharp maneuvers have an opposite effect, mainly on the angular degrees of freedom θ x and θ y , respectively, and the roll and the pitch angles, as represented in Figure 8b. While the pitch angle θ y has a smaller effect on the vehicle’s stability (given a normally large wheelbase), the roll angle θ x is much more important, being related to the vehicle’s stability because of centrifugal forces on sharp turns or by eventual actions of lateral wind gusts.
This dynamic action may have a dramatic effect on heavy vehicles, as is the case with a passenger bus. For instance, if the vehicle is at full capacity, its center of mass has an increased level to ground, more easily potentiating rollover motion, as described in the following analysis.
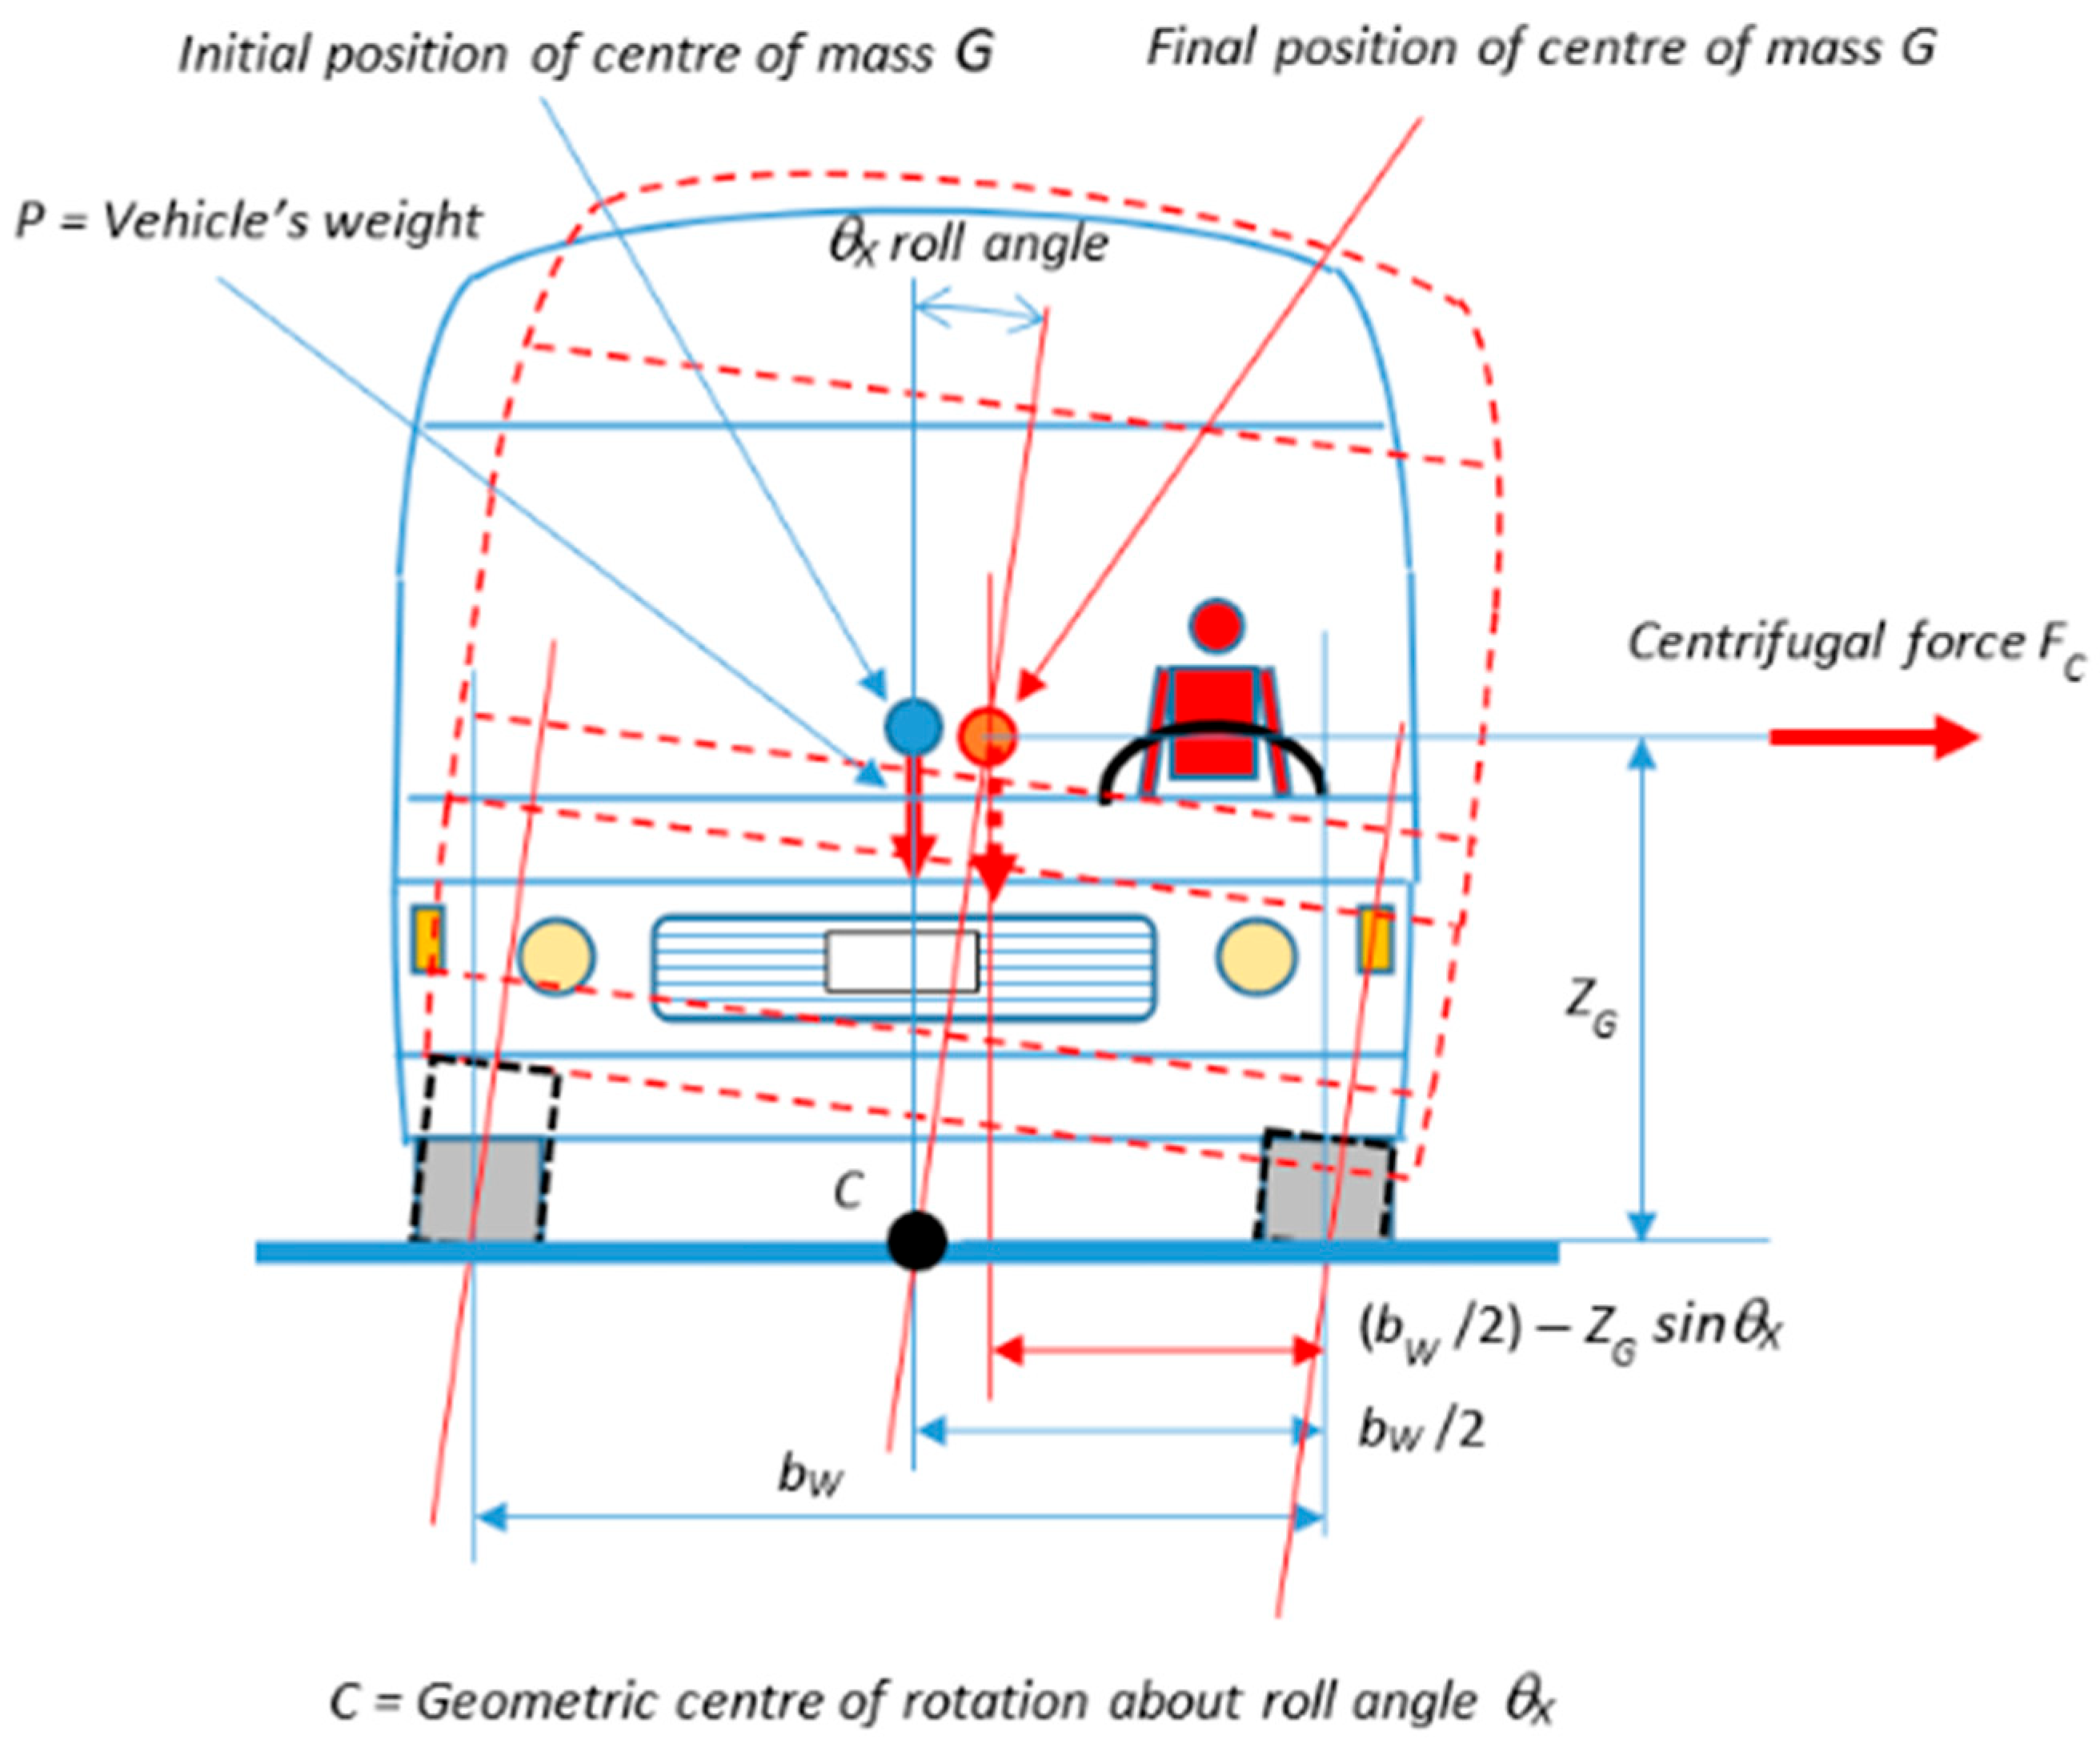
Figure 9 is a schematic representation of a passenger vehicle subjected to centrifugal force F C while going (at velocity v ) along a curved trajectory (R: curve trajectory radius).
The Stability Moment M w e i g h t   is obtained by multiplying the vehicle’s weight P by the effective distance of the center of gravity projection on the ground to the tire line joining the front and rear wheels, closer to the center of curvature R of the trajectory. Given the effect of the centrifugal force on the suspension, its elasticity raises the roll angle θ x , hence reducing the initial distance of the center of mass projection point to the mentioned wheel line. This effective distance is then given by b W 2 z G × sin θ x , showing that if the vehicle has a smooth and non-stabilized suspension against roll tendency, the danger of vehicle rollover will increase. Thus, the Stability Moment can be considered as:
M w e i g h t = P × b W 2 z G × sin θ x = m B u s × g × b W 2 z G × sin θ x
On the other hand, an antagonist moment is generated by the centrifugal force (if the roll angle θx is small, that is, less than 10°). Thus, the rollover moment M R o l l , which is obtained by multiplying the centrifugal force F C by the z G   coordinate of the vehicle’s center of mass, is given by:
M R o l l = F C × z G = m B u s × v 2 R × z G
Hence, the condition for a vehicle’s stability through a curved trajectory should follow the condition of Equation (23), i.e., the Stability Moment should always be larger than the rollover moment.
M w e i g h t M R o l l
Inversely, the vehicle’s rollover is achieved when Equation (24) is verified:
M R o l l M w e i g h t
Finally, to obtain the critical overturning velocity of a vehicle when approaching a curve, given the local geometric topography and the vehicle characteristics, the following condition for stability must be observed:
m B u s × v 2 R × z G < m B u s × g × b W 2 z G × sin θ x
Considering that angle θx is small, as stated above, it is possible to take sin θ x θ x .
In the imminence of vehicle rollover, the following equation represents that limit:
v 2 R × z G = g × b W 2 z G × sin θ x
The system of Equation (20) includes a second equation, where variable θx appears uncoupled to the remaining ones:
b w 2 4 2 k F r o n t + 2 k Re a r × θ x = M θ x
θ x = M θ x b w 2 4 2 k F r o n t + 2 k Re a r
Then, for rollover imminence,
θ x = m B u s × v 2 R × z G b w 2 4 2 k F r o n t + 2 k Re a r
The condition of moment equilibrium due to the vehicle’s weight support basis leads to:
z G × v 2 g × R = b W 2 m B u s × z G 2 × v 2 b w 2 4 2 k F r o n t + 2 k Re a r × R
b W 2 = v 2 m B u s × z G 2 b w 2 4 2 k F r o n t + 2 k Re a r × R + z G g × R
Then, the critical speed for the overturning imminence of a vehicle (bus) going along a curved trajectory is as follows:
v o v e r t u r n i n g = R × b W 2 × m B u s × z G 2 b w 2 4 2 k F r o n t + 2 k Re a r + z G g
The equation above depends on the stiffness properties of the vehicle’s suspension. Nevertheless, it is necessary for the manufacturers to provide those values or use reference values found in the literature.

3. Results

To enhance the opportunity and usefulness of numerical tools for the dynamic analysis presented above, two examples are hereby presented to validate the finite element method developed, performing as a single rigid body for modeling the dynamic behavior of a vehicle. The objective is to demonstrate how to obtain pitch and roll angles by applying the developed method. Afterwards, the proposed equation to calculate the overturning velocity—Equation (29)—is applied to a real-world accident investigation to compare and validate the results.

3.1. Estimation of Pitch and Roll Angles

Example 1
For the first example, we intend to demonstrate the expected reality of a vehicle under real road driving conditions, revealing the behavior of the vehicle’s body during the braking motion. Let us suppose a vehicle with the following dimensions:
  • Bus mass: 13 ton (approx. 130,000 N);
  • Wheelbase L b a s e : 6 m;
  • Track width b w : 2.5 m;
  • Stiffness coefficient of front/rear suspension k f / k r = 303,844/397,007.7 N/m [36,37,38].
Assuming the vehicle’s mass is concentrated at the center of mass and the geometric center of the four-node wheel hub rectangle presented in Figure 8, Equation (20), giving the z-displacements of the vehicle wheel hubs, is as follows:
1,400,000 0 150,000 0 2,187,500 0 150,000 0 12,600,000 u G θ x θ y = 130,000 0 0
θ x = 0 θ y = 0.0011   r a d u G = 0.0928   m
These results refer to a downward weight force, but it is assumed to be positive; also, the pitch angle θ y = 0.0011   r a d is assumed to represent the sense of watching the vehicle “pitch” ahead, which is an expected configuration given the softer front springs of the front suspension.
Example 2
In another example, let us suppose that the vehicle’s dead weight, assumed to be the concentration of masses at the vehicle’s CoG, has an additional offset weight due to the presence of passengers (see Figure 10), meaning that all of them are distributed along seat rows only on one side of the vehicle.
The total passenger load is 2200 kg (about 22,000 N), where the center of mass of this additional load shifts 0.5 m in the direction of the passenger’s row, compared to the vehicle’s original (unloaded) leading axis XG. Now, an additional moment is generated in the vector of external loads, and the equations for the problem are as follows:
1,400,000 0 150,000 0 2,187,500 0 150,000 0 12,600,000 u G θ x θ y = 130,000 + 22,000 = 152,000 22,000 × 0.5 = 11,000 0
The results are now as follows:
θ x = 0.005   r a d θ y = 0.0011   r a d u G = 0.108   m
Thus, the displacements at the wheel hubs (assumed to be positive if facing downwards) are as follows:
  • Front axis, left wheel: 0.108 + 6 2 × 0.0011 2.5 2 × 0.005 = 0.105   m
  • Front axis, right wheel: 0.108 6 2 × 0.0011 2.5 2 × 0.005 = 0.0985   m
  • Rear axis, left wheel: 0.108 + 6 2 × 0.0011 + 2.5 2 × 0.005 = 0.1176   m
  • Rear axis, right wheel: 0.108 6 2 × 0.0011 + 2.5 2 × 0.005 = 0.111   m
It is possible to conclude, by simple visual inspection, that the hub displacements due to the passengers’ weight are practically the same (values vary by less than 0.02 m), and the vehicle’s chassis seems to be level and parallel to the horizontal plane.

3.2. Real-World Accident Investigation

A real-world case study, which involved a bus accident in Portugal, is presented to illustrate the critical relationship between a vehicle’s CoG height and its stability while cornering. By examining both an analytical and a computational approach, it is important to clarify the mechanisms that can lead to a vehicle achieving overturning conditions and how they relate to the CoG height and cornering dynamics. The following analysis proposes an inverse methodology where the vehicle’s velocity is sought to potentiate the imminence of the vehicle rollover.

3.2.1. Accident Description: Site and Vehicle Details

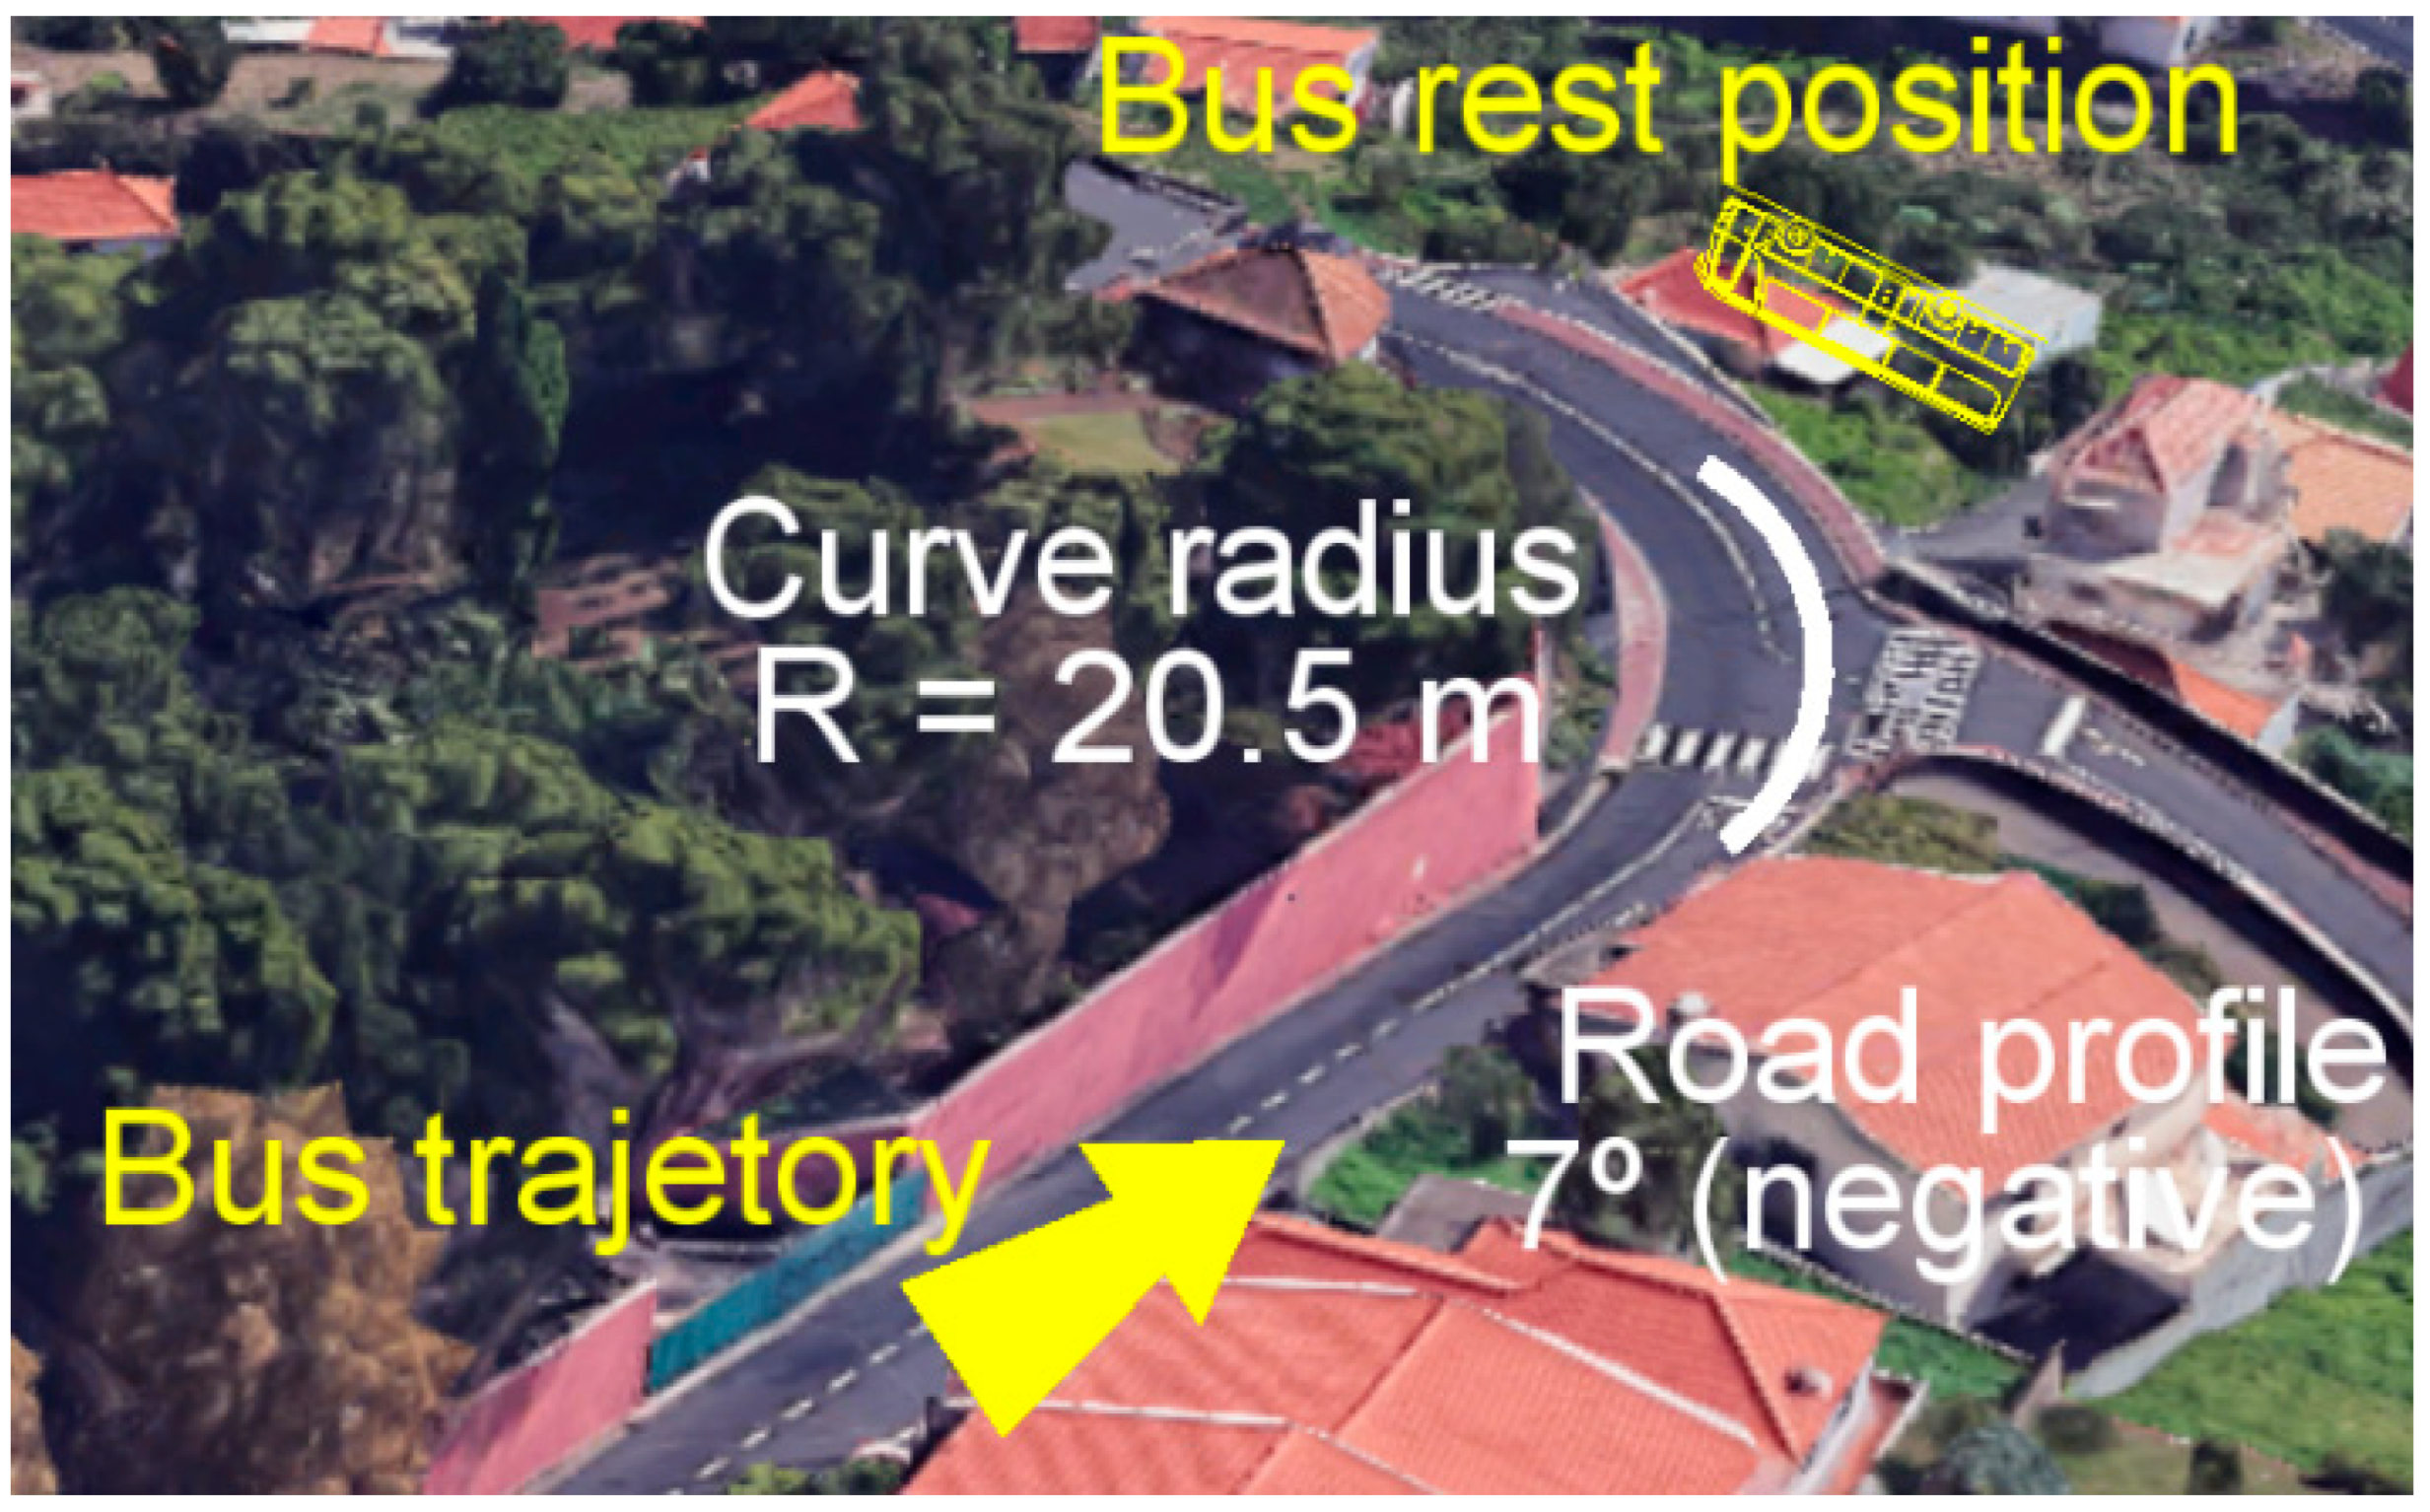
The accident occurred as the bus was going around a sharp corner with a radius of 20.5 m and a negative inclination of 7° on a downhill trajectory (see a sketch of the accident in Figure 11).
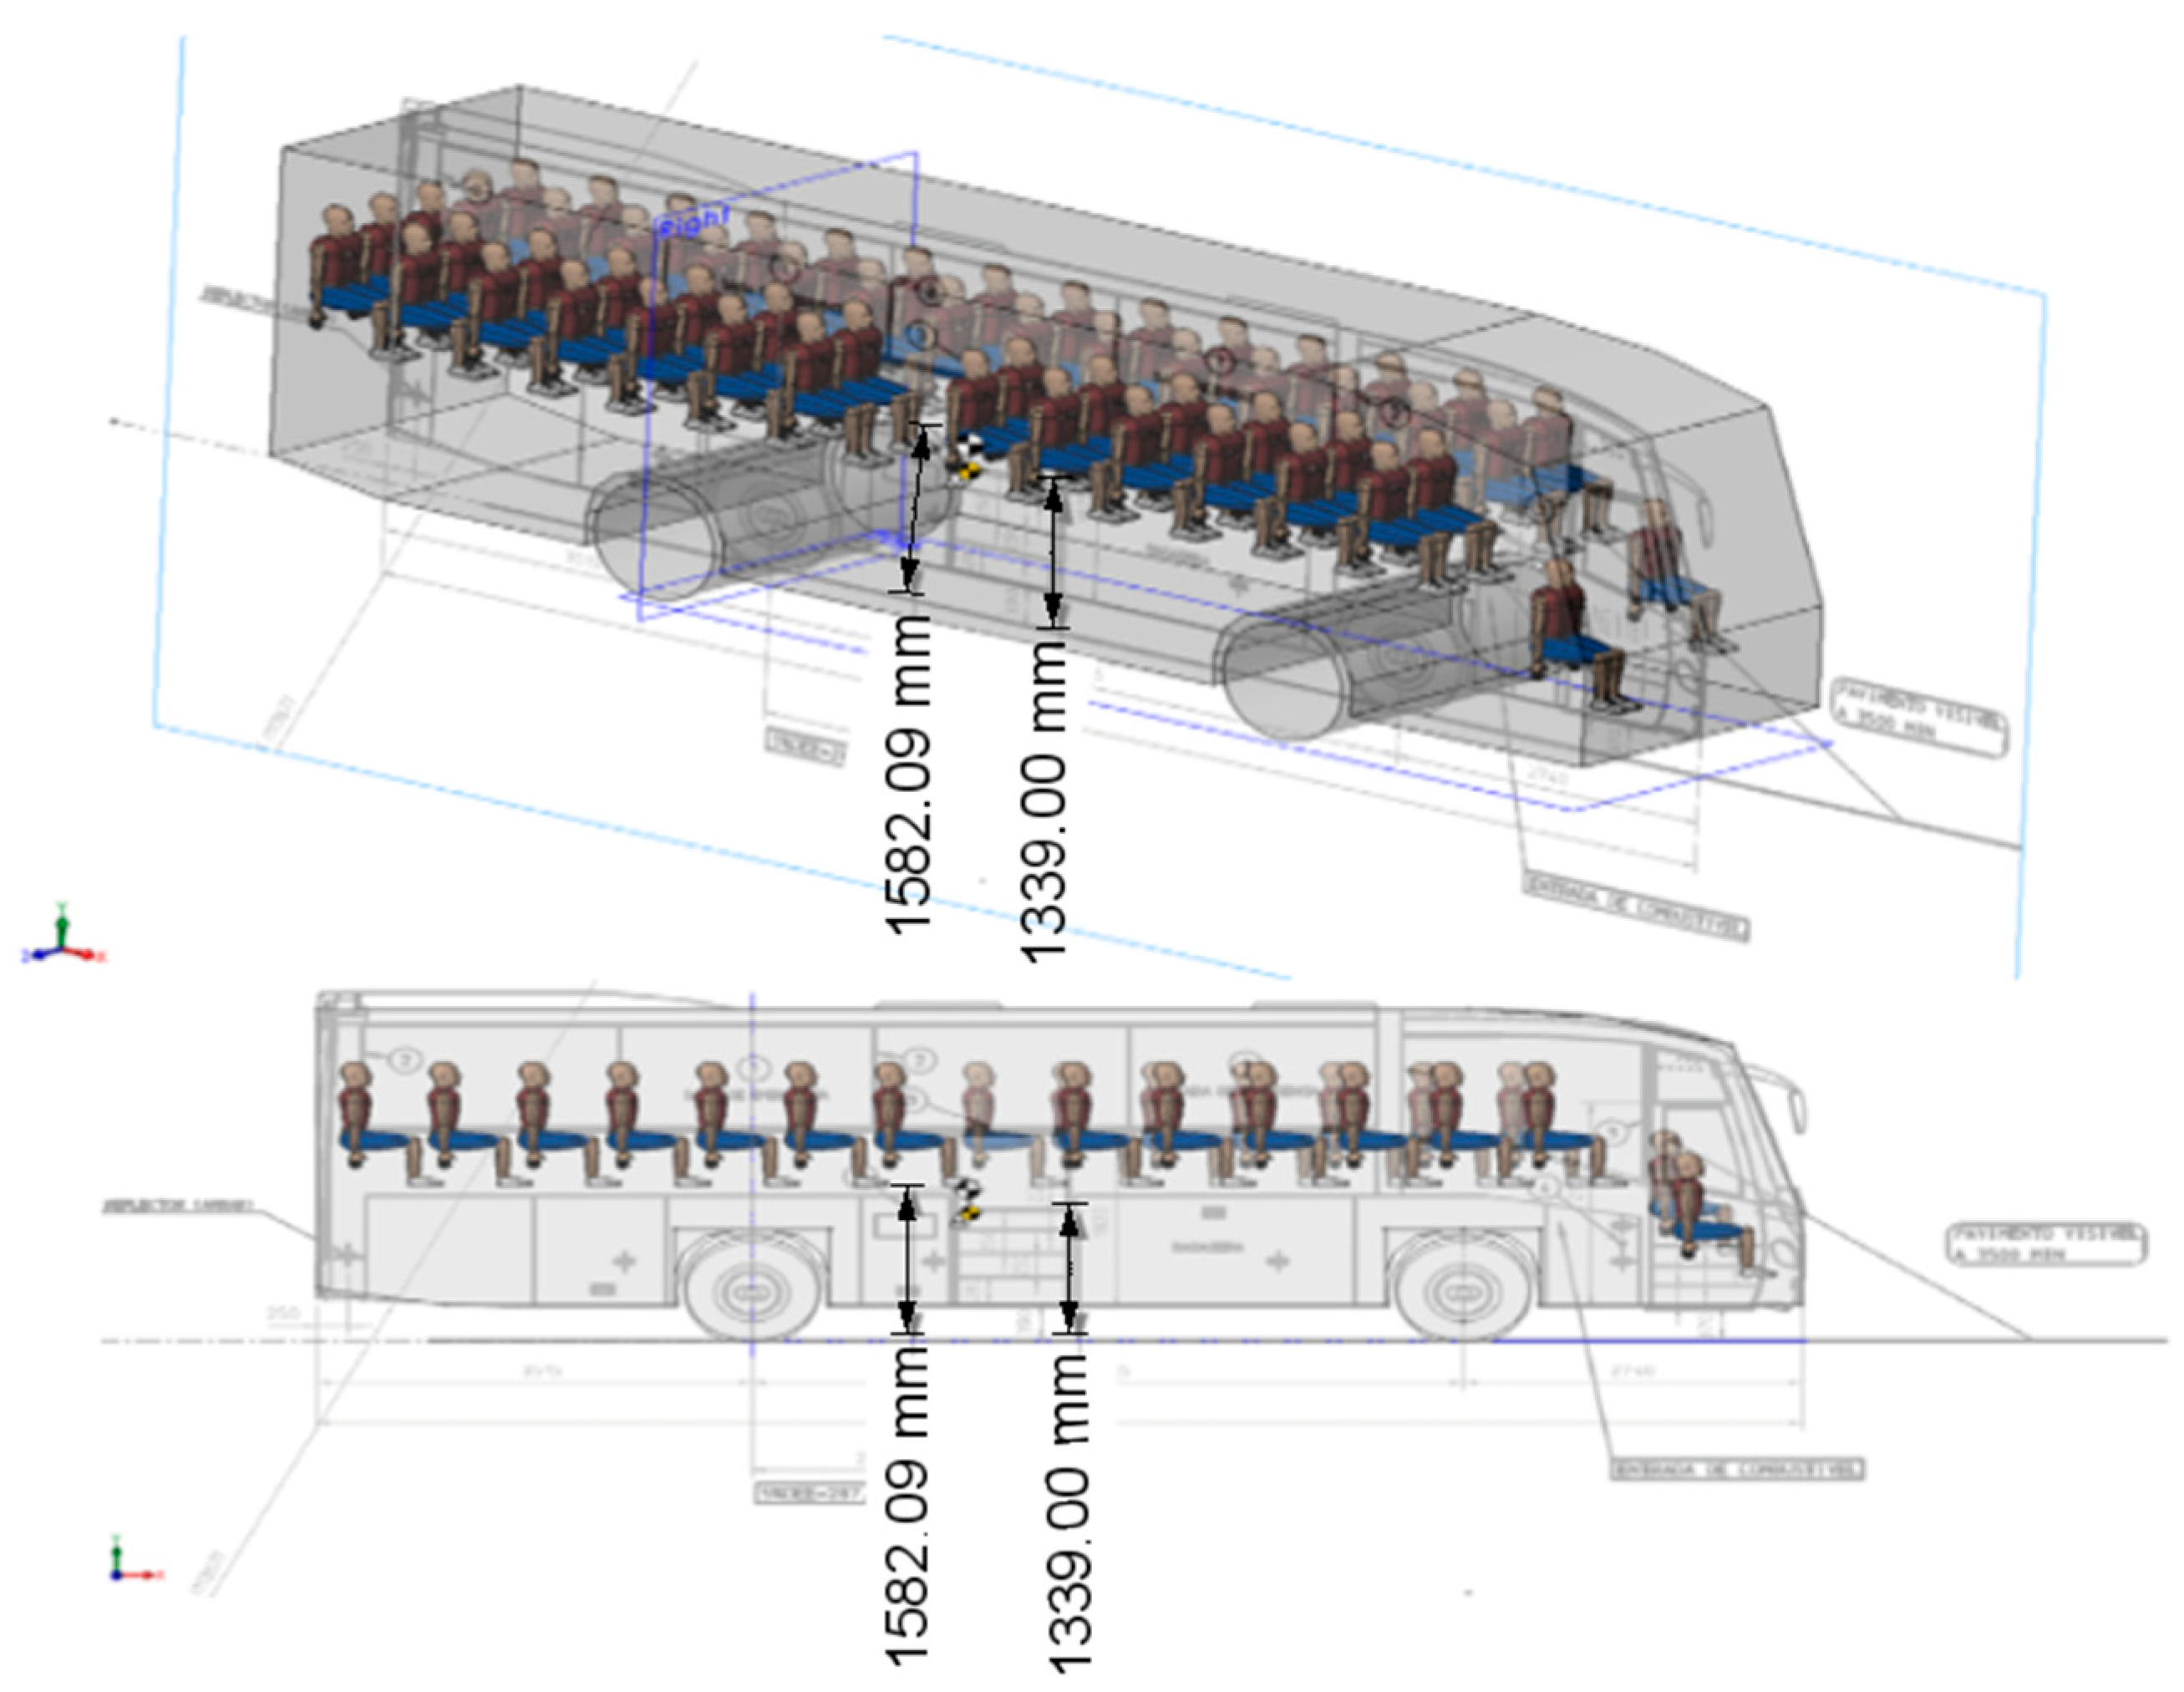
The vehicle’s curb weight was 13,300 kg; its width was 2.55 m, and the unladen vehicle’s CoG height z G was 1.339 m (data provided by the manufacturer).
On the day of the accident, the bus was traveling with 57 people without any luggage. Thus, with the added weight of the passengers, the bus’s total mass reached approximately 18,202 kg, and the CoG height z G increased to approximately 1.582 m (Figure 12).

3.2.2. Reconstruction of the Accident: Analytical and Computational Analysis

Initially, to better understand the rollover risk at the accident’s location, an analytical study was performed to estimate the critical speeds associated with stability limits. The skid velocity, according to Equation (11), was calculated as 12.2 m/s (44 km/h), representing the speed at which the vehicle would likely lose lateral stability. The overturning velocity, according to Equation (13), at which the bus would theoretically begin to roll over, was estimated at 12.7 m/s (46 km/h) for this case.
For example, and for theoretical purposes, if there were no passengers or luggage, the CoG height would be 1.399 m, and the bus’s overturning velocity would increase to 13.54 m/s (49 km/h).
These values showcase the narrow margin between maintaining traction and experiencing a potential rollover, emphasizing the need to control the CoG height in high-capacity vehicles like buses.
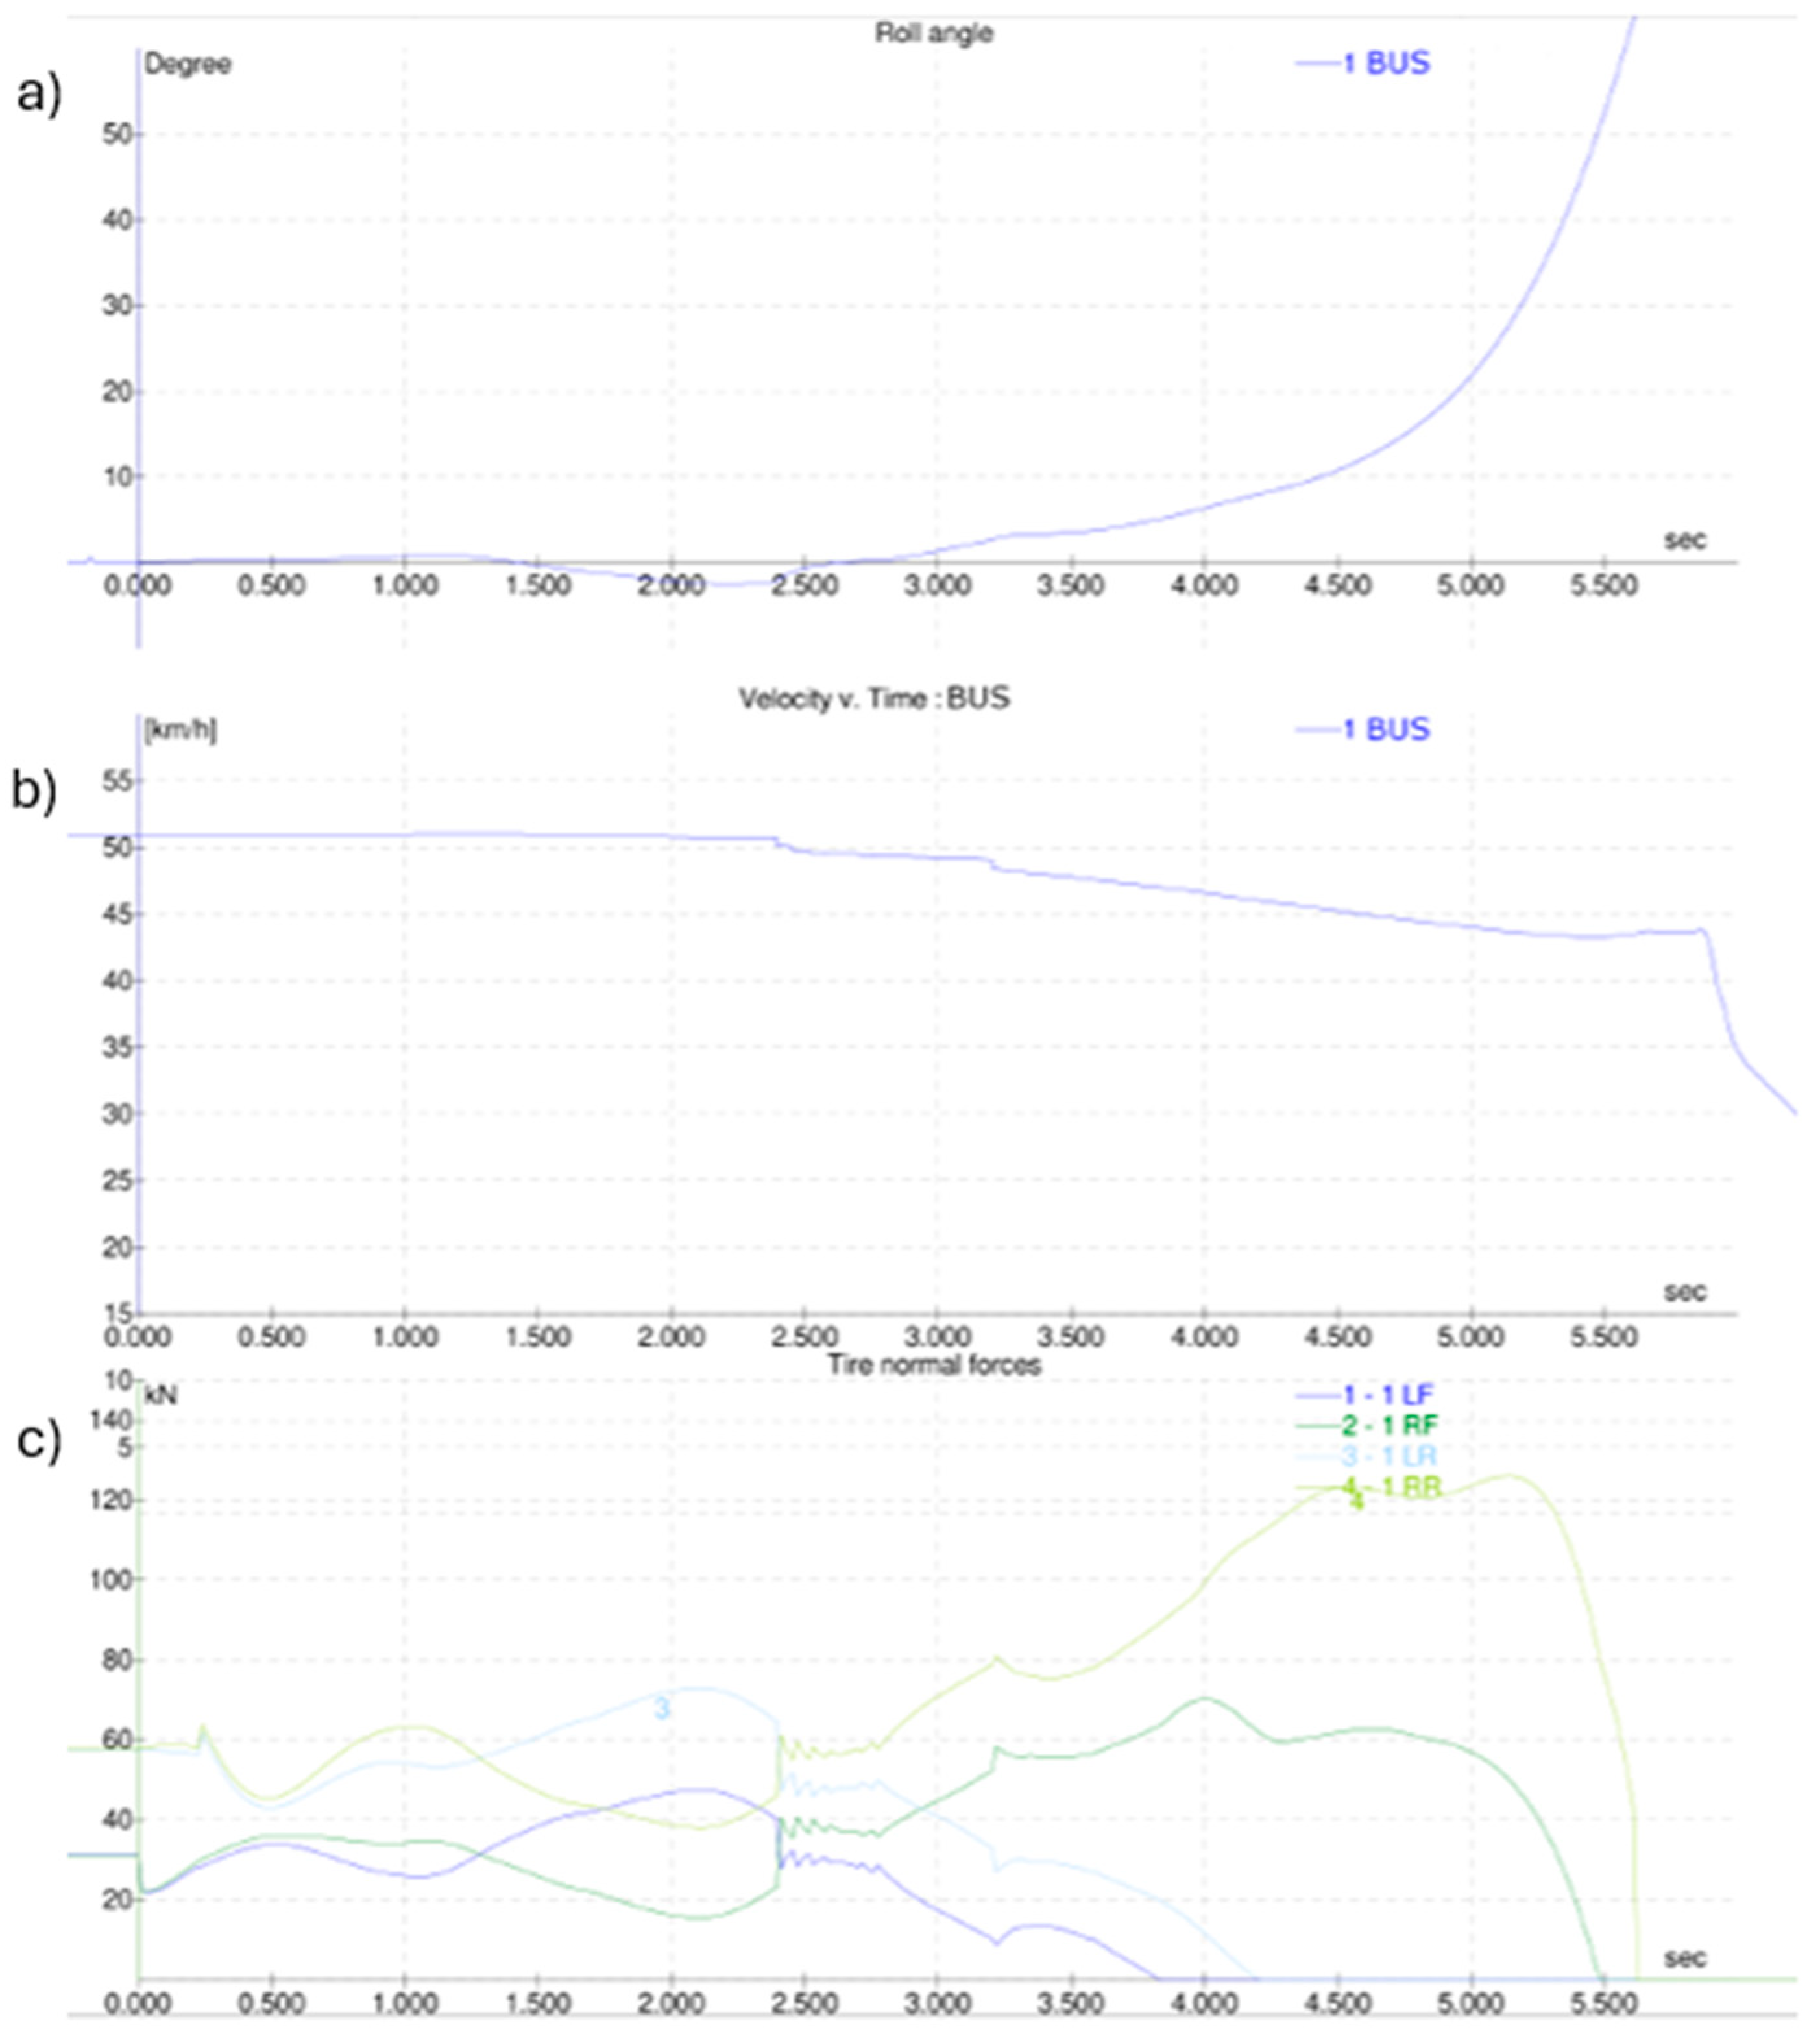
Following the analytical study, a simulation was performed using the PC-Crash® software version 11.1 to validate and refine the solution obtained. This computational approach allowed for a more detailed analysis of the vehicle dynamics under the accident’s conditions. The simulation confirmed that the critical rollover speed was approximately 44 km/h (a reconstruction of the accident is shown in Figure 13 and Figure 14), aligning closely with the analytical results (error of around 5%) and offering further insights into the dynamic factors influencing vehicle stability, such as the roll angle and normal forces of the tire (graphic in Figure 15).
The use of computational modeling in this analysis showed the advantage of digital tools in validating analytical findings and refining the understanding of real-world rollover scenarios, providing an overview of the forces involved and highlighting the heightened rollover risk associated with elevated CoG heights.

3.2.3. Numerical Modeling of the Real Case Accident Scenario

To enhance the influence of geometric details, as described above, regarding the rollover tendency of heavyweight vehicles under lateral forces, this example refers to the previously analyzed real-world scenario. As already mentioned, an accident occurred due to the overturning of a bus while taking a sharp turn to the left. The bus had a total mass of 18,202 kg, the CoG height z G was 1.582 m, the bus track width was 2.55 m, and the turn radius was 20.5 m.
Thus, to obtain the overturning velocity, Equation (29) is applied. However, for the present scenario, the stiffness coefficient from Example 1 and Example 2 will be considered as an estimation ( k f / k r = 303,844/397,007.7 N/m) given that, for this vehicle, these values were not provided or measured.
v o v e r t u r n i n g = R × b W 2 × m B u s × z G 2 b w 2 4 2 k F r o n t + 2 k Re a r + z G g   = 20.5 × 2.55 2 × 18,202 × 1.582 2 2.55 2 4 2 × 303,844 + 2 × 397,007.7 + 1.582 9.81   = 12 m s 43.2   k m / h
Additionally, the corresponding roll angle is given by the previously Equation (28):
θ x = m B u s × v 2 R × z G b w 2 4 2 k F r o n t + 2 k Re a r = 18,500 × 12 2 20.5 × 1.582 2.55 2 4 2 × 303,844 + 2 × 397,007.7 = 0.090   r a d 5.16 º
This results in approximately 5.16° of vehicle roll, which is not an excessive value. However, the position of the center of mass was too high, allowing the centrifugal force lateral moment to exceed the gravity moment for base support for the bus.
It is possible to conclude that the overturning velocity and the roll angle are similar to the values obtained during the forensic investigation (see Figure 15), confirming and validating the proposed method. Applying the developed equation and comparing it to the existing equations used regularly in forensic investigations, the associated error was reduced from 5% to 2%.
To prevent this type of accident, some design precautions are proposed:
  • Lower the position of the center of mass as much as possible; alternatively, design the passenger bus vehicles with a larger track base (attention should be paid to vehicle dimension rules);
  • Use active suspensions, correcting for excessive vehicle roll (this is possible with pneumatic suspensions);
  • Implement automatic gradual braking in case the critical cornering speed is reached;
  • Introduce a movable ballast to correct for CoG deviations.
Taking the first recommendation to lower the vehicle’s center of mass, as an example, lowering the CoG to 1.5 m (instead of 1.582 m, that is, 82 mm lower) will increase the critical speed from 43.2 km/h to 44.5 km/h. It is important to mention that considering no passengers onboard ( m B u s = 13,300   k g ; u n l a d e n   v e h i c l e s   C o G   h e i g h t = 1.399 ) , the overturning velocity would increase to 46.9 km/h.

4. Conclusions

The behavior of a vehicle going along a curved trajectory was studied. Using a simple and practical finite element, performing as a single rigid body, the dynamic behavior of a vehicle was modeled. Afterwards, regarding the problem assessment, an equation was developed and proposed to analyze the overturning velocity and roll angle of a vehicle while cornering.
Complementary to the already existing equation for evaluating the overturning velocity, the proposed equation considers the stiffness properties of the vehicle. To validate the proposed solution, a real-world accident investigation and all its results were presented and compared to the results using the developed equation. Similar results were obtained for both cases, and compared to existing equations, the error was reduced from 5% to 2%.
Finally, an important parameter for estimating the overturning velocity is the CoG height. If this parameter is increased, stability issues are experienced as low overturning velocities are obtained. Thus, a correct estimation of its value is necessary, although its location is often not given by the manufacturers, despite being compulsory; it is estimated using 3D modeling or static measurements, which are not very useful in dynamic contexts where the passengers or loading conditions vary constantly. Therefore, a real-time monitoring system for the position of the CoG would be welcome, as it would inform the driver of the risk of rollover and thus contribute to improving the active safety of heavy vehicles. This solution would be particularly useful in the case of heavy goods vehicles, where the density and distribution of the load can change the position of the CoG for heterogeneous loads of the same volume.

Author Contributions

Conceptualization, F.C. and M.A.P.V.; methodology, F.C. and F.Q.d.M.; software, F.C. and N.V.R.; validation, D.F., P.M.G.P.M. and M.A.P.V.; formal analysis, F.C.; investigation, F.C. and M.A.P.V.; resources, M.A.P.V. and P.M.G.P.M.; writing—original draft preparation, F.C.; writing—review and editing, D.F.; visualization, F.C.; supervision, P.M.G.P.M. and M.A.P.V.; project administration, F.C. All authors have read and agreed to the published version of the manuscript.

Funding

This research received no external funding.

Institutional Review Board Statement

Not applicable.

Informed Consent Statement

Not applicable.

Data Availability Statement

The data presented in this study are available upon request from the corresponding author.

Conflicts of Interest

The authors declare no conflicts of interest.

References

  1. World Health Organization. Global Status Report on Road Safety 2018; World Health Organization: Geneva, Switzerland, 2019. [Google Scholar]
  2. ECA. Special Report, Reaching EU road Safety Objectives; European Court of Auditors: Luxembourg, 2024. [Google Scholar]
  3. C. Database on Road Accidents (CARE) European Commission—Directorate-General for Mobility and Transport (MOVE). Persons Killed in Road Accidents by Age, Sex and Category of Persons involved. Available online: https://ec.europa.eu/eurostat/databrowser/view/tran_sf_roadus__custom_13407010/default/line?lang=en (accessed on 14 November 2024).
  4. European Commission. Facts and Figures Buses/Coaches/Heavy Goods Vehicles; European Road Safety Observatory; European Commission, Directorate General for Transport: Brussels, Belgium, 2019. [Google Scholar]
  5. Khan, I.U.; Vachal, K. Factors affecting injury severity of single-vehicle rollover crashes in the United States. Traffic Inj. Prev. 2020, 21, 66–71. [Google Scholar] [CrossRef]
  6. Wittmer, K.; Sawodny, O.; Henning, K.U. Model-Based Estimation of Vehicle Center of Gravity Height and Load. J. Dyn. Syst. Meas. Control Trans. ASME 2023, 145, 051001. [Google Scholar] [CrossRef]
  7. Park, G.; Choi, S.B. An Integrated Observer for Real-Time Estimation of Vehicle Center of Gravity Height. IEEE Trans. Intell. Transp. Syst. 2021, 22, 5660–5671. [Google Scholar] [CrossRef]
  8. Yu, K.; Watanabe, Y. Effects of Center of Gravity Position on Rollover Based Upon Detection of Three-Dimensional Center of Gravity. Toros Üniversitesi İİSBF Sos. Bilim. Derg. 2021, 70–84. [Google Scholar] [CrossRef]
  9. Echaveguren, T.; Cruz, P.; Echaveguren, T.; González, P. Estimation of Heavy Vehicle Rollover Potential Using Reliability Principles. 2017. Available online: www.ricuc.cl (accessed on 13 March 2025).
  10. Trigell, A.S.; Rothhämel, M.; Pauwelussen, J.; Kural, K. Advanced vehicle dynamics of heavy trucks with the perspective of road safety. Veh. Syst. Dyn. 2017, 55, 1572–1617. [Google Scholar] [CrossRef]
  11. Kühn, W. Fundamentals of Road Design; Wit Press: Southampton, UK, 2013; Volume 20. [Google Scholar]
  12. Gillespie, T. Fundamentals of Vehicle Dynamics; SAE International: Warrendale, PA, USA, 2021. [Google Scholar]
  13. Tian, J.; Whitfield, C. Effect of mass and center of gravity on vehicle speed and braking performance. J. Emerg. Investig. 2021, 4, 1–7. [Google Scholar] [CrossRef] [PubMed]
  14. Huang, X.; Wang, J. Center of gravity height real-time estimation for lightweight vehicles using tire instant effective radius. Control Eng. Pract. 2013, 21, 370–380. [Google Scholar] [CrossRef]
  15. Rajamani, R.; Piyabongkam, D.; Tsourapas, V.; Lew, I.Y. Real-time estimation of roll angle and CG height for active rollover prevention applications. In Proceedings of the American Control Conference, St. Louis, MO, USA, 10–12 June 2009; pp. 433–438. [Google Scholar] [CrossRef]
  16. Wang, C.; Wang, Z.; Zhang, L.; Cao, D.; Dorrell, D.G. A Vehicle Rollover Evaluation System Based on Enabling State and Parameter Estimation. IEEE Trans. Industr. Inform. 2021, 17, 4003–4013. [Google Scholar] [CrossRef]
  17. Yoon, J.; Yi, K. A Rollover Mitigation Control Scheme Based on Rollover Index. In Proceedings of the 2006 American Control Conference, Minneapolis, MN, USA, 14–16 June 2006. [Google Scholar]
  18. Solmaz, S.; Akar, M.; Shorten, R.; Kalkkuhl, J. Realtime Multiple-Model Estimation of Center of Gravity Position in Automotive Vehicles. Veh. Syst. Dyn. 2008, 46, 763–788. [Google Scholar] [CrossRef]
  19. Patel Jainish, S.G.; Topiwala, J.; Gopalbhai Patel, C. Measuring a Centre of Gravity of an Object using 4 Load Transducer Method. 2017. Available online: www.ijert.org (accessed on 13 March 2025).
  20. Rievaj, V.; Vrábel, J.; Synák, F.; Bartuška, L. The Effects of Vehicle Load on Driving Characteristics. Adv. Sci. Technol. Res. J. 2018, 12, 142–149. [Google Scholar] [CrossRef]
  21. Fabbri, A.; Molari, G. Static measurement of the centre of gravity height on narrow-track agricultural tractors. Biosyst. Eng. 2004, 87, 299–304. [Google Scholar] [CrossRef]
  22. Wu, F.; Sun, C.; Li, H.; Zheng, S. Real-Time Center of Gravity Estimation for Intelligent Connected Vehicle Based on HEKF-EKF. Electronics 2023, 12, 386. [Google Scholar] [CrossRef]
  23. Huang, X.; Wang, J. Real-time estimation of center of gravity position for lightweight vehicles using combined AKF-EKF method. IEEE Trans. Veh. Technol. 2014, 63, 4221–4231. [Google Scholar] [CrossRef]
  24. Germann, S.; Isermann, R. Determination of the centre of gravity height of a vehicle with parameter estimation. IFAC Proc. Vol. 1994, 27, 563–568. [Google Scholar] [CrossRef]
  25. Yue, H.; Zhang, L.; Shan, H.; Liu, H.; Liu, Y. Estimation of the vehicle’s centre of gravity based on a braking model. Veh. Syst. Dyn. 2015, 53, 1520–1533. [Google Scholar] [CrossRef]
  26. Ding, H.; Khajepour, A.; Huang, Y. A novel tripped rollover prevention system for commercial trucks with air suspensions at low speeds. Proc. Inst. Mech. Eng. Part D J. Automob. Eng. 2018, 232, 1516–1527. [Google Scholar] [CrossRef]
  27. Kamal, M.; Shim, T. Development of Active Suspension Control for Combined Handling and Rollover Propensity Enhancement; SAE International: Warrendale, PA, USA, 2007. [Google Scholar] [CrossRef]
  28. Ghazali, M.; Durali, M.; Salarieh, H. Path-following in model predictive rollover prevention using front steering and braking. Veh. Syst. Dyn. 2017, 55, 121–148. [Google Scholar] [CrossRef]
  29. Schofield, B.; Hagglund, T. Optimal control allocation in vehicle dynamics control for rollover mitigation. In Proceedings of the American Control Conference, Seattle, WA, USA, 11–13 June 2008; pp. 3231–3236. [Google Scholar] [CrossRef]
  30. Rothhämel, M.; Ijkema, J.; Drugge, L. Influencing driver chosen cornering speed by means of modified steering feel. Veh. Syst. Dyn. 2013, 52, 522–538. [Google Scholar] [CrossRef]
  31. Woodrooffe, J.; Blower, D.; Green, P.E. Safety Performance and Benefits of Heavy Truck Stability Control: Providing Insight into Compliance Evaluation. SAE Int. J. Commer. Veh. 2012, 5, 429–440. [Google Scholar] [CrossRef]
  32. Blower, D.; Woodrooffe, J. Real-World Safety Effect of Roll Stability Control. In Proceedings of the SAE 2013 Commercial Vehicle Engineering Congress, Rosemont, IL, USA, 1–3 October 2013. [Google Scholar] [CrossRef]
  33. Franck, H.F.D. Mathematical Methods for Accident Reconstruction: A forensic Engineering Perspective; CRC Press: Boca Raton, FL, USA, 2009. [Google Scholar]
  34. Brach, R.M.; Brach, M.; James, M. Accident Analysis Reconstruction Methods; SAE International: Warrendale, PA, USA, 2022. [Google Scholar]
  35. Lopes, R.; Farahani, B.V.; de Melo, F.Q.; Moreira, P.M.G.P. A Dynamic Response Analysis of Vehicle Suspension System. Appl. Sci. 2023, 13, 2127. [Google Scholar] [CrossRef]
  36. Sekulić, D.; Dedović, V.; Rusov, S.; Šalinić, S.; Obradović, A. Analysis of vibration effects on the comfort of intercity bus users by oscillatory model with ten degrees of freedom. Appl. Math. Model. 2013, 37, 8629–8644. [Google Scholar] [CrossRef]
  37. Sekulic, D.; Dedović, V.; Sekulić, D. The Effect of Stiffness and Damping of the Suspension System Elements on the Optimisation of the Vibrational Behaviour of a Bus. 2011. Available online: https://www.researchgate.net/publication/232613306 (accessed on 6 February 2024).
  38. Lopes, R.; Farahani, B.V.; de Melo, F.Q.; Ramos, N.V.; Moreira, P.M.G.P. Dynamic modal analysis of a passenger bus: Theoretical and numerical studies. In Transportation Research Record; SAGE Publications Ltd.: Thousand Oaks, CA, USA, 2021; Volume 2675, pp. 264–279. [Google Scholar] [CrossRef]
Figure 1. Number of deaths per year related to road accidents in Portugal [3].
Applsci 15 11959 g001
Figure 2. Annual number of fatalities in bus/coach crashes and their share in the total number of fatalities in the EU27 (2010–2019) [4].
Applsci 15 11959 g002
Figure 3. Distribution of fatalities in bus/coach crashes in the EU27 (2019) [4].
Applsci 15 11959 g003
Figure 4. Forces acting on a vehicle going around a banked curve (from [9]).
Applsci 15 11959 g004
Figure 5. Model of a vehicle rolling: h R : CoG’s height; a y : lateral acceleration; ϕ : roll angle; and F: vertical tire load (adapted from [15]).
Applsci 15 11959 g005
Figure 6. Road accident reconstruction methodology and its outcomes.
Applsci 15 11959 g006
Figure 7. Forces acting on a vehicle going along a sloped curve (from [20]).
Applsci 15 11959 g007
Figure 8. (a) Bus body dimensions and (b) equivalent chassis dynamic model with suspension (adapted from [35]). Legend: L—overall length; b—body width; L b a s e —wheelbase; and b w —track width.
Applsci 15 11959 g008
Figure 9. Bus geometry with kinematic and dynamic parameters when cornering. Legend: z G —vertical coordinate of the center of mass G; b w —vehicle track width; θ x —roll angle; and m Bus —vehicle mass (assuming a full passenger capacity).
Applsci 15 11959 g009
Figure 10. Front view of the vehicle with the passengers and driver: displacement (exaggerated). Legend: z G —vertical coordinate of the center of mass G; b w —vehicle track width; P —vehicle’s weight; and F c —centripetal force.
Applsci 15 11959 g010
Figure 11. Accident sketch: vehicle’s traveling direction, rest position, curve radius, and road profile.
Applsci 15 11959 g011
Figure 12. Bus drawing; estimation of the CoG height using mass properties and SolidWorks®.
Applsci 15 11959 g012
Figure 13. Reconstruction of the accident using PC-Crash software: 2D representation.
Applsci 15 11959 g013
Figure 14. Reconstruction of the accident using PC-Crash software: 3D representation.
Applsci 15 11959 g014
Figure 15. Graphical correlation of roll angle (a) with velocity (b) and normal forces of the tire (c).
Applsci 15 11959 g015
Disclaimer/Publisher’s Note: The statements, opinions and data contained in all publications are solely those of the individual author(s) and contributor(s) and not of MDPI and/or the editor(s). MDPI and/or the editor(s) disclaim responsibility for any injury to people or property resulting from any ideas, methods, instructions or products referred to in the content.