1. Introduction
In recent years, there has been an increasing call for sustainable water management frameworks that not only emphasize reducing anthropogenic stressors but also explicitly integrate climate change adaptation into groundwater governance [
1,
2]. Climatic trends such as shifts in precipitation distribution, reduced snowfall, and rising temperature regimes do not only affect the magnitude but also the timing and effectiveness of recharge in aquifers dependent on direct infiltration.
Combined effects of anthropogenic demand and changing climate variables on future groundwater status in hydrogeologically sensitive systems is a widespread problem with significant environmental, economic, and water management implications [
3,
4,
5,
6,
7,
8].
The Chełm region hosts a fissured–porous aquifer developed in carbonate rocks of the Upper Cretaceous. This chalk aquifer forms a continuous, hydraulically connected groundwater system, serving as the main usable water body in the area. Due to the lack of an impermeable cover, recharge occurs almost exclusively through direct infiltration of precipitation, which makes the aquifer highly susceptible both to quantitative and qualitative anthropogenic pressures [
9]. The Chełm chalk mine has been operating for over 60 years, which has created an extensive depression cone encompassing urban, agricultural, and protected natural areas [
10,
11]. In contexts like the Chełm chalk aquifer, where anthropogenic mine dewatering already exerts strong pressure, climate-driven reductions in recharge may amplify declines in groundwater levels, extend the recovery time following drawdowns, and increase vulnerability in both urban and natural ecosystems. Such combined pressures demand that sustainable water management strategies incorporate both mitigation (e.g., controlling pumping, protecting recharge zones) and adaptation measures (e.g., monitoring climatic variables, modeling future recharge under climate scenarios) [
12].
The aim of this study was to compare and assess the impact of long-term drainage of the chalk deposit and ongoing climate change on changes in the water table in the vicinity of the mine.
To reliably assess human-induced transformations of the circulation system, the first step was to analyze the potential influence of precipitation over the last 30 years by testing temporal trends and evaluating whether climate-driven changes may have affected groundwater levels. This approach, linking rainfall variability with groundwater recharge and storage, has been widely applied in hydrogeological studies worldwide [
13,
14,
15,
16]. A key component of the present research was the analysis of temporal trends in groundwater levels at 50 monitoring points between 2009 and 2025. A robust and well-documented set of statistical tools was applied, including the Mann–Kendall test, Kendall’s tau correlation, Sen’s slope estimator, and linear regression, methods frequently employed in hydrological and hydrogeological time series analysis [
17,
18,
19].
Beyond temporal assessment, spatial analysis of the distribution of individual trend indicators was undertaken to document regional patterns of groundwater table decline. The consistency of results across methods, the spatial coherence of groundwater trend indicators, was also evaluated, following approaches previously applied in chalk and other carbonate aquifers [
20,
21]. Importantly, the spatial analysis was extended by the use of Local Moran’s I and the Getis–Ord Gi* statistics to identify clusters and hot-spots of groundwater decline. These techniques have proven valuable in identifying localized mining-related impacts on aquifers [
22,
23].
2. Study Area
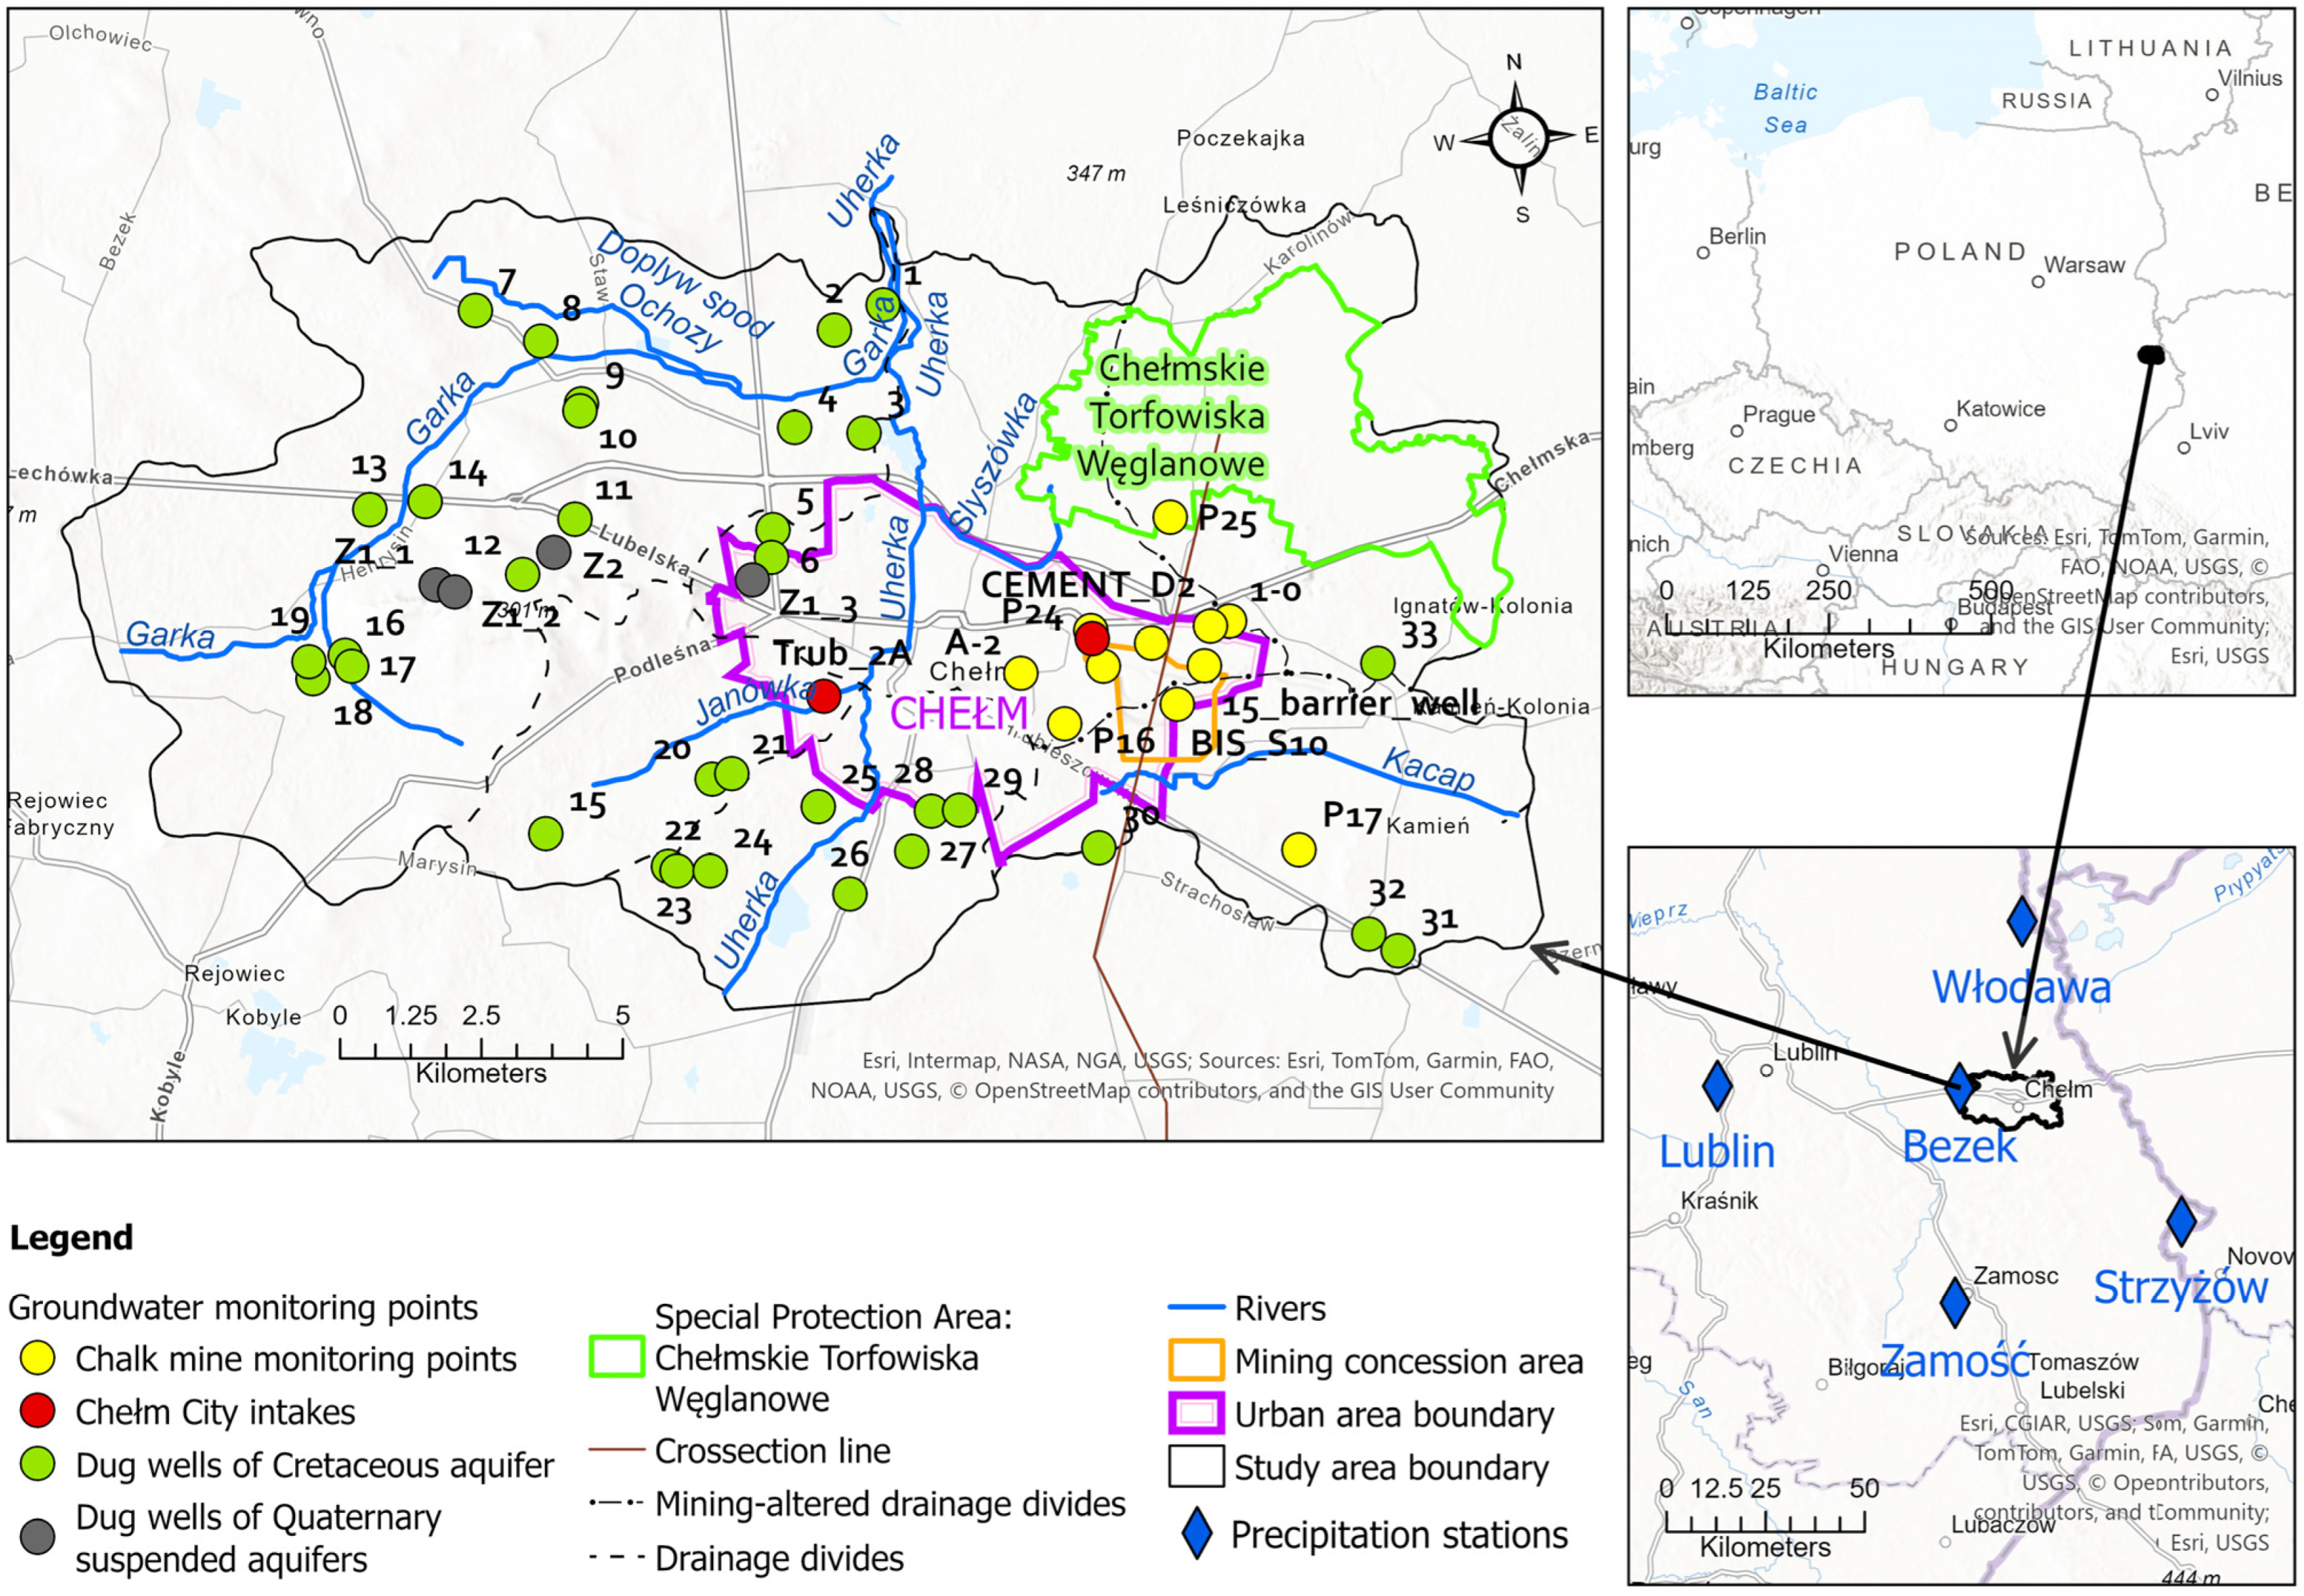
The study area is located in the South East Poland in the Chełm district, around 70 km from Lublin, the capital of the Lubelskie province. A key factor influencing groundwater dynamics is the operation of the Chełm chalk mine, situated east of the city (
Figure 1).
Mine dewatering has generated an extensive depression cone affecting an area of 30–50 km
2, encompassing urban, agricultural, and protected wetland ecosystems [
10,
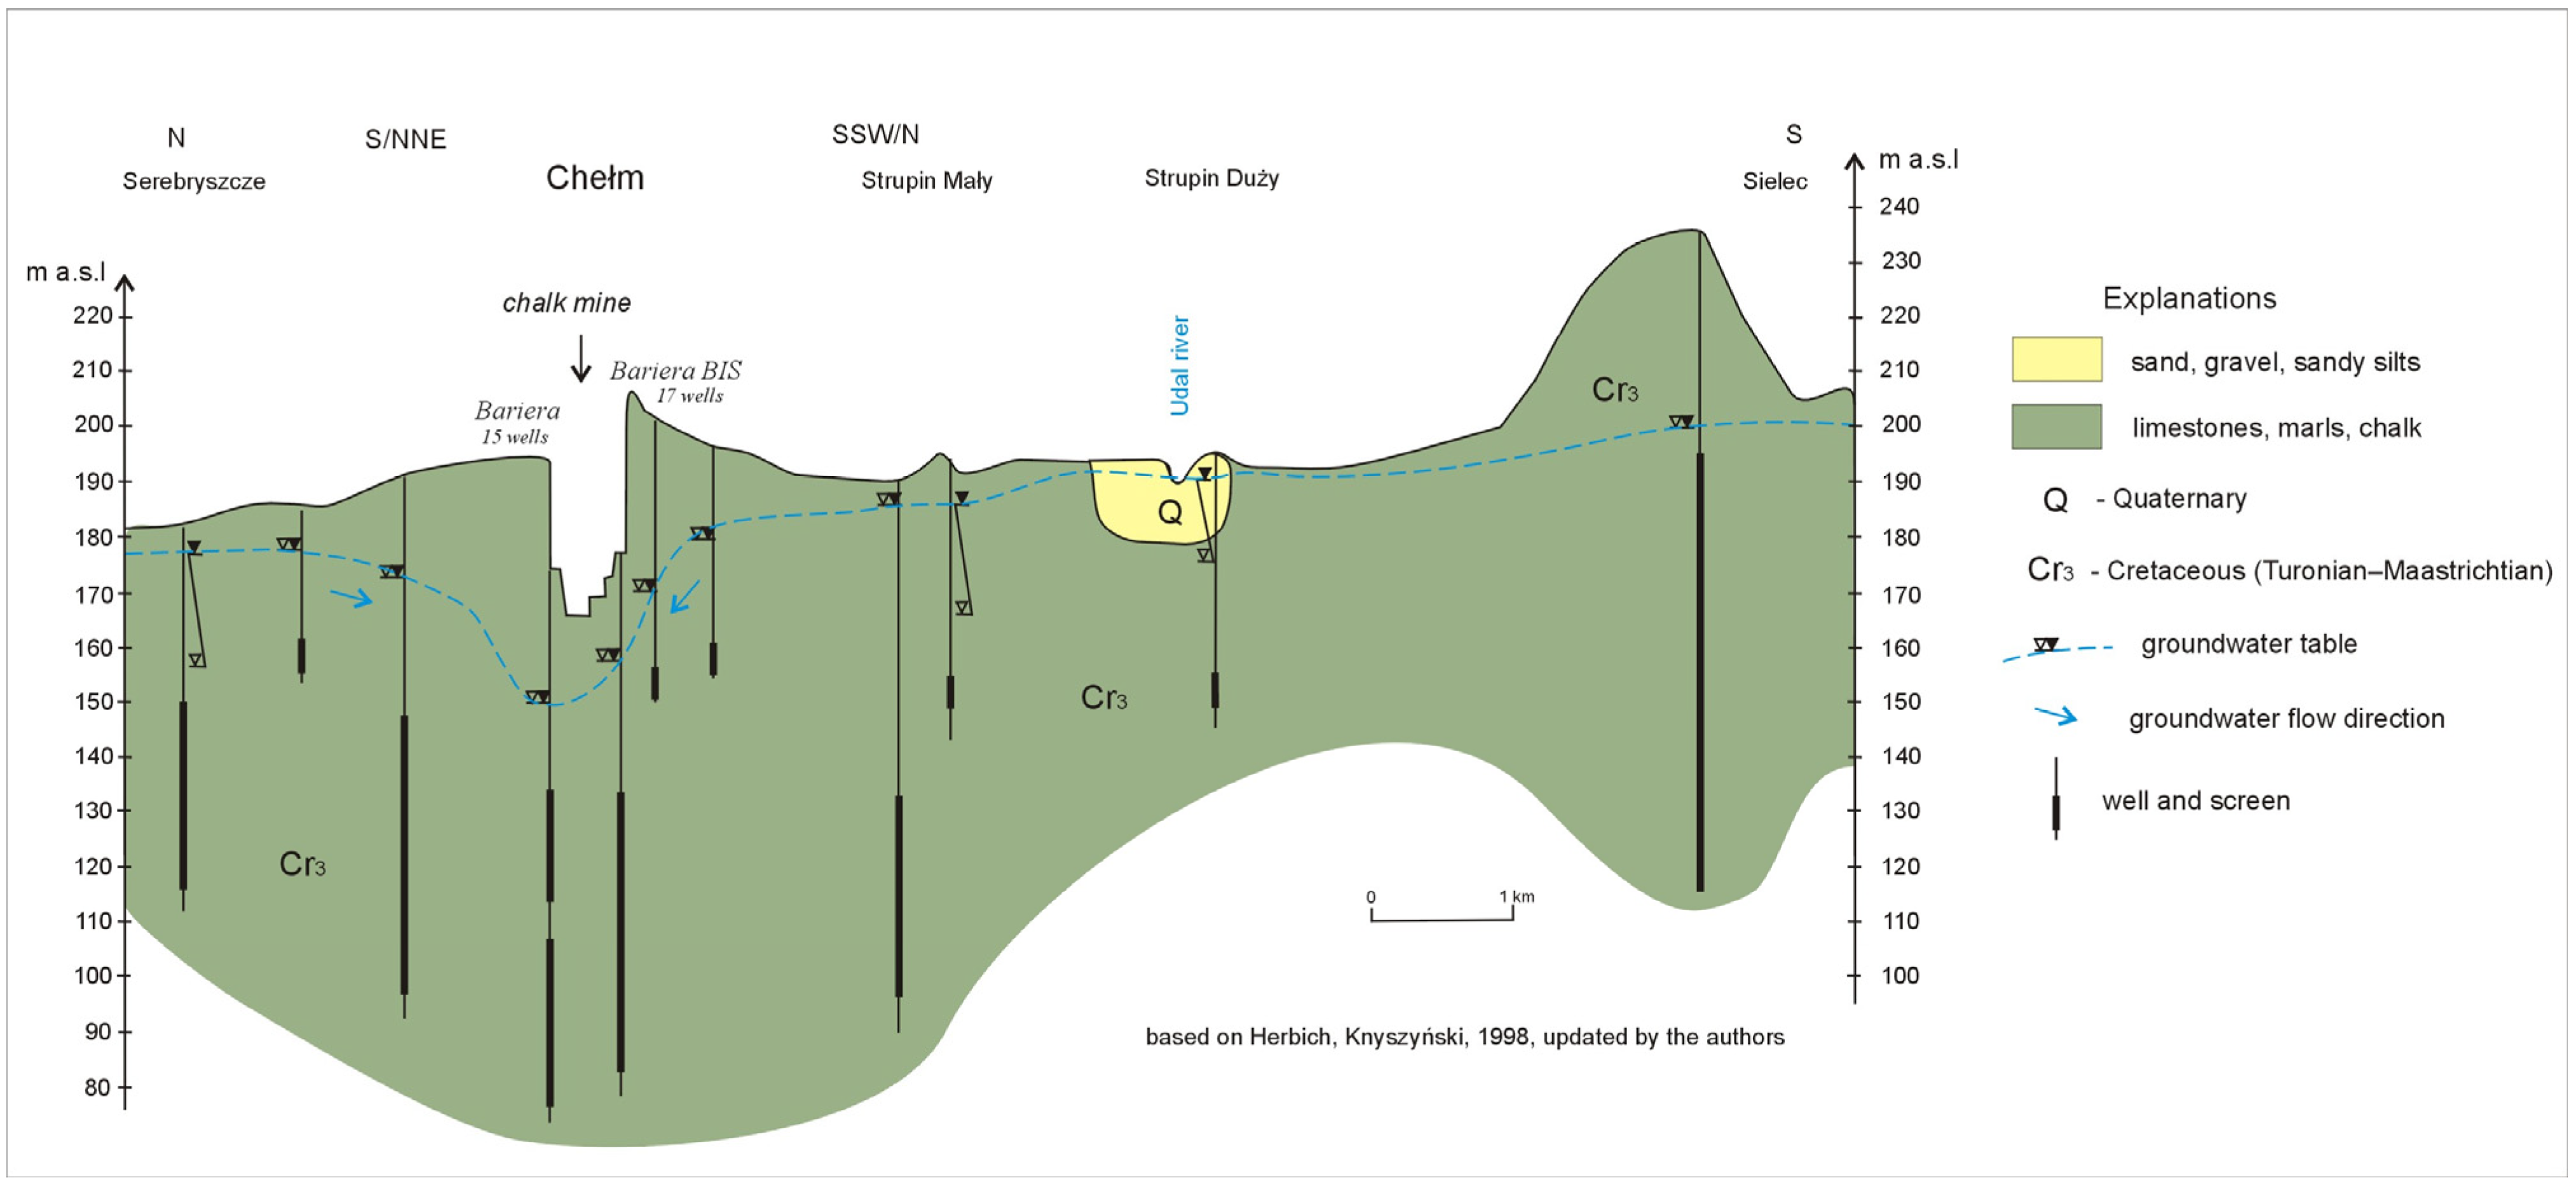
11]. The Upper Cretaceous aquifer represents the primary groundwater reservoir in the Lublin Basin. It consists mainly of marly–limestone sequences (Turonian–Maastrichtian) up to 1000 m thick in the west, thinning eastward to 300 m; in the Chełm area the thickness reaches 600 m and is mainly built by the Upper Cretaceous chalk (
Figure 2). These formations display heterogeneous permeability, with fractured horizons, local perched water levels, and zones of sandy or siliceous facies. The aquifer has been designated as Major Groundwater Reservoir no. 407, emphasizing its high resource potential. Recharge occurs across the entire outcrop area, while discharge zones are associated with river valleys [
24,
25].
Dewatering is conducted via a surface ditch with a sump and two well fields: ‘Bariera’ (total of 15 wells, in
Figure 1 selected as 15_barrier well) and ‘Bariera BIS’ (total 17 wells, operating since 2017, in
Figure 1 selected as BIS_S10 well). Together these systems have created an artificial flow field with a depression cone several tens of meters deep. The Bariera wells also serve municipal supply, complementing the Trubaków wells (in
Figure 1 selected as Trub_2A) in the SW part of the city [
26,
27]. The western urban zone corresponds to the built-up area of Chełm city located west of the mine, while the northwestern fringe represents the transitional zone toward the Uherka River valley, marking the boundary between the mining depression cone and regional recharge areas (
Figure 1).
Figure 2.
Cross-section of the Upper Cretaceous fissured–porous aquifer in the Chełm region ([
27], updated by the authors).
Figure 2.
Cross-section of the Upper Cretaceous fissured–porous aquifer in the Chełm region ([
27], updated by the authors).
To evaluate groundwater table fluctuations at both local and regional scales, the study encompassed five 6th-order river catchments, which include established monitoring points. The total study area covers 264.6 km
2. The selection of these catchments provides a representative basis for assessing the spatial variability of groundwater dynamics across both recharge and discharge zones [
28,
29,
30,
31,
32,
33].
3. Materials and Methods
The assessment combined meteorological data (precipitation) and hydrogeological monitoring data (groundwater levels). Precipitation records from five meteorological stations covering the period 1994–2024 were analyzed for long-term variability. Groundwater level data were obtained from 50 representative observation points (wells and piezometers) measured annually between 2009 and 2025. This dual dataset enabled parallel evaluation of climate variability and anthropogenic impacts.
Precipitation data at monthly and annual resolution were obtained from five monitoring stations. Annual totals represent combined precipitation from rainfall and snowfall (total precipitation expressed in millimeters of water equivalent). The Bezek station, located directly at the western boundary of the study area, provided a continuous series for the period 1994–2015. Additional records were included from stations located within 45–65 km of Chełm (Lublin, Strzyżów, Włodawa, and Zamość), all of which offered continuous observations for the full 30-year period 1994–2024. The following indices were also considered: number of days with snow, number of days with snow cover, absolute and mean maximum air temperature, and absolute and mean minimum air temperature. Annual means or totals were calculated from monthly data. Temporal trends were quantified using linear regression, with slopes expressed per year and significance assessed at
p < 0.05. All meteorological data were sourced from the Institute of Meteorology and Water Management [
34].
Hydrogeological data in the form of groundwater level elevations were derived from the authors’ own field surveys as well as datasets provided by the Chełm Chalk Mine and the Municipal Water Supply and Sewerage Company, which maintain a local monitoring network [
26]. Annual measurements covered the period 2009–2025 and included between 88 and 934 dug wells, drilled wells, and piezometers depending on the campaign. From this set, 50 of the most representative sites were selected, characterized by consistent long-term records and spatial distribution across the study area, including the mining-impacted zone, the urban area, and surrounding rural sectors.
Because detailed historical records of mine dewatering volumes were not available for analysis, a statistical approach was adopted to infer the influence of drainage activities indirectly from observed groundwater level changes. The applied trend detection and spatial–statistical framework thus serves as a quantitative proxy, enabling assessment of the dewatering signal based on its temporal persistence and spatial extent.
Temporal trend analysis employed a set of complementary statistical methods widely recognized in hydrogeological research: the non-parametric Mann–Kendall test, Kendall’s tau correlation, and the Sen’s slope estimator. Together, these tools allow for the detection, quantification, and consistency assessment of monotonic changes in time series of groundwater levels.
The Mann–Kendall test (MK) evaluates whether a variable exhibits a statistically significant monotonic trend over time without requiring normal distribution of data or evenly spaced measurements. This makes it particularly suitable for groundwater datasets that often contain irregular intervals or missing values. The Sen’s slope estimator provides a robust measure of the trend magnitude, expressed here as the rate of change in groundwater level per year (m/year), together with 95% confidence intervals that define the uncertainty range. Kendall’s tau coefficient quantifies the strength and direction of trend consistency, enabling comparison among multiple observation sites and integration with spatial analyses [
17,
18,
19].
These non-parametric methods were selected because they are less sensitive to outliers and serial correlation than linear regression, which is important for hydrogeological time series influenced by seasonal recharge variability. Linear regression was nonetheless applied in parallel to provide parametric estimates and to verify the coherence of results. The combination of both statistical approaches ensured a reliable assessment of temporal changes and allowed for the cross-validation of the trend magnitude and direction.
Beyond temporal analysis, the spatial coherence of individual trend indicators was evaluated using Anselin Local Moran’s I and Getis–Ord Gi* statistics, which identify spatial clusters and hot-spots of similar trend behavior [
22,
23]. This integration of temporal and spatial analyses allows not only to confirm the statistical significance of groundwater decline but also to delineate its extent and intensity across the study area.
In this study, such a multi-method framework provided both quantitative and spatially explicit evidence of groundwater depletion, enabling separation of natural recharge variability from anthropogenic drawdown induced by long-term mine dewatering. The statistical calculations were performed using Microsoft Excel, while spatial analyses (Local Moran’s I and Getis–Ord Gi*) were conducted in ArcGIS Pro.
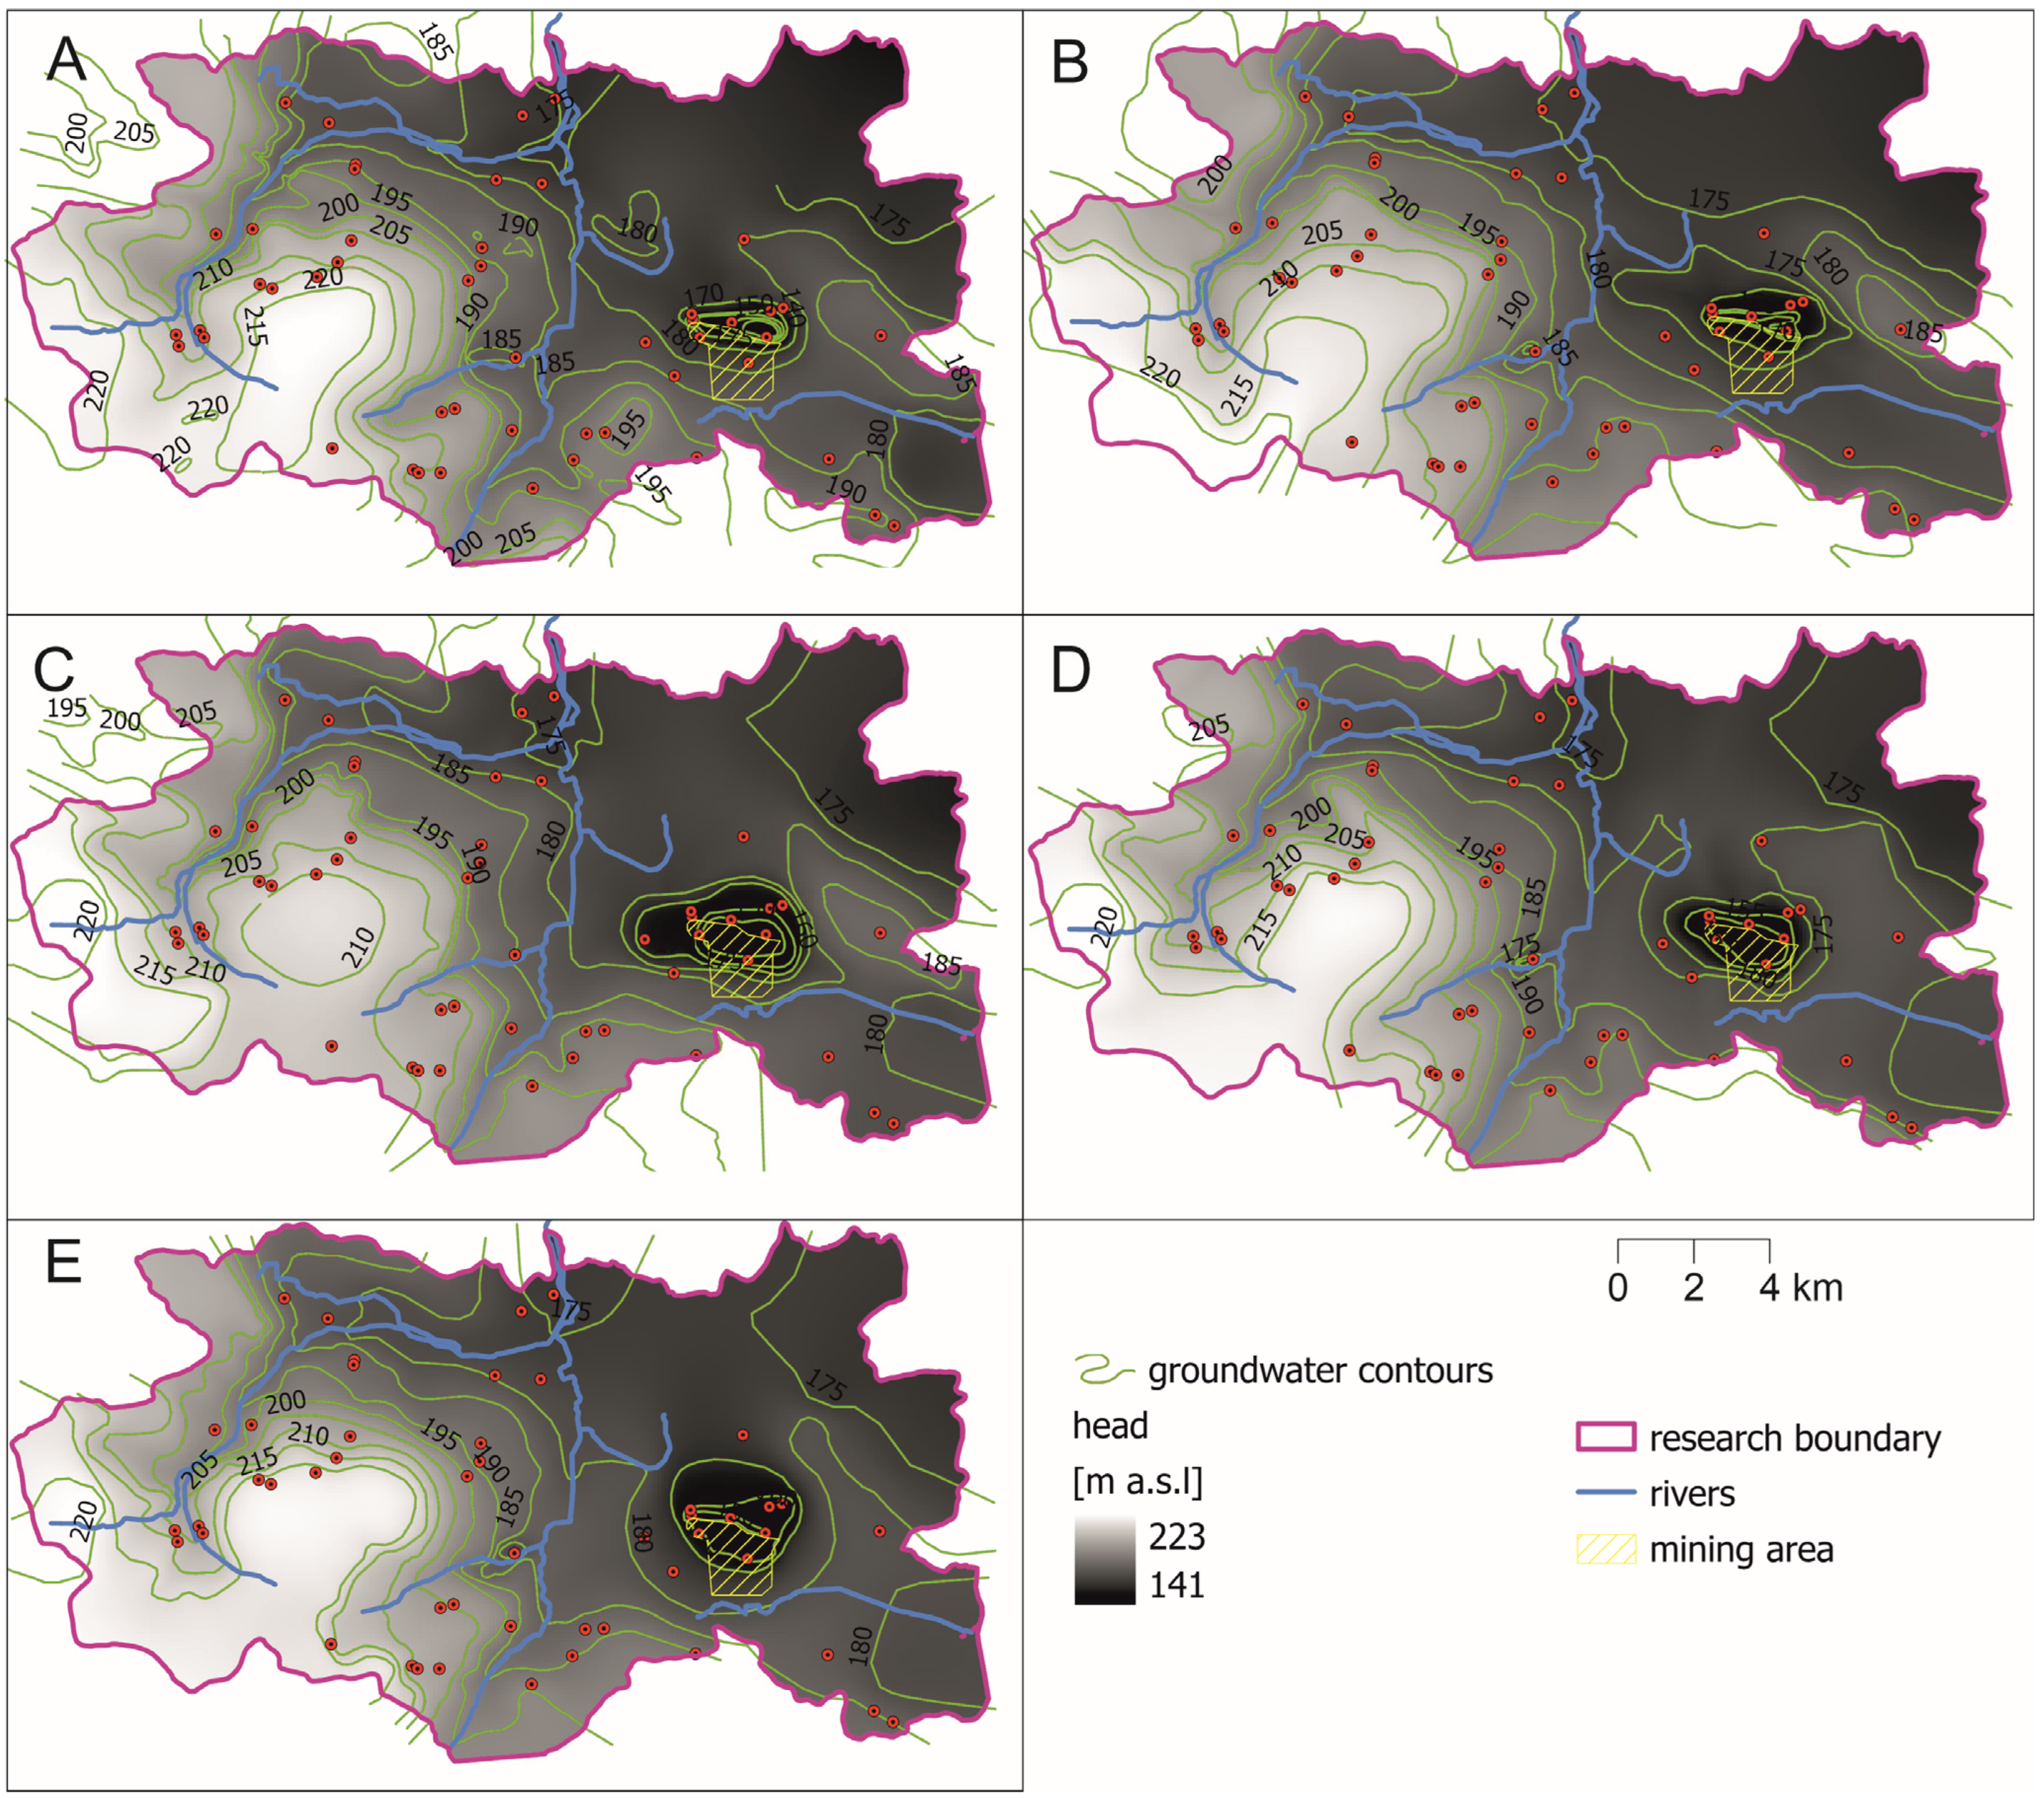
Spatial changes in the position of the groundwater table were determined not only at monitoring points but also between them, based on groundwater contour maps. For comparative purposes with statistical analyses, maps from years representative of varying meteorological conditions—resulting from sequences of dry and wet years—were used.
Maps were developed for the beginning and end of the observation period, namely 2009 and 2025, as well as for a dry year (2015), a year with average precipitation (2018), and a wet year (2023). Raster images with a resolution of 100 × 100 m were analyzed to identify regions where the groundwater table rose or declined. Raster image analysis, drawing of the groundwater contour maps and groundwater contour map interpolation were performed using ArcGIS Pro (version 3.5.2, employing tools such as Topo to Raster, Clip Raster, and Raster Calculator to generate raster surfaces and identify areas of groundwater rise and decline.
4. Results
4.1. Precipitation Trends
Analysis of annual precipitation totals over the 30-year period (1994–2024) revealed no significant long-term regional trends (
Table 1). The values represent total precipitation (rain + snow), corresponding to the combined annual water equivalent. Only the Włodawa station showed a statistically significant increase (+3.76 mm/year; Mann–Kendall
p = 0.044). For the aggregated dataset, the linear regression slope was close to zero (+0.12 mm/year;
p = 0.95), confirming the absence of a regional signal.
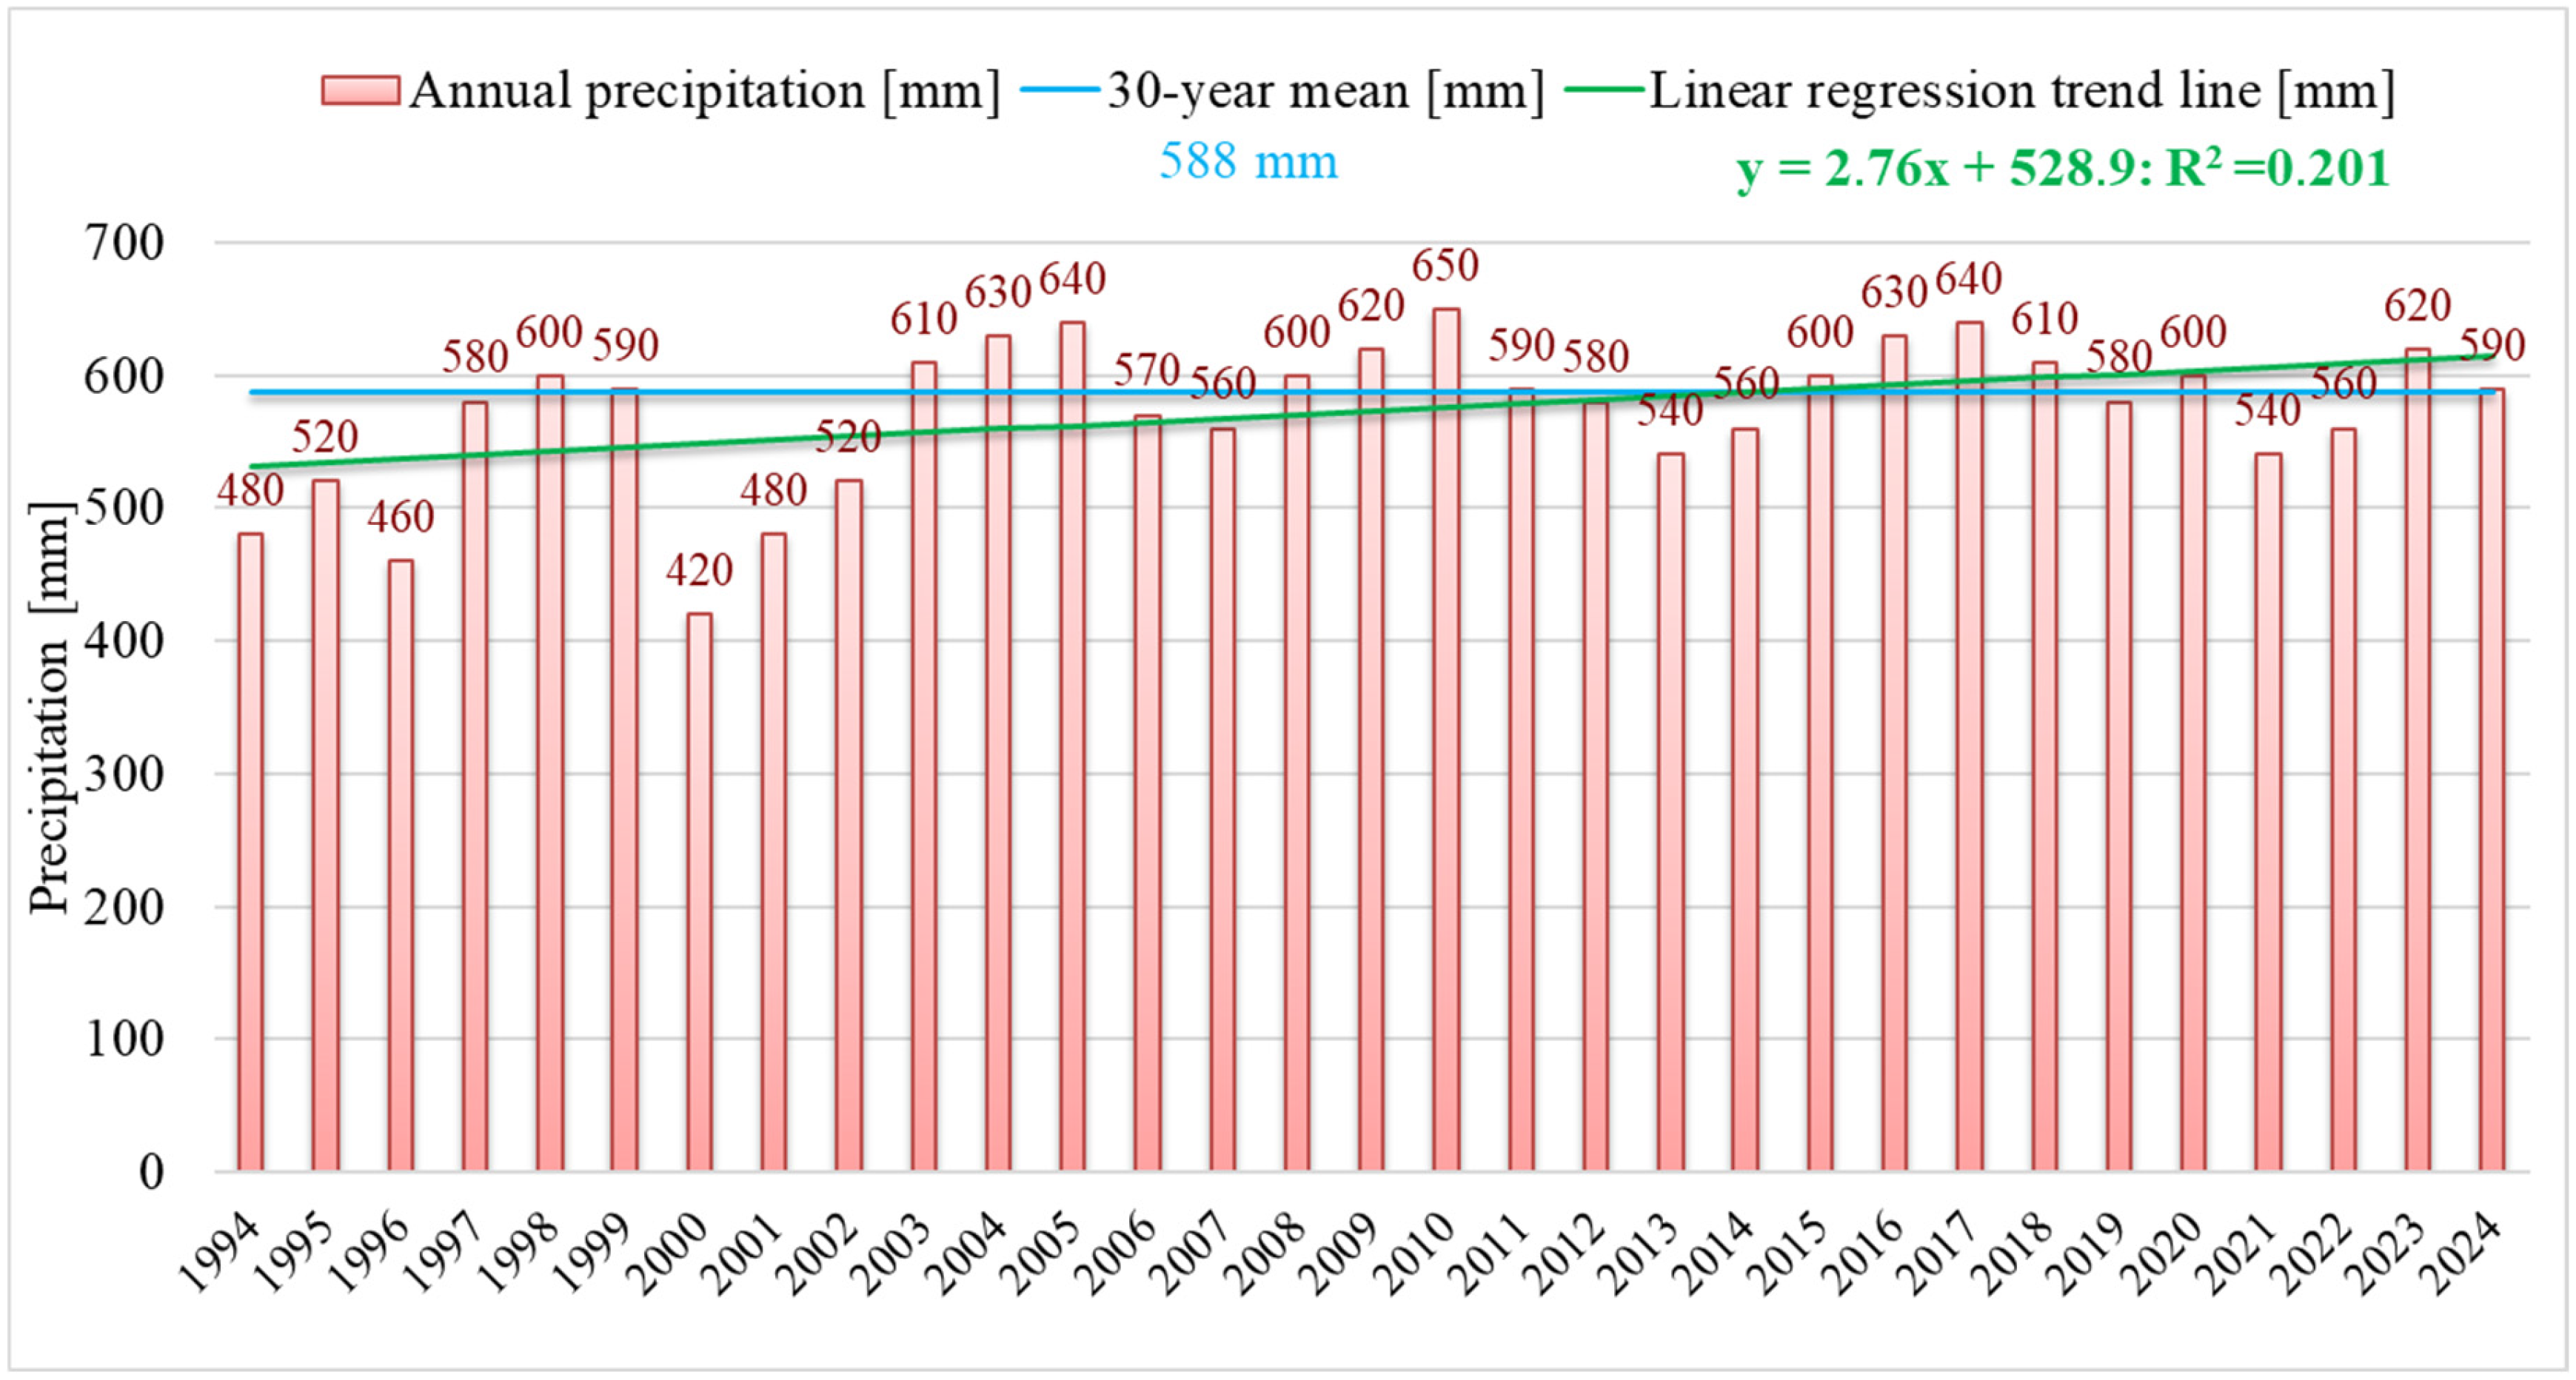
The 30-year mean annual precipitation equals 588 mm, and the linear regression trend line almost completely overlaps the mean line, underscoring the overall long-term stability of precipitation totals, although multi-year cycles of increase and decrease are evident, and a slight long-term upward tendency can be observed in the aggregated series (
Figure 3).
Periods of lower precipitation were recorded in 2013–2015, representing a three-year sequence of below-average totals relative to the 30-year mean, whereas 2023 represented an exceptionally wet year, with annual precipitation of approximately 620 mm, exceeding the 30-year mean (588 mm) by about 5%. These years were highlighted because they overlap with the groundwater-level monitoring period (2009–2025) and represent contrasting hydro-meteorological conditions used for spatial comparison of groundwater heads. These deviations, visible in
Figure 3, illustrate the short-term variability superimposed on the overall long-term stability of annual precipitation in the region.
At the monthly scale, localized upward trends were observed in winter (January, December) at several stations and in the aggregated series. However, these did not translate into changes in annual totals. The heat map illustrates Sen’s slope values (mm/year) for individual months and monitoring stations, together with the aggregated series (mean across all stations) (
Figure 4).
Additional meteorological data show clear trends over the last three decades (
Table 2). The number of snow cover days fell from 56.3 in the 1990s to 56.6 in the 2010s, and only 37.4 days in the 2020s. This indicates an average decline by approximately –1.49 day/year. In contrast, absolute max. air temperature increased from 32.53 °C in the 1990s to 33.92 °C in the 2010s, reaching 33.15 °C in the 2020s. Monthly mean max. air temperature followed a similar trajectory, rising from 12.02 °C to 13.10 °C. Absolute min. air temperature increased by about +0.2 °C/year, and the monthly mean min. air temperature rose by +0.06 °C/year. These temperature trend values were derived from the linear regression slope column (LR slope) in
Table 2, which expresses the rate of change per year in degrees Celsius.
4.2. Groundwater Level Trends
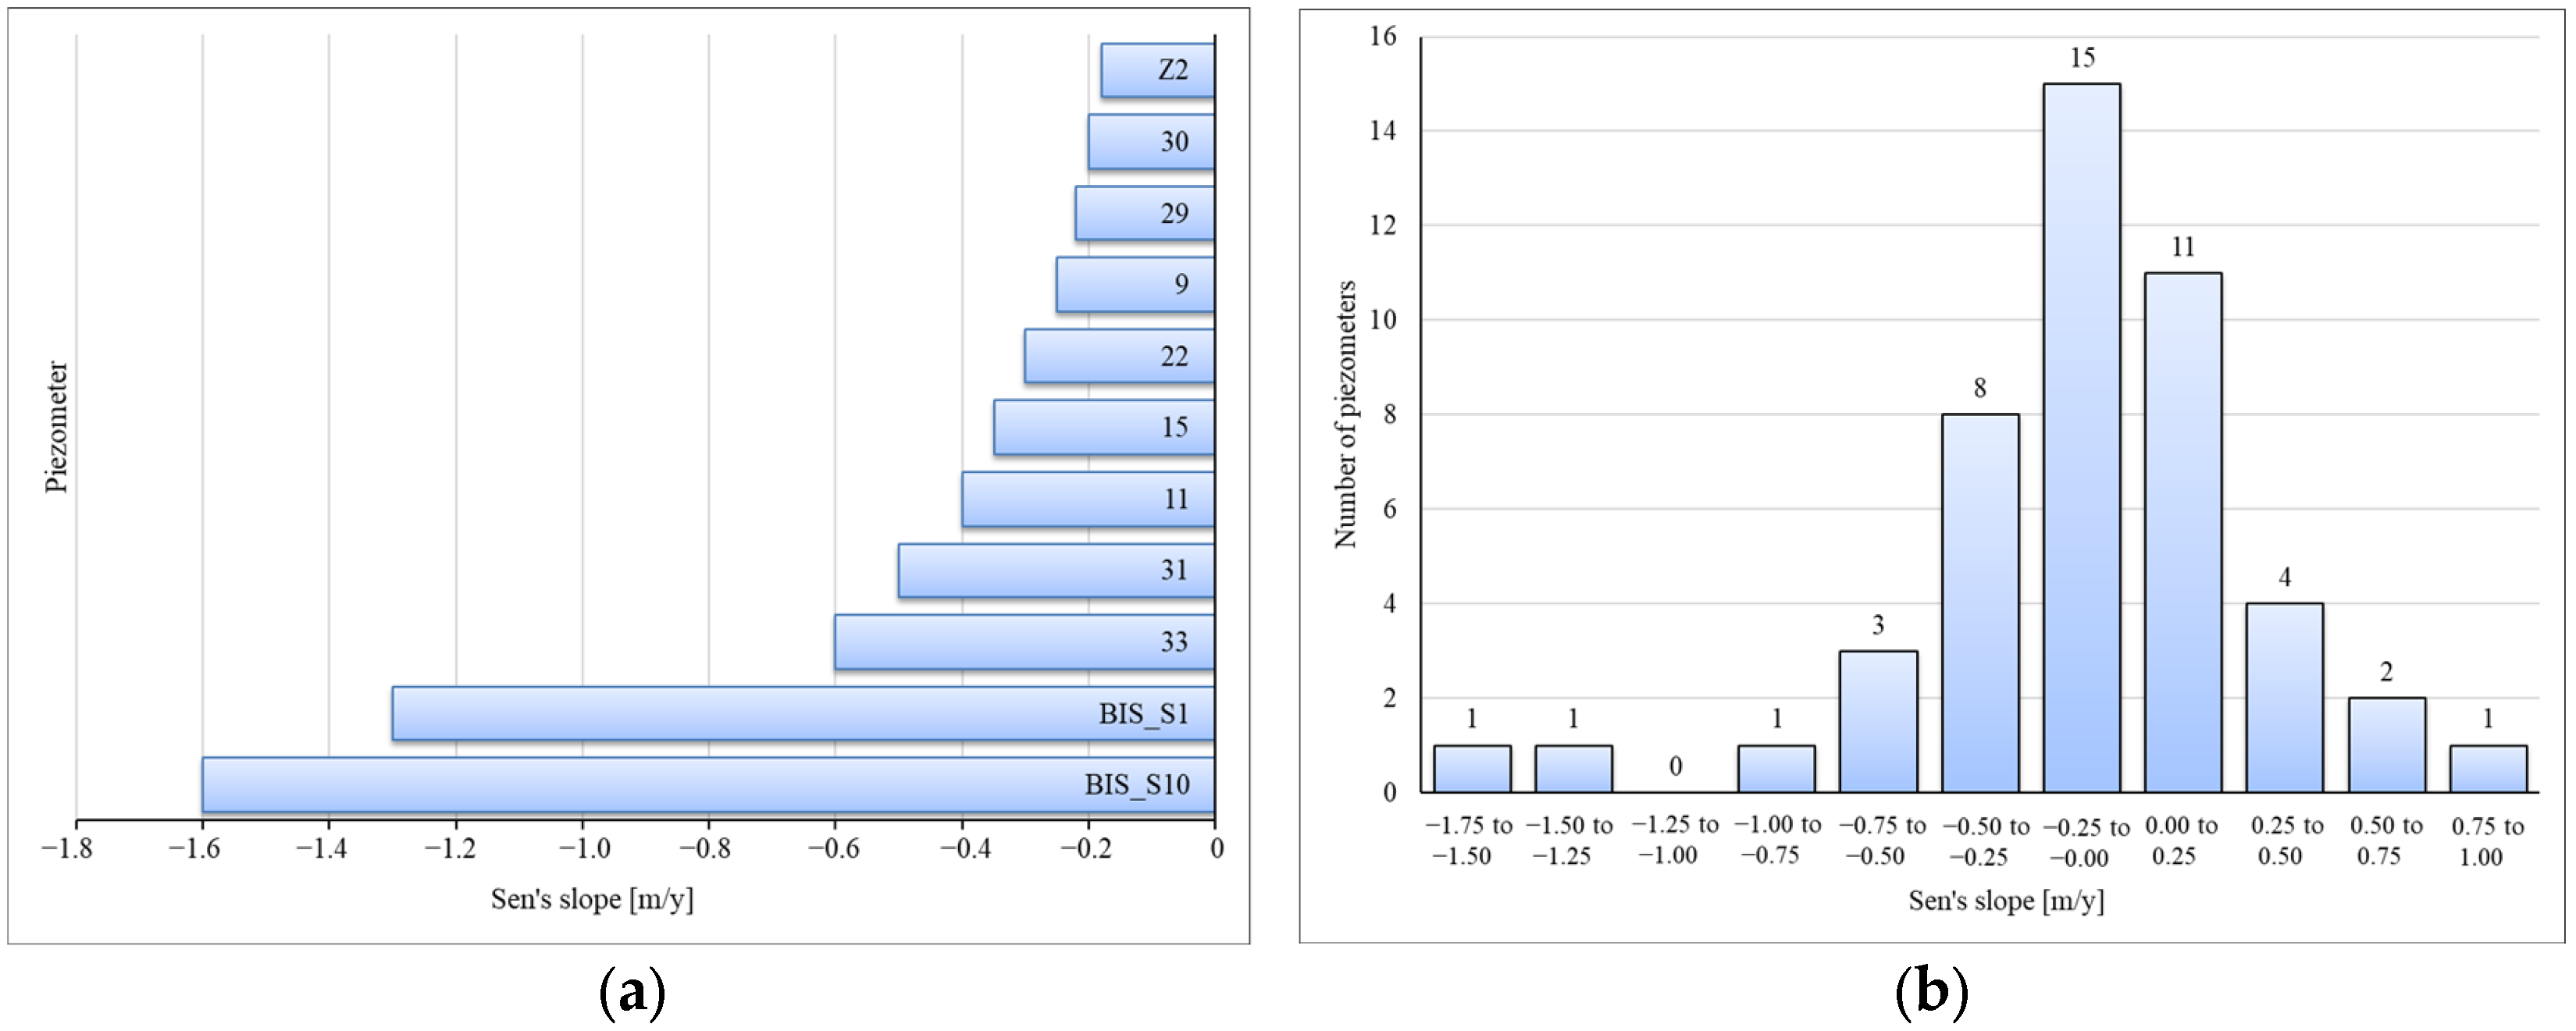
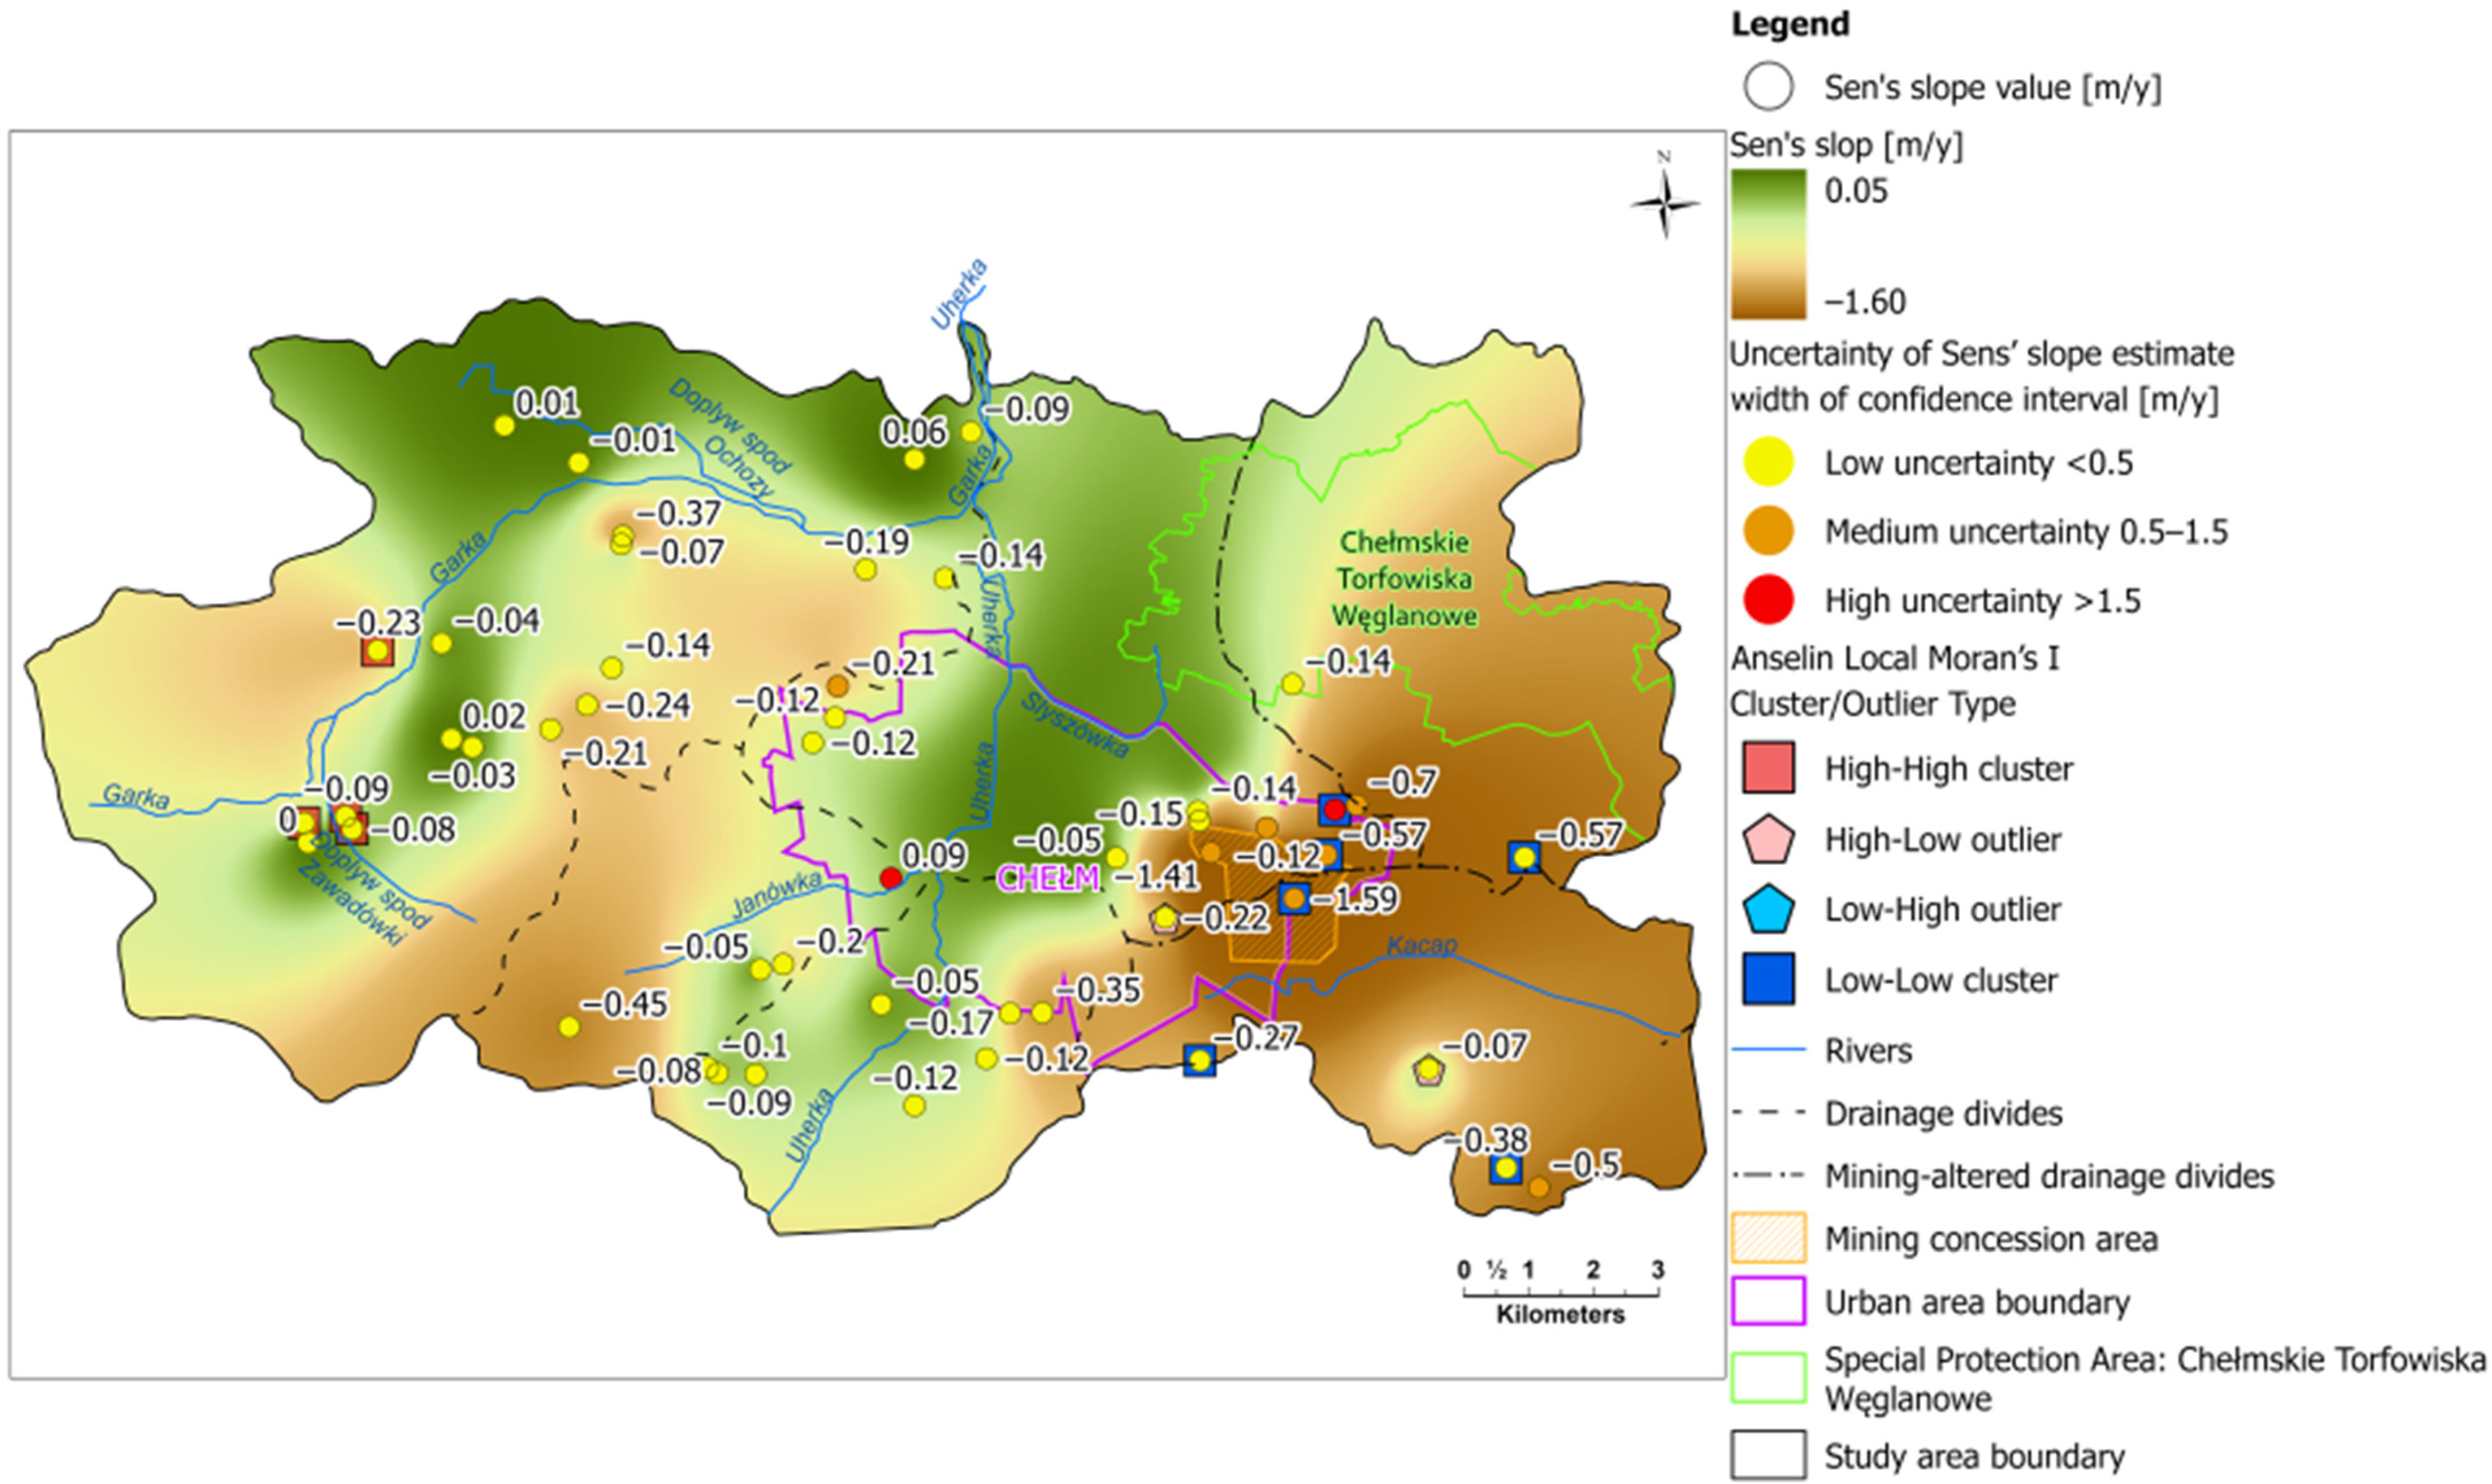
Groundwater levels (2009–2025) showed a clear predominance of declining trends. Statistically significant downward trends occurred in 23 of 50 observation points, while 24 of the remaining 27 also indicated declines; only three points showed slight increases. The median Sen’s slope equaled −0.14 m/year (mean −0.23 m/year), with extremes ranging from −1.59 to +0.09 m/year (
Table 3).
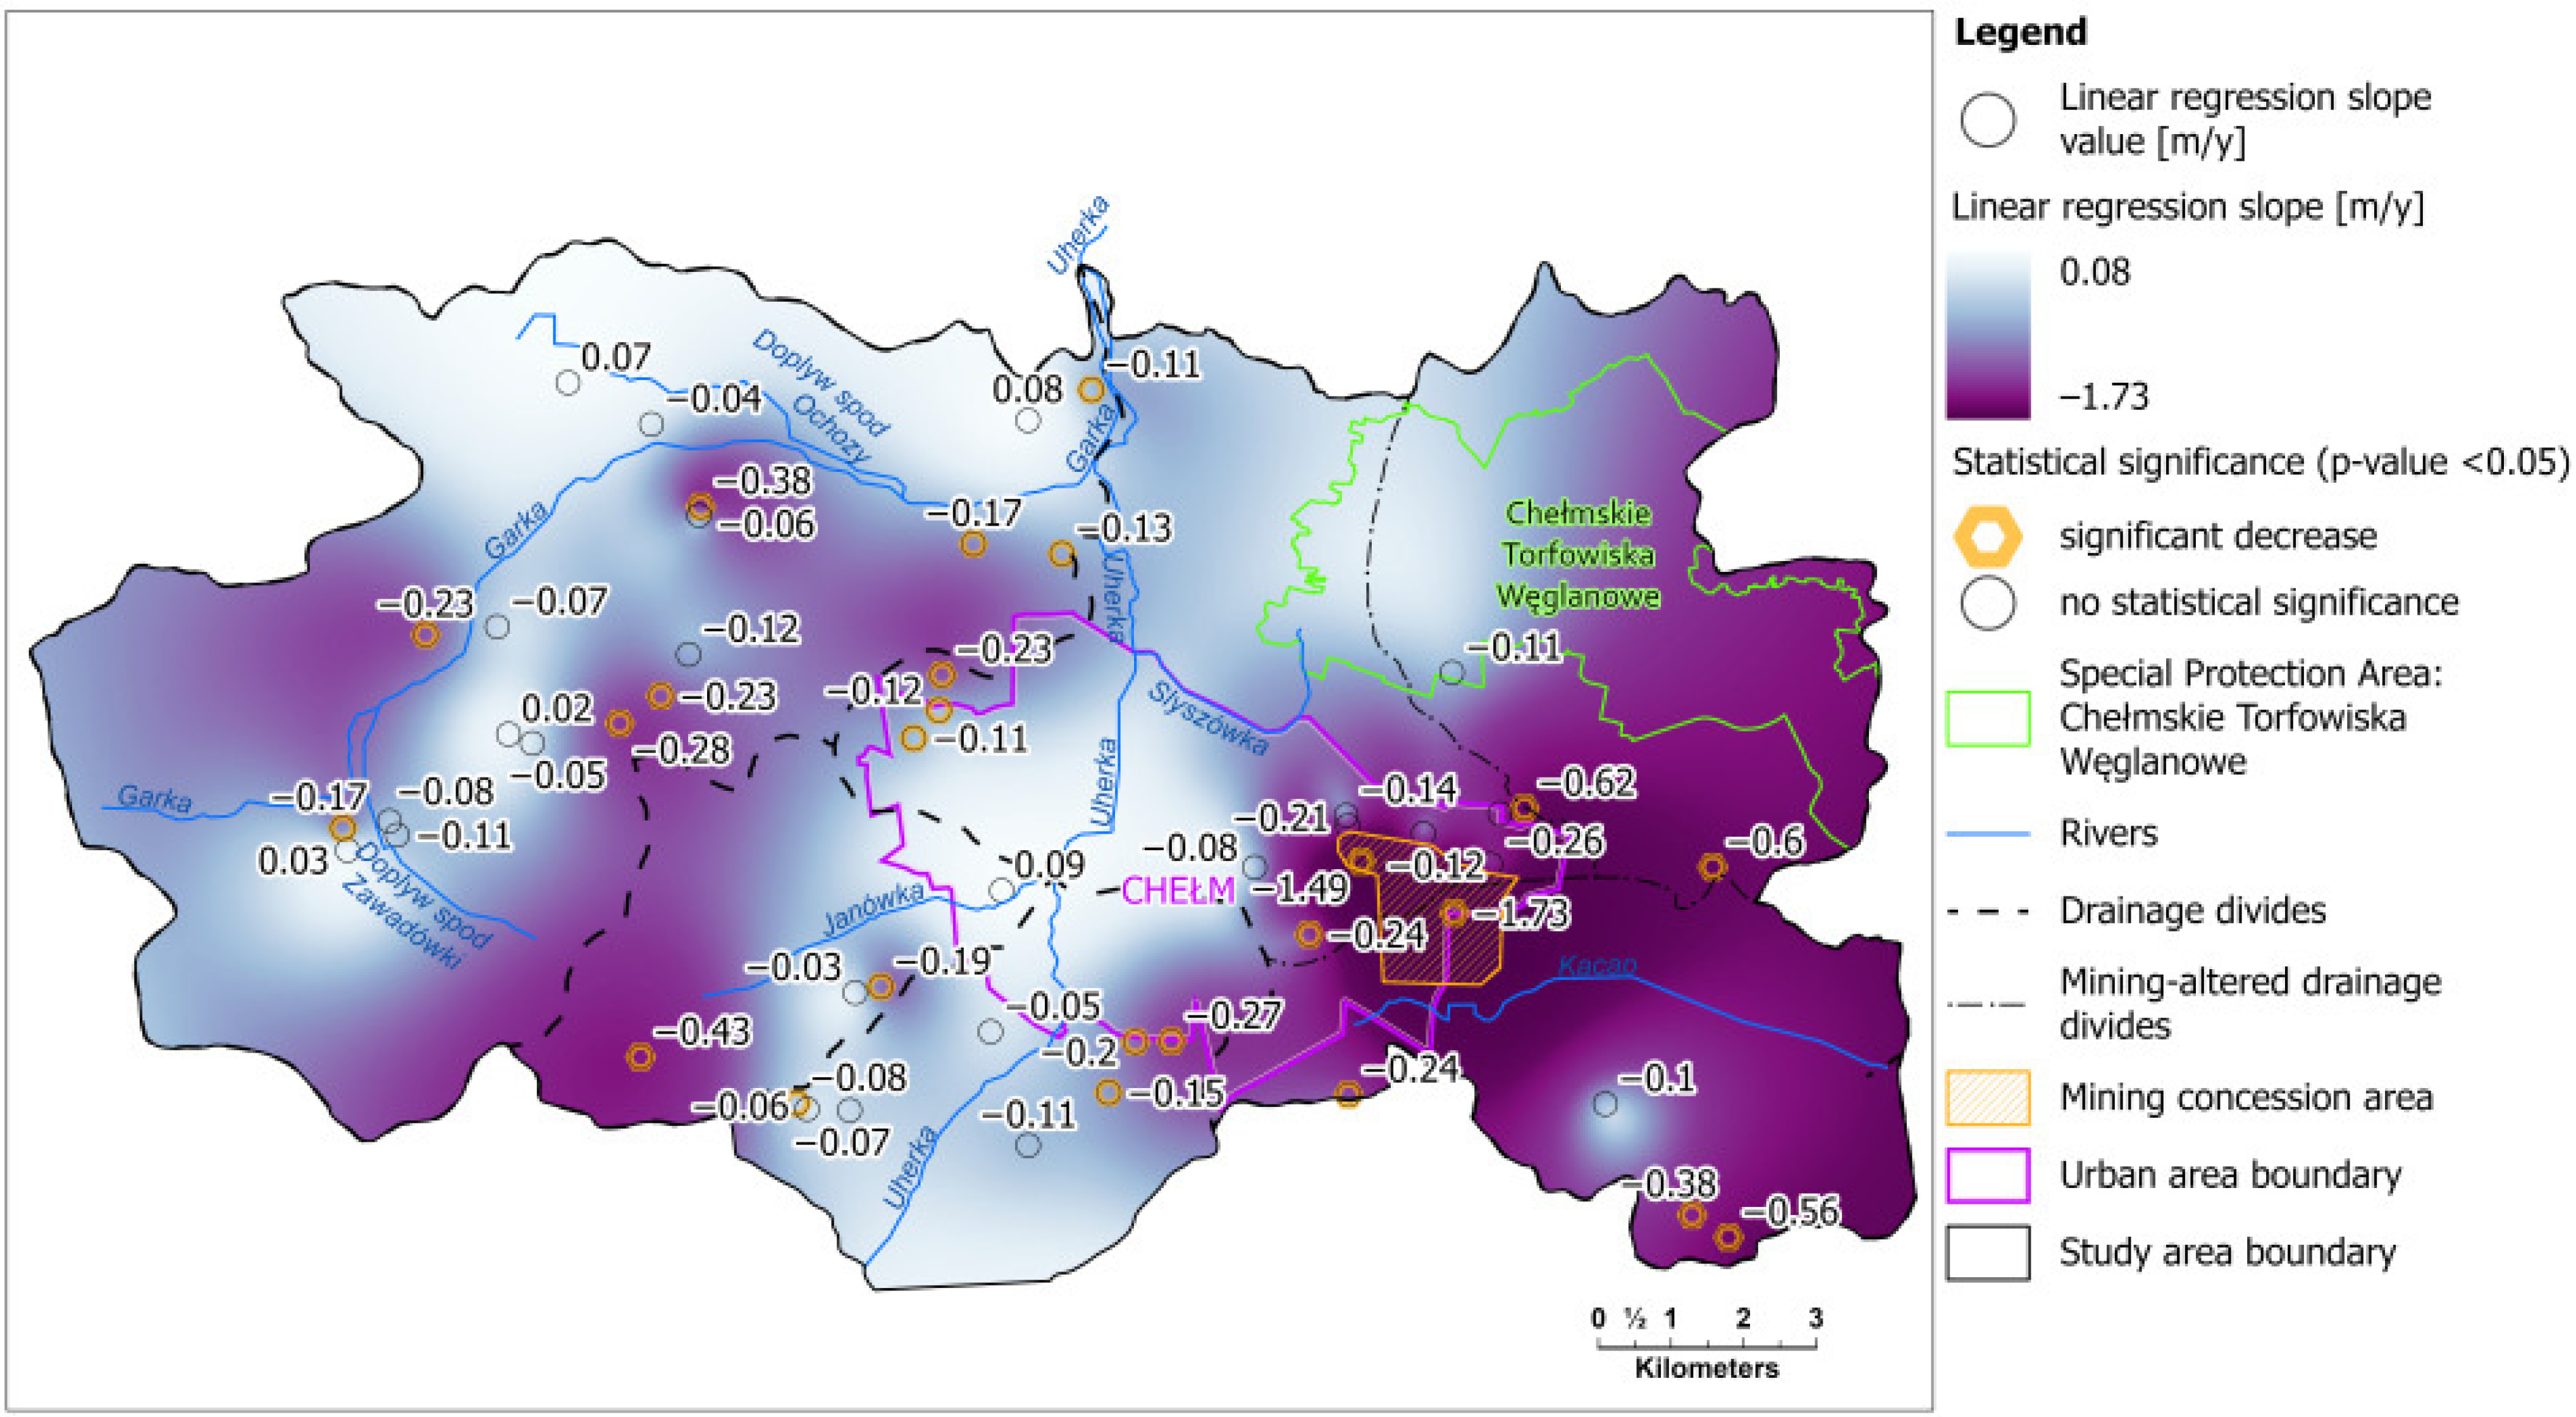
Linear regression slopes were consistent with Sen’s slope results (median −0.13 m/year), and agreement between both estimators was high (r = 0.81). A comparison of reference conditions (2005–2009) with the present state (2025) showed a median absolute decline of −2.76 m (mean −4.75 m), with maximum drawdowns exceeding −22 m in the BIS_S10 piezometer near the mine (
Figure 5). These values correspond to the deepest part of the depression cone shown in
Figure 5b, where the negative Sen’s slope and absolute change values jointly indicate the maximum recorded groundwater-level decline in the monitoring network.
4.3. Spatial Analysis
Spatial statistics confirmed coherent local clusters of groundwater decline shown in
Figure 6,
Figure 7,
Figure 8 and
Figure 9. Pearson correlation analysis showed positive correlation of Sen’s slopes at distances up to 15–20 km, decaying to zero beyond 30 km. High-High clusters occurred in the southwestern sector near the Garka valley, while Low-Low clusters dominated the eastern mining zone (
Figure 6).
Groundwater decline extends northward toward the “Chełmskie Torfowiska Węglanowe” wetland reserve, around 2 km from the mine. The nearest observation point (P25) indicated a statistically significant decline of 0.14 m/year.
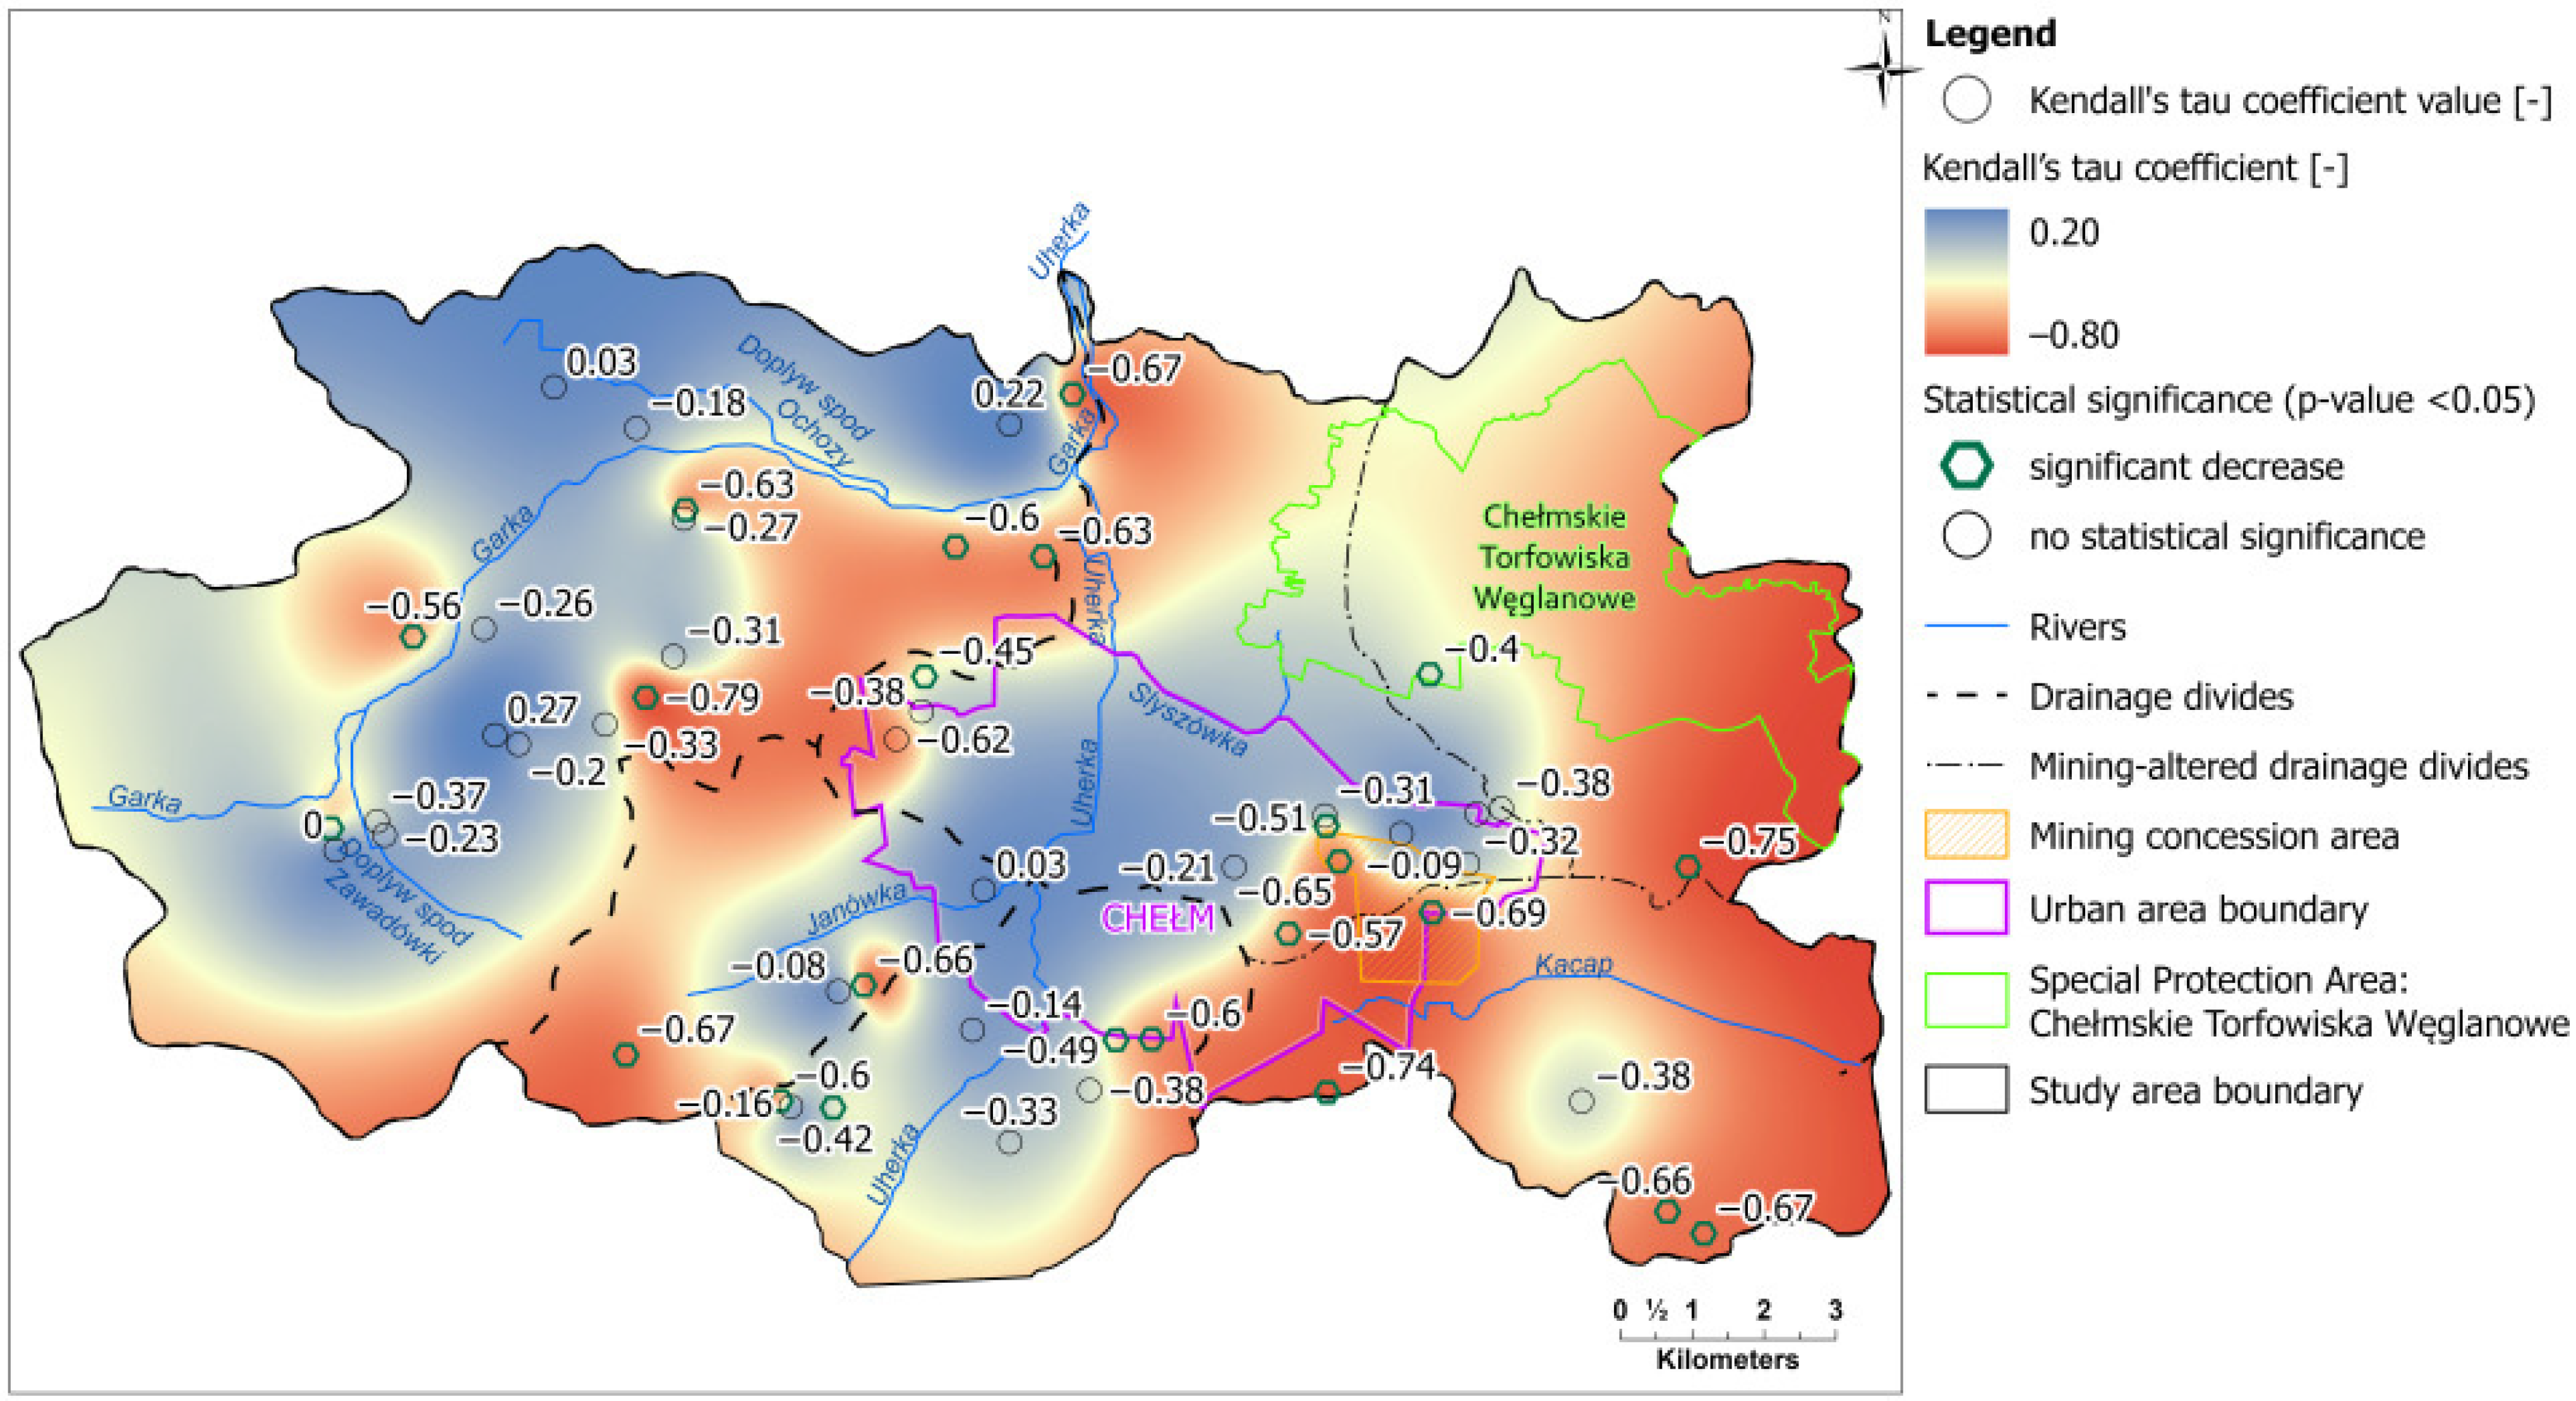
Trend consistency analysis showed that 93.6% of the study area had agreement among Kendall’s tau (
Figure 8), Sen’s slope (
Figure 6), and linear regression (
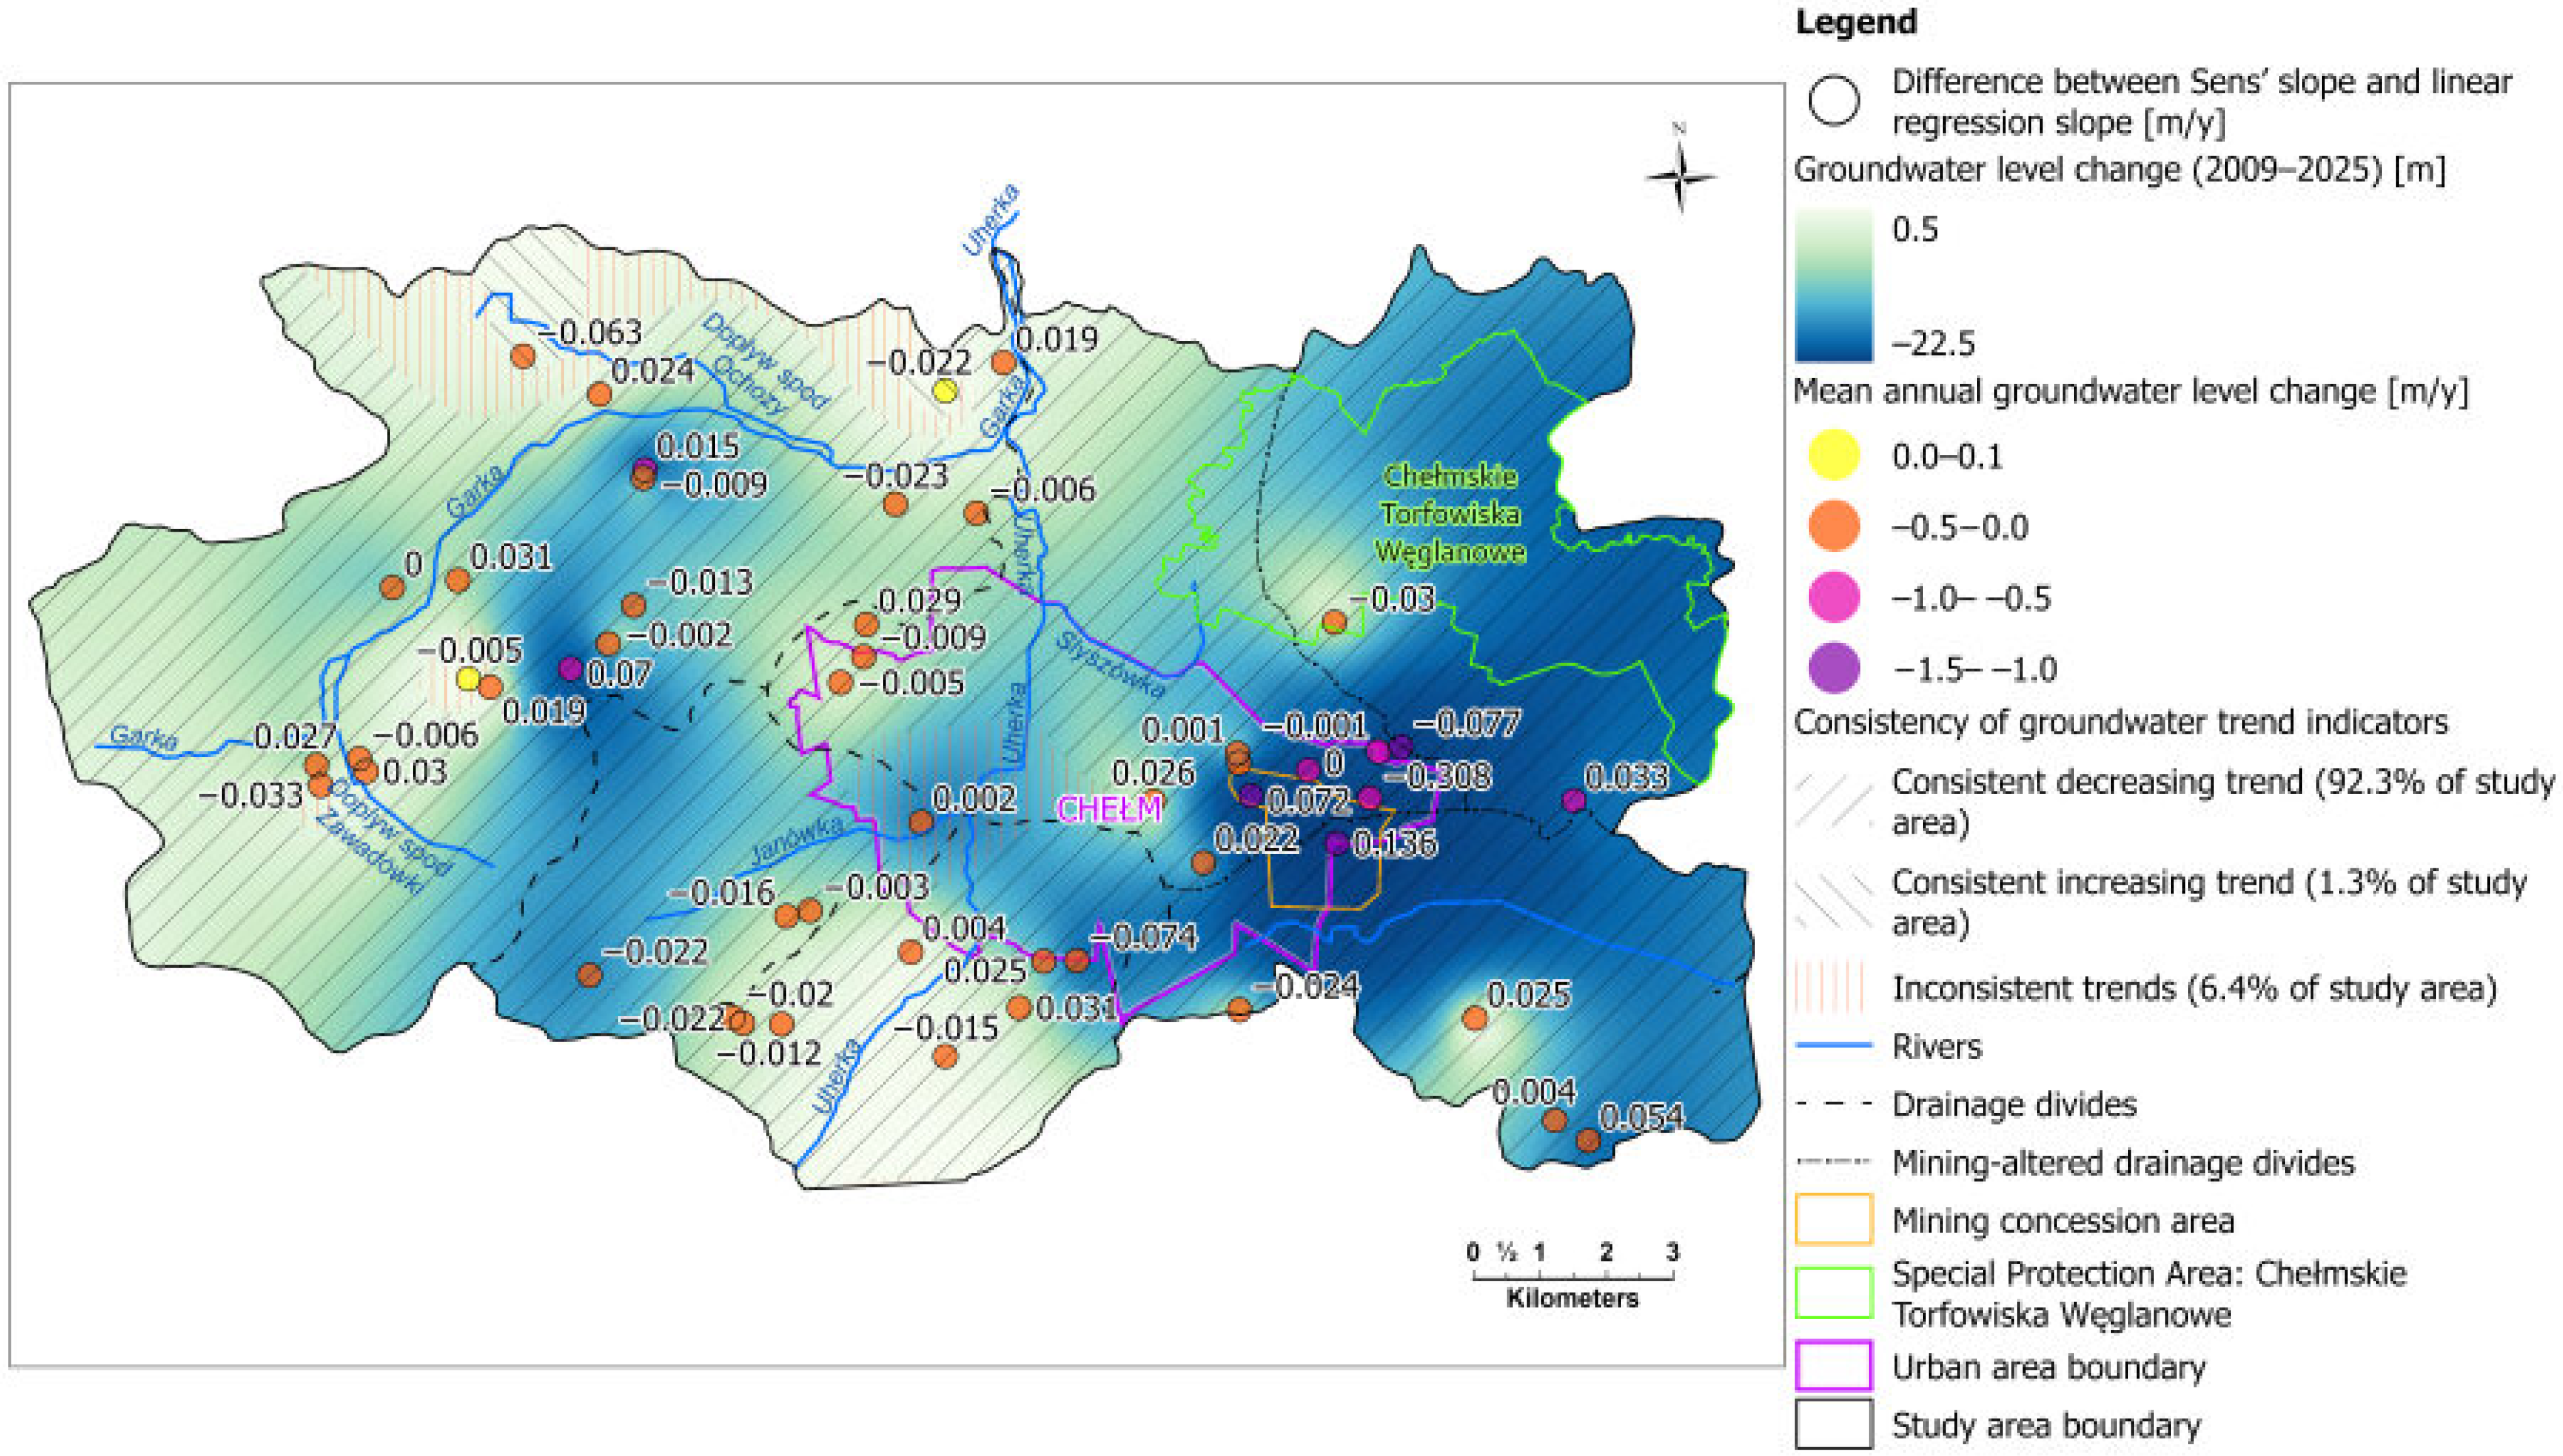
Figure 9). Of this, 92.3% corresponded to declining trends, while 1.3% showed upward trends of only a few cm/year. Inconsistent classifications occurred over 6.4% of the area, notably in the western urban zone and at the northwestern fringe (
Figure 7).
4.4. Spatiotemporal Changes in Groundwater Table Level
Analysis of the statistical data revealed that some areas exhibit no clear trend in groundwater-table fluctuations over the 2009–2025 period. This ambiguity stems from the aquifer’s variable response to recharge from precipitation. Annual rainfall totals show that 2015 was the third consecutive driest year, while 2023 ranked among the wettest, which can introduce significant uncertainty into linear statistical trends—though these shifts may not be sufficient to reverse the overall direction [
35,
36].
Groundwater head maps for all analyzed years (
Figure 10) show generally comparable regional patterns, but with noticeably wider low-head (dark-shaded) zones around the mining area (site A2, 15_barrier well and BIS_S10), reflecting the gradual expansion of the depression cone.
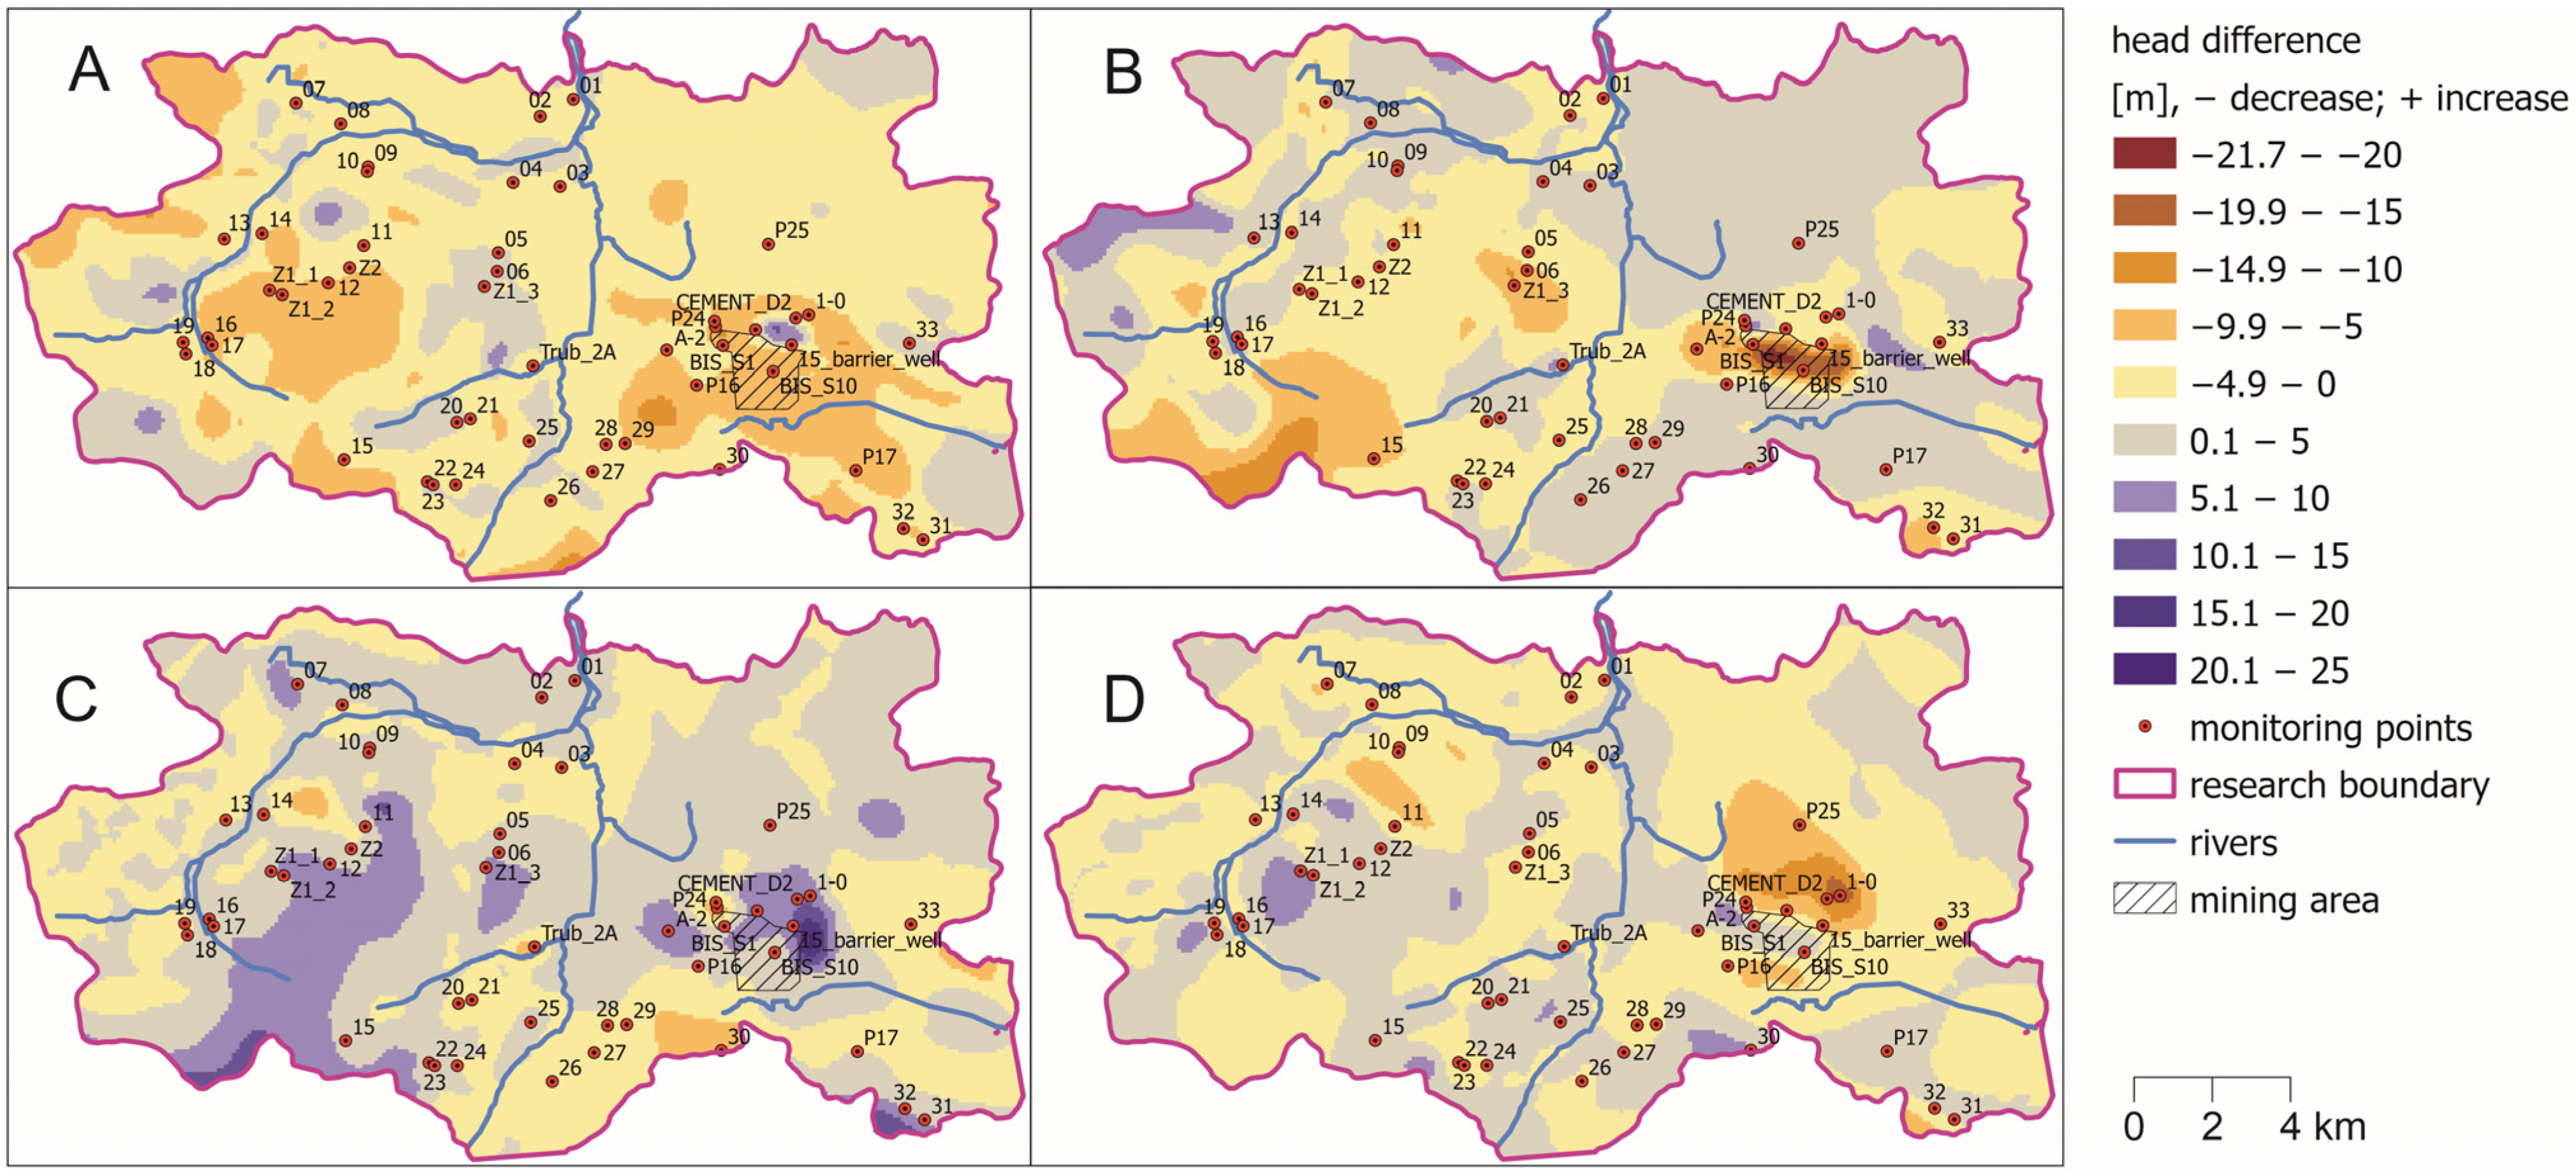
As the third year in a dry sequence, 2015 produced a pronounced drawdown of the water table across 87% of the study area. The maximum decline of 12.5 m occurred south of the chalk mine (site BIS_S10,
Figure 11A). The mine itself and the adjacent watershed zones experienced drops of 5–10 m (site 29, P16, P17). Localized groundwater table rises were confined to narrow areas along the Garka and Uherka streams (site 03, 04, 07–10, 14) and around the cement plant north of the chalk mine, when water abstraction rates were lower.
With precipitation closest to the long-term average, the year of 2018 represents median hydrological conditions for the study period. Compared with 2015, the water table recovered over 43% of the area, reaching higher elevations (
Figure 11B). However, the chalk mine region (site A2, 1-0, 15_BARRIER _WELL) saw a 22 m decline due to dewatering in its southern sector via Bariera Bis wells. The inter-river watershed between the Garka and Uherka catchments also showed continued declines of 5–15 m (11, 12, Z1_1, Z1_2, Z1_3).
Comparing 2018 (average rainfall) with the wet year 2023 highlights a substantial water table rise across 82% of the study area (
Figure 11C). The greatest increase up to 20 m was recorded at the periphery of the depression cone (site CEMENT_D2, 1-0, A2, 15_BARRIER_WELL); elsewhere, gains rarely exceeded 10 m, especially in watershed areas that sharply responded to increased infiltration. The remaining territory exhibited changes between −5 m (minor drawdown) and +5 m (slight rise), without clear spatial dominance of either process.
By the year of 2025, after the 2023 wet year, differences in groundwater head are at their minimum, generally within −5 to +5 m (
Figure 11D). A downward trend still affects 65% of the surface. The largest declines up to 12 m occur north of the mine pit (site CEMENT_D2, 1-0, P25), while scattered zones show up to an 8 m rise.
5. Discussion
5.1. Climate Variability vs. Groundwater Decline
The absence of significant regional precipitation trends over 1994–2024 indicates that climate-driven recharge variability cannot explain the systematic groundwater decline. Although winter precipitation showed localized increases, annual totals remained stable, consistent with other chalk and carbonate aquifers across Europe [
3,
13]. More importantly, our climate analysis revealed clear decreases in snow-related indices: snow days and snow cover shortened by approximately 1–1.5 days per year, while maximum and minimum air temperatures increased by 0.02–0.2 °C per year. These changes align with European-scale findings on declining snow cover duration [
37,
38,
39]. While the present analysis did not directly confirm a statistical correlation between climatic variables and groundwater decline, the observed reduction in snowfall and snow cover duration, together with rising air temperatures, may theoretically enhance the effects of mine dewatering by reducing recharge efficiency. Thus, the climatic signal should be regarded as a secondary but amplifying factor contributing to the overall downward trend in groundwater levels [
3,
40]. These climatic shifts weaken the resilience of recharge, but they cannot account for the magnitude of groundwater decline observed in the Chełm chalk aquifer.
5.2. Groundwater Level Declines and Spatial Patterns
Groundwater levels display systematic, monotonic declines consistent across statistical estimators. The median Sen’s slope of –0.14 m/year and maximum drawdowns exceeding 20 m near the mine indicate a persistent depression cone induced by mine drainage. The high agreement between Sen’s slope and linear regression (r = 0.81) confirms that the decline is systematic rather than random. Divergences between estimators (>0.15 m/year) likely delineate transitional zones at the depression cone edge, areas of variable recharge, or wells influenced by local pumping. These findings are consistent with earlier observations of anthropogenic impacts in the Chełm area [
10,
11].
Spatial autocorrelation further supports localized anthropogenic influence. Low-Low clusters dominate the eastern mining zone, while High-High clusters appear in watershed areas, reflecting a combination of mine drainage and hydrogeological boundary conditions. Similar applications of Local Moran’s I and Getis–Ord Gi* have proven effective in detecting anthropogenic stress in hydrogeological systems [
22,
23].
5.3. Ecological and Regional Concerns
Of particular concern is the northward expansion of declining trends toward the “Chełmskie Torfowiska Węglanowe” reserve. Groundwater-dependent wetlands are sensitive to even modest declines (e.g., 0.14 m/year at P25), and long-term drawdowns may alter their hydrological balance. Comparable risks have been reported in other chalk aquifers where abstraction altered wetland hydrology [
21]. In the western watershed between the Garka and Uherka catchments (site 05, 06, 11, 12, Z1_1-3, Z2), mean annual declines of 0.21–0.45 m/year contrast with weaker but still negative trends in adjacent river valleys, particularly along the Uherka and Garka rivers (
Figure 6). This spatial differentiation aligns with global evidence that river valleys act as buffer zones, moderating groundwater fluctuations relative to watershed recharge zones [
27,
28,
29,
30,
31,
32,
33].
5.4. Mine Dewatering Impacts in Carbonate Aquifers
Although mine drainage was identified as the dominant driver of groundwater decline, detailed historical pumping and discharge records from the Chełm Chalk Mine were not available. Therefore, statistical trend and spatial analyses were used as an indirect quantitative approach to infer the magnitude and spatial footprint of dewatering.
The consistency among Kendall’s tau, Sen’s slope, and linear regression (93.6% agreement) strengthens confidence in our conclusion that mine dewatering is the dominant driver of decline. Secondary contributions from legal abstractions and potential unregistered withdrawals cannot be excluded but are unlikely to account for the observed regional drawdown. Case studies confirm that mine dewatering in carbonate aquifers frequently produces extensive depression cones, occasionally displacing groundwater divides and reducing or eliminating spring discharge [
41,
42]. Once formed, such regional depressions exhibit inertia, with recovery delayed or incomplete after pumping cessation [
43,
44,
45,
46].
The ecological consequences of long-term dewatering are also well documented. Wetlands near drainage zones are particularly vulnerable, as even moderate declines can trigger irreversible habitat degradation [
11,
12,
47]. Reduced or absent spring discharge further illustrates the hydrological sensitivity of carbonate aquifer discharge areas.
Overall, the evidence demonstrates that climate variability has contributed indirectly, by reducing snowmelt recharge and altering seasonality, but cannot explain the magnitude of groundwater decline. Instead, the long-term mine dewatering in Chełm has established a depression cone that extends regionally, approaching sensitive wetland ecosystems and reshaping natural groundwater divides. The combined processes of regional groundwater flow disturbance, spring yield decline, and slow recovery emphasize the systemic vulnerability of fissured–porous chalk aquifers to intensive and prolonged dewatering.
6. Conclusions
This study demonstrates that groundwater dynamics in the Chełm region are predominantly controlled by anthropogenic factors, but its impact is reinforced by climatic signals, such as stable precipitation totals but declining snowfall, shorter snow cover duration, and rising temperatures. Sustainable groundwater management in such settings must therefore account for both anthropogenic stresses and climate-driven reductions in recharge.
The groundwater levels in the Upper Cretaceous chalk aquifer consistently declined during 2009–2025, with statistically significant downward trends recorded in nearly half of the observation points. Trend consistency analysis showed that over 93% of the study area exhibited agreement among statistical estimators. These results confirm the robustness of the methodology and underscore the dominant role of mine dewatering in shaping the groundwater regime.
During exceptionally wet years, when annual precipitation substantially exceeds long-term averages, aquifer systems capture and store much larger recharge pulses than under normal conditions. These recharge elevating the groundwater table in watershed divides and in the areas with relatively thin vadose zones and lower transmissivity. As a result, 82% of the area is observed to have increasing groundwater levels even in the periphery of the depression cone, but this change is only temporary and does not play an important role looking at the improvement of the long term decrease trend. This boost in storage remains transient, so once precipitation returns to average or below-average levels, excess water drains away or is withdrawn by the chalk mine dewatering system.
Although this drawdown represents a clear hydrogeological impact, its effects are partly mitigated by the beneficial use of pumped mine water: around 50% of the annual dewatering volume is directed into municipal supply, providing high-quality drinking water after only simple microbiological treatment. This set of conditions highlights the need for integrated management that links mining operations, water supply security, and climate adaptation strategies to sustain both human and ecosystem demands.
Despite the fact that mine dewatering and groundwater abstraction remain the dominant drivers of the observed groundwater table decline, other factors may also contribute to spatial and temporal variability, such as land drainage systems and river channel regulation, surface sealing under urban expansion. On the natural side, climatic variables such as systematic decline in snow days and snow cover which may reduce infiltration efficiency. Taken together, these additional processes are likely secondary compared to the mining dewatering signal but should be acknowledged as part of the broader framework of groundwater dynamics in the Chełm chalk aquifer.
Although no isotope-based groundwater age data are available for the Chełm/Lublin Basin chalk aquifer, applying multi-tracer dating (e.g., 3H–3He, 14C, CFCs/SF6, and noble gases) is recommended as future work to quantify age distributions and recharge timing, thereby refining the interpretation of the observed drawdown beyond level- and recharge-based analyses. Such investigations are necessary because the present interpretation assumes that precipitation, including snowmelt, contributes to recharge that reaches the monitored aquifer within one or a few years. This assumption could not be verified with the available data, as no direct information on groundwater residence time or flow pathways was included in the current study. Therefore, multi-tracer dating would help to test and validate this assumption, improving the reliability of the inferred relationship between precipitation variability and groundwater-level response.
In conclusion, the observed trends point to a strong anthropogenic signal superimposed on a hydrogeological system naturally sensitive to recharge fluctuations. A forward-looking strategy should combine enhanced monitoring of precipitation, snow, temperature, and groundwater levels with adaptive measures that anticipate future recharge scenarios. This includes evaluating water balances under projected climate conditions and integrating ecological requirements into water management decisions.
Sustainable approaches in mining-affected aquifers should also explore compensatory measures such as artificial recharge, the protection of infiltration zones, and the reduction in non-essential withdrawals. Finally, regional policies should explicitly link groundwater management with climate adaptation frameworks, ensuring resilience of groundwater-dependent ecosystems to both human activity and environmental change.
Author Contributions
Conceptualization, K.S. and S.Z.; methodology, K.S. and S.Z.; validation, D.P.; formal analysis, K.S. and S.Z.; investigation, K.S. and S.Z.; resources, K.S.; data curation, S.Z.; writing—original draft preparation, K.S. and S.Z.; writing—review and editing, D.P.; visualization, K.S. and S.Z.; supervision, D.P.; project administration, D.P.; funding acquisition, D.P. All authors have read and agreed to the published version of the manuscript.
Funding
This research received no external funding.
Institutional Review Board Statement
Not applicable.
Informed Consent Statement
Not applicable.
Data Availability Statement
The data are available from the corresponding author upon request and with the permission of the data owners. Data obtained from publicly available sources are cited in the References Section.
Acknowledgments
We would like to thank the Reviewers for their valuable comments that helped us improve the quality of our article. In the preparation of this work, ChatGPT-5 tools were used to improve the readability and language of the work.
Conflicts of Interest
The authors declare no conflict of interest.
References
- Rusli, S.R.; Bense, V.F.; Mustafa, S.M.T.; Weerts, A.H. The impact of future changes in climate variables and groundwater abstraction on basin-scale groundwater availability. Hydrol. Earth Syst. Sci. 2024, 28, 5107–5131. [Google Scholar] [CrossRef]
- Davamani, V.; John, J.E.; Poornachandhra, C.; Gopalakrishnan, B.; Arulmani, S.; Parameswari, E.; Santhosh, A.; Srinivasulu, A.; Lal, A.; Naidu, R. A critical review of climate change impacts on groundwater resources: A focus on the current status, future possibilities, and role of simulation models. Atmosphere 2024, 15, 122. [Google Scholar] [CrossRef]
- Bloomfield, J.P.; Marchant, B.P. Analysis of groundwater drought building on the standardised precipitation index approach. Hydrol. Earth Syst. Sci. 2013, 17, 4769–4787. [Google Scholar] [CrossRef]
- Jackson, C.R.; Bloomfield, J.P.; Mackay, J.D. Evidence for changes in historic and future groundwater levels in the UK. Prog. Phys. Geogr. 2015, 39, 49–67. [Google Scholar] [CrossRef]
- Guzy, A.; Malinowska, A.A. Assessment of the impact of the spatial extent of land subsidence and aquifer system drainage induced by underground mining. Sustainability 2020, 12, 7871. [Google Scholar] [CrossRef]
- West, L.J.; Farrell, R.P.; Foley, A.E.; Howlett, P.R.; Massei, N. An introduction to the Chalk aquifers of northern Europe. Geol. Soc. Lond. Spec. Publ. 2023, 517, 1–14. [Google Scholar] [CrossRef]
- Ahmat, K.; Lu, H.; Liu, H. A numerical study on impact of coal mining activity and mine water drainage on flow and transport behavior in groundwater. Water 2024, 16, 3596. [Google Scholar] [CrossRef]
- Gromnicki, K.; Chudy, K. Impact assessment of mining dewatering on vegetation based on satellite image analysis and the NDVI index—A case study of a Chalk mine. Resources 2025, 14, 134. [Google Scholar] [CrossRef]
- Batlle-Aguilar, J.; Orban, P.; Dassargues, A.; Brouyère, S. Identification of groundwater quality trends in a chalk aquifer threatened by intensive agriculture in Belgium. Hydrogeol. J. 2007, 15, 1615–1627. [Google Scholar] [CrossRef]
- Borchulski, Z.; Gołębiowska, E.; Łyszczarz, L.; Szydeł, R. Zmiany stosunków wodnych w rejonie torfowisk węglanowych w okolicach Chełma. Człowiek Sr. 1995, 19, 143–162. [Google Scholar]
- Herbich, P.; Jarmułowicz-Siekiera, M.; Nidental, M.; Nizicka, D.; Przytuła, E. Identyfikacja warunków wodnych obszaru Natura 2000–Chełmskie Torfowiska Węglanowe na podstawie analizy wybranych warstw informacyjnych bazy danych GIS Mapy Hydrogeologicznej Polski 1:50,000. Biul. Państwowego Inst. Geol. 2011, 444, 7–24. [Google Scholar]
- Krogulec, E.; Porowska, D. Sustainable water management at regional and local levels. In Sustainable Development: Concept, Perspectives, Challenges; Dziewulska, A., Krogulec, E., Eds.; Wydawnictwa Uniwersytetu Warszawskiego: Warsaw, Poland, 2025; pp. 43–66. [Google Scholar]
- Venegas-Quiñones, H.L.; Thomasson, M.; Garcia-Chevesich, P.A. Trend analysis of precipitation, groundwater level and flow rate data by using Mann–Kendall and Sen’s slope estimator statistical tests in the Petorca Commune. Am. J. Environ. Sci. 2019, 15, 180–187. [Google Scholar] [CrossRef]
- Szczepiński, J. The significance of groundwater flow modeling study for simulation of opencast mine dewatering, flooding, and the environmental impact. Water 2019, 11, 848. [Google Scholar] [CrossRef]
- Sun, K.; Fan, L.; Xia, Y.; Li, C.; Chen, J.; Gao, S.; Wu, B.; Peng, J.; Ji, Y. Impact of coal mining on groundwater of Luohe Formation in Binchang mining area. Int. J. Coal Sci. Technol. 2021, 8, 88–102. [Google Scholar] [CrossRef]
- Fattah, M.A.; Hasan, M.M.; Dola, I.A.; Morshed, S.R.; Chakraborty, T.; Kafy, A.A.; Alsulamy, S.; Khedher, K.M.; Shohan, A.A.A. Implications of rainfall variability on groundwater recharge and sustainable management in South Asian capitals: An in-depth analysis using Mann Kendall tests, continuous wavelet coherence, and innovative trend analysis. Groundw. Sustain. Dev. 2024, 24, 101060. [Google Scholar] [CrossRef]
- Mohammed, S.H.; Flores, Y.G.; Al-Manmi, D.A.M.; Mikita, V.; Szűcs, P. Assessment of groundwater level fluctuation using integrated trend analysis approaches in the Kapran sub-basin, North East of Iraq. Groundw. Sustain. Dev. 2024, 26, 101292. [Google Scholar] [CrossRef]
- Minea, I.; Boicu, D.; Amihăiesei, V.; Iosub, M. Identification of seasonal and annual groundwater level trends in temperate climatic conditions. Front. Environ. Sci. 2022, 10. [Google Scholar] [CrossRef]
- Valois, R.; MacDonell, S.; Núñez Cobo, J.H.; Maureira-Cortés, H. Groundwater level trends and recharge event characterization using historical observed data in semi-arid Chile. Hydrol. Sci. J. 2020, 65, 597–609. [Google Scholar] [CrossRef]
- Marchant, B.P.; Bloomfield, J.P. Spatio-temporal modelling of the status of groundwater droughts. J. Hydrol. 2018, 564, 397–413. [Google Scholar] [CrossRef]
- Wendt, D.E.; Van Loon, A.F.; Bloomfield, J.P.; Hannah, D.M. Asymmetric impact of groundwater use on groundwater droughts. Hydrol. Earth Syst. Sci. 2020, 24, 4853–4868. [Google Scholar] [CrossRef]
- Liu, F.; Kang, P.; Zhu, H.; Han, J.; Huang, Y. Analysis of spatiotemporal groundwater-storage variations in China from GRACE. Water 2021, 13, 2378. [Google Scholar] [CrossRef]
- Li, Y.; Li, M.; Song, X.; Hu, X.; Guo, X.; Qiu, Y.; Xiong, H.; Cui, H.; Ma, C. An integrated approach combining LISA, BI-LISA, and the modified COPK method to improve groundwater management in large-scale karst areas. J. Hydrol. 2023, 625, 130111. [Google Scholar] [CrossRef]
- Krajewski, S. Zone of Waterlogging of Upper Cretaceous Formations in the Lublin Coal Basin; Geological Publications: Warsaw, Poland, 1972. [Google Scholar]
- Paczyński, B.; Sadurski, A. Regional Hydrogeology of Poland: Mineral, Medicinal, Thermal, and Mine Waters; Paczyński, B., Sadurski, A., Eds.; Polish Geological Institute: Warsaw, Poland, 2007; ISBN 978-83-7538-169-6. [Google Scholar]
- MPGK Chełm. Skąd się bierze woda w kranie. In Miejskie Przedsiębiorstwo Gospodarki Komunalnej; Chełm: Chełm, Poland, 2025. [Google Scholar]
- Herbich, P.; Knyszyński, F. 1998–Mapa Hydrogeologiczna Polski, 1:50,000, Arkusz Strachosław (790), Z Objaśnieniami; PIB-PIB: Warszawa, Poland, 1998. [Google Scholar]
- Allen, D.J.; Darling, W.G.; Gooddy, D.C.; Lapworth, D.J.; Newell, A.J.; Williams, A.T.; Allen, D.; Abesser, C. Interaction between groundwater, the hyporheic zone and a Chalk stream: A case study from the River Lambourn, UK. Hydrogeol. J. 2010, 18, 1125–1141. [Google Scholar] [CrossRef]
- Hughes, A.G.; Vounaki, T.; Peach, D.W.; Ireson, A.M.; Jackson, C.R.; Butler, A.P.; Bloomfield, J.P.; Finch, J.; Wheater, H.S. Flood risk from groundwater: Examples from a Chalk catchment in southern England. J. Flood Risk Manag. 2011, 4, 143–155. [Google Scholar] [CrossRef]
- Soley, R.W.N.; Power, T.; Mortimore, R.N.; Shaw, P.; Dottridge, J.; Bryan, G.; Colley, I. Modelling the hydrogeology and managed aquifer system of the Chalk across southern England. Geol. Soc. Lond. Spec. Publ. 2012, 364, 129–154. [Google Scholar] [CrossRef]
- Bonì, R.; Cigna, F.; Bricker, S.; Meisina, C.; McCormack, H. Characterisation of hydraulic head changes and aquifer properties in the London Basin using Persistent Scatterer Interferometry ground motion data. J. Hydrol. 2016, 540, 835–849. [Google Scholar] [CrossRef]
- Collins, S.L.; Christelis, V.; Jackson, C.R.; Mansour, M.M.; Macdonald, D.M.J.; Barkwith, A.K.A.P. Towards integrated flood inundation modelling in groundwater-dominated catchments. J. Hydrol. 2020, 591, 125755. [Google Scholar] [CrossRef]
- Cao, F.; Jaunat, J.; Vergnaud-Ayraud, V.; Devau, N.; Labasque, T.; Guillou, A.; Ollivier, P.; Aquilina, L.; Hubert, J. Heterogeneous behaviour of unconfined Chalk aquifers inferred from combination of groundwater residence time, hydrochemistry and hydrodynamic tools. J. Hydrol. 2020, 581, 124433. [Google Scholar] [CrossRef]
- Institute of Meteorology and Water Management. Available online: https://danepubliczne.imgw.pl (accessed on 30 June 2025).
- Qiu, Y.; Wang, D.; Yu, X.; Jia, G.; Li, H. Effects of groundwater table decline on vegetation in groundwater-dependent ecosystems. Forests 2023, 14, 2326. [Google Scholar] [CrossRef]
- Söller, L.; Luetkemeier, R.; Müller Schmied, H.; Döll, P. Groundwater stress in Europe—Assessing uncertainties in future groundwater discharge alterations due to water abstractions and climate change. Front. Water 2024, 6, 1448625. [Google Scholar] [CrossRef]
- IPCC. Climate Change 2007: The Physical Science Basis; Contribution of Working Group I to the Fourth Assessment Report of the Intergovernmental Panel on Climate Change; Cambridge University Press: Cambridge, UK, 2007. [Google Scholar]
- López-Moreno, J.I.; Gascoin, S.; Herrero, J.; Sproles, E.A.; Pons, M.; Alonso-González, E.; Hanich, L.; Boudhar, A.; Musselman, K.N.; Molotch, N.P.; et al. Different sensitivities of snowpacks to warming in Mediterranean climate mountain areas. Environ. Res. Lett. 2017, 12, 074006. [Google Scholar] [CrossRef]
- Masloumidis, I.; Dafis, S.; Kyros, G.; Lagouvardos, K.; Kotroni, V. Snow Cover and Depth Climatology and Trends in Greece. Climate 2025, 13, 34. [Google Scholar] [CrossRef]
- Stahl, K.; Hisdal, H.; Hannaford, J.; Tallaksen, L.M.; van Lanen, H.A.J.; Sauquet, E.; Demuth, S.; Fendekova, M.; Jódar, J. Streamflow trends in Europe: Evidence from a dataset of near-natural catchments. Hydrol. Earth Syst. Sci. 2016, 14, 2367–2382. [Google Scholar] [CrossRef]
- Hobbs, S.L.; Gunn, J. The hydrogeological effect of quarrying karstified limestone: Options for prediction and mitigation. Q. J. Eng. Geol. Hydrogeol. 1998, 31, 147–157. [Google Scholar] [CrossRef]
- Qiao, X.; Li, G.; Li, M.; Zhou, J.; Du, J.; Du, C.; Sun, Z. Influence of coal mining on regional karst groundwater system: A case study in West Mountain area of Taiyuan City, northern China. Environ. Earth Sci. 2011, 64, 1525–1535. [Google Scholar] [CrossRef]
- Edwards, A.J.; Hobbs, S.L.; Smart, P.L. Effects of quarry dewatering on a karstified limestone aquifer: A case study from the Mendip Hills, England. In Proceedings of the Third Conference on Hydrogeology, Ecology, Monitoring and Management of Ground Water in Karst Terranes, Nashville, TN, USA, 4–6 December 1991; National Water Well Association: Columbus, OH, USA, 1991; pp. 77–92. [Google Scholar]
- van Niekerk, H.J.; van der Walt, I.J. Dewatering of the Far West Rand dolomitic area by gold mining activities and subsequent ground instability. Land Degrad. Dev. 2006, 17, 441–452. [Google Scholar] [CrossRef]
- Winde, F.; Stoch, E.J. Threats and opportunities for post-closure development in dolomitic gold-mining areas of the West Rand and Far West Rand (South Africa)—A hydraulic view. Water SA 2010, 36, 69–82. [Google Scholar] [CrossRef]
- Poulain, A.; Hinschberger, F.; Michel, J.; Pirlot, M. Hydrodynamic and hydrochemical impact of pumped-storage operation in a chalk quarry (Obourg, Belgium). Appl. Sci. 2021, 11, 4913. [Google Scholar] [CrossRef]
- Mayes, W.M.; Large, A.R.G.; Younger, P.L. The impact of pumped water from a de-watered Magnesian limestone quarry on an adjacent wetland: Thrislington, County Durham, UK. Environ. Pollut. 2005, 138, 443–454. [Google Scholar] [CrossRef]
Figure 1.
Location of the study area with monitoring points.
Figure 1.
Location of the study area with monitoring points.
Figure 3.
Annual precipitation totals at the Chełm region stations (1994–2024) with 30-year mean and linear regression trend line.
Figure 3.
Annual precipitation totals at the Chełm region stations (1994–2024) with 30-year mean and linear regression trend line.
Figure 4.
Monthly Sen’s slope estimates of precipitation trends (1994–2024) [m/y] for individual stations and aggregated series, with statistically significant values (p < 0.05) highlighted.
Figure 4.
Monthly Sen’s slope estimates of precipitation trends (1994–2024) [m/y] for individual stations and aggregated series, with statistically significant values (p < 0.05) highlighted.
Figure 5.
Spatial and statistical characteristics of groundwater level trends in the Chełm region (2009–2025). (a) Distribution of Sen’s slope values, (b) Largest statistically significant groundwater level declines (negative Sen’s slope values) for 2009–2025. Intervals are defined as left-closed and right-open.
Figure 6.
Spatial distribution of groundwater level changes in the Chełm region (2009–2025) by Sen’s slope values.
Figure 6.
Spatial distribution of groundwater level changes in the Chełm region (2009–2025) by Sen’s slope values.
Figure 7.
Spatial distribution of groundwater level changes in the Chełm region (2009–2025) by absolute and annual changes.
Figure 7.
Spatial distribution of groundwater level changes in the Chełm region (2009–2025) by absolute and annual changes.
Figure 8.
Spatial distribution of groundwater level changes in the Chełm region (2009–2025) by Kendall’s tau coefficients.
Figure 8.
Spatial distribution of groundwater level changes in the Chełm region (2009–2025) by Kendall’s tau coefficients.
Figure 9.
Spatial distribution of groundwater level changes in the Chełm region (2009–2025) by linear regression slopes.
Figure 9.
Spatial distribution of groundwater level changes in the Chełm region (2009–2025) by linear regression slopes.
Figure 10.
Cretaceous aquifer groundwater head in year: (A)—2009; (B)—2015; (C)—2018; (D)—2023; (E)—2025.
Figure 10.
Cretaceous aquifer groundwater head in year: (A)—2009; (B)—2015; (C)—2018; (D)—2023; (E)—2025.
Figure 11.
Groundwater head changes during the period of: (A)—2015–2009; (B)—2018–2015; (C)—2023–2018; (D)—2025–2023.
Figure 11.
Groundwater head changes during the period of: (A)—2015–2009; (B)—2018–2015; (C)—2023–2018; (D)—2025–2023.
Table 1.
Statistical summary of precipitation trends (1994–2024) for five meteorological stations and aggregated series, including Mann–Kendall (MK) results, Sen’s slope, and linear regression (LR) parameters.
Table 1.
Statistical summary of precipitation trends (1994–2024) for five meteorological stations and aggregated series, including Mann–Kendall (MK) results, Sen’s slope, and linear regression (LR) parameters.
| Station | MK Trend | Sen’s Slope [mm/y] | p-Value (MK) [-] | Slope LR [mm/y] | R2 (LR) [-] | p-Value (LR) [-] |
|---|
| Bezek | no trend | 2.200 | 0.696 | 1.586 | 0.011 | 0.638 |
| Lublin | no trend | −1.215 | 0.613 | −2.011 | 0.033 | 0.325 |
| Włodawa | increasing | 3.756 | 0.044 | 1.865 | 0.025 | 0.398 |
| Strzyżów | no trend | 1.220 | 0.458 | −0.070 | 0.000 | 0.974 |
| Zamość | no trend | 0.318 | 0.941 | −0.277 | 0.000 | 0.920 |
| Mean (aggregate) | no trend | 1.488 | 0.311 | 0.117 | 0.000 | 0.952 |
Table 2.
Summary of Climatic Trend Indicators (1994–2024) Based on Mann–Kendall, Sen’s Slope, and Linear Regression.
Table 2.
Summary of Climatic Trend Indicators (1994–2024) Based on Mann–Kendall, Sen’s Slope, and Linear Regression.
| Variable | MK Trend | p-Value (MK) [-] | Sen Slope
[per Year] | LR Slope
[per Year] | R2
(LR) [-] | p-Value (LR) [-] |
|---|
| Days with snow | decreasing | 0.00 | −0.91 | −0.90 | 0.40 | 0.00 |
| Days with snow cover | decreasing | 0.01 | −1.43 | −1.49 | 0.28 | 0.00 |
| Absolute max. air temperature [°C] | increasing | 0.05 | 0.05 | 0.05 | 0.10 | 0.04 |
| Monthly mean max. air temperature [°C] | increasing | 0.00 | 0.06 | 0.06 | 0.42 | 0.00 |
| Absolute min. air temperature [°C] | increasing | 0.05 | 0.17 | 0.20 | 0.17 | 0.02 |
| Monthly mean min. air temperature [°C] | increasing | 0.00 | 0.06 | 0.06 | 0.52 | 0.00 |
| Max. daily preciptation [mm] | no trend | 0.56 | 0.16 | 0.14 | 0.01 | 0.57 |
| Max. daily snow cover [cm] | no trend | 0.10 | −0.49 | −0.38 | 0.10 | 0.08 |
| Days with rain | no trend | 0.53 | 0.17 | 0.09 | 0.00 | 0.79 |
| Days with thunderstorm | decreasing | 0.00 | −0.50 | −0.68 | 0.36 | 0.00 |
Table 3.
Summary statistics of groundwater level trend indicators (2009–2025) for 50 observation points, based on Kendall’s tau, Sen’s slope with confidence intervals, and linear regression.
Table 3.
Summary statistics of groundwater level trend indicators (2009–2025) for 50 observation points, based on Kendall’s tau, Sen’s slope with confidence intervals, and linear regression.
| Indicator | Mean | Median | Min | Max | Std. Dev. | IQR |
|---|
| Kendall’s tau correlation coefficient [-] | −0.39 | −0.38 | −0.79 | 0.27 | 0.25 | 0.38 |
| Kendall’s tau p-value [-] | 0.18 | 0.06 | 7.70 × 10⁻⁵ | 1.00 | 0.27 | 0.26 |
| Sen’s slope [m/y] | −0.23 | −0.14 | −1.59 | 0.09 | 0.31 | 0.16 |
| Sen’s slope lower confidence interval [m/y] | −0.47 | −0.32 | −2.36 | −0.01 | 0.53 | 0.27 |
| Sen’s slope upper confidence interval [m/y] | −0.01 | 0.01 | −1.00 | 0.95 | 0.27 | 0.15 |
| Width of Sen’s slope confidence interval [m/y] | 0.46 | 0.31 | 0.05 | 2.96 | 0.51 | 0.18 |
| Linear regression slope [m/y] | −0.23 | −0.13 | −1.73 | 0.09 | 0.33 | 0.17 |
| Linear regression R2 [-] | 0.35 | 0.30 | 0.01 | 0.88 | 0.25 | 0.42 |
| Linear regression p-value [-] | 0.15 | 0.05 | 3.00 × 10⁻⁶ | 0.77 | 0.21 | 0.20 |
| Difference between slopes (Sen vs. LR) [m/y] | −1.28 × 10⁻³ | −6.08 × 10⁻⁴ | −0.31 | 0.14 | 0.06 | 0.04 |
| Absolute change (2025 vs. 2009) [m] | −4.75 | −2.76 | −22.50 | 0.38 | 5.09 | 4.02 |
| Average annual change [m/y] | −0.30 | −0.18 | −1.41 | 0.02 | 0.32 | 0.25 |
| Disclaimer/Publisher’s Note: The statements, opinions and data contained in all publications are solely those of the individual author(s) and contributor(s) and not of MDPI and/or the editor(s). MDPI and/or the editor(s) disclaim responsibility for any injury to people or property resulting from any ideas, methods, instructions or products referred to in the content. |
© 2025 by the authors. Licensee MDPI, Basel, Switzerland. This article is an open access article distributed under the terms and conditions of the Creative Commons Attribution (CC BY) license (https://creativecommons.org/licenses/by/4.0/).
