Article

Effect of Spherical Electric Arc Slag on Solid Waste-Based 3D-Printed Concrete

College of Material Science and Engineering, Nanjing Tech University, Nanjing 211816, China
*
Author to whom correspondence should be addressed.
Appl. Sci. 2025, 15(22), 11933; https://doi.org/10.3390/app152211933
Submission received: 21 October 2025 / Revised: 6 November 2025 / Accepted: 8 November 2025 / Published: 10 November 2025
(This article belongs to the Section Additive Manufacturing Technologies)

Abstract

Three-dimensional-printed concrete (3DPC) is an additive manufacturing technology that forms 3D solids via layer-by-layer printing based on 3D model data, but it consumes large amounts of river sand (RS) and has poor frost resistance. To address these issues, this study used industrial waste electric arc furnace slag (EAFS) as an aggregate at 0–100% replacement ratios to test the workability, mechanical properties, frost resistance, and microstructures of 3DPC specimens. The results show that EAFS improves mortar flowability and extends the printing window, but full replacement increases slump and reduces constructability. The stress dispersion and dense packing effects of EAFS ensure excellent mechanical properties of specimens before and after freeze–thaw cycles. At an 80% EAFS replacement ratio, compressive and flexural strengths increase by 2.52%/13.8% and 10.6%/18.2%, respectively; after freeze–thaw cycles, the specimens exhibit the best frost resistance. The interfacial transition zone between EAFS and cement matrix is only 2 μm, with 1.8% lower porosity and 20.14% fewer harmful pores than the 100% RS specimen after freeze–thaw cycles. In conclusion, 80% EAFS replacement balances 3DPC performance and solid waste utilization, providing important references for EAFS’s safe application in 3DPC and its performance improvement mechanism.

1. Introduction

In recent years, 3DPC, as a crucial branch of additive manufacturing technology in the construction field, has attracted extensive attention from an increasing number of researchers. However, there remain key unresolved issues. The majority of its fine aggregates are primarily sourced from river sand (RS), which not only leads to the rapid depletion of river sand resources but also significantly increases the practical application cost of 3DPC [1,2,3].
Using bulk solid waste as 3DPC aggregates can not only reduce environmental pollution caused by solid waste stockpiling and lower raw material costs but also practice the concept of “circular economy” [4,5,6,7]. Therefore, researchers have focused on the application of solid waste-based fine aggregates in 3DPC, aiming to achieve the dual goals of river sand reduction and solid waste resource utilization. Skibicki et al. [8] used 10–50% recycled PET aggregates to replace river sand and explored their effects on the mechanical properties and durability of 3DPC. The results showed that although high replacement rates led to a significant decline in performance, low-proportion replacement still had engineering applicability. Wang et al. [9] conducted 3D printing experiments on desert sand with different mix ratios and found that the compressive strength of the specimens was the highest when the sand/cement ratio was 1.7, but it was still significantly affected by the anisotropy effect. Zhou et al. [10] replaced river sand with 0–45% bauxite tailings and found that the mechanical properties of the specimens were optimal at a 35% replacement rate. Moreover, the potential activity of bauxite tailings could promote cement hydration and strengthen the ITZ, thereby improving the overall performance of 3DPC. Dong et al. [11] applied aeolian sand (AS) and ferrochrome slag (FS) to 3DPC, determined the optimal printing parameters through durability tests, and predicted the service life of the components. Liu et al. [12] focused on studying the effect of different proportions of recycled coarse aggregates (RCAs) on the frost resistance of 3DPC and found that compared with natural aggregates, the wider ITZ between RCAs and fresh mortar was prone to inducing micro-cracks and surface spalling, which was detrimental to the frost resistance of the specimens. The above studies confirmed that solid waste-based fine aggregates can effectively replace RS in 3DPC by adjusting replacement ratios, with some even improving specimen performance—verifying the application feasibility.
As a typical metallurgical solid waste, EAFS has unique advantages in 3DPC fine aggregate replacement due to its properties, with related research becoming a key academic focus. Pellegrino et al. [13], considering the impact of EAFS on concrete workability, suggested that its replacement rate should not exceed 50%. In 25–45 MPa grade concrete, adding 30% EAFS fine aggregates can effectively improve mechanical properties [14]. Ozturk et al. [15] showed that the mechanical properties of concrete still improved at a 40% EAFS content. Chadee et al. [16] found that when replacing natural aggregates with 0–50% EAFS, the compressive strength of the specimens showed an upward trend with the increase in the replacement rate. Kwon et al. [17] even achieved full replacement of natural aggregates with EAFS, and the mechanical properties of the specimens increased rather than decreased. In the field of 3DPC, Yue et al. [18] used EAFS as fine aggregates, improving the constructability and rheological properties of the specimens while avoiding the adverse effects of water reducers, directly confirming its printing applicability. Kim et al. [19] found that incorporating EAFS could improve the fluidity of concrete without losing mechanical properties, highlighting its practical value in optimizing constructability. Kang et al. [20] observed that EAFS could not only improve the fluidity of concrete but also extend the setting time, providing a new direction for the regulation of the 3DPC printing window.
However, existing studies still lack a systematic exploration of EAFS as a fine aggregate to replace river sand in 3DPC. The coupling effect of its replacement ratio on the workability, mechanical properties, and frost resistance of 3DPC, as well as the correlation mechanism between microstructures (such as ITZ and porosity) and macro-performance, remain unclear. Based on this, this study prepared 3DPC specimens by replacing RS with EAFS as fine aggregates at different ratios and improved the workability, mechanical properties, and frost resistance of the specimens through experiments. At the same time, combined with scanning electron microscopy (SEM) and mercury intrusion porosimetry (MIP), the effect of the EAFS replacement ratio on the ITZ and porosity of 3DPC was investigated to finally reveal the intrinsic mechanism by which EAFS fine aggregates improve the performance of 3DPC. The core value of this study lies in systematically clarifying the influence law of EAFS as a river sand substitute fine aggregate on the workability, mechanical properties, and durability of 3DPC, providing a reliable theoretical basis and data support for the subsequent engineering application of EAFS aggregates in 3D printed concrete.

2. Materials and Methods

2.1. Materials

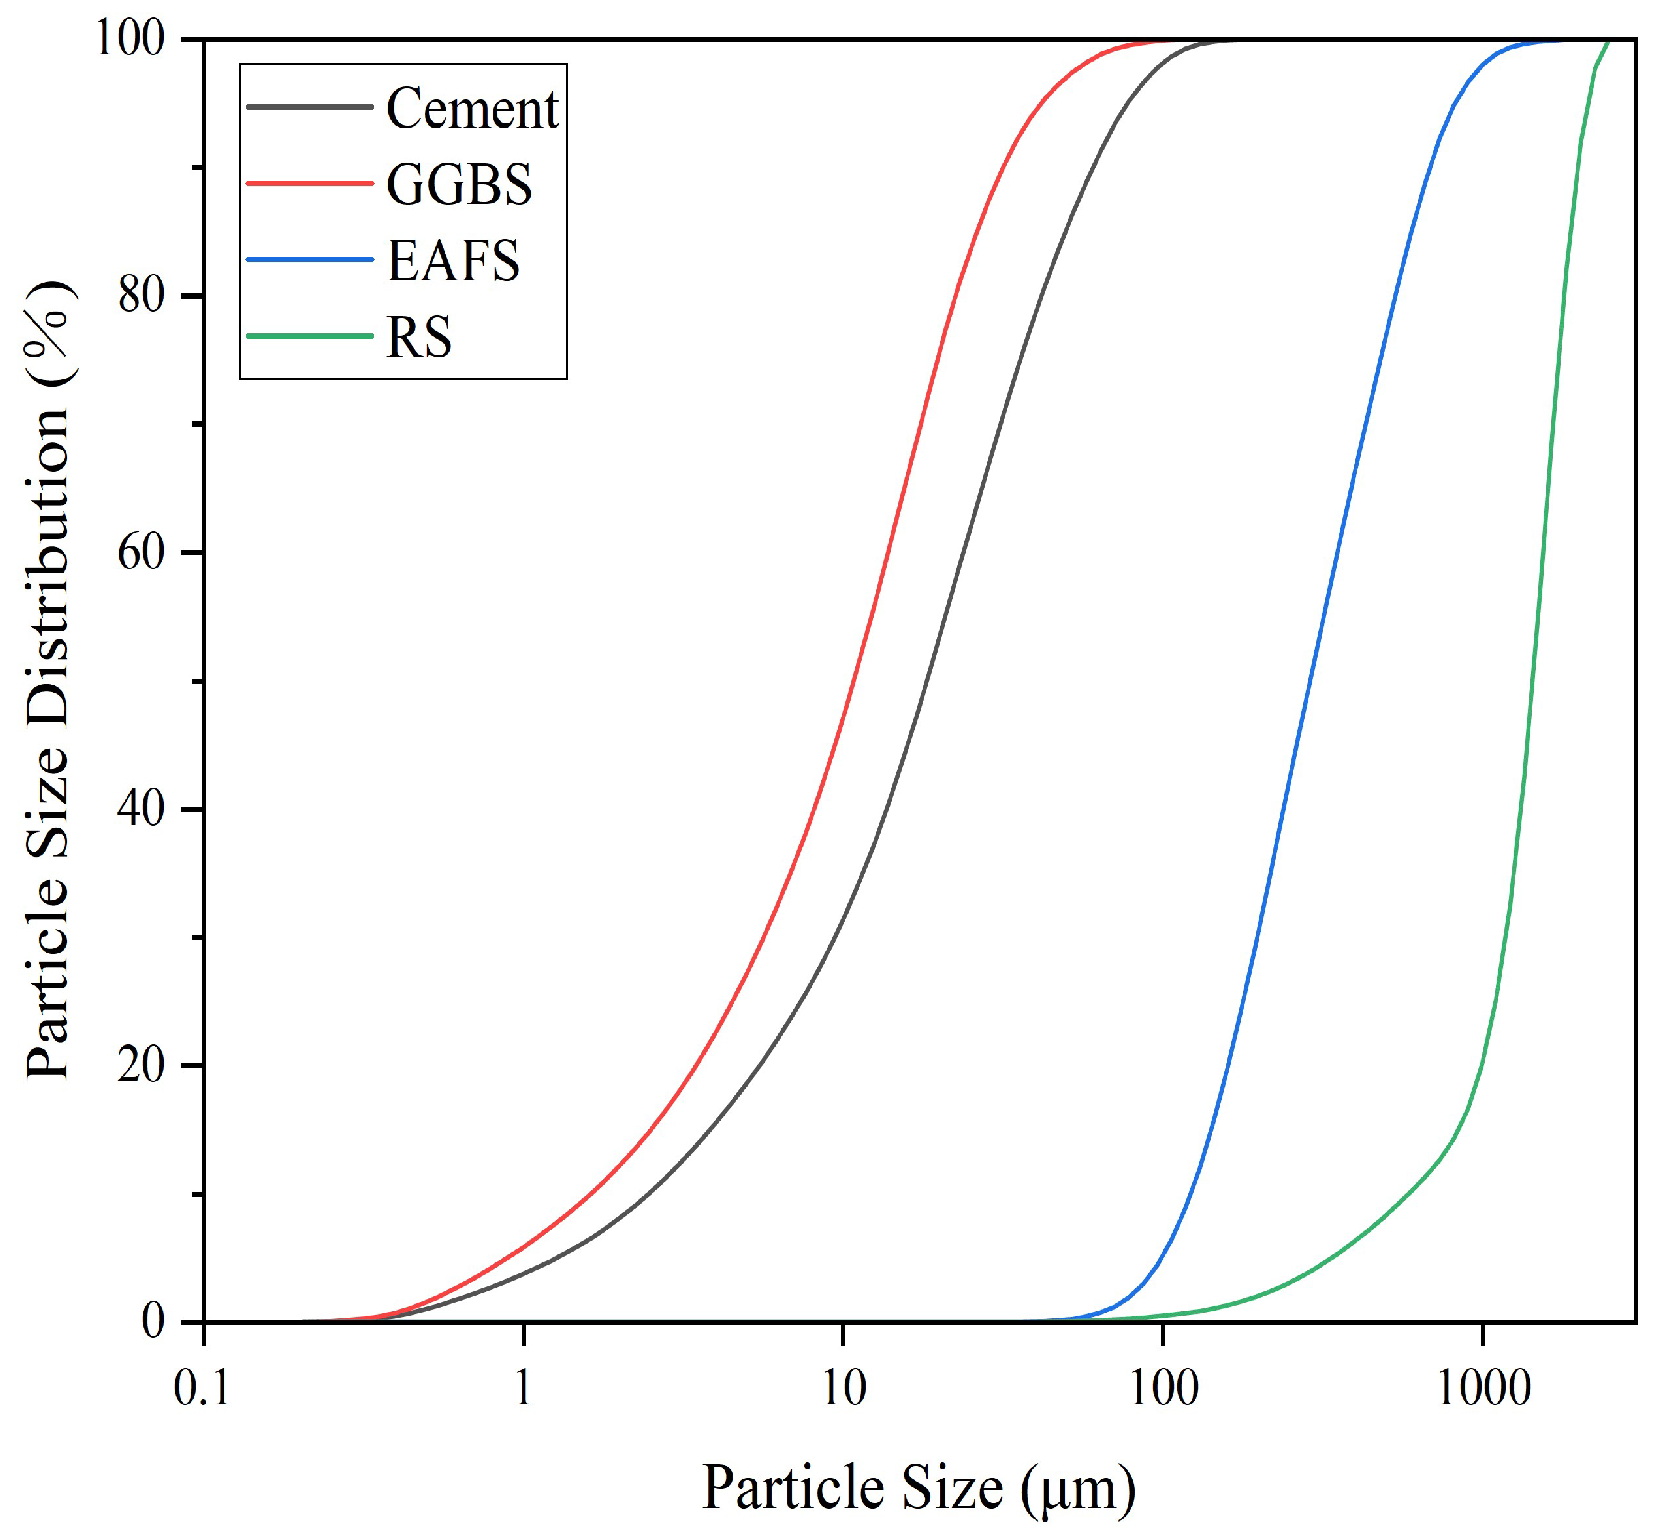
The 42.5 ordinary Portland cement (OPC) used in this experiment was provided by Anhui Conch Cement Co., Ltd. (Wuhu, China) Ground granulated blast furnace slag (GGBS) obtained from Jiangsu Yong Gang Group Co., Ltd. (Suzhou, China). Admixtures include sodium desulfurized ash, sodium metaaluminate, 6mm polyvinyl alcohol fiber (PVA), ethylene/vinyl acetate copolymer (EVA), and attapulgite (ATm). The particle size distribution curves of critical materials are shown in Figure 1.
In this study, sodium desulfurized ash is used as an activator, sodium metaaluminate is used as an accelerator, PVA is used to enhance the strength of specimens, the addition of EVA strengthens interlayer adhesion and water retention, and ATm can increase buildability. The cement/sand ratio must be maintained within an appropriate range to ensure that the 3D-printed concrete paste can be smoothly extruded without collapse or fracture [21]. Considering the actual printing situation and extrusion ability, the RS used passes through a standard screen with a diameter of 1.18 mm. The X-Ray Fluorescence (XRF) analysis results for GGBS, OPC, and EAFS are shown in Table 1.
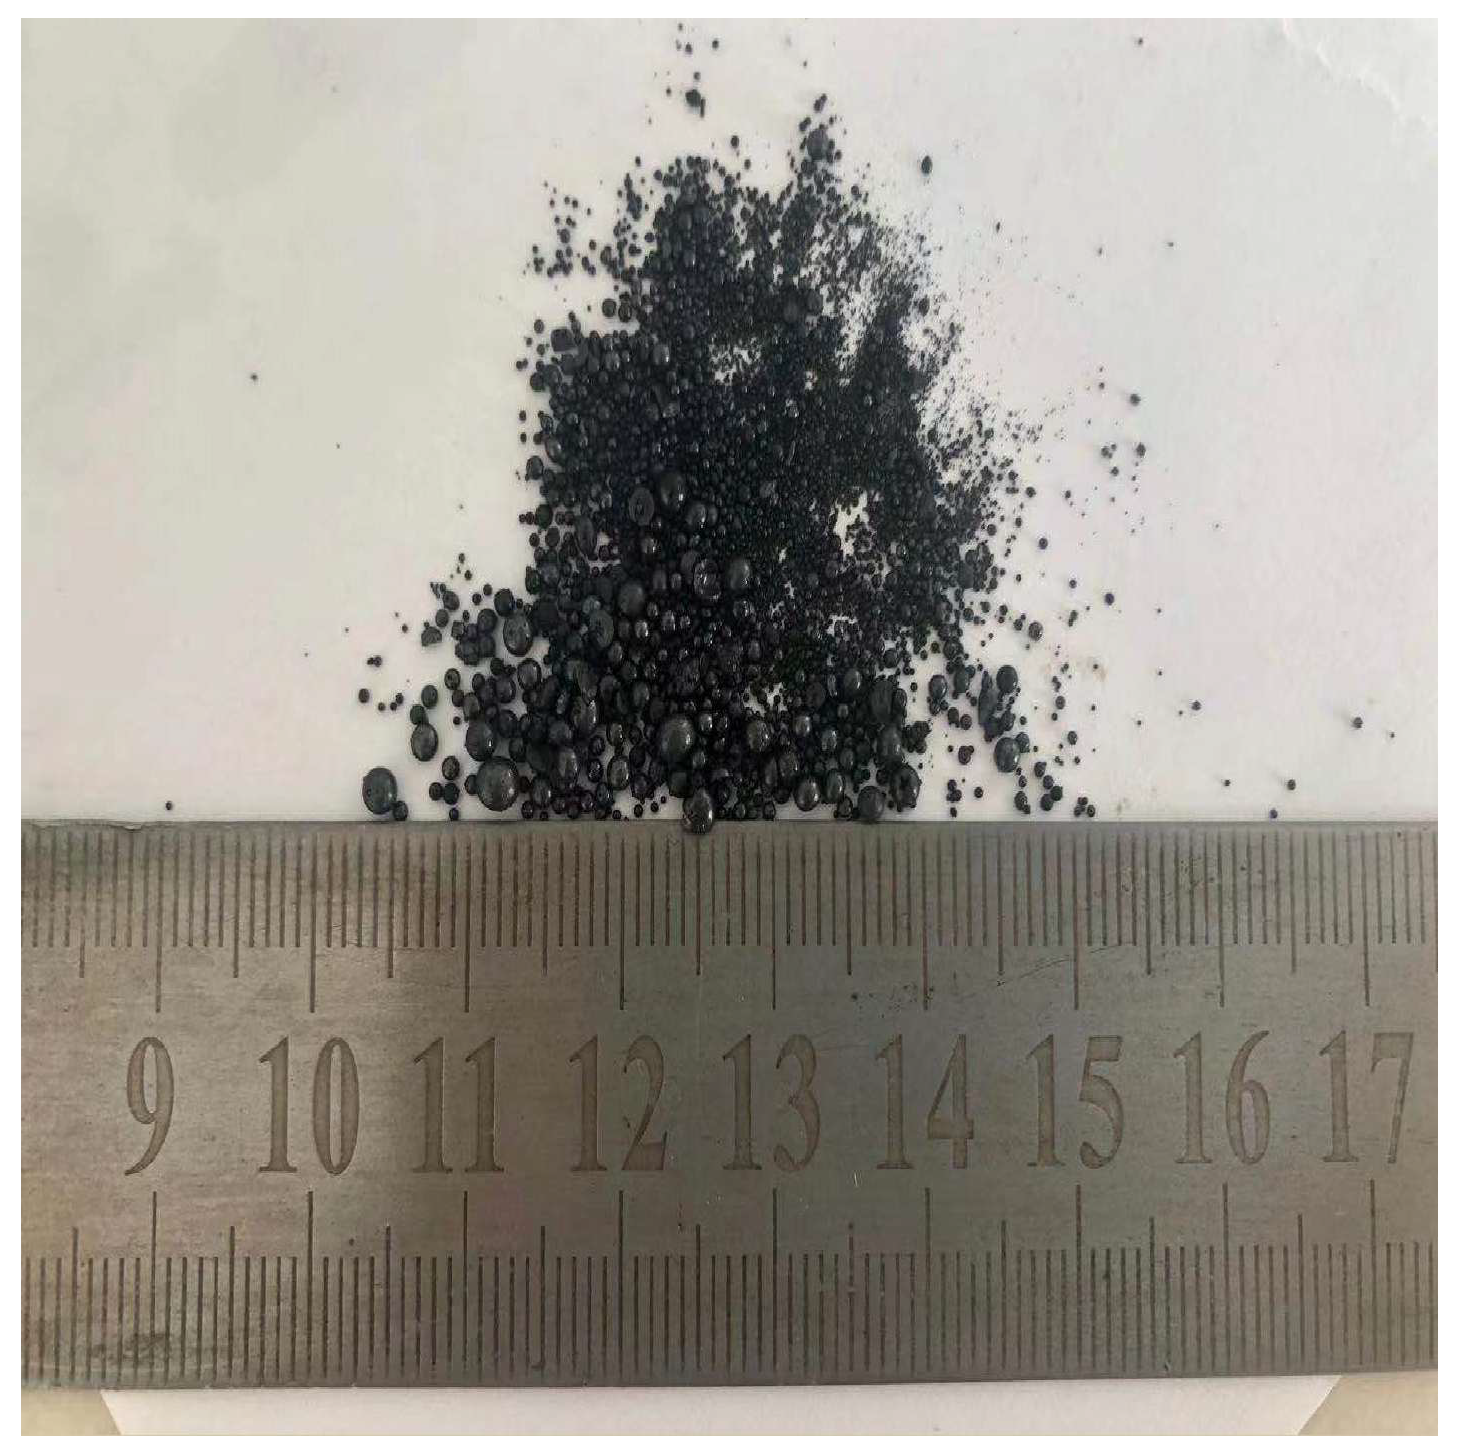
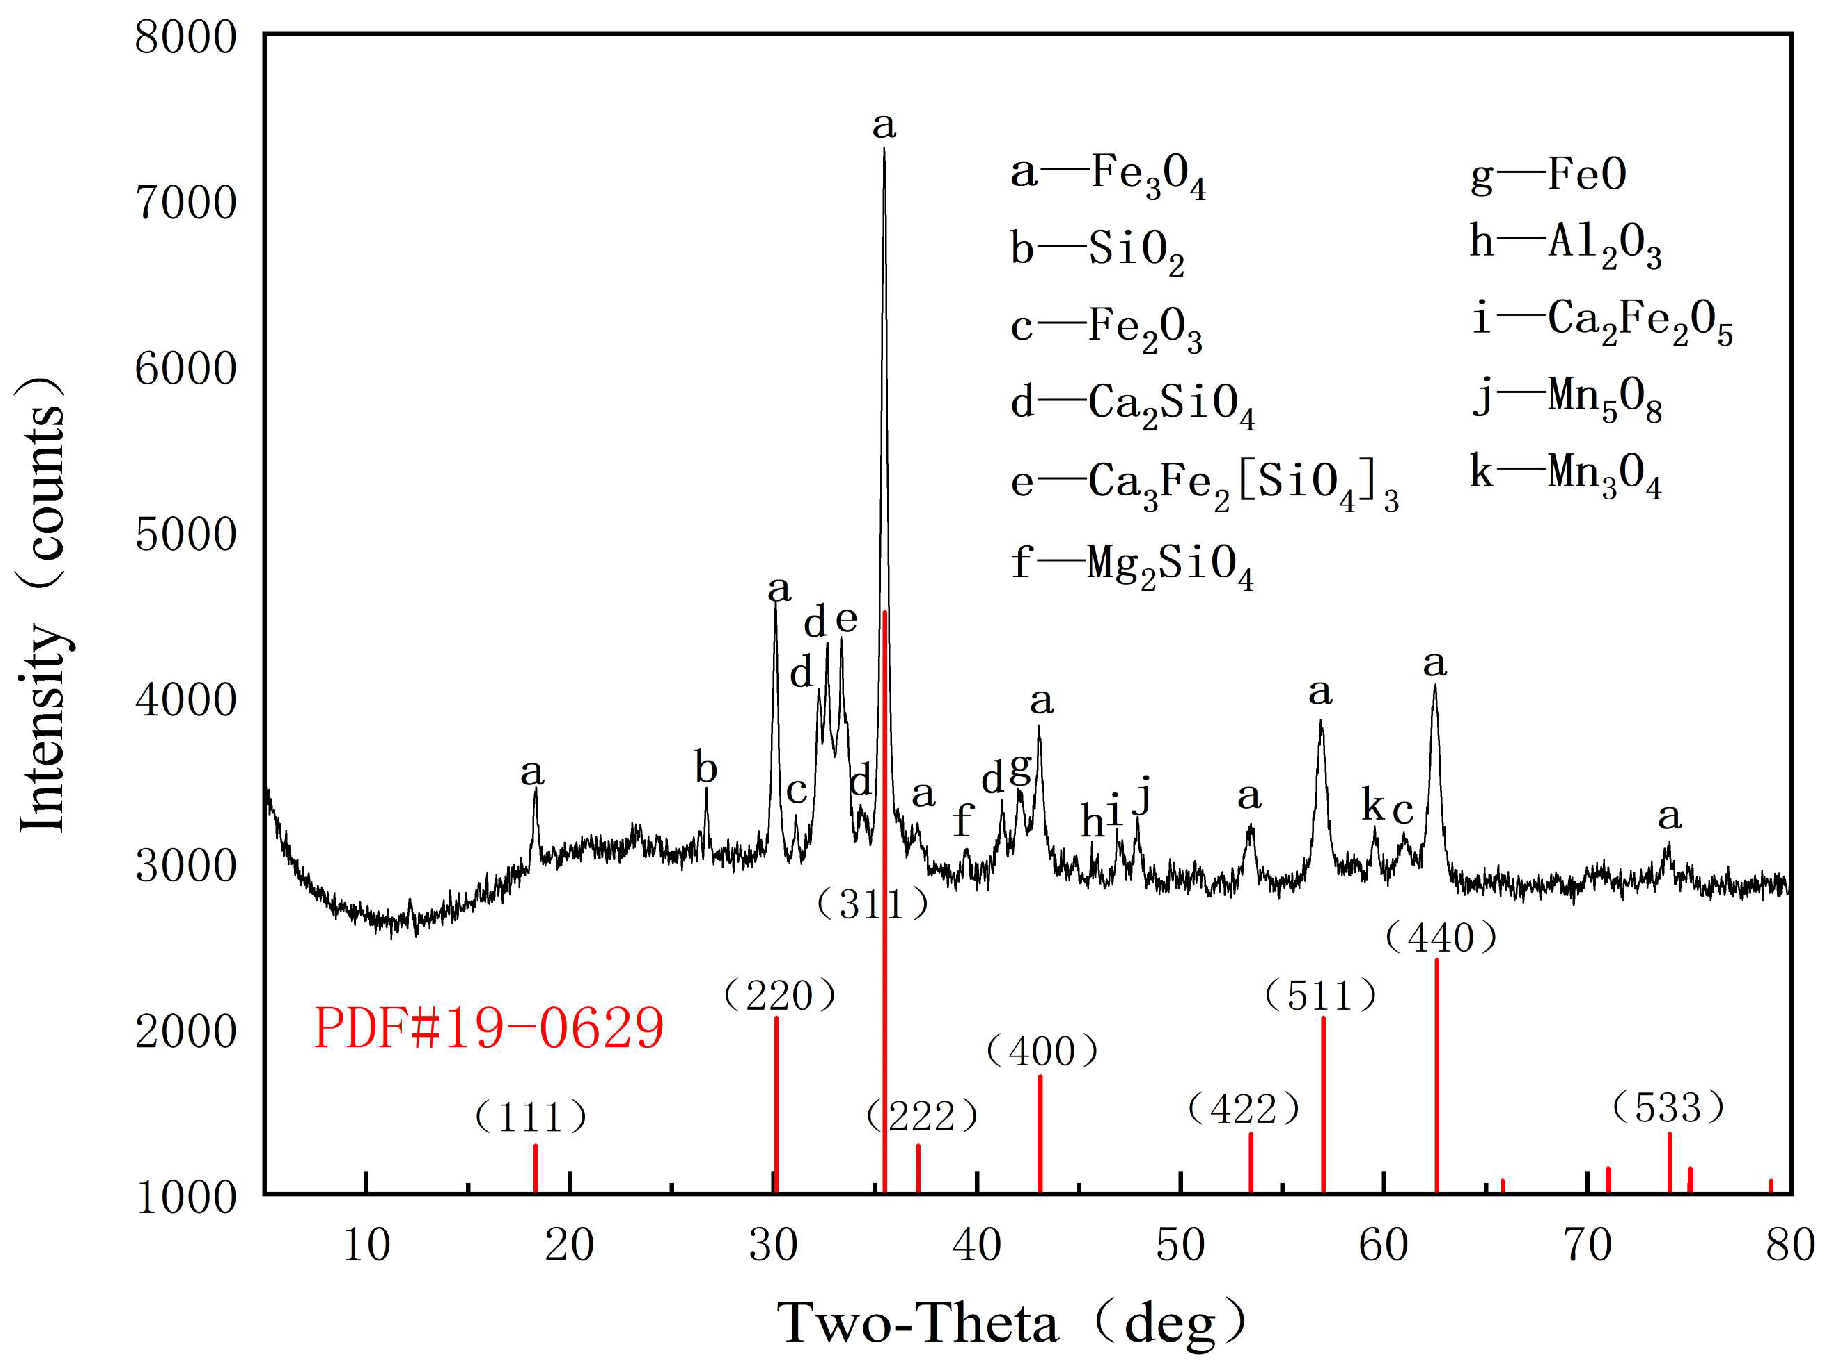
Figure 2 shows the EAFS fine aggregate used in this study. Figure 3 shows the X-ray diffraction (XRD) pattern of EAFS. The experimental group and the control group in this experiment are shown in Table 2. The cement/sand ratio was set to 1:1.1, and the water/cement ratio was set to 0.45. In the mortar mixture, five different proportions of EAFS were selected to replace the RS, with the ratio ranging from 20% to 100% and the gradient being 20%. Table 3 presents the aggregate physical properties of EAFS and RS.

2.2. Preparation of Casting Mold Specimens and 3D-Printed Specimens

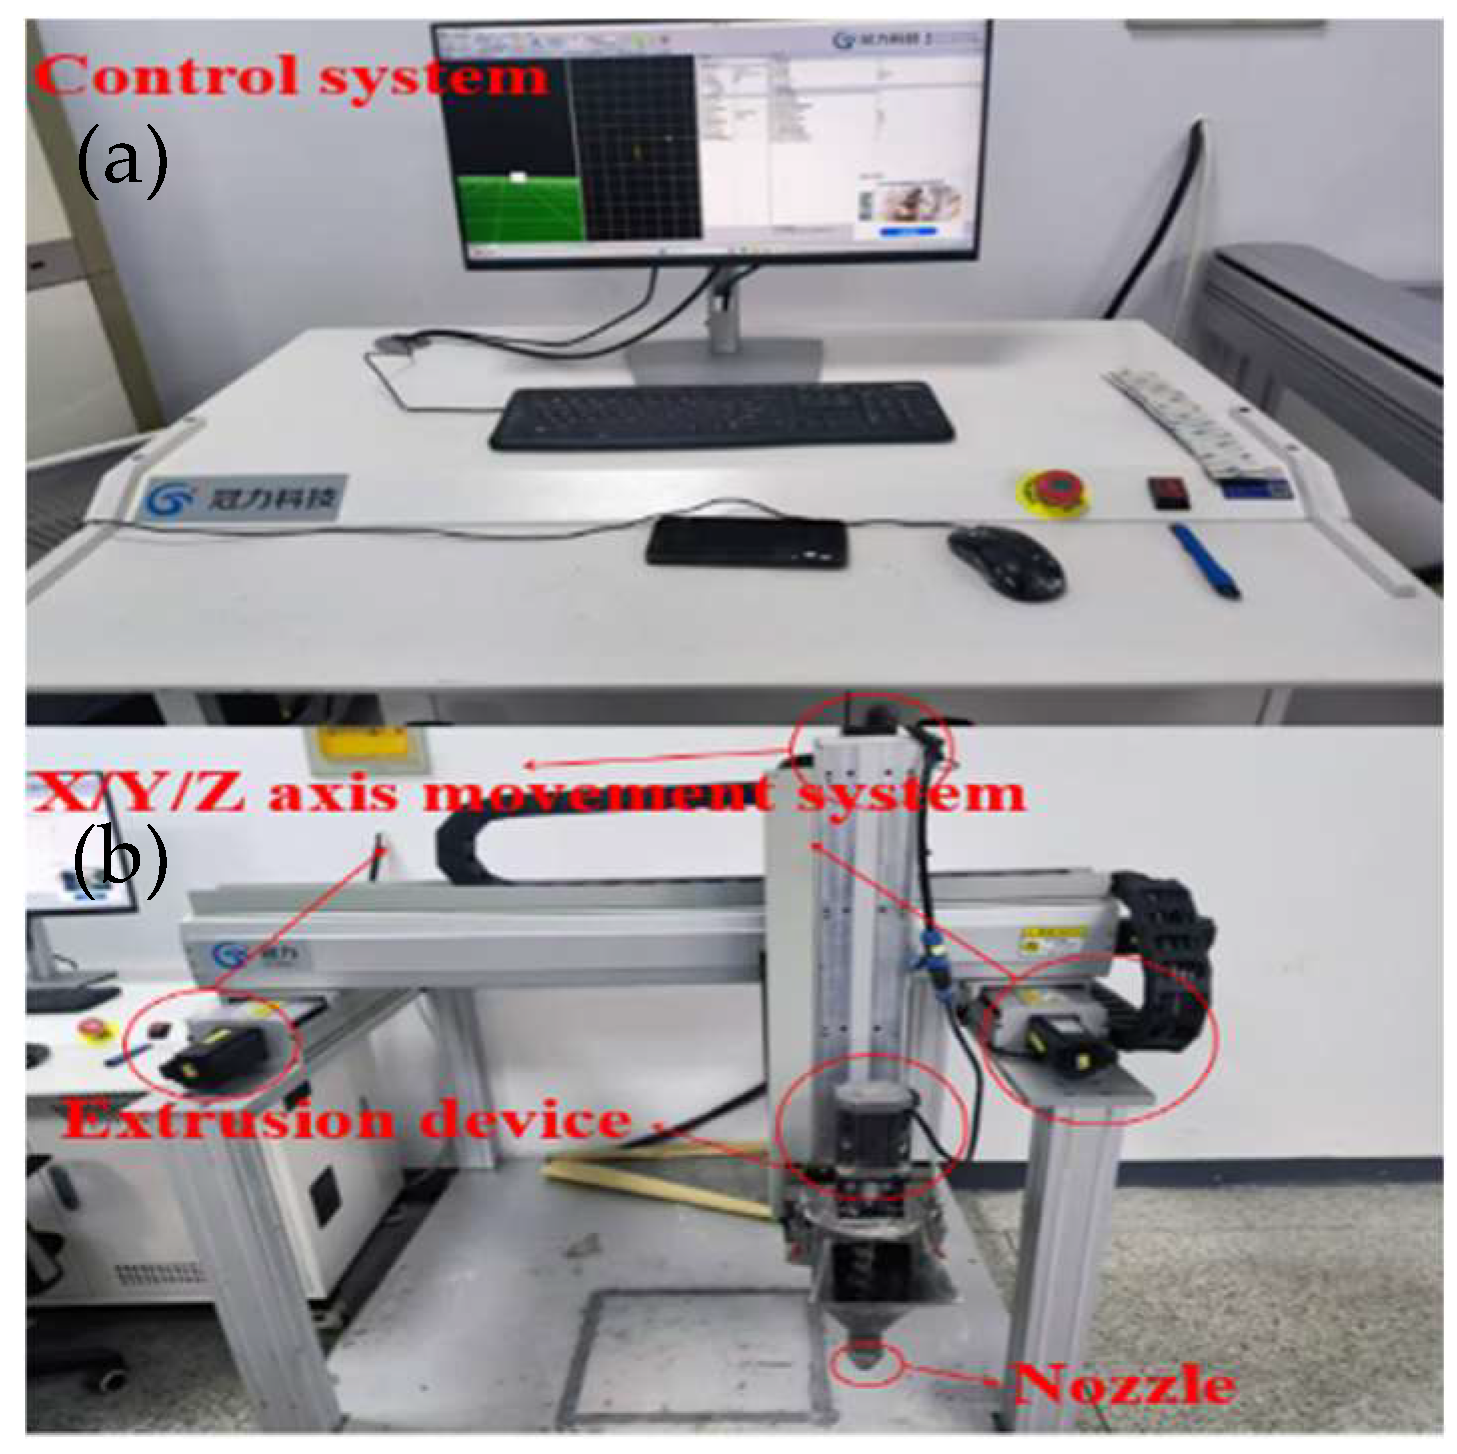
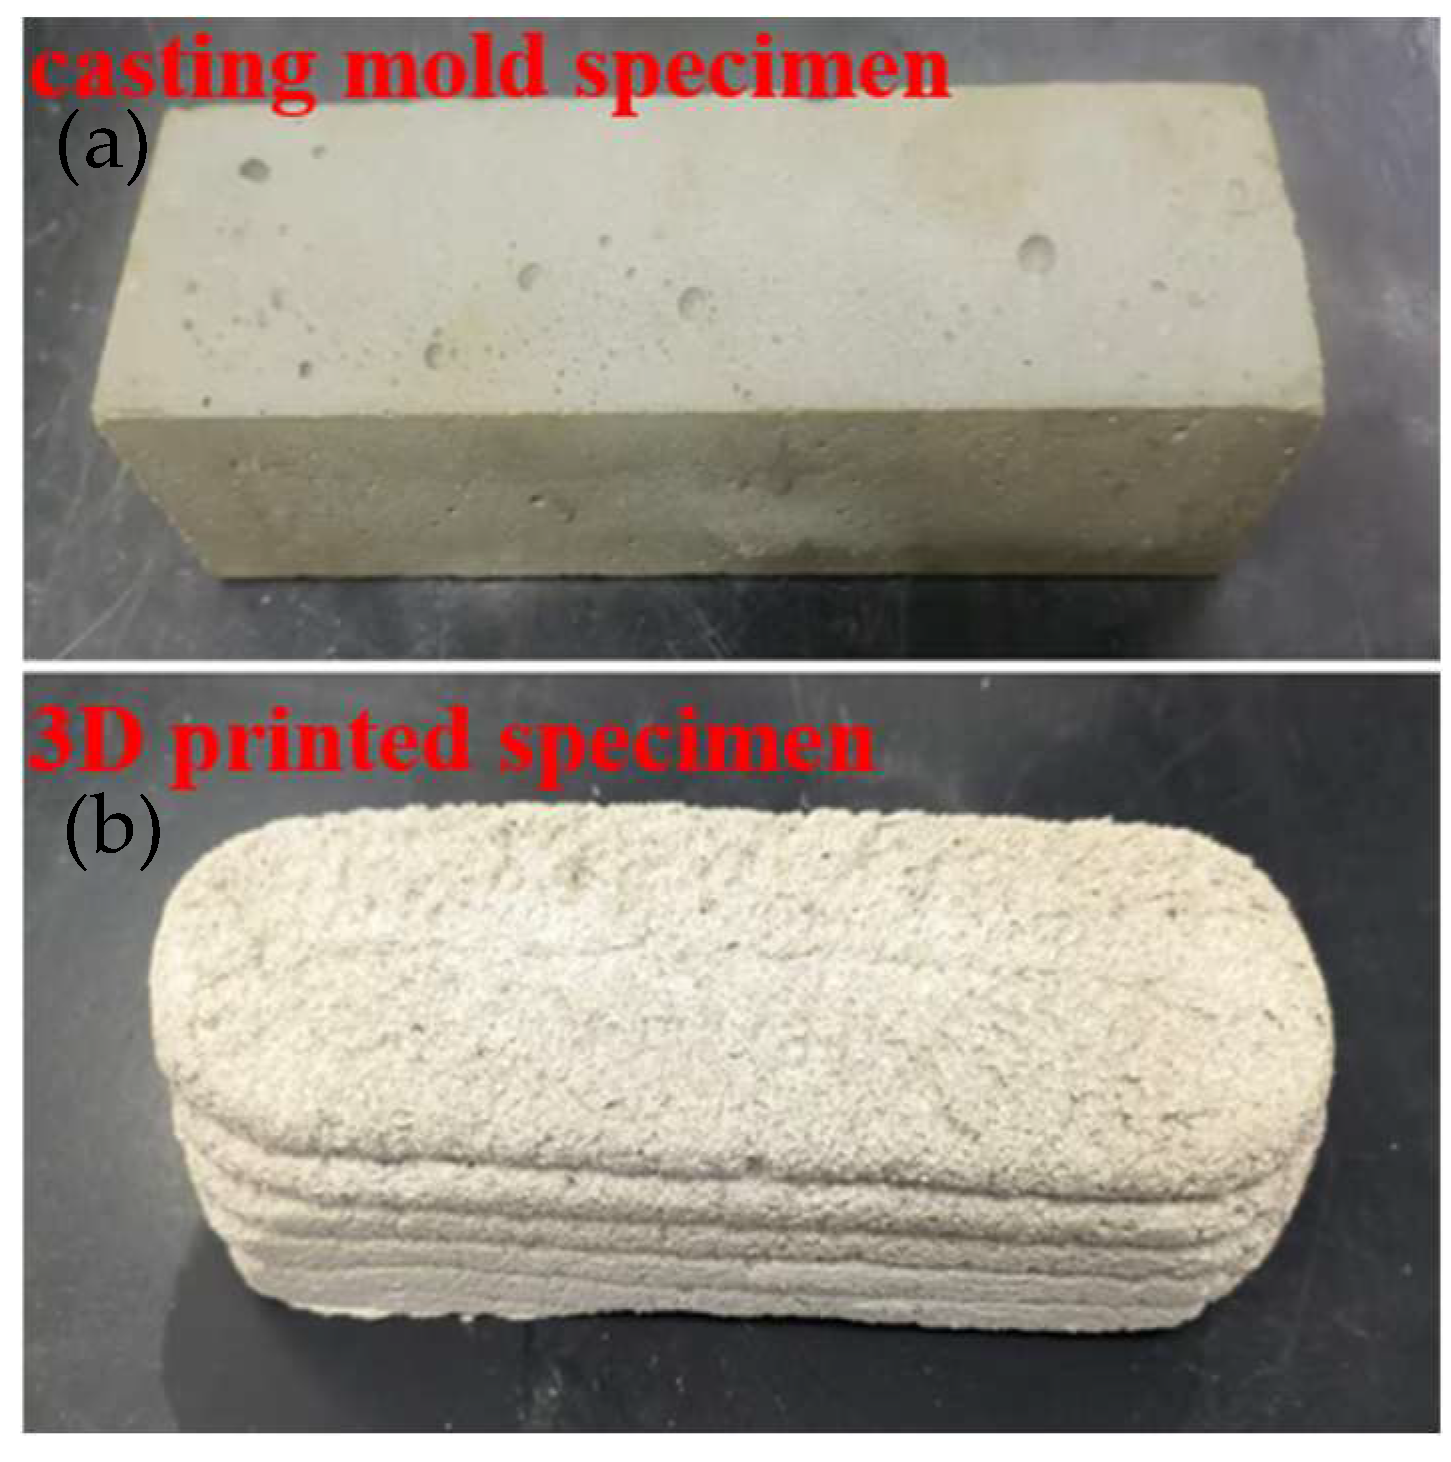
The specific production process of the sample is as follows. First, the fibers and aggregates were weighed and placed into a sealed bag. The bag was manually shaken for 2 min to ensure uniform dispersion of the fibers within the aggregates. Subsequently, the remaining cementitious materials, admixtures, and water were weighed and added to a mortar mixer. The mixture was initially stirred at low speed for 90 s. After 30 s of slow mixing, the pre-mixed fiber–aggregate blend was incorporated into the mixer, followed by high-speed stirring for an additional 120 s. The production of the casting mold specimens was made in a mold of 40 × 40 × 160 mm. Figure 4a,b show a 3D printing system. The printing material was poured into the barrel and compacted to eliminate air voids. Subsequently, the printing origin and parameters were calibrated to ensure consistent extrusion and layer adhesion. During the experiment, the printing speed was fixed at 50 mm/s, the extrusion speed of the extrusion device was fixed at 1 rad/s, and a circular print head with a diameter of 20 mm was used for printing. As shown in Figure 5, the printed specimens were cut into a size of 40 × 40 × 160 mm, which is convenient for comparison with the casting mold specimens (MCs).

2.3. Fresh Properties

2.3.1. Flowability and Mini-Slump

According to the standard ASTM C1437-20 [22], the freshly mixed mortar is loaded into a round table-shaped mold, and then the mold is gently lifted to record the vertical distance from the highest point to the lowest point of the freshly mixed mortar from three angles. Next, record the mean as the mini-slump of the 3D printed concrete. Then, start the jumping table, stop after vibrating 25 times on the jumping table, record the expanded diameter of the freshly mixed mortar in the two vertical directions, and record the average value to calculate the fluidity of the 3D-printed concrete.

2.3.2. Apparent Viscosity

Apparent viscosity reflects the deformation capacity of printing materials under shear action and primarily influences the print quality. By controlling the EAFS replacement ratio (0–100%), this study analyzes the change in apparent viscosity, with print quality as the direct evaluation index. This method aligns with the conventional logic in existing studies of inferring the rationality of rheological properties from macroscopic printing performance [23,24,25].

2.4. Constructability

In the 3D printing experiment of concrete, the constructability of the printed mortar was evaluated by printing the total layer height change and the width change. The stirred mortar is injected into the storage barrel, and under the action of external force, the mortar is continuously and evenly extruded through the nozzle. The printed sample is folded to 20 layers, and the height and width of the printed strip are recorded.

2.5. Freeze–Thaw Resistance

The test adopted the rapid freezing method with reference to GB/T 50082-2024 [26]. After curing for 24 days, the printed specimens were soaked in water at 20 °C for 4 days until saturated. The surface moisture of the specimen is dried with a rag, and the initial mass of the specimen is recorded as m0 after the water is saturated. The temperature of the sample decreases from 6 °C to −18 °C and then rises to 6 °C for a cycle. Each freeze–thaw cycle is specified to be completed within 4 h, and the mass loss and mechanical property change in the specimen are measured every 50 freeze–thaw cycles. If the mass loss of the specimen is more than 5% or the compressive strength is less than 75%, the specimen is considered to be broken. The formula for calculating the strength loss rate is as follows:
Δ f i = f 0 f i f 0 × 100 %
where ∆fi is the mechanical property rate after i freeze–thaw cycles and f0 is the mechanical property of the specimen before the freeze–thaw test.

2.5.1. Compressive Strength (Before and After Freeze–Thaw)

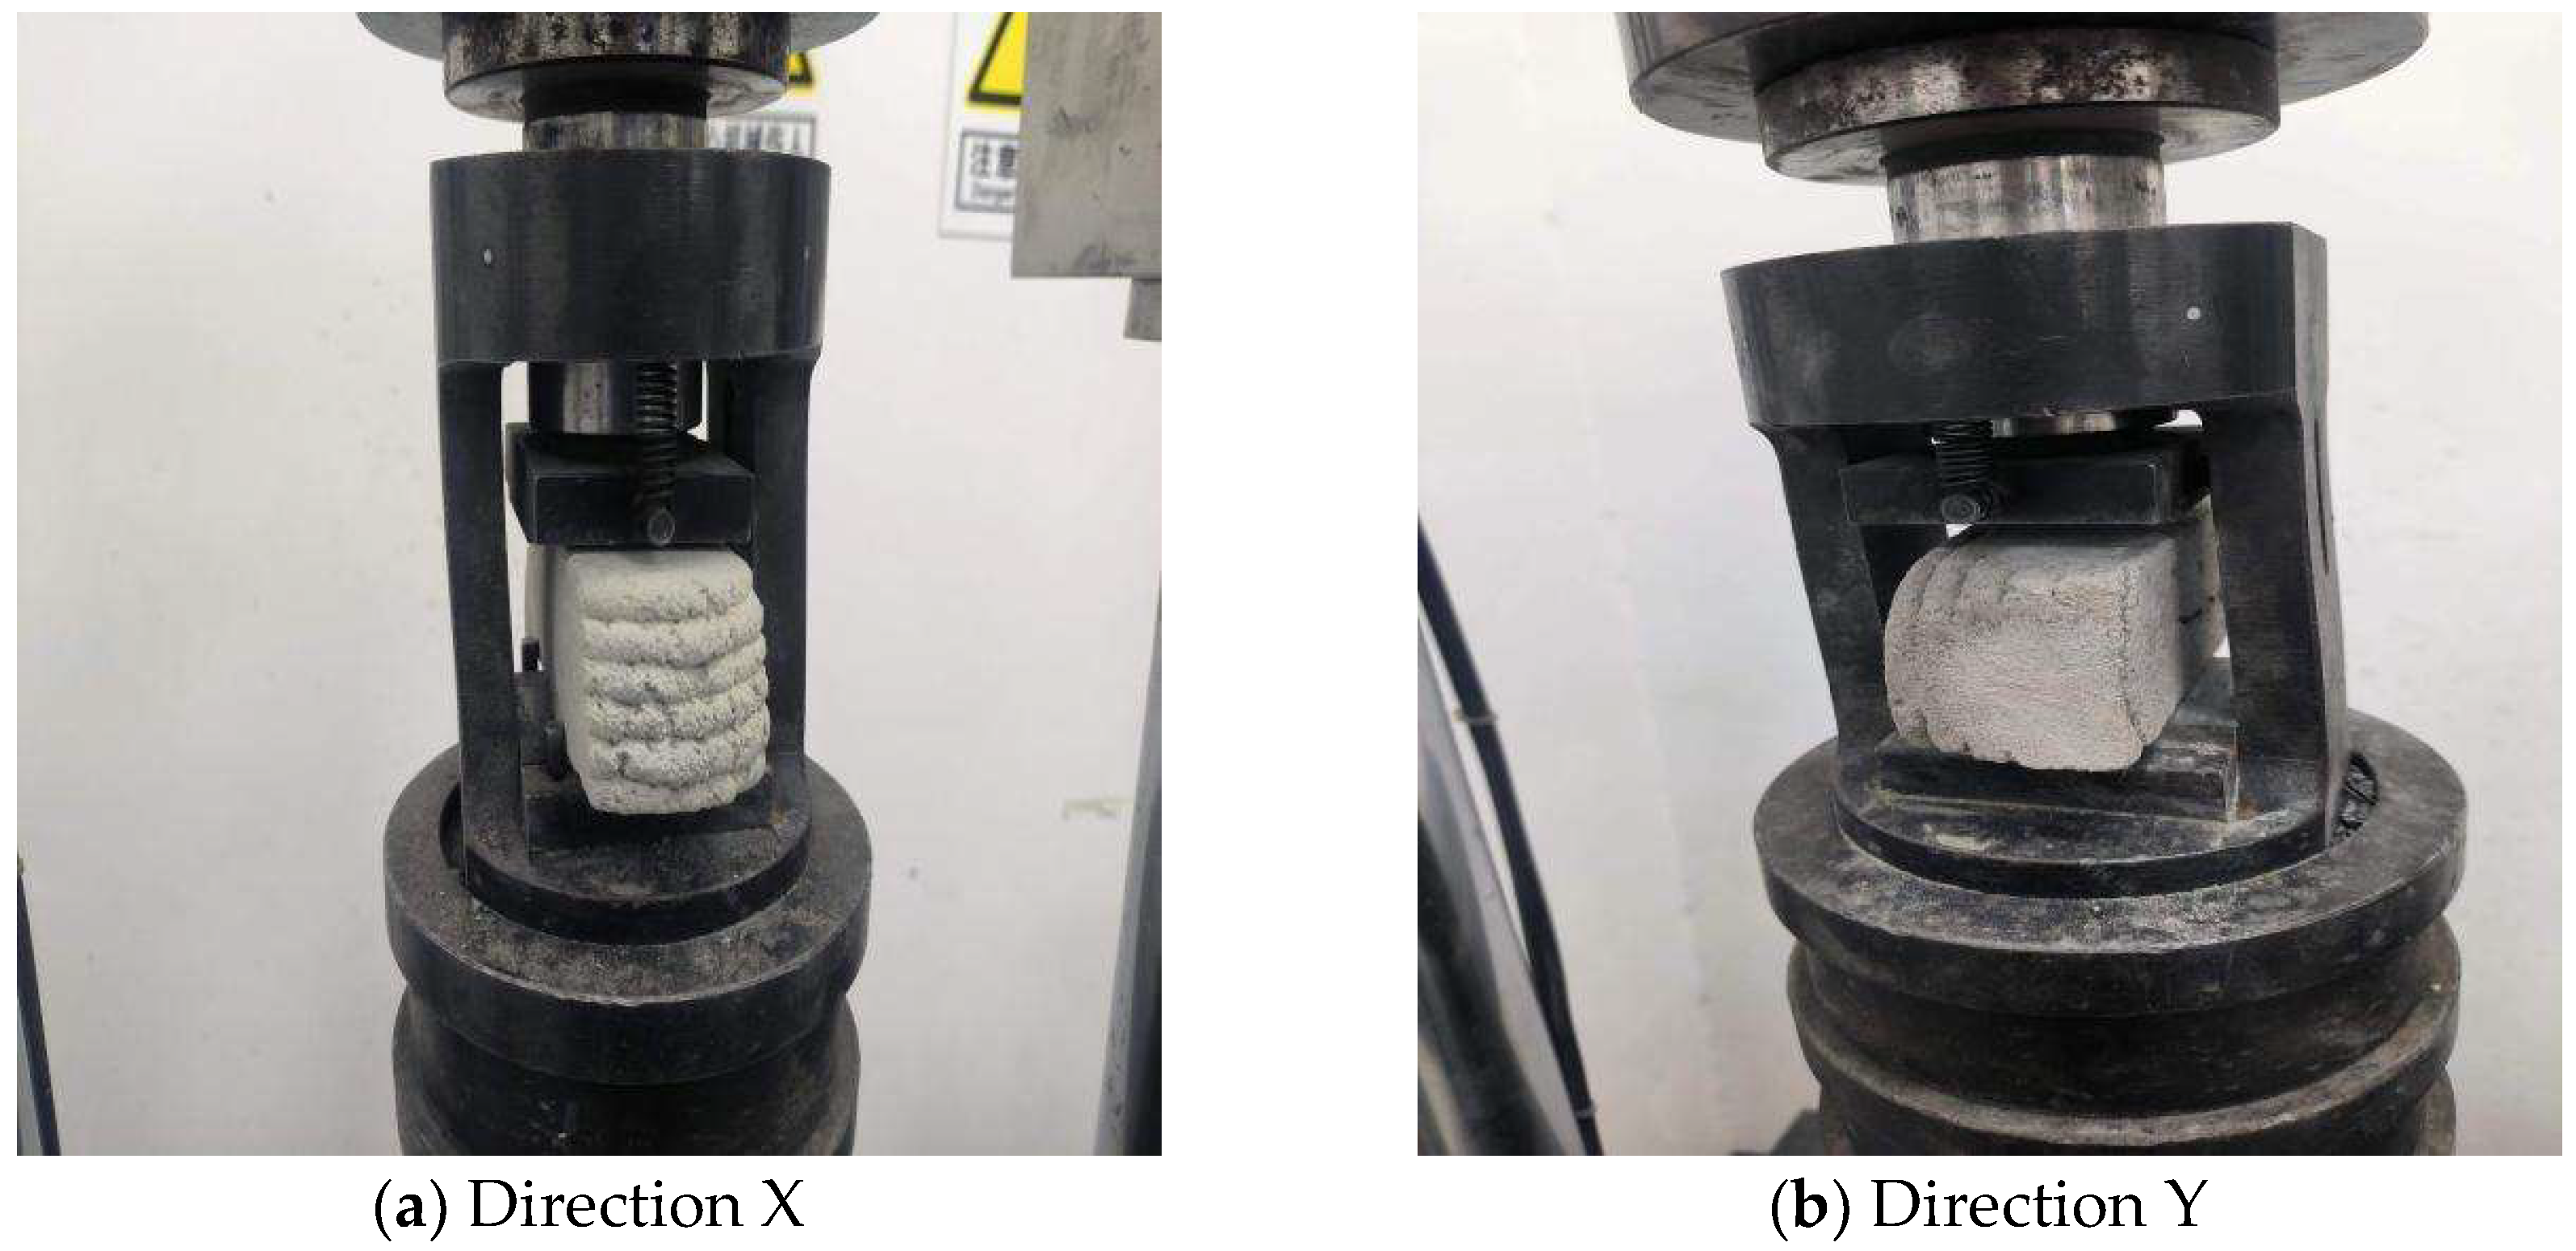
The effect of EAFS on the mechanical properties and frost resistance of 3DPC specimens was determined by testing the compressive strength of 3DPC with different EAFS replacement ratios after 28 days of curing and after freeze–thaw cycles. As shown in Figure 6a,b, the solidified specimens were cut into 40 mm × 40 mm × 160 mm and tested in accordance with EN 196-1 [27]. These specimens were cured to the corresponding age in an environment with a temperature of 20 °C and a relative humidity of 95%, with 4 specimens in each group.

2.5.2. Flexural Strength (Before and After Freeze–Thaw)

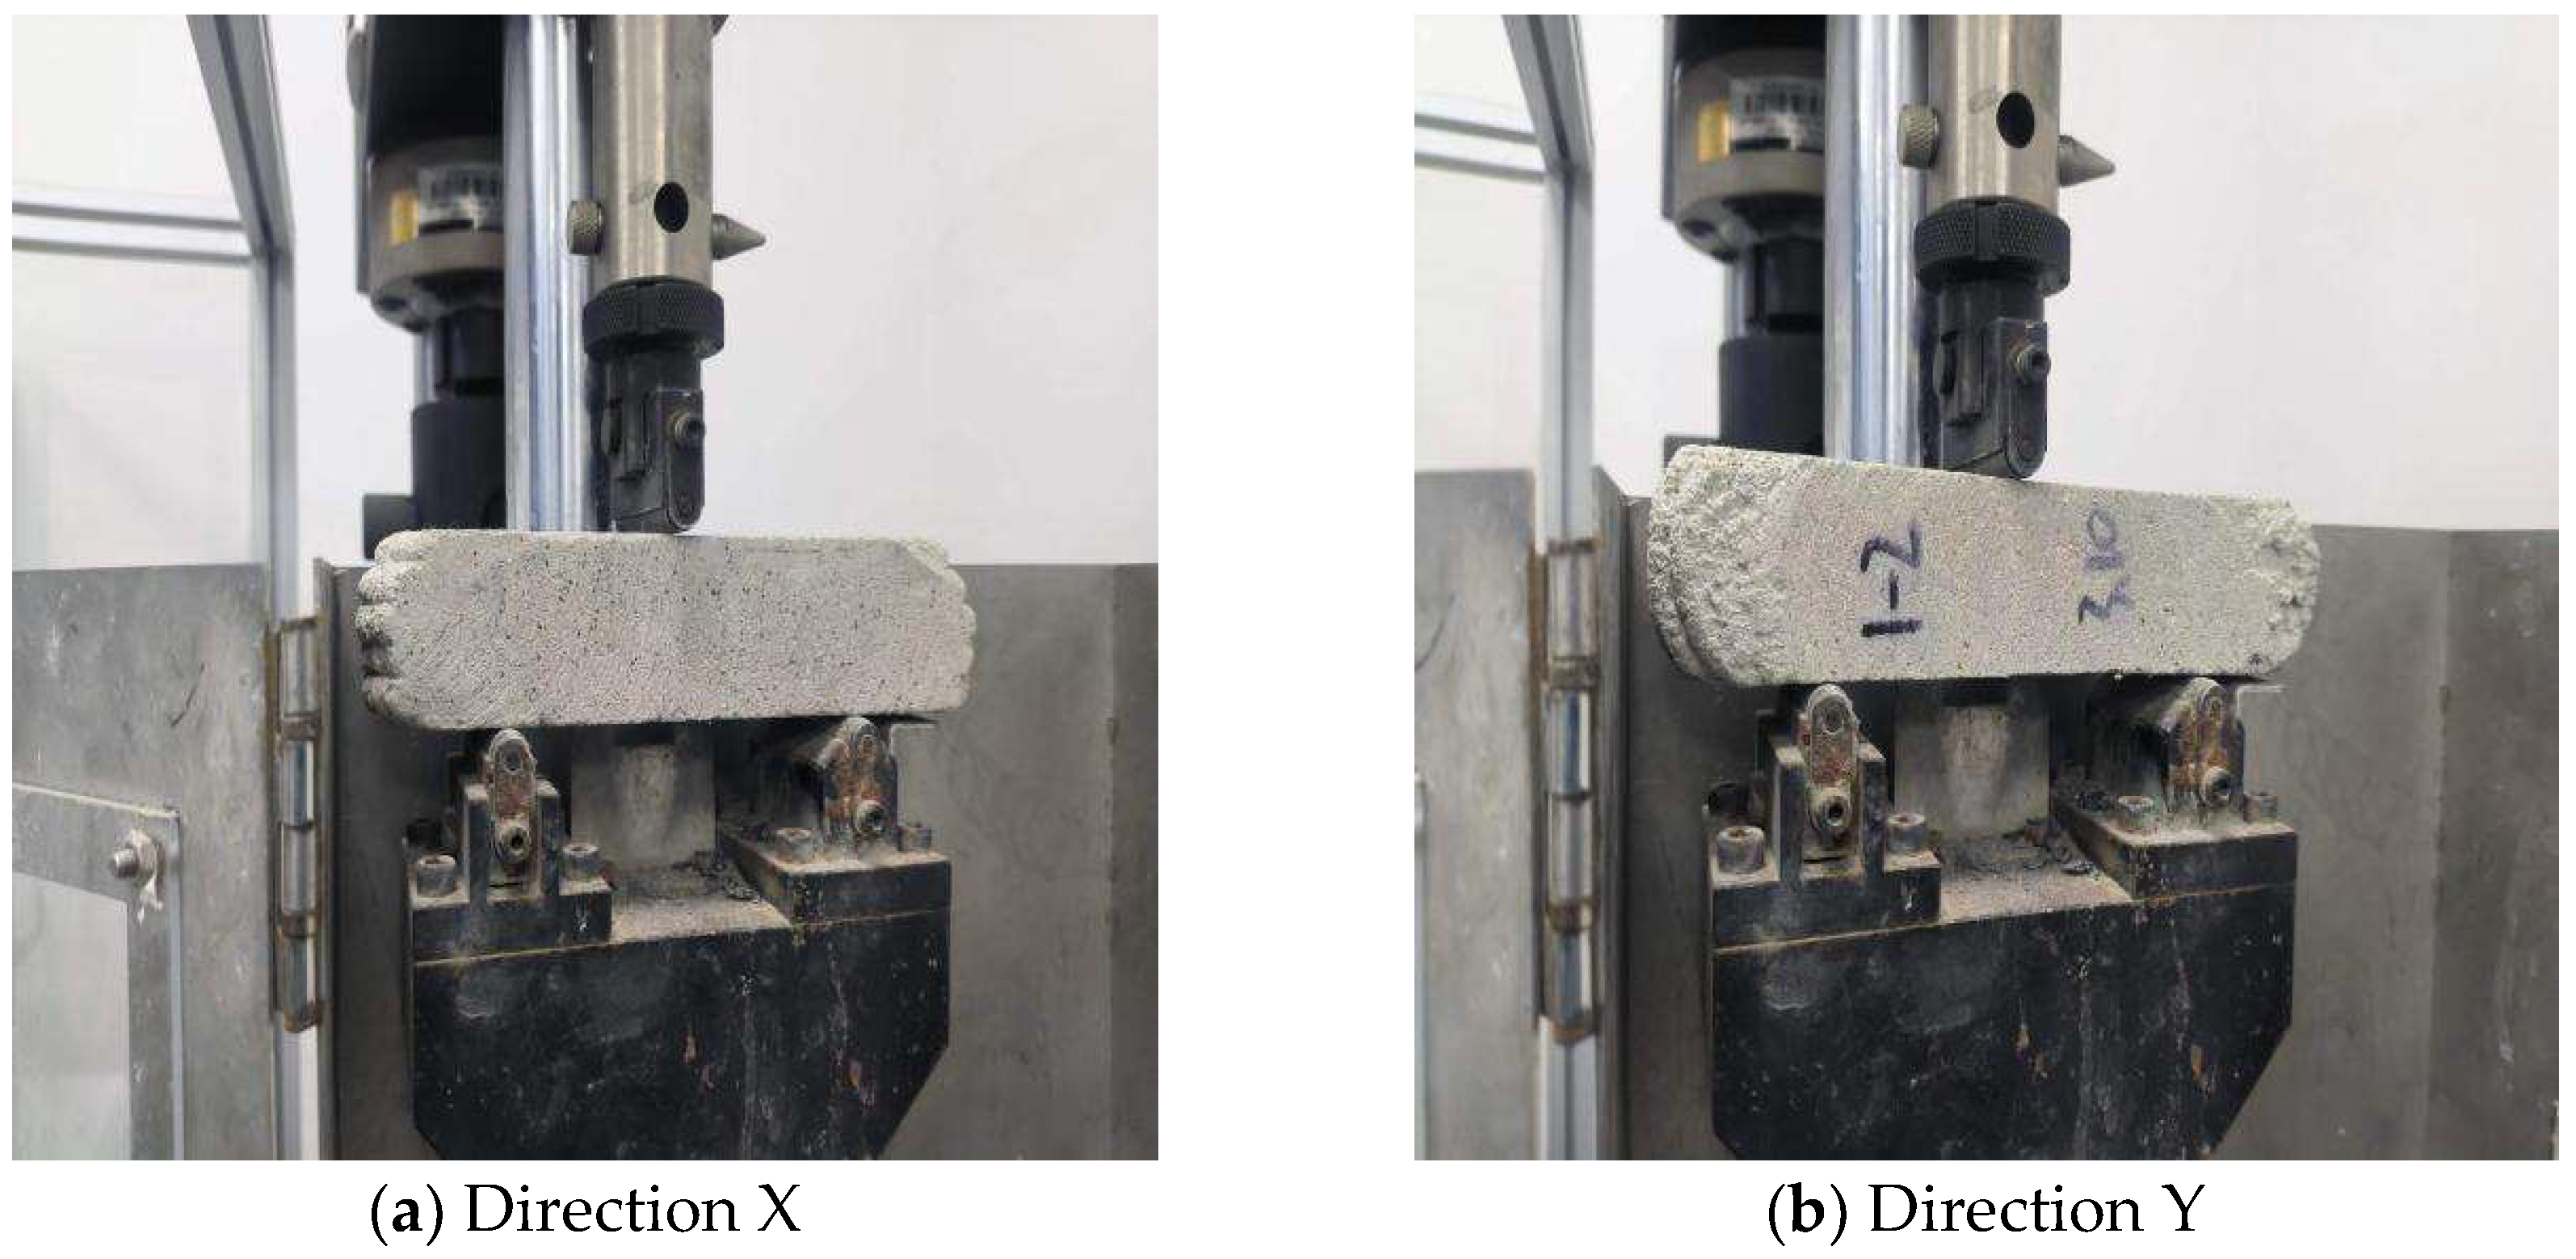
As shown in Figure 7a,b, similar to the compressive strength test, 3DPC specimens with different EAFS replacement ratios that had cured to the corresponding ages were cut into dimensions of 40 mm × 40 mm × 160 mm according to EN 196-1 [27]. Each group of specimens was tested three times, and the average value was calculated.

2.5.3. Mass Loss Rate

The formula for calculating the mass loss rate of the mortar specimen after freezing and thawing is as follows:
Δ m i = m 0 m i m 0 × 100 %
where ∆mi is the mass loss rate after i freeze–thaw cycles, m0 is the initial mass of the specimen before the freeze–thaw test, and mi is the mass of the specimen after i freeze–thaw cycles. For each group, test the mass loss of three specimens and determine the average value.

2.6. Interface Transition Zone (ITZ)

The ITZ structure is a weak area between coarse or fine aggregate and cement matrix, occupying a part of the pore volume, which affects the compactness and mechanical properties of mortar. A scanning electron microscope (JEOL, JSM-5900, Akishima, Japan) was used to observe the microstructure of the EAFS mortar with respect to the ITZ after 28 days of curing and after the freeze–thaw cycles.

2.7. Pore Structure Analysis

The change in porosity of 3DPC with EAFS replacement ratios is measured by MIP. About 2 g of samples were taken and placed in a 60° drying box for 4 h. Then, cool to room temperature and place in the vacuum tube; set the upper pressure to 30,000 PSIA. Mercury liquid intrudes into the pores of the sample by pressure, and the intrusion volume represents the pore volume of the corresponding pores.

3. Results and Discussion

3.1. Fresh Properties

3.1.1. Flowability and Mini-Slump

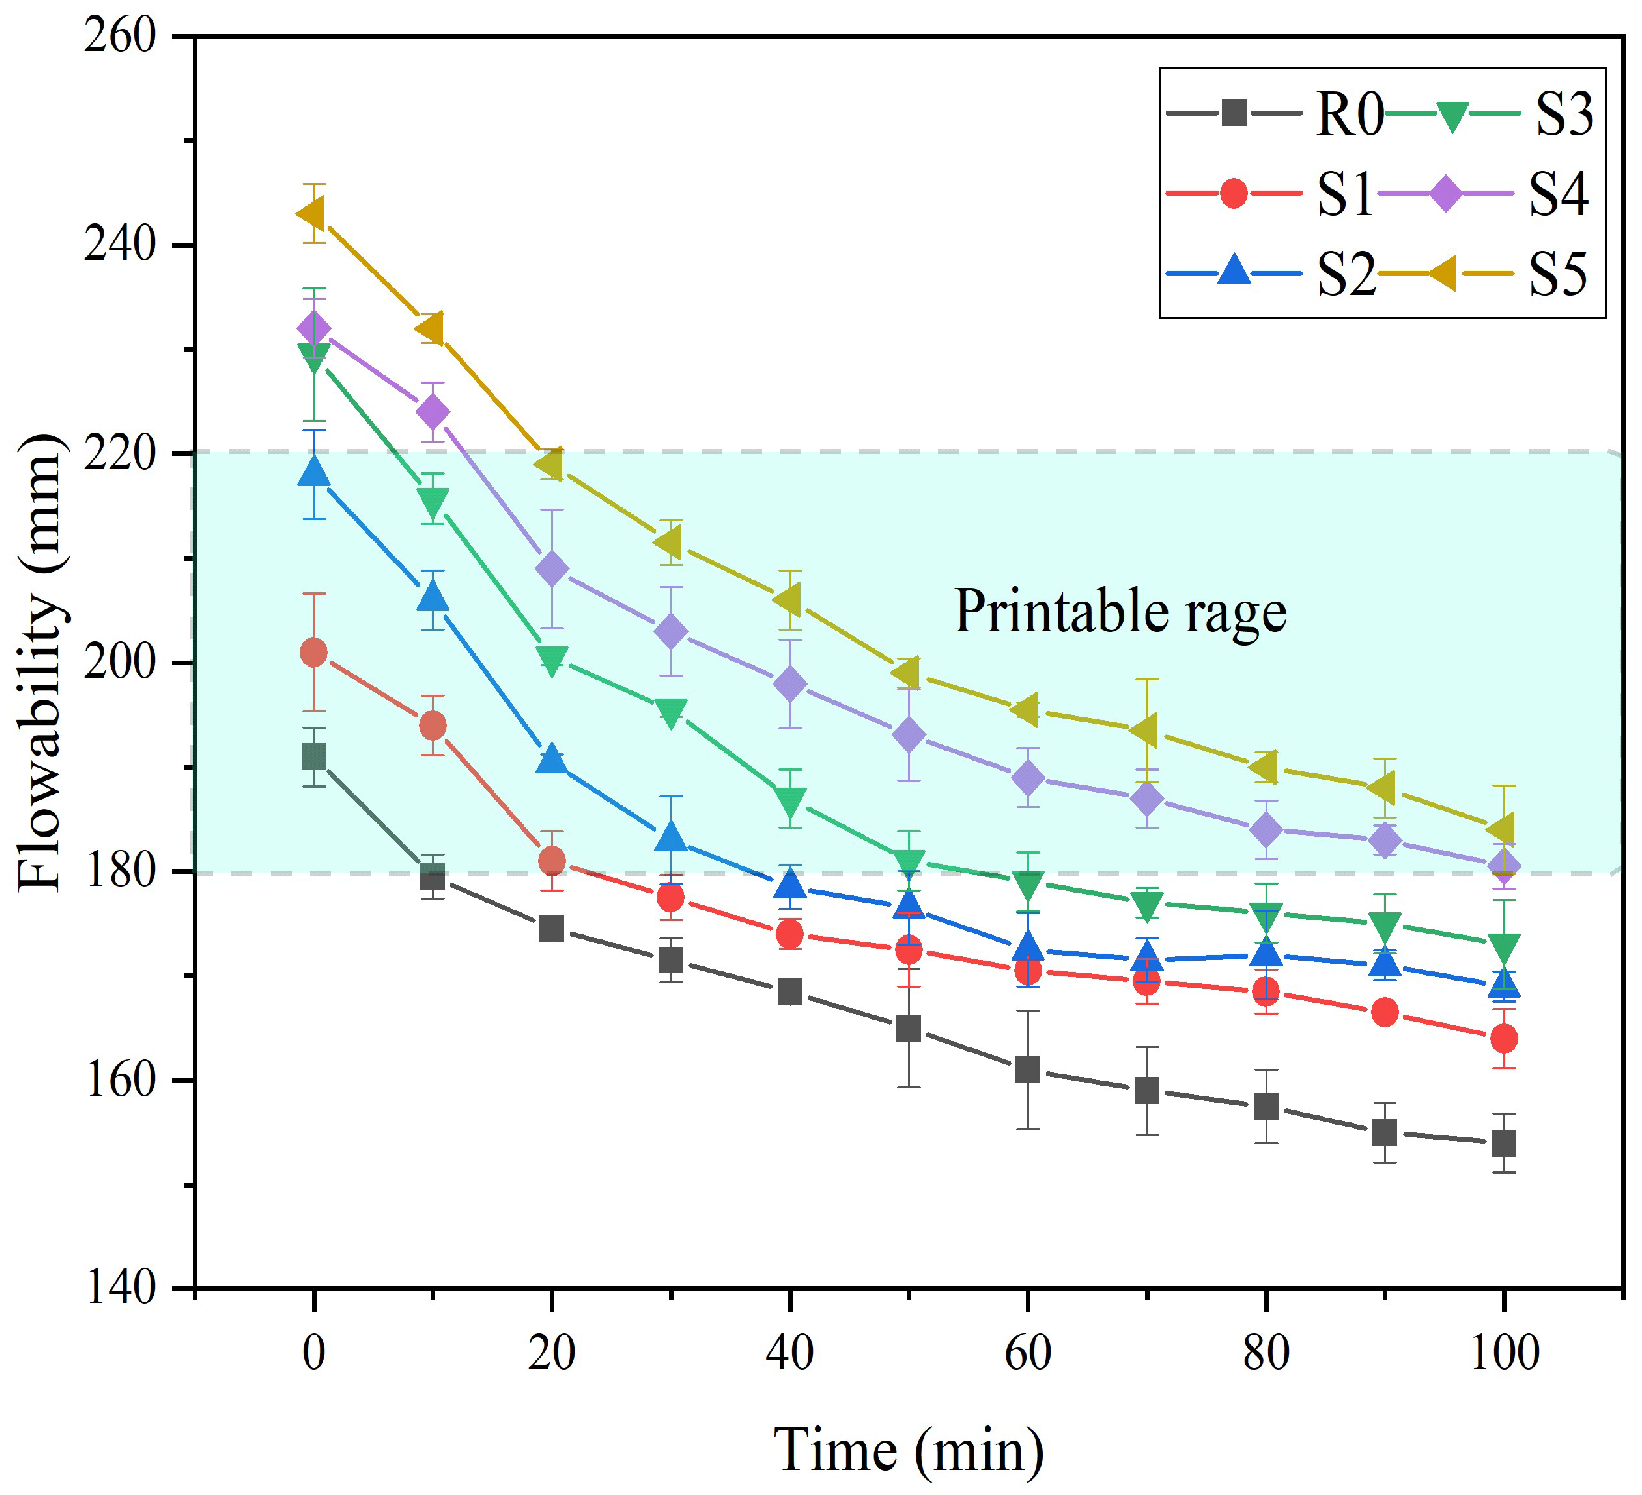
As shown in Figure 8, with the increase in the replacement ratio of EAFS to RS, the initial flowability of the printing ink exhibits an overall upward trend. Group R0 (100%RS) had a 10 min printing window. As the EAFS replacement ratio increases, the printing window of group S1 is twice that of group R0. Groups S4 and S5 have the longest printing windows, both exceeding 60 min. Notably, all groups maintained printing-required flowability within their printing windows, ensuring feasible continuous printing. The underlying reason lies in the ball-rolling effect of EAFS [18]. Unlike RS, which has irregular edges and corners, EAFS particles feature a more rounded morphology. This structural characteristic can effectively reduce the frictional resistance between the cementitious material and the aggregate during the flow process [28]. Although the flowability of all test groups shows a cumulative decreasing trend over time, the increase in EAFS replacement ratio significantly extends the overall printing window of the printing ink.
Figure 9 shows the mini-slump variation of the printing ink. With the increase in the EAFS replacement ratio, the mini-slump of the printing ink gradually increases. Groups R0, S1, and S2 exhibited both initial mini-slump and mini-slump over time within 10 mm, meeting the requirement. In contrast, the initial mini-slumps of groups S3, S4, and S5 were all greater than 10 mm, and they met the mini-slump requirement after 50, 60, and 70 min, respectively. The core mechanism lies in the differences in particle characteristics between EAFS and RS. On the one hand, EAFS particles have a rounded morphology, and their specific surface area is significantly smaller than that of RS with irregular edges and corners, which results in less adsorption of cement paste and provides more space for paste flow [29]. On the other hand, consistent with the reason for the improvement of flowability mentioned earlier, the ball-rolling effect of EAFS further weakens the anti-flow constraint of the paste. Groups S3, S4, and S5 had an initial mini-slump greater than 10 mm due to their high initial free paste content. With the passage of time, the continuous generation of hydration products significantly increases the paste viscosity and flow resistance, thereby gradually reducing the mini-slump [30].

3.1.2. Apparent Viscosity

As shown in Figure 10a, group R0 had excessively high apparent viscosity, leading to rough, discontinuous printed strip edges and compromised specimen quality. In contrast, the group in Figure 10b had lower viscosity than R0 but still showed rough, cracked strip surfaces. It showed insufficient viscosity reduction for optimal print morphology. The group in Figure 10c had printed strips with continuous, smooth edges, marking improved print quality. Collectively, these results confirm that EAFS can regulate and optimize ink apparent viscosity, thereby enhancing the material’s printability and printed component structural integrity.

3.2. Constructability

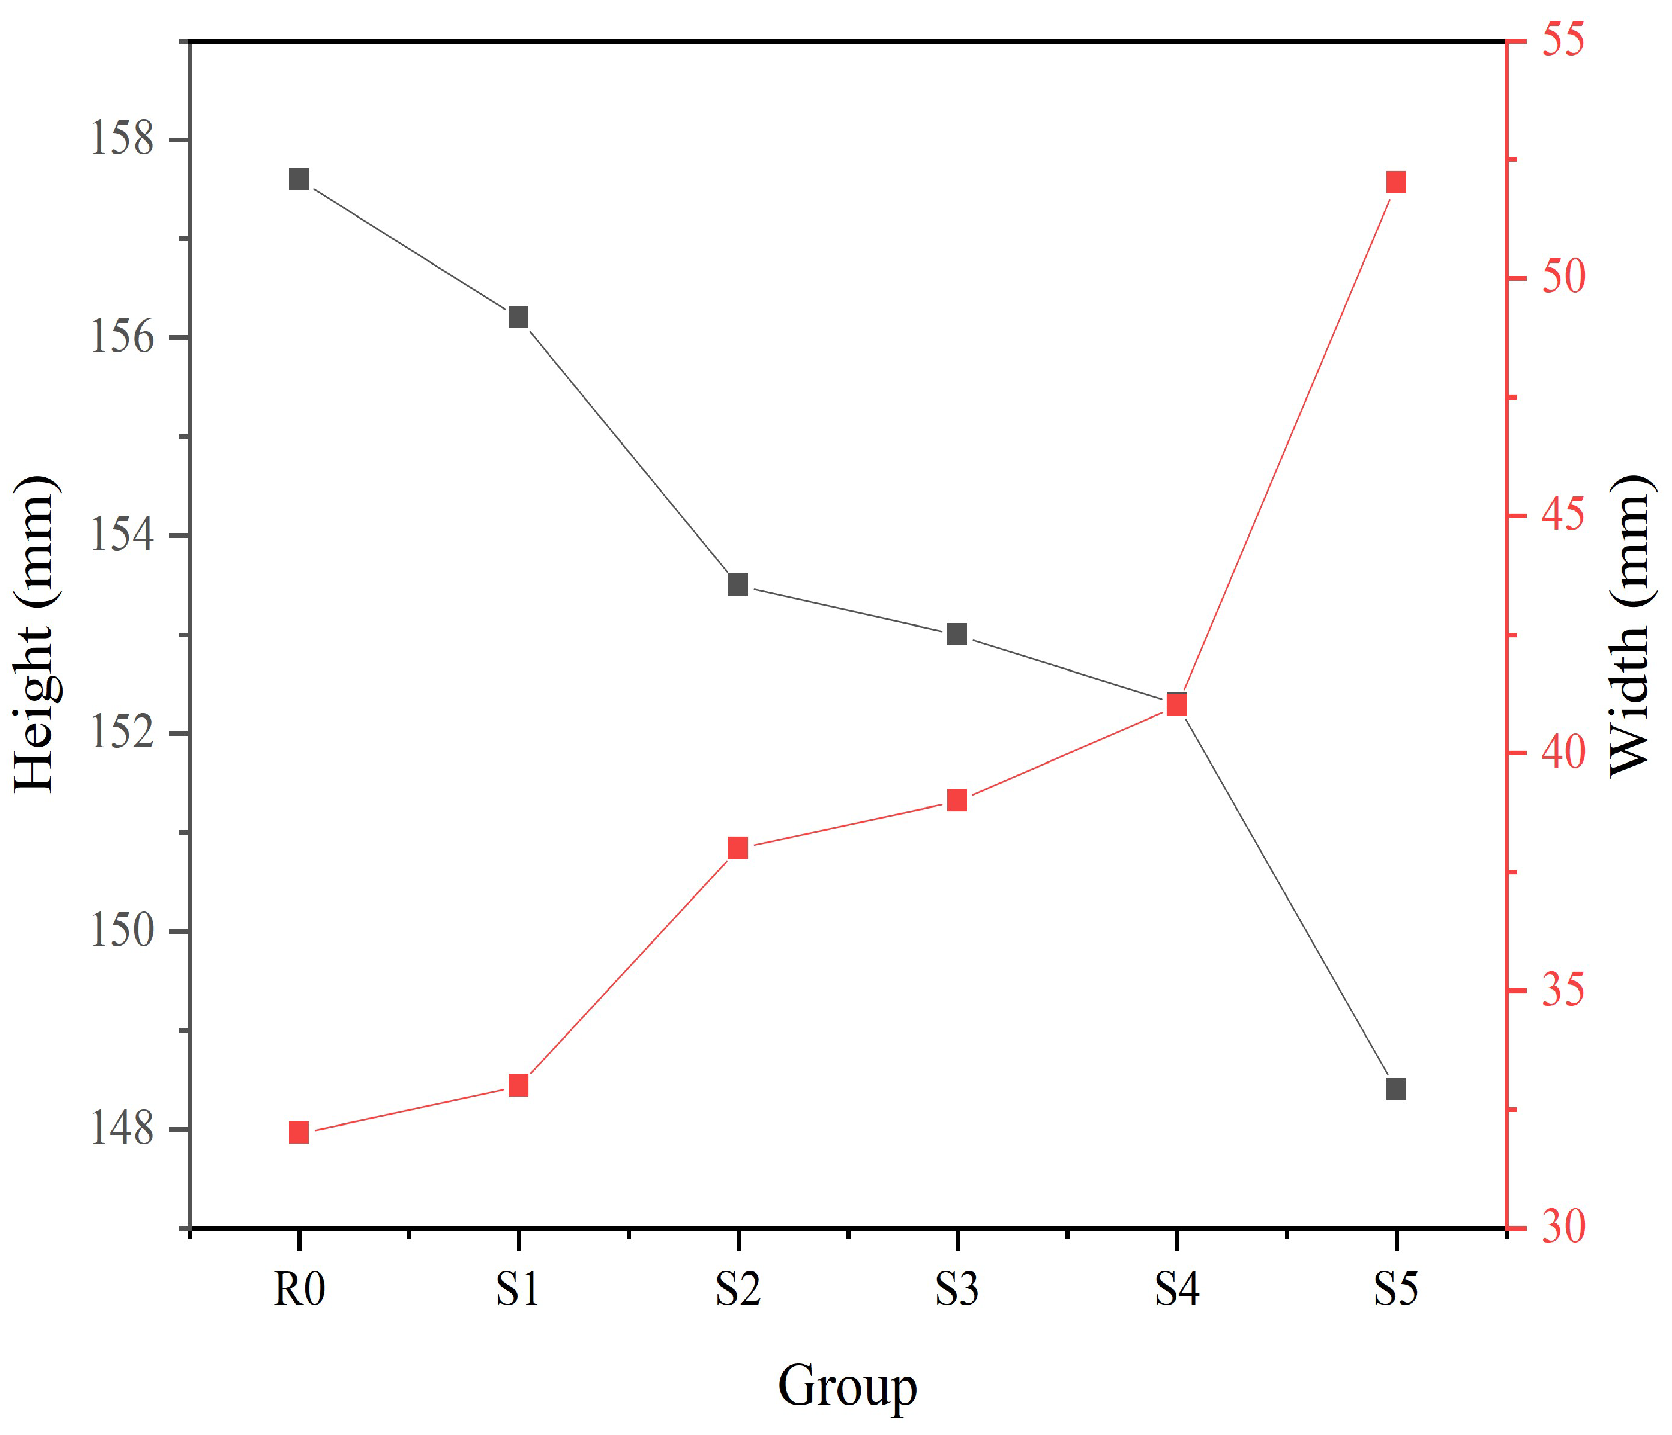
As shown in Figure 11, the actual construction height of printed specimens decreases with increasing the EAFS replacement ratio. Compared with group R0, groups with increasing EAFS replacement ratios showed a construction height reduction of 0.89%, 2.60%, 2.91%, 3.36%, and 5.83%, respectively. Their printed strip widths increased by 3.12%, 18.75%, 21.87%, 28.12%, and 62.5%. It is found that the maximum feasible EAFS replacement ratio in 3DPC is 80%. Complete replacement (100% EAFS) significantly impairs the paste’s shape retention capacity, thereby severely undermining constructability. The test results align with EAFS’s higher density, as shown in Table 3, and ball-rolling effect, whose regulatory effects on paste self-weight and flow constraint explain the correlation between constructability, fluidity, and apparent viscosity.

3.3. Freeze–Thaw Resistance

3.3.1. Compressive Strength (Before and After Freeze–Thaw)

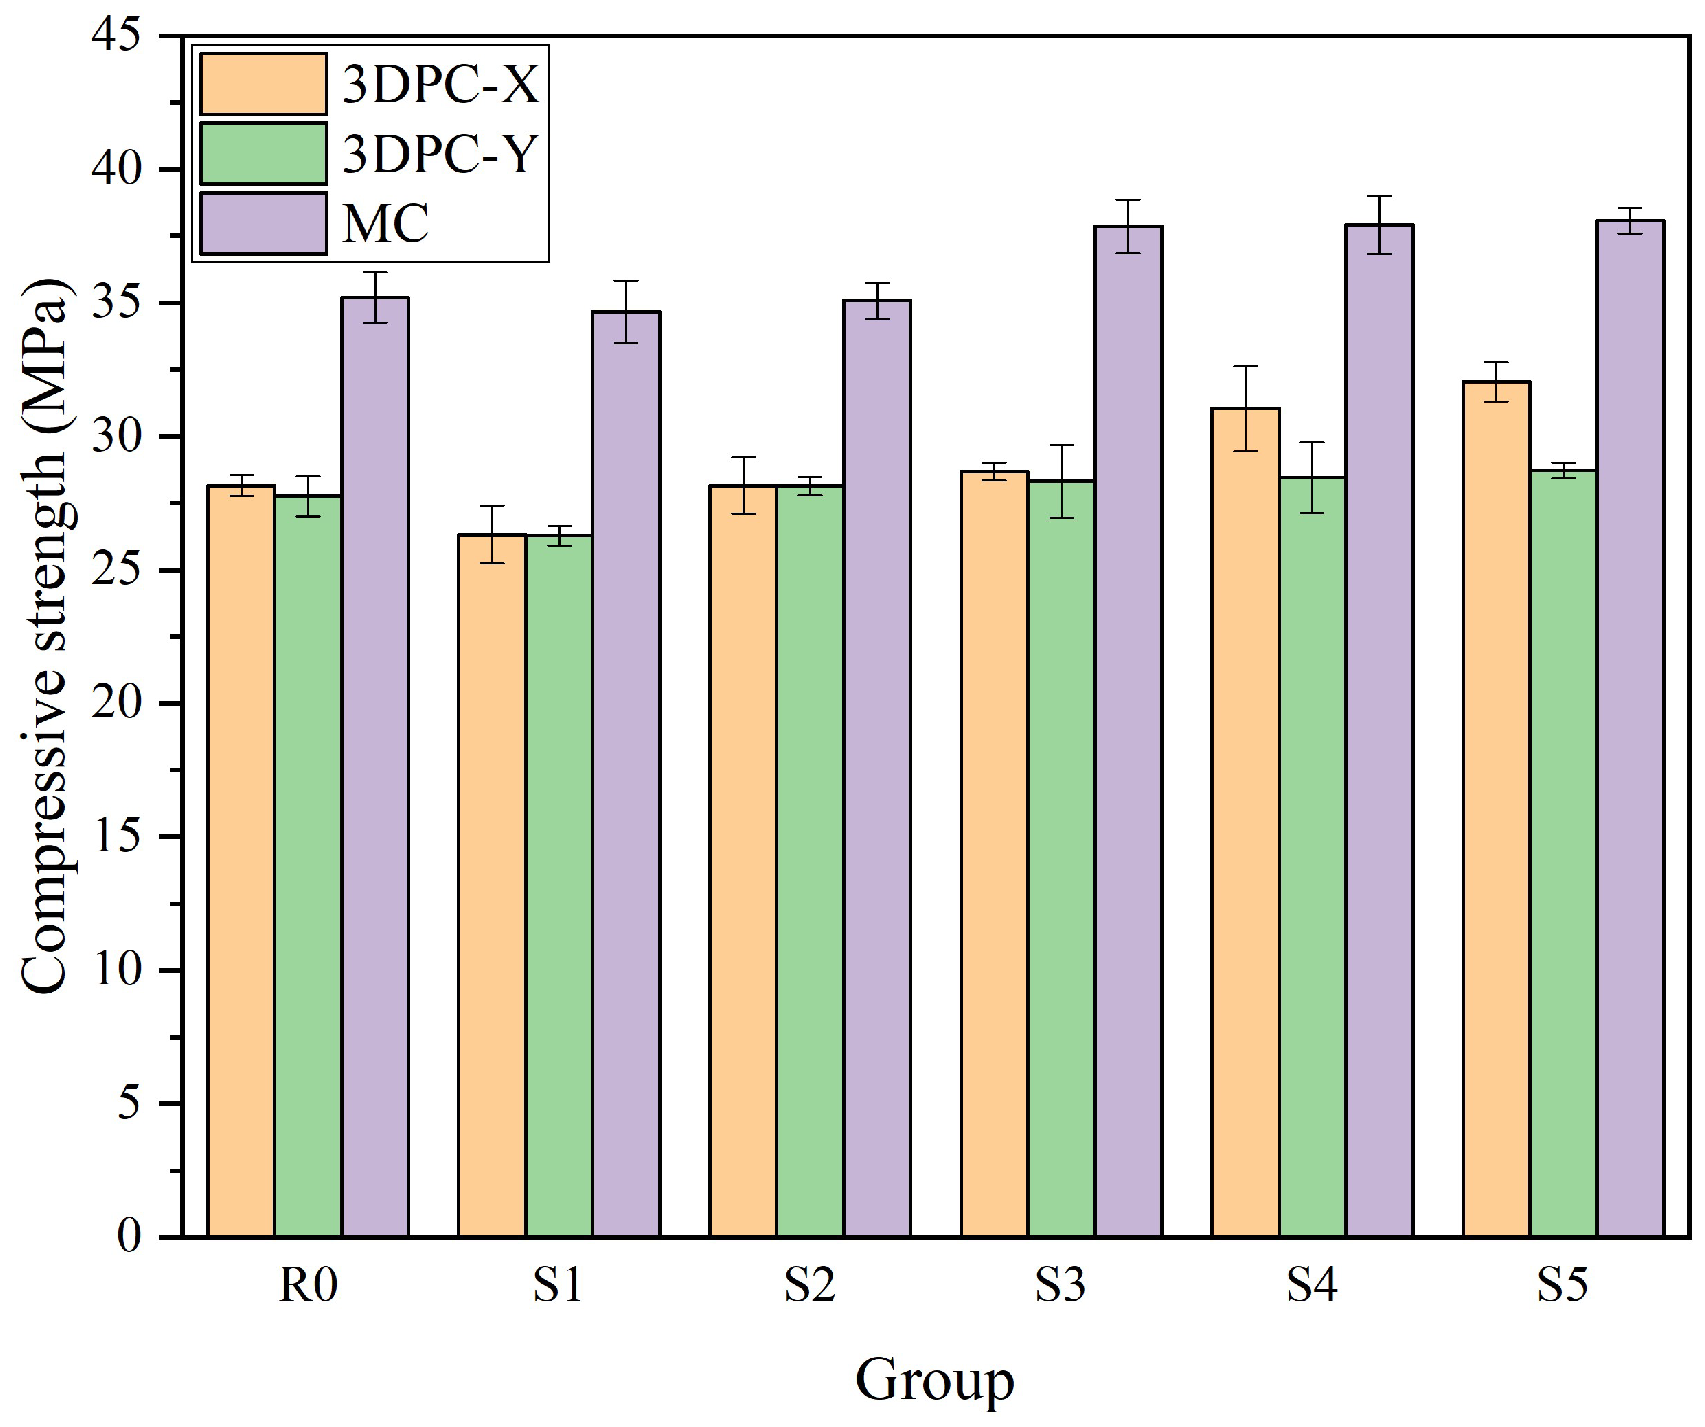
As shown in Figure 12 and Table 4, the 28-day compressive strengths of 3DPC specimens and MC specimens are presented. By increasing the EAFS replacement ratio, the compressive strength generally shows an upward trend. Compared with group R0, the relative change rates of compressive strength are as follows. For 3DPC specimens, the rates are −6.51%, 1.77%, 1.88%, 10.23%, and 13.8% in the X direction and −5.31%, 1.36%, 2.01%, 2.52%, and 3.48% in the Y direction; for cast specimens, the rates are −1.54%, 0.17%, 7.5%, 7.7%, and 8.2%. The compressive strength of group S1 is slightly lower than that of group R0, which may be attributed to poor packing of RS and EAFS in the printing paste, leading to more harmful pores.
One reason for the increased compressive strength is EAFS’s anti-cracking property; the other is the key role of EAFS’s dense packing effect [31]. As the ideal physical model for particle dense packing is a sphere, EAFS conforms to this model. EAFS incorporation enhances 3DPC density, leading to higher compressive strength [32]. Additionally, dense packing improves space utilization and reduces pore volume. Regarding 3DPC’s mechanical anisotropy, compressive strength in the “X” direction is higher than that in the “Y” direction. This can be explained by the higher density of the “X” direction under external forces during printing. This is consistent with other studies [33,34].
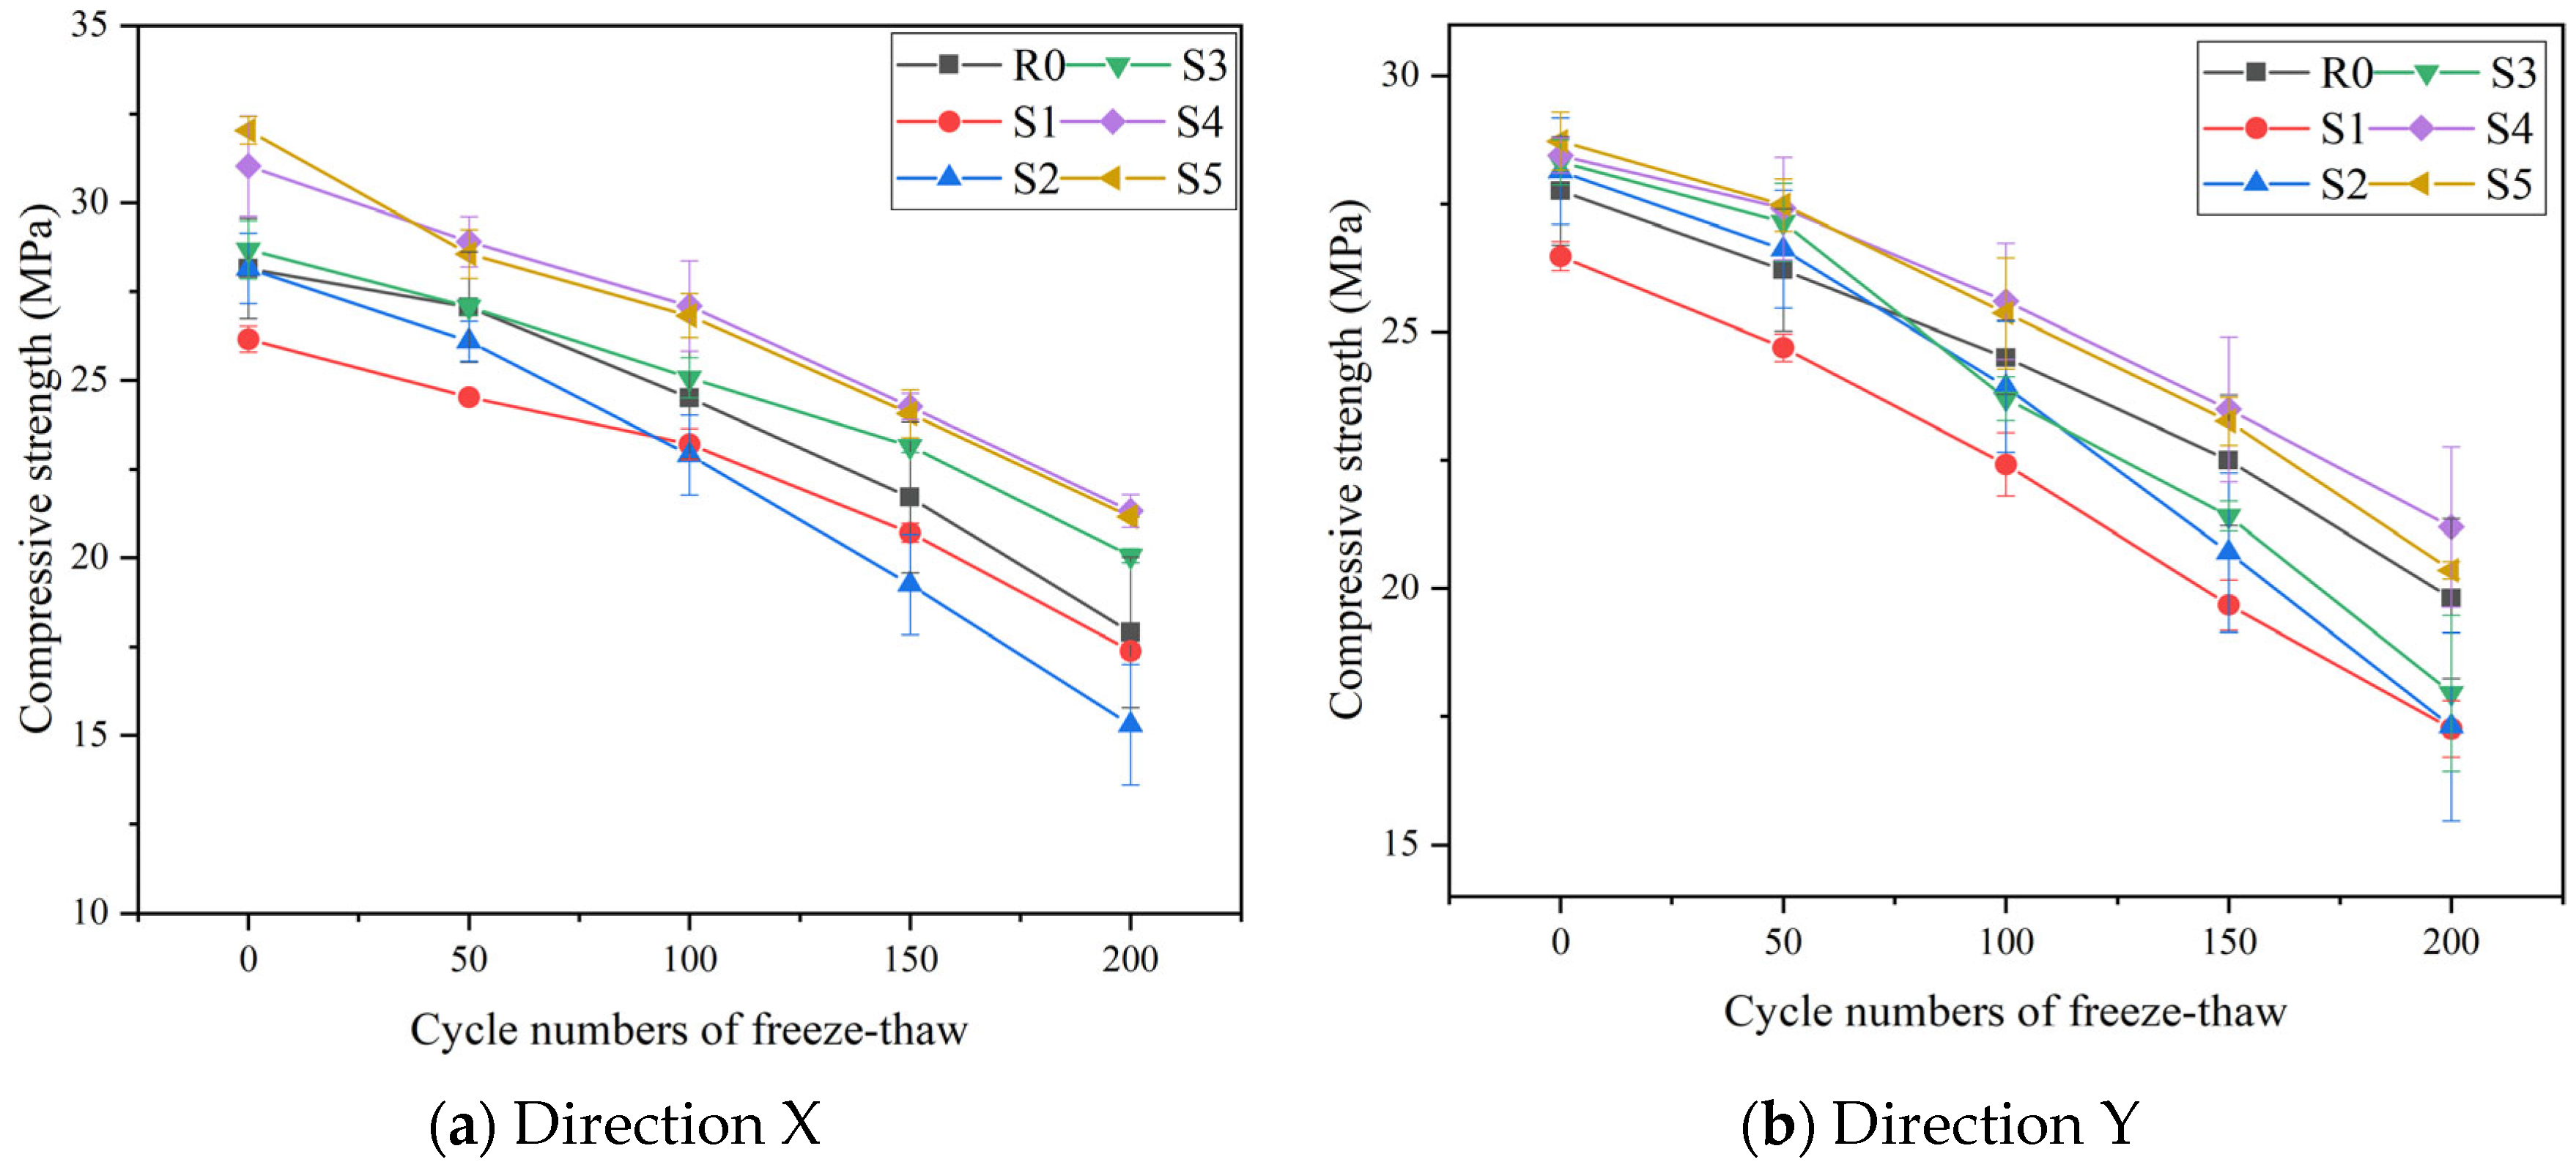
Figure 13a,b and Table 5 present the compressive strength loss in the X and Y directions of specimens with different EAFS replacement ratios after 200 freeze–thaw cycles. The test results show a clear rule that the compressive strength loss rate of 3DPC specimens first increases and then decreases as EAFS replacement ratios rise. Specifically, after 50 freeze–thaw cycles, the strength loss rate of all specimens is relatively low, and all are below 10%. At 100 freeze–thaw cycles, group S2 has the maximum compressive strength loss rates in the X and Y directions, which are 18.66% and 14.93%, respectively, while S4 has the minimum ones, which are 12.66% and 10.0%, respectively. This trend remains at 150 freeze–thaw cycles, where group S2 still has the highest loss rates, which are 31.62% and 26.41%, respectively, and S4 has the lowest ones, which are 21.81% and 18.24%, respectively. When freeze–thaw cycles reach 200, the compressive strength loss rates of all specimens in both the X and Y directions exceed 25%, and this ultimately causes specimen failure.

3.3.2. Flexural Strength (Before and After Freeze–Thaw)

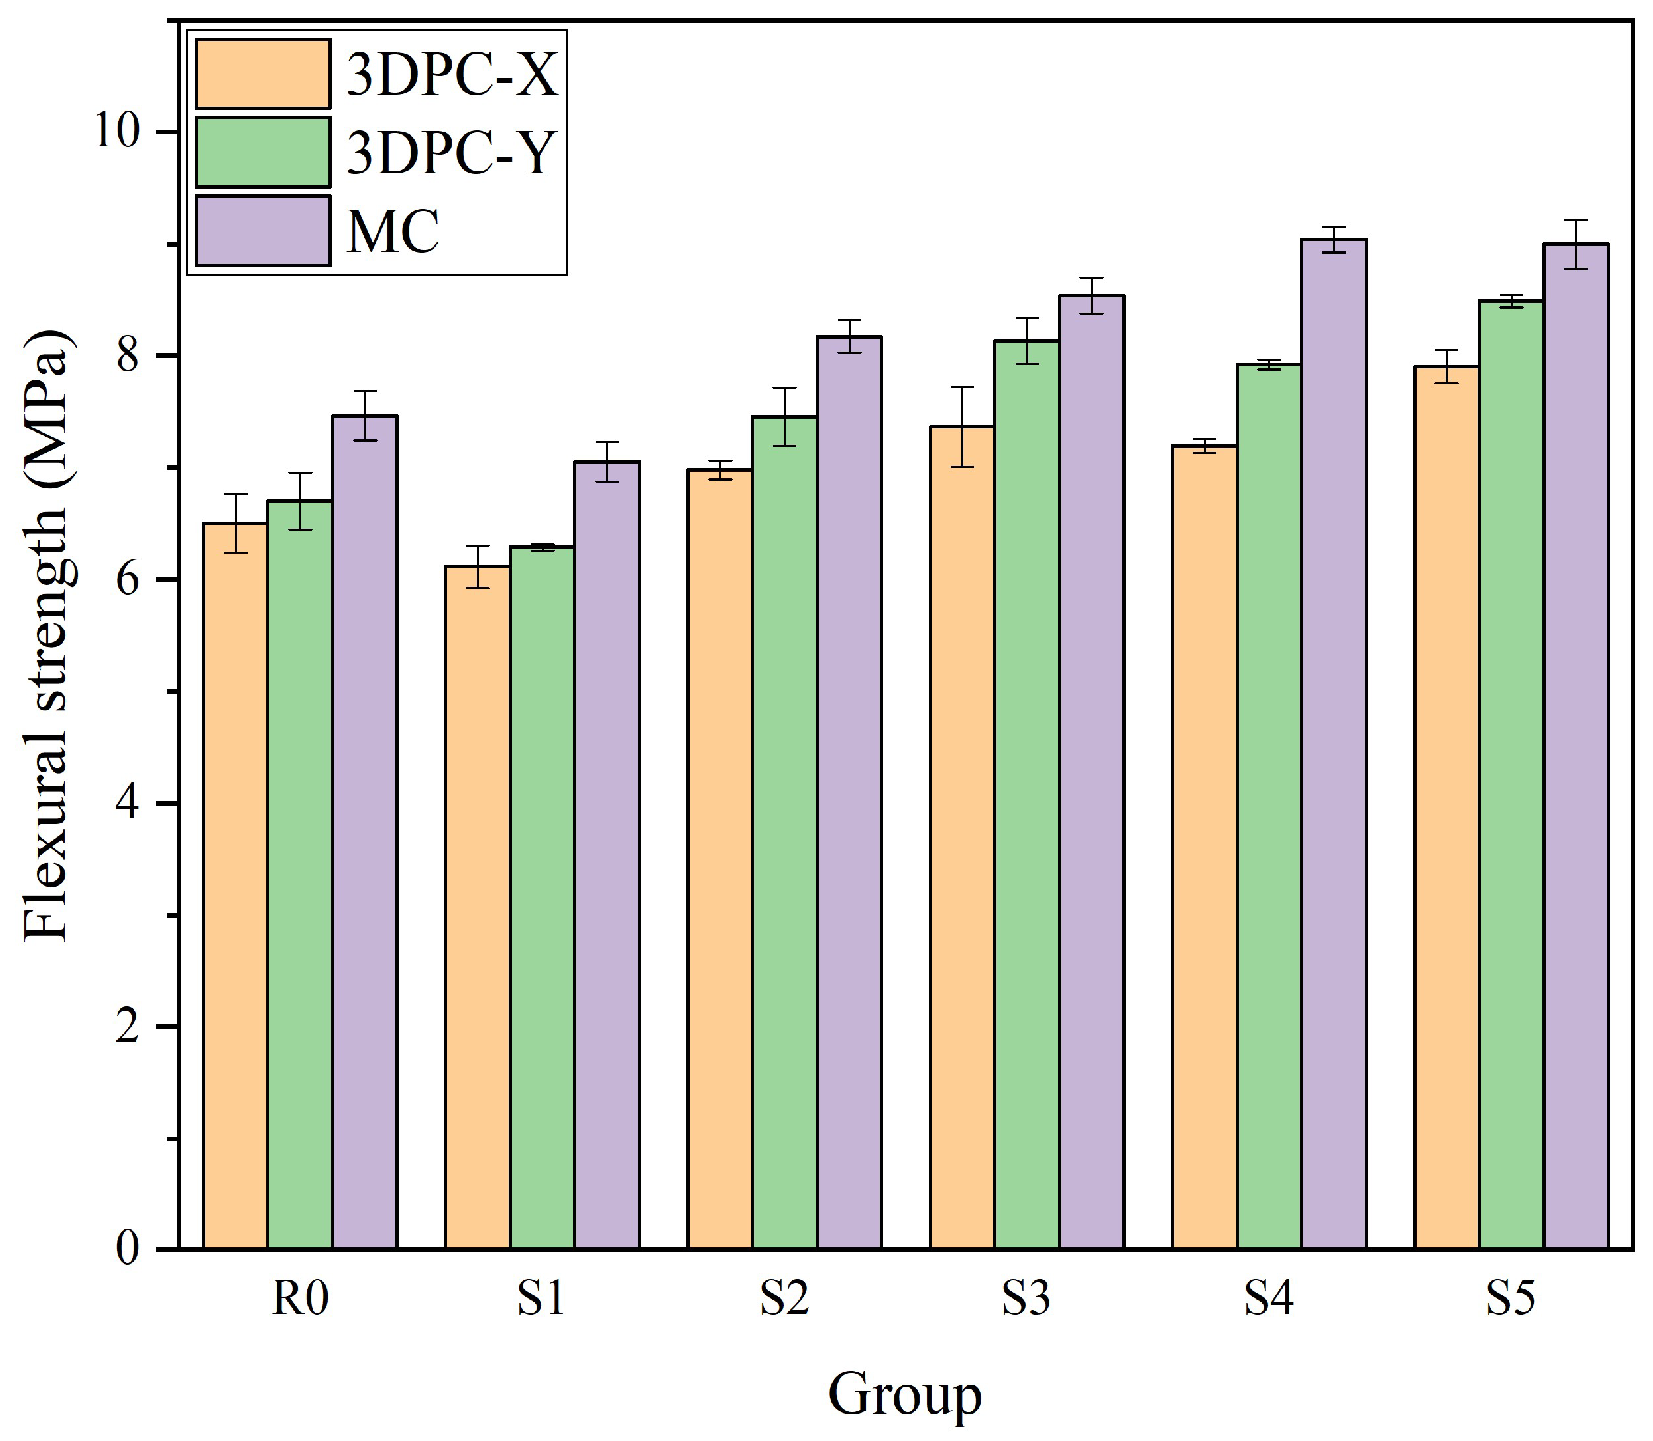
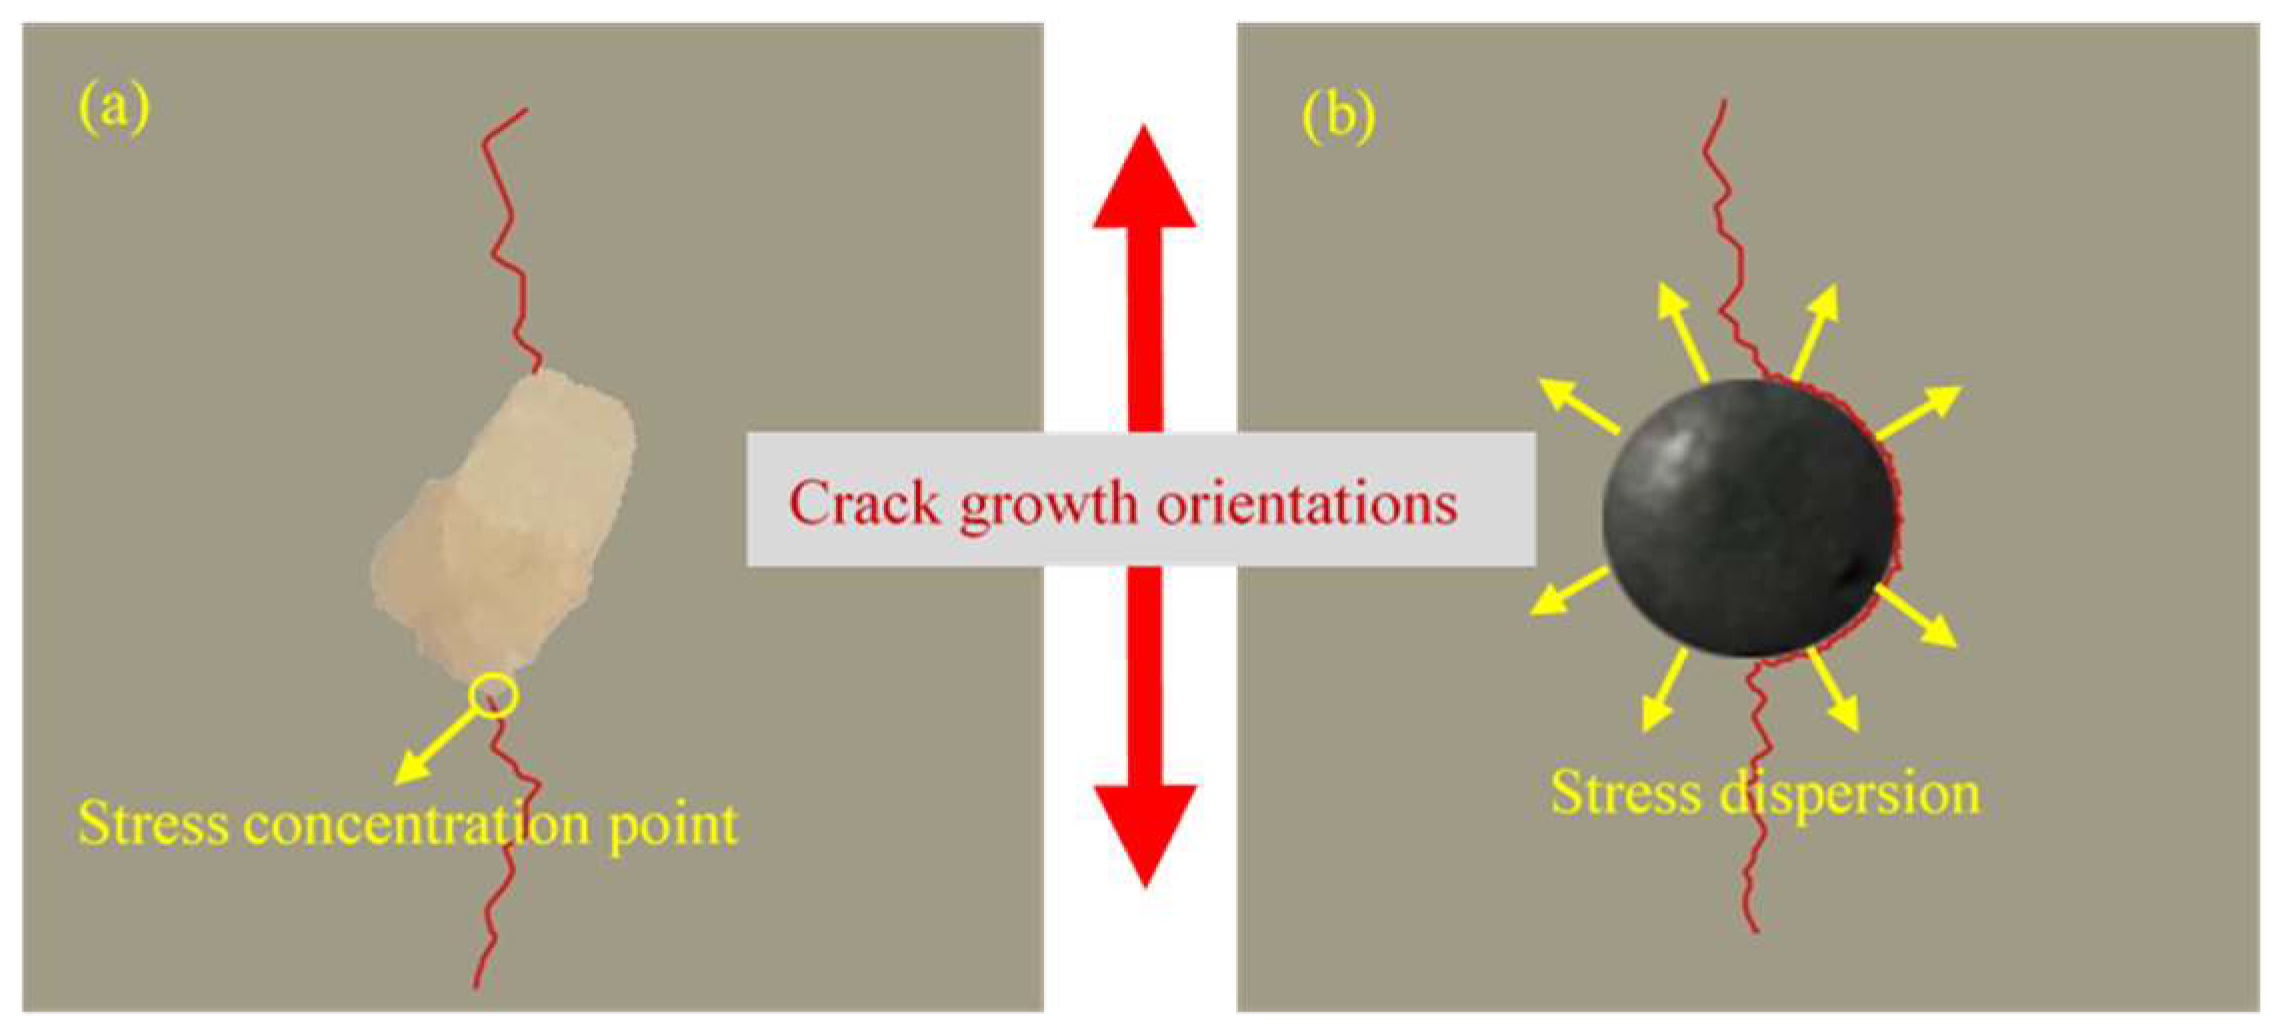
Figure 14 and Table 4 present the trend of the flexural strength of 3DPC specimens with different EAFS replacement ratios after 28 days of curing, clearly indicating that EAFS enhances the fracture resistance of the matrix. Compared with group R0, the flexural strength of groups S2, S3, S4, and S5 in the X direction increases by 7.3%, 13.22%, 10.6%, and 21.52%, respectively. In the Y direction, the flexural strength of 3DPC specimens increases by 11.26%, 17.63%, 18.2%, and 26.71%, respectively. MC specimens exhibit a similar flexural strength variation trend to 3DPC specimens. In general, the fracture process of mortar comprises three stages: crack initiation, propagation, and destabilization. During the early hydration stage, aggregates exhibit much higher fracture resistance than the cement matrix and the ITZ, and they account for most of the mortar volume. Akçaoğlu et al. [35] noted that aggregates with sharp edges tend to cause higher internal stress concentration, which promotes the initiation and propagation of micro-cracks. However, spherical aggregates enable the most uniform stress distribution around themselves.
As shown in Figure 15a, RS is more likely to induce crack initiation due to tip stress concentration. This is followed by crack propagation and eventual destabilization. In contrast, the spherical surface of EAFS in Figure 15b allows stress to disperse evenly around it. Therefore, cracks are less likely to form around EAFS. This also explains the reason for the increase in flexural strength of 3DPC specimens under high EAFS replacement ratios.
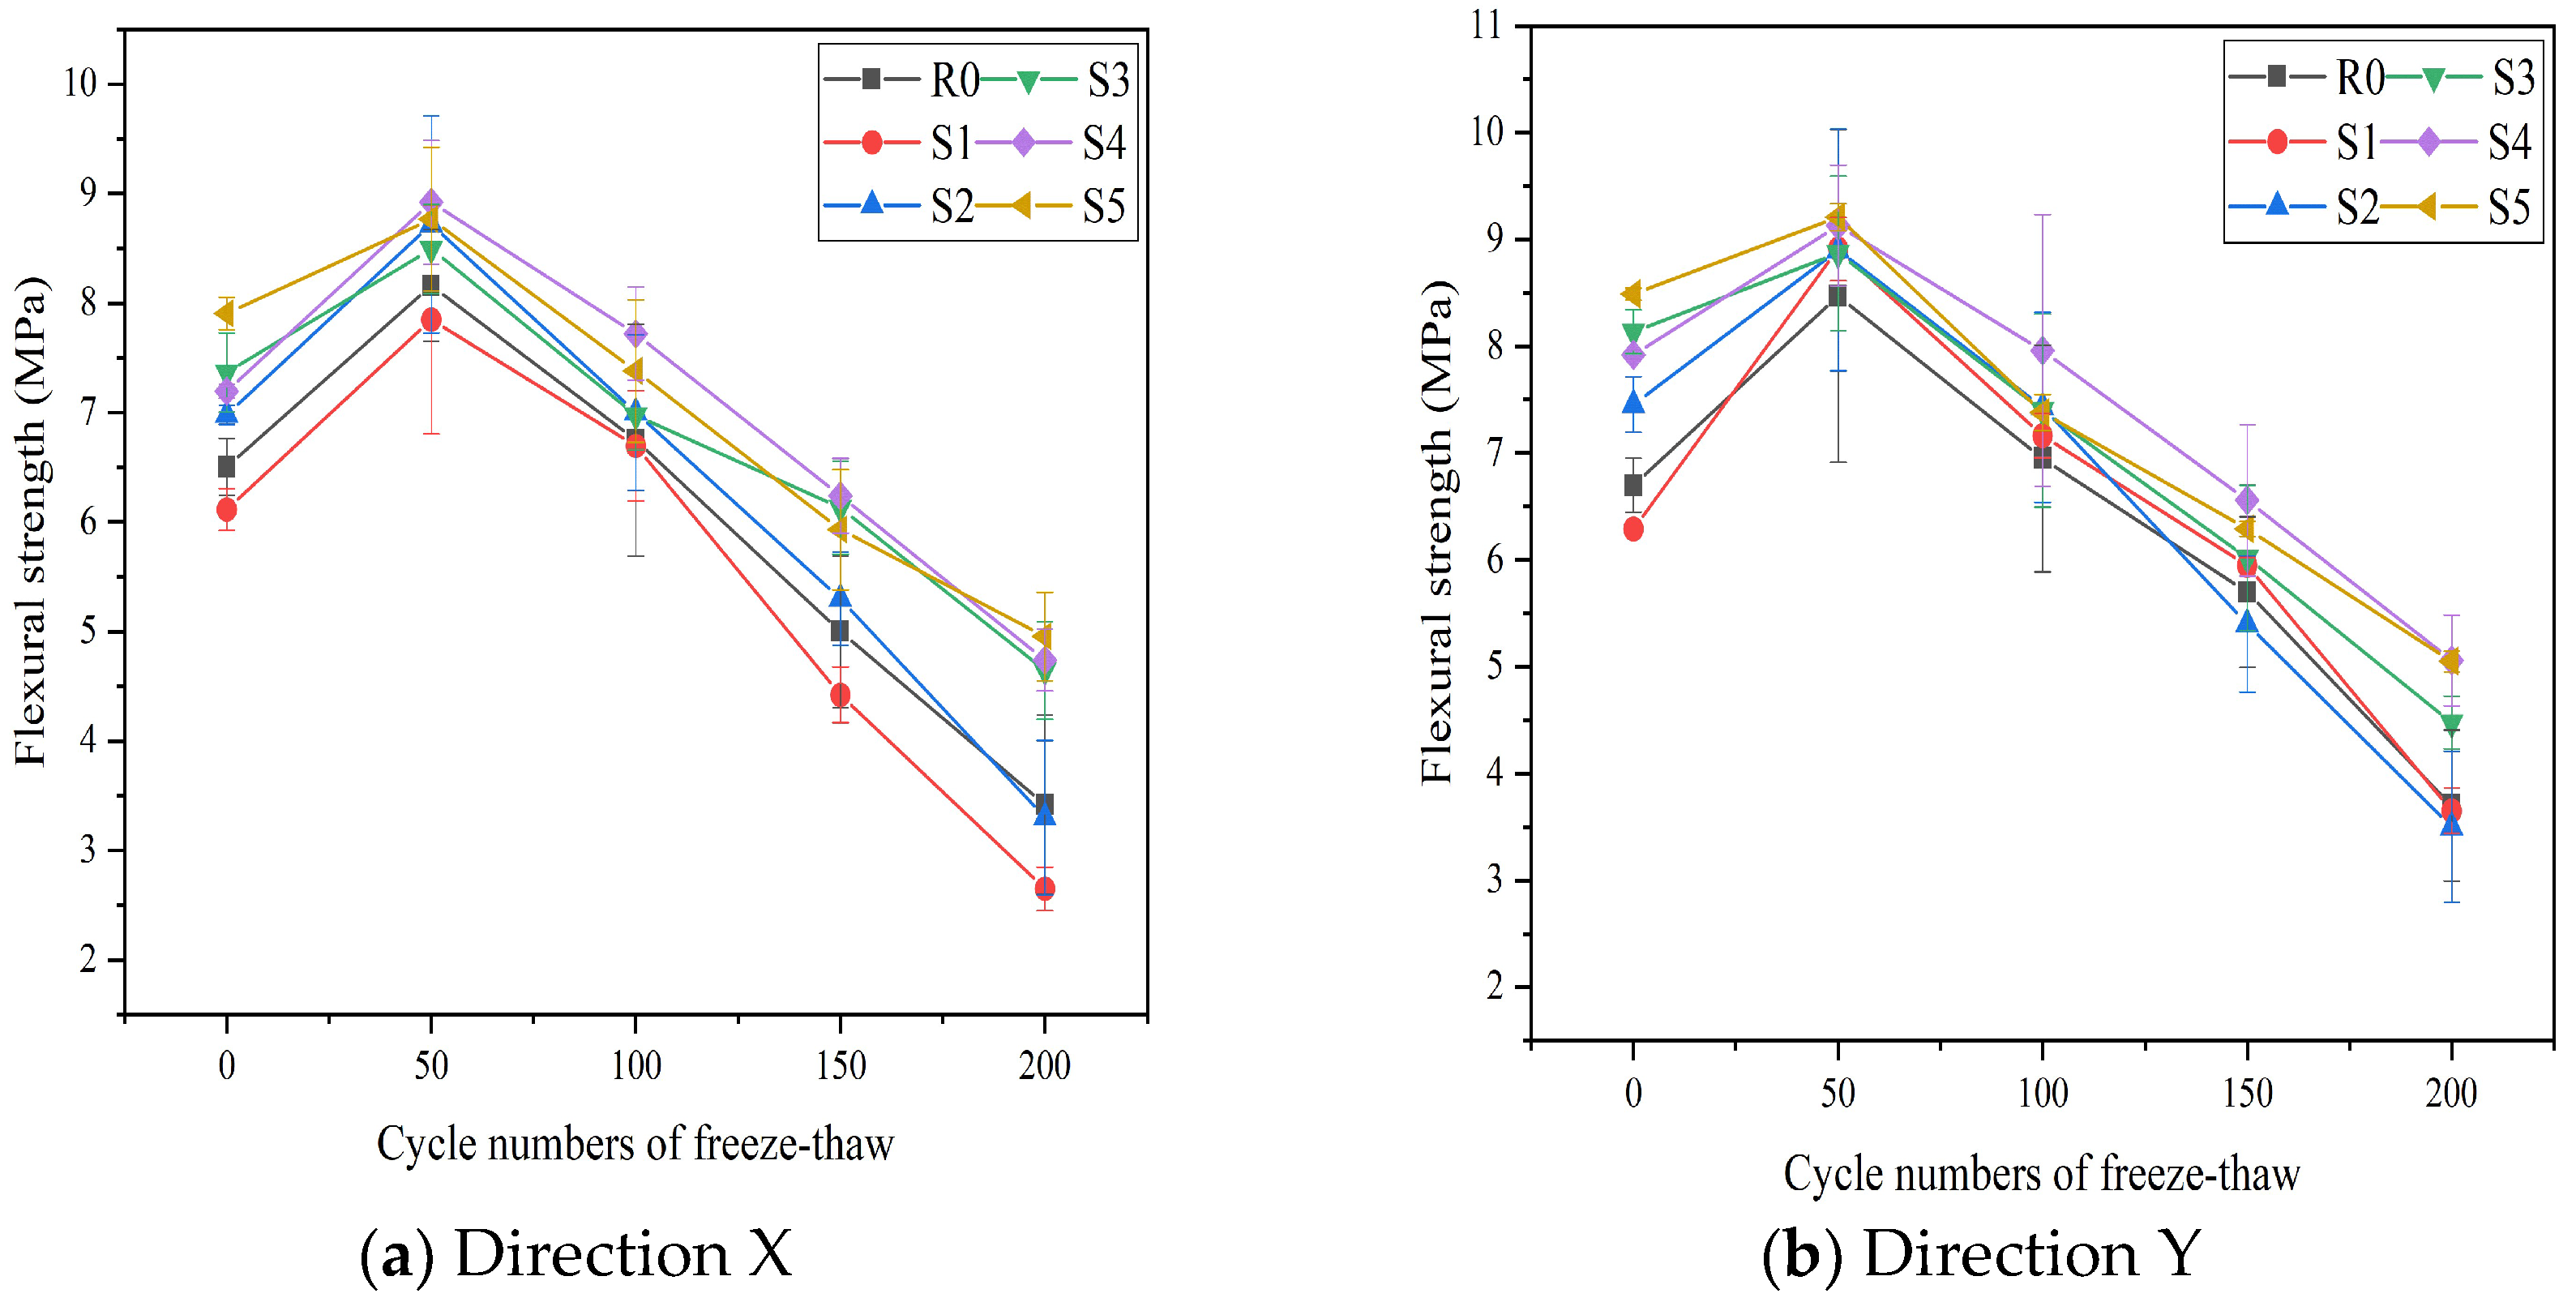
Figure 16a,b and Table 5 show the flexural strength curves of 3DPC specimens in the X and Y directions after 200 freeze–thaw cycles, respectively. It can be seen that the flexural strength of the specimens increases during the 0–50 freeze–thaw cycle stage. The main reasons for this phenomenon are as follows. In this stage, water mainly remains on the surface of the specimens and does not penetrate into the interior in large quantities; the frost heaving force generated by the freezing of surface water is lower than the flexural strength of the specimens, so the freeze–thaw damage is not obvious. Meanwhile, the incompletely hydrated cementitious materials inside the specimens continue to undergo hydration reactions during the freeze–thaw process, and the generated hydration products further fill the internal micro-pores and improve the microstructure, thus promoting the increase in flexural strength. This is consistent with the conclusions in reference [34].
With the continuous increase in freeze–thaw cycles, the water on the surface of the specimens gradually diffuses and accumulates in the interior. The cumulative frost heaving force generated by the freezing of pore water inside the specimens exceeds the flexural strength threshold of the specimens, leading to the initiation and gradual propagation of internal micro-cracks, and thus the flexural strength of the specimens enters a continuous decline stage [9]. When the number of freeze–thaw cycles reaches 150, the largest flexural strength loss rate in the X direction was 27.71% for group S1, and the largest in the Y direction was 27.51% for group S2, while group S4 (with an 80% EAFS replacement ratio) shows the minimum flexural strength loss rate, which is 21.01% and 17.17% in the X and Y directions, respectively. The results show that the flexural strength loss ratio of 3DPC specimens after freeze–thaw cycles is the lowest when the electric arc furnace slag (EAFS) replacement ratio is 80%.

3.3.3. Mass Loss Rate

Figure 17 shows the change in the mass loss rate of 3DPC specimens with different EAFS replacement ratios during 200 freeze–thaw cycles. With the increase in the replacement ratios of EAFS, the mass loss rate of the specimens shows a trend of first increasing and then decreasing. After 50 freeze–thaw cycles, the mass loss rate of each group of specimens is relatively small. At this stage, there is less water in the specimens, and the freeze–thaw cycles only cause the shedding of the surface specimens. With the increase in the number of freeze–thaw cycles and the continuous migration of water to the interior, the frost heaving force generated after the water in the pores of the specimens freezes causes cracks in the pores of the specimens and increases the porosity, and the mass loss rate of the specimens further increases. After 200 freeze–thaw cycles, the mass loss of group R0 was 4.8%. Group S4 had the minimum mass loss of 3.85%, while group S1 had the maximum of 6.33%. This is consistent with the lower compressive and flexural strength loss rates of group S4 in the same period, further confirming its better frost resistance.
Figure 18a–f present the apparent morphology of 3DPC specimens with different EAFS replacement ratios after 200 freeze–thaw cycles. All specimens exhibited surface spalling to varying degrees after the cycles. With the increase in the EAFS replacement ratio, the amount of surface spalled material decreased. This phenomenon is consistent with the trend of reduced mass loss rate for specimens with higher EAFS replacement ratios.

3.4. ITZ

The ITZ structure is a weak area between the aggregate and specimen matrix, occupying a part of the pore volume, which affects the mechanical properties of concrete materials. Relevant studies show that the thickness of the ITZ is mainly affected by aggregate size [36] and the water/cement ratio [37]. The thickness of the ITZ in the investigation was about 30 μm, which resulted in a weak connection between the aggregate and the cement matrix [38]. On the contrary, the narrower the thickness of the ITZ, the better the mechanical properties [39,40].
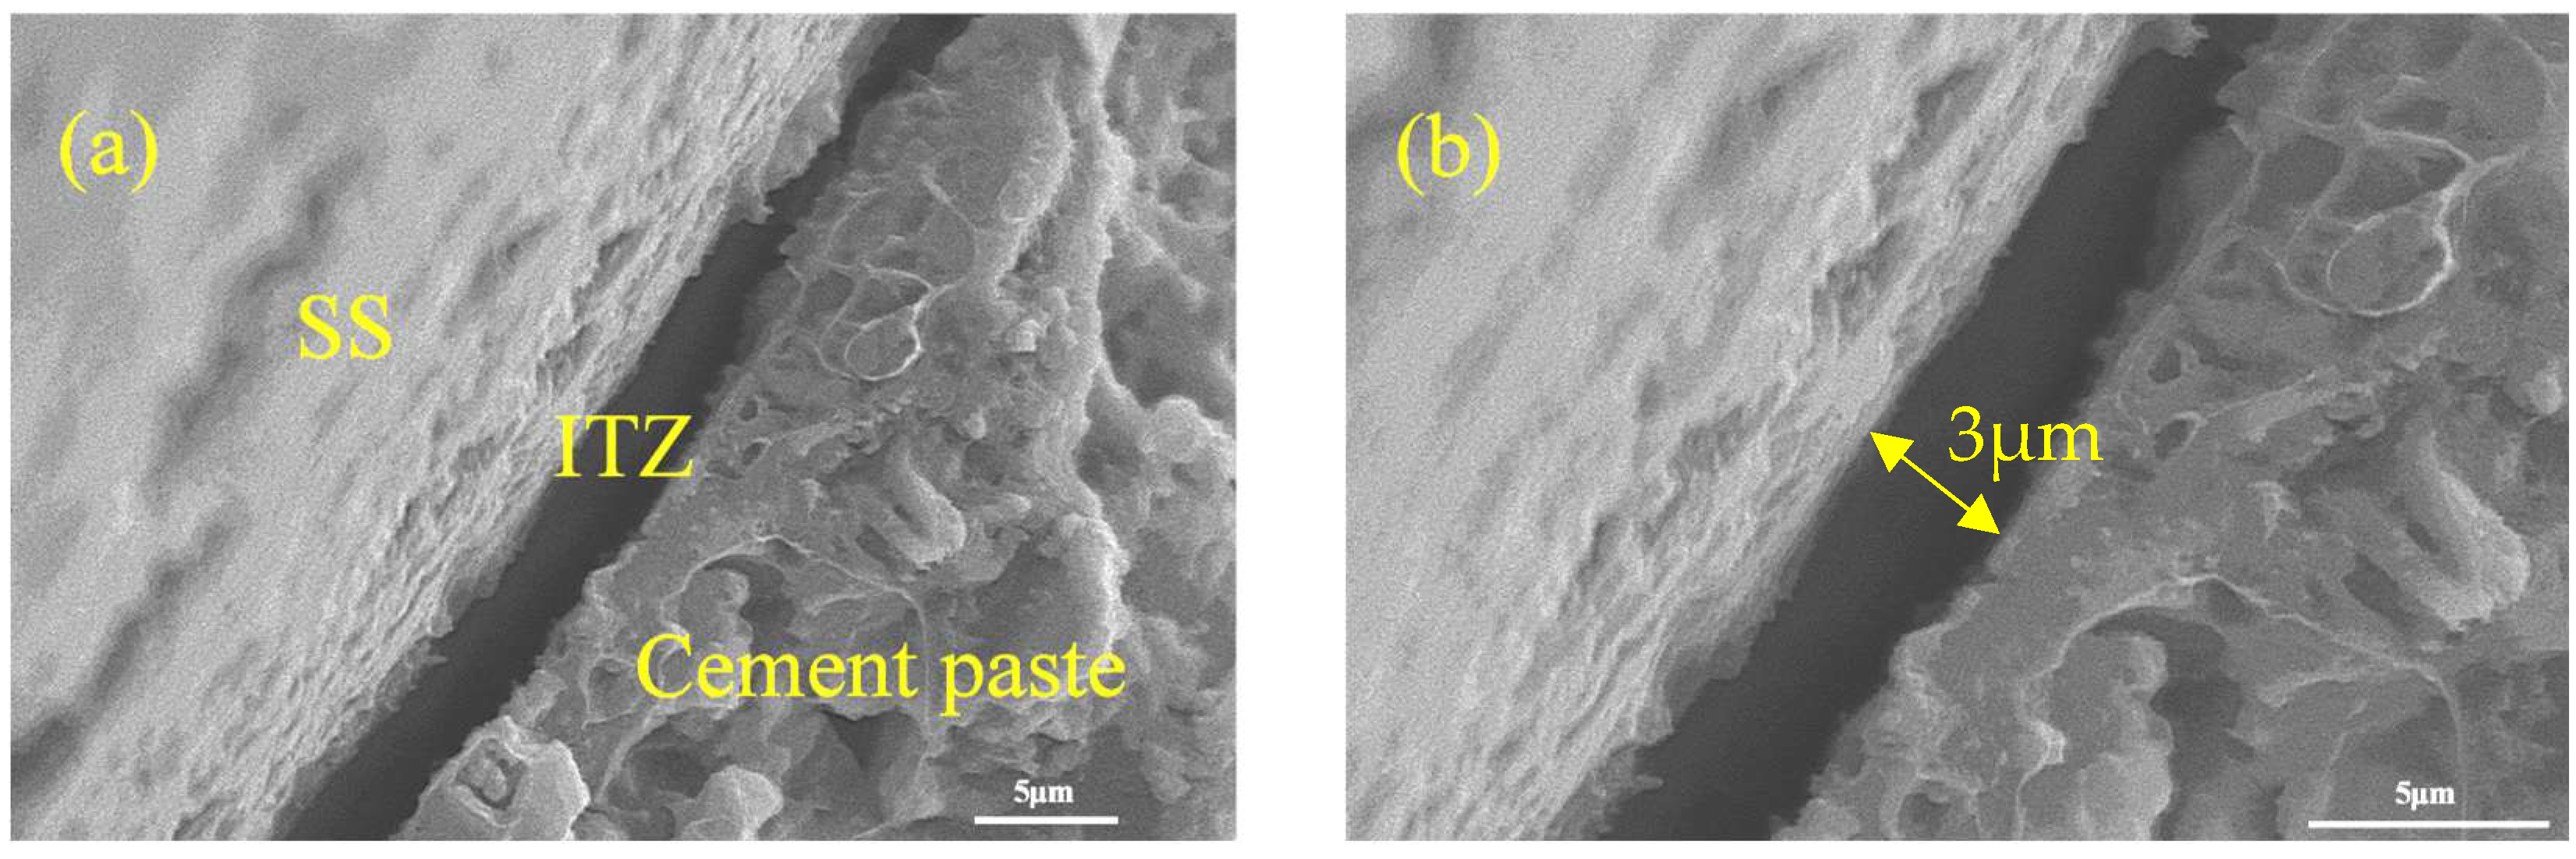
The ITZ thickness between RS and the cement phase is observed to be 3 μm in Figure 19a,b, while the ITZ thickness between EAFS and the specimen matrix is about 2 μm in Figure 20a,b. Comparative SEM images of the above two ITZs show that EAFS does not exhibit the disadvantage of connecting weakly with the cement matrix. This result is at once a guarantee of enhanced mechanical properties and further supports the feasibility of EAFS applications in the 3DPC field.
As shown in Figure 21, the micro-morphologies of R0, S2, and S4 after 200 freeze–thaw cycles are presented. In Figure 21a, it can be observed that numerous micro-cracks appear in the matrix of R0 and at the ITZ between RS and the matrix after freeze–thaw cycles. These micro-cracks propagate from the ITZ to the matrix, increasing the harmful pores and detrimental voids in the specimen. Driven by the frost heaving force, the cracks extend toward the interior of the specimen, leading to a sharp decline in frost resistance. In Figure 21b, obvious micro-cracks remain in the ITZ of RS and the paste of S2. In Figure 21c, the micro-cracks in S4 are mainly observed to propagate within the specimen matrix. This is because the ITZ of EAFS is thinner than that of RS, and the bonding effect between the paste and EAFS is better. In Figure 21d, it can be observed that the ITZ between EAFS aggregates and the specimen matrix remains tightly bonded after freeze–thaw cycles.

3.5. Pore Structure Analysis

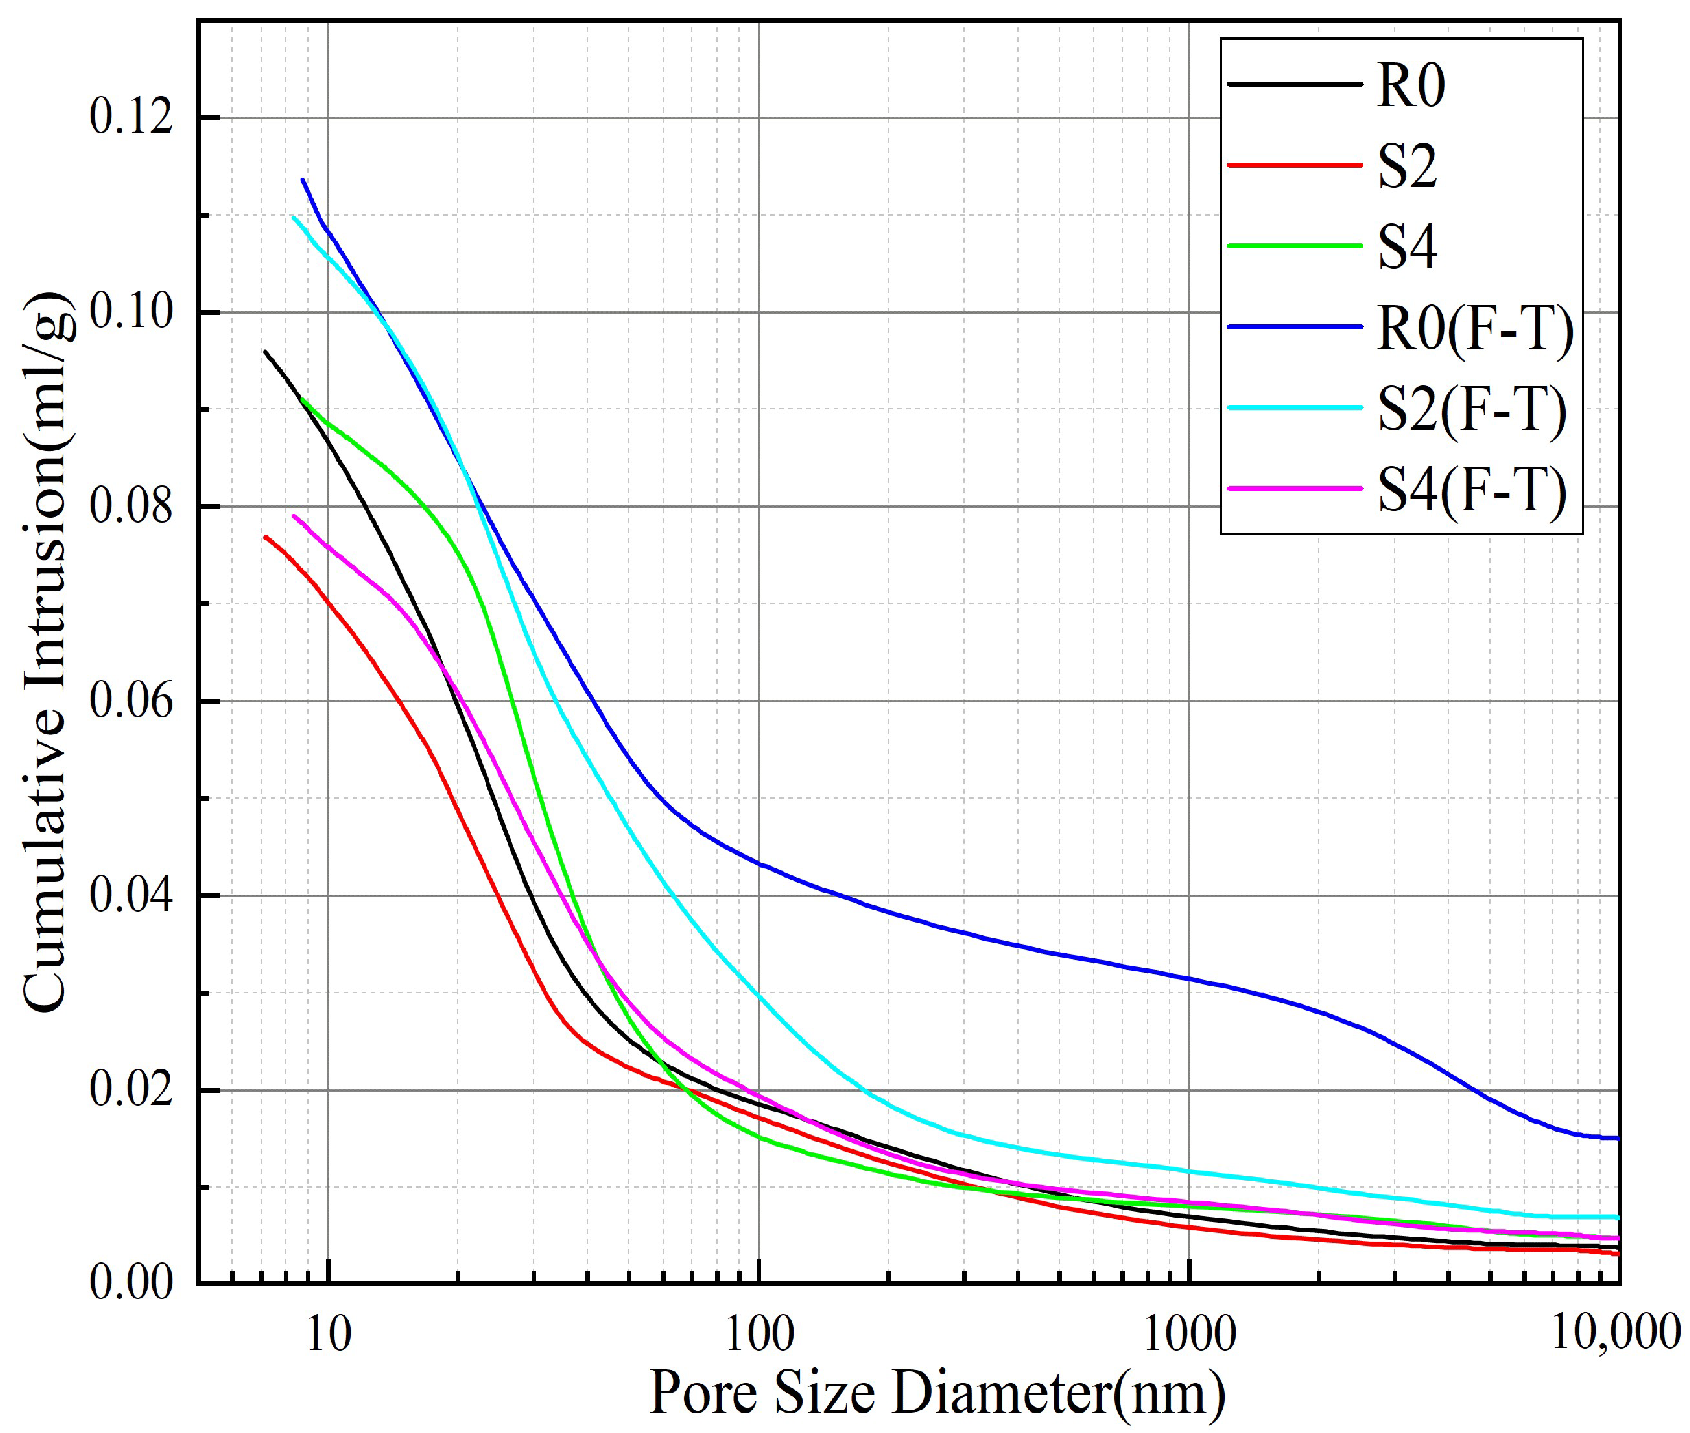
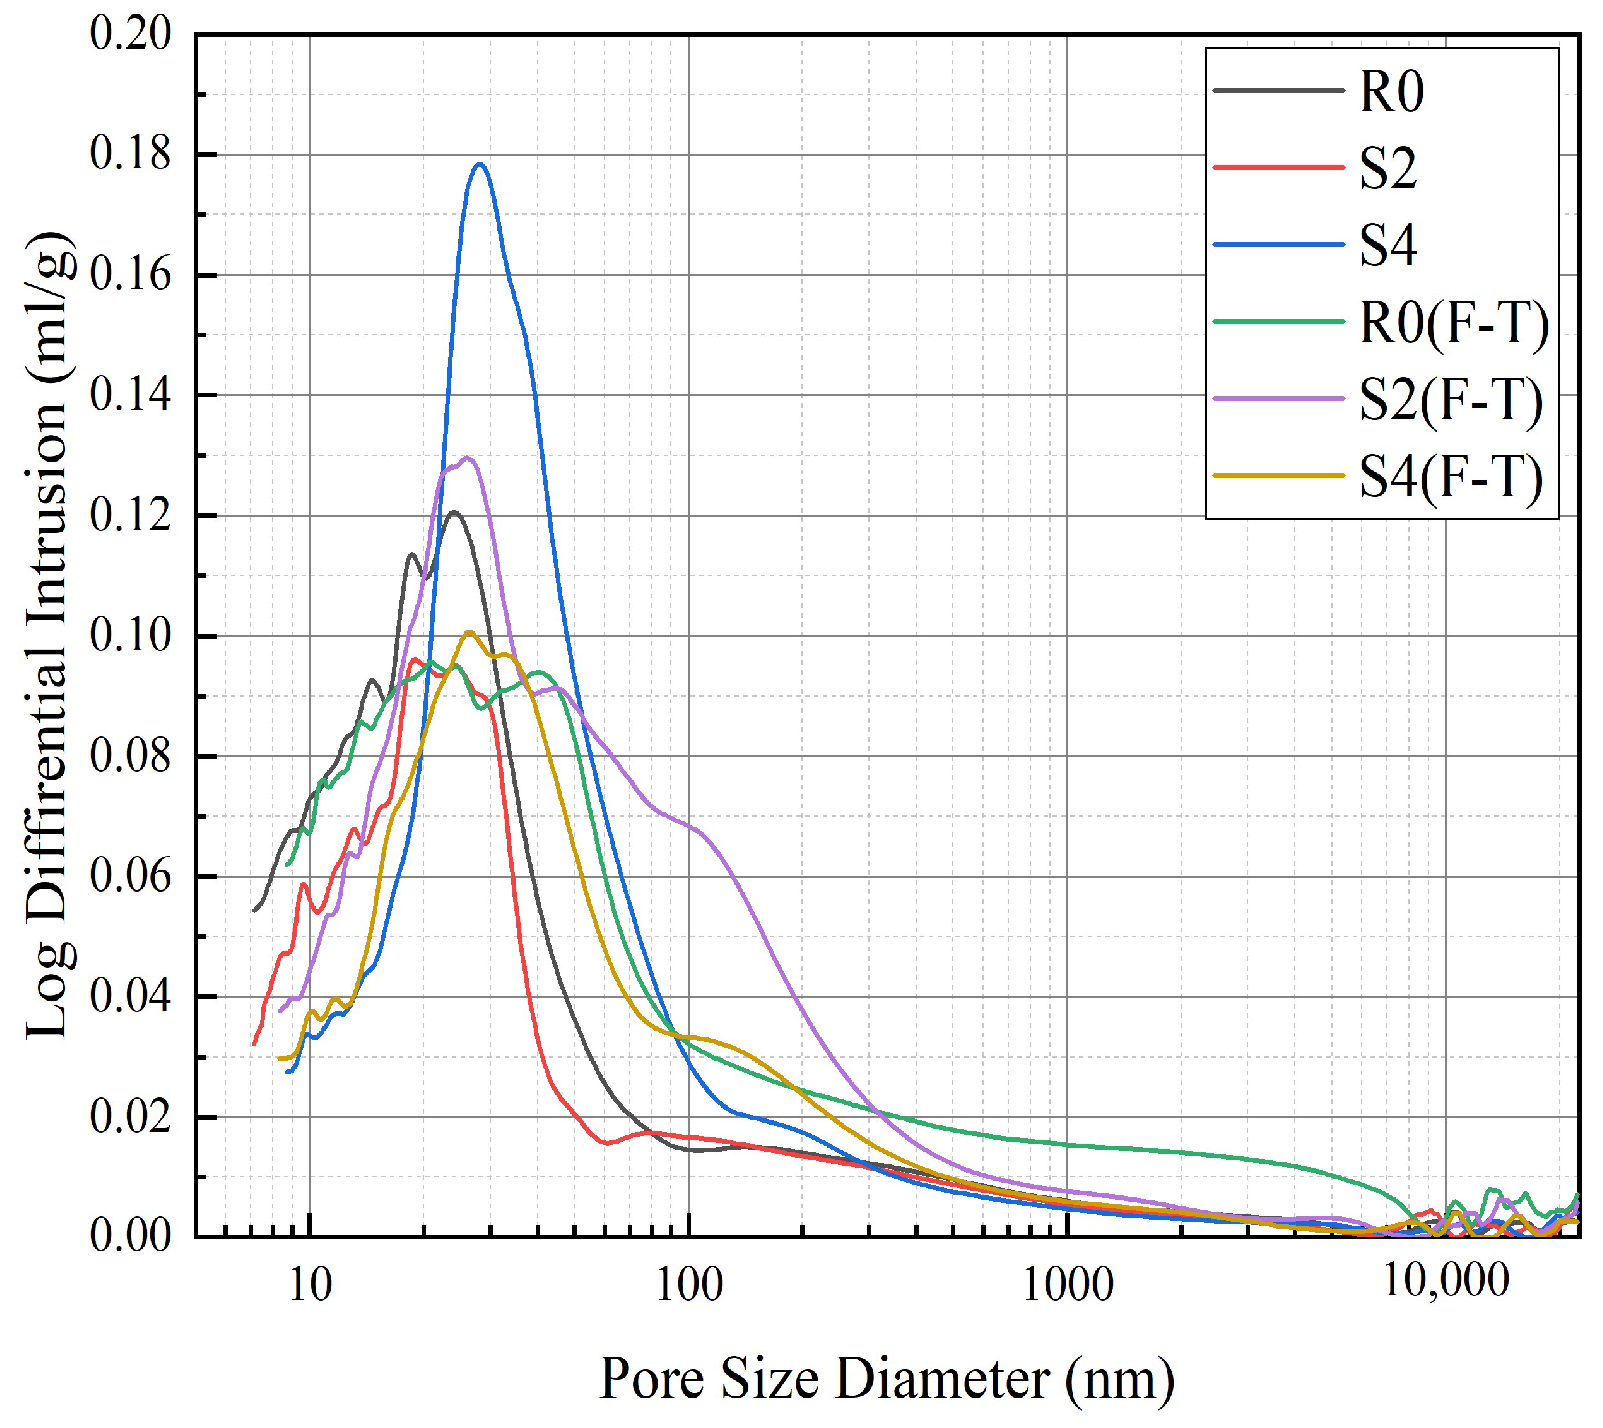
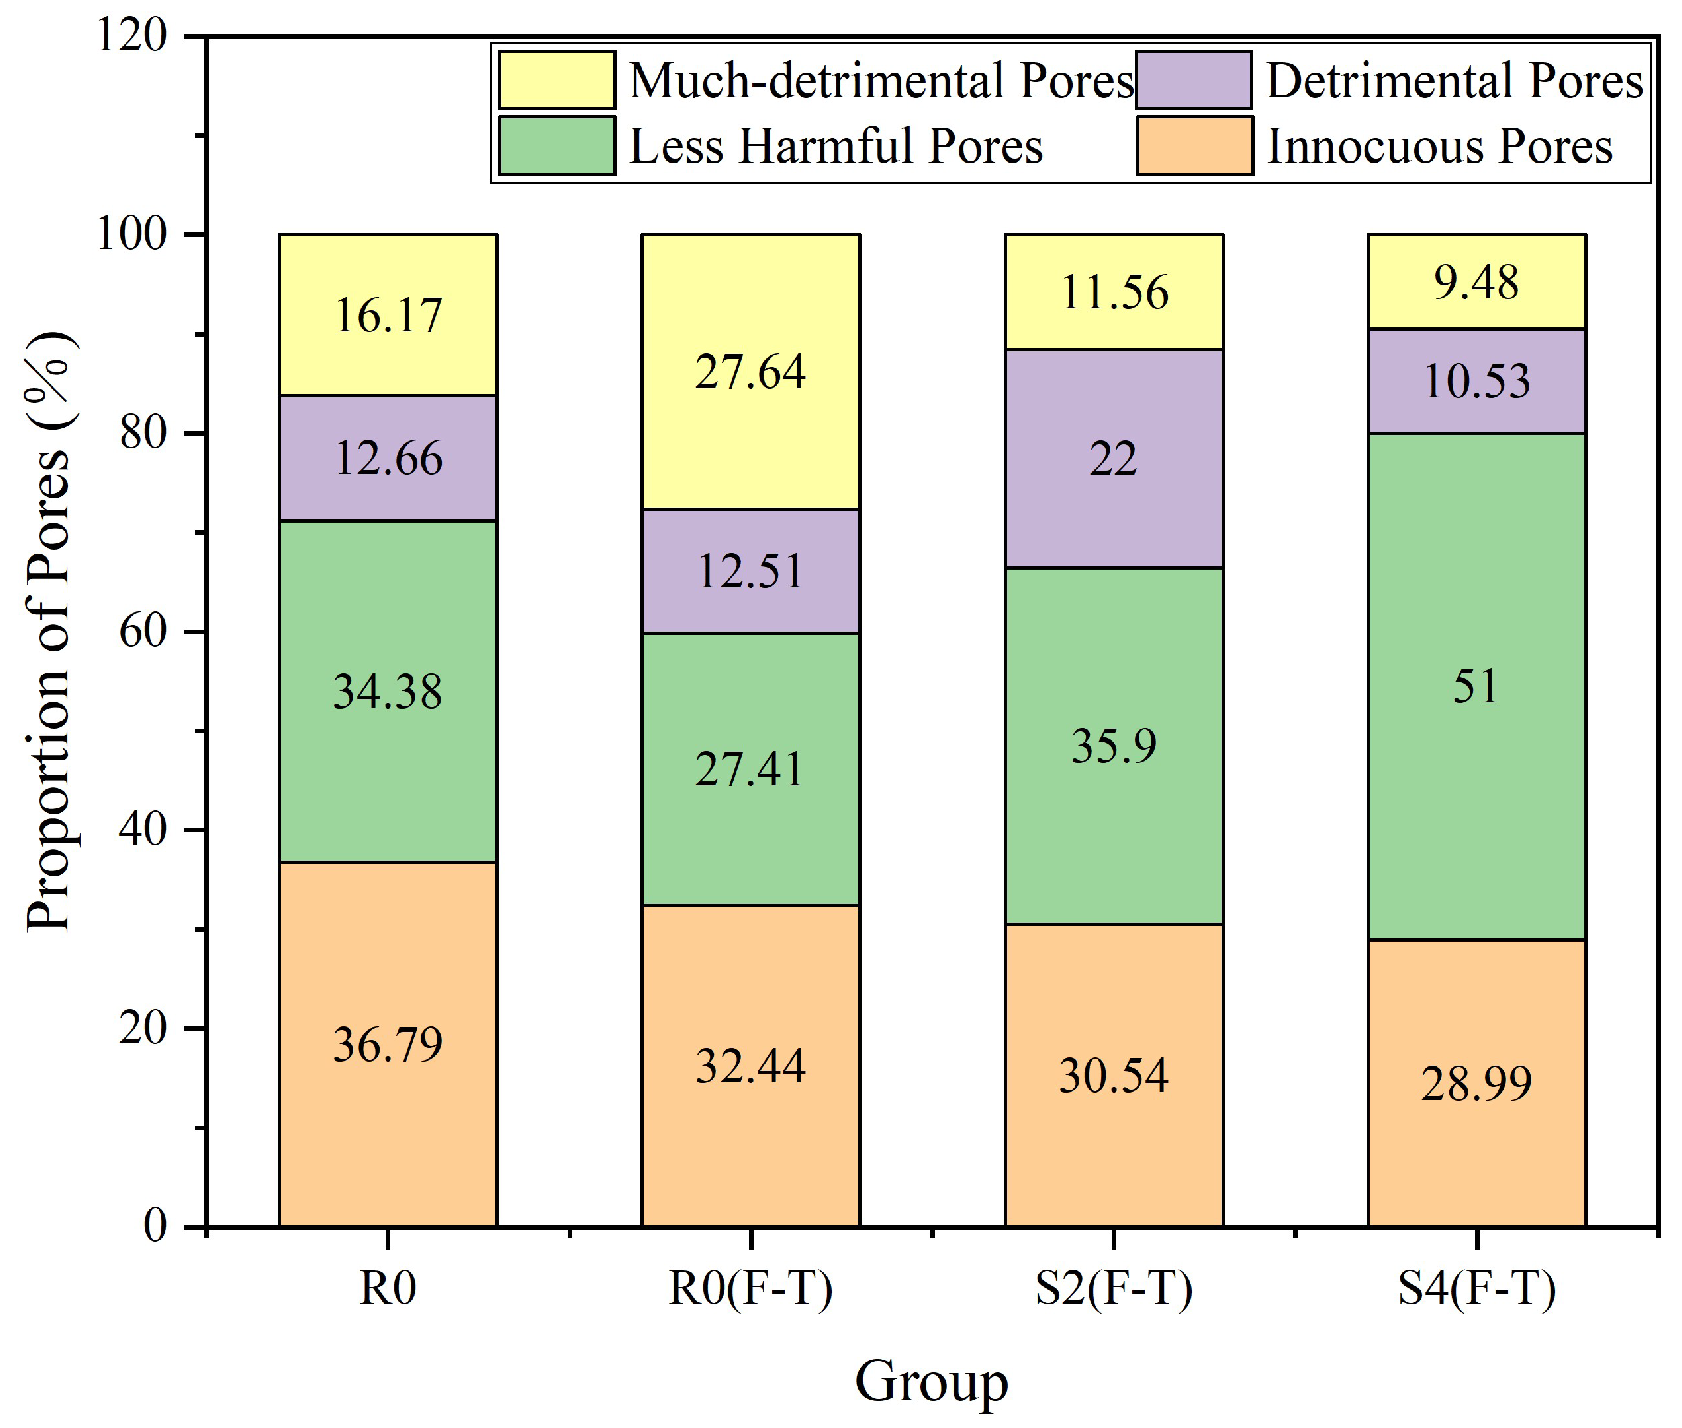
Figure 22 and Figure 23 show the cumulative porosity and pore distribution before and after freeze–thaw cycles. According to Wang et al. [41], all pores were classified as innocuous pores (diameter < 20 nm), less harmful pores (20 ≤ diameter < 50 nm), detrimental pores (50 nm ≤ diameter < 200 nm), and much-detrimental pores (200 nm ≤ diameter). Detrimental and much-detrimental pores are the main factors influencing the performance of mechanical properties [42,43]. The total porosity of 28-day specimens in group R0 was 18.69%. After freeze–thaw cycles, the total porosity of groups R0, S2, and S4 increased by 3.13%, 3.31%, and 1.33%, as shown in Table 6, indicating that freeze–thaw cycles increase specimen porosity, with group S4 showing the smallest increment. Figure 24 shows that after freeze–thaw cycles, the pore structures of 3DPC specimens in each group exhibit significant differences. The proportions of detrimental pores and much-detrimental pores in groups R0, S2, and S4 increased by 11.32% and 4.73% and decreased by 8.82%. In terms of harmless pores and less harmful pores, compared with the untreated group R0 (without freeze–thaw treatment), the proportions in group R0 (F-T) decreased by 4.35% and 6.79%, respectively, while the harmless pore proportion of group S2 (F-T) decreased by 6.25%. In contrast, the proportions of harmless pores and less harmful pores in group S4 (F-T) increased by 20.14% compared with group R0 (F-T). This indicates that freeze–thaw cycles promote the development of pores in 3DPC specimens towards larger pore sizes; however, when the EAFS replacement rate is 80%, the pore structure of the specimens is effectively optimized. This indicates that the pore structure of specimens with an 80% EAFS replacement ratio is optimized after freeze–thaw cycles. It is consistent with the findings of Hwang et al. [44]. Under the action of freeze–thaw cycles, smaller pores are developed into larger pores due to frost heave force. The increase in pore size leaves more space for water, so the freeze–thaw cycle disruption is more obvious [43]. The MIP results reveal why the mechanical properties and frost resistance of specimens with an 80% EAFS replacement ratio are higher than those of group R0.

4. Conclusions

In this paper, 3DPC was prepared by replacing RS with EAFS at different ratios. The material has good fluidity, printability, mechanical properties, and frost resistance. The following conclusions are made.
  • EAFS fine aggregate enhances the flowability of 3DPC mortar and extends its printing window. With the increase in EAFS replacement ratios, the initial slump of the mortar increases, and the slump over time meets the printing requirements. In addition, the apparent viscosity of the printed specimens decreases. However, as the replacement ratios of EAFS aggregate increase, the printing height of the specimens decreases while the printing width increases, with this trend being particularly notable in group S5.
  • The 28d flexural strength of 3DPC specimens increases by 7.3–26.71% with a higher EAFS replacement rate. EAFS shows significant early-stage crack resistance. Additionally, based on the ideal dense packing model, compressive strength at all ages rises with increased EAFS replacement. The early-age mechanical properties of 3DPC are key to improving its production and transportation efficiency. The study results are compared with those of the relevant literature, as detailed in Table 7 below.
  • With an increased EAFS fine aggregate replacement rate, the mass loss rate, compressive strength loss rate, and flexural strength loss rate of 3DPC specimens after freeze–thaw cycles first rise then fall. Group S4 has the smallest losses: a mass loss rate of 2.36%; compressive strength loss rates of 21.81% (X direction) and 18.41% (Y direction); and flexural strength loss rates of 21.01% and 17.17%, with a frost resistance grade of F150.
  • SEM images of EAFS mortar show that the ITZ thickness is only 2 μm, which is a satisfactory performance. EAFS mortar reduces the damage of freeze–thaw cycles to the ITZ. Applying EAFS to 3DPC can reduce the total porosity of the specimens. When the substitution rate is 80%, the porosity of the specimens after freeze–thaw is the smallest. The dense packing of spherical particles reduces the proportion of harmful and multi-harmful pores. It supported the feasibility of EAFS application to 3DPC from a microscopic perspective.

Author Contributions

Conceptualization, S.H.; methodology, Q.L.; software, H.Y.; validation, Q.L. and H.Y.; formal analysis, Q.L.; investigation, Q.L.; resources, S.H.; data curation, Q.L.; writing—original draft preparation, Q.L.; writing—review and editing, Q.L.; visualization, H.Y.; supervision, Q.L.; project administration, H.Y.; funding acquisition, S.H. All authors have read and agreed to the published version of the manuscript.

Funding

The authors gratefully acknowledge funding from the Jiangsu Province Carbon Peak Carbon Neutral Science and Technology Innovation Special Funds Project (BE2022608), the Research and development of key technologies for the classification and utilization of steel slag resources, a key core technology project of Suzhou City facing the world (SZJB202505), and the China Construction Group Co., Ltd. Construction Waste Recycled Aggregate 3D Printing Concrete Material Research and Development and Durability Research Project (202410191).

Institutional Review Board Statement

Not applicable.

Informed Consent Statement

Not applicable.

Data Availability Statement

The data presented in this study are available upon request from the corresponding author. The data are not publicly available due to privacy.

Conflicts of Interest

The authors declare that this study received funding from China Construction Group Co., Ltd. The funder was not involved in the study design, collection, analysis, interpretation of data, the writing of this article or the decision to submit it for publication.

References

  1. Islam, S.; Islam, J.; Alam, J.B.; Chowdhury, A.S.; Hasnat, N. Partial replacement of sand by fine-grained crushed waste glass along with fly ash stabilization for geotechnical applications in pavement. Heliyon 2024, 10, e38754. [Google Scholar] [CrossRef]
  2. Boucedra, A.; Bederina, M.; Ghernouti, Y. Study of the acoustical and thermo-mechanical properties of dune and river sand concretes containing recycled plastic aggregates. Constr. Build. Mater. 2020, 256, 119447. [Google Scholar] [CrossRef]
  3. Shanmugavadivu, P.M.; Malathy, R. Effect of Physical Properties of Manufactured Sand as Fine Aggregate in Elastic and Shrinkage Properties of Concrete and Mortar. Adv. Mater. Res. 2012, 1662, 221–225. [Google Scholar] [CrossRef]
  4. Islam, Z.U.; Farooq, S.; Wali, O.; Ullah, F. Enhancing concrete properties through the utilization of steel slag as aggregate replacement. J. Build. Pathol. Rehabil. 2025, 10, 135. [Google Scholar] [CrossRef]
  5. Hosen, K.; Bărbulescu, A. Sustainable Concrete Using Ceramic Tile Waste as a Substitute for Brick Aggregate. Materials 2025, 18, 3093. [Google Scholar] [CrossRef] [PubMed]
  6. Amjad, H.; Abd-Elaal, E.-S.; Ma, X.; Benn, T.; Fisher, M. A critical review of iron ore tailings as cement and aggregate substitutes for robust infrastructure: Mechanical, durability, eco-economic, and social impacts. J. Clean. Prod. 2025, 492, 144853. [Google Scholar] [CrossRef]
  7. Ahmed, G.H. A review of “3D concrete printing”: Materials and process characterization, economic considerations and environmental sustainability. J. Build. Eng. 2023, 66, 105863. [Google Scholar] [CrossRef]
  8. Skibicki, S.; Pułtorak, M.; Kaszyńska, M.; Hoffmann, M.; Ekiert, E.; Sibera, D. The effect of using recycled PET aggregates on mechanical and durability properties of 3D printed mortar. Constr. Build. Mater. 2022, 335, 127443. [Google Scholar] [CrossRef]
  9. Wang, L.; Xiao, W.; Wang, Q.; Jiang, H.; Ma, G. Freeze-thaw resistance of 3D-printed composites with desert sand. Cem. Concr. Compos. 2022, 133, 104693. [Google Scholar] [CrossRef]
  10. Zhou, L.; Gou, M.; Ji, J.; Hou, X.; Zhang, H. Durability and hardened properties of 3D printed concrete containing bauxite tailings. Mater. Today Sustain. 2024, 25, 100704. [Google Scholar] [CrossRef]
  11. Dong, W.; Wang, J.; Hang, M.; Qu, S. Research on printing parameters and salt frost resistance of 3D printing concrete with ferrochrome slag and aeolian sand. J. Build. Eng. 2024, 84, 108508. [Google Scholar] [CrossRef]
  12. Liu, C.; Liu, H.; Wu, Y.; Wu, J.; Ding, S. Effect of X-ray CT characterized pore structure on the freeze–thaw resistance of 3D printed concrete with recycled coarse aggregate. Constr. Build. Mater. 2025, 469, 140492. [Google Scholar] [CrossRef]
  13. Pellegrino, C.; Cavagnis, P.; Faleschini, F.; Brunelli, K. Properties of concretes with Black/Oxidizing Electric Arc Furnace slag aggregate. Cem. Concr. Compos. 2013, 37, 232–240. [Google Scholar] [CrossRef]
  14. Qasrawi, H.; Shalabi, F.; Asi, I. Use of low CaO unprocessed steel slag in concrete as fine aggregate. Constr. Build. Mater. 2008, 23, 1118–1125. [Google Scholar] [CrossRef]
  15. Ozturk, M.; Akgol, O.; Sevim, U.K.; Karaaslan, M.; Demirci, M.; Unal, E. Experimental work on mechanical, electromagnetic and microwave shielding effectiveness properties of mortar containing electric arc furnace slag. Constr. Build. Mater. 2018, 165, 58–63. [Google Scholar] [CrossRef]
  16. Chadee, A.A.; Narine, K.L.; Maharaj, D.; Olutoge, F.; Azamathulla, H.M. Sustainable concrete production: Partial aggregate replacement with electric arc furnace slag. J. Mech. Behav. Mater. 2024, 33, 20240013. [Google Scholar] [CrossRef]
  17. Kwon, S.-J.; Lee, H.-S.; Yang, K.-H.; Lim, H.-S. Engineering performance evaluation of mortar with EOS (electric arc furnace oxidizing slag) as fine aggregate. J. Mater. Cycles Waste Manag. 2018, 21, 547–555. [Google Scholar] [CrossRef]
  18. Yue, H.; Hua, S.; Qian, H.; Yao, X.; Gao, Y.; Jiang, F. Investigation on applicability of spherical electric arc furnace slag as fine aggregate in superplasticizer-free 3D printed concrete. Constr. Build. Mater. 2022, 319, 126104. [Google Scholar] [CrossRef]
  19. Kim, H.; Koh, T.; Pyo, S. Enhancing flowability and sustainability of ultra high performance concrete incorporating high replacement levels of industrial slags. Constr. Build. Mater. 2016, 123, 153–160. [Google Scholar] [CrossRef]
  20. Kang, M.-C.; Lee, B.; Kang, M.; Lee, S.-J.; Pyo, S. Self-sensing properties of cementless ultra-high performance concrete (UHPC) with slag aggregates. J. Build. Eng. 2024, 86, 108863. [Google Scholar] [CrossRef]
  21. Zhang, C.; Hou, Z.; Chen, C.; Zhang, Y.; Mechtcherine, V.; Sun, Z. Design of 3D printable concrete based on the relationship between flowability of cement paste and optimum aggregate content. Cem. Concr. Compos. 2019, 104, 103406. [Google Scholar] [CrossRef]
  22. ASTM C1437-20; Standard Test Method for Flow of Hydraulic Cement Mortar. ASTM International: West Conshohocken, PA, USA, 2020.
  23. Zhou, Y.; Xiao, S.; Li, H.; Wang, C.; Li, F.; Liu, G.; Chen, Z. Study on the rheological properties and printability of multi-scale material modified mortar for 3D printing. Constr. Build. Mater. 2025, 493, 143293. [Google Scholar] [CrossRef]
  24. Xu, Z.-Y.; Zhang, D.-W.; Li, H.; Li, J.-C.; Liu, Q.; Fan, L.-H.; Wei, T.-D.; Li, H.-X. WFT-based assessment of the rheological characteristics, particle packing, and buildability of Pcc-FA-GGBFS composite materials for 3D printing. Case Stud. Constr. Mater. 2024, 21, e03857. [Google Scholar] [CrossRef]
  25. Chen, M.; Guo, X.; Zheng, Y.; Li, L.; Yan, Z.; Zhao, P.; Lu, L.; Cheng, X. Effect of tartaric acid on the printable, rheological and mechanical properties of 3D printing sulphoaluminate cement paste. Materials 2018, 11, 2417. [Google Scholar] [CrossRef]
  26. GB/T 50082-2024; Standard for Test Methods of Long-Term Performance and Durability of Ordinary Concrete. General Administration of Quality Supervision, Inspection and Quarantine of the People’s Republic of China (AQSIQ) & Standardization Administration of the People’s Republic of China (SAC): Beijing, China, 2024.
  27. EN 196-1; Methods of Testing Cement—Part 1, Determination of Strength. British Standards Institution: London, UK, 2016.
  28. Jiang, Z.; Mao, Y.; Jiao, D.; Hu, X.; Shi, C. Insights into the role of aggregate shape in enhancing rheology and reducing cement usage in concrete mixture design. J. Build. Eng. 2025, 103, 112073. [Google Scholar] [CrossRef]
  29. Roy, S.; Miura, T.; Nakamura, H.; Yamamoto, Y. Investigation on applicability of spherical shaped EAF slag fine aggregate in pavement concrete–fundamental and durability properties. Constr. Build. Mater. 2018, 192, 555–568. [Google Scholar] [CrossRef]
  30. Rahman, S.M.A.; Mahmood, A.H.; Shaikh, F.U.A.; Sarker, P.K. Fresh state and hydration properties of high-volume lithium slag cement composites. Mater. Struct. 2023, 56, 91. [Google Scholar] [CrossRef]
  31. Benavides, D.; Montero, L.T.; Aponte, D. Evaluation of fatigue performance and crack propagation in asphalt mixtures with electric arc furnace slag. Constr. Build. Mater. 2025, 471, 140704. [Google Scholar] [CrossRef]
  32. Estephane, P.; Garboczi, E.J.; Bullard, J.W.; Wallevik, O.H. Three-dimensional shape characterization of fine sands and the influence of particle shape on the packing and workability of mortars. Cem. Concr. Compos. 2019, 97, 125–142. [Google Scholar] [CrossRef]
  33. Liu, Y.; Wang, L.; Yuan, Q.; Peng, J. Effect of coarse aggregate on printability and mechanical properties of 3D printed concrete. Constr. Build. Mater. 2023, 405, 133338. [Google Scholar] [CrossRef]
  34. Zhang, Y.; Zhang, Y.; Yang, L.; Liu, G.; Chen, Y.; Yu, S.; Du, H. Hardened properties and durability of large-scale 3D printed cement-based materials. Mater. Struct. 2021, 54, 45. [Google Scholar] [CrossRef]
  35. Akçaoğlu, T. Determining aggregate size & shape effect on concrete microcracking under compression by means of a degree of reversibility method. Constr. Build. Mater. 2017, 143, 376–386. [Google Scholar] [CrossRef]
  36. Lyu, K.; She, W.; Chang, H.; Gu, Y. Effect of fine aggregate size on the overlapping of interfacial transition zone (ITZ) in mortars. Constr. Build. Mater. 2020, 248, 118559. [Google Scholar] [CrossRef]
  37. Ahmed, N.; Karim, M. Numerical study of the influence of W/C ratio and aggregate shape and size on the ITZ volume fraction in concrete. Constr. Build. Mater. 2022, 351, 128950. [Google Scholar] [CrossRef]
  38. Lam, M.N.-T.; Jaritngam, S.; Le, D.-H. Roller-compacted concrete pavement made of Electric Arc Furnace slag aggregate: Mix design and mechanical properties. Constr. Build. Mater. 2017, 154, 482–495. [Google Scholar] [CrossRef]
  39. Arribas, I.; Santamaría, A.; Ruiz, E.; Ortega-López, V.; Manso, J.M. Electric arc furnace slag and its use in hydraulic concrete. Constr. Build. Mater. 2015, 90, 68–79. [Google Scholar] [CrossRef]
  40. Jing, W.; Jiang, J.; Ding, S.; Duan, P. Hydration and Microstructure of Steel Slag as Cementitious Material and Fine Aggregate in Mortar. Molecules 2020, 25, 4456. [Google Scholar] [CrossRef]
  41. Wang, L.; Zheng, D.; Zhang, S.; Cui, H.; Li, D. Effect of nano-SiO2 on the hydration and microstructure of Portland cement. Nanomaterials 2016, 6, 241. [Google Scholar] [CrossRef]
  42. Zhang, S.; Fan, Y.; Li, N. Pore structure and freezing resistance of nanoclay modified cement based materials. Mater. Res. Innov. 2014, 18, S2-358–S2-362. [Google Scholar] [CrossRef]
  43. Kruger, J.; du Plessis, A.; van Zijl, G. An investigation into the porosity of extrusion-based 3D printed concrete. Addit. Manuf. 2021, 37, 101740. [Google Scholar] [CrossRef]
  44. Hwang, E.H.; Kim, J.M.; Yeon, J.H. Characteristics of polyester polymer concrete using spherical aggregates from industrial by-products. J. Appl. Polym. Sci. 2013, 129, 2905–2912. [Google Scholar] [CrossRef]
Figure 1. Particle size distribution.
Applsci 15 11933 g001
Figure 2. Spherical EAFS fine aggregate.
Applsci 15 11933 g002
Figure 3. XRD pattern of EAFS.
Applsci 15 11933 g003
Figure 4. Schematics of the 3D printing system: (a) control system and (b) printing equipment.
Applsci 15 11933 g004
Figure 5. (a) Casting mold and (b) 3D-printed specimen.
Applsci 15 11933 g005
Figure 6. The compressive strength of 3DPC: (a) direction X and (b) direction Y.
Applsci 15 11933 g006
Figure 7. The flexural strength of 3DPC: (a) direction X and (b) direction Y.
Applsci 15 11933 g007
Figure 8. Time-dependent flowability under different EAFS replacement ratios.
Applsci 15 11933 g008
Figure 9. Relationship between the mini-slump and rest time.
Applsci 15 11933 g009
Figure 10. Effect of different EAFS replacement ratios on apparent viscosity. (a) The group with a 0% EAFS replacement ratio. (b) The group with a 40% EAFS replacement ratio. (c) The group with a 100% EAFS replacement ratio.
Applsci 15 11933 g010
Figure 11. Relationship between construction height, width, and EAFS content.
Applsci 15 11933 g011
Figure 12. Twenty-eight-day compressive strength of 3DPC and MC specimens under different EAFS replacement ratios.
Applsci 15 11933 g012
Figure 13. Changes in the compressive strength of 3DPC specimens in (a) the direction X and (b) direction Y under different EAFS replacement ratios before freeze–thaw cycles.
Applsci 15 11933 g013
Figure 14. Flexural strength of 3DPC at different EAFS replacement ratios.
Applsci 15 11933 g014
Figure 15. Effect of aggregate morphology on crack propagation of (a) RS and (b) EAFS.
Applsci 15 11933 g015
Figure 16. Changes in compressive strength of 3DPC specimens in (a) direction X and (b) direction Y under different EAFS replacement ratios after freeze–thaw cycles.
Applsci 15 11933 g016
Figure 17. Mass loss rate of 3DPC specimens under different EAFS replacement ratios after freeze–thaw cycles.
Applsci 15 11933 g017
Figure 18. The apparent morphology of (a) R0, (b) S1, (c) S2, (d) S3, (e) S4, and (f) S5 with different replacement ratios of EAFS after 200 freeze–thaw cycles.
Applsci 15 11933 g018
Figure 19. (a,b) SEM images of 3DPC samples with RS aggregate after 28 days.
Applsci 15 11933 g019
Figure 20. (a,b) SEM images of 3DPC samples with EAFS aggregate after 28 days.
Applsci 15 11933 g020
Figure 21. SEM images of 3DPC: (a) sample of R0; (b) sample of S1; (c,d) sample of S4 with different EAFS replacement ratios after freeze–thaw cycles.
Applsci 15 11933 g021
Figure 22. Cumulative porosity before and after freeze–thaw cycles.
Applsci 15 11933 g022
Figure 23. Pore distribution before and after freeze–thaw cycles.
Applsci 15 11933 g023
Figure 24. Proportion of pores.
Applsci 15 11933 g024
Table 1. Chemical composition (%) of raw materials.
CompositionSiO2CaOAl2O3Fe2O3TiO2MgOSO3MnOOtherLOI
GGBS31.8639.5515.970.230.649.271.14No0.4081.23
OPC27.6148.9810.343.390.472.321.850.0920.373.66
EAFS12.7724.534.9346.740.463.140.144.851.8020.55
Table 2. Mix proportions and notation.
Group NumberRS/A (%)EAFS/A (%)Activator (%)Accelerator (%)PVA (%)EVA (%)ATm (%)
R0100020.130.160.82.3
S1802020.130.160.82.3
S2604020.130.160.82.3
S3406020.130.160.82.3
S4208020.130.160.82.3
S5010020.130.160.82.3
Table 3. Aggregate physical properties.
AggregateApparent Density/(kg/m3)Bulk Density/(kg/m3)Fineness ModulusAbsorption (%)
EAFS368822352.860.02
RS259315962.370.21
Table 4. Compressive and flexural strengths of specimens at different EAFS replacement ratios.
GroupCompressive Strength (MPa)Flexural Strength (MPa)
Direction XDirection YMCDirection XDirection YMC
R028.1527.7535.206.506.707.46
S126.3226.2834.666.116.297.05
S228.1528.1335.096.987.458.17
S328.6828.3137.857.368.138.54
S431.0328.4437.927.197.929.04
S532.0328.7238.087.908.498.99
Table 5. Compressive and flexural strengths of specimens at different EAFS replacement ratios after freeze–thaw cycles (e.g., direction X).
Freeze–Thaw Cycles Group050100150200050100150200
Compressive Strength (MPa)Flexural Strength (MPa)
R028.1527.0624.5021.7117.96.508.166.755.003.42
S126.3224.5223.2020.7117.386.117.856.694.422.65
S228.1526.1022.9019.2515.306.988.727.005.303.30
S328.6827.0725.0723.1520.067.368.496.976.134.64
S431.0328.9127.1024.2621.327.198.927.725.684.74
S532.0328.5626.8224.0621.167.908.767.385.934.95
Table 6. The total porosity of 3DPC specimens before and after freeze–thaw cycles.
GroupR0R0 (F-T)S2 (F-T)S4 (F-T)
Total porosity18.69%21.82%22.0%20.02%
Table 7. A comparative analysis between this study and the relevant studies.
Comparison ItemsThis StudyRef. [20]Ref. [13]
Forming method3D printingCasting moldCasting mold
Cementitious material mix ratioGGBS:OPC = 7:3GGBFS:FA:SF = 688:172:45CEM II-A/L 42.5R (330–355 kg/m3)
EAFS replacement ratio (%)0–10055.460–100
Compressive strength improvement rate (%)−6.50–13.78−2.21–−9.93−7.20–1.77
Other relevant properties
  • Flowability shows an increasing trend with the rise of the EAFS replacement ratio.
  • Flexural strength of 3DPC specimens increases by 7.3–26.71% with the rise of the EAFS replacement ratio.
  • The ITZ between EAFS and paste is narrower than that between RS and cement.
  • After freeze–thaw cycles, the total porosity of group S4 is 1.8% lower than that of R0, with the pore structure optimized.
  • EAF slag-containing mixtures show higher fluidity (mini-slump: 200–230 mm) than silica sand-containing ones (180–190 mm).
  • Self-sensing performance: EAF slag group shows low FCR noise (EAF_0.7% RMSE = 0.5710) and sensitive initial crack detection; the sand group still has high noise even with carbon fibers.
  • Strength increases by 18.03% (Mix5) after freeze–thaw cycles; strength loss of Mix4 reaches 22.17% after dry–wet cycles, which is more significant than the traditional group’s 13.74%.
Disclaimer/Publisher’s Note: The statements, opinions and data contained in all publications are solely those of the individual author(s) and contributor(s) and not of MDPI and/or the editor(s). MDPI and/or the editor(s) disclaim responsibility for any injury to people or property resulting from any ideas, methods, instructions or products referred to in the content.