Abstract
In this paper, 15-min production data from renewable energy sources (RES), aggregated by technology (onshore wind, offshore wind, solar) and by country (Germany, Austria, Hungary), are analyzed. The concept of a confidence interval is introduced as a parameter for practical use in power-system management. In probabilistic dimensioning of the FRR (Frequency Restoration Reserve; sometimes also called “secondary reserve”), it is necessary to ensure reserve sufficiency for a high percentage of time p, in the order of 99.9%. The confidence interval is specified by upper and lower deviation limits, expressed as percentages of the total installed capacity of the observed RES system, not to be exceeded with a probability greater than . The concept of the “regulation multiplier” is also considered, which essentially indicates how many additional megawatts of RES capacity can be installed for each added megawatt of FRR capacity, ceteris paribus. Finally, a previously experimentally developed regulation-multiplier model is verified by replicating the original research on a new dataset used in this paper.
1. Introduction
Decarbonizing electricity generation, as the largest polluting industrial sector, is one of the key components of the comprehensive green transition for society and the economy. This process involves replacing fossil energy sources, such as coal and gas power plants, with renewable energy sources (RES), like wind and solar power plants. While conventional power plants are characterized by stable and controllable operation, electricity generation from wind and solar is subject to significant variations across all time horizons because it depends on the immediate availability of the energy source, which can be forecasted but not controlled.
Consequently, the increasing share of RES in the generation mix introduces several distinct challenges, arising from a low capacity factor, typically around 30% for wind farms. Ref. [1] discusses system methods for capacity credit estimation. Ref. [2] provides a recent Western U.S. reassessment, while ref. [3] examines variability in Croatia as an example. A low capacity credit, estimated at around 5%, was found in [4]. Some extremely rapid changes in instantaneous generation capacity, occurring within a time frame of up to 15 min, were documented in [5]. These quick changes demand the maintenance of an increasing amount of FRR capacities. It is important to emphasize that all three challenges, although related, are fundamentally different, and the methods for addressing them vary significantly.
Regarding the capacity factor, its value of approximately 30% implies that to generate a sufficient total amount of energy from such sources, it would be necessary to build 1/0.3 = 3.33 times more generating capacity than would be required if power plants operated continuously at full power. The capacity factor represents the lower limit of the required generating capacity in a future system where RES power plants will dominate the production part of the power system.
However, the capacity credit imposes stricter constraints. It indicates the portion of the total installed generating capacity of a given technology that can be relied upon for meeting peak demand for a very high percentage of the time (e.g., 99.9%). Given the low capacity factor and existing correlations in wind and solar radiation statistics, available sources suggest that, under conditions of high RES penetration, the capacity credit may be around 5% [4]. This would mean that, in the absence of any countermeasures, approximately 20 times more generating capacity would need to be installed than the expected peak load. Additionally, transmission networks would need to be upgraded to transport significantly larger quantities of energy per unit of time compared to the current situation. Nevertheless, given the existing technological solutions, such as pumped storage plants, battery storage systems, etc., this excessive overbuilding of capacity will not be necessary. However, the capacity factor will fundamentally constrain it.
Finally, ensuring the system’s ability to promptly compensate for very rapid fluctuations in generation from variable RES on a minute-by-minute basis is the third component of the comprehensive variability problem. The stability of operations and energy supply, which is unquestionably the ultimate societal demand today, directly depends on this aspect. This is the main topic of this paper, where we present experimentally determined characteristics of rapid fluctuations in generation and propose, on a preliminary level, two approaches for statistically modeling this phenomenon, which would be of practical use to transmission system operators (TSOs). We also provide a comparison with previous work, which similarly analyzed and modeled rapid generation fluctuations and the associated demand for FRR caused by RES.
A comprehensive understanding of wind-power generation statistics is vital, not only for managing short-term balancing costs but also for ensuring grid security. For example, ref. [6] suggested a method to enhance the stability of power systems with substantial renewable energy integration by mitigating fluctuations that challenge grid stability under stress conditions. Ref. [7] applied the Gravitational Search Algorithm (GSA) to study the effects of wind-power variability on unit commitment. Meanwhile, ref. [8] utilized meteorological data to explore the extreme variability of wind-power production. Although this analysis does not focus on extreme wind events, it emphasizes the importance of considering the distribution tails in such contexts.
Recent studies in the broader domain of power-system flexibility provide complementary perspectives that situate the present work within a wider context. Advanced dynamic controllers for battery energy storage systems (BESS) have been shown to significantly improve the provision of frequency-regulation reserves by considering state of charge and real-time measurements [9]. Likewise, cluster-based methods for distributed generation explicitly account for frequency-regulation response speed, offering insights into how aggregation can reduce system complexity while enhancing flexibility [10]. On the forecasting side, increasingly accurate high-resolution models now extend the predictability of wind resources up to several hours ahead [11], while physics-based approaches to ultra-short-term wind-power forecasting in complex terrain have achieved notable improvements in predicting ramp events [12]. Complementing these methods, the design of frequency-regulation scenarios for battery energy storage in the PJM market underscores the importance of realistic short-term signals for evaluating system response and reserve requirements [13]. In parallel, probabilistic optimization techniques address the risks of power and energy imbalance under high shares of wind and solar [14], while probabilistic long-term assessments stress the importance of geographic location and extreme low-resource periods (so-called “Dunkelflaute” events) for system robustness [15]. On the market side, machine-learning models for FRR procurement have demonstrated how dynamic sizing can reduce inefficiencies in systems with significant variable renewable sources (vRES) penetration [16]. Finally, broader reviews of vRES integration emphasize the combined role of advanced storage, virtual power plants, and flexible cross-border interconnection as key strategies for mitigating variability in grid-connected systems [17].
This study contributes to understanding the actual degree of statistical cancellation of fast production changes in RES systems, using data from Germany, Austria, and Hungary, where a substantial amount of variable renewable sources has grown over the last decade and is now operational. This cancellation arises from summing the contributions of numerous individual plants with partially correlated production statistics. Ideally, the overall volatility of production will decrease with the increase in installed capacities and the spatial diversification of plants. Reducing volatility has several aspects. In this work, we focus specifically on how the statistical behavior of 15-min production changes is influenced by the overall size and spatial diversification of the RES portfolio. It is worth noting that the statistical behavior of 15-min changes does not necessarily apply to the statistical patterns of the energy produced, as it is well known that total production and short-term production changes follow very different statistical distributions (see, e.g., [5]).
In the operations-focused stream, ref. [18] proposes a probabilistic reserve decision-making scheme based on cumulative-probability approximations derived from forecast errors, offering a clear risk-to-reserve translation within a model/forecast pipeline. Our approach contrasts using measured 15-min production deltas to construct empirical-exceedance bounds directly for FRR headroom.
Relatedly, ref. [19] demonstrates operating dynamic reserve dimensioning built on probabilistic forecasts (e.g., CAISO use cases), emphasizing adaptive sizing as conditions evolve. We similarly target operational usability but avoid forecast-model assumptions by estimating tail behavior from observed ramp distributions.
At the policy/operations interface, the ENTSO-E Biennial Report on Operational PRA [20] documents Europe’s transition toward probabilistic, risk-based security assessment. This institutional context motivates our data-first framing of acceptable default risk r mapped to FRR headroom.
On spatial variability, ref. [21] provides evidence and tooling for exploring cross-country wind resource variability and correlation structures across Europe, supporting the role of geographic diversification. Our multi-country aggregation results are consistent with these correlation patterns at 15-min resolution.
From a meteorological perspective, ref. [22] links regime-dependent weather dynamics to wind-power variability over Western Europe, illuminating mechanisms behind tail behavior and low-wind episodes. These findings help contextualize why empirical tails—and thus FRR needs—differ across regions and seasons.
1.1. Research Gap
Existing studies on RES variability and reserve dimensioning typically proceed via forecasting models, parametric assumptions on ramp distributions, or system-level simulations of reserve activation. By contrast, the present work models directly measured short-horizon production changes at 15-min resolution, normalized to installed capacity, and uses the resulting empirical-exceedance bounds to map an acceptable default risk r to required FRR headroom. To our knowledge, this power-system operational framing—centered on the practically salient question of whether FRR capacity is sufficient or short, and how often such shortfalls occur—has been only rarely addressed in the literature. This gap motivates a data-first, technology-agnostic treatment that remains close to system-operator practice.
A second gap concerns the cross-context generality of the regulation-multiplier relation (see Section 3.2). An empirically obtained functional form, , was previously reported using a different dataset from an American wind-plant portfolio [5]. Here, we provide an experimental verification of the same relation on a wide-area European portfolio and show that the functional behavior extends not only to onshore wind but also to solar generation. This strengthens the evidence that the multiplier’s dependence on acceptable default risk r is robust across regions and technologies.
Finally, while our dataset covers only several countries, this selection spans a large and diverse geographic area and exhibits statistical characteristics consistent with [5]. Given our objective—to establish and validate an operational, empirical mapping from production-change statistics to FRR headroom—the inclusion of additional countries would primarily expand scope rather than alter the core findings. Accordingly, we deem the chosen coverage sufficient and proportionate to the research problem.
1.2. Scope and Limitations
The analysis is based on directly measured 15-min production deltas for a selected set of European countries and normalizes changes to end-of-year installed capacity; the results therefore pertain to short-horizon FRR dimensioning rather than adequacy or long-term planning. We do not explicitly co-model load, non-RES generation portfolios, or FRR activation dynamics, and we treat the rolling estimation window as approximately stationary over the horizon considered. “Confidence intervals” are used in an operational, empirical-exceedance sense (tail bounds), not as parametric confidence sets for population means. Data quality and coverage limitations (e.g., sub-regional resolution and harmonization across sources) may affect tail estimates, especially at very low acceptable default risks. All the above modeling simplifications help present a clearer baseline picture without cluttering it with excessive detail; however, they can and should be addressed in future research.
1.3. Nomenclature
The abbreviations for variables used throughout this article are constructed by combining the abbreviations for production technology with the respective country. The production technology abbreviations are as follows:
- Sol: solar
- Woff: wind, offshore
- Won: wind, onshore
The country abbreviations are as follows:
- AT: Austria
- H: Hungary
- D: Germany
- All: all countries
For instance, “Won_AT” represents onshore wind in Austria. “Won_Sol_D” indicates the combined production of onshore wind and solar in Germany, and “Won_Woff_AT_D” refers to onshore and offshore wind production in both Austria and Germany.
2. Data Analysis, Preparation, and Methods
In this paper, we evaluate data from the Central European region, concentrating on Germany, Austria, and Hungary, to assess the variability and the effectiveness of geographic diversification in mitigating overall variability relative to installed capacities.
All measured production data, categorized by country and technology, were obtained from the ENTSO-E Transparency Platform (https://transparency.entsoe.eu (accessed on 6 November 2025)). The dataset, accessed on 14 October 2022, spans from 1 January 2015, at 00:00 hours to 12 October 2022, at 23:59 hours. Over the stated period, 272,832 intervals, each 15 min long (equal to 88,208 h, or 2842 days), were analyzed. The initial data set covered a much broader range of countries and variables; however, the 15-min readings over the entire period were available from only the three countries mentioned above.
The data underwent initial validation to ensure accuracy, with any errors, incomplete entries, or significant outliers corrected as needed. For Germany, no corrections were required, and the data for Austria and Hungary similarly did not need outlier adjustments. However, Austria had a 0.01% rate of missing data (%NaN), while Hungary’s rate was 0.47%. Overall, only 0.16% of the data required correction, rendering the potential margin of error negligible.
Regarding installed capacities by country and technology, data from ENTSO-E were cross-referenced with the IRENA Renewable Energy Statistics database (www.irena.org). This comparison was essential because of some discrepancies, particularly in Hungarian data related to solar production in the early years, where instances of production exceeding installed capacity appeared in the ENTSO-E records.
Another challenge involved normalizing production data to installed capacities, as capacity data are typically reported annually and usually reflect year-end values. This is particularly relevant for renewable energy sources (RES), where such discrepancies are often unavoidable. Nevertheless, in cases where annual capacity increases were relatively modest, the overall impact of these errors was considered minimal.
Table 1 summarizes end-of-year installed capacities for wind and solar in Germany, Austria, and Hungary over 2015–2022; these values normalize the 15-min changes used in our analysis. Installed capacity growth is steepest in Germany (wind and solar), with Austria and Hungary increasing mainly in solar; these differences matter because our 15-min deltas are expressed as a percentage of installed capacity, not absolute MW.

Table 1.
End-of-year installed capacities (MW) for wind and solar in Germany, Austria, and Hungary.
For the statistical analysis, the focus is on assessing the characteristics of 15-min changes in renewable energy output in the selected countries. These changes are critical for the operational grid management, as they necessitate the use of FRR. Given the high cost of these reserves and the limited availability of dispatchable power plants in minute-level intervals, short-term variability becomes a key economic consideration in integrating renewable sources. Yet, it is worth noting that the statistical behavior of 15-min changes does not necessarily apply to the statistical patterns of the energy produced, as it is well known that total production and short-term production changes follow very different statistical distributions (see, e.g., [5]).
3. Statistical Characterization of the 15-Min Production Changes
Alongside some traditional statistical metrics, we shall derive two indicators that effectively capture renewable energy variability from the perspective of grid management, making them particularly relevant for transmission system operators.
3.1. Confidence Intervals
The first indicator is referred to as the “confidence interval.” Figure 1 illustrates the 15-min changes in all variables analyzed throughout the aforementioned period. The horizontal axis represents the number of hours elapsed since 1 January 2015, at 00:00, while the vertical axis shows 15-min power production changes normalized to the installed capacities of each group of renewable sources. It becomes clear that the majority of these changes are tightly clustered around zero.
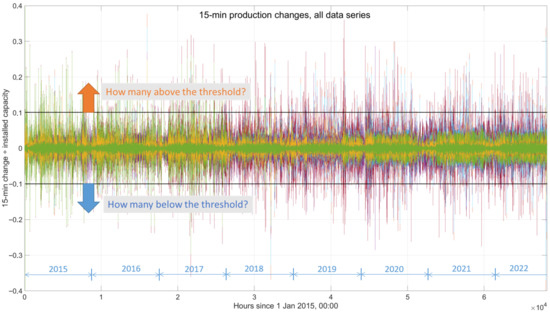
Figure 1.
15-min power production changes in all areas, coded in different colors, and each normalized to their respective installed capacities, and an example of the calculation of the probability distribution function.
One can easily calculate the cumulative probability that the observed 15-min changes surpass a predefined threshold of of installed capacity in the positive direction or in the negative direction. Figure 1 shows examples for the thresholds of +10% and −10%, where counting the number of samples above 0.1 and below −0.1, respectively, and dividing these by the total number of samples gives the one-sided probabilities at those levels. Interestingly, the two probabilities are unequal, meaning the distribution density is asymmetric around zero. By calculating these probabilities for varying and values, one can determine the range within which the 15-min normalized changes will likely fall, with a “reasonably low” probability p of exceeding these limits. This range is then called the “confidence interval,” representing a one-sided probability confidence level of p (or a two-sided confidence level of ).
Table 2 presents a selection of confidence intervals at two-sided probability levels of 0.2%, 2%, and 4%. These were derived from several variables, or sums of variables, used in the research. Figure 2 visualizes the 0.2% two-sided confidence interval for Won_Sol_AT on a lin-log scale.
Table 2.
Selected confidence intervals at various two-sided default probabilities.

Figure 2.
Explanation of the confidence interval at a two-sided default probability of 0.2% for the dataset Won_Sol_AT.
The concept of the confidence interval in the context of this paper, as well as its practical significance for managing the power system, can be explained with the help of Figure 2. It shows the curves of three measured probability distribution functions, plotted on a lin-log scale. Let us examine the curve Won_Sol_AT. Suppose the transmission system operator finds it acceptable to fall short on FRR capacity for 0.2% of the time or less. The graph directly shows the width of the confidence interval, which covers the range between −5.8 and 7.0 percent of the installed capacity of renewable sources. This means that it is 99.8% certain that the 15-min changes will stay within these limits. (Note that the need to secure a certain capacity for FRR is slightly lower in the negative direction.)
3.2. Regulation Multipliers
The second indicator is closely linked to the first. If the confidence-interval boundaries are at a probability level of p, we define a quantity , which we call the “regulation multiplier.” Given that and may differ slightly, we can either use the less favorable (higher) value or take the average. Precision, in this case, is not crucial. For every additional megawatt of capacity reserved for secondary regulation (FRR), megawatts of newly installed capacity of renewable sources can be added while maintaining a one-sided probability of p for exceeding the confidence interval (or the corresponding two-sided probability of ).
This quantity was introduced in an earlier study based on the measured output of a large system of wind plants installed in the U.S.A. [5]. It was shown that for a large-scale wind-power system analyzed in that study, the regulation multiplier can be accurately described by the function , where r represents the “acceptable level of default risk” (essentially, the cumulative probability under a different term), and A, B, and C are constants found by least square fit to the observed values. In the current study, we validated the model using data from Germany, Austria, and Hungary.
The concept of the “regulation multiplier” merits further discussion because the situation is not as simple as it may seem at first glance. It provides a rough estimate of the FRR capacity required to maintain a given probability of not exceeding regulation capacity. However, our simple definition disregards the variability of other generation and consumption elements within the power system. Furthermore, the variability introduced by newly added renewable sources does not linearly add to the existing variability. Most probably, a more complex mathematical behavior should be expected.
Another factor contributing to the inaccuracy of the value is that FRR engagement rarely happens exactly at the midpoint of the capacity range. For example, when regulation is already activated in the positive region, the available capacity to handle further upward changes is often significantly lower than the nominal upward reserve capacity.
Despite these limitations, the “regulation multiplier” remains a useful heuristic for assessing the additional load introduced by newly installed renewable sources into the power grid. It allows for comparisons between different portfolios of variable renewable energy sources, but requires further research to refine its accuracy. Obviously, it calls for further research.
Figure 3 provides an example of an function derived from the datasets Won_D and Sol_AT, using the positive branch of the probability distributions in both cases. The fit is excellent for small acceptable risk values, which is the practical regime for FRR (Frequency Restoration Reserve) dimensioning. As mentioned earlier, the negative branches would yield slightly higher values, which is not significant for this research but could be relevant in future, more detailed studies. It is obvious that the data analyzed here fit very well with the regression model developed in [5] from the American data. Moreover, it looks like the regulation multipliers derived from the solar production data of short-term changes fit the same type of model, just as well as wind.
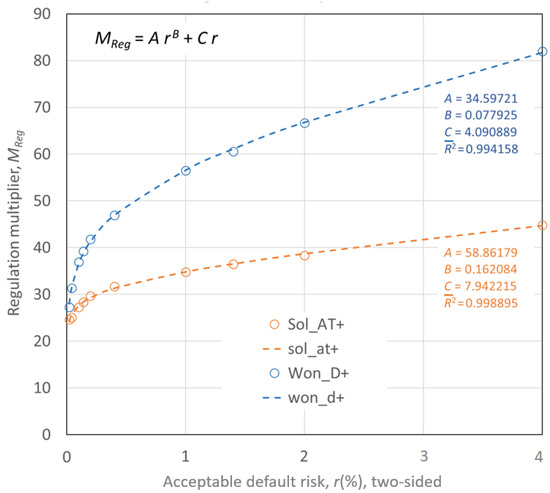
Figure 3.
Regulation multipliers for the positive branches of the probability distribution functions of the datasets Won_D and Sol_AT, and the fit to the regression model of the form from [5]. The dots mark experimentally obtained data points, while the dashed curves are the best-fit regression functions .
It is worth mentioning that the model applies only to smaller values of acceptable default risks, being very precise for the smallest ones, as shown in [5]. This is more than sufficient in a practical sense because the power-system operation requirements are very tight. As the new European legislation promotes a probabilistic approach to system reserve planning [23], which is a consequence of the ever-increasing share of RES seeking connection to the grid, certain small probabilities of temporarily running short of FRR capacity are allowed. However, they are limited to up to 0.1% or even less of the time (two-sided probability), which corresponds to about 9 h per year [24]. Recent EU practice favors probabilistic FRR dimensioning [23].
4. Discussion
From Table 2 and Figure 2, the marginal benefit of narrowing the empirical confidence interval declines as the cumulative probability increases; equivalently, additional FRR headroom delivers diminishing returns at higher acceptable default risks r. In contrast, within the low-r region that is operationally relevant for system security, the marginal benefit remains substantial—consistent with the regulation-multiplier curves in Figure 3.
System size and geographic spread materially affect the 15-min production-change statistics. In general, larger and more spatially diversified portfolios yield tighter confidence intervals: for onshore wind, Hungary exhibits wider intervals than Austria, and both are wider than Germany. Aggregating onshore wind production across all three countries further reduces the intervals relative to any single area, highlighting diversification benefits.
An exception occurs in the solar data, where Austria shows narrower confidence intervals than Germany despite the latter’s larger capacity. This counterintuitive result merits targeted investigation with higher-resolution inputs (e.g., sub-regional production and irradiance), as it may reflect structural differences in isolation regimes, spatial siting, or data granularity.
The regulation-multiplier specification , originally reported in [5], is corroborated here with a longer time span and a portfolio of substantially greater installed capacity and geographic dispersion. The observed fit and behavior extend to solar, whose 15-min production-change statistics display analogous short-horizon properties to wind.
These findings motivate two practical extensions. First, a refined multiplier should explicitly incorporate other sources of short-term variability (load and non-RES generation) and the dynamics of FRR engagement by combining system-level operational traces with the differential RES data used here. Second, because even total-country productions remain only partially correlated at 15-min resolution, coordinated cross-border siting and portfolio design could be evaluated as policy instruments to dampen short-term variability under technical and economic constraints.
OperationalUse for Real-Time FRR Support
Transmission system operators can leverage rolling empirical distributions of 15-min RES production deltas to establish a continuous mapping from an acceptable default risk r to the corresponding FRR headroom requirement. In practice, this mapping supports two complementary operational layers:
- (i)
- Day-ahead and intraday planning. Using forecasted, installed-capacity–normalized deltas together with the empirical confidence-interval bounds and , operators set target FRR upward and downward headroom.
- (ii)
- Real-time adaptation. At each dispatch interval, tail probabilities are re-estimated from a recent rolling window (e.g., the past 1–4 weeks); is updated accordingly, and FRR set-points are adjusted if the available headroom approaches the relevant bound.
The procedure is technology-agnostic and computationally light, and it is consistent with probabilistic FRR dimensioning principles, translating observed short-term RES ramps into explicit FRR headroom targets.
5. Conclusions and Further Research
This study develops an operational, data-first mapping from empirically observed 15-min RES production changes (normalized to installed capacity) to required FRR headroom at a selected acceptable default risk r. The evidence indicates a clear diminishing marginal benefit from additional FRR headroom as r increases, whereas in the low-r region—relevant for secure system operation—the marginal benefit remains substantial. The regulation-multiplier relation , originally obtained on a different dataset [5], is experimentally verified on a broader European portfolio and is observed for both onshore wind and solar. Geographic aggregation tightens empirical confidence intervals, consistent with diversification; an observed Austria–Germany discrepancy in solar warrants targeted investigation. Although the dataset covers several countries, the geographic span is large and the statistics are consistent with [5], suggesting that adding data from more countries would expand the scope but is unlikely to alter the core operational mapping established here.
Further research. Extending coverage and granularity to sub-regional data to examine spatial and meteorological drivers of tails would be useful. Elaborating the regulation-multiplier concept by integrating additional sources of short-term variability (load and non-RES generation) and FRR activation dynamics may enable joint distributions and time-coupled risk assessments. Possibilities for international coordination policies that would minimize joint variability subject to technical and economic constraints may be worth further investigation, taking into account, however, additionally incurred costs that may arise, such as increased need for transmission interconnections. Finally, from the more directly applicative needs, rolling-window estimation schemes for real-time applications, including stability of under seasonal shifts and structural breaks, may be explored.
Author Contributions
Conceptualization, D.S., L.T.G. and G.S.; Methodology, D.S., L.T.G. and G.S.; Software, D.S. and L.T.G.; Validation, D.S., L.T.G. and G.S.; Formal analysis, D.S., L.T.G. and G.S.; Investigation, D.S., L.T.G. and G.S.; Resources, D.S., L.T.G. and G.S.; Data curation, D.S., L.T.G. and G.S.; Writing – original draft, D.S.; Writing – review & editing, L.T.G. and G.S.; Visualization, D.S.; Supervision, D.S.; Project administration, D.S.; Funding acquisition, L.T.G. All authors have read and agreed to the published version of the manuscript.
Funding
This research received no external funding. The APC was funded by Zagreb University of Applied Sciences, Croatia.
Institutional Review Board Statement
Not applicable.
Informed Consent Statement
Not applicable.
Data Availability Statement
All data used in this study are publicly available from the ENTSO-E Transparency Platform (https://transparency.entsoe.eu (accessed on 6 November 2025)) and the IRENA Renewable Energy Statistics database (https://www.irena.org (accessed on 6 November 2025)). No new data were created.
Conflicts of Interest
The authors declare no conflicts of interest. The funders had no role in the design of the study; in the collection, analyses, or interpretation of data; in the writing of the manuscript; or in the decision to publish the results.
References
- Ensslin, C.; Milligan, M.; Holttinen, H.; O’Malley, M.; Keane, A. Current Methods to Calculate Capacity Credit of Wind Power. In Proceedings of the 2008 IEEE Power and Energy Society General Meeting: Conversion and Delivery of Electrical Energy in the 21st Century, Pittsburgh, PA, USA, 20–24 July 2008; IEEE: Piscataway, NJ, USA, 2008; pp. 1–3. [Google Scholar] [CrossRef]
- Jorgenson, J.; Awara, S.; Stephen, G.; Mai, T. A Systematic Evaluation of Wind’s Capacity Credit in the Western United States. Wind Energy 2021, 24, 1107–1121. [Google Scholar] [CrossRef]
- Horváth, L.; Beljan, D.; Elezović, M.; Marić, A. Power Variability of Wind and Solar Production Portfolio in the Republic of Croatia. J. Energy 2022, 71, 29–34. [Google Scholar] [CrossRef]
- Ssengonzi, J.; Johnson, J.X.; DeCarolis, J.F. An Efficient Method To Estimate Renewable Energy Capacity Credit at Increasing Regional Grid Penetration Levels. Renew. Sustain. Energy Transit. 2022, 2, 100033. [Google Scholar] [CrossRef]
- Sabolić, D.; Župan, A.; Malarić, R. Statistical Properties of Electricity Generation From a Large System of Wind Plants and Demand for Fast Regulation. J. Sustain. Dev. Energy Water Environ. Syst. 2017, 5, 447–465. [Google Scholar] [CrossRef][Green Version]
- Morel, J.; Obara, S.; Morizane, Y. Stability Enhancement of a Power System Containing High-penetration Intermittent Renewable Generation. J. Sustain. Dev. Energy Water Environ. Syst. 2015, 3, 151–162. [Google Scholar] [CrossRef]
- Ji, B.; Yuan, X.; Chen, Z.; Tian, H. Improved Gravitational Search Algorithm for Unit Commitment Considering Uncertainty of Wind Power. Energy 2014, 67, 52–62. [Google Scholar] [CrossRef]
- Cannon, D.J.; Brayshaw, D.J.; Methven, J.; Coker, P.J.; Lenaghan, D. Using Reanalysis Data to Quantify Extreme Wind Power Generation Statistics: A 33 Year Case Study in Great Britain. Renew. Energy 2015, 75, 767–778. [Google Scholar] [CrossRef]
- Tsai, Y.S.; Chen, C.W.; Kuo, C.C.; Chen, H.C. Design of an Enhanced Dynamic Regulation Controller Considering the State of Charge of Battery Energy Storage Systems. Appl. Sci. 2024, 14, 2155. [Google Scholar] [CrossRef]
- Xu, Y.; Hu, P.; Zhang, F.; Zhou, T. Distributed Generation Cluster Division Method Considering Frequency Regulation Response Speed. Appl. Sci. 2024, 14, 2432. [Google Scholar] [CrossRef]
- Elmousalami, H.; Alnaser, A.A.; Kin Peng Hui, F. Advancing Smart Zero-Carbon Cities: High-Resolution Wind Energy Forecasting to 36 Hours Ahead. Appl. Sci. 2024, 14, 11918. [Google Scholar] [CrossRef]
- Michos, D.; Catthoor, F.; Foussekis, D.; Kazantzidis, A. Ultra-Short-Term Wind Power Forecasting in Complex Terrain: A Physics-Based Approach. Energies 2024, 17, 5493. [Google Scholar] [CrossRef]
- Zhang, Y.; Anvari-Moghaddam, A.; Peyghami, S.; Blaabjerg, F. Novel Frequency Regulation Scenarios Generation Method Serving for Battery Energy Storage System Participating in PJM Market. Energies 2024, 17, 3479. [Google Scholar] [CrossRef]
- Shi, J.; Qin, J.; Li, H.; Li, Z.; Ge, Y.; Liu, B. Probabilistic Power and Energy Balance Risk Scheduling Method Based on Distributed Robust Optimization. Energies 2024, 17, 4894. [Google Scholar] [CrossRef]
- Berna-Escriche, C.; Álvarez Piñeiro, L.; Blanco, D. Forecasts Plus Assessments of Renewable Generation Performance, the Effect of Earth’s Geographic Location on Solar and Wind Generation. Appl. Sci. 2025, 15, 1450. [Google Scholar] [CrossRef]
- Passagem dos Santos, J.; Algarvio, H. A Machine Learning Model for Procurement of Secondary Reserve Capacity in Power Systems with Significant vRES Penetrations. Energies 2025, 18, 1467. [Google Scholar] [CrossRef]
- Ejuh Che, E.; Roland Abeng, K.; Iweh, C.D.; Tsekouras, G.J.; Fopah-Lele, A. The Impact of Integrating Variable Renewable Energy Sources into Grid-Connected Power Systems: Challenges, Mitigation Strategies, and Prospects. Energies 2025, 18, 689. [Google Scholar] [CrossRef]
- Yang, Y.; Meng, Z.; Wu, G.; Yang, Z.; Guo, R. A Probabilistic Reserve Decision-Making Method Based on Cumulative Probability Approximation for High-Penetration Renewable Energy Power System. Energies 2025, 18, 2658. [Google Scholar] [CrossRef]
- Costilla-Enriquez, N.; Ortega-Vazquez, M.; Tuohy, A.; Motley, A.; Webb, R. Operating Dynamic Reserve Dimensioning Using Probabilistic Forecasts. arXiv 2021, arXiv:2108.09362. [Google Scholar] [CrossRef]
- ENTSO-E. 2023 Biennial Progress Report on Operational Probabilistic Coordinated Security Assessment and Risk Management; Technical Report; ENTSO-E: Brussels, Belgium, 2023. [Google Scholar]
- Puech, A.; Read, J. Uncovering the Spatial and Temporal Variability of Wind Resources in Europe: A Web-Based Data-Mining Tool. arXiv 2023, arXiv:2305.01343. [Google Scholar] [CrossRef]
- Garrido-Perez, J.M.; Ordóñez, C.; Barriopedro, D.; García-Herrera, R.; Paredes, D. Impact of Weather Regimes on Wind Power Variability in Western Europe. Appl. Energy 2020, 264, 114731. [Google Scholar] [CrossRef]
- Papavasiliou, A. An Overview of Probabilistic Dimensioning of Frequency Restoration Reserves with a Focus on the Greek Electricity Market. Energies 2021, 14, 5719. [Google Scholar] [CrossRef]
- ENTSO-E. Policy 1: Load-Frequency Control and Performance; ENTSO-E: Brussels, Belgium, 2009; Available online: https://www.entsoe.eu/fileadmin/user_upload/_library/publications/entsoe/Operation_Handbook/Policy_1_final.pdf (accessed on 14 October 2022).
Disclaimer/Publisher’s Note: The statements, opinions and data contained in all publications are solely those of the individual author(s) and contributor(s) and not of MDPI and/or the editor(s). MDPI and/or the editor(s) disclaim responsibility for any injury to people or property resulting from any ideas, methods, instructions or products referred to in the content. |
© 2025 by the authors. Licensee MDPI, Basel, Switzerland. This article is an open access article distributed under the terms and conditions of the Creative Commons Attribution (CC BY) license (https://creativecommons.org/licenses/by/4.0/).