Article

Data Mining to Identify University Student Dropout Factors

by
Yuri Reina Marín
1,
Lenin Quiñones Huatangari
2,
Omer Cruz Caro
1,*,
Jorge Luis Maicelo Guevara
3,
Judith Nathaly Alva Tuesta
1,
Einstein Sánchez Bardales
1 and
River Chávez Santos
4
1
Oficina de Gestión de la Calidad, Universidad Nacional Toribio Rodríguez de Mendoza de Amazonas, Chachapoyas 01001, Peru
2
Instituto de Investigación en Estudios Estadísticos y Control de Calidad, Facultad de Ingeniería Zootecnista, Biotecnología, Agronegocios y Ciencia de Datos, Universidad Nacional Toribio Rodríguez de Mendoza de Amazonas, Chachapoyas 01001, Peru
3
Escuela de Economía, Pontificia Universidad Católica del Perú, Lima 15088, Peru
4
Facultad de Educación y Ciencias de la Comunicación, Universidad Nacional Toribio Rodríguez de Mendoza de Amazonas, Chachapoyas 01001, Peru
*
Author to whom correspondence should be addressed.
Appl. Sci. 2025, 15(22), 11911; https://doi.org/10.3390/app152211911 (registering DOI)
Submission received: 2 September 2025 / Revised: 26 September 2025 / Accepted: 5 November 2025 / Published: 9 November 2025

Abstract

University dropout poses academic, social, and economic challenges that call for effective prevention strategies. The objective was to identify determining factors of student dropout through educational data mining and machine learning models. A survey was administered to 527 undergraduate students, and the data were processed with classification algorithms (Adaboost, Gradient Boosting, Extra Trees, Random Forest, Decision Tree, and XGBoost), complemented with interpretation techniques such as SHAP and sensitivity analysis. The results revealed that, in addition to prior academic performance (GPA), psychological support emerged as the most influential predictor across all models, followed by institutional and socioeconomic variables, including academic program, age, and parental job stability. Integrating psychological, institutional, and family factors into predictive systems enhances model accuracy and provides practical evidence to inform educational policies, strengthen student support programs, and design early interventions to promote retention in higher education.

1. Introduction

University student dropout is a global phenomenon that generates significant consequences for individuals and societies [1]. According to the Organization for Economic Cooperation and Development (OECD) [2], around 30% of students enrolled in higher education in member countries dropped out before graduating. This figure, while already concerning, mirrors the global challenge and underscores the urgent need for action. In some regions, the rate is even more staggering, reaching almost double the OECD average, highlighting specific areas in need of urgent intervention. Dropout rates have been attributed to academic factors, financial constraints, emotional problems, and a lack of social and academic integration [3]. In addition, the COVID-19 pandemic exacerbated educational continuity challenges and created financial insecurity among students [4].
In Latin America, the problem is more acute due to existing socioeconomic conditions and inequalities [5]. The university dropout rate exceeds 40%, especially in low-income contexts with limited educational infrastructure [6]. This scenario is aggravated by the need for many young people to work to support their studies, as well as by deficiencies in institutional support systems [7]. According to theories of academic and social integration, these numerical disparities can be mapped onto several key mechanisms. For instance, students from rural and low socioeconomic backgrounds face higher dropout rates due to barriers such as transportation difficulties and limited academic support, which affect their social integration into the university environment [8,9]. Meanwhile, institutional support is often inadequate, detracting from these students’ ability to fully engage both academically and socially within the institution. The National University of Colombia reports that by the end of 2021, the university dropout rate in Ibero-America had reached 33%, with Puerto Rico having the highest dropout rate at 60%, followed by Bolivia at 48% and Colombia at 42% [10]. These statistics underscore the critical need to enhance institutional and social support mechanisms to reduce student dropout rates.
In Peru, the cumulative university dropout rate is around 18%, mainly affecting students with fewer economic resources [1]. The COVID-19 health crisis exacerbated this problem, evidenced by a 24% drop in university enrollment during 2020, with private universities being the most affected [11]. This phenomenon implies a loss not only for students but also for the institutional development and social growth of the country, which demands the implementation of comprehensive retention and support policies, along with the use of emerging technologies such as data mining to identify at-risk students and prevent dropouts [12].
Data mining refers to the process of identifying patterns, links, and knowledge from large volumes of data [13], through the use of decision trees, Naive Bayes, and artificial neural networks, instance-based methods, kernel methods, among others [14,15], to obtain useful information for adequate decision making, risk management, and process optimization [16]. Data mining is present in multiple areas, including education [17], which, through the use of student data, aims to improve teaching–learning processes [18].
Predictive models aim to forecast future behaviors and facilitate decision making in educational processes [19], developing educational policies based on accurate and up-to-date data [20]. Implementing predictive techniques such as logistic regression analysis and decision trees demonstrates 95% accuracy in student dropouts [17]. Academic dropout is affected by personal, social, economic, academic, and other factors [21]. However, understanding them allows for the development of intervention strategies that increase student retention rates [22,23].
The ability of data mining to generate predictions and visualize data is vital to designing personalized educational strategies that improve academic outcomes [16]. Analyzing educational data helps us understand not only academic performance but also factors such as student behavior and interaction with content [14]. In higher education institutions, the use of Educational Data Mining (EDM) reverses the negative impact on institutional financial stability, especially of income received from tuition and educational resources [24,25,26].
EDM focuses on extracting patterns and trends from information in the educational context [26,27], such as student performance based on historical data which include past grades and study habits [24,28]. Higher education institutions have valuable insights into student performance [14], the effectiveness of teaching methods, and possible areas for improvement [29]. EDM becomes a tool to predict academic performance and carry out early interventions in students at risk of dropping out [12,28].
Predicting academic, institutional, performance, and dropout factors using EDM in universities improves retention rates and reduces financial losses [25,30]. The use of educational data has proven to be key to optimizing educational management and ensuring greater efficiency in the allocation of resources [31]. Educational management based on predictive models contributes to improving the personalization of learning by adapting systems to the needs of students [32,33]; in this way, it contributes to the improvement of administrative decisions and the continuous evaluation of educational processes [34], with the identification and prediction of university student dropout factors, graduation rates, and academic performance [35].
The OECD exemplifies that a third of students enrolled in universities finish their studies before obtaining a professional degree [36]. For this reason, the advances in Artificial Intelligence (AI) and machine learning significantly improve the ability to make predictions through the use of techniques such as SHAP and LIME [22]; these models not only make it easier to predict which students are at risk of dropping out but also suggest mitigating tactics [37]. These studies underscore the importance of having tools that offer a comprehensive and dynamic perspective on students in vulnerable situations, enabling timely interventions and promoting the economic sustainability of educational institutions.
Dropping out of the educational field is understood as the interruption of studies before obtaining an academic degree [21,38], and can manifest itself at different levels: dropping out of higher education, institutional, unit, or course [17,39,40]. Studies indicate that the causes are multifactorial, including economic limitations, lack of social and emotional support, poor guidance, transportation problems, distance to school, and lack of tutoring programs [38,41,42,43]; causes are also influenced by changes in work or family conditions, the absence of interaction between peers, and the lack of academic feedback [8,44,45]. These elements generate demotivation and hinder the adaptation process, reducing confidence in one’s own abilities and encouraging the intention to quit [46,47].
Motivational beliefs, aspirations for success, and a vision of mathematics are linked to academic continuity [48,49,50,51], while the unchangeable mentality of some teachers can increase student vulnerability [52,53]. Factors such as anxiety, depression, emotional exhaustion, and the need to assume family responsibilities also affect the permanence [54,55,56,57]. Additionally, problems of social and academic integration affect students in rural areas more strongly, who face transportation barriers, less access to extracurricular activities, and difficulties with emotional well-being [9,33,43,58,59,60,61].
Economic and institutional factors play a central role: the costs of tuition, materials, transportation, and accommodation constitute an unsustainable burden for many students, forcing them to work part-time or drop out due to a lack of scholarships and loans [36,61,62,63,64,65]. The lack of institutional support policies, such as academic guidance programs, tutoring, psycho-pedagogical counseling, or flexible scheduling and course selection, exacerbates the problem [66,67,68,69,70]. Added to this are safety and well-being factors on campus: violence, discrimination, food insecurity, and mental health issues increase anxiety and the risk of dropping out [71,72,73].
This study contributes significantly to the analysis of factors influencing university student dropout rates through the application of data mining techniques. By exploring academic, institutional, personal, family, and other factors, it seeks to identify patterns and relationships not readily apparent in the data, to generate empirical evidence to anticipate dropout risks. This approach allows us to understand the complexity of the dropout phenomenon and propose evidence-based solutions that promote academic continuity and the achievement of students’ educational objectives.

2. Materials and Methods

2.1. Methodology

The study used the Cross-Industry Standard Process for Data Mining (CRISP-DM) approach, which represents a structured framework widely used in both practical and academic contexts for data exploration. This methodological scheme (Figure 1) consists of six essential stages: analysis of the business environment, familiarization with the available information, data conditioning, model construction, validation of results, and deployment of solutions [74].
Machine learning algorithms were used as a methodological resource for predictive analysis, given their ability to identify recurring patterns in educational environments, particularly in addressing phenomena such as student dropout [41]. To generate reliable estimates, the models were pre-calibrated using historical data and can be categorized into classification models such as Support Vector Machines (SVM), Logistic Regression (LR), K-nearest Neighbors (KNN) algorithm, Naïve Bayes, and Decision Tree [75]. These models are widely used to label students at risk or likely to persist, each with different assumptions and sensitivities to educational data structures [74].
SVM and LR assume independent and identically distributed data; LR can be adapted using generalized estimating equations to account for clustered errors; KNN is a nonparametric model sensitive to demographic clustering; Naïve Bayes, despite its strong independence assumption, is still useful on large datasets when combined with feature selection; and decision trees are intuitive and flexible, but prone to overfitting without pruning [74,76].
Ensemble models such as Random Forest and Gradient Boosting integrate multiple base models to improve accuracy and generalization [75]. Random Forest offers simplicity, short training time, and improved forecast accuracy, although with increased model complexity as more trees are added [76,77,78]. XGBoost, an optimized implementation of gradient boosting, has become a leading model due to its speed, built-in regularization, early stopping, and ability to handle structured and nested data using parameters like group [79].

2.2. Data Collection

Data were collected through an online survey of students enrolled in the first academic semester of 2025 (2025-I), between the II and XII cycle, and a sample of 527 participants who gave their informed consent in compliance with established ethical principles was obtained. The instrument used was designed based on factors previously identified in relevant background studies, as specified in Table 1.
The instrument underwent a rigorous validation process, which included evaluation by three experts, who analyzed its content, relevance, and clarity. Furthermore, psychometric validation was conducted using Exploratory Factor Analysis (EFA) to identify the underlying structure of the constructs measured.
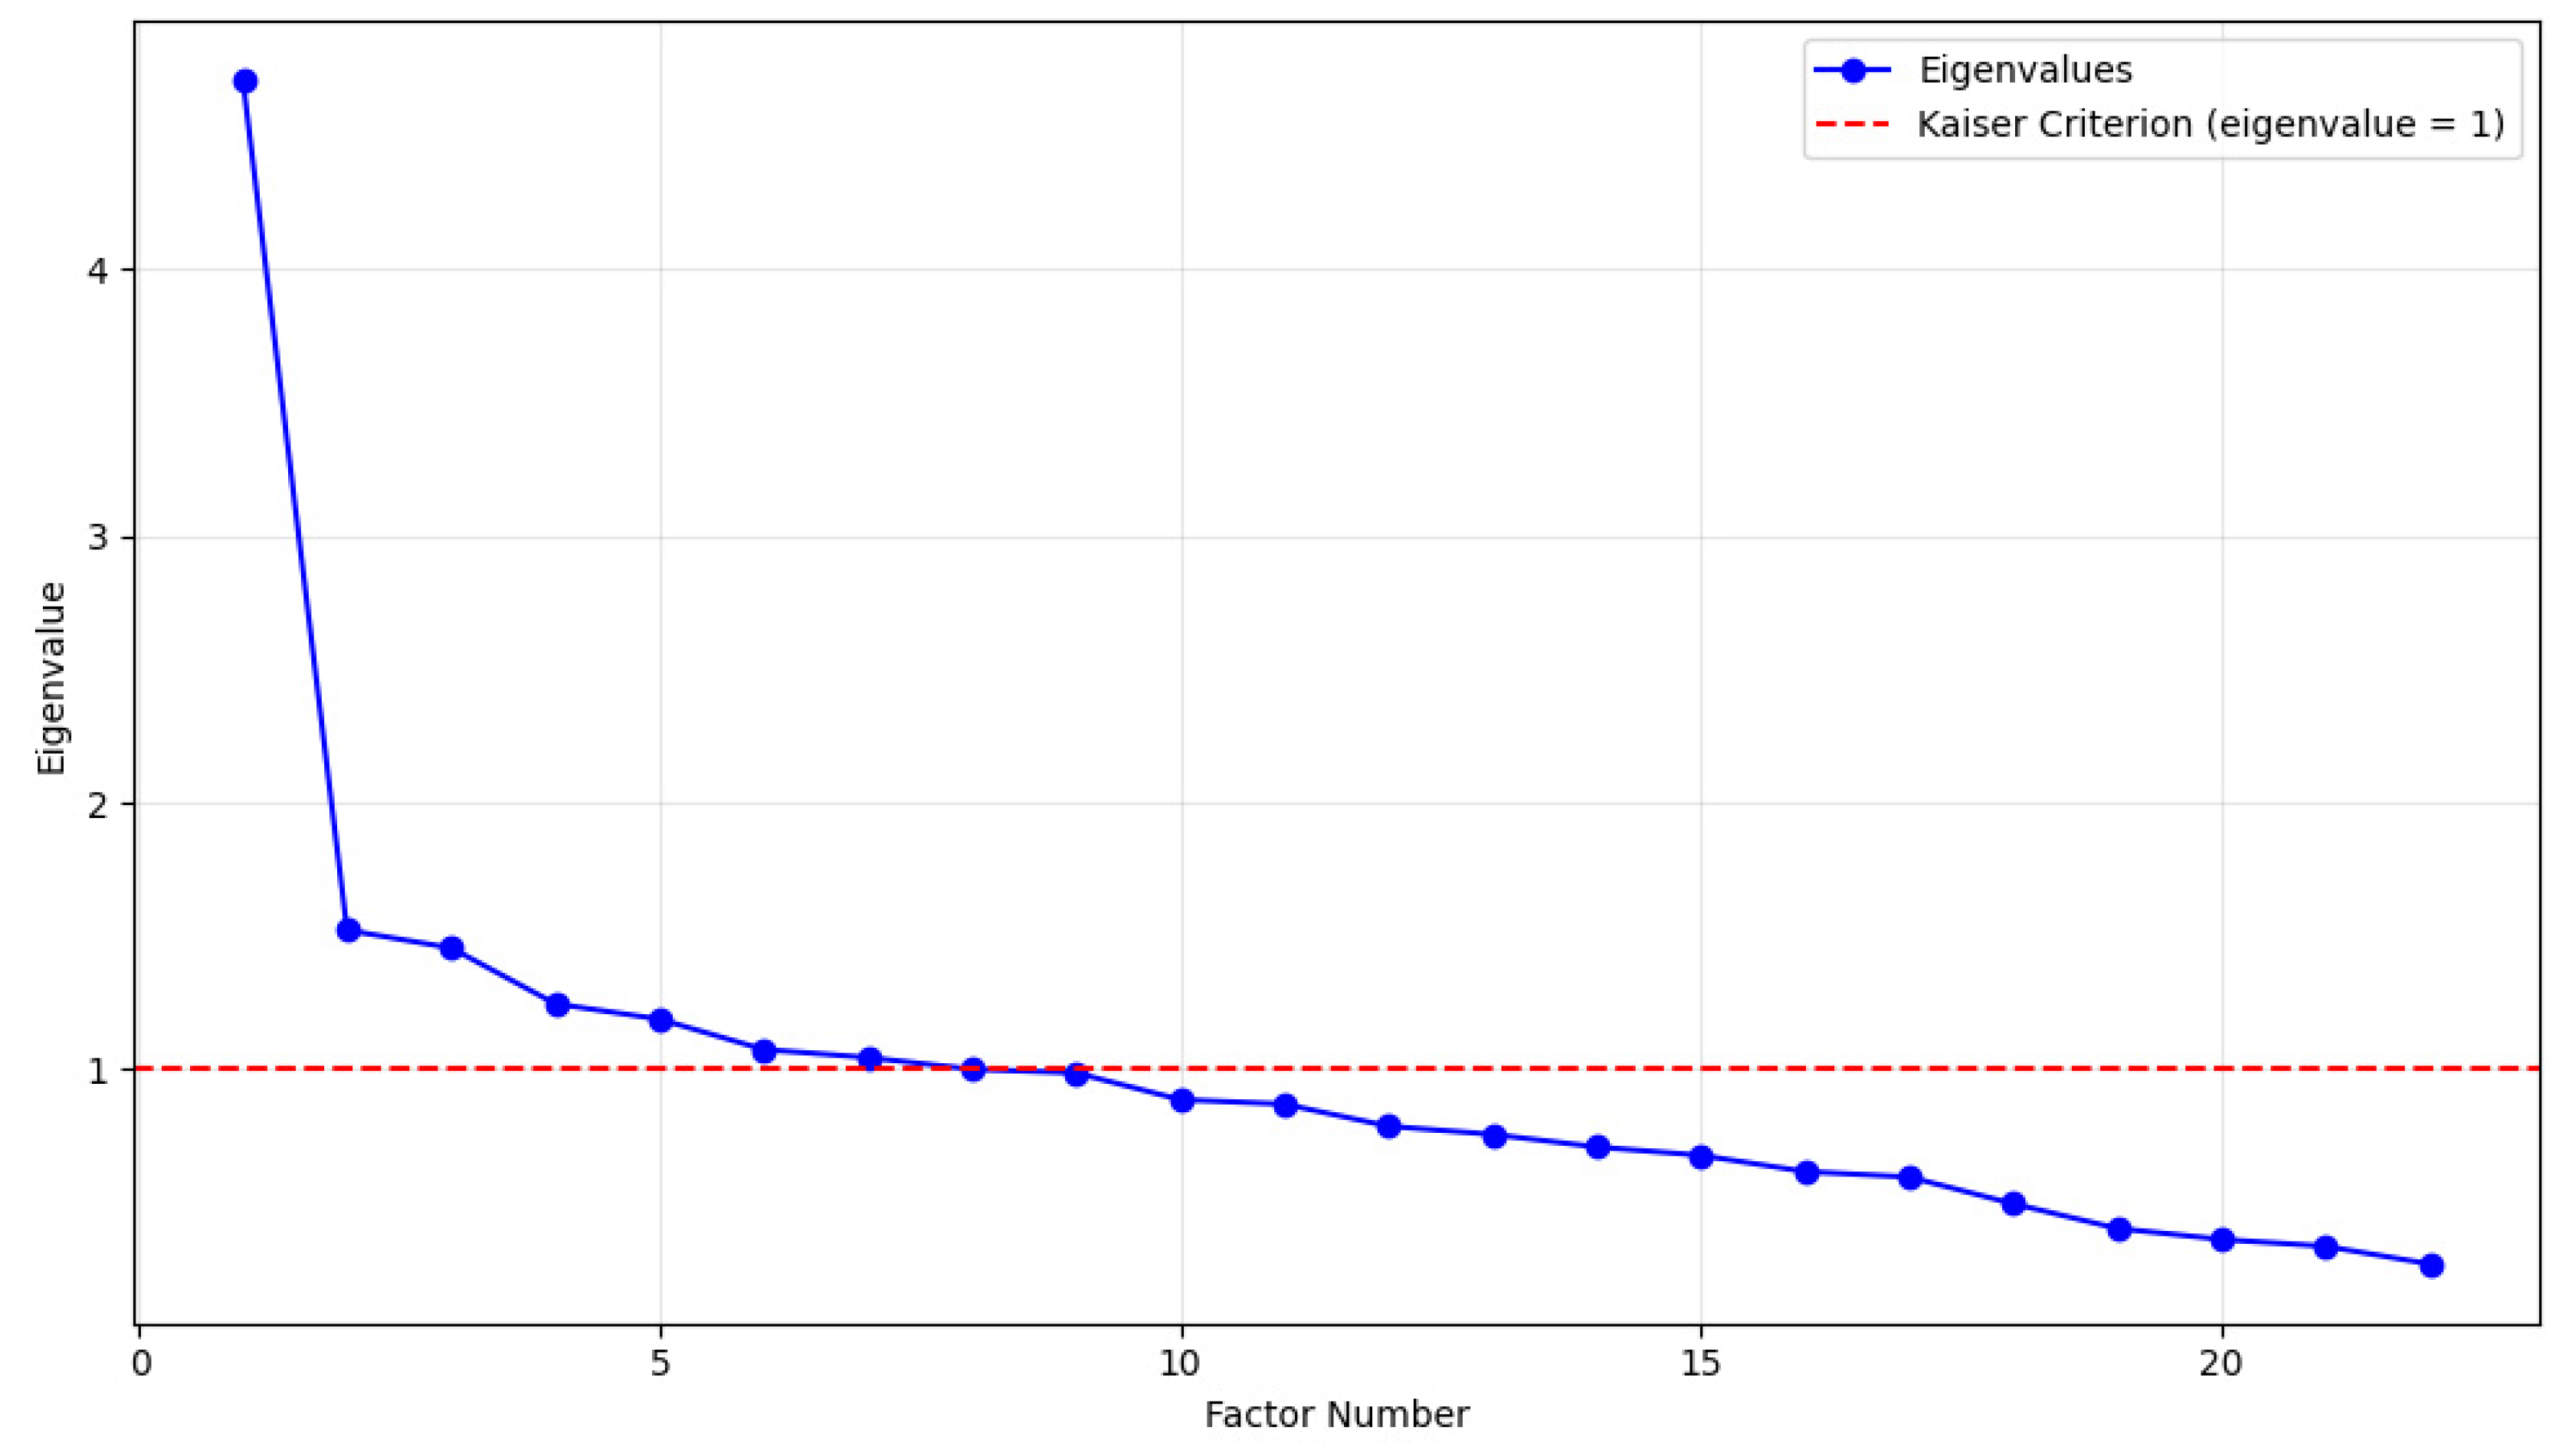
The EFA results demonstrate the instrument’s sampling adequacy and construct validity. Bartlett’s test (χ2 = 2423.12, p < 0.000) rejected the hypothesis of independence between variables, while the KMO index (0.809) confirmed a meritorious level of intercorrelation. As shown in the scree plot (Figure 2), the first factor accounts for part of the explained variance, followed by a pronounced decline in the eigenvalues, suggesting a defined factor structure. According to the Kaiser criterion, a few factors were identified with eigenvalues greater than 1, which supports the parsimony of the model and the coherence of the constructs evaluated.
In accordance with the results of the scree plot, the EFA identified a structure composed of five primary factors. Table 2 presents the factor loadings for each item, which reveal a consistent distribution and enable the variables to be grouped into distinct dimensions, thereby strengthening the instrument’s structural validity.
Based on Figure 2 and Table 2, it can be observed that university dropout rates are explained by five interrelated dimensions: academic, linked to the quality of teaching and classroom performance; institutional and social, related to access to support programs, psychological support, and student networks; administrative demands and barriers, associated with the weight of academic demands, bureaucracy, and family limitations; contextual, determined by the perception of campus security; and motivational, related to the clarity of life plans and professional goals.
Table 3 presents the explained variance values for each of the five identified factors. Factor 1 accounts for the largest proportion of variance (14.82%), confirming its importance in the academic–pedagogical dimension linked to teaching quality and classroom interaction. It is followed by Factor 2 (7.95%) and Factor 5 (8.05%), which are associated with the institutional–social and motivational dimensions, respectively. These factors together explain the role of student support and clear personal goals in university permanence. Factor 4 (8.55%) reflects the importance of contextual security conditions in the student experience, while Factor 3 (6.62%) highlights the impact of administrative barriers and academic demands. These factors explain 45.99% of the total variance, demonstrating that the model captures a significant proportion of the dynamics of university dropout.

2.3. Data Analysis

The data collected on the dropout factors areas was associated through data mining algorithms using the free software WEKA version 3.8.6, which allows its use, coding, and distribution [82]. To identify the most important factors in the dataset, feature evaluators were applied, including CorrelationAttributeEval, GainRatioAttributeEval, InfoGainAttributeEval, OneRAttributeEval, ReliefFAttributeEval, and SymmetricalUncertAttributeEval.
CorrelationAttributeEval: It is a selection algorithm that evaluates the relevance of each attribute by measuring its linear correlation (Pearson coefficient) with the dependent variable (class). This method is particularly suitable for quantitative attributes, as it measures the strength and direction of the linear relationship between the attribute and the target class; in the case of nominal attributes, these are analyzed individually, considering each value as a variable and calculating an overall correlation using a weighted average of the indicative values [83].
GainRatioAttributeEval: It is an attribute selection method that measures the relevance of each feature using the adjusted information gain, known as the gain ratio. This technique improves the information gain by correcting its bias toward attributes with many different values. It also calculates the ratio between the information gain and the attribute’s entropy. It is useful in algorithms such as C4.5 to avoid overfitting; thus, it allows for the identification of more representative attributes with greater predictive power [84].
InfoGainAttributeEval: Evaluates attribute values independently based on their information entropy relative to a target attribute. It is used in conjunction with the Search Ranker method, which ranks attributes individually based on specific entropy assessments. This combination makes it possible to identify which attributes are most representative for predicting differences in target variables [85].
OneRAttributeEval: Also known as OneR, due to its single-rule approach, it allows for the construction of single-level decision trees from individual attributes. This method evaluates the effectiveness of each attribute using cross-validation techniques to estimate the accuracy of the predictive model. It also integrates concepts from the C4.5 decision tree and statistical distributions, such as the Gaussian distribution, to strengthen its classification capabilities [86].
ReliefFAttributeEval: Evaluates the value of an attribute by repeatedly sampling an instance and considering the value of the given attribute for the closest instance of the same class and a different one. It can operate with categorical (discrete) and numeric (continuous) variables, making it more versatile for different types of data [87,88].
SymmetricalUncertAttributeEval: This attribute evaluation approach is based on the analysis of symmetric uncertainty relative to the target variable, which allows for a more accurate measurement of the informative contribution of each attribute to the classification process. By considering the distribution of uncertainty relative to classes, the method identifies attributes that offer greater discriminatory power within the dataset [88].

3. Results

3.1. Descriptive Data

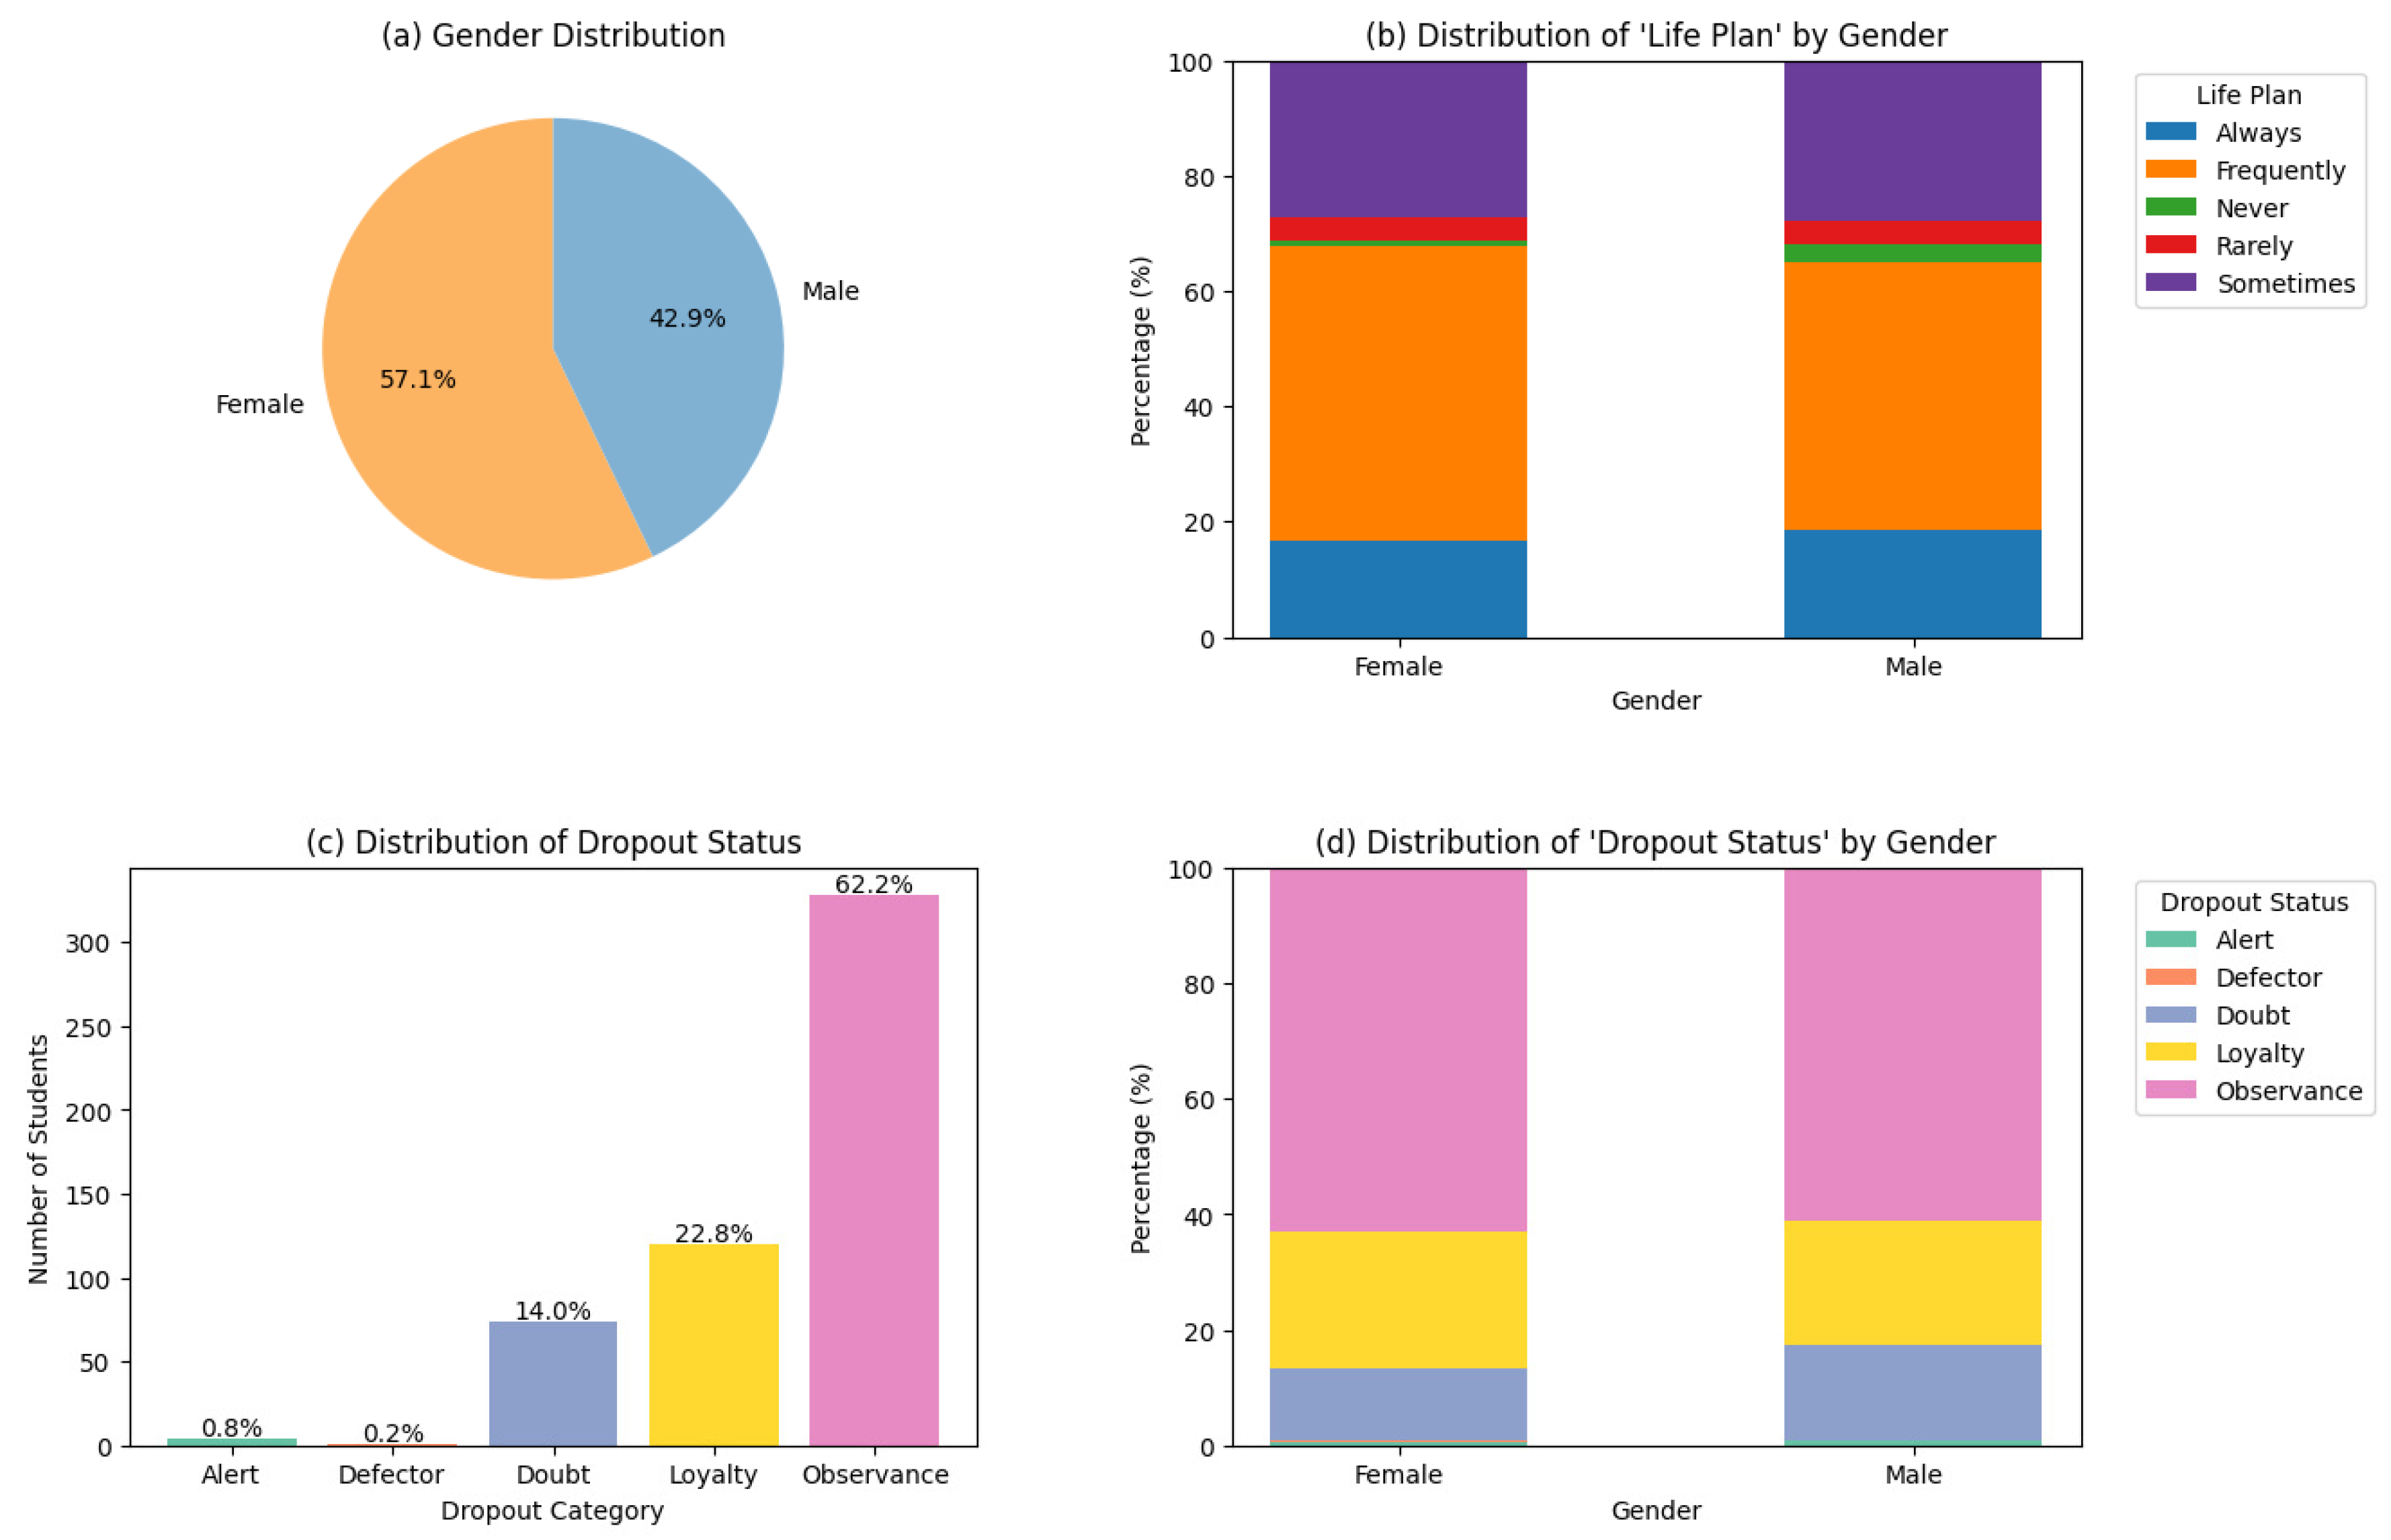
Figure 3 indicates that 57.1% of respondents are women and 42.9% are men. The analysis of life plans by gender reveals that the categories “rarely” and “never” correspond to low student commitment, while “sometimes” reflects inconsistent planning. In contrast, “frequently” and “always” indicate that only a small group of students consistently engage in planning, demonstrating habits and strategies that support discipline and goal achievement.
The abandonment status categories can be described as follows: Observance (62.2%) is associated with student stability and commitment. Loyalty (22.8%) represents students who maintain acceptable attendance and participation but show slight signs of vulnerability. Doubt (14.0%) identifies a critical segment that alternates between persistence and withdrawal. Alerts (0.8%) include a small group with clear indicators of dropout risk—repeated absences, low participation, and loss of interest. Finally, the ‘Dropout’ category (0.2%) comprises the actual cases of withdrawal.
Dropout patterns by gender show that compliance is linked to personal motivation, life planning, and family support. Loyalty is influenced by increased responsibilities or declining interest. Hesitancy is associated with financial challenges or insufficient guidance. Alertness is driven by poor performance and significant demotivation, while dropout results from the accumulation of these factors, leading to permanent disengagement from the institution.
Figure 4 shows the distribution of previous GPA, with 50% of students scoring between 12 and 14 points. The ≤10 and 10–12 ranges represent minority proportions, and the 18–20 interval is almost absent; the distribution is markedly centered, with little presence at the extremes, consistent with a predominantly average previous performance and low dispersion. In the teaching methodology according to perceived quality, the evaluations (“never”, “rarely”) are mainly associated with traditional and, to a lesser extent, participatory methodologies; the evaluations “sometimes” and “frequently” increase the presence of hybrid and project-based learning approaches; “always” allows us to observe a balance between hybrid, technological, and project-based strategies, evidencing methodological diversification and technological integration perceived as having higher quality by the teacher.
The GPA of students from public and private schools converges around 14 points, with no appreciable differences in the central area of the distribution; that is, school origin does not emerge as a differentiating factor for prior academic performance. However, family motivation systematically varies according to dropout status: in the ‘alert’ status category, moderate and high levels predominate, with little presence of very high motivation; in “dropout” status, low motivation prevails, and high levels almost disappear; in “doubt” status, low and moderate levels coexist; in “loyalty” and “observance” status, high and very high motivation levels are concentrated, supporting the role of family support as a protective factor for student commitment and retention.

3.2. Attribute Identification

Table 4 presents the comparative evaluation of the factors (originally identified as attributes by Weka) analyzed with multiple feature selection methods to predict student dropout, such as
CorrelationAttributeEval: The analysis shows that the previous GPA (0.428) is the strongest predictor, demonstrating that historical performance accounts for most of the relationship with future academic performance; it also influences the duration of the program in semesters (0.111) and the academic cycle (0.102), factors that reflect the formative stage and curricular progress to a lesser extent; personal variables such as time spent hanging out with friends (0.087) introduce differences linked to the balance between social life and performance.
GainRatioAttributeEval: The previous GPA (0.944) is consolidated as the most decisive attribute, confirming that academic record is the best predictor of performance; second, marital status (0.076) reflects that personal responsibilities influence student performance. Likewise, the father’s occupation (0.046) and the academic school (0.046) provide differentiation, demonstrating the influence of both the family context and the curricular organization.
InfoGainAttributeEval: The previous GPA (1.308) again stands out as the factor with the greatest capacity to reduce uncertainty. The academic school (0.170) and the father’s work (0.148) are also relevant, showing the impact of the institutional and socioeconomic context. The academic cycle (0.128) complements the picture, indicating that the stage of studies constitutes a determining factor in performance.
OneRAttributeEval: In this method, the previous GPA (97,723) stands out as the most powerful predictor in simple rules; however, practical variables such as time spent on academic procedures (62,998) and personal context variables such as motivation to continue studies (62,239) are added. These results suggest that, in addition to past performance, administrative and motivational aspects can be effective predictors of performance.
ReliefFAttributeEval: The previous GPA (0.263) is confirmed as the strongest differentiator. Academic factors such as the academic period (0.068) and academic school (0.060) also mark differences associated with curricular progress, and at the institutional level, participation in additional services (0.039) reflects the role of complementary pedagogical resources in student performance.
SymmetricalUncertAttributeEval: This method confirms the previous GPA (0.946) as the central indicator. It also highlights the academic school (0.067) and the academic period (0.057), which describe differences in the educational environment and the student’s stage of life. Finally, the father’s occupation (0.065) represents a relevant factor in the family context, linked to cultural and socioeconomic capital.

3.3. Correlation of Variables

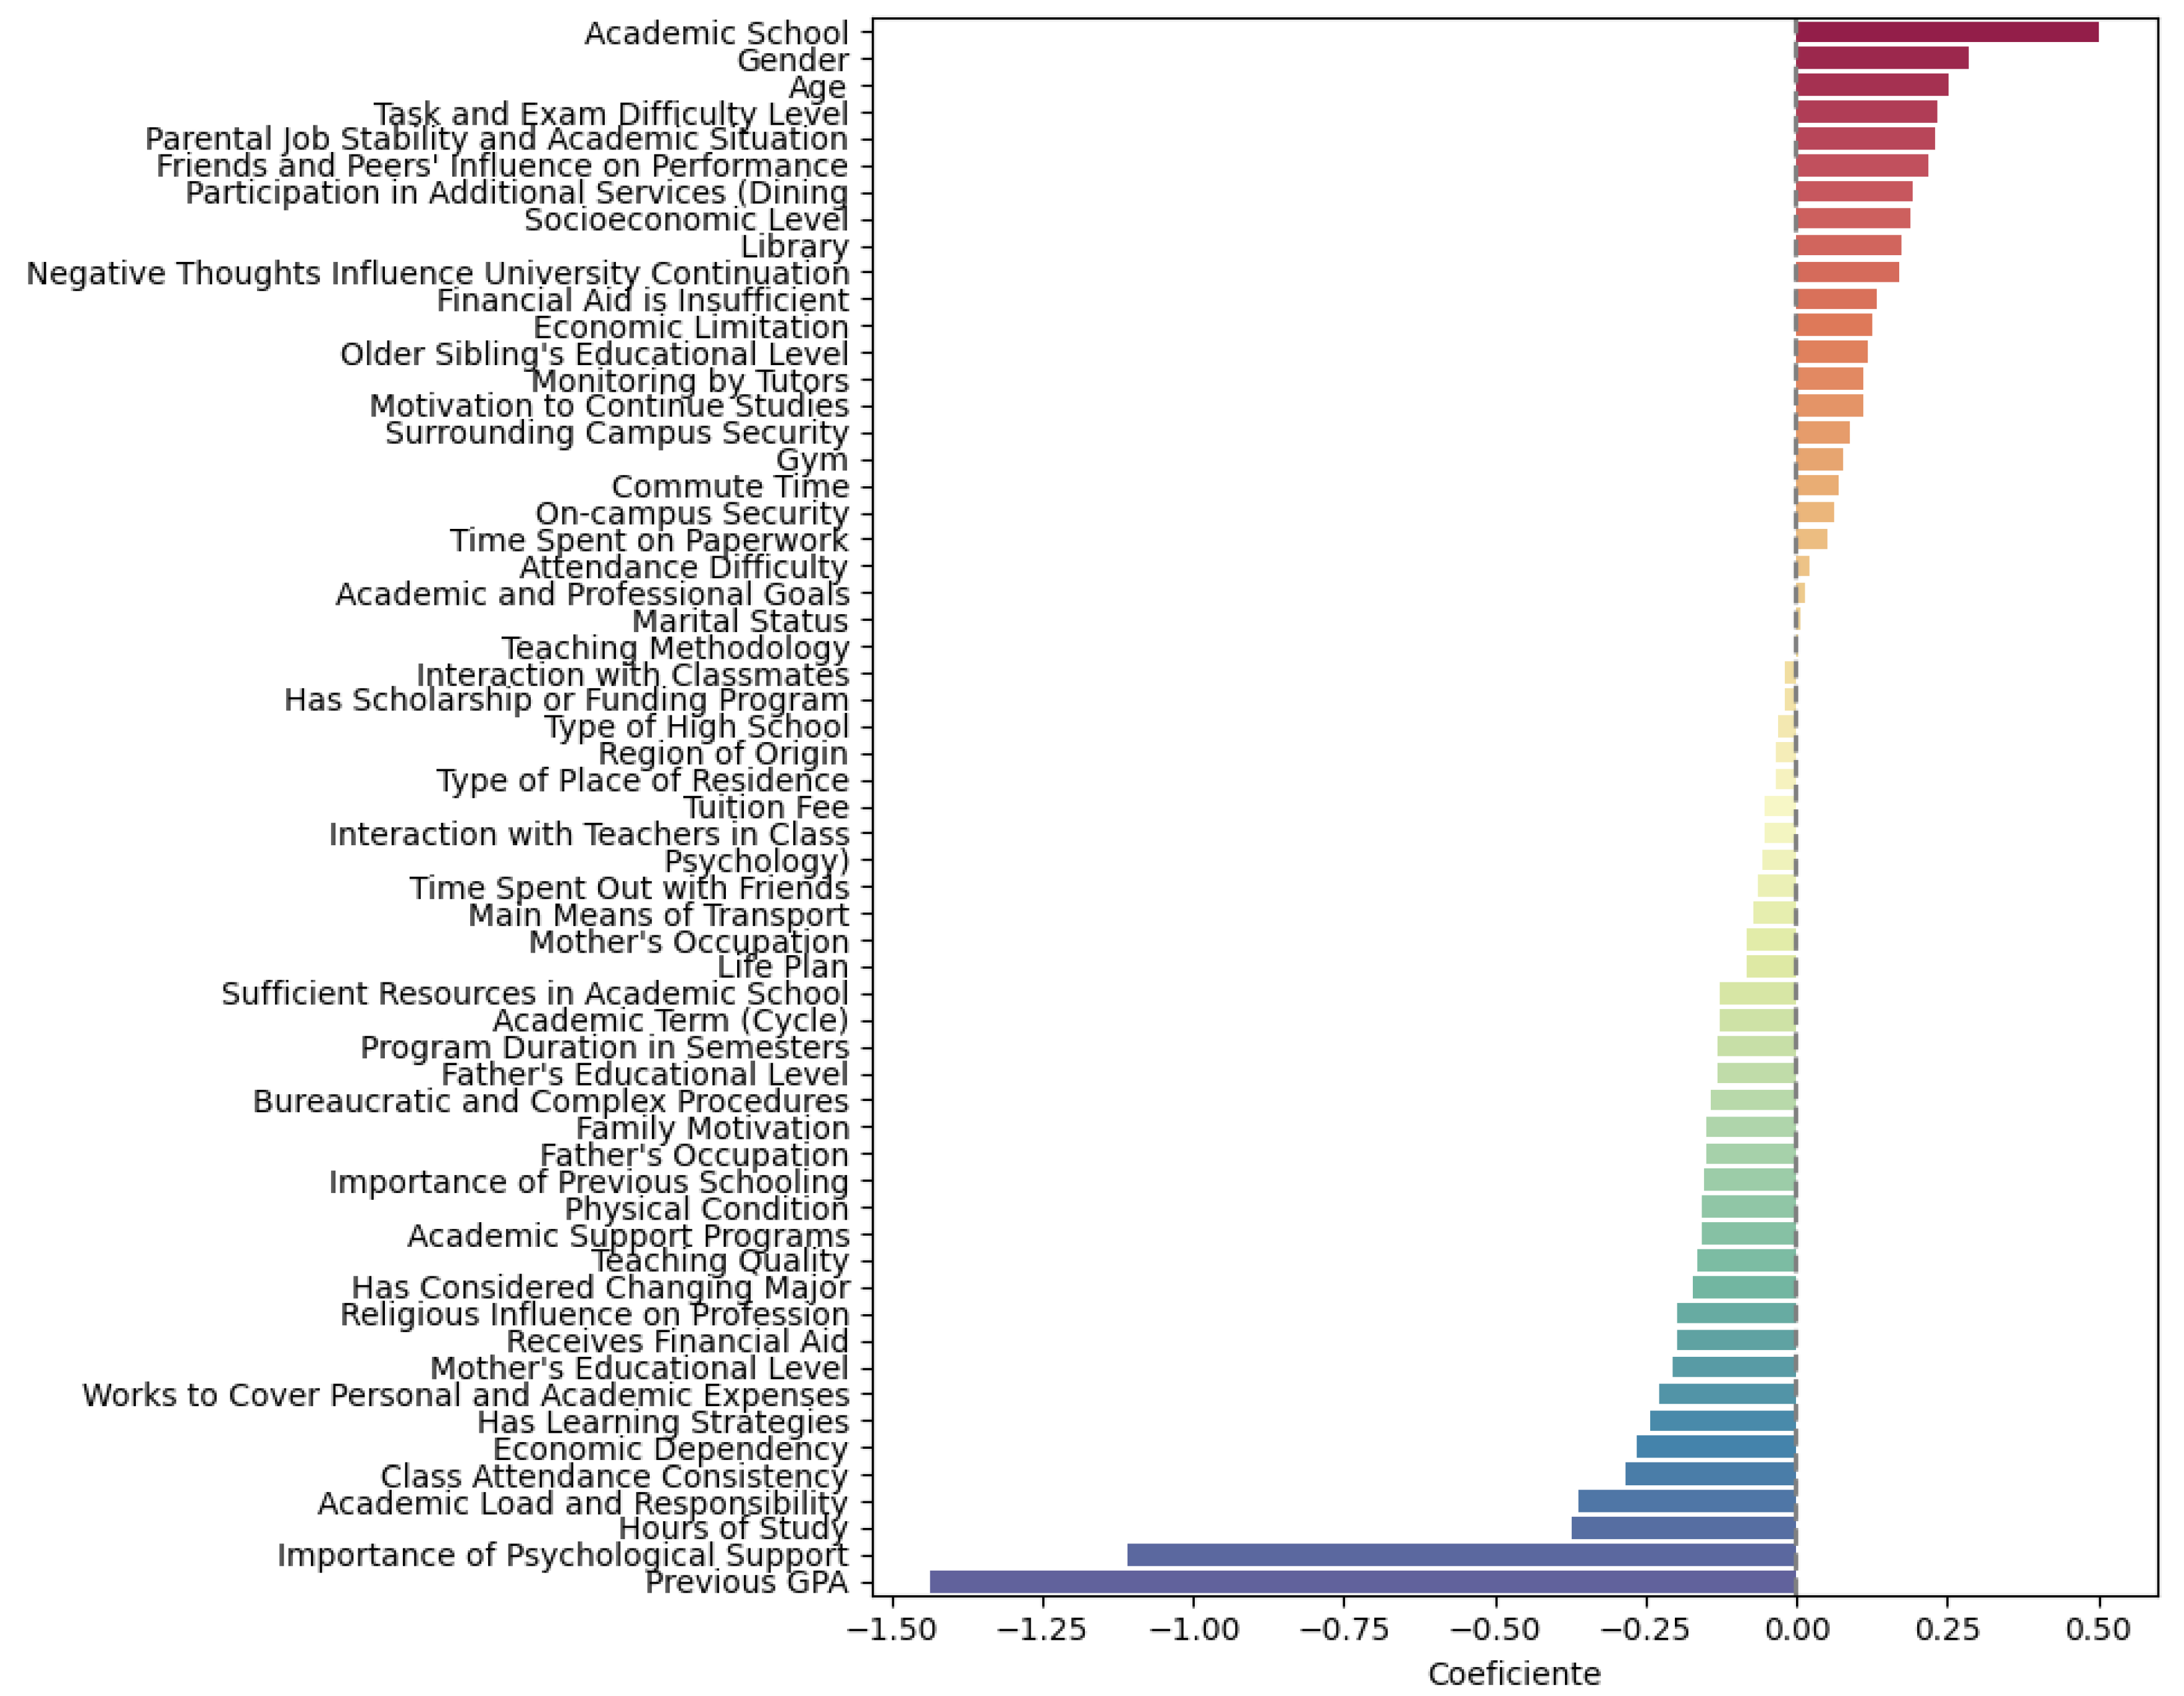
Figure 5 shows that the variables with the highest positive coefficients include academic school, gender, age, difficulty level of assignments and exams, job stability, and parents’ academic or educational level, and the influence of friends and peers; these variables are associated with a higher risk. Variables such as the importance of psychological support, GPA, number of study hours, academic responsibilities, and class attendance have strongly negative coefficients, indicating that they act as protective factors. On the other hand, the closest variables, such as type of secondary school, region of origin, and type of residence, show minimal effects, with no significant influence on the event.

3.4. Importance Analysis

Figure 6 shows the relative importance of each variable in predicting dropout, as evaluated by six algorithms: AdaBoost, Gradient Boosting, Extra Trees, Random Forest, Decision Tree, and XGBoost. Across all methods, psychological support consistently emerges as the most influential factor, with values above 0.8 in AdaBoost, Decision Tree, and XGBoost. Previous GPA also demonstrates significant relevance, particularly in Random Forest and Extra Trees. These findings suggest that prioritizing psychological support in resource allocation could substantially improve student retention.
Variables such as program of study, age, and class attendance frequency have intermediate importance, with greater weight in Gradient Boosting, Random Forest, and XGBoost. Variables such as type of residence, teaching method, commute time, and campus safety show a minimal or insignificant effect; on the other hand, the results reveal a clear pattern in the importance of psychological support and grade point average, which are the most decisive and consistent predictors.

3.5. Decision Tree

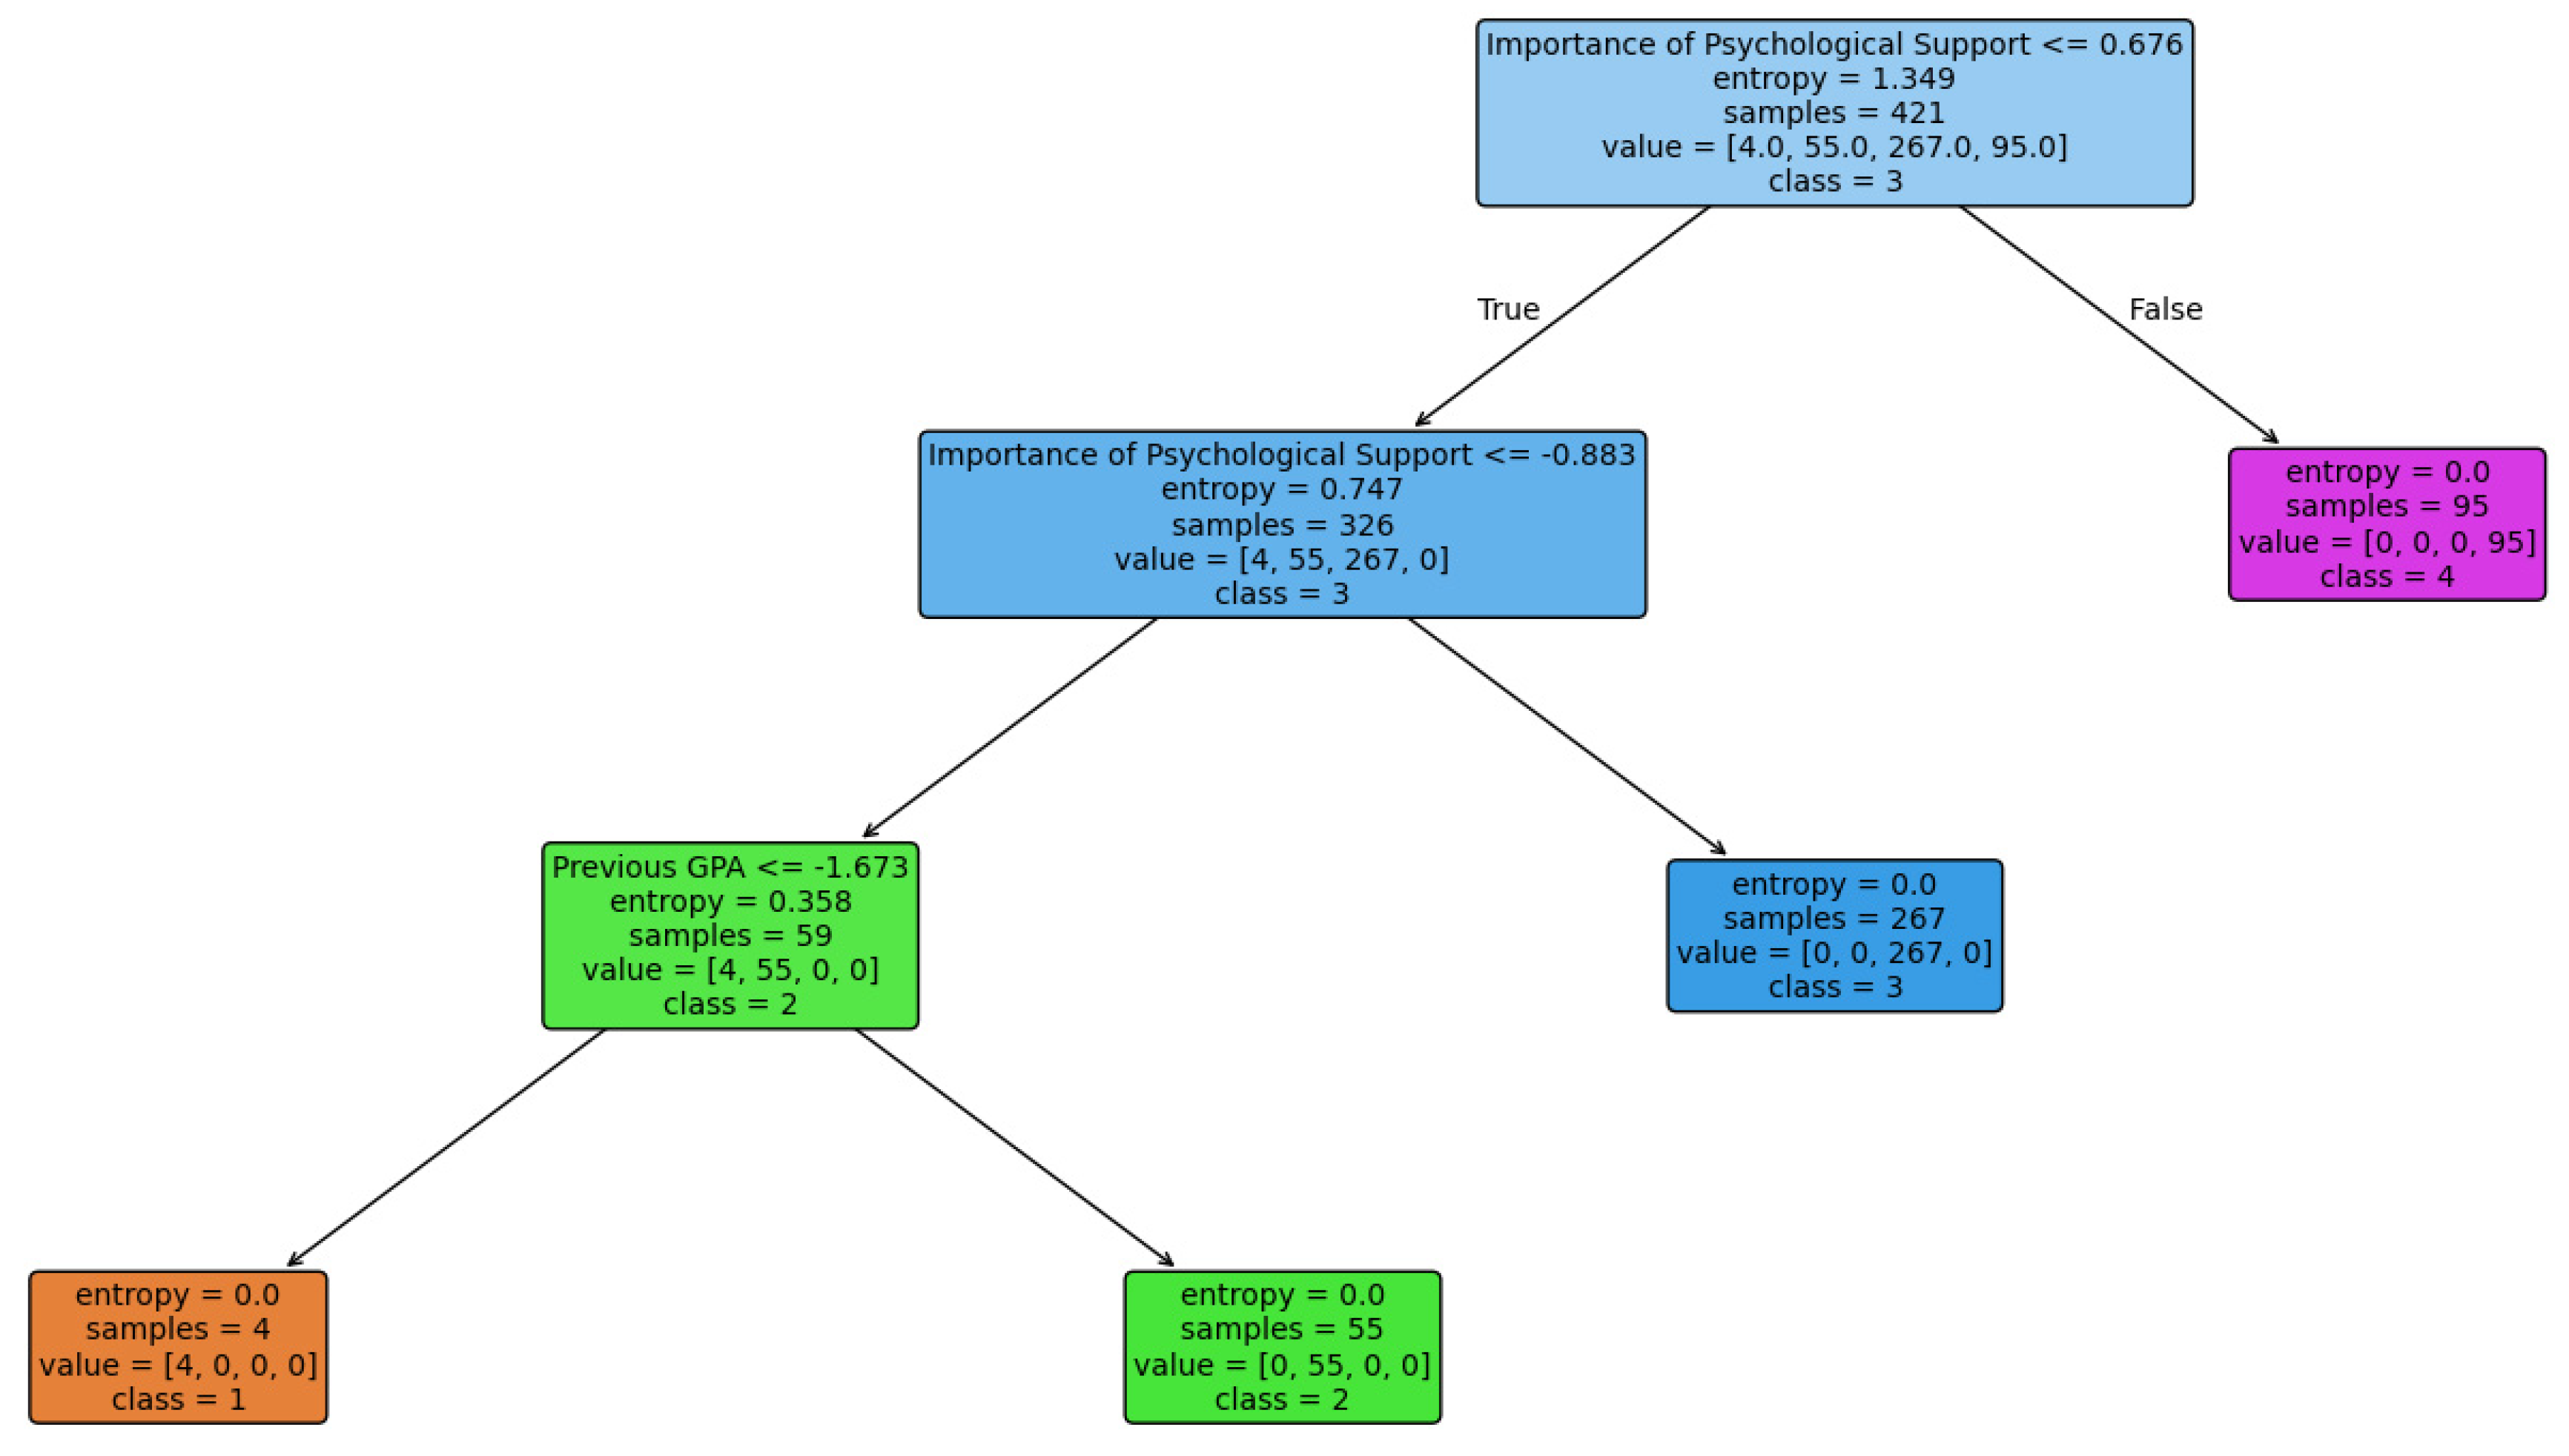
In Figure 7, the root node shows that the importance of psychological support is the most relevant factor for dividing the sample of 421 students; those who perceive importance less than or equal to 0.676 will move on to a second division, while those whose value is above the threshold, grouping 95 students classified in class 4, show no signs of dropping out.
The left branch shows a second split when the importance of psychological support is less than or equal to 0.883, based on the previous GPA, where a value less than or equal to 1.673 identifies a small group of four students in class A (high risk of dropping out), while a higher GPA in this same subgroup places 55 students in class 2 (moderate risk); the students who value psychological support the most within this first group (0.883) are classified entirely in class 3 (low risk) with 267 cases.

3.6. Shap Analysis

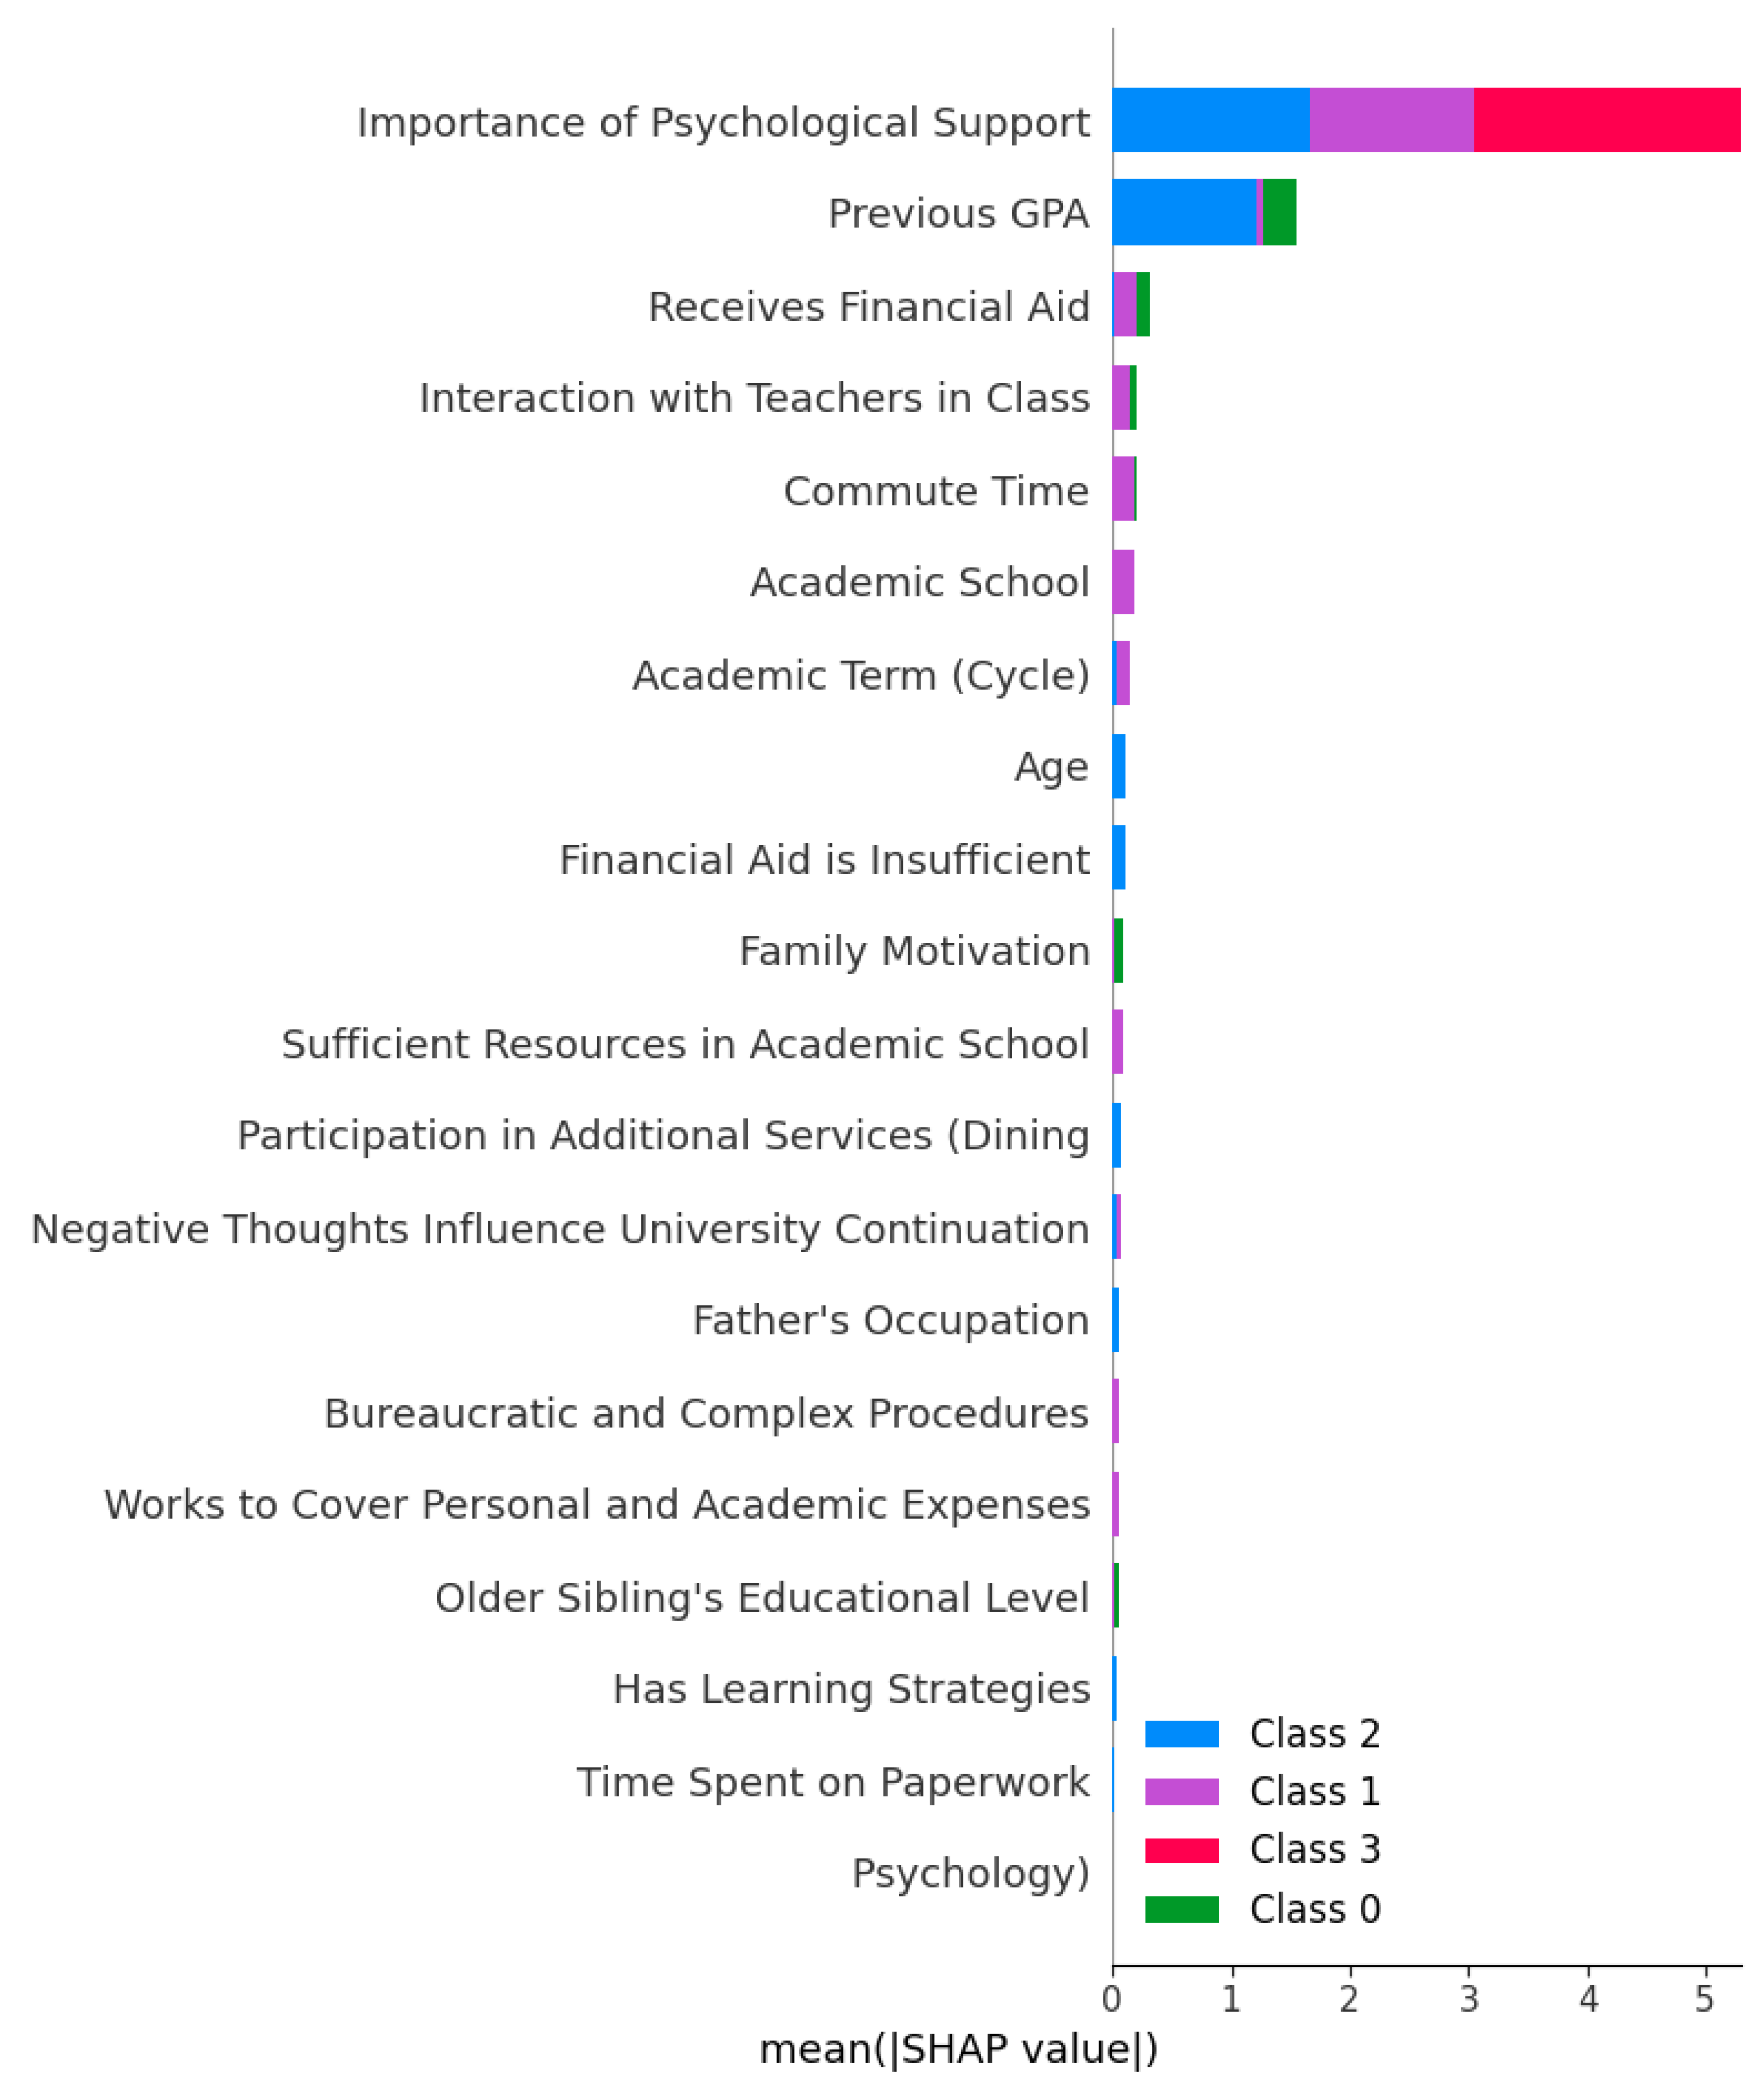
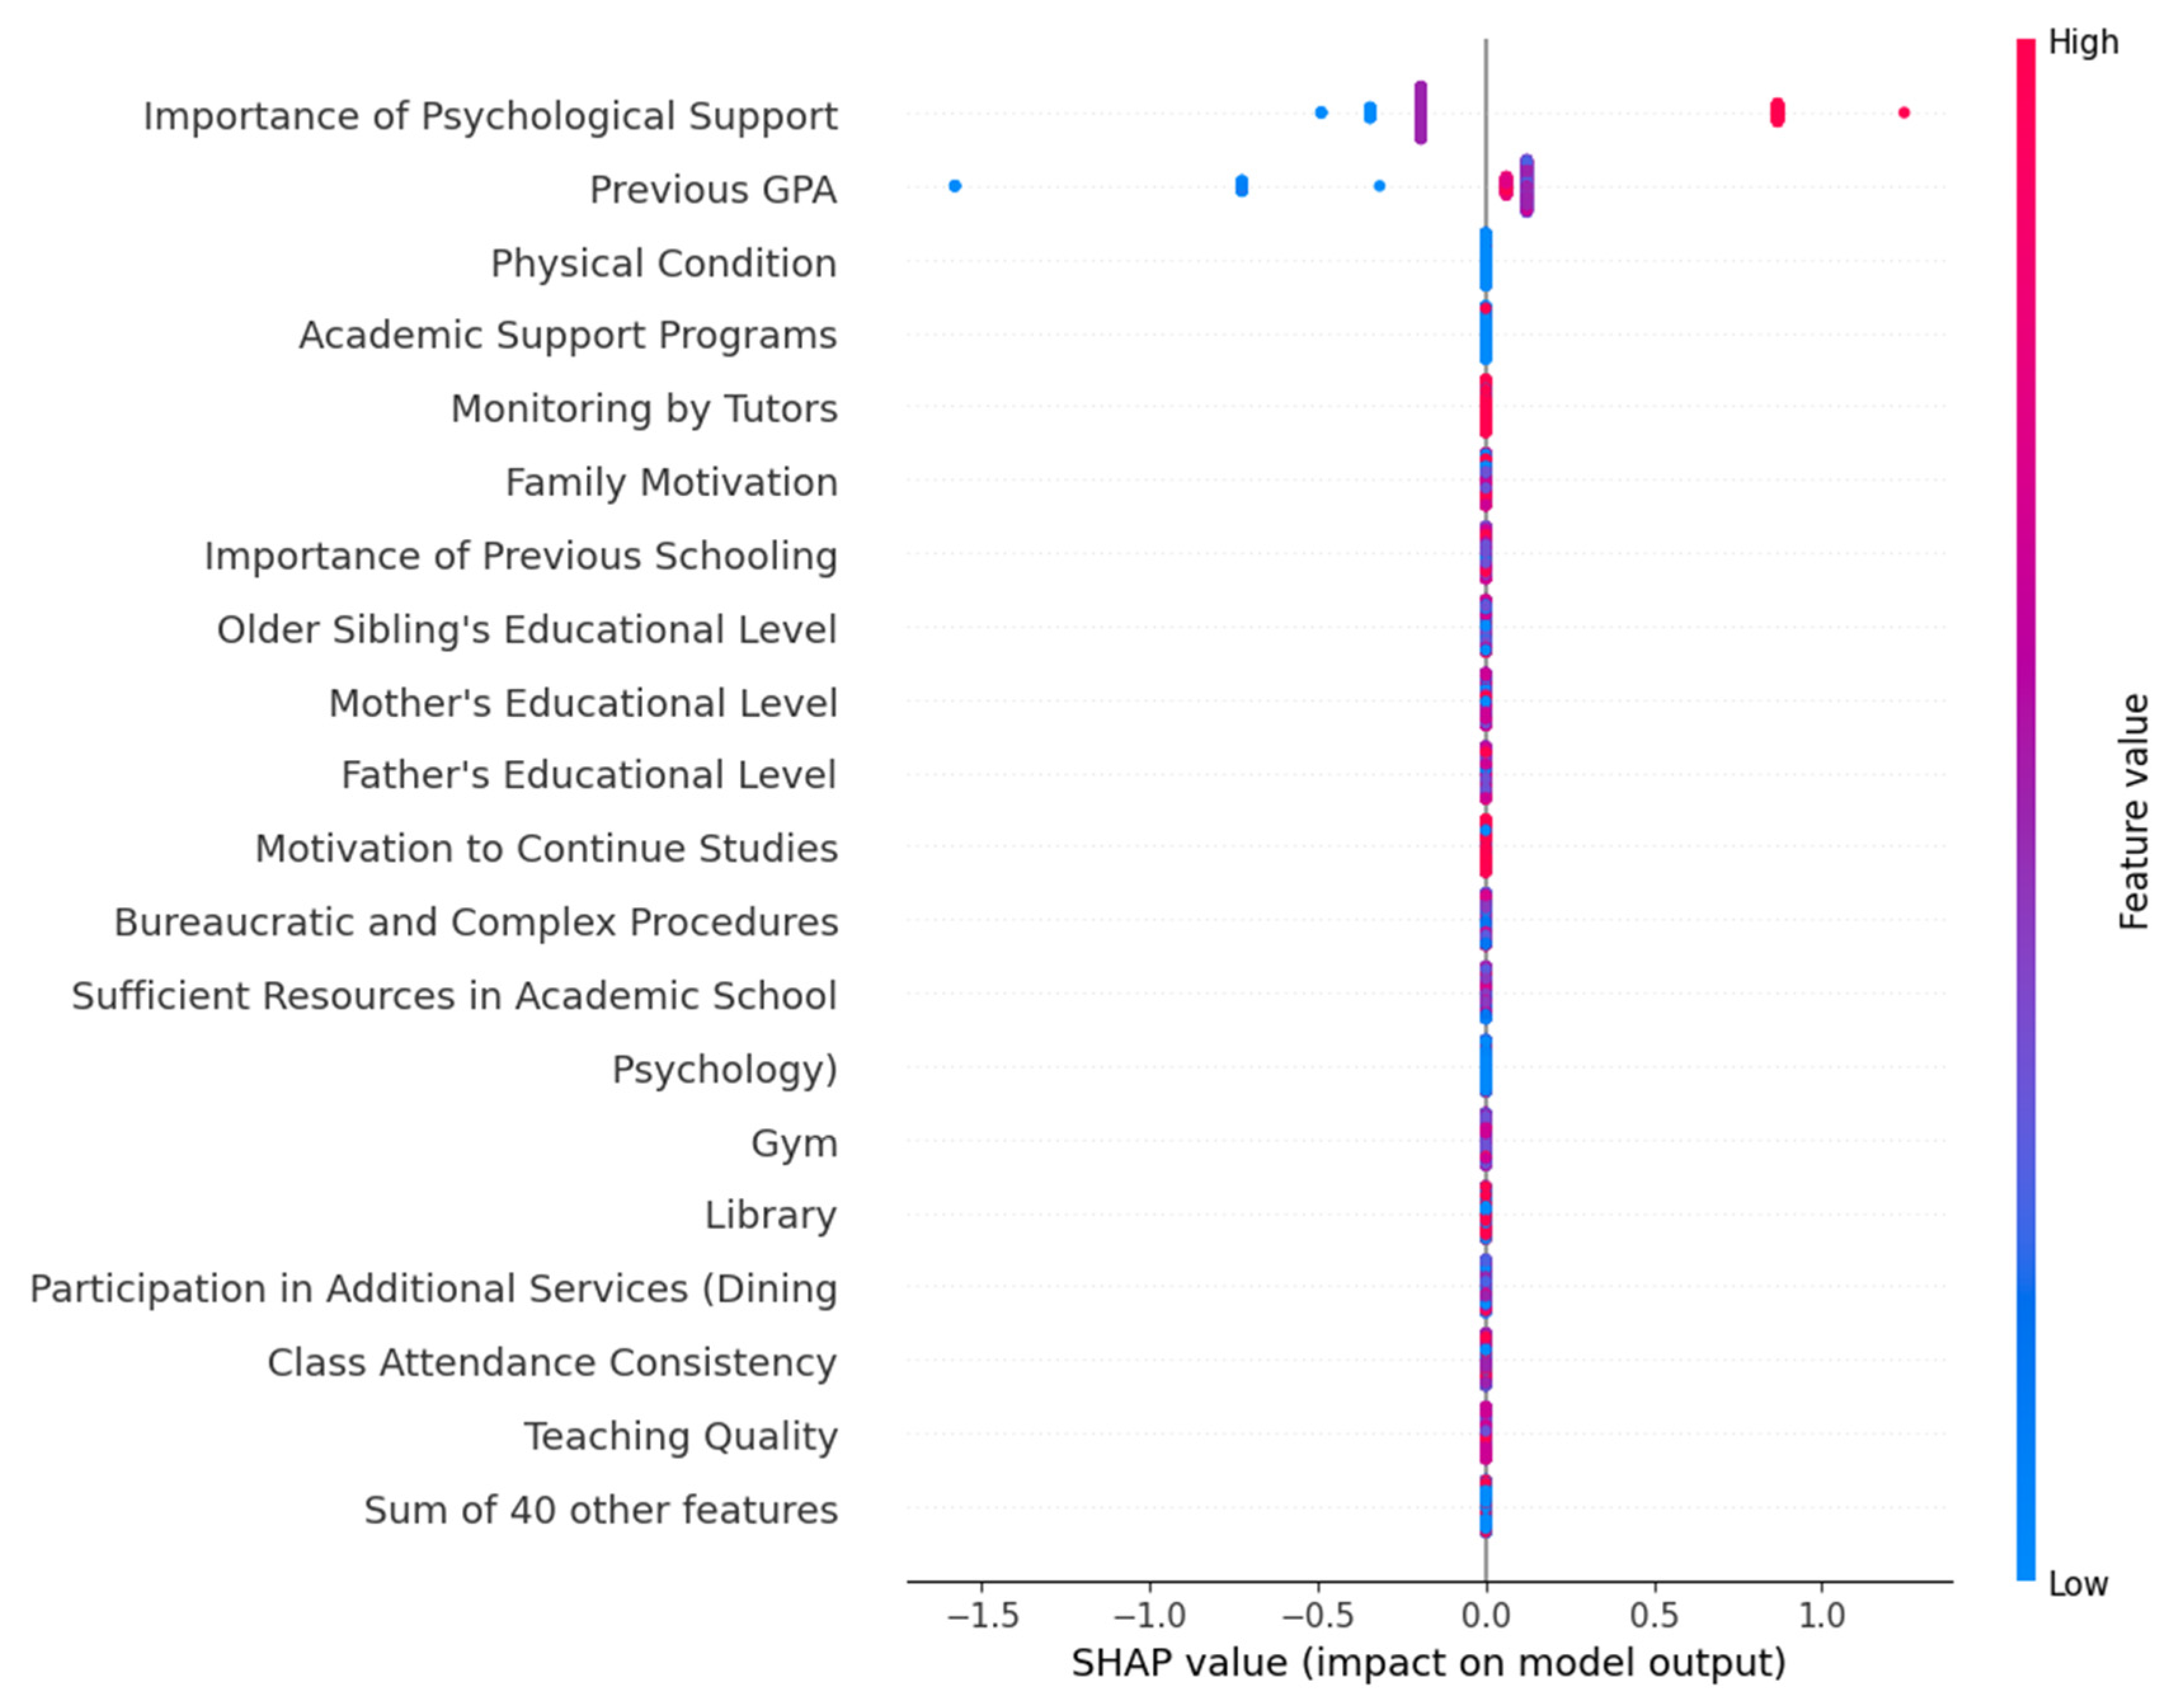
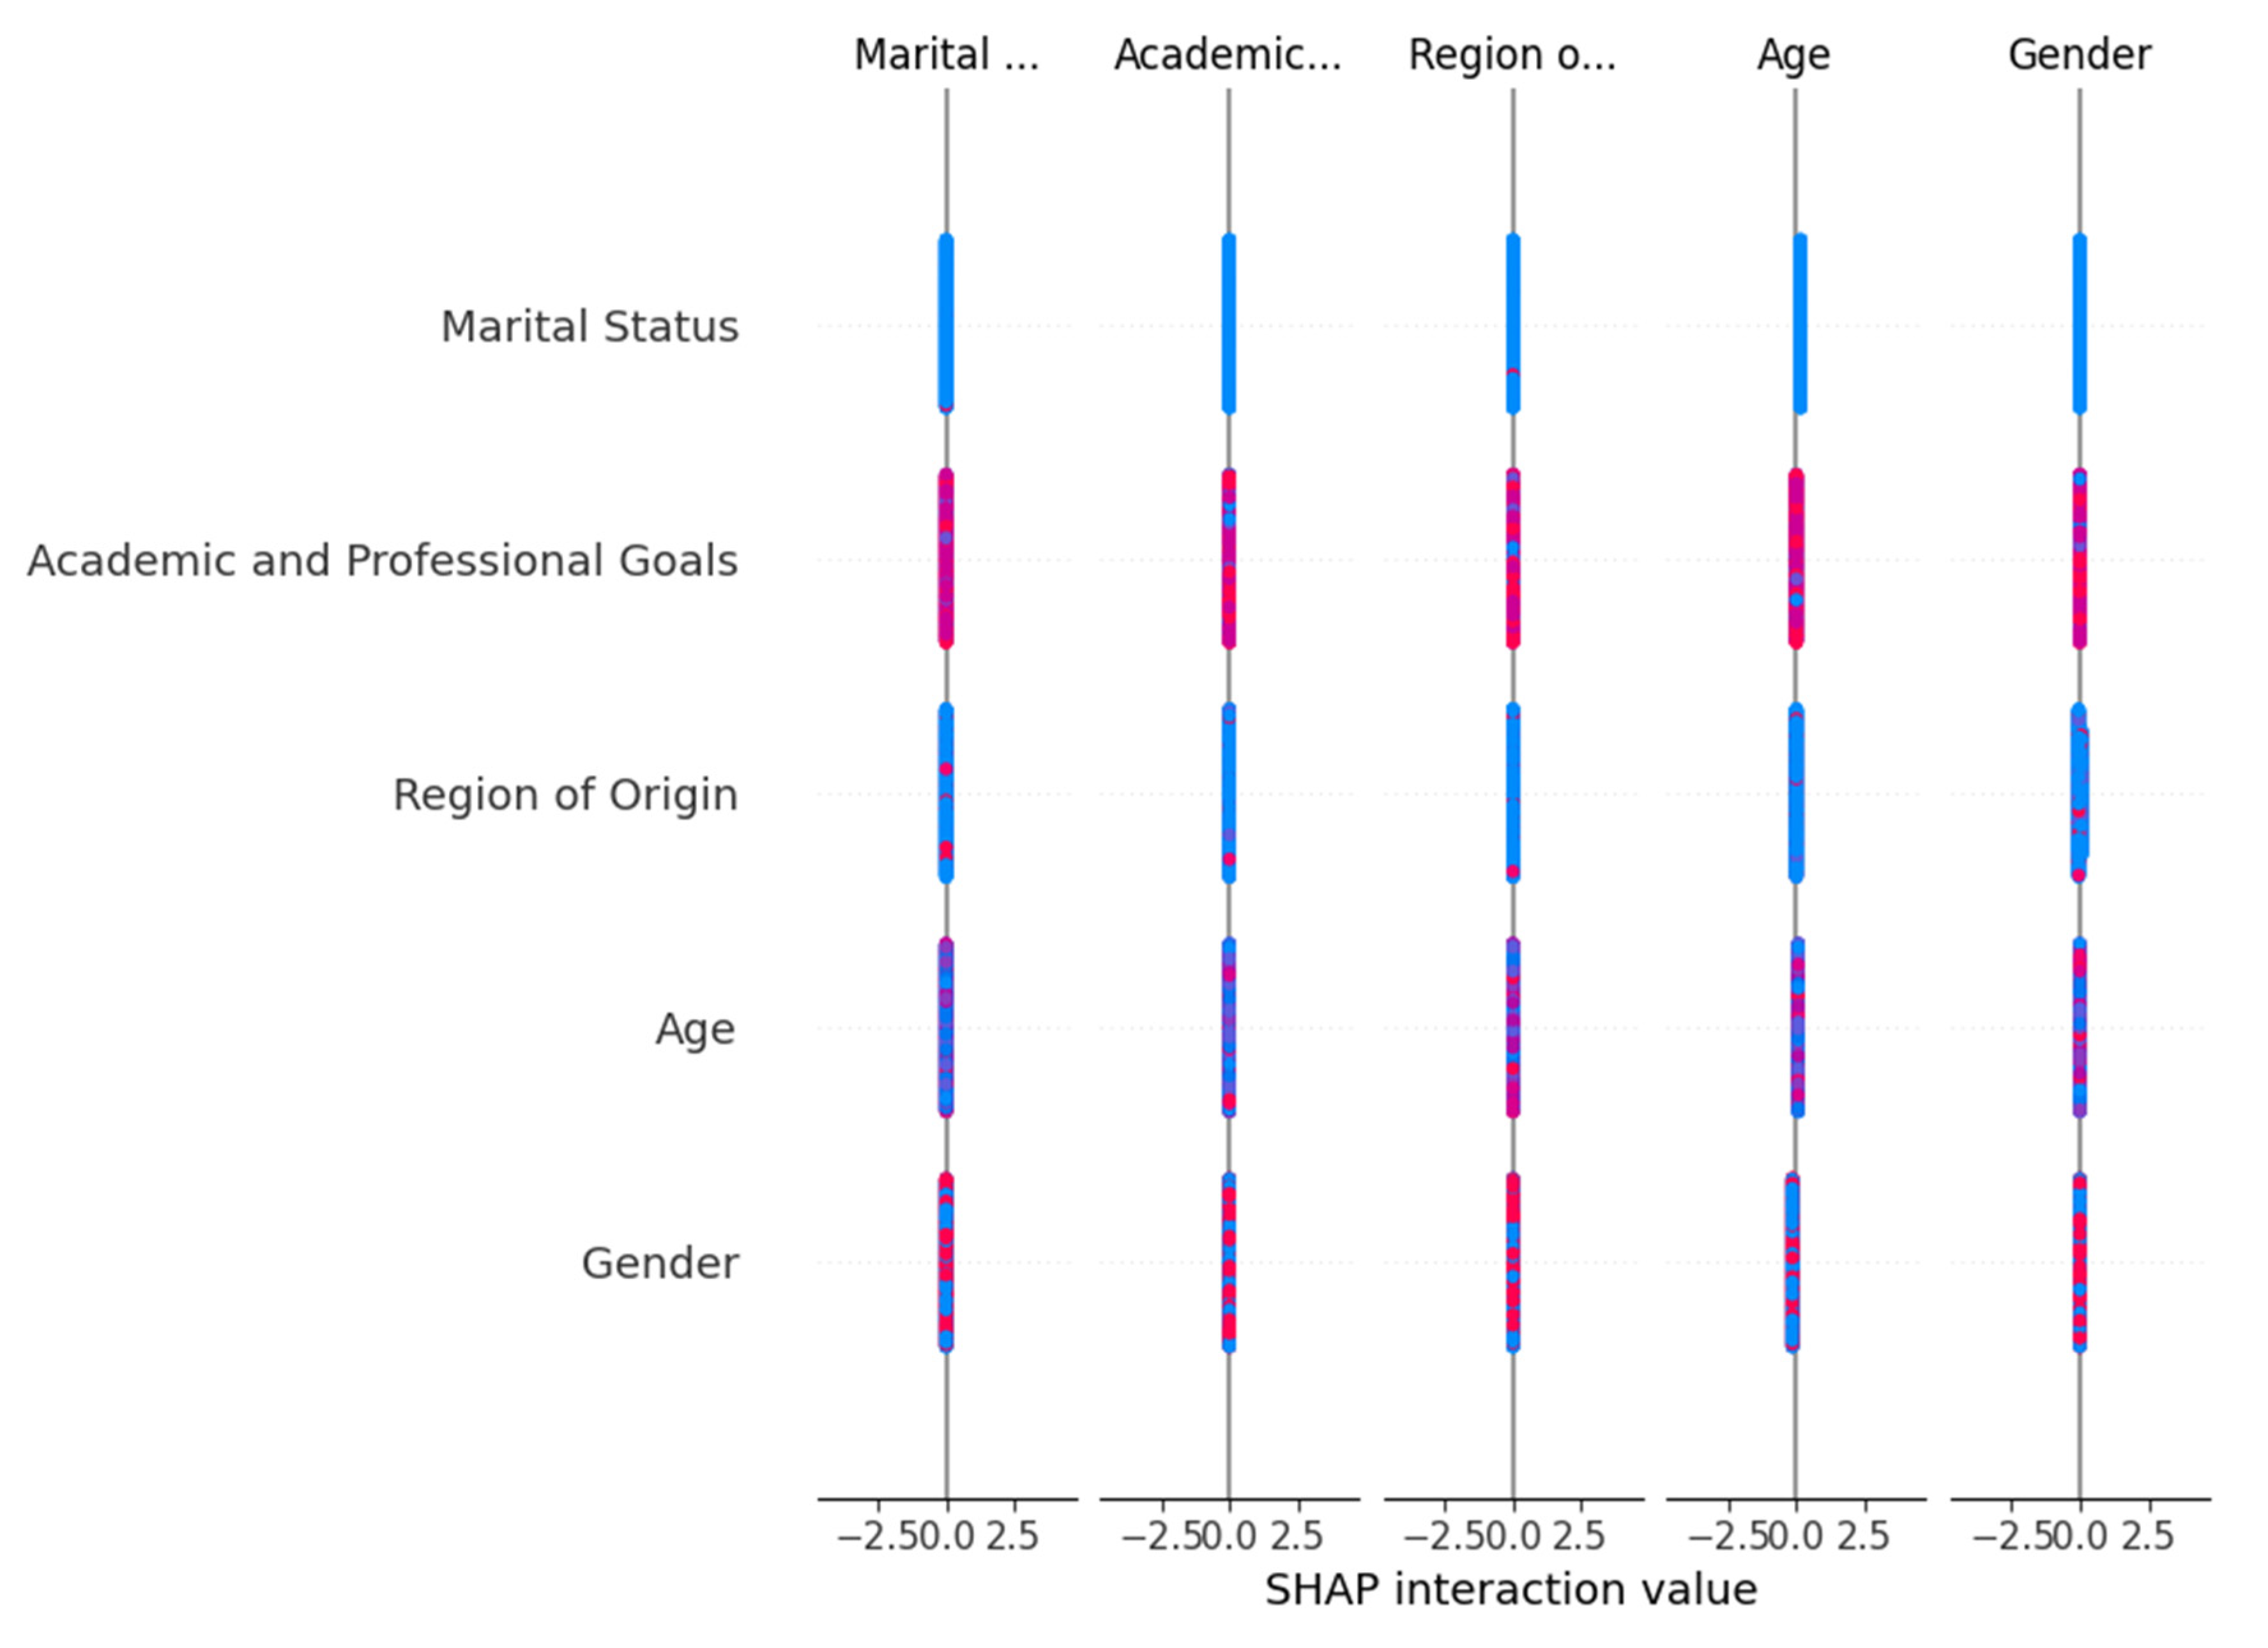
To interpret the influence and interaction of the predictor variables in the student classification model, the SHAP (Shapley Additive exPlanations) approach was applied, using three complementary visualizations: average impact graph per class (Figure 8), scatter plot by variable value (Figure 9), and interaction plot (Figure 10).
The average impact per class showed that psychological support, academic school, and GPA were the variables with the greatest overall contribution to the model; factors such as age, learning strategies, and commuting time showed an intermediate influence, while variables such as interaction with teachers and family motivation had more limited effects.
The scatter plot allowed us to observe specific values for each variable’s effect prediction, revealing nonlinear patterns. Relevant variables were identified, such as physical condition, academic support programs, tutor monitoring, and teaching quality, whose impact varies depending on the level of each characteristic.
The interaction graph showed that combinations of sociocultural variables such as age, gender, region of origin, and academic goals can amplify or attenuate the predictive effect. This analysis allows for the identification of distinct profiles and justifies the inclusion of interaction terms in more robust models.

3.7. Sensitivity Analysis

Figure 11 shows that the importance of psychological support (33.7%) and previous GPA (33.3%) are the variables with the greatest influence on student dropout and are also determining factors in anticipating the probability of dropping out. The academic year contributes only 1.9% to the application of the model; that is, its predictive relevance is very low. Other variables (31.1%) are not individually dominant, but together they contribute considerably to the overall predictive capacity.

4. Discussion

Previous research on predicting university dropout rates has focused exclusively on academic indicators, such as grade point average or previous performance [17,23,35]. The study’s findings reveal that variables not necessarily directly linked to academic performance have a substantial impact on the likelihood of dropping out. As evidenced in the results, psychological support consistently emerged as the most influential factor in all the machine learning models applied, even surpassing previous GPA, which has traditionally been considered the most robust predictor of student performance. This result coincides with Alencar et al. [72], who emphasize that mental health is a critical determinant of university retention.
Similarly, the comparative analysis of attributes showed that variables such as academic school, age, parental job stability, and frequency of school attendance also have a significant impact on predicting dropout rates. These findings broaden the scope of previous studies that focused exclusively on academic factors by showing that dropout rates respond to a multidimensional structure jointly influenced by social, familial, and institutional factors [22,46]. The incorporation of these variables into the predictive system allows for the identification of more diverse risk profiles, preventing students with acceptable average performance from being excluded from prevention strategies.
The analysis using LR and decision trees showed that, along with academic factors, elements linked to the institutional and socio-emotional environment play a fundamental role. Variables such as perceived campus safety, teaching quality, and tutorial support appear to moderate student engagement, in line with what was proposed by Chen [66] and De Silva et al. [67], who highlight the importance of clear institutional policies to ensure retention. In this study, psychological support not only acts as a protective factor but also appears as a central dividing node in student classification, reinforcing the need to strengthen university well-being services.
Furthermore, the SHAP analysis identified relevant interactions between academic and sociocultural factors, such as the combination of gender, age, and region of origin, which amplify or attenuate the probability of dropping out. These findings are consistent with the approaches of Piepenburg & Beckmann [56], who argue that dropout rates cannot be explained solely by individual deficits, but rather respond to complex dynamics of social and academic integration. Consequently, predictive models that incorporate this interaction effects offer a more precise understanding of risk profiles and allow for the design of interventions tailored to individual student characteristics.
Likewise, the sensitivity analysis showed that psychological support (33.7%) and previous GPA (33.3%) account for more than two-thirds of the predictive capacity, while variables traditionally considered relevant, such as the academic year, barely reach 1.9%. This suggests that predicting dropout rates requires a balance between monitoring academic indicators and assessing support and well-being factors. As noted by Alencar et al. [72] and Barragán & González [46], mental health care and building emotionally supportive environments are central strategies not only for student success, but also for the sustainability of educational institutions.
The robustness of predictive models used in this study, according to Cordova et al. [89], depends on the methodological strategies employed; for example, the construction of tables of characteristics adapted to the variable length of academic records, using techniques such as the use of averages, medians, or information from the last semester, has proven to be crucial to avoid bias in the predictors [17,90]. Likewise, class imbalance, where dropouts often represent a minority percentage, is a recurring challenge, as it tends to bias models toward predicting permanence; in this sense, oversampling methods such as SMOTE and F1 Score have shown improvements in sensitivity [21,91]; the literature emphasizes that the stability and transferability of models are achieved when attribute engineering techniques, data balancing, and machine learning algorithm selection are appropriately combined, thus ensuring predictions applicable to different educational contexts [32,92,93].
Data mining techniques identified predictive factors of university dropout, but relying on numerical patterns carries the risk of oversimplifying a complex and multidimensional phenomenon, leaving out personal motivations or specific contexts. Even so, their use is valuable for monitoring trends and updating predictions as political, economic, and social conditions change, functioning more as a dynamic tracking system than a static prediction tool. Although the study was conducted at a single university, the findings are transferable to other institutions, especially in Latin America. The consistent importance of psychological support, prior academic performance, and institutional and socioeconomic factors shows that these needs are common and that identifying factors without complementary interventions limits the impact; therefore, the results should serve as a basis for designing concrete actions to strengthen retention programs and predictive systems.
The self-administered survey may introduce social desirability bias in sensitive areas such as academic difficulties or motivation, and because it is based on cross-sectional data, it does not allow for establishing causal relationships or explaining in depth the reasons for dropout, but only the associated factors. Therefore, it is recommended to complement these models with longitudinal studies, qualitative analyses, and mixed approaches that integrate administrative records and students’ subjective experiences to improve both predictive capacity and the understanding of the mechanisms underlying dropout, moving toward more contextualized interpretations.

5. Conclusions

The study shows that university dropout is a comprehensive and diverse phenomenon, involving not only academic factors such as previous GPA, identified through Weka’s feature selection methods as one of the most relevant, but also institutional, socioeconomic, and personal dimensions. Psychological support emerged as the most influential predictor in all the models applied, demonstrating that emotional well-being is as important as academic performance for anticipating and preventing student dropout.
The use of machine learning algorithms, along with explanatory techniques such as SHAP, allowed us to identify complex patterns and interactions between variables, revealing distinct dropout risk profiles. This methodological approach confirms the utility of data mining in education and contributes to the development of more accurate predictive models capable of integrating individual and contextual factors.
Integrating psychological, institutional, and socioeconomic factors significantly strengthens the prediction of university dropout rates along with academic performance. While traditional literature has prioritized GPA as a determining variable, the results obtained confirm that dropout rates respond to a network of interconnected elements that require comprehensive approaches. In this sense, incorporating these variables into predictive models not only improves the accuracy of predictions but also facilitates the design of more inclusive and sustainable educational policies, aligned with the current challenges of higher education in Latin American contexts.
Given that psychological support emerged as the most influential predictor across all models, together with institutional and socioeconomic variables, future research should involve collaborations with multiple institutions across different regions to enable broader data collection and more comprehensive analysis. Expanding the study to include longitudinal follow-up and evaluating the influence of structural factors, such as public policies and educational funding, will make it possible to track how these determinants evolve over time and deepen the understanding of student persistence.

Author Contributions

Y.R.M., L.Q.H., O.C.C., J.L.M.G., J.N.A.T., E.S.B. and R.C.S.; methodology, Y.R.M., L.Q.H. and O.C.C.; software, L.Q.H. and O.C.C.; validation, Y.R.M., L.Q.H., O.C.C., J.L.M.G., J.N.A.T., E.S.B. and R.C.S.; formal analysis, Y.R.M., O.C.C., J.L.M.G., J.N.A.T., E.S.B. and R.C.S.; investigation, Y.R.M., L.Q.H., O.C.C., J.L.M.G., J.N.A.T., E.S.B. and R.C.S.; resources, Y.R.M.; data curation, Y.R.M., L.Q.H., O.C.C., J.L.M.G., J.N.A.T., E.S.B. and R.C.S.; writing—original draft preparation, L.Q.H., O.C.C. and E.S.B.; writing—review and editing, O.C.C.; visualization, Y.R.M., L.Q.H., O.C.C., J.L.M.G., J.N.A.T., E.S.B. and R.C.S.; supervision, Y.R.M.; project administration, Y.R.M.; funding acquisition, Y.R.M. All authors have read and agreed to the published version of the manuscript.

Funding

This research received no external funding.

Institutional Review Board Statement

The study holds an official Ethical Review Waiver Certificate issued by the Institutional Committee on Research Ethics (CIEI–UNTRM), under project code 0014-CIEI-2025.

Informed Consent Statement

Informed consent was obtained from all subjects involved in the study.

Data Availability Statement

The data is available upon request to the corresponding author.

Conflicts of Interest

The authors declare no conflicts of interest.

References

  1. Escalante, J.; Medina, C.; Vásquez, A. La deserción universitaria: Un problema no resuelto en el Perú. Hacedor—AIAPAEC 2023, 7, 60–72. [Google Scholar] [CrossRef]
  2. OECD. Education at a Glance 2020; OECD: Paris, France, 2020. [Google Scholar] [CrossRef]
  3. Sotomayor, P.; Rodríguez, D. Factores explicativos de la deserción académica en la Educación Superior Técnico Profesional: El caso de un centro de formación técnica. Rev. Estud. Exp. Educ. 2020, 19, 199–223. [Google Scholar] [CrossRef]
  4. Ortiz, F. El Problema del Abandono Escolar: Un Análisis de los Factores de Deserción en el Tesis para Optar por el Grado de Magíster en Educación. Master’s Thesis, Universidad Nacional de la Plata, La Plata, Argentine, 2024. Available online: https://sedici.unlp.edu.ar/bitstream/handle/10915/178147/Documento_completo.pdf-PDFA.pdf?sequence=1&isAllowed=y (accessed on 17 May 2025).
  5. Villegas, B.; Núñez, L. Factores asociados a la deserción estudiantil en el ámbito universitario. Una revisión sistemática 2018–2023. RIDE Rev. Iberoam. Para Investig. Desarro. Educ. 2024, 14, e671. [Google Scholar] [CrossRef]
  6. UNESCO. La Educación Superior en América Latina y el Caribe: Avances y Retos; Documentos de Apoyo Para la CRES+5. Available online: https://unesdoc.unesco.org/ark:/48223/pf0000392578.locale=en (accessed on 17 May 2025).
  7. Herreño, M.; Romero, J.; Mejía, J.; Román, W. Deserción estudiantil en educación superior. Tendencias y oportunidades en la era post pandemia. Rev. Arbitr. Interdiscip. Koinonía 2024, 9, 156–177. [Google Scholar] [CrossRef]
  8. Londoño, L. Facteurs de risque présents dans la désertion d’étudiants dans la Corporation Universitaire Lasallista. Rev. Virtual Univ. Católica Norte 2013, 1, 183–194. Available online: https://bit.ly/1OnjEwM (accessed on 4 March 2025).
  9. Zamora-Vélez, G.A.; Bermúdez-Cevallos, L.D.R. Socioeconomic factors and university student dropout. Int. J. Soc. Sci. 2024, 7, 103–112. [Google Scholar] [CrossRef]
  10. Reyes, I. Deserción Universitaria: Causas y Cómo la Educación Virtual Puede Ayudar a Reducirla. Available online: https://cognosonline.com/desercion-universitaria/ (accessed on 17 May 2025).
  11. Gómez, L.; Moreno, G.; Zapata, S. La pandemia del COVID-19 y su impacto en la deserción estudiantil. Rev. Cienc. Humanidades 2022, 38, 352–374. [Google Scholar] [CrossRef]
  12. Urbina, A.; Camino, J.; Cruz, R. Deserción escolar universitaria: Patrones para prevenirla aplicando minería de datos educativa. RELIEVE—Rev. Electrónica Investig. Evaluación Educ. 2020, 26, 1–19. [Google Scholar] [CrossRef]
  13. Aulakh, K.; Kumar, R.; Kaushal, M. E-learning enhancement through educational data mining with COVID-19 outbreak period in backdrop: A review. Int. J. Educ. Dev. 2023, 101, 102814. [Google Scholar] [CrossRef] [PubMed]
  14. Barbeiro, L.; Gomes, A.; Correia, F.; Bernardino, J. A Review of Educational Data Mining Trends. Procedia Comput. Sci. 2024, 237, 88–95. [Google Scholar] [CrossRef]
  15. Cerezo, R.; Lara, J.; Azevedo, R.; Romero, C. Reviewing the differences between learning analytics and educational data mining: Towards educational data science. Comput. Hum. Behav. 2024, 154, 108155. [Google Scholar] [CrossRef]
  16. Maniyan, S.; Ghousi, R.; Haeri, A. Data mining-based decision support system for educational decision makers: Extracting rules to enhance academic efficiency. Comput. Educ. Artif. Intell. 2024, 6, 100242. [Google Scholar] [CrossRef]
  17. Rabelo, A.; Zárate, L. A model for predicting dropout of higher education students. Data Sci. Manag. 2025, 8, 72–85. [Google Scholar] [CrossRef]
  18. Feng, G.; Fan, M. Research on learning behavior patterns from the perspective of educational data mining: Evaluation, prediction and visualization. Expert Syst. Appl. 2024, 237, 121555. [Google Scholar] [CrossRef]
  19. Peña, A. Educational data mining: A survey and a data mining-based analysis of recent works. Expert Syst. Appl. 2014, 41, 1432–1462. [Google Scholar] [CrossRef]
  20. Chalaris, M.; Gritzalis, S.; Maragoudakis, M.; Sgouropoulou, C.; Tsolakidis, A. Improving Quality of Educational Processes Providing New Knowledge Using Data Mining Techniques. Procedia Soc. Behav. Sci. 2014, 147, 390–397. [Google Scholar] [CrossRef]
  21. Mustofa, S.; Emon, Y.; Mamun, S.; Akhy, S.; Ahad, M. A novel AI-driven model for student dropout risk analysis with explainable AI insights. Comput. Educ. Artif. Intell. 2025, 8, 100352. [Google Scholar] [CrossRef]
  22. Vaarma, M.; Li, H. Predicting student dropouts with machine learning: An empirical study in Finnish higher education. Technol. Soc. 2024, 76, 102474. [Google Scholar] [CrossRef]
  23. Martínez, J.; Castillo, D. Prediction of student dropout using Artificial Intelligence algorithms. Procedia Comput. Sci. 2024, 251, 764–770. [Google Scholar] [CrossRef]
  24. Chytas, K.; Tsolakidis, A.; Triperina, E.; Karanikolas, N.; Skourlas, C. Academic data derived from a university e-government analytic platform: An educational data mining approach. Data Brief 2023, 49, 109357. [Google Scholar] [CrossRef]
  25. Shaik, T.; Tao, X.; Dann, C.; Xie, H.; Li, Y.; Galligan, L. Sentiment analysis and opinion mining on educational data: A survey. Nat. Lang. Process. J. 2023, 2, 100003. [Google Scholar] [CrossRef]
  26. Lemay, D.J.; Baek, C.; Doleck, T. Comparison of learning analytics and educational data mining: A topic modeling approach. Comput. Educ. Artif. Intell. 2021, 2, 100016. [Google Scholar] [CrossRef]
  27. Romero, C.; Ventura, S. Educational Data Mining: A Review of the State of the Art. IEEE Trans. Syst. Man Cybern. Part C (Appl. Rev.) 2010, 40, 601–618. [Google Scholar] [CrossRef]
  28. Sarker, S.; Kumar, M.; Sheikh, T.; Al Mehedi, M. Analyzing students’ academic performance using educational data mining. Comput. Educ. Artif. Intell. 2024, 7, 100263. [Google Scholar] [CrossRef]
  29. Cardoso, R.; Brito, K.; Leitão, P. A data mining framework for reporting trends in the predictive contribution of factors related to educational achievement. Expert Syst. Appl. 2023, 221, 119729. [Google Scholar] [CrossRef]
  30. Alam, M.; Raza, M. Analyzing energy consumption patterns of an educational building through data mining. J. Build. Eng. 2021, 44, 103385. [Google Scholar] [CrossRef]
  31. Dol, S.; Jawandhiya, P. Classification Technique and its Combination with Clustering and Association Rule Mining in Educational Data Mining—A survey. Eng. Appl. Artif. Intell. 2023, 122, 106071. [Google Scholar] [CrossRef]
  32. Rodrigues, M.; Isotani, S.; Zárate, L. Educational Data Mining: A review of evaluation process in the e-learning. Telemat. Inform. 2018, 35, 1701–1717. [Google Scholar] [CrossRef]
  33. Aldowah, H.; Al-Samarraie, H.; Mohamad, W. Educational data mining and learning analytics for 21st century higher education: A review and synthesis. Telemat. Inform. 2019, 37, 13–49. [Google Scholar] [CrossRef]
  34. Mohamad, S.K.; Tasir, Z. Educational Data Mining: A Review. Procedia Soc. Behav. Sci. 2013, 97, 320–324. [Google Scholar] [CrossRef]
  35. Asif, R.; Merceron, A.; Ali, S.A.; Haider, N.G. Analyzing undergraduate students’ performance using educational data mining. Comput. Educ. 2017, 113, 177–194. [Google Scholar] [CrossRef]
  36. Aina, C.; Baici, E.; Casalone, G.; Pastore, F. The determinants of university dropout: A review of the socio-economic literature. Socioecon. Plan. Sci. 2022, 79, 101102. [Google Scholar] [CrossRef]
  37. Phan, M.; De Caigny, A.; Coussement, K. A decision support framework to incorporate textual data for early student dropout prediction in higher education. Decis. Support. Syst. 2023, 168, 113940. [Google Scholar] [CrossRef]
  38. Abarca, A.; Sánchez, A. La deserción estudiantil en la educación superior: El caso de la universidad de Costa Rica. Rev. Electrónica Actual. Investig. Educ. 2005, 5, 1–22. Available online: https://bit.ly/35TVeLE (accessed on 3 March 2025).
  39. Cabrera, L.; Bethencourt, J.; Alvarez, P.; González, M. El problema del abandono de los estudios universitarios. RELIEVE—Rev. Electrónica Investig. Evaluación Educ. 2014, 12, 171–203. [Google Scholar] [CrossRef]
  40. Ruíz, L. Deserción en la Educación Superior Recinto las Minas. Período 2001–2007. Cienc. Intercult. 2009, 4, 30–46. [Google Scholar] [CrossRef]
  41. Núñez, D. Modelo Predictivo basado en Aprendizaje Automático para la retención Estudiantil en Educación Superior. Eur. Public Soc. Innov. Rev. 2025, 10, 1–21. [Google Scholar] [CrossRef]
  42. Pierrakeas, C.; Koutsonikos, G.; Lipitakis, A.; Kotsiantis, S.; Xenos, M.; Gravvanis, G. The Variability of the Reasons for Student Dropout in Distance Learning and the Prediction of Dropout-Prone Students. In Machine Learning Paradigms; Springer: Cham, Switzerland, 2020; pp. 91–111. [Google Scholar] [CrossRef]
  43. Utami, S.; Winarni, I.; Handayani, S.; Zuhauri, F. When and Who Dropouts from Distance Education? Turk. Online J. Distance Educ. 2020, 21, 141–152. [Google Scholar] [CrossRef]
  44. Fozdar, B.; Kumar, L.; Kannan, S. A Survey of a Study on the Reasons Responsible for Student Dropout from the Bachelor of Science Programme at Indira Gandhi National Open University. Int. Rev. Res. Open Distance Learn. 2006, 7. [Google Scholar] [CrossRef]
  45. Marczuk, A. Is it all about individual effort? The effect of study conditions on student dropout intention. Eur. J. High. Educ. 2023, 13, 509–535. [Google Scholar] [CrossRef]
  46. Barragán, S.; González, L. Complexities of student dropout in higher education: A multidimensional analysis. Front. Educ. 2024, 9, 1461650. [Google Scholar] [CrossRef]
  47. Stinebrickner, T.R.; Stinebrickner, R. Learning about academic ability and the college drop-out decision. J. Labor Econ. 2012, 30, 707–748. [Google Scholar] [CrossRef]
  48. Bardach, L.; Lüftenegger, M.; Oczlon, S.; Spiel, C.; Schober, B. Context-related problems and university students’ dropout intentions—The buffering effect of personal best goals. Eur. J. Psychol. Educ. 2020, 35, 477–493. [Google Scholar] [CrossRef]
  49. Bargmann, C.; Thiele, L.; Kauffeld, S. Motivation matters: Predicting students’ career decidedness and intention to drop out after the first year in higher education. High. Educ. 2022, 83, 845–861. [Google Scholar] [CrossRef]
  50. Geisler, S. What role do students’ beliefs play in a successful transition from school to university mathematics? Int. J. Math. Educ. Sci. Technol. 2023, 54, 1458–1473. [Google Scholar] [CrossRef]
  51. Wild, S.; Schulze, L. Student dropout and retention: An event history analysis among students in cooperative higher education. Int. J. Educ. Res. 2020, 104, 101687. [Google Scholar] [CrossRef]
  52. Anttila, S.; Lindfors, H.; Hirvonen, R.; Määttä, S.; Kiuru, N. Dropout intentions in secondary education: Student temperament and achievement motivation as antecedents. J. Adolesc. 2023, 95, 248–263. [Google Scholar] [CrossRef]
  53. Parr, A.K.; Bonitz, V.S. Role of Family Background, Student Behaviors, and School-Related Beliefs in Predicting High School Dropout. J. Educ. Res. 2015, 108, 504–514. [Google Scholar] [CrossRef]
  54. Álvarez, N.; Castellanos, S.; Niño, R. Cuestionario variables de riesgo de deserción universitaria: Comprensión y pertinencia del instrumento. Rastros Rostros 2023, 26, 1–21. [Google Scholar] [CrossRef]
  55. Archambault, I.; Janosz, M.; Dupéré, V.; Brault, M.; Andrew, M.M. Individual, social, and family factors associated with high school dropout among low-SES youth: Differential effects as a function of immigrant status. Br. J. Educ. Psychol. 2017, 87, 456–477. [Google Scholar] [CrossRef]
  56. Piepenburg, J.; Beckmann, J. The relevance of social and academic integration for students’ dropout decisions. Evidence from a factorial survey in Germany. Eur. J. High. Educ. 2022, 12, 255–276. [Google Scholar] [CrossRef]
  57. Rumberger, R.; Ghatak, R.; Poulos, G.; Ritter, P.L.; Dornbusch, S.M. Family Influences on Dropout Behavior in One California High School. Sociol. Educ. 1990, 63, 283. [Google Scholar] [CrossRef]
  58. Sweet, R. Student dropout in distance education: An application of Tinto’s model. Distance Educ. 1986, 7, 201–213. [Google Scholar] [CrossRef]
  59. Stoessel, K.; Ihme, T.A.; Barbarino, M.; Fisseler, B.; Stürmer, S. Sociodemographic Diversity and Distance Education: Who Drops Out from Academic Programs and Why? Res. High. Educ. 2015, 56, 228–246. [Google Scholar] [CrossRef]
  60. Bardales, E.; Carrasco, A.; Marín, Y.; Caro, O.; Fernández, M.; Santos, R. Determinants of academic desertion: A case study in a Peruvian university. Power Educ. 2025. [Google Scholar] [CrossRef]
  61. Carrasco, A.; Bardales, E.; Marín, Y.; Caro, O.; Santos, R.; Rubio, Y.d.C.M. Comprehensive Wellness in University Life: An Analysis of Student Services and Their Impact on Quality of Life. J. Educ. Soc. Res. 2024, 14, 514. [Google Scholar] [CrossRef]
  62. Kocsis, Z.; Pusztai, G. Student Employment as a Possible Factor of Dropout. Acta Polytech. Hung. 2020, 17, 183–199. Available online: https://acta.uni-obuda.hu/Kocsis_Pusztai_101.pdf (accessed on 15 April 2025). [CrossRef]
  63. Lenon, M.; Majid, M. Student Dropouts and their Economic Impact in the Post-Pandemic Era: A Systematic Literature Review. Int. J. Acad. Res. Bus. Soc. Sci. 2024, 14, 2142–2161. [Google Scholar] [CrossRef] [PubMed]
  64. Villanueva, N.; Rios, S.; Meneses, B. Exploration of theoretical conceptualizations of the causes of college dropout. Semin. Med. Writ. Educ. 2022, 1, 15. [Google Scholar] [CrossRef]
  65. Katel, N.; Katel, K.P. Factors Influencing Students’ Dropout in Bachelor’s Level. Sotang Yrly. Peer Rev. J. 2024, 6, 69–84. [Google Scholar] [CrossRef]
  66. Chen, R. Institutional Characteristics and College Student Dropout Risks: A Multilevel Event History Analysis. Res. High. Educ. 2012, 53, 487–505. [Google Scholar] [CrossRef]
  67. De Silva, L.M.H.; Chounta, I.; Rodríguez, M.; Roa, E.; Gramberg, A.; Valk, A. Toward an Institutional Analytics Agenda for Addressing Student Dropout in Higher Education. J. Learn. Anal. 2022, 9, 179–201. [Google Scholar] [CrossRef]
  68. Gubbels, J.; van der Put, C.; Assink, M. Risk Factors for School Absenteeism and Dropout: A Meta-Analytic Review. J. Youth Adolesc. 2019, 48, 1637–1667. [Google Scholar] [CrossRef]
  69. Cuevas, M.; Díaz, F.; Díaz, M.; Vicente, M. Prediction analysis of academic dropout in students of the Pablo de Olavide University. Front. Educ. 2023, 7, 1083923. [Google Scholar] [CrossRef]
  70. Nurmalitasari, A.; Faizuddin, M. Factors Influencing Dropout Students in Higher Education. Educ. Res. Int. 2023, 2023, 7704142. [Google Scholar] [CrossRef]
  71. Lee, Y.; Choi, J.; Kim, T. Discriminating factors between completers of and dropouts from online learning courses. Br. J. Educ. Technol. 2013, 44, 328–337. [Google Scholar] [CrossRef]
  72. Alencar, A.; Fernandes, M.A.; Vedana, K.G.G.; Lira, J.A.C.; Barbosa, N.S.; Rocha, E.P.; Cunha, K.R.F. Mental health and university dropout among nursing students: A cross-sectional study. Nurse Educ. Today 2025, 147, 106571. [Google Scholar] [CrossRef]
  73. Košir, S.; Aslan, M.; Lakshminarayanan, R. Application of school attachment factors as a strategy against school dropout: A case study of public school students in Albania. Child. Youth Serv. Rev. 2023, 152, 107085. [Google Scholar] [CrossRef]
  74. Deleña, R.; Dia, N.J.; Sacayan, R.R.; Sieras, J.C.; Khalid, S.A.; Macatotong, A.H.T.; Gulam, S.B. Predicting student retention: A comparative study of machine learning approach utilizing sociodemographic and academic factors. Syst. Soft Comput. 2025, 7, 200352. [Google Scholar] [CrossRef]
  75. Alwarthan, S.; Aslam, N.; Khan, I.U. An Explainable Model for Identifying At-Risk Student at Higher Education. IEEE Access 2022, 10, 107649–107668. [Google Scholar] [CrossRef]
  76. Vijayalakshmi, V.; Venkatachalapathy, K. Comparison of Predicting Student‘s Performance using Machine Learning Algorithms. Int. J. Intell. Syst. Appl. 2019, 11, 34–45. [Google Scholar] [CrossRef]
  77. Almalawi, A.; Soh, B.; Li, A.; Samra, H. Predictive Models for Educational Purposes: A Systematic Review. Big Data Cogn. Comput. 2024, 8, 187. [Google Scholar] [CrossRef]
  78. Costa, T.; Falcão, B.; Mohamed, M.; Annuk, A.; Marinho, M. Employing machine learning for advanced gap imputation in solar power generation databases. Sci. Rep. 2024, 14, 23801. [Google Scholar] [CrossRef]
  79. Tyagi, A. ¿Qué es el algoritmo XGBoost? Analytics Vidhya. Available online: https://www.analyticsvidhya.com/blog/2018/09/an-end-to-end-guide-to-understand-the-math-behind-xgboost/ (accessed on 30 July 2025).
  80. Carvajal, P.; Trejos, Á. Revisión de estudios sobre deserción estudiantil en educación superior en Latinoamérica bajo la perspectiva de Pierre Bourdieu. In Proceedings of the Congresos CLABES, Quito, Ecuador, 9–11 November 2016. [Google Scholar]
  81. Vélez, A.; López, D. Estrategias para vencer la deserción universitaria. Educ. Educ. 2004, 7, 177–203. Available online: https://bit.ly/39MgeEJ (accessed on 3 March 2025).
  82. Urbina, A.; Téllez, A.; Cruz, R. Patrones que identifican a estudiantes universitarios desertores aplicando minería de datos educativa. Rev. Electrónica Investig. Educ. 2021, 23, e1507. [Google Scholar] [CrossRef]
  83. Toscano, B.; Margain, L.; Ponce, J.; López, R. Aplicación de Minería de Datos para la Identificación de Factores de Riesgo Asociados a la Muerte Fetal. In Proceedings of the VIII Congreso Internaconal en Ciencias Computacionales—CICOMP 2016, Ensenada, CA, USA, 9–11 November 2016; Available online: https://www.researchgate.net/publication/310797578 (accessed on 10 October 2025).
  84. Amrita; Ahmed, P. A Hybrid-Based Feature Selection Approach for IDS. In Networks and Communications (NetCom2013); Lecture Notes in Electrical Engineering; Springer: Cham, Switzerland, 2014; Volume 284, pp. 195–211. [Google Scholar] [CrossRef]
  85. Murcia, A.; Salazar, J. Predictive and Visual Analytics Models Applied in a Stylistic and Technological Analysis of Spindle Whorls: A Case Study. Cirex-ID. 2018. Available online: https://www.researchgate.net/publication/351512849 (accessed on 10 October 2025).
  86. Badache, I. 2SRM: Learning social signals for predicting relevant search results. Web Intell. 2020, 18, 15–33. [Google Scholar] [CrossRef]
  87. Kononenko, I. Estimación de atributos: Análisis y extensiones de RELIEF. In Proceedings of the Conferencia Europea Sobre Aprendizaje Automático, Catania, Italy, 6–8 April 1994; pp. 171–182. [Google Scholar]
  88. Kira, K.; Rendell, L.A. A Practical Approach to Feature Selection. In Machine Learning Proceedings 1992; Morgan Kaufmann: San Francisco, CA, USA, 1992; pp. 249–256. [Google Scholar] [CrossRef]
  89. Córdova, D.; Terven, J.; Romero-González, J.-A.; Córdova-Esparza, K.-E.; López-Martínez, R.-E.; García-Ramírez, T.; Chaparro-Sánchez, R. Predicting and Preventing School Dropout with Business Intelligence: Insights from a Systematic Review. Information 2025, 16, 326. [Google Scholar] [CrossRef]
  90. Song, Z.; Sung, S.; Park, D.; Park, B. All-Year Dropout Prediction Modeling and Analysis for University Students. Appl. Sci. 2023, 13, 1143. [Google Scholar] [CrossRef]
  91. Leelaluk, S.; Tang, C.; Švábenský, V.; Shimada, A. Knowledge Distillation in RNN-Attention Models for Early Prediction of Student Performance. In Proceedings of the ACM Symposium on Applied Computing, Catania, Italy, 31 March–4 April 2025; Association for Computing Machinery: New York, NY, USA, 2025; pp. 64–73. [Google Scholar] [CrossRef]
  92. Dia, N.; Sieras, J.C.; Khalid, S.A.; Macatotong, A.H.T.; Mondejar, J.M.; Genotiva, E.R.; Delena, R.D. EduGuard RetainX: An advanced analytical dashboard for predicting and improving student retention in tertiary education. SoftwareX 2025, 29, 102057. [Google Scholar] [CrossRef]
  93. Roslan, N.; Jamil, J.M.; Shaharanee, I.; Alawi, S. Prediction of Student Dropout in Malaysian’s Private Higher Education Institute using Data Mining Application. J. Adv. Res. Appl. Sci. Eng. Technol. 2025, 45, 168–176. [Google Scholar] [CrossRef]
Figure 1. CRISP-DM approach to identifying student dropout factors. Note. Adapted Model of [74].
Applsci 15 11911 g001
Figure 2. Sedimentation of eigenvalues according to Exploratory Factor Analysis (EFA). Note. Bartlett’s Test: Chi-square = 2423.12, p-value = 0.000, KMO Index = 0.809.
Applsci 15 11911 g002
Figure 3. Factors associated with student retention by gender.
Applsci 15 11911 g003
Figure 4. Performance, teaching methodology, and family environment.
Applsci 15 11911 g004
Figure 5. Logistic Regression Coefficient by Variable.
Applsci 15 11911 g005
Figure 6. Importance of variables on student dropout, using machine learning algorithms.
Applsci 15 11911 g006
Figure 7. Decision tree for classifying student dropout status. Note. The node colors indicate the predicted dropout risk class: blue = low risk (class 3), green = moderate risk (class 2), orange = high risk (class 1), and purple = no dropout (class 4). Each node shows the splitting variable, the entropy (purity), the number of samples reaching that node, the distribution of cases across the four classes (“value”), and the dominant class (“class”) assigned by the model.
Applsci 15 11911 g007
Figure 8. Average SHAP value (average impact on model prediction).
Applsci 15 11911 g008
Figure 9. SHAP value (effect of the variable on the model’s prediction).
Applsci 15 11911 g009
Figure 10. SHAP value of the interaction between features.
Applsci 15 11911 g010
Figure 11. Sensitivity of variables to dropout status.
Applsci 15 11911 g011
Table 1. Identification of factors associated with dropout.
FactorsDescriptionAuthors
BeliefsIt measures the student’s personal perception and goals, as well as the clarity of their academic and professional objectives.Carvajal & Trejos [80]
Distance and transportationIt refers to the distance between the student’s home and the university, as well as the costs and time spent on transportation.Vélez & López [81]
Abarca & Sánchez [38]
Academic factorsIt addresses the student’s academic performance, the perceived difficulty of the courses, the learning and teaching strategies used, as well as the length of the degree and the time dedicated to study.Ruiz [40]
Londoño [8]
Fozdar et al. [44]
Carvajal & Trejos [80]
Economic factorsIt includes key economic aspects such as the cost of tuition and materials, available scholarships and agreements, the student’s financial dependency, their socioeconomic status, and financial limitations.Vélez & López [81]
Ruiz [40]
Cabrera et al. [39]
Carvajal & Trejos [80]
Personal/family factorsIt refers to the student’s family background, including the educational level of the parents or guardians, and the motivational support the student receives from his or her family.Fozdar et al. [44]
Carvajal & Trejos [80]
Cabrera et al. [39]
Social factorsIt includes the student’s interactions with his friends, classmates, and teachers.Vélez & López [81]
Ruiz [40]
Cabrera et al. [39]
Carvajal & Trejos [80]
Institutional factorsIt aims to study the quality of teaching offered by the institution, the attendance and commitment of teachers, the infrastructure available for learning, and accessibility to additional services such as libraries and psychological support.Ruiz [40]
Abarca & Sánchez [38]
Carvajal & Trejos [80]
Fozdar et al. [44]
Carvajal & Trejos [80]
Lack of orientationThe lack of academic and emotional support that the student may experience during their college career.Abarca & Sánchez [38]
SecurityIt is related to the perception of security on and off the university campus.Vélez & López [81]
Vocation for the careerIt seeks to measure the level of interest, motivation, and commitment that the student has toward his or her career and studies.Abarca & Sánchez [38]
Health situationIt refers to any physical or mental condition that the student may have, which may affect their academic continuity.Abarca & Sánchez [38]
Employment StatusIt measures the students’ financial need to work and covers their personal and academic expenses, as well as the employment status of the parents.Ruiz [40]
Table 2. Factor loading matrix of Exploratory Factor Analysis.
ItemFactor 1Factor 2Factor 3Factor 4Factor 5
Academic and Professional Goals0.1800.0000.0070.0910.602
Life Plan0.146−0.0270.0860.0960.720
Negative Thoughts Influence University Continuation−0.3200.0760.426−0.179−0.306
Religious Influence on Profession−0.1660.3690.238−0.1090.409
On-campus Security0.2960.091−0.0060.7670.165
Surrounding Campus Security0.2690.0890.0470.7920.117
Attendance Difficulty−0.018−0.0990.333−0.278−0.350
Tuition Fee0.332−0.122−0.1680.2770.005
Friends and Peers’ Influence on Performance−0.1700.5420.2420.139−0.330
Interaction with Teachers in Class0.725−0.018−0.0150.0540.276
Interaction with Classmates0.5230.1510.1250.1700.263
Task and Exam Difficulty Level0.1200.0150.529−0.182−0.084
Teaching Methodology0.7220.282−0.0150.0170.120
Teaching Quality0.7700.1690.0660.1740.038
Class Attendance Consistency0.700−0.0060.0990.2330.002
Participation in Additional Services (dining, library, etc.)0.0220.453−0.0910.3700.038
Bureaucratic and Complex Procedures−0.041−0.0700.6020.0690.078
Importance of Previous Schooling0.0780.1340.159−0.1360.123
Family Motivation0.115−0.0880.4850.2400.203
Monitoring by Tutors0.2180.216−0.1140.2500.318
Academic Support Programs0.3870.662−0.120−0.0310.080
Importance of Psychological Support0.3760.648−0.2070.0260.130
Table 3. Variance explained by each factor in Exploratory Factor Analysis.
Factor 1Factor 2Factor 3Factor 4Factor 5
Explained Variance3.25941.74841.45731.88191.7711
Proportion of Variance0.14820.07950.06620.08550.0805
Cumulative Variance0.14820.22760.29390.37940.4599
Note. Total variance explained: 0.4599 (45.99%).
Table 4. Multi-methodological factors are selected for predicting academic performance.
CorrelationAttributeEvalGainRatioAttributeEvalInfoGainAttributeEvalOneRAttributeEvalReliefFAttributeEvalSymmetricalUncertAttributeEval
RankedFactorsRankedFactorsRankedFactorsRankedFactorsRankedFactorsRankedFactors
0.428Previous GPA0.944Previous GPA1.308Previous GPA97.723Previous GPA0.263Previous GPA0.946Previous GPA
0.111Program Duration Semesters0.076Marital Status0.170Academic School62.998Time Spent on Paperwork0.068Academic Term0.067Academic School
0.102Academic Term0.046Father’s Occupation0.148Father’s Occupation62.239Surrounding Campus Security0.060Academic School0.065Father’s Occupation
0.087Time Spent Out with Friends0.046Academic School0.128Academic Term62.239Motivation Continue Studies0.039Participation Additional Services0.057Academic Term
0.073Physical Condition0.041Academic Term0.075Mothers’ Occupation62.239Works to cover expenses0.032Teaching Methodology0.040Mothers’ Occupation
0.071Academic School0.037Program Duration Semesters0.056Mothers’ Educational Level62.239Parental Job Stability Academic Situation0.032Fathers’ Educational Level0.031Region Origin
0.068Academic Support Programs0.034Region Origin0.040Hours of Study62.239Life Plan0.031Economic Dependency0.028Mothers’ Educational Level
0.065Age0.032Mothers Occupation0.039Region Origin62.239Main Means of Transport0.030Gender0.025Program Duration Semesters
0.064Has Scholarship Funding Program0.021Mothers’ Educational Level0.035Fathers’ Educational Level62.239Academic Professional Goals0.029Father’s Occupation0.020Hours of Study
0.060Motivation Continue Studies0.021Has Considered Changing Major0.032Participation Additional Services62.239Religious Influence Profession0.028Teaching Quality0.019Time Spent Out with Friends
Note. The 10 most relevant factors identified by each of the evaluated models were selected.
Disclaimer/Publisher’s Note: The statements, opinions and data contained in all publications are solely those of the individual author(s) and contributor(s) and not of MDPI and/or the editor(s). MDPI and/or the editor(s) disclaim responsibility for any injury to people or property resulting from any ideas, methods, instructions or products referred to in the content.