Article

Multi-Granularity Content-Aware Network with Semantic Integration for Unsupervised Anomaly Detection

1
College of Artificial Intelligence, Nankai University, Tianjin 300350, China
2
North Automatic Control Technology Institute, Taiyuan 030006, China
*
Author to whom correspondence should be addressed.
Appl. Sci. 2025, 15(21), 11842; https://doi.org/10.3390/app152111842
Submission received: 8 October 2025 / Revised: 30 October 2025 / Accepted: 31 October 2025 / Published: 6 November 2025
(This article belongs to the Topic Intelligent Image Processing Technology)

Abstract

Unsupervised anomaly detection has been widely applied to industrial scenarios. Recently, transformer-based methods have also been developed and have produced good performance. Although the global dependencies in anomaly images are considered, the typical patch partition strategy in the vanilla self-attention mechanism ignores the content consistencies in anomaly defects or normal regions. To sufficiently exploit the content consistency in images, we propose the multi-granularity content-aware network with semantic integration (MGCA-Net), in which superpixel segmentation is introduced into feature space to divide images according to their spatial structures. Specifically, we adopt a pre-trained ResNet as the encoder to extract features. Then, we design content-aware attention blocks (CAABs) to capture the global information in features at different granularities. In this block, we impose superpixel segmentation on the features from the encoder and employ the superpixels as tokens for the learning of global relationships. Because the superpixels are divided according to their content consistencies, the spatial structures of objects in anomaly or normal regions are preserved. Meanwhile, the multi-granularity semantic integration block is devised to further integrate the global information of all granularities. Next, we use semantic-guided fusion blocks (SGFBs) to progressively upsample the features with the help of CAABs. Finally, the differences between the outputs of CAABs and SGFBs are calculated and merged to predict the anomaly defects. Thanks to the preservation of content consistency of objects, experimental results on two benchmark datasets demonstrate that our proposed MGCA-Net achieves superior anomaly detection performance over state-of-the-art methods.

1. Introduction

With the advancement of Industry 4.0, modern industrial production is transforming from traditional manual operations to highly automated and intelligent ones. Traditional quality inspection methods cannot meet the needs of efficient and accurate production. In recent years, computer vision technologies have developed rapidly, and the cost of sensors, such as RGB cameras and depth cameras, has also decreased [1]. Both developments make efficient anomaly detection feasible through visual means in industrial scenarios [2]. Visual anomaly detection of industrial images [3] aims to analyze the surface and status of products and locate the abnormal areas by computer vision algorithms, which has become one of the important technologies in industrial processes.
At present, deep neural network (DNN)-based methods have become the mainstream paradigm for visual anomaly detection of industrial images. For example, the autoencoder is considered to estimate the abnormal regions by reconstructing sample features [4]. The generative adversarial network (GAN) is also utilized to infer the anomalies in industrial images by residual and reconstruction errors [5]. In addition, to alleviate the limitations of the local receptive field of convolution neural networks, a transformer is applied to this field owing to its global modeling capabilities. For instance, a self-induction vision transformer [6] is constructed to combine the local semantic information and global semantic information in images. Meanwhile, the vision transformer is further considered in [7] to form an encoder–decoder model for anomaly detection. Similarly, an autoencoder based on a transformer [8] is also built for anomaly analysis, in which coordinate attention modules are introduced. A dual-attention transformer is used to learn the local and global information at two different scales [9].
Although transformer-based anomaly detection methods have produced good performance, the generation manner of tokens destroys the spatial structures of abnormal regions or products in images [10,11]. Specifically, transformer-based methods often adopt the patch partition strategy to synthesize the desired tokens. This strategy ignores the content consistency of objects in images. For example, one abnormal region may be divided into different tokens. Meanwhile, compared to the entire image, the size of the abnormal area is relatively small. The broken spatial structures further lead to the inappropriate estimation of abnormal regions. In addition, the spatial consistencies exist in feature maps of images at different granularities. Therefore, the multi-granularity spatial consistencies should also be considered.
Motivated by the above challenges, we present the multi-granularity content-aware network with semantic integration (MGCA-Net), which incorporates superpixel segmentation into the feature space, enabling the generation of tokens based on spatial structures for unsupervised anomaly detection. In detail, a pre-trained ResNet [12] is utilized as the encoder for hierarchical feature extraction. Following this, we design content-aware attention blocks (CAABs) to capture global contextual information across different feature granularities. Within each CAAB, superpixel segmentation is applied to the features derived from the encoder, and these superpixels with consistent spatial contents are viewed as tokens to achieve the learning of global relationships. By partitioning features according to content consistency, the spatial integrity of objects in both normal and anomalous regions is preserved, enabling more precise anomaly detection. Additionally, we also design a multi-granularity semantic integration block (MGSIB) to aggregate global information from all features from CAABs. Following this, semantic-guided fusion blocks (SGFBs) are constructed to progressively upsample features with the semantic guidance from CAABs. Finally, the anomaly detection is achieved by computing and fusing reconstruction errors between the multi-granularity features from CAABs and SGFBs. Experimental results on two benchmark datasets demonstrate the consistent superiority of the proposed MGCA-Net over state-of-the-art methods. Due to the effective preservation of the content consistency of objects, the proposed MGCA-Net demonstrates better performance in terms of detecting subtle anomalies. In sum, our work makes the following contributions:
1.
The proposed MGCA-Net, consisting of CAABs, MGSIB, and SGFBs to model the content consistency in images. In our model, images are divided into superpixels to generate tokens.
2.
We design CAABs to capture the content consistency in anomaly and abnormal regions. By iterative optimization and segmentation in CAABs, the spatial structures of objects, such as defects and artifacts, are preserved.
3.
We construct the MGSIB to integrate the features from fine, medium, and coarse granularities. By progressive cross-granularity attention, the global semantic information at all granularities is efficiently merged.
The remainder of this paper is organized as follows. Section 2 first reviews the development and trends in the anomaly detection field. Then, Section 3 introduces the proposed MGCA-Net and its modules in detail. Next, Section 4 presents a comprehensive comparison of the experimental results achieved by the proposed MGCA-Net and several state-of-the-art methods across multiple datasets. Finally, we conclude the paper in Section 5.

2. Related Work

Industrial data is typically characterized by a significant class imbalance, with a vast majority of normal samples and a limited number of anomalous instances that exhibit high diversity. For example, the defects vary in terms of shapes, sizes, and locations. According to the use of labeled samples, the methods in this field can be classified into two groups: supervised anomaly detection methods and unsupervised anomaly detection methods [13,14].

2.1. Supervised Anomaly Detection

Supervised anomaly detection methods mainly depend on the training data with anomaly labels and identify anomalies in new samples by the learned differences between normal and anomaly samples. Baitieva et al. [15] proposed a supervised anomaly detection method from the perspective of image segmentation combined with the random forest classifier. Kawachi et al. [16] integrated the complementary set and the variational autoencoder to boost the anomaly detection capability. Yao et al. [17] took the guidance of boundaries between normal and anomaly samples into consideration and employed contrastive learning to learn more efficient features. Yeh et al. [18] designed a Gabor convolutional network and embedded the Taguchi operation into this network to learn the anomaly pattern in the wood defect detection. Although these methods produce good detection results, supervised learning algorithms need a large amount of labeled data for training, which limits their performance in anomaly detection tasks. Meanwhile, the process of gathering and annotating large-scale data is often prohibitively laborious and time-consuming.
To alleviate the demand for training samples, researchers have developed semi-supervised and weakly supervised anomaly detection methods. For the semi-supervised paradigm, Zhou et al. [19] presented a semi-supervised neural process by which the robustness of the prediction results of anomalies was improved. Liu et al. [20] embedded the autoencoder into the prototype learning framework, in which prototype and reconstruction losses were jointly imposed on the anomaly and normal samples, respectively. As for the weakly supervised paradigm, vision-language models are generally considered owing to its powerful representative and strong generalization ability. Following a similar formulation, Yang et al. [21] introduced the text prompt into the large model to alleviate the non-negligible demand for labeled samples. Wang et al. [22] adopted the vision-language models as the auxiliary network to achieve better results under the weakly supervised settings. Zhou et al. [23] considered the latent representations, residual vectors, and reconstruction errors inferred from the autoencoder to sufficiently exploit the limited sample information. Compared to the unsupervised-based anomaly detection methods, supervised methods have better performance because of the available labeled samples.

2.2. Unsupervised Anomaly Detection

Considering a great deal of normal available samples, unsupervised anomaly detection methods are attracting increasing attention from researchers. For example, null subspace PCA detectors [24] were designed and imposed on the features extracted by DNNs for anomaly detection. Tang et al. [25] constructed an anomaly detection framework by combining the reconstruction network and the segmentation network. Huang et al. [26] combined GANs and the autoencoder and calculated the anomaly scores in the latent space. Lin et al. [27] adopted a U-Net with a predictive convolution attention mechanism to boost the extraction of discriminative features for anomaly detection. Zhou et al. [28] built a parallel attention and implemented the multi-head self-attention along the phase dimension to capture the differences. Recently, diffusion models have also been applied to this field. For example, He et al. [29] directly trained a diffusion model on unlabeled data and estimated the abnormal regions by computing the similarity between the multi-scale feature maps from the corresponding encoder and decoder. Following the reconstruction paradigm, Akshay et al. [30] employed a Schrodinger bridge diffusion model to restore the anomaly image as a normal image. Anomaly localization is then achieved by computing the discrepancy between the original and the reconstructed image. Zhang et al. [31] considered the powerful generation ability of the diffusion model and utilized it to synthesize anomaly images for anomaly detection. Very recently, the large language model based on transformers has also been considered in this field for anomaly analysis [32].
According to the description mentioned above, the reconstruction-based framework is widely used among the unsupervised anomaly detection methods thanks to its effectiveness. Under this framework, various DNNs are also explored. For example, He et al. [33] devised a Mamba-based network, in which hybrid state space blocks were equipped for reconstruction. Guo et al. [34] used the encoder and decoder consisting of transformer blocks for the reconstruction of feature maps and then inferred the anomalies. Yao et al. [35] also followed the reconstruction-based transformer and employed semantic aggregation to enhance detection performance. Although the reconstruction-based transformer can capture the global properties in images, the input images of feature maps are always segmented into patches for token generation. Due to the patch segmentation, the integrity and content consistency of objects in images are often destroyed, especially for the small abnormal areas. The damage to content consistency may lead to large reconstruction errors of background regions and improper anomaly localization. Considering the content consistency of objects in images, we introduce the superpixel segmentation strategy into the generation of tokens, instead of the patch partition. Through the superpixel segmentation in feature space, the tokens are obtained according to the content consistency of objects in images, and the division of abnormal regions is avoided. Meanwhile, we also consider the spatial consistencies at fine, medium, and coarse granularities and integrate them together for better anomaly detection. In [36], Park et al. applied the temporal fusion transformer to fault detection, in which gating and temporal attention mechanisms were used to learn the short- and long-term relationships with time series. Differently, our proposed method uses a content-aware attention mechanism to exploit the global dependencies in two-dimensional image space. In addition, Wang et al. [37] proposed a GAN-based data augmentation method for fault detection framework and TabNet achieved the best performance owing to the adopted sequential attention and its decent interpretability. Compared to this method, the proposed method adopts the multi-granularity configuration and attention to sufficiently capture the spatial features along horizontal and vertical dimensions.

3. Proposed MGCA-Net

As shown in Figure 1, the proposed MGCA-Net takes an image as input and outputs a corresponding anomaly score map, in which larger values indicate a higher probability that the corresponding region contains a defect. Specifically, the proposed MGCA-Net comprises three main components: an encoder, a decoder, and an inference module. In the proposed MGCA-Net, the encoder is derived from a pre-trained ResNet-50, in which the first three residual blocks (ResBlocks) are used to extract multi-granularity features from the input image I H × W . H × W is the spatial dimension of the input image. Then, the multi-granularity features F 1 , F 2 , and F 3 with different sizes are fed into the decoder consisting of CAABs, MGSIB, and SGFBs for feature reconstruction. In the decoder, the features from fine, medium, and coarse granularities are successively enhanced by CAAB 1, 2, and 3 by introducing the content-aware superpixel segmentation into the self-attention mechanism. The enhanced multi-granularity features are merged by MGSIB for the improvement of semantic information. Subsequently, the output of MGSIB is progressively improved by SGFBs with the introduction of content-aware information from CAABs. Finally, the feature maps between CAABs and their corresponding SGFBs are sent into the inference module to calculate and integrate the reconstruction errors for the prediction of anomaly regions. During the unsupervised training, the reconstruction errors between CAABs and SGFBs features are minimized to backward the gradient. When the model is tested, an anomaly score map is generated by integrating the feature similarity at different granularities. The details of CAAB, MGSIB, and SGFB are presented as follows.

3.1. Content-Aware Attention Block

As analyzed in Section 1, the vanilla self-attention in the transformer fails to consider the content consistency of objects within images and may result in the damage of spatial structures due to the patch partition manner. Meanwhile, the global information in the features from the encoder is not exploited sufficiently because the ResBlocks in ResNet-50 only contain convolution operations. To explore the global information and preserve the content consistency simultaneously, we design the CAAB shown in Figure 2 and apply the superpixel segmentation technique to the feature maps, by which different superpixels are generated. Because the homogeneity properties in images are considered during the superpixel segmentation, the spatial structures or contents of objects in images are preserved.
Specifically, the feature map F i from the i-th ResBlock is first passed to the CAAB shown in Figure 2 and processed by a convolution block. The red arrow in Figure 2 denotes the content information transmission. Then, the superpixel segmentation is implemented on the output of the convolution block. During superpixel segmentation, we impose the superpixel generation manner [38] in feature space and obtain the desired superpixels with content consistency. Here, the initial results of superpixel segmentation are produced via the patch division means adopted in the vanilla self-attention. In this way, the original feature map is divided into J patches, and the number of superpixels is also set as J. In addition, the average pooling is imposed on all patches to obtain the initialized superpixel centers. Then, based on the original superpixel centers S 0 , we implement the iterative optimization to calculate the association map between pixels and superpixels and estimate the desired superpixels alternatively. For the n-th iteration, the association map M n between pixels and superpixels is computed as follows:
M n = softmax R F i R S n 1 T d ,
where S t 1 denotes superpixel centers at the (n − 1)-th iteration. R · stands for the reshape operation. d represents the number of channels in feature maps. Then, according to the association map M n , the superpixel centers at the n-the iteration are inferred by
S n = M n T R F i ,
where the superpixel centers are reformulated into S n . During the iterative optimization, pixels are aggregated as superpixels according to their contents, and the superpixel centers are adaptively synthesized. Through the iterations between superpixel estimation and association map shown in Figure 2, the final superpixel centers S and the association map M are obtained after N iterations; meanwhile, S is regarded as the tokens to be fed into the multi-head self-attention (MHSA) to learn the global dependencies in images. By employing superpixel segmentation, the content consistency of objects in images is better maintained.
After the MHSA on tokens, the enhanced feature by global information is upsampled to restore the original spatial resolution and combined with the output of the convolution block. Owing to the shape irregularity of superpixels, we upsample the output of the MHSA according to the association map M instead of the bicubic or bilinear interpolation strategy. The token upsampling is written as
U i = R M MHSA S ,
where U i is the output of the token upsampling block and MHSA · corresponds to the MHSA mechanism. The result of the convolution block is added to U i to generate A i , which is then fed into the corresponding SGFB. Meanwhile, A i is further processed by a convolution block made up of two convolution layers and two leaky ReLU (LReLU) functions to produce the output G i of the CAAB. Through the CAAB, the global information is used to enhance the features from ResBlocks, and the damage of content consistencies caused by the hard patch division is also avoided.
To comprehensively model the global relationships in images, we introduce three CAABs into the proposed MGCA-Net as shown in Figure 1. Specifically, the three CAABs are implemented on F 1 , F 2 , and F 3 . Compared to features F 2 and F 3 , F 1 contains more detail and is finely scaled. Because the input F 1 of the first CAAB is fine-grained, the superpixel segmentation on F 1 is also fine-grained and we name the feature learned by CAAB 1 as the fine-granularity one. Meanwhile, the number of superpixels in CAAB 1 is set to 256. Similarly, according to the size of feature maps, F 2 and F 3 correspond to the medium and coarse scales, respectively. Therefore, the corresponding features extracted by the second and third CAABs in Figure 1 are called medium- and coarse–granularity ones, respectively. In CAAB 1 and 2, the number of superpixels are set to 64 and 16, respectively. In addition, the number of iterations in superpixel segmentation is 10. The temperature in Softmax of MHSA is set to 1. Through the formulation in Figure 1, multi-granularity features are generated from the segmented superpixels from different scales.

3.2. Multi-Granularity Semantic Integration Block

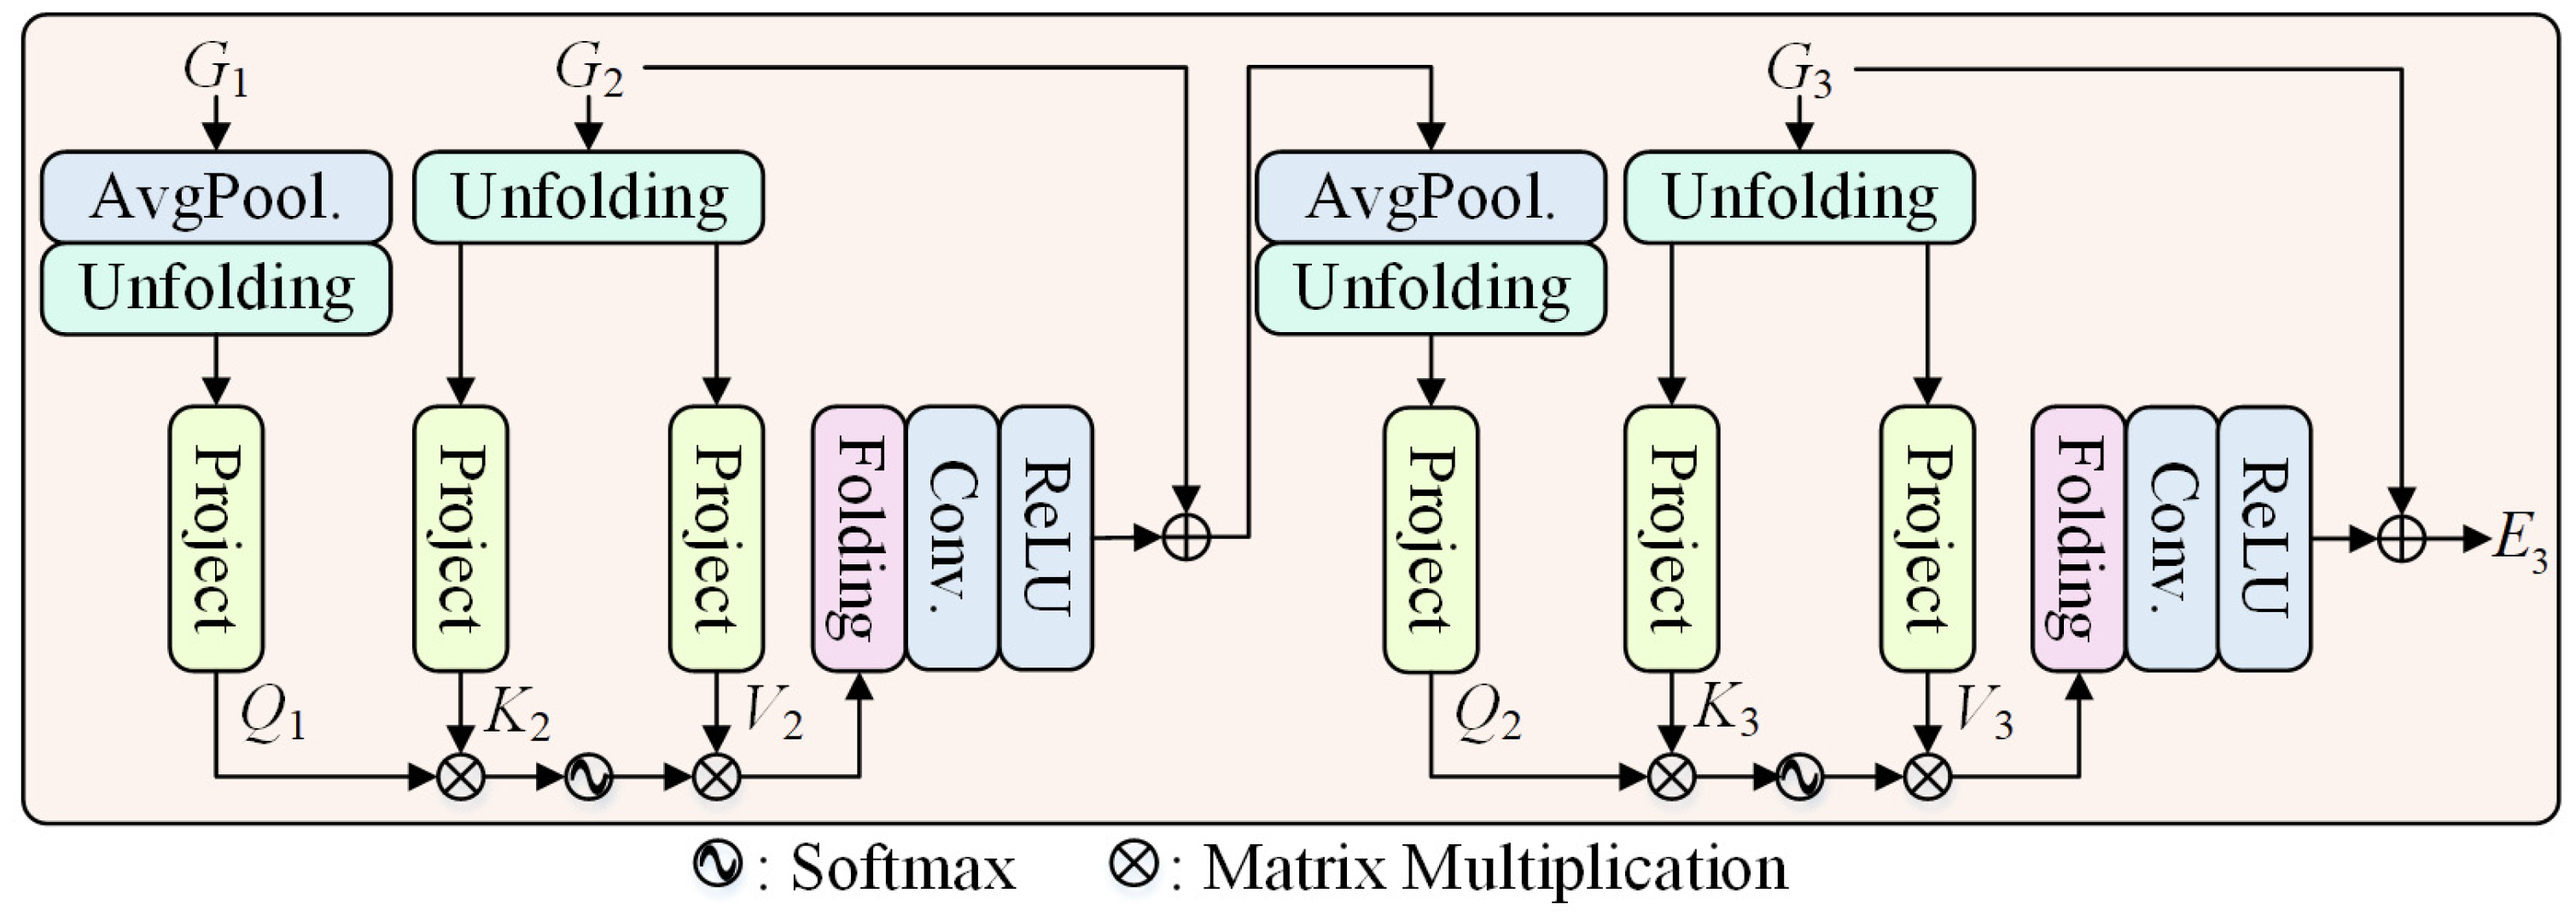
According to the formulation in CAABs, the content consistencies in images at different granularities are captured. However, the semantic information varies owing to the differences among granularities. For example, the features from the fine granularity contain more detail information about anomaly or normal regions, while contours or layout information is involved in the features from the coarse granularity. In order to integrate the semantic information of all granularities, we design the MGSIB as shown in Figure 3, in which the outputs G 1 , G 2 , and G 3 of CAABs are progressively combined together by the cascaded cross-granularity attention mechanisms.
Specifically, G 1 at the fine granularity is downsampled via an average pooling layer to match the size of G 2 . Then, the downsampled version of G 1 is unfolded and projected to obtain the query Q 1 . At the same time, G 2 at the medium granularity is also processed by the corresponding unfolding and projection operators to generate the key K 2 and the value V 2 , respectively. For better integration of semantic information in G 1 and G 2 , Q 1 , K 2 , and V 2 are combined via the cross-granularity attention:
E 1 , 2 = softmax Q 1 K 2 T d V 2 ,
where E 1 , 2 is the output of the cross-granularity attention. Subsequently, the folded result of E 1 , 2 flows into the following convolution layer and ReLU function and is added to G 2 . Through the attention in (4), the semantic information in fine and medium granularities are combined. In a similar manner, we further incorporate the semantic information in G 3 with the integration result of G 1 and G 2 . In this way, the proposed MGSIB efficiently fuses the semantic information at different granularities, whose output is used for the reconstruction of feature maps in the decoder of MGCA-Net.

3.3. Semantic-Guided Fusion Block

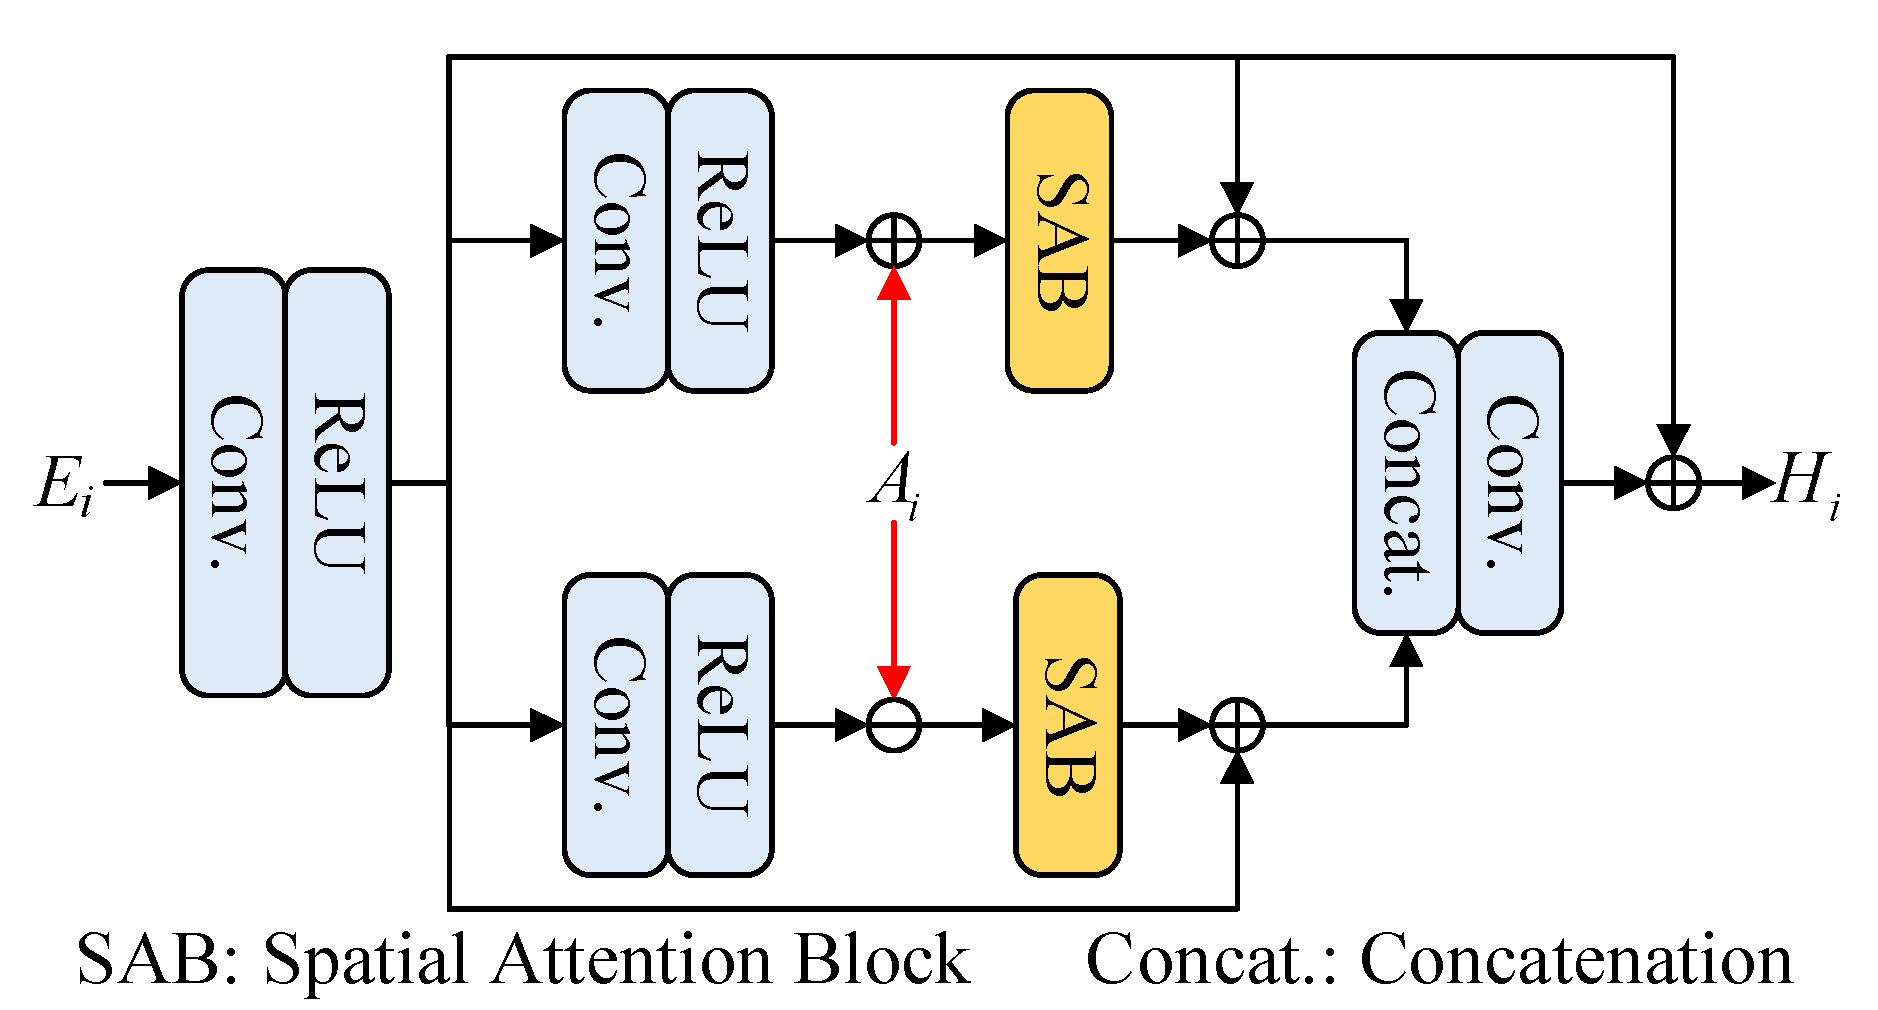
For better feature reconstruction in the decoder of MGCA-Net, the SGFB shown in Figure 4 is designed, in which we introduce the content information in the corresponding CAAB as the guidance for the fusion of different features. Through the guidance of the content information, feature maps are reconstructed more efficiently. Specifically, in Figure 4, the input E i of the i-th SGFB first flows into a convolution block. The red arrow in Figure 4 denotes the content information transmission. Based on the block, two branches, both consisting of convolution and ReLU layers, are equipped to produce their results. Then, the output of the first branch is added to the transmitted content information A i from the i-th CAAB for the semantic enhancement of content consistency. Meanwhile, detailed features are obtained by computing the difference between the output of the second branch and A i . To further highlight the semantic information and texture details in features, we subsequently cast the spatial attention blocks (SABs) [39] on the sums. Finally, the enhanced features are concatenated and projected by a convolution layer to generate the output H i of the i-th SGFB.

3.4. Model Optimization and Inference

As shown in Figure 1, the proposed MGCA-Net predicts the anomaly detection results based on the differences between the outputs of CAABs and SGFBs. Therefore, we train the proposed MGCA-Net by minimizing the reconstruction errors of features. If there are anomaly regions, the reconstruction errors will increase. Then, the anomaly defects are located through the integration of large reconstruction errors.

3.4.1. Model Optimization

As mentioned above, we directly combine the feature differences of all granularities for the optimization of our MGCA-Net. Therefore, the proposed MGCA-Net is optimized with the following loss function L :
L = i = 1 3 G i H i 2 2 .
Through the optimization of this loss function, the proposed MGCA-Net tends to show better reconstruction performance on the normal samples.

3.4.2. Inference

After training, the proposed MGCA-Net is prepared for the prediction on unseen samples. During the testing phase, we also infer the anomaly regions based on the differences between G 1 , G 2 , G 3 and H 1 , H 2 , H 3 . Typically, we first compute the cosine similarity among them. If the reconstruction errors are small, the similarity is relatively high. On the contrary, large reconstruction errors mean the low similarity between G 1 , G 2 , G 3 and H 1 , H 2 , H 3 , which also indicate the possible anomalies. Based on the above, we define the anomaly score P as follows:
P = i = 1 3 U p i 1 p i p i x , y = G i x , y , H i x , y ,
where p i denotes the similarity map at the i-th granularity, which is derived from the inner product between G i and H i . · , · represents the inner product of two vectors. x , y stands for the spatial location of pixels. U p i is an upsampling operator, whose upsampling ratio is set to match the spatial dimensions of images. Through the fusion of similarity maps from all granularities, the anomaly regions can be found efficiently.

4. Experimental Results and Analysis

This section systematically evaluates the proposed MGCA-Net framework. We first detail the experimental settings, compared methods, and evaluation metrics. Then, we analyze the content consistencies in images and demonstrate the effectiveness of the superpixel segmentation for the generation of tokens. In addition, to validate the performance of our proposed MGCA-Net, we perform comparison experiments on MVTec-AD [40] and VisA [41] datasets. In addition, the effectiveness of the CAAB, MGSIB, and SGFB blocks in MGCA-Net is further validated through an ablation study.

4.1. Experimental Setup

4.1.1. Experiment Settings

We perform the following experiments on the MVTec-AD and VisA datasets. The MVTec-AD dataset contains 15 distinct categories. In this dataset, 3629 normal images are prepared for training and validation. In the test data, 1725 images are kept for testing, and both normal and anomaly images are included. For the VisA dataset, there are 12 subsets including 12 objects. Various structures and instances are involved in this dataset, and the numbers of normal and anomaly images are 9621 and 1200, respectively. The proposed MGCA-Net is trained, validated, and tested under the PyTorch v2.3.1. framework on an NVIDIA GeForce RTX 3090 GPU. Considering the computational complexity and efficiency, input images are resized to a fixed spatial resolution of 256 × 256 during the training of our proposed MGCA-Net. The adopted pre-trained ResNet-50 is trained on ImageNet [42]. The model is optimized using stochastic gradient descent, with the initial learning rate set to 0.001. With the increase in the number of epochs, the learning rate is multiplied by 0.1 for every 100 epochs. In addition, the model is trained with a batch size of 4 until the completion of 600 epochs.

4.1.2. Compared Methods

To validate the performance of the proposed MGCA-Net, we select five state-of-the-art methods for comparison, including DRAEM [43], UniAD [44], RD4AD [45], SimpleNet [46], and ViTAD [47]. In DRAEM, the reconstruction and discriminative sub-networks are jointly built to infer the anomaly areas. UniAD formulates the multi-class anomaly detection into a unified model and designs a neighbor masked attention for better feature reconstruction. RD4AD introduces the knowledge distillation mechanism into the detection of anomaly defects. In SimpleNet, the generator and discriminator are equipped to enhance the performance of anomaly localization. ViTAD mainly uses the plain vision transformer for anomaly detection.

4.1.3. Evaluation Metrics

In the following experimental parts, we employ three indexes, including average precision (AP), F1 score, and area under the receiver operating characteristic curve (AUROC), to evaluate the overall performance of all methods [48]. Their calculation is given as follows.
Precision is defined as
Precision = TP TP + FP ,
where TP and FP stand for “True Positive” and “False Positive”, respectively. For evaluation, the predicted anomaly score maps of all methods are binarized according to the threshold inferred from the maximum value of F1 scores in the predicted result. In results, the pixel value of detected abnormal regions are set as 1 and the background regions are composed of pixels with the value of 0. Here, TP represents the number of correctly predicted abnormal pixels in the result, while FP is the number of the pixels that are incorrectly categorized as defects. For AP, it is computed on precision values of all kinds of defects. For AP, larger values also indicate that the detection results are better.
F1 score is calculated as
F 1 = TP TP + 0 . 5 × FP + FN .
For F1, larger values mean better detection performance. FN means “False Negative” and is equal to the number of pixels which are misclassified as the normal region.
For the AUROC, it aims to assess the predictive capability of models by calculating the area under the receiver operating characteristic curve, which is obtained by
AUROC = 0 1 TPR FPR d FPR TPR = TP TP + FN , FPR = FP FP + TN
where TN stands for “True Negative” and means the number of pixels classified as the normal regions correctly. The ideal value of AUROC is 1, and values closer to 1 imply better performance.

4.2. Content Consistencies at Different Granularities

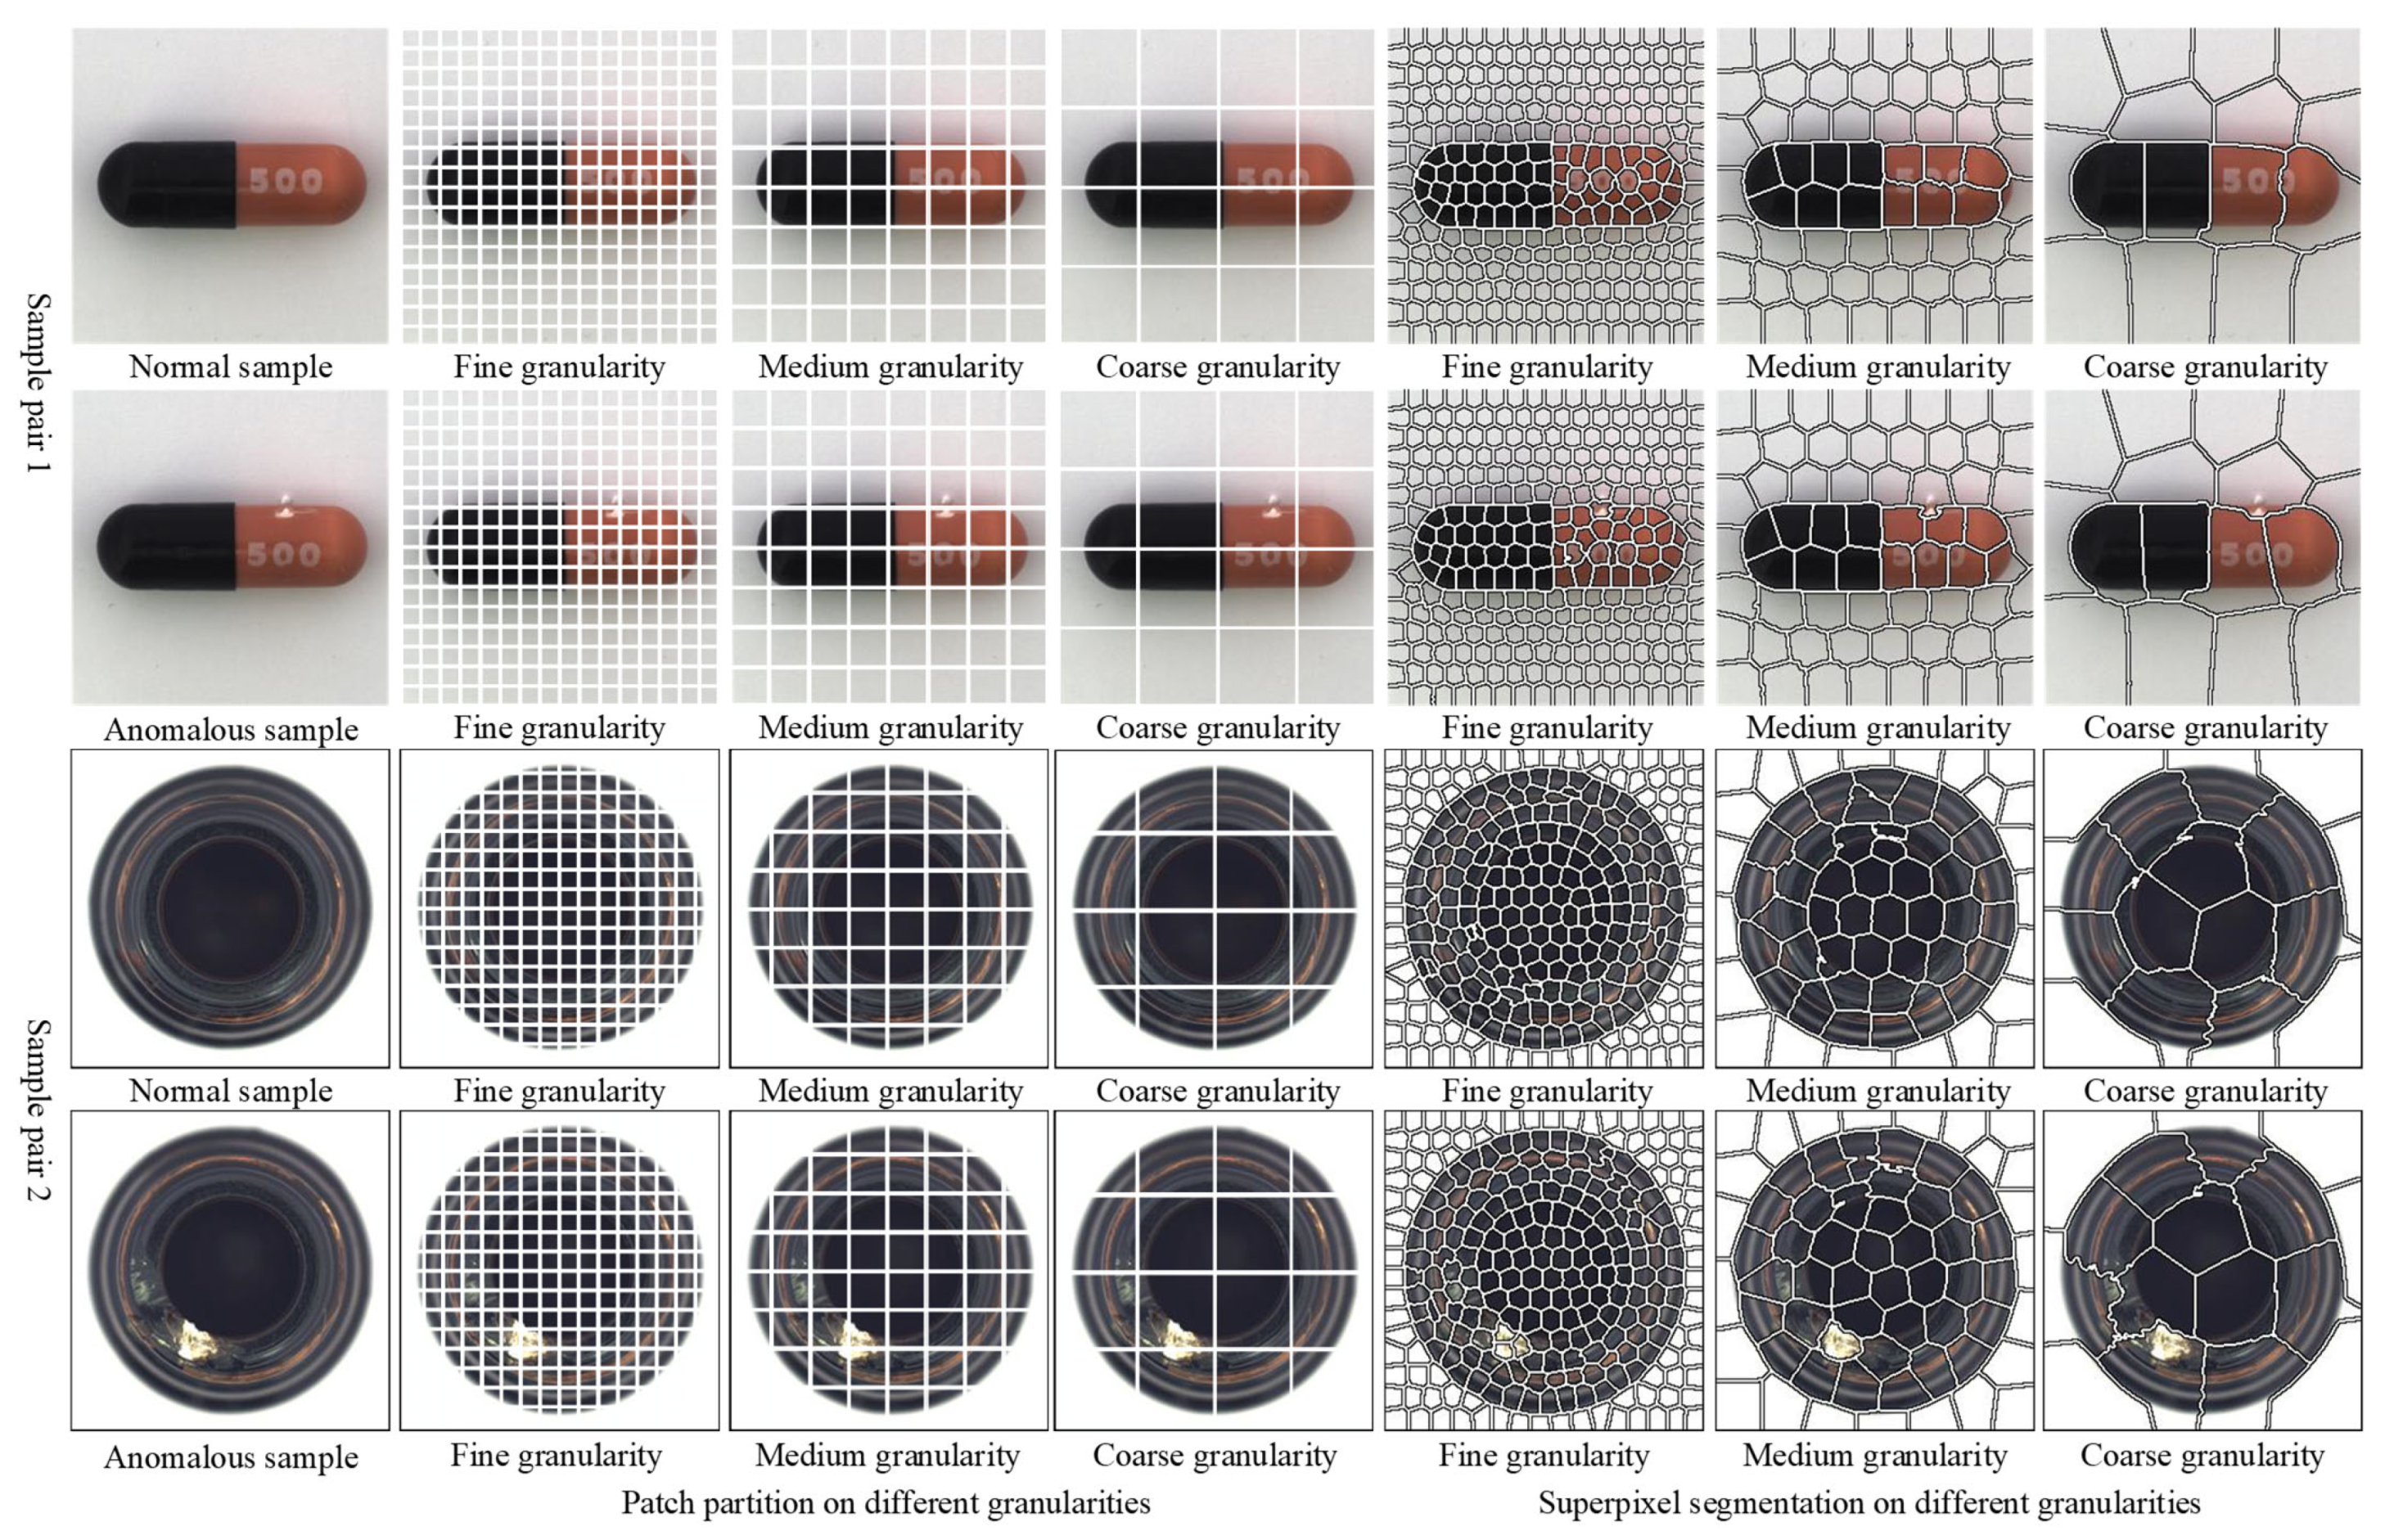
In our proposed MGCA-Net, superpixel segmentation serves as a key mechanism for modeling the content consistency in images. To show the effectiveness of the introduction of superpixel segmentation in CAABs, we choose two image pairs from the MVTec-AD and impose the superpixel maps at different granularities on the original images for better visualization. Meanwhile, we also present the patch partition results of image pairs by the vanilla self-attention mechanism for a direct comparison. All results can be found in Figure 5. In this figure, two image pairs, consisting of normal and anomalous samples, are given. As shown in Figure 5, the first and third rows present normal samples and their counterparts, respectively, while the second and fourth rows display anomalous samples along with the partition results of different strategies.
From the results of the sample pair 1, we can see that the patch partition in the vanilla self-attention directly divides images into patches and cannot preserve the content consistency in images. On the contrary, thanks to the superpixel segmentation technique in CAABs, superpixels are outlined according to their contents, especially in the regions of objects. In addition, despite the varying granularities, one can see that the division of superpixels at different granularities still complies with the spatial contents and structures in images, and the consistencies are efficiently modeled. The hard patch partition cannot be adjusted according to the varying granularities. In addition, it can also be found that the superpixel map at the fine granularity can preserve the integrity of the anomaly defect, which means that the anomaly defect in the anomalous sample is not segmented into different tokens. With the increase in terms of granularity, the anomaly defect can still be segmented into one superpixel, indicating the content consistency. Therefore, the results of the sample pair 1 demonstrate the effectiveness of the introduced superpixel segmentation for the generation of tokens.
The last two rows of Figure 5 show the results of the sample pair 2. Similar to the results of the sample pair 1, we can see that the anomaly defect is completely preserved by the corresponding superpixel at the medium granularity. Although the anomaly defect is divided into three superpixels, the contents in the three superpixels are consistent, and background regions are excluded. Thanks to the advantages, the anomaly regions can be further emphasized by the self-attention mechanism. In addition, in the results of the coarse granularity, the anomaly defect is also not partitioned. However, in the results of the patch partition strategy, the anomaly region is split into different patches, and the content consistency is not preserved.

4.3. Experiments on the MVTec-AD Dataset

In this section, we compare the results of all methods on the MVTec-AD dataset. Table 1 reports the values of AUROC, AP, and F1 of these methods, and the best value of each metric is highlighted in bold. In Table 1, we can see that the proposed MGCA-Net produces the best performance in terms of image-level and pixel-level evaluations. Specifically, for the value of the image-level AUROC, it is improved to 98.7 compared to the AUROC value of ViTAD. Although the best value of the image-level AP is obtained by MGCA-Net and ViTAD, our MGCA-Net provides a better F1 score compared to other state-of-the-art methods. For the pixel-level assessment, it can be seen that an increase in AUROC is achieved by our MGCA-Net. Meanwhile, the obvious improvement can also be found in the values of the pixel-level AP. Similarly, the pixel-level F1 value of MGCA-Net is 59.3 and is also better than other methods. MGCA-Net behaves better because pixels with similar semantic information are aggregated together and form a superpixel, which is then used for the token generation.
Figure 6 shows the results of the compared methods and our proposed MGCA-Net on some samples in the MVTec-AD dataset. To better visualize the detection results, the predicted anomaly score maps of all methods are presented by heat maps. In these results, the redder the color, the more likely it is that the area is an abnormal area. The first row in Figure 6 displays the anomaly result of the capsule sample. In this sample, the flaw is small. From the result, it can be observed that the defect region is located by all methods. But some methods also regard other regions as abnormal defects. For example, the results in SimpleNet and ViTAD suffer from the expansion of abnormal areas. For the result of DRAEM, we can see that the highlighted region matches the location of the defect, but some slight differences also can be found. In the second row of Figure 6, one also can find similar performance. The region located by DRAEM is smaller than the ground truth. In the SimpleNet, larger differences compared with the ground truth also arise. Compared to the results of other methods, the defects is estimated by MGCA-Net better thanks to the capability of subtle granularities.

4.4. Experiments on the VisA Dataset

This part presents quantitative and qualitative results of all methods on the VisA dataset. In Table 2, the best values are marked in bold. From this table, we can find that the overall performance of our MGCA-Net is better because the five best values of metrics are realized by MGCA-Net. Specifically, for the image-level evaluation results, one can see that MGCA-Net shows better values in terms of AUROC and AP compared to the five compared methods. For RD4AD, the best F1 value is obtained. However, the F1 value of MGCA-Net is closer to that of RD4AD, and the gap is very small. At the same time, the results of pixel-level metrics indicate that MGCA-Net provides better values. The detection performance of ViTAD is inferior to that of MGCA-Net, probably because the tokens in ViTAD are synthesized by the patch partition of feature maps. In MGCA-Net, the spatial homogeneity is considered, which avoids the division of anomaly defects. Therefore, the issues caused by the patch partition strategy are alleviated.
Figure 7 presents the results of the compared methods and our proposed MGCA-Net on selected samples from the VisA dataset. In the first row of Figure 7, the flaw is more obvious compared to the other sample in this figure. Owing to the salient hue, the defect is also located by all methods. However, more related regions are also emphasized in the results of UniAD and SimpleNet compared to other methods. For DRAEM, its result is also impacted by similar areas in the test sample. In the results of the second row of Figure 7, the results of UniAD and ViTAD suffer from differences compared to the ground truth because some unrelated regions are also highlighted. In the result of DRAEM, the abnormal regions and the background are large; the reason for this may be the joint learning for abnormal images and their normal reconstruction. Compared to other methods, such as ViTAD and SimpleNet, MGCA-Net utilizes the learning of global dependency and the modeling of irregular regions to find the defect more accurately.

4.5. Ablation Study

To validate the effectiveness of the proposed components, we perform an ablation study by modifying the architecture of MGCA-Net. Specifically, in case 1, we first directly replace the iterative superpixel segmentation in CAABs with the traditional patch partition manner to analyze the influence of the content consistency prior. Then, the progressive integration of semantic information in the MGSIB is also simplified in case 2. In other words, the multi-granularity features from CAABs are downsampled and added together in the simplified version of the MGSIB. In case 3, the guided-fusion strategy in SGFBs is removed. In the alternative counterpart of SGFB, its input and the semantic information from corresponding CAABs are directly concatenated and projected by a convolution layer. In addition, we also ablate the content information transmission in the proposed MGCA-Net in case 4 to verify the impact of the semantic information.
Table 3 lists the numerical values of all metrics in terms of different versions of MGCA-Net. From this table, it can be observed that the removal of superpixel segmentation in CAABs has a larger influence on the quantitative results of MGCA-Net on the MVTec-AD dataset. It may be because the ablation of superpixel segmentation results in inefficiency in terms of the modeling of spatial structures. For the results of case 2, we can observe that the cross-granularity attention plays a positive role when the multi-granularity features are merged. With the help of the semantic information in multi-granularity features, the anomaly regions can be estimated more efficiently. When the semantic-guided fusion strategy is removed, one can find that the numerical results of case 4 also decrease. Thus, it further verifies that the content consistency and semantic information are helpful for the accuracy improvement of the anomaly detection.
The best values are labeled in bold.
Figure 8 displays the visual results of the anomaly sample in the ablation experiments. From Figure 8, it can be seen that the removal of all blocks or configurations has a negative influence on the detection results of anomaly samples. For example, when the iterative superpixel segmentation in CAABs is removed from MGCA-Net, the content-aware attention in Figure 2 degrades to the vanilla self-attention. In return, we find that the results of case 1 in Figure 8 cannot highlight the anomaly regions in cables, especially the black irregular region. It may be because the irregular regions in this sample cannot be depicted by the vanilla self-attention with the patch partition strategy. Therefore, the effectiveness of the iterative superpixel segmentation in Figure 2 is verified by the result of case 1. Similarly, the performance degradation also arises in the result of case 2 due to the ablation of the progressive integration of semantic information. However, its impact is slighter than that caused by the ablation of superpixel segmentation. For the result of case 3, compared to the elaborated guided-fusion strategy in SGFBs, the straightforward concatenation cannot merge the semantic information and reconstruction features efficiently. Thus, the anomaly defects are not filtered out with high confidence. From the result of case 4, one can find that the introduction of semantic information from CAABs boosts the detection precision because the content consistency prior is contained in A1, A2, and A3. Compared to the variants of MGCA-Net, the complete MGCA-Net produces the best anomaly score map, which is also close to the ground truth.
We report the numerical results of different cases of MGCA-Net in Table 4. In this table, larger influences can be found when the superpixel segmentation strategy in CAABs is ablated. With the introduction of this manner, pixels are adaptively partitioned according to their content. In other words, adjacent pixels with consistent content are regarded as one superpixel. Therefore, the ablation results in larger performance degradation in terms of these metrics. In addition, the quantitative performance also decreases when we directly fuse the multi-granularity features by downsampling and addition. Therefore, the progressive semantic integration in MGCA-Net is necessary. Subsequently, one can see that the guided fusion and content information transmission also have a negative impact on the detection results owing to the loss of semantic information at different granularities. Compared to the results of different cases, MGCA-Net shows better numerical values.
Figure 9 displays the visual results of one candle sample in the ablation experiments. In the anomalous sample in Figure 9, one can observe that the defect regions are not obvious due to the close hue and smooth textures. The main defect in this sample is still located by the proposed MGCA-Net and its variants. However, some differences exist in the score maps of different cases. As for the result of case 1, the shape of the high-confidence region is diffused and does not match that of the defect owing to the hard segmentation in the self-attention mechanism. The ablation of the progressive integration in the MGSIB also leads to a decrease in terms of detection accuracy. As for the results in cases 3 and 4, direct concatenation or removal of the semantic information results in worse performance because the content consistency is ignored during feature extraction. For the result of the complete MGCA-Net, the shape of the high-confidence region shows more matched visual effects to the anomaly defect. According to the above ablation experiments, we can see that the designed blocks all have positive influences on the detection performance of MGCA-Net.

4.6. Feature Visualization

To better demonstrate the effectiveness of CAABs in MGCA-Net, we use Grad-CAM [49,50] to visualize the output features of these modules and show them in Figure 10. From Figure 10, one can observe that the abnormal regions can be located properly in the features from different scales thanks to the attention mechanism in CAABs. Therefore, the attention modules can learn meaningful semantic information for anomaly detection.

4.7. Computational Complexity

In this part, we list the model size and computational complexity of all methods in Table 5 for more comprehensive comparison. In Table 5, we can see that the model size and GFLOPs of DRAEM are considerable compared with those of other methods. Meanwhile, it can be observed that the number of parameters in UniAD is the smallest and UniAD also has better performance in terms of computational complexity. For the proposed MGCA-Net, its model size is larger than that of UniAD but smaller than those of the other four methods. As for GFLOPs, UniAD also produces the best value and the computational complexity of MGCA-Net is comparable with that of SimpleNet.

5. Conclusions

This paper proposes MGCA-Net, a novel network designed to overcome the limitation of existing transformer-based methods in modeling content consistency for unsupervised anomaly detection. By embedding superpixel segmentation into the self-attention mechanism, we partition features based on content homogeneity, ensuring the preservation of spatial structures in both normal and anomalous regions. In this way, the designed CAABs can avoid the damage of spatial structures caused by patch-based token generation. Meanwhile, the same superpixel segmentation technique is implemented on fine, medium, and coarse granularities for comprehensive modeling of content consistencies. To fuse cross-granularity features, we build the MGSIB, by which the global semantic information of all granularities is further highlighted. Then, the progressive feature refinement from coarse to fine granularities is achieved by the corresponding SGFBs. Finally, our MGCA-Net effectively identifies anomaly patterns by computing the reconstruction errors between the corresponding features. Experimental results on two anomaly detection benchmarks, MVTec-AD and VisA, show that MGCA-Net outperforms existing approaches, which validates the effectiveness of the modeling of content consistencies. Although MGCA-Net produces good performance, some limitations should not be ignored. For example, the limited detection performance arises when the defects are tiny or the flaws are visually slight compared to the background in images. For future work, we will explore more efficient frameworks to avoid the detail loss caused by downsampling operations. Meanwhile, more refined superpixel granularity and effective superpixel segmentation techniques will also be considered to model the subtle structures in defect regions.

Author Contributions

Conceptualization, X.G. and S.Z. (Shihui Zhao); methodology, X.G. and S.Z. (Shihui Zhao); software, X.G., S.Z. (Shihui Zhao), D.L., and X.H.; validation, X.G., J.X., and S.Z. (Shihui Zhao); formal analysis, X.G., S.Z. (Shuai Zhang), and X.H.; investigation, J.X. and D.L.; writing—original draft preparation, X.G. and S.Z. (Shihui Zhao); writing—review and editing, X.G. and S.Z. (Shihui Zhao); visualization, J.X., S.Z. (Shuai Zhang), and Y.Z. All authors have read and agreed to the published version of the manuscript.

Funding

This research received no external funding.

Institutional Review Board Statement

Not applicable.

Informed Consent Statement

Not applicable.

Data Availability Statement

The original data presented in the study are openly available in [40,41].

Conflicts of Interest

The authors declare no conflicts of interest.

References

  1. Yousif, I.; Burns, L.; El Kalach, F.; Harik, R. Leveraging computer vision towards high-efficiency autonomous industrial facilities. J. Intell. Manuf. 2025, 54, 2983–3008. [Google Scholar] [CrossRef]
  2. Tao, X.; Gong, X.; Zhang, X.; Yan, S.; Adak, C. Deep learning for unsupervised anomaly localization in industrial images: A survey. IEEE Trans. Instrum. Meas. 2022, 71, 5018021. [Google Scholar] [CrossRef]
  3. Xie, G.; Wang, J.; Liu, J.; Lyu, J.; Liu, Y.; Wang, C.; Zhang, F.; Jin, Y. IM-IAD: Industrial image anomaly detection benchmark in manufacturing. IEEE Trans. Cybern. 2025, 54, 2720–2733. [Google Scholar] [CrossRef]
  4. Gong, D.; Liu, L.; Le, V.; Saha, B.; Mansour, M.R.; Venkatesh, S.; Hengel, A.V.D. Memorizing normality to detect anomaly: Memory-augmented deep autoencoder for unsupervised anomaly detection. In Proceedings of the 2019 IEEE/CVF International Conference on Computer Vision (ICCV), Seoul, Republic of Korea, 27 October–2 November 2019; pp. 1705–1714. [Google Scholar]
  5. Schlegl, T.; Seebock, P.; Waldstein, S.M.; Langs, G.; Schmidt-Erfurthb, U. f-AnoGAN: Fast unsupervised anomaly detection with generative adversarial networks. Med. Image Anal. 2019, 54, 30–44. [Google Scholar] [CrossRef]
  6. Yao, H.; Yu, W. Generalizable industrial visual anomaly detection with self-induction vision transformer. arXiv 2022, arXiv:2211.12311. [Google Scholar] [CrossRef]
  7. Lee, Y.; Kang, P. AnoViT: Unsupervised anomaly detection and localization with vision transformer-based encoder-decoder. IEEE Trans. Access 2022, 10, 46717–46724. [Google Scholar] [CrossRef]
  8. Yang, Q.; Guo, R. An unsupervised method for industrial image anomaly detection with vision transformer-based autoencoder. Sensors 2024, 24, 2440. [Google Scholar] [CrossRef]
  9. Yao, H.; Luo, W.; Yu, W.; Zhang, X.; Qiang, Z.; Luo, D.; Shi, H. Dual-attention transformer and discriminative flow for industrial visual anomaly detection. IEEE Trans. Autom. Sci. Eng. 2024, 21, 6126–6140. [Google Scholar] [CrossRef]
  10. Huang, H.; Zhou, X.; Cao, J.; He, R.; Tan, T. Vision transformer with super token sampling. arXiv 2022, arXiv:2211.11167. [Google Scholar]
  11. Meng, Z.; Zhang, T.; Zhao, F.; Chen, G.; Liang, M. Multiscale super token transformer for hyperspectral image classification. IEEE Geosci. Remote Sens. Lett. 2024, 21, 5508105. [Google Scholar] [CrossRef]
  12. He, K.; Zhang, X.; Ren, S.; Sun, J. Deep residual learning for image recognition. In Proceedings of the 2016 IEEE/CVF Conference on Computer Vision and Pattern Recognition (CVPR), Las Vegas, NV, USA, 27–30 June 2016; pp. 770–778. [Google Scholar]
  13. Huang, H.; Wang, P.; Pei, J.; Wang, J.; Alexanian, S.; Niyato, D. Deep learning advancements in anomaly detection: A comprehensive survey. IEEE Internet Things J. 2025, 12, 44318–44342. [Google Scholar] [CrossRef]
  14. Liu, J.; Xie, G.; Wang, J.; Li, S.; Wang, C.; Zheng, F.; Jin, Y. Deep industrial image anomaly detection: A survey. Mach. Intell. Res. 2024, 21, 104–135. [Google Scholar] [CrossRef]
  15. Baitieva, A.; Hurych, D.; Besnier, V.; Bernard, O. Supervised anomaly detection for complex industrial images. In Proceedings of the 2024 IEEE/CVF Conference on Computer Vision and Pattern Recognition (CVPR), Seattle, WA, USA, 16–22 June 2024; pp. 17754–17762. [Google Scholar]
  16. Kawachi, Y.; Koizumi, Y.; Harada, N. Complementary set variational autoencoder for supervised anomaly detection. In Proceedings of the 2018 IEEE International Conference on Acoustics, Speech and Signal Processing (ICASSP), Calgary, AB, Canada, 15–20 April 2018; pp. 2366–2370. [Google Scholar]
  17. Yao, X.; Li, R.; Zhang, J.; Sun, J.; Zhang, C. Explicit boundary guided semi-push-pull contrastive learning for supervised anomaly detection. In Proceedings of the 2023 IEEE/CVF Conference on Computer Vision and Pattern Recognition (CVPR), Vancouver, BC, Canada, 18–22 June 2023; pp. 24490–24499. [Google Scholar]
  18. Yeh, M.-F.; Luo, C.-C.; Liu, Y.-C. Optimization of Gabor convolutional networks using the Taguchi method and their application in wood defect detection. Appl. Sci. 2025, 15, 9557. [Google Scholar] [CrossRef]
  19. Zhou, F.; Wang, G.; Zhang, K.; Liu, S.; Zhong, T. Semi-supervised anomaly detection via neural process. IEEE Trans. Knowl. Data Eng. 2023, 35, 10423–10435. [Google Scholar] [CrossRef]
  20. Liu, J.; Song, K.; Feng, M.; Yan, Y.; Tu, Z.; Zhu, L. Semi-supervised anomaly detection with dual prototypes autoencoder for industrial surface inspection. Opt. Lasers Eng. 2021, 136, 106324. [Google Scholar] [CrossRef]
  21. Wu, P.; Zhou, X.; Pang, G.; Yang, Z.; Yan, Q.; Wang, P.; Zhang, Y. Weakly supervised video anomaly detection and localization with spatio-temporal prompts. In Proceedings of the 32nd ACM International Conference on Multimedia, New York, NY, USA, 20–27 February 2024; pp. 9301–9310. [Google Scholar]
  22. Yang, Z.; Liu, J.; Wu, P. Text prompt with normality guidance for weakly supervised video anomaly detection. In Proceedings of the 2024 IEEE/CVF Conference on Computer Vision and Pattern Recognition (CVPR), Seattle, WA, USA, 16–22 June 2024; pp. 17754–17762. [Google Scholar]
  23. Zhou, Y.; Song, X.; Zhang, Y.; Liu, F.; Zhu, C.; Liu, L. Feature encoding with autoencoders for weakly supervised anomaly detection. IEEE Trans. Neural Netw. Learn. Syst. 2023, 33, 2454–2465. [Google Scholar] [CrossRef]
  24. Bilal, M.; Hanif, M.S. Fast anomaly detection for vision-based industrial inspection using cascades of Null subspace PCA detectors. Sensors 2025, 15, 4853. [Google Scholar] [CrossRef]
  25. Tang, S.; Xu, X.; Li, H.; Zhou, T. Unsupervised detection of surface defects in varistors with reconstructed normal distribution under mask constraints. Appl. Sci. 2025, 15, 10479. [Google Scholar] [CrossRef]
  26. Wang, J.; Huang, W.; Wang, S.; Dai, P.; Li, Q. LRGAN: Visual anomaly detection using GAN with locality-preferred recoding. J. Vis. Commun. Image Represent. 2021, 79, 103201. [Google Scholar] [CrossRef]
  27. Lin, S.C.; Lee, H.W.; Hsieh, Y.S.; Ho, C.Y.; Lai, S.H. Masked attention ConvNeXt Unet with multi-synthesis dynamic weighting for anomaly detection and localization. In Proceedings of the 34th British Machine Vision Conference (BMVC), Aberdeen, UK, 20–24 November 2023; p. 911. [Google Scholar]
  28. Zhou, W.; Zhou, S.; Cao, Y.; Yang, J.; Liu, H. Unsupervised anomaly detection method for electrical equipment based on audio latent representation and parallel attention mechanism. Appl. Sci. 2025, 15, 8474. [Google Scholar] [CrossRef]
  29. He, H.; Zhang, J.; Chen, H.; Chen, X.; Li, Z.; Chen, X.; Xie, L. A diffusion-based framework for multi-class anomaly detection. In Proceedings of the AAAI Conference on Artificial Intelligence (AAAI), Vancouver, BC, Canada, 20–27 February 2024; pp. 8472–8480. [Google Scholar]
  30. Akshay, S.; Narasimhan, N.L.; George, J.; Balasubramanian, V.N. A unified latent schrodinger bridge diffusion model for unsupervised anomaly detection and localization. In Proceedings of the 2025 IEEE/CVF Conference on Computer Vision and Pattern Recognition (CVPR), Nashville, TN, USA, 11–15 June 2025; pp. 25528–25538. [Google Scholar]
  31. Zhang, X.; Li, N.; Li, J.; Dai, T.; Jiang, Y.; Xia, S.T. Unsupervised surface anomaly detection with diffusion probabilistic model. In Proceedings of the 2023 IEEE/CVF Conference on Computer Vision and Pattern Recognition (CVPR), Vancouver, BC, Canada, 18–22 June 2023; pp. 6782–6791. [Google Scholar]
  32. Park, S.; Choi, D. Exploring the potential of anomaly detection through reasoning with large language models. Appl. Sci. 2025, 15, 10384. [Google Scholar] [CrossRef]
  33. He, H.; Bai, Y.; Zhang, J.; He, Q.; Chen, H.; Gan, Z.; Xie, L. MambaAD: Exploring state space models for multi-class unsupervised anomaly detection. In Proceedings of the 38th Advances in Neural Information Processing Systems (NeuriPS), Vancouver, BC, Canada, 16–20 December 2024; pp. 71162–71187. [Google Scholar]
  34. Guo, J.; Lu, S.; Zhang, W.; Chen, F.; Li, H.; Liao, H. Dinomaly: The less is more philosophy in multi-class unsupervised anomaly detection. In Proceedings of the 2025 IEEE/CVF Conference on Computer Vision and Pattern Recognition (CVPR), Nashville, TN, USA, 11–15 June 2025; pp. 20405–20415. [Google Scholar]
  35. Yao, H.; Luo, W.; Lou, J.; Yu, W.; Zhang, X.; Qiang, Z.; Shi, H. Scalable industrial visual anomaly detection with partial semantics aggregation vision transformer. IEEE Trans. Instrum. Meas. 2023, 73, 5004217. [Google Scholar] [CrossRef]
  36. Park, S.; Kim, J.; Kim, J.; Wang, S. Fault Diagnosis of air handling units in an auditorium using real operational labeled data across different operation modes. J. Comput. Civ. Eng. 2025, 39, 04025065. [Google Scholar] [CrossRef]
  37. Wang, S. A hybrid SMOTE and Trans-CWGAN for data imbalance in real operational AHU AFDD: A case study of an auditorium building. Energy Build. 2025, 348, 116447. [Google Scholar] [CrossRef]
  38. Jampani, V.; Sun, D.; Liu, M.Y.; Yang, M.H.; Kautz, J. Superpixel sampling networks. In Proceedings of the 2018 European Conference on Computer Vision (ECCV), Munich, Germany, 8–14 September 2018; pp. 1–17. [Google Scholar]
  39. Woo, S.; Park, J.; Lee, J.; Kweon, I. CBAM: Convolutional Block Attention Module. In Proceedings of the 2018 European Conference on Computer Vision (ECCV), Munich, Germany, 8–14 September 2018; pp. 1–17. [Google Scholar]
  40. Bergmann, P.; Fauser, M.; Sattlegger, D.; Steger, C. MVTec AD—A comprehensive real-world dataset for unsupervised anomaly detection. In Proceedings of the 2019 IEEE/CVF Conference on Computer Vision and Pattern Recognition (CVPR), Long Beach, CA, USA, 15–20 June 2019; pp. 9584–9592. [Google Scholar]
  41. Zou, Y.; Jeong, J.; Pemula, L.; Zhang, D.; Dabeer, O. Spot-the-difference self-supervised pre-training for anomaly detection and segmentation. In Proceedings of the 2022 European Conference on Computer Vision (ECCV), Tel Aviv, Israel, 23–27 October 2022; pp. 1–17. [Google Scholar]
  42. Deng, J.; Dong, W.; Socher, R.; Li, L.J.; Li, K.; Li, F. ImageNet: A large-scale hierarchical image database. In Proceedings of the 2009 IEEE/CVF Conference on Computer Vision and Pattern Recognition (CVPR), Miami, FL, USA, 20–25 June 2009; pp. 248–255. [Google Scholar]
  43. Zavrtanik, V.; Kristan, M.; Skocaj, D. DRAEM-A discriminatively trained reconstruction embedding for surface anomaly detection. In Proceedings of the 2021 IEEE/CVF International Conference on Computer Vision (ICCV), Virtual, 11–17 October 2021; pp. 8330–8339. [Google Scholar]
  44. You, Z.; Cui, L.; Shen, Y.; Yang, K.; Lu, X.; Zheng, Y.; Le, X. A unified model for multi-class anomaly detection. In Proceedings of the 36th Advances in Neural Information Processing Systems (NeuriPS), New Orleans, LA, USA, 28 November–9 December 2022; pp. 4571–4584. [Google Scholar]
  45. Deng, H.; Li, X. Anomaly detection via reverse distillation from one-class embedding. In Proceedings of the 2022 IEEE/CVF Conference on Computer Vision and Pattern Recognition (CVPR), New Orleans, LA, USA, 19–24 June 2022; pp. 9737–9746. [Google Scholar]
  46. Liu, Z.; Zhou, Y.; Xu, Y.; Wang, Z. SimpleNet: A Simple Network for Image Anomaly Detection and Localization. In Proceedings of the 2023 IEEE/CVF Conference on Computer Vision and Pattern Recognition (CVPR), Vancouver, BC, Canada, 18–22 June 2023; pp. 20402–20411. [Google Scholar]
  47. Zhang, J.; Chen, X.; Wang, Y.; Wang, C.; Liu, Y.; Li, X.; Yang, M.H.; Tao, D. Exploring plain ViT features for multi-class unsupervised visual anomaly detection. Comput. Vis. Image Underst. 2025, 253, 104308. [Google Scholar] [CrossRef]
  48. Li, Z.; Yan, Y.; Wang, X.; Ge, Y.; Meng, L. A survey of deep learning for industrial visual anomaly detection. IEEE Trans. Instrum. Meas. 2025, 58, 279. [Google Scholar] [CrossRef]
  49. Selvaraju, R.R.; Cogswell, M.; Das, A.; Vedantam, R.; Parikh, D.; Batra, D. Grad-cam: Visual explanations from deep networks via gradient-based localization. In Proceedings of the 2017 IEEE/CVF International Conference on Computer Vision (ICCV), Venice, Italy, 22–29 October 2017; pp. 618–626. [Google Scholar]
  50. Liu, Y.; Zhang, K.; Guan, C.; Zhang, S.; Li, H.; Wan, W.; Sun, J. Building change detection in earthquake: A multi-scale interaction network with offset calibration and a dataset. IEEE Trans. Geosci. Remote Sens. 2024, 62, 5635217. [Google Scholar] [CrossRef]
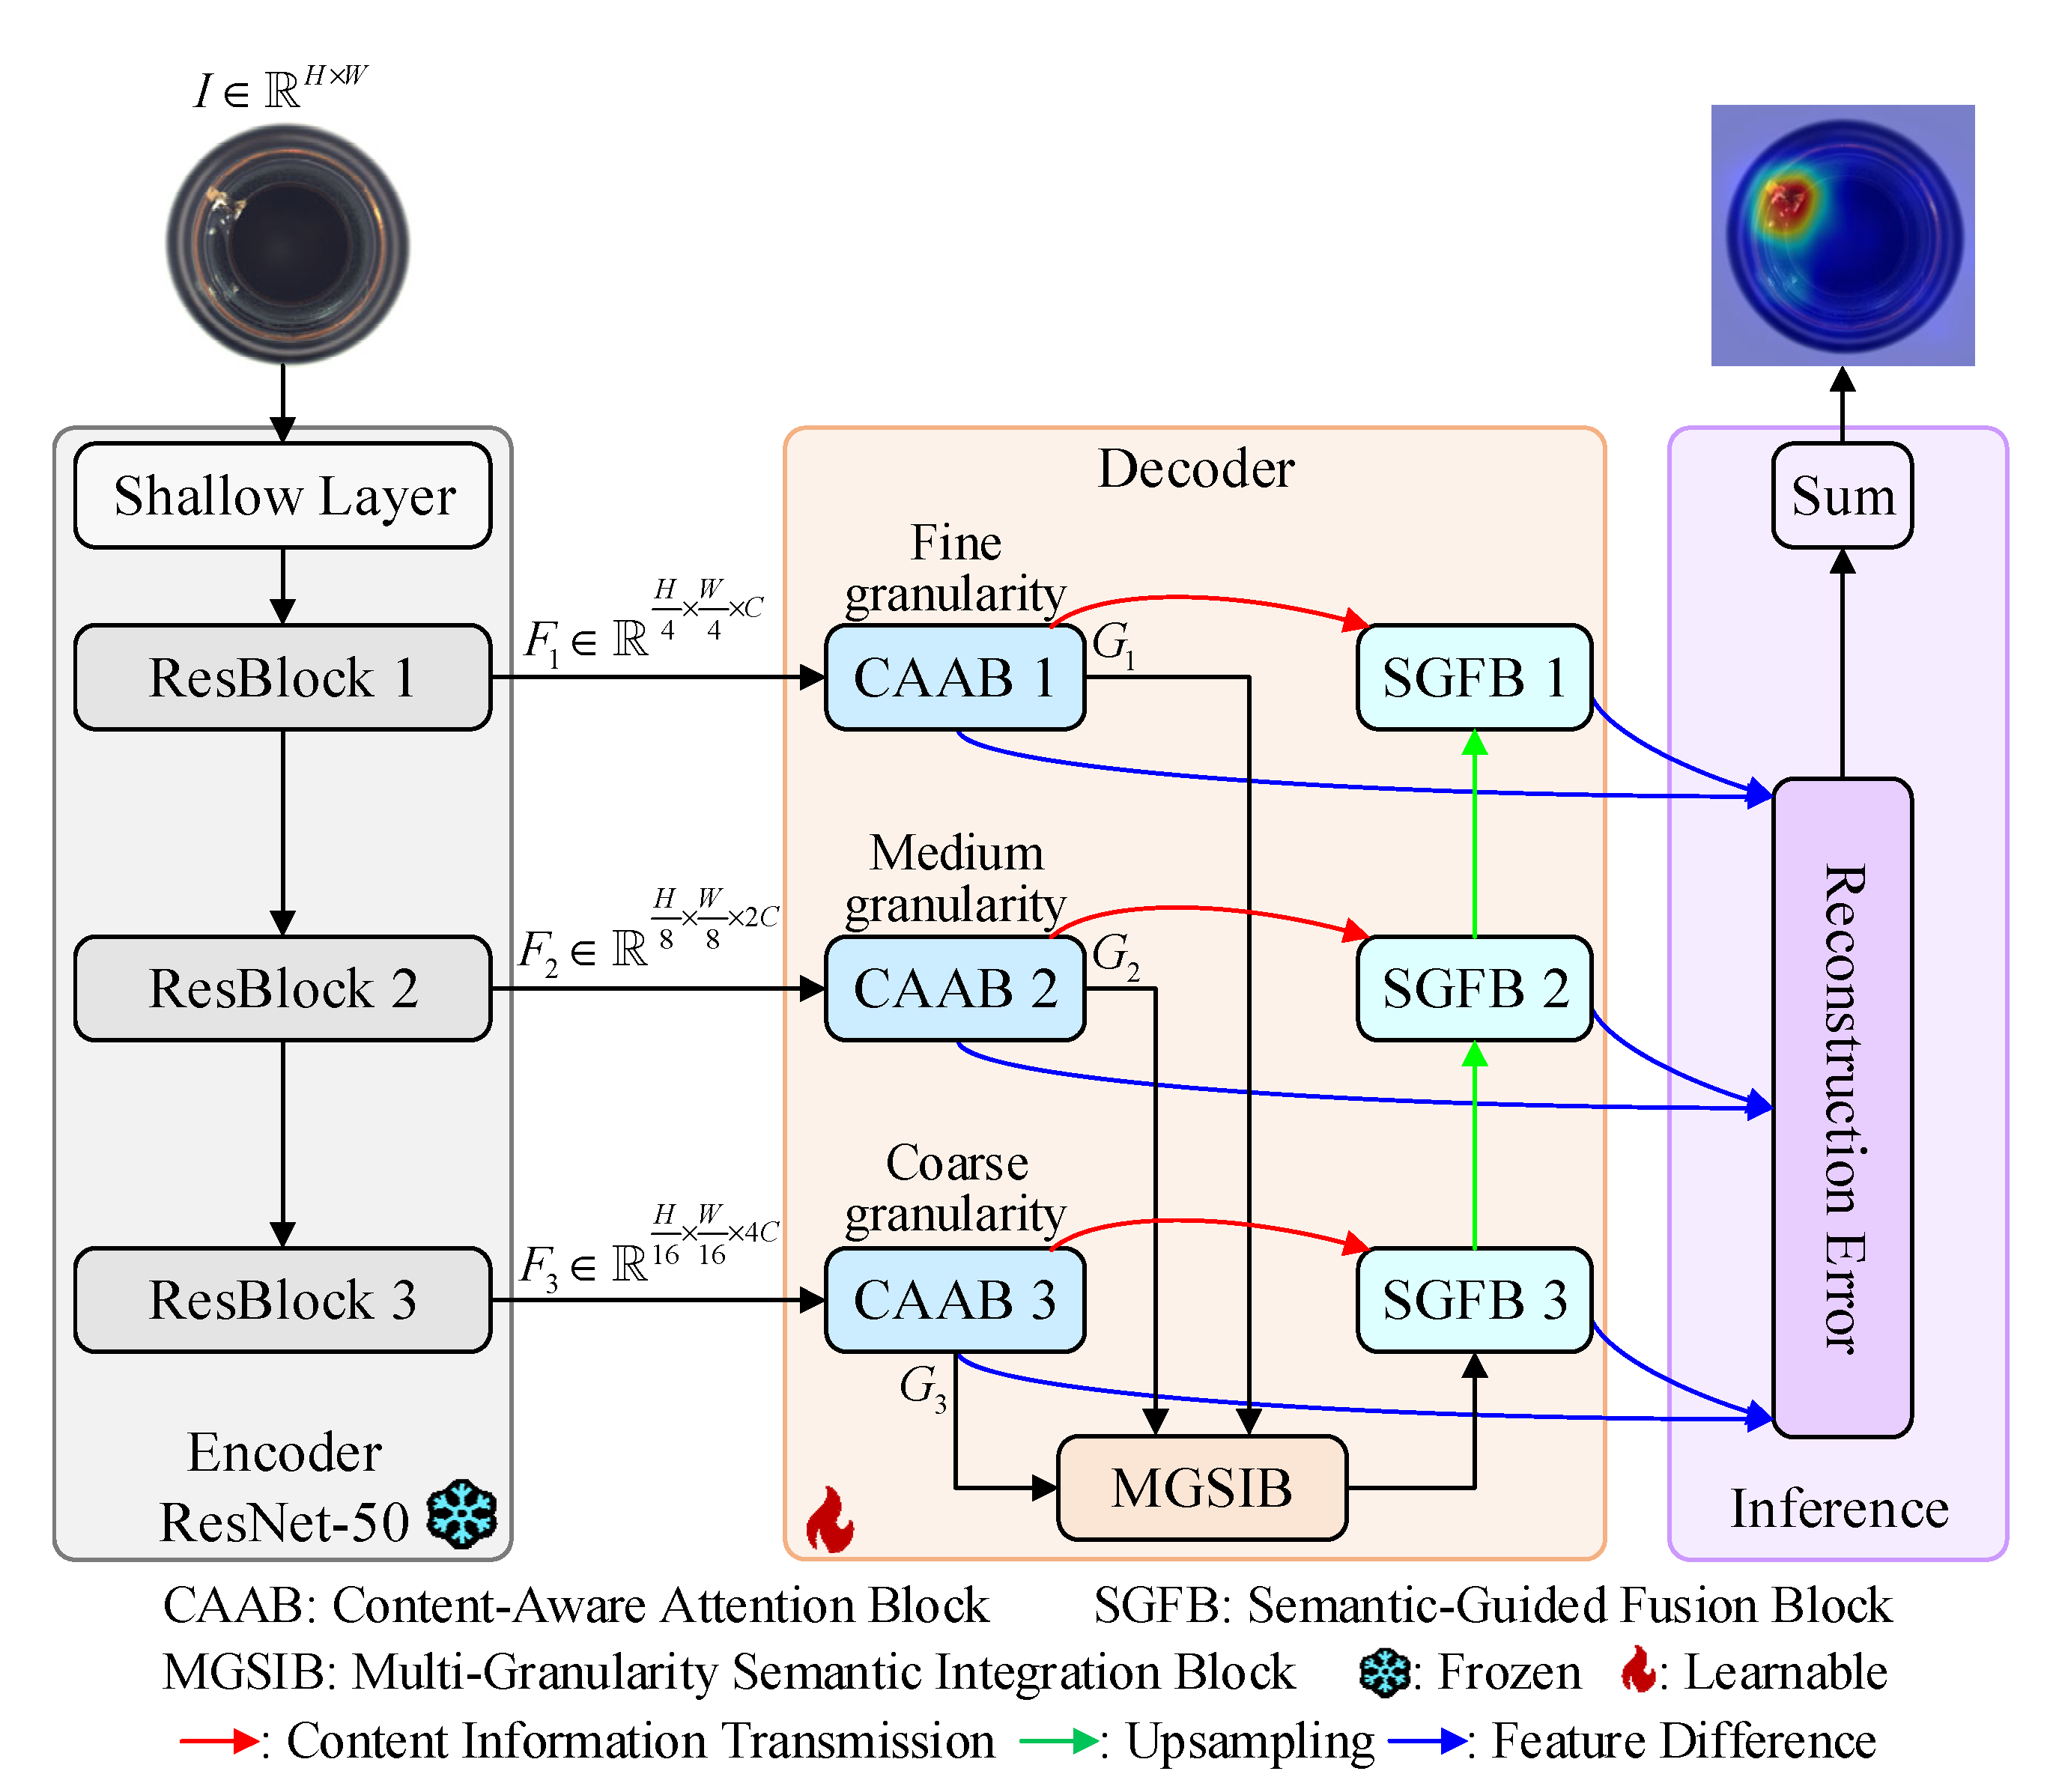
Figure 1. Overall architecture of the proposed MGCA-Net.
Applsci 15 11842 g001
Figure 2. The details of CAAB.
Applsci 15 11842 g002
Figure 3. The details of MGSIB.
Applsci 15 11842 g003
Figure 4. The details of SGFB.
Applsci 15 11842 g004
Figure 5. Comparisons between patch partition and superpixel segmentation at different granularities.
Applsci 15 11842 g005
Figure 6. Visualization of the results of all methods on some samples in the MVTec-AD dataset.
Applsci 15 11842 g006
Figure 7. Visualization of the results of all methods on some samples in the VisA dataset.
Applsci 15 11842 g007
Figure 8. Visualization of the ablation results of MGCA-Net on some samples in the MVTec-AD dataset.
Applsci 15 11842 g008
Figure 9. Visualization of the ablation results of MGCA-Net on some samples in the VisA dataset.
Applsci 15 11842 g009
Figure 10. Visualization of features in CAABs.
Applsci 15 11842 g010
Table 1. Numerical results of all methods on the MVTec-AD dataset.
MetricsDRAEM [43]UniAD [44]RD4AD [45]SimpleNet [46]ViTAD [47]MGCA-Net
Image-
level
AUROC88.196.594.695.398.398.7
AP94.798.896.598.499.499.4
F192.096.295.295.897.397.7
Pixel-
level
AUROC88.696.896.196.997.798.1
AP52.643.448.645.955.356.1
F148.649.553.849.758.759.3
Table 2. Numerical results of all methods on the VisA dataset.
MetricsDRAEM [43]UniAD [44]RD4AD [45]SimpleNet [46]ViTAD [47]MGCA-Net
Image-
level
AUROC79.588.892.487.290.591.4
AP82.890.892.487.091.792.3
F179.485.889.681.886.388.9
Pixel-
level
AUROC91.498.398.196.898.298.9
AP24.833.738.034.736.638.6
F130.439.042.637.841.143.1
Table 3. Ablation results of different blocks in MGCA-Net on the MVTec-AD dataset.
MetricsCase 1Case 2Case 3Case 4MGCA-Net
Image-
level
AUROC97.798.598.298.298.7
AP98.698.999.099.399.4
F196.897.396.997.197.7
Pixel-
level
AUROC97.297.897.798.098.1
AP55.455.656.155.856.1
F158.458.358.159.259.3
Table 4. Ablation results of different blocks in MGCA-Net on the VisA dataset.
MetricsCase 1Case 2Case 3Case 4MGCA-Net
Image-
level
AUROC89.890.290.791.191.4
AP90.690.791.291.792.3
F186.488.087.387.988.9
Pixel-
level
AUROC96.396.796.897.398.9
AP37.637.937.538.138.6
F141.842.341.642.143.1
The best values are labeled in bold.
Table 5. Computational complexity analysis of all methods.
DRAEM [43]UniAD [44]RD4AD [45]SimpleNet [46]ViTAD [47]MGCA-Net
Model size97.4 M24.5 M80.6 M72.8 M38.6 M26.3 M
GFLOPs198.03.628.416.110.717.3
Disclaimer/Publisher’s Note: The statements, opinions and data contained in all publications are solely those of the individual author(s) and contributor(s) and not of MDPI and/or the editor(s). MDPI and/or the editor(s) disclaim responsibility for any injury to people or property resulting from any ideas, methods, instructions or products referred to in the content.