Article

Cuff-Less Estimation of Blood Pressure and Detection of Hypertension/Arteriosclerosis from Fingertip PPG Using Machine Learning: An Experimental Study

by
Marco Antonio Arroyo-Ramírez
1,
Isaac Machorro-Cano
2,
Augusto Javier Reyes-Delgado
1,
Jorge Ernesto González-Díaz
1 and
José Luis Sánchez-Cervantes
1,*
1
Tecnológico Nacional de México/I. T. Orizaba, Oriente 9, Orizaba C.P. 94320, Veracruz, Mexico
2
Universidad del Papaloapan, Circuito Central # 200, ColoniaParque Industrial, San Juan Bautista Tuxtepec C.P. 68301, Oaxaca, Mexico
*
Author to whom correspondence should be addressed.
Appl. Sci. 2025, 15(21), 11829; https://doi.org/10.3390/app152111829
Submission received: 12 September 2025 / Revised: 22 October 2025 / Accepted: 4 November 2025 / Published: 6 November 2025
(This article belongs to the Special Issue Data Science for Human Health Monitoring with Smart Sensors)

Featured Application

This study describes the application of photoplethysmographic signals and machine learning algorithms to identify the risk of hypertension and its correlation with arteriosclerosis.

Abstract

Worldwide less than half of adults with hypertension are diagnosed and treated (only 42%), in addition one in five adults with hypertension (21%) has the condition under control. In the American continent, cardiovascular diseases (CVD) are the leading cause of death and high blood pressure (hypertension) is responsible for 50% of CVD deaths. Only a few countries show a population hypertension control rate of more than 50%. In this experimental study, we trained 15 regression-type machine learning algorithms, including traditional and ensemble methods to assess their effectiveness in estimating arterial pressure using noninvasive photoplethysmographic (PPG) signals extracted from 110 study subjects, to identify the risk of hypertension and its correlation with arteriosclerosis. We analyzed the performance of each algorithm using the metrics MSE, MAE, RMSE, and r2. A 10-fold cross-validation showed that the best algorithms for hypertension risk identification were LR, KNN, SVR, RF, LR Baggin, KNNBagging, SVRBagging, and DTBagging. On the other hand, the best algorithms for arterioclesrosis risk identification were LR, KNN, SVR, RF, LR Bagging, and DTBagging. These results suggest that this research is promising and offers valuable information on the acquisition and processing of PPG signals. However, as this is an experimental study, the effectiveness of our model needs to be validated with a larger database. On the other hand, this model represents a support tool for healthcare specialists in the early detection of cardiovascular health, allowing people to self-manage their health and seek medical attention at an early stage.

1. Introduction

According to the World Health Organization (WHO), cardiovascular diseases (CVD’s), such as coronary artery disease, heart failure, high blood pressure, and cerebrovascular disease, to mention but a few [1,2], are the main cause of death in the American continent. We speak of hypertension when the blood pressure in our blood vessels is too high (140/90 mmHg or more); this means that the systole (high pressure) is at the maximum peak of blood pressure or 140 mmHg and that the diastole (low pressure) is at the minimum peak of a blood pressure or 90 mmHg. High blood pressure is a common problem that can be serious if left untreated, and which is responsible for 50% of deaths due to cardiovascular disease in the American continent. Unfortunately, in the American continent, more than a quarter of adult women and four out of ten adult men have hypertension, and diagnosis, treatment, and control are suboptimal [3]. In fact, only a few countries show a population hypertension control rate of more than 50%. It is estimated that there are 1280 million adults aged 30–79 years with hypertension worldwide and that most of them (about two-thirds) live in low- and middle-income countries. According to estimates, 46% of hypertensive adults are unaware that they have the condition. Hypertension is diagnosed and treated in less than half of adults with hypertension (only 42% worldwide). Only one in five adults with hypertension (21% worldwide) has the condition under control. One of the global targets for non-communicable diseases is to reduce the prevalence of hypertension by 25% by 2030, compared to 2010 baseline values. Sometimes it causes no symptoms, and the only way to detect it is to take your blood pressure. Among other complications, hypertension can cause serious heart damage [3,4]. Excess pressure can harden the arteries (arteriosclerosis), reducing the flow of blood and oxygen to the heart. Hypertension can also cause blockage or rupture of the arteries that carry blood and oxygen to the brain, leading to a stroke. It can also cause kidney damage, leading to kidney failure [5].
Blood pressure (BP) is one of the four vital signs that provide valuable medical information about cardiovascular activity. PPG is a non-invasive optical method for measuring changes in blood volume per pulse. In other words, the PPG waveform represents the mechanical activity of the heart [6]. Applications based on artificial intelligence have found widespread use in many fields of science, technology, and medicine. In cardiovascular medicine, AI-based systems have found new applications in the diagnosis and prediction of cardiovascular risk [7].
Hence, our proposal consists of the early identification of hypertension risk factors and their correlation with arteriosclerosis [8] through the photoplethysmography signals analysis using machine learning algorithms to support people in maintaining the good health of the arterial system due to it is of vital importance for the transport of blood flow to the different parts of the human body and its proper functioning [9].
In addition, we believe it is important for people to monitor their own cardiovascular health to avoid white coat syndrome. In this phenomenon, a person’s blood pressure rises when it is measured by a healthcare professional in a clinical setting. In contrast, it remains within normal levels in other settings (such as at home). For this reason, it is important to determine whether machine learning models can estimate blood pressure from photoplethysmographic signals with acceptable accuracy, enabling early identification of abnormalities and helping people seek specialized medical care.
The main scientific contributions of our research are as follows:
(1)
The use of photoplethysmographic signals and machine learning algorithms to identify risk factors for hypertension and their correlation with arteriosclerosis.
(2)
The development of a tool to support physicians in making decisions related to the diagnosis of cardiovascular diseases.
(3)
This tool contributes to self-management of health in patients suffering from cardiovascular diseases.
The remainder of this article is organized as follows: Section 2 presents related work that discusses current research on technologies for blood pressure monitoring; Section 3 describes the Materials and Methods; Section 4 presents describe the results and discussions. Finally, in Section 5 we present the conclusion and the future work of our research.

2. Related Works

This section presents related works divided into two parts. The first part shows work that uses regression algorithms, and the second part shows works that use classification algorithms.

2.1. Regression

An accurate, continuous, cuff-free blood pressure measurement system that used a MAX30102 photoplethysmography (PPG) sensor and an ESP-WROOM-32 microcontroller to capture PPG signals was developed by [10]. The model used a dataset of six subjects with a total of 114 records, achieving a coefficient of determination of 0.37 for systole and 0.46 for diastole and a mean absolute error value of 4.38 for systole and 4.49 for diastole by using the Random Forest algorithm. In developing this system, they chose a regression approach because the output variable represents blood pressure, which is a continuous real value. In addition, a machine learning approach to estimate blood pressure by photoplethysmography (PPG) noninvasively was presented by [11]. They found the XGBoost models to be more accurate than the Neural Network models, obtaining a root mean square error (RMSE) for systolic pressure and diastolic pressure, respectively, of 5.67 mmHg and 3.95 mmHg. Additionally, the use of PPG signals as a cuff-free, noninvasive, continuous blood pressure measurement system using four neural networks, was investigated by [12]. The trained CNNs predicted systolic blood pressure by 5.26 ± 6.53 mmHg (mean error ± standard deviation), diastolic blood pressure by 2.96 ± 3.31 mmHg and mean arterial pressure by 3.27 ± 3.55 mmHg. The model results suggest that the application of PPG provides clinically feasible measurements from the point of view of accuracy.
Likewise, an absolute blood pressure estimation with a machine learning method was provided by [13]. The authors reported that the estimation of absolute systolic blood pressure yielded a mean absolute error of 9.456 mmHg and a correlation coefficient of 0.730. These results were significantly improved by modifying the separation of the data, obtaining a mean absolute error of 6.366 mmHg and a correlation coefficient of 0.874. On the other hand, several features were utilized based on PPG signal morphology from biosignals to determine valid markers of blood pressure. In addition, they used these features with pulse arrival time (PAT), which were analyzed by [14]. They reported that they used 42 features of the PPG signal to train the models: Linear Regression, Random Forest, Artificial Neural Networks, and Recurrent Neural Networks, which obtained a root mean square error of 6.92 mmHg for systolic pressure and a root mean square error of 3.99 mmHg for diastolic pressure. Also, the challenge of continuous blood pressure estimation without pneumatic cuff from the PPG signal was investigated by [15]. They reported that the results obtained showed an average absolute error of 4.59 mmHg for systolic pressure and an average absolute error of 2.47 mmHg for diastolic pressure. They noted that their proposed method is promising for practical application and provides a convenient way to estimate continuous blood pressure without a pneumatic cuff with comparable accuracy.

2.2. Classification

A hypertension diagnostic tool called the ANC Test, using photoplethysmographic (PPG) signals, was developed by [16]. During the development and testing phases, the accuracy of the different machine learning models for detecting systolic hypertension was in many cases around 70%, with a maximum value of 72.9%. The ANC Test can be implemented on wearable devices such as smartwatches and smart bands to detect the hypertension stage. Likewise, a method of continuous blood pressure measurement without a pneumatic cuff was presented by [17]. They reported using a backpropagation neural network as a modeling tool responsible for extracting the features of ECG and PPG signals. They then applied a multitype information fusion method for accurate blood pressure estimation. They reported that their proposed model obtained a root mean square error of 1.5 mmHg for systolic pressure and a root mean square error of 0.9 mmHg for diastolic pressure. Additionally, an automated machine learning model using a tree-inspired pipeline optimization tool from PPG signals for blood pressure estimation was built by [18]. They reported that they used the algorithms Random Forest, and k-nearest neighbors for this study to automate the extraction of features from the PPG signal. They reported that their proposed model obtained an average absolute error of 6.52 mmHg for systolic pressure and an average absolute error of 4.19 mmHg to diastolic pressure. On the other hand, the prediction error of blood pressure based on photoplethysmography (PPG), was analyzed by [19]. They reported using four different neural network architectures: AlexNet, ResNet, a spectro-temporal network, and a bidirectional short-term memory network (BiLSTM). They reported that the ResNet network obtained the best performance with an average absolute error of 12.7 mmHg for systolic pressure and an average absolute error of 10.8 mmHg for diastolic pressure. Also, using the PPG signal and its first and second derivatives to predict the blood pressure level using a deep learning method was proposed by [20]. They reported that the AlexNet network achieved the best performance with an accuracy of 98.90%. They noted that AlexNet, with only eight layers, performed better than the other networks with more layers.
According to the related works summarized, we can observe that in the case of the works that used classification algorithms, authors [11,12,14,17,19,20] used prediction models with Neural Networks, which implies that these models are more robust, require more parameters, and also require more computational power. Training takes more time, and since they are classification models, such training requires large databases. On the other hand, authors [16,18] used classical and ensemble-type algorithms, but as mentioned above, training takes longer and requires large databases since they are classification models. Our research uses regression algorithms that, according to the literature, are more suitable for solving continuous value problems such as blood pressure prediction. In addition, few data are used; therefore, the training of the models takes less time and does not require significant computational power. In the case of the works that used regression algorithms, the authors [10,13,15] used classical and ensemble algorithms whose performance was evaluated with the MAE metric, which does not penalize the deviation of the errors and, therefore, its results are unreliable.
Finally, in difference to the related works analyzed, in our research we used prediction models with classical regression algorithms and assembled using few data; consequently, the training of the models was performed in less time and does not require significant computational power. In addition, taking into account the importance of data reliability, we used a commercial PPG signal acquisition card certified by the FDA another difference unlike the previously analyzed works, where self-designed devices were used which are not licensed and, consequently, there is no guarantee that they work correctly because these devices do not have certification from a regulatory medical institution. On the other hand, it should be noted that it is not feasible to compare the results of our study with related studies, since most studies that estimate blood pressure use classification algorithms or combinations of regression algorithms with, for example, neural networks. However, it is important to note that in our study, we only used regression algorithms because blood pressure values are continuous values and regression algorithms are the most suitable for this type of problem [10].

3. Materials and Methods

This section describes the acquisition of PPG signals [21], the analysis of the performance of traditional and assembled algorithms used for blood pressure estimation, the identification of hypertension risk, and the identification of arteriosclerosis risk.
Fifteen machine learning algorithms categorized into classical and ensembled were used, which are specified as follows. (a) Traditional Machine Learning Algorithms [22]: (1) Linear Regression; (2) KNN (uniform weight); (3) KNN (distance weight); (4) SVR (Gaussian kernel); (5) SVR (polynomial); and (6) Decision Tree. (b) Boosting type ensembled methods: (7) Adaboost; and (8) GradientBoosting; (9) Random Forest, (c) Bagging type assemblies [23,24]: (10) Linear Regression—bagging; (11) SVR—bagging (Gaussian kernel); (12) SVR—bagging (polynomial kernel); (13) KNN—bagging (uniform weight); (14) KNN—bagging (distance weight); and (15) Decision Tree—Bagging. Finally, all results were accurately documented for further analysis.

Methodology

The methodology used for the processing and analysis of PPG signals is based on four stages. Stages 1 and 2 involve signal acquisition, stage 3 corresponds to signal processing and feature extraction, stage 4 corresponds to the blood pressure estimation module; within stage 4, there are two sub-stages: (1) 4.1 corresponds to the identification of the risk of hypertension, and (2) 4.2 corresponds to the identification of the risk of arteriosclerosis, as depicted in Figure 1.
Stages 1 and 2 collect PPG signals through the fingertips using a photoplethysmography sensor module mounted on the Max86150 cardiac signal acquisition card [25], whose data are saved in a CSV file for further processing. Stage 3, features the data stored in the CSV file, which is processed and filtered to display the graph of the PPG signal. Subsequently, the extraction of signal features in the time domain, frequency domain, and statistical features is carried out (see table “Morphological Features of the PPG Signal” in the Appendix A), including the calculation of the first and second derivatives of the PPG signal, which has already been filtered to extract its features in the time and frequency domains. In stage 4, the features extracted from the time domain, frequency, and statistical features of the already filtered PPG signal are used to estimate blood pressure. Finally, in the sub-stage 4.1, the features extracted from stage 4 are used, in addition to the features extracted from the derivatives of the already filtered PPG signal, to identify the risk of hypertension, and 2) in the sub-stage 4.2, the features extracted from stage 4 and sub-stage 4.1 are used to determine the risk of arteriosclerosis.
The PPG signals were obtained through a cardiac signal acquisition card Max86150 from Analog Devices, as shown in Figure 1. This card can acquire electrocardiographic (ECG) signals through dry electrodes and PPG signals using an optical sensor module with two types of LEDs, one red and the other infrared. These signals can be acquired simultaneously or separately, and the card is certified by the FDA.
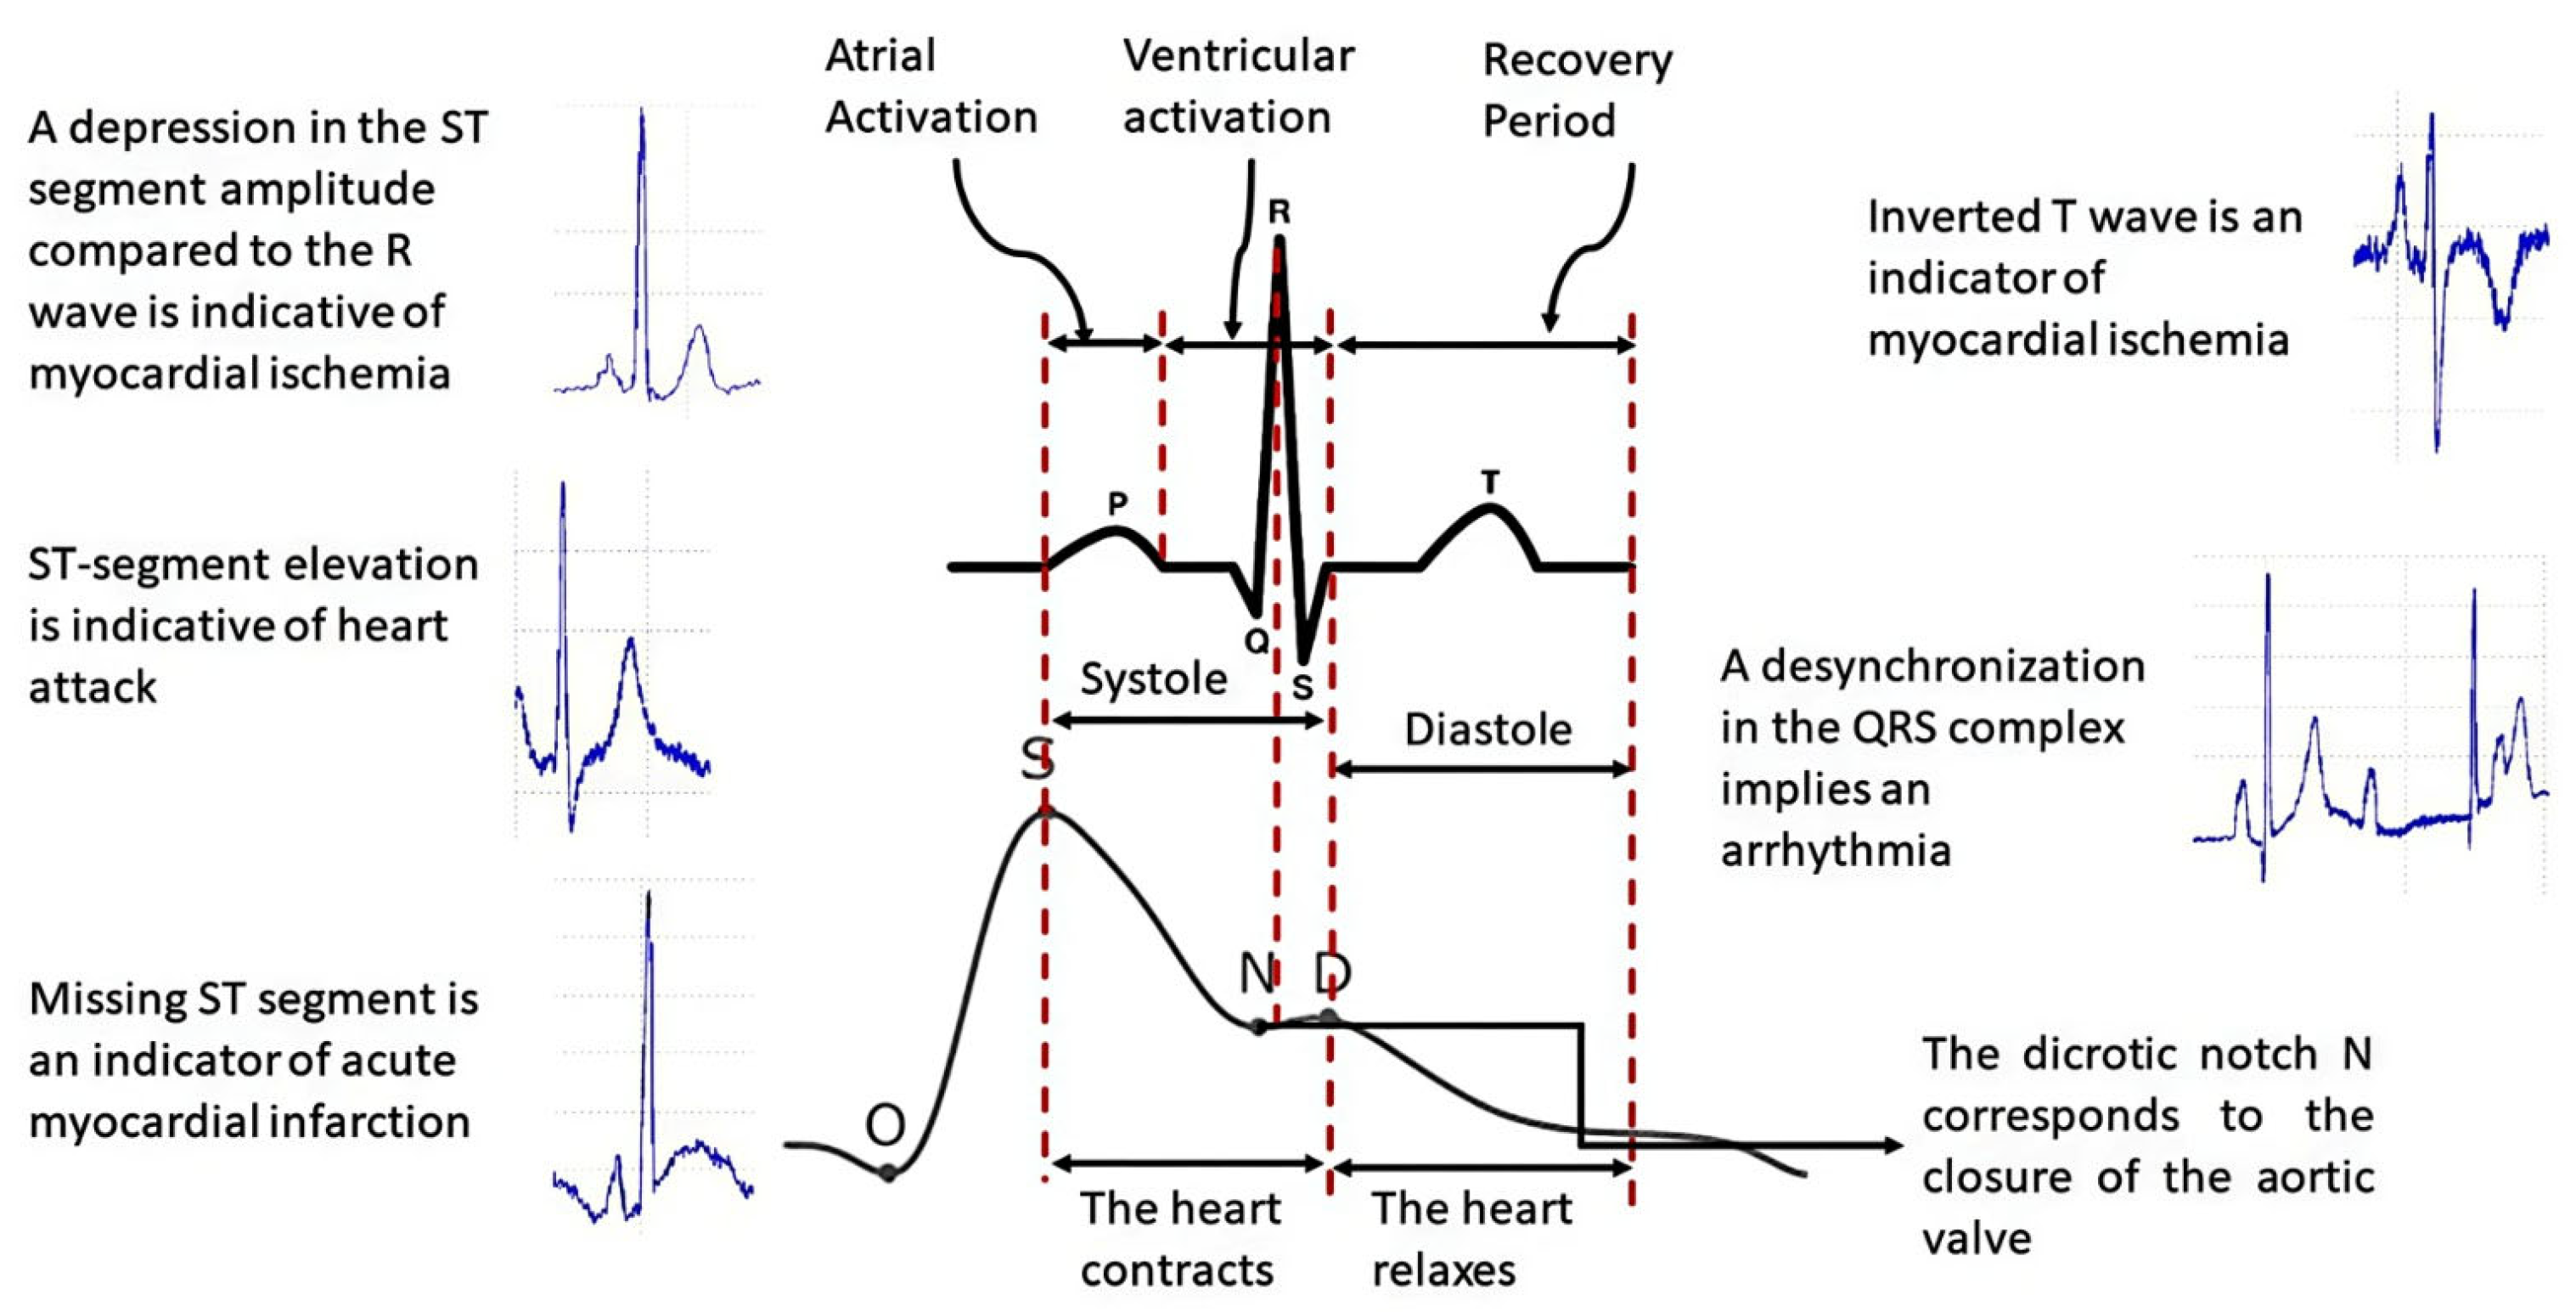
For this research, we decided to use PPG signals since the photoplethysmographic method consists of measuring the increase in volume in the cardiac pathways due to the passage of blood through the light absorbed or reflected by the tissues of the arteries, instead of using ECG signals because this signal represents the electrical activity of the heart, i.e., they are signals of different types; therefore, the PPG signal is the most appropriate for analyzing the arterial system [26]. Figure 2 shows the differences between the two types of signals.
Table 1 shows the possible heart diseases to be detected and the levels of biomarkers that indicate the level necessary to develop such diseases [26]. The detection of such diseases will be performed with photoplethysmographic technology and the support of machine learning algorithms.
Additionally, the architecture of the machine learning-based model for predicting hypertension and arteriosclerosis was performed, as depicted in Figure 3.
The following is a step-by-step description of the above architecture workflow, focused mainly on Classification Rules for detecting hypertension and arteriosclerosis.
Once the PPG signals are obtained from the fingertips using the cardiac signal acquisition card (step 1), the PPG signal features (time, frequency, statistics, and time domain) of the first and second derivatives are obtained. Based on these features, blood pressure prediction, hypertension detection, and any risk related to arteriosclerosis are carried out (step 2). In step 3, for the detection of hypertension, classification rules were established based on the American standard of cardiology. For the categories normal, elevated, level 1, and level 2, i.e., the predictions were established with values between 0 and 1. In this way, if the prediction value is equal to or less than 0.5, the blood pressure value is classified as usual, otherwise if the prediction value is less than or equal to 1, it indicates a high probability of suffering from hypertension. Similarly, for the categories level 1 and level 2, classification rules were established, that is, the predictions were established with values between 0 and 1, so that if the value of the prediction is equal to or less than 0.5, the value indicates a level 1 probability of having hypertension; otherwise, if the value of the prediction is less than or equal to 1, it indicates a level 2 probability of having hypertension.
In addition, in step 3, for the detection of some type of risk related to arteriosclerosis, classification rules were established for the normal, low, medium, and high categories. That is, the predictions were established with values between 0 and 1, so that if the prediction value is equal to or less than 0.5 the blood pressure value is classified as normal, otherwise if the prediction value is less than or equal to 1 it indicates a low probability of some risk related to arteriosclerosis. Similarly, for the medium and high categories, classification rules were established. That is, the predictions were established with values between 0 and 1, so that if the value of the prediction is equal to or less than 0.5, the value indicates a medium probability of suffering some risk related to arteriosclerosis. Otherwise, if the value of the prediction is less than or equal to 1, it indicates a high probability of risk related to arteriosclerosis. We hope that this machine learning-based methodology for obtaining information on blood pressure from the morphology of photoplethysmographic signals will allow health professionals to speed up the detection of changes in this physiological variable and to detect early the development of hypertension and arteriosclerosis.

4. Results and Discussion

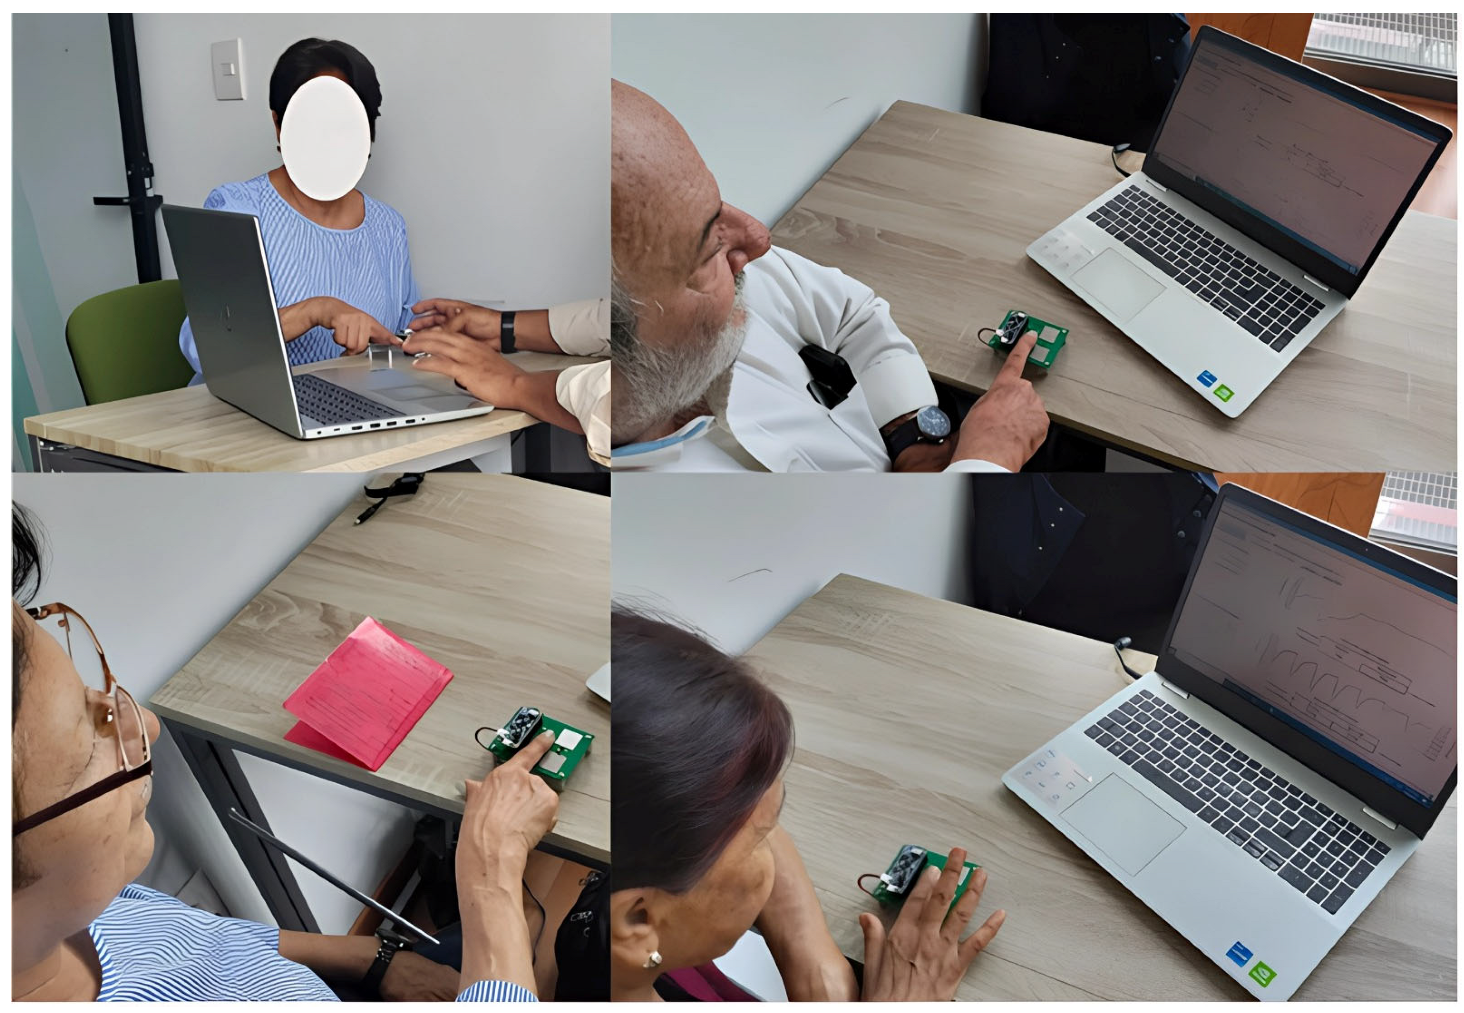
In this section, we present and discuss the results of validating our system based on the methodology established for our research. This allows the early identification of hypertension risk factors and their correlation with arteriosclerosis using machine learning algorithms. This validation was carried out with the help of experts in the health area, through at least one case study. For the validation, 110 PPG signals were collected with the support of the Doctor Hernández Zurita Foundation in Orizaba, Ver. Mexico [28]. Figure 4 shows three of the 110 study subjects who participated in collecting PPG signals at Foundation facilities (see table “Baseline data of study subjects” in the Appendix A).
It should be noted that when acquiring PPG signals, finger position, movement, and pressure applied to the PPG sensor can affect signal quality. Even ambient light can introduce noise into the sensor signal. However, these problems are solved thanks to the design features of the Max86150 cardiac signal acquisition card. These features are listed below:
  • Instrumentation amplifier to eliminate input noise;
  • Adaptive filter acting on the time domain;
  • Notch filter to set the operating frequency;
  • Low-pass filter to let the desired signal frequencies pass;
  • Automatic gain control function to dynamically adjust the current of the red and infrared LEDs of the PPG sensor;
  • Function to cancel ambient light;
  • Proximity function to detect the position of the finger on the PPG sensor, to mention just a few of the functions of the Max86150 card.
These PPG signals were obtained from male and female study subjects between 20 and 90 years of age with different cardiovascular conditions such as diabetes, hypertension, and cardiac problems. Subsequently, the processing and feature extraction of these PPG signals was carried out, the feature extraction was carried out in the time domain, frequency domain and statistical features, the first and second derivatives of the PPG signals were also calculated including the feature extraction in the time domain of the derivatives of the signals to estimate arterial pressure, identify the risk of hypertension and arteriosclerosis, and verify the correlation between these two conditions with the help of machine learning algorithms. Before processing and extracting the features of the PPG signals, an analysis of the morphology of each signal was carried out to discard those PPG signals that did not comply with a well-defined morphology of this type of signal. This morphological analysis consisted of verifying that the signals comply with the segments of the PPG signal, such as the origin of the signal, anacrotic phase, systolic peak, catacrotic phase, dicrotic notch, and diastolic peak. It should be noted that when processing the PPG signal, it is difficult to find the dicrotic notch, especially in older adults. However, this was achieved thanks to the following aspects:
  • The Max86150 cardiac signal acquisition card provides us with PPG signals with the least possible noise.
  • Although our system has its limitations, our Python 3.10 code for PPG signal processing, although capable of detecting the systolic peak, still requires improvements so that the system does not confuse the diastolic notch with the diastolic peak.
It should be noted that the reason why 80 of the 110 signals did not comply with the aforementioned morphology was because the study subjects had white coat syndrome, acrophobia (fear of heights) due to the height of the building of the Doctor Hernández Zurita Foundation, since the collection of PPG signals was carried out on the fourth floor of the foundation building. This building has floor-to-ceiling windows, allowing a full view of the exterior, which causes acrophobia in the study subjects. In addition, the study subjects come from different rural regions, and many of them are not accustomed to being at heights, which affects the readings. There were also movement artifacts, fear that they would receive an electric shock when touching the Max86150 card and, in other cases, poor positioning of the fingertip on the PPG sensor, and in the case of older adults, difficulties specific to their age arose. We also believe that the sample is sufficient for an experimental test, in addition to the fear experienced by the study subjects when they discovered that they had other ailments in addition to those they were already aware of. All these drawbacks meant several signals had to be discarded because they were not viable for this study. Once this analysis was performed, 80 signals were discarded, and the remaining 30 signals were used for processing, feature extraction, and cardiovascular analysis. A total of 150 cardiovascular analysis tests were processed on the PPG signals using 15 machine learning algorithms for each signal: (1) Linear Regression, (2) KNN (uniform weight), (3) KNN (distance weight), (4) SVR (Gaussian kernel), (5) SVR (Polynomial kernel), (6) DT, (7) AdaBoost, (8) Gradient Boosting, (9) Random Forest, (10) Bagging LR, (11) Bagging SVR (Gaussian kernel), (12) Bagging SVR (Polynomial kernel), (13) Bagging KNN (uniform weight), (14) Bagging KNN (distance weight), and (15) Bagging DT.

4.1. Healthy Patient (S2)

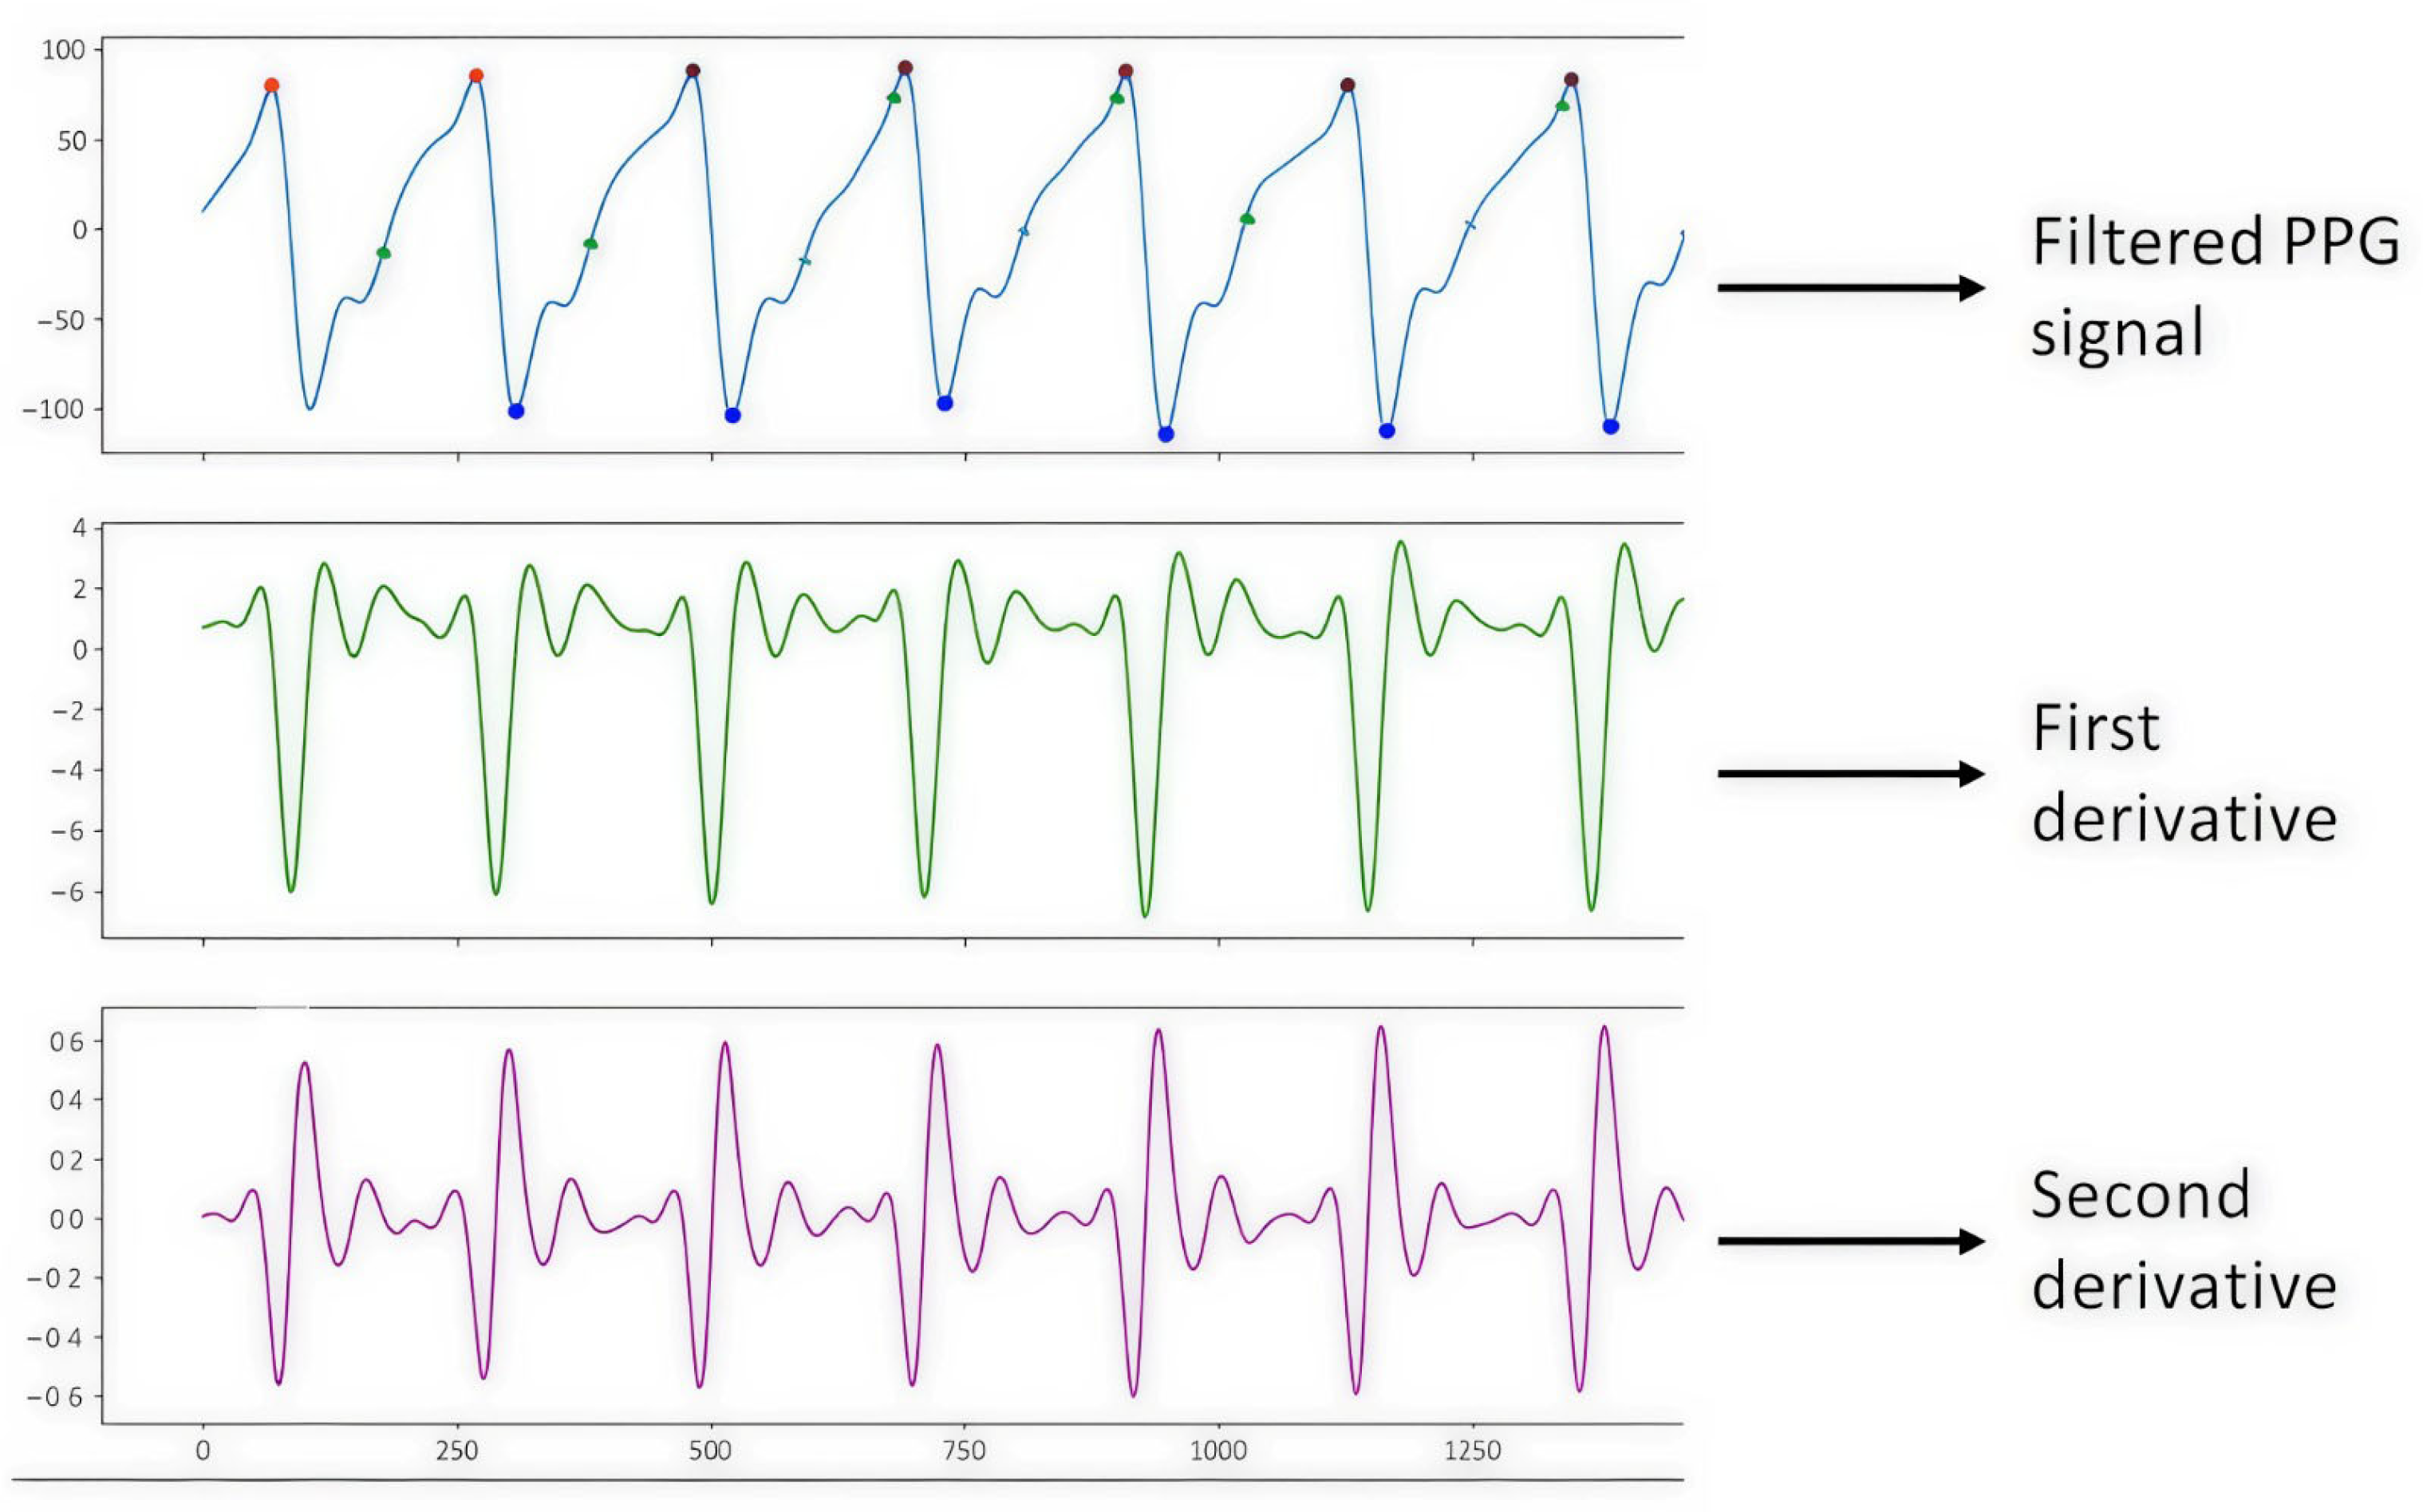
Figure 5 shows the PPG signal processing, which consists of plotting the filtered PPG signal and plotting the first and second derivatives obtained from the signal collected from study subject S2 (male, 43 years old, healthy) with support from the Max 86150 card.
It should be noted that the elimination of the PPG signal baseline is achieved thanks to the characteristics of the Max86150 cardiac signal acquisition card’s proprietary design. These characteristics are listed below:
  • Instrumentation amplifier for eliminating input noise;
  • Adaptive filter acting on the time domain;
  • Notch filter to set the operating frequency;
  • Low-pass filter to allow the desired frequencies of the signal to pass through;
  • There is an automatic gain control function to dynamically adjust the current of the red and infrared LEDs of the PPG sensor;
  • There is a function to cancel ambient light;
  • It has a proximity function to detect the position of the finger on the PPG sensor, to mention just a few of the functions of the Max86150 card;
  • Our Python code for PPG signal processing.
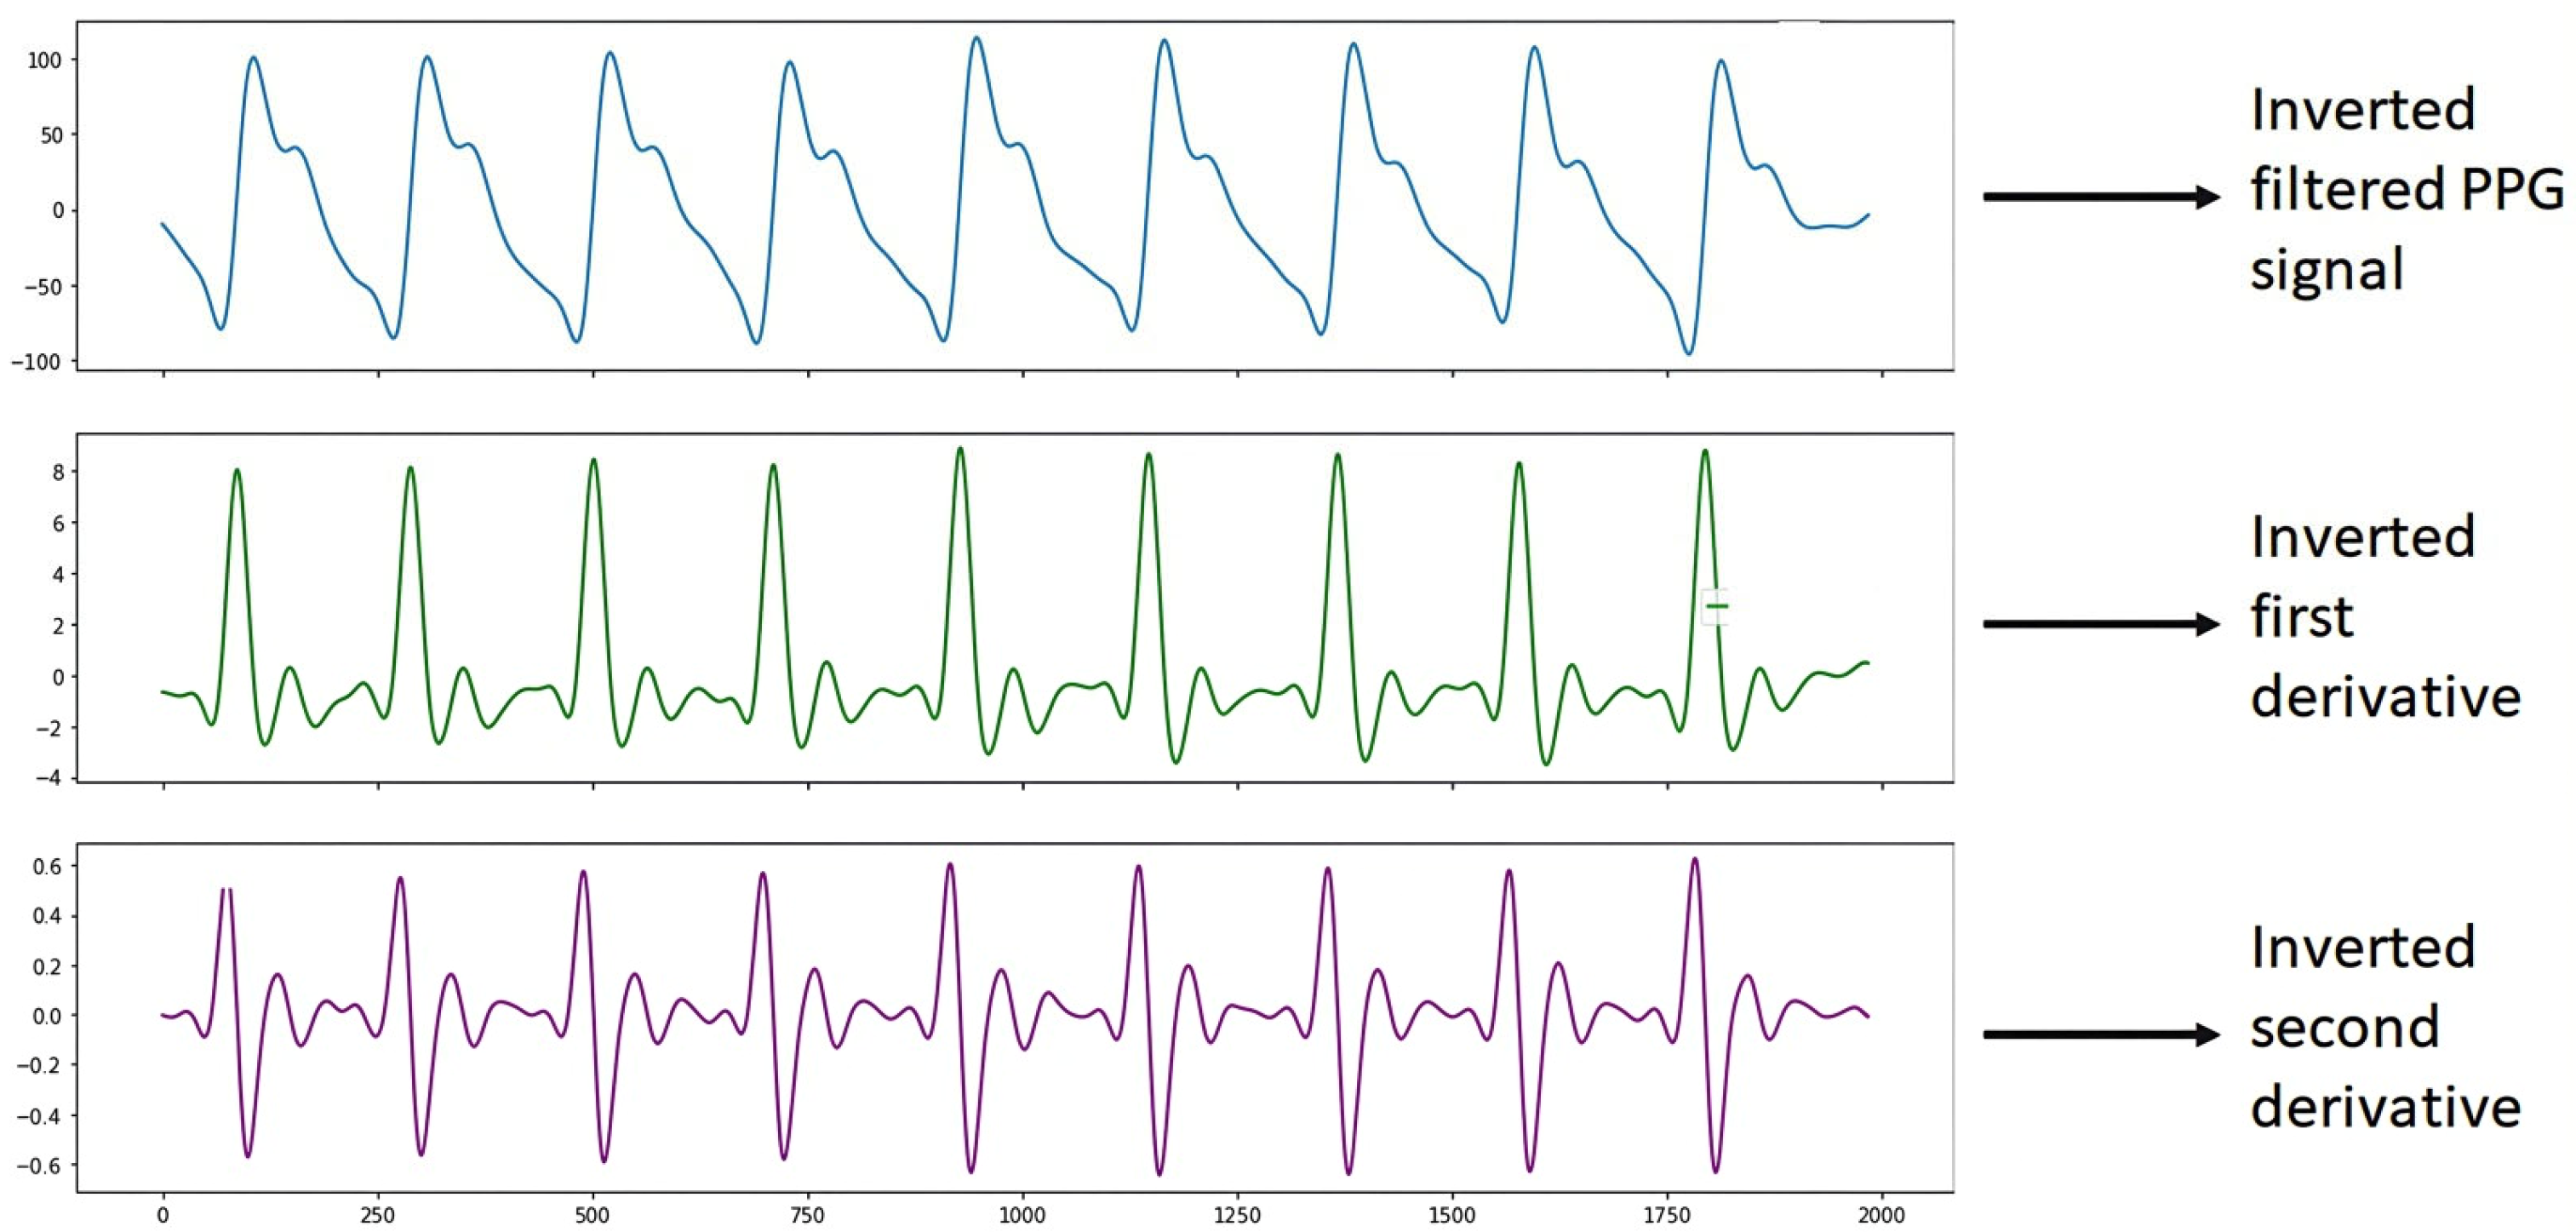
It is worth mentioning that once the S2 signal processing was performed, it was observed that the graph of the filtered PPG signal was shown horizontally upside down. This is since the Max86150 card, when collecting the PPG signals shows them upside down due to how the electronic devices and the PPG sensor of said card process the signals, due to design issues of the card. Therefore, we proceeded to carry out the programming in the Python 3 language with the help of Spyder version 5.4.1 software using a DELL Inspiron 3501 PC with an Intel Core i5 processor, NVIDIA GeForce 2 GB graphics card, 8 GB RAM, 1 TB hard drive, and a 64-bit operating system with Windows 10, to show the inverted PPG signal when processing it, which helped to correct the graphs of the filtered PPG signal and the graphs of the derivatives, as shown in Figure 6.
Table 2 shows the results of the analysis of the PPG signal of subject S2 for the estimation of blood pressure, where it can be seen that the best results of the predictions were obtained with the KNN and Bagging LR algorithms. The metrics used for the evaluation of these algorithms can also be seen, such as MSE (Mean Squared Error), r2 (Coefficient of Determination), and RMSE (Root Mean Squared Error), in addition to the cross validation performed with the RMSE metric to evaluate the performance of the algorithms.
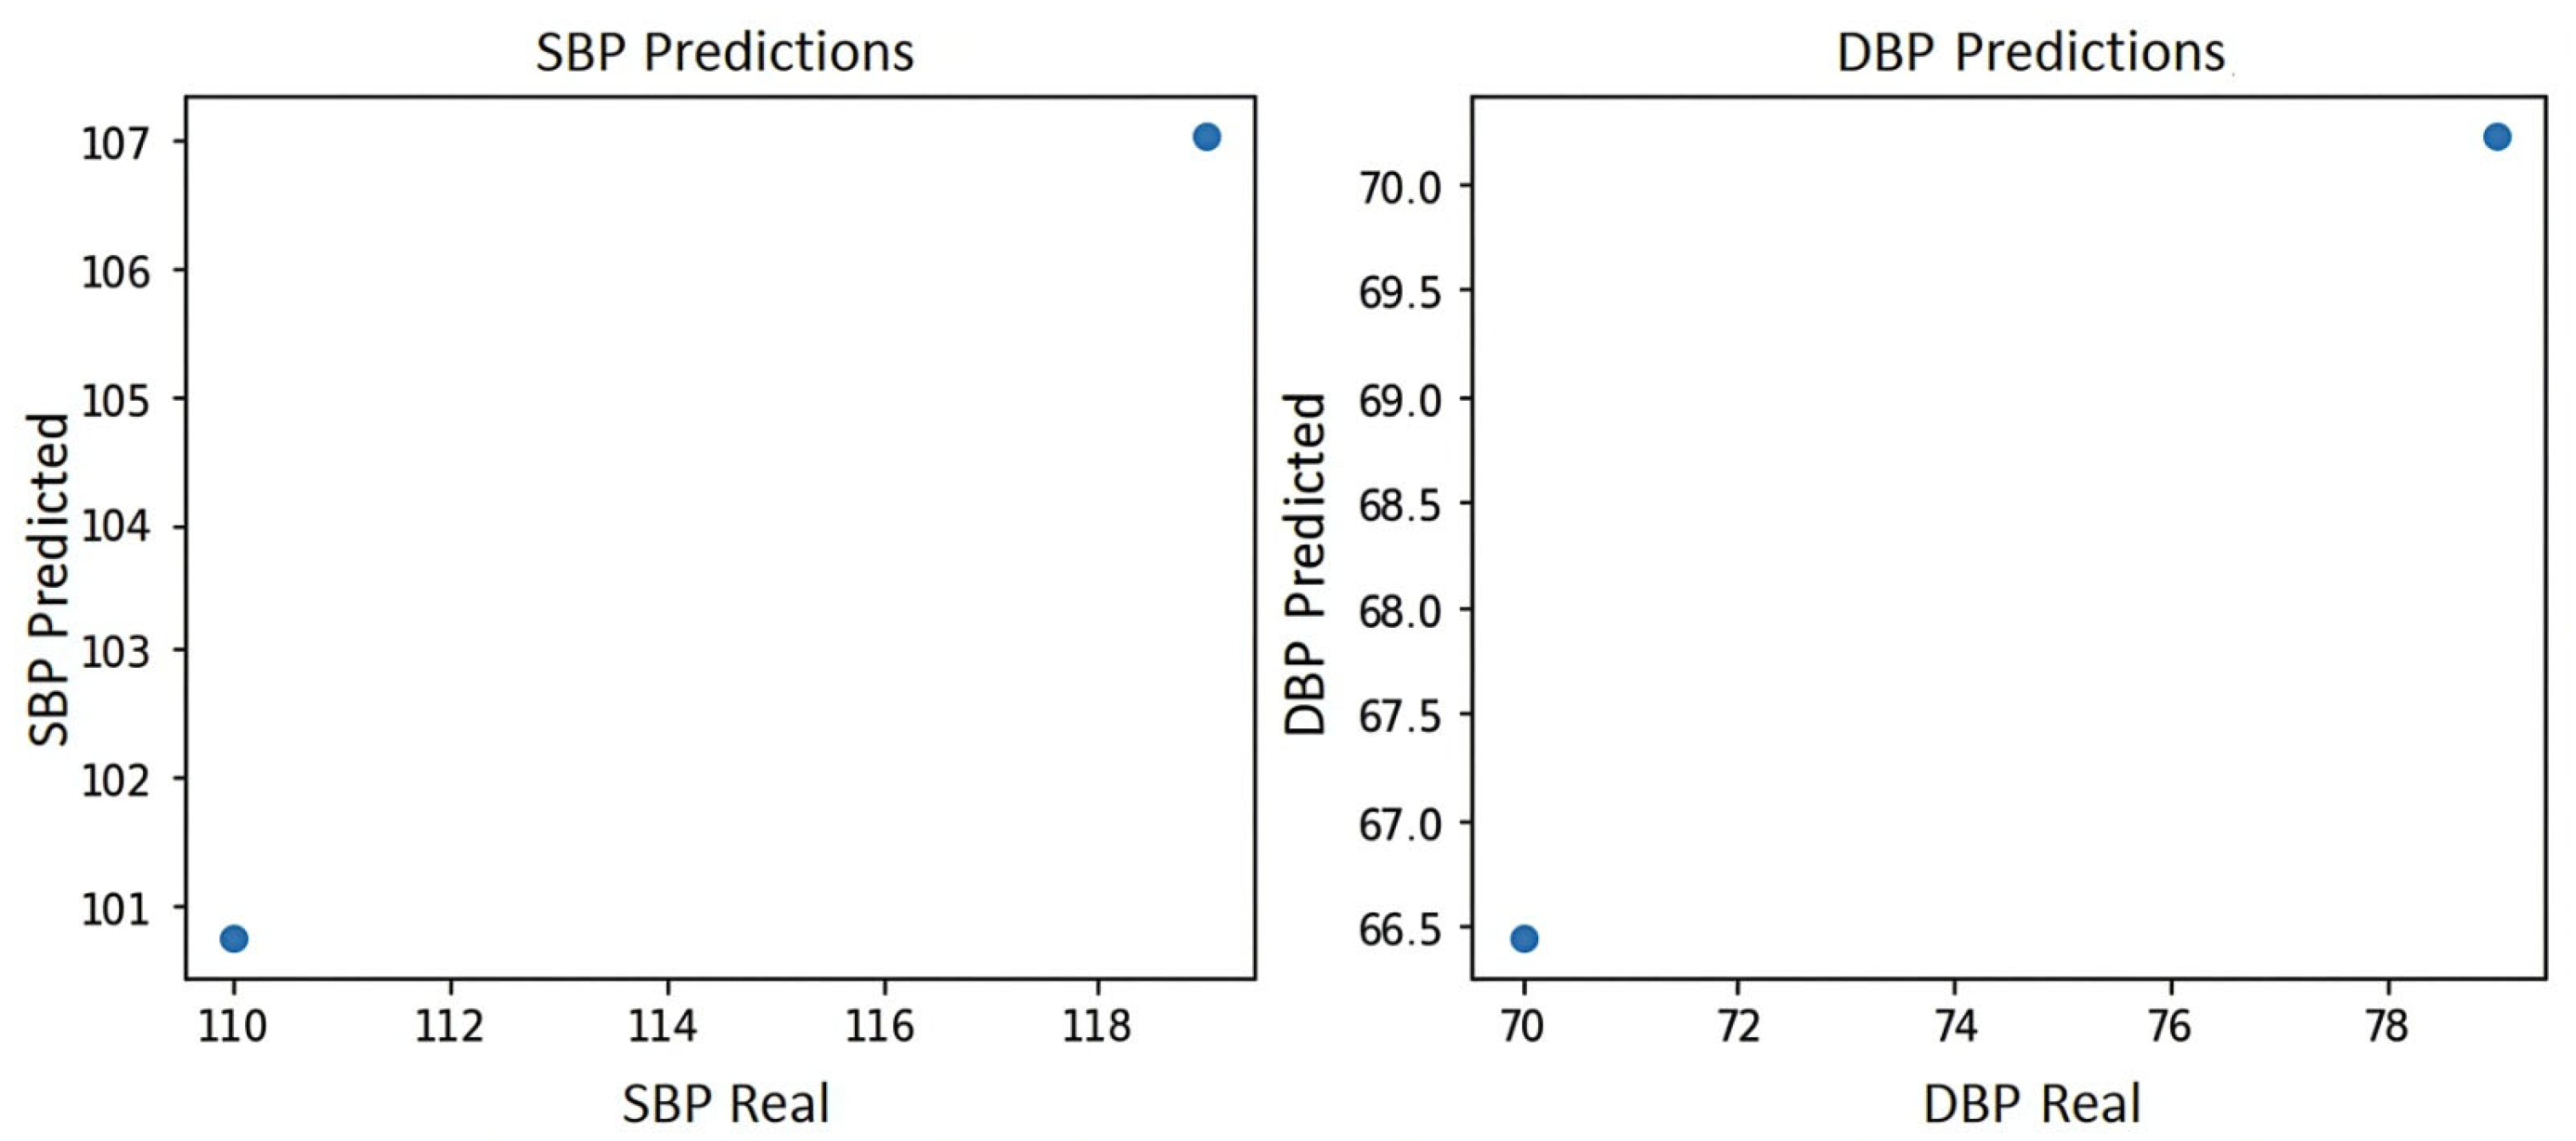
Figure 7 shows the blood pressure plot of the PPG signal of subject S2, where it can be seen that the system yields the two best predictions for blood pressure estimation, which are prediction 1:100 mmHg for systole and 66.5 mmHg for diastole and prediction 2:107 mmHg for systole and 71 mmHg for diastole, indicating in either case a normal blood pressure according to the blood pressure levels of the American standard of cardiology [29].
Table 3 shows the results of the analysis of the PPG signal of subject S2 for the identification of hypertension risk, where it can be seen that the best results of the predictions were obtained with the KNN and Bagging LR algorithms. The metrics used for the evaluation of these algorithms can also be seen, such as MSE (Mean Squared Error), r2 (Coefficient of Determination), and RMSE (Root Mean Squared Error), in addition to the cross validation performed with the RMSE metric to evaluate the performance of the algorithms. In this table, it can be seen that the two predictions for the elevated category are not reliable since 0.68 is not a value above 70% and 1 is a perfect result, and according to the literature this value indicates that the system is memorizing; therefore, we are left with the values of 0.43 and 0.44, which indicate that the blood pressure category is normal according to the classification rules that were established for this test [30,31].
Table 4 shows the results of the analysis of the PPG signal of subject S2 for the identification of atherosclerosis risk, where it can be seen that the best results of the predictions were obtained with the KNN and Bagging LR algorithms. The metrics used for the evaluation of these algorithms can also be seen, such as MSE (Mean Squared Error), r2 (Coefficient of Determination), and RMSE (Root Mean Squared Error), in addition to the cross validation performed with the RMSE metric to evaluate the performance of the algorithms. In this table, it can be observed that the two predictions for the low category are not reliable, since 0.68 is not a value above 70% and 1 is a perfect result. According to the literature, this value indicates that the system is memorizing; therefore, we are left with the values of 0.43 and 0.44 which indicate that the category of risk of arteriosclerosis is null according to the classification rules that were established for this test [29].

4.2. Diabetic Patient (S4)

Figure 8 shows the PPG signal processing, which consists of plotting the filtered PPG signal and plotting the first and second derivatives obtained from the signal collected from study subject S4 (Male, 48 years old, Diabetic) with the support of the Max86150 card.
Table 5 shows the results of the analysis of the PPG signal of subject S4 for the estimation of blood pressure, where it can be seen that the best results of the predictions were obtained with the KNN and Bagging LR algorithms. The metrics used for the evaluation of these algorithms can also be seen, such as MSE (Mean Squared Error), r2 (Coefficient of Determination), and RMSE (Root Mean Squared Error), in addition to the cross validation performed with the RMSE metric to evaluate the performance of the algorithms.
Figure 9 shows the blood pressure graph of the PPG signal of subject S4, where it can be seen that the system yields the two best predictions for blood pressure estimation, which are prediction 1:102.5 mmHg for systole and 67.5 mmHg for diastole and prediction 2:106 mmHg for systole and 69.5 mmHg for diastole, indicating in either case a normal blood pressure according to the blood pressure levels of the American standard of cardiology [29].
Table 6 shows the results of the analysis of the PPG signal of subject S4 for the identification of hypertension risk, where it can be seen that the best results of the predictions were obtained with the KNN and Bagging LR algorithms. The metrics used for the evaluation of these algorithms can also be seen, such as MSE (Mean Squared Error), r2 (Coefficient of Determination), and RMSE (Root Mean Squared Error), in addition to the cross validation performed with the RMSE metric to evaluate the performance of the algorithms. In this table, it can be observed that the two predictions for the elevated category are not reliable since 0.64 is not a value above 70% and 1 is a perfect result, and according to the literature, this value indicates that the system is memorizing; therefore, we are left with the value of 0.48, which indicates that the blood pressure category is normal according to the classification rules that were established for this test [30,31].
Table 7 shows the results of the analysis of the PPG signal of subject S4 for the identification of the risk of arteriosclerosis, where it can be seen that the best results of the predictions were obtained with the KNN algorithm; also, the metrics used for the evaluation of these algorithms can be seen, such as MSE (Mean Squared Error), r2 (Coefficient of Determination) and RMSE (Root Mean Squared Error), in addition to the cross validation performed with the RMSE metric to evaluate the performance of the algorithms. In this table, it can be observed that the prediction for the low category is not reliable since 0.50 is not a value above 70% and according to the literature, this value indicates indecision, that is to say that the system is not sure of the result; therefore, we are left with the value of 0.48, which indicates that the risk category of arteriosclerosis is null according to the classification rules that were established for this test.

4.3. Hypertensive and Diabetic Patient (S14)

Figure 10 shows the PPG signal processing consisting of plotting the filtered PPG signal and plotting the first and second derivatives obtained from the signal collected from study subject S14 (male, 69 years old, hypertensive and diabetic) with the support of the Max86150 card.
Table 8 shows the results of the analysis of the PPG signal of subject S14 for the estimation of blood pressure, where it can be seen that the best results of the predictions were obtained with the Bagging LR algorithm. The metrics used for the evaluation of algorithms, such as MSE (Mean Squared Error), r2 (Coefficient of Determination) and RMSE (Root Mean Square Error), in addition to the cross validation performed with the RMSE metric to assess the performance of the algorithm can also be seen.
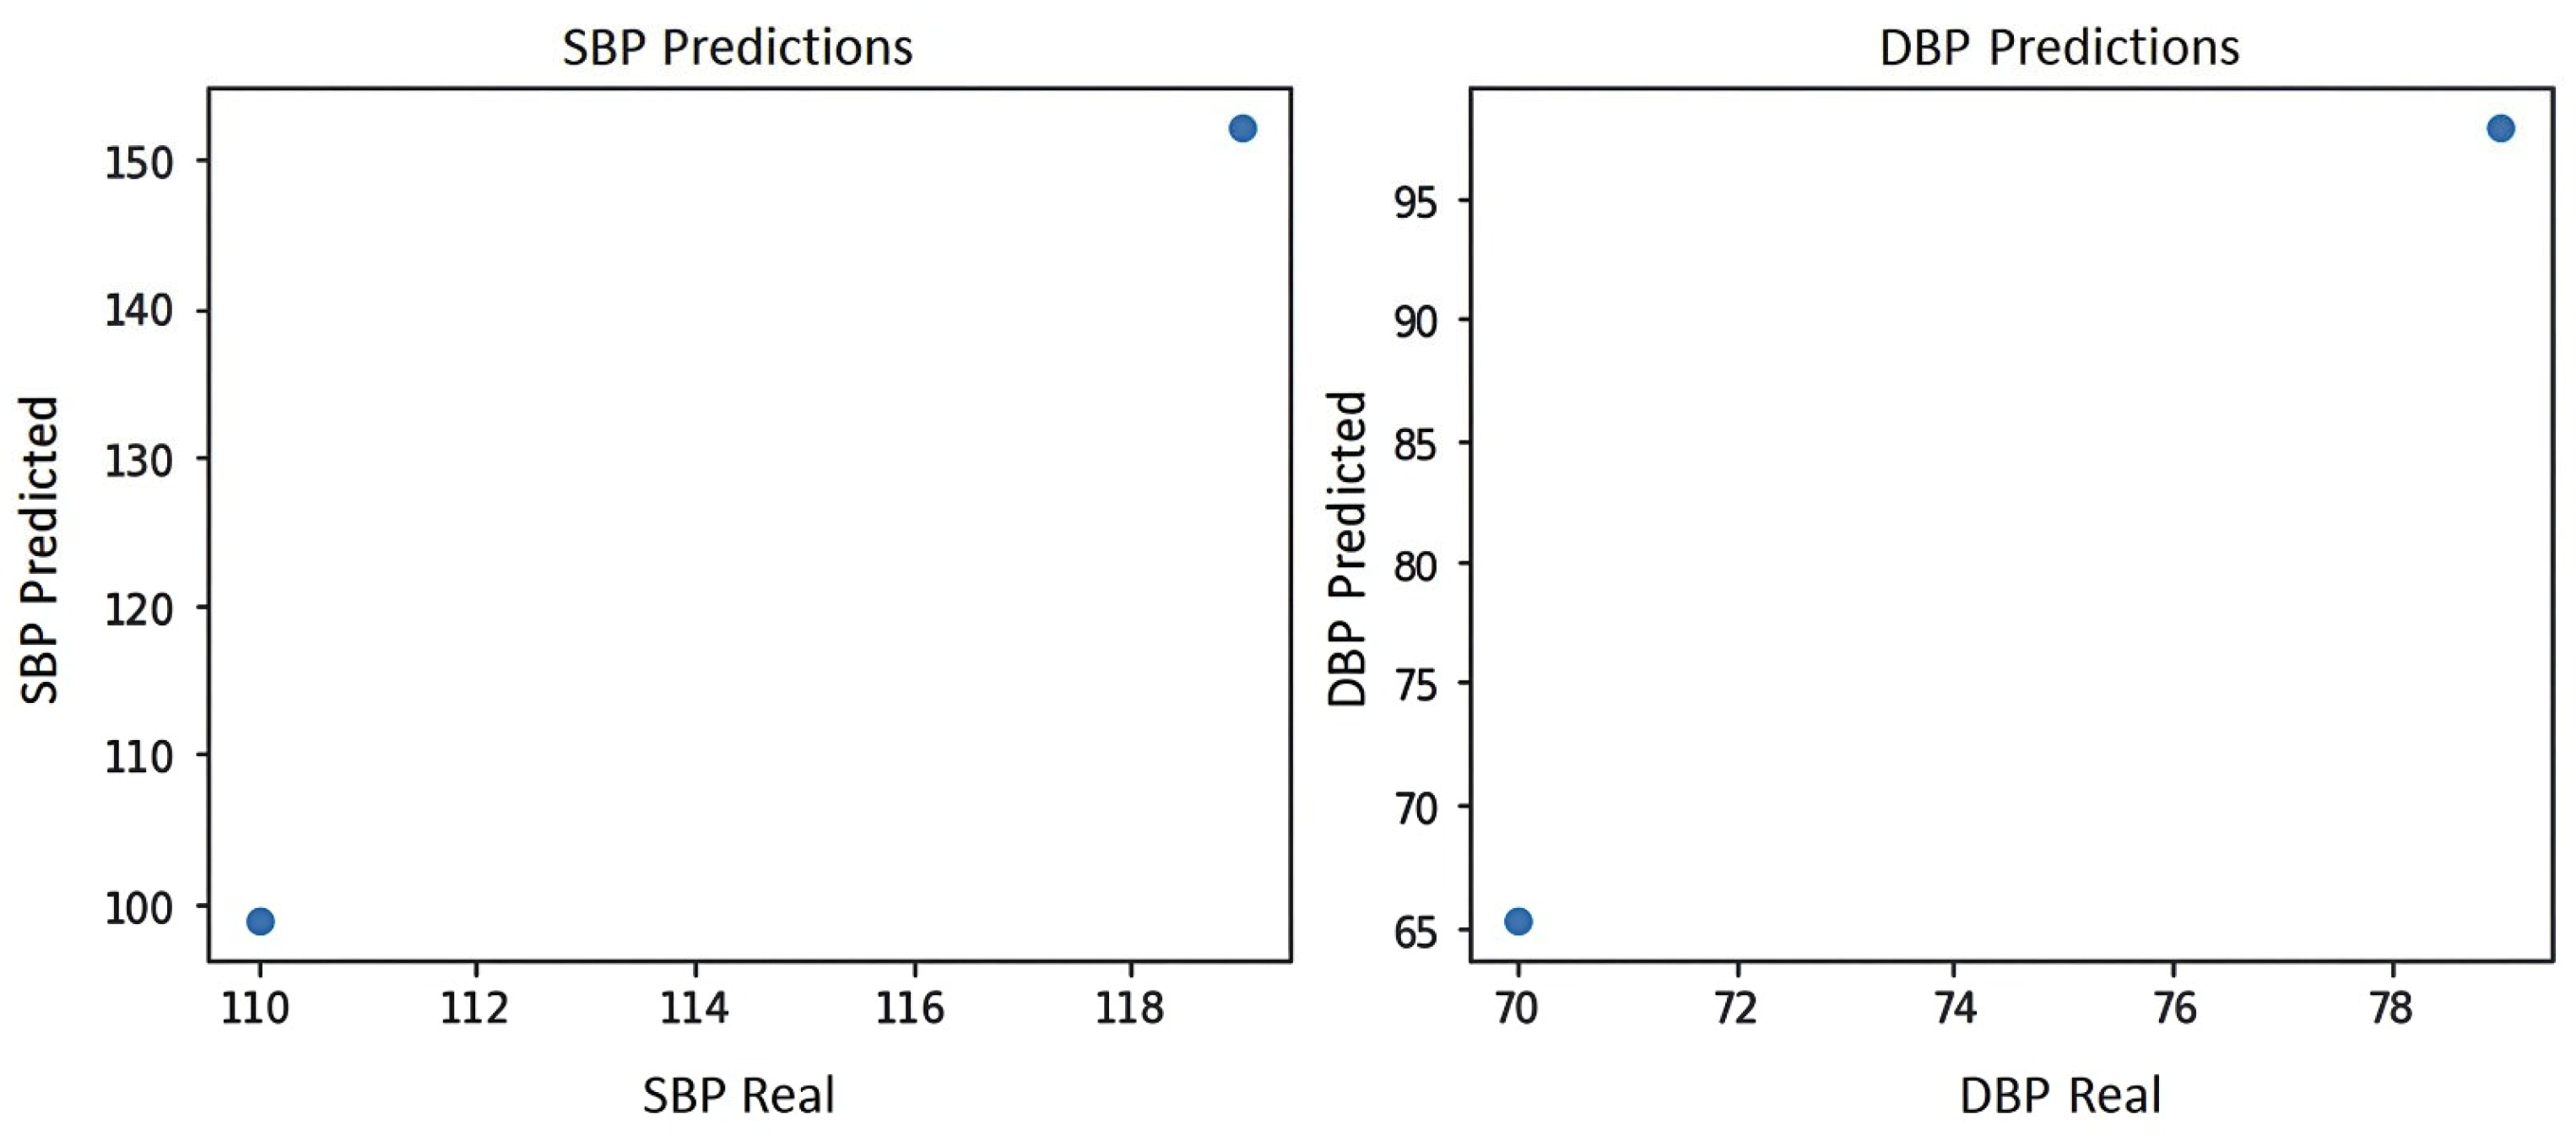
Figure 11 shows the blood pressure graph of the PPG signal of subject S14, where it can be seen that the system yields the two best predictions for blood pressure estimation, which are prediction 1:100 mmHg for systole and 65 mmHg for diastole, and prediction 2:150 mmHg for systole and 100 mmHg for diastole, indicating that prediction 2 shows level 2 hypertension according to the blood pressure levels of the American standard of cardiology [29].
Table 9 shows the results of the analysis of the PPG signal of subject S14 for the identification of hypertension risk, where it can be seen that the best results of the predictions were obtained with the Bagging LR algorithm. Also, the metrics used for the evaluation of these algorithms can be seen, such as MSE (Mean Squared Error), r2 (Coefficient of Determination), and RMSE (Root Mean Squared Error), in addition to the cross validation performed with the RMSE metric to evaluate the performance of the algorithms. In this table it can be seen that the prediction for the level 2 category shows a reliable value of 74%, thus indicating a level 2 hypertension risk according to the classification rules established for this test [29].
Table 10 shows the results of the analysis of the PPG signal of subject S14 for the identification of risk of arteriosclerosis, where it can be seen that the best results of the predictions were obtained with the Bagging LR algorithm. It can also be seen the metrics used for the evaluation of such algorithms, such as MSE (Mean Squared Error), r2 (Coefficient of Determination) and RMSE (Root Mean Squared Error), in addition to the cross validation performed with the RMSE metric to evaluate the performance of the algorithms. In this table, it can be seen that the prediction for the high category shows a reliable value of 74%, thus indicating a risk of arteriosclerosis according to the classification rules established for this test.
On the other hand, Table 11 shows the results of the confidence interval applied to the KNN_w_distance algorithm, which was the algorithm that obtained the best accuracy in its performance, with a confidence interval of 95% in both the estimation of systolic blood pressure (SBP) and the estimation of diastolic blood pressure (DBP). These results were obtained using the Python 3 language with the help of Spyder version 5.4.1 software.
Finally, the results allow us to confirm the correlation between the risk of hypertension and arteriosclerosis. Based on the medical literature, poor treatment or care of hypertension leads to an increased risk of arteriosclerosis [32].

4.4. Findings, Challenges, and Limitations

One of the challenges of the acquisition, processing and analysis of PPG signals was that the study subjects, at the time of collecting their PPG signal, presented in some cases symptoms such as white coat syndrome, or were nervous about seeing the cardiac signal acquisition card, or had acrophobia (fear of heights) due to the height of the building of the Doctor Hernández Zurita Foundation. There were also movement artifacts (patient movements when taking blood pressure), and in other cases, the wrong position of the fingertip on the PPG sensor. In addition to the fear experienced by the study subjects for discovering that they have other conditions in addition to those they are already aware of, all these inconveniences generated that several signals had to be discarded because they were not viable for this study. Therefore, it is recommended that self-management of cardiovascular health be carried out at home where the study subject feels comfortable, safe, and calm, so that the PPG signals do not suffer alterations.
On the other hand, one limitation of this study was that the Max86150 cardiac signal acquisition card has FDA certification; however, this certification refers to compact energy-saving designs, such as the Max86150 card, which include cell phones, laptops, tablets, and smart speakers; it is not a certification for use in clinical environments. However, being a device developed by Analog Devices, a U.S. company recognized worldwide by the design and develop of non-invasive blood pressure solutions, we consider that the use of Max86150, and its performance is feasible and reliable for the development of this type of research project instead of using a prototype of their own design, thereby risking the reliability of the data collected [33].

5. Conclusions and Future Work

In this experimental study, we compared the performance of 15 machine learning algorithms to estimate arterial pressure using a non-invasive method through PPG signals and identifying the risk of hypertension and its correlation with arteriosclerosis using different metrics with the training-test split strategy and k-fold cross-validation methods. Our main findings revealed that the analyzed machine learning algorithms that showed the best performance for blood pressure estimation were Linear Regression, polynomial SVR, GradientBoosting, and polynomial bagging SVR using MSE and RMSE metrics. The analyzed machine learning algorithms that showed the best performance for identifying hypertension risk were Linear Regression, KNN, SVR, RF, LR bagging, KNN bagging, SVR bagging, and DT bagging using MSE and RMSE metrics. The analyzed machine learning algorithms that showed the best performance for identifying atherosclerosis-related risk were Linear Regression, KNN, SVR, RF, LR bagging, and DT bagging. The main contribution of this research is to validate the best risk models. These results suggest that this research is promising and offers valuable information on the acquisition and processing of PPG signals. However, as this is an experimental study, the effectiveness of our model needs to be validated with a larger database before being used in a clinical setting. On the other hand, this model represents a support tool for healthcare specialists in the early detection of cardiovascular health, allowing people to self-manage their health and seek medical attention at an early stage.
As for future work, we consider the following objectives: (1) Collect PPG signals in the homes of study subjects (or ask them to monitor their own PPG signals) to avoid white coat syndrome and other types of stress experienced by study subjects when undergoing clinical studies in medical institutions, and to avoid discarding signals that do not comply with the morphology of PPG signals; (2) use other FDA-approved devices for PPG signal acquisition, including wearable devices; (3) detect other abnormalities in the arterial system based on the morphology of PPG signals and their derivatives, which indicate to healthcare specialists the risk of hypertension and arteriosclerosis; (4) detect other diseases related to the cardiovascular system using photoplethysmography, and (5) develop services and a web platform for the use of machine learning algorithms identified as the best for the early detection of hypertension and arteriosclerosis, which serve as support for the general public and in the decision-making of healthcare specialists.

Author Contributions

Conceptualization, I.M.-C.; methodology, M.A.A.-R.; software, M.A.A.-R. and A.J.R.-D.; validation, I.M.-C.; formal analysis, M.A.A.-R. and I.M.-C.; investigation, M.A.A.-R. and J.L.S.-C.; resources, J.L.S.-C.; data curation, A.J.R.-D.; writing—original draft preparation, M.A.A.-R.; writing—review and editing, M.A.A.-R., J.L.S.-C. and I.M.-C.; visualization, J.E.G.-D.; supervision, J.E.G.-D.; project administration, J.L.S.-C.; funding acquisition, J.L.S.-C. All authors have read and agreed to the published version of the manuscript.

Funding

This work was supported by Tecnológico Nacional de México (TecNM) Orizaba, México. Project 22083.25-P “Predicción del deterioro macular en personas con adultez intermedia mediante aprendizaje profundo”.

Institutional Review Board Statement

It has been reviewed and approved by the Bioethics and Research Committees of the Universidad Veracruzana Campus Cd Mendoza, Mexico, being recorded with code: 046-202601-FMCM.

Informed Consent Statement

Not applicable.

Data Availability Statement

The proposed model source code in this study is available on https://drive.google.com/drive/folders/1kGZpJcBnd2cBH2uZUHo5dixs2jFoQPBD. The dataset used in this study is available on https://figshare.com/articles/dataset/PPG-BP_Database_zip/5459299 and https://physionet.org/content/bidmc/1.0.0/#files-panel, all accessed on 2 November 2025.

Acknowledgments

This work was supported by Mexico’s National Technological Institute (TecNM) and sponsored by Mexico’s Secretariat of Science, Humanities, Technology, and Innovation (SECIHTI) and the Secretariat of Public Education (SEP) through the PRODEP project (Programa para el Desarrollo Profesional Docente). Thanks to the Doctor Hernández Zurita Foundation, I.B.P., for allowing samples to be obtained for experimentation in this work.

Conflicts of Interest

The authors declare no potential conflict of interest with respect to the publication of this research.

Appendix A

Comparison of Regression Algorithm Performance
Metrics
AlgorithmsMSEr2MAERMSERMSE_CV
SBPDBPSBPDBPSBPDBPSBPDBPSBPDBP
1RL27.404.64−0.350.773.882.135.232.159.274.23
2KNN_w_uniform164.2569.25−7.11−2.4112712.818.3215.079.29
3KNN_w_distance57.9122.67−1.85−0.117.604.367.614.7612.047.10
4SVR_rbf153.1361.57−6.56−2.0411.656.6512.377.8414.849.04
5SVR_poly170.3336.42−7.41−0.7912.345.5513.056.0313.526.48
6DT20858−9.27−1.8612714.427.6114.427.61
7AdaBoost20.520.5−0.01−0.014.54.54.524.529.476.07
8GradientBoosting61.9416.95−2.050.167.194.117.874.1111.145.86
9RandomForest67.6231.70−2.33−0.567.754.458.225.6311.907.09
10Bagging_RL68.7026.75−2.39−0.328.284.768.285.1711.686.59
11Bagging_SVR_rbf170.4769.38−7.41−2.4212.327.1213.058.3215.129.22
12Bagging_SVR_poly115.0322.31−4.68−0.109.754.0010.724.7213.156.62
13Bagging_KNN_w_uniform176.573.54−7.71−2.6312.57.313.288.5715.249.35
14Bagging_KNN_w_distance109.4345.08−4.40−1.2210.215.9210.466.7113.598.19
15Bagging_DT67.6231.70−2.33−0.567.754.458.225.6311.907.09
Morphological Features of the PPG Signal
Time DomainFrequency DomainStatistical Features
RR mean (Average RR interval)VLF Power (Power in the very low frequency band)Mean (PPG signal average)
RR std (Standard deviation of RR intervals)LF Power (Power in the low frequency band)Std (Standard deviation of the PPG signal)
HR mean (Average heart rate)HF Power (High frequency band power)Skewness (PPG signal asymmetry)
HR std (Standard deviation of heart rate)Total Power (Total sum of spectral power in the range of interest)Kurtosis (Kurtosis of the PPG signal)
HRV RMSSD (Square root of the mean of the successive differences squared)LF/HF Ratio (Relationship between LF and HF powers)Max (Maximum PPG signal value)
VLF (%) (Percentage of power in the VLF band relative to the total)Min (Minimum PPG signal value)
LF (%) (Porcentaje de potencia en la banda LF respecto al total)Range (Rango (máx − mín) de la señal PPG)
HF (%) (Porcentaje de potencia en la banda HF respecto al total)Energy (Energía total de la señal PPG)
Baseline Data of Study Subjects
SubjectGenderAgeCardiovascular Diseases
S1Male72Diabetes
S2Male43Healthy
S3Male29Healthy
S4Male48Diabetes
S5Male27Hypertension
S6Male42Healthy
S7Male42Healthy
S8Feminine66Healthy
S9Male27Healthy
S10Male27Healthy
S11Feminine73Healthy
S12Male73Diabetes
S13Feminine63Hypertension and type 2 diabetes mellitus
S14Male69Hypertension and diabetes
S15Feminine41Hypertension and diabetes
S16Feminine62Healthy
S17Feminine67Hypertension and diabetes
S18Feminine72Hypertension
S19Male64Hypertension
S20Feminine66Hypertension
S21Male61Hypertension
S22Feminine75Healthy
S23Feminine61Healthy
S24Male63Hypertension and diabetes
S25Male52Healthy
S26Feminine35Healthy
S27Feminine62Hypertension and diabetes
S28Feminine48Hypertension
S29Male37Healthy
S30Feminine60Healthy
S31Feminine51Hypertension
S32Male61Hypertension and diabetes
S33Male54Healthy
S34Male75Hypertension and diabetes
S35Feminine54Healthy
S36Male71Healthy
S37Male74Healthy
S38Male66Healthy
S39Male51Diabetes
S40Male72Hypertension
S41Male55Hypertension
S42Male67Healthy
S43Feminine68Hypertension and diabetes
S44Male48Diabetes
S45Feminine46Healthy
S46Male72Diabetes
S47Feminine26Healthy
S48Male42Healthy
S49Feminine35Healthy
S50Feminine80Healthy
S51Feminine61Healthy
S52Male73Healthy
S53Feminine45Healthy
S54Feminine43Healthy
S55Feminine68Healthy
S56Feminine66Diabetes
S57Feminine28Healthy
S58Feminine60Hypertension and diabetes
S59Feminine38Healthy
S60Male65Healthy
S61Feminine58Healthy
S62Feminine74Healthy
S63Feminine53Healthy
S64Male68Diabetes
S65Feminine57Healthy
S66Male57Healthy
S67Male64Healthy
S68Male71Hypertension and diabetes
S69Feminine24Healthy
S70Feminine50Diabetes
S71Feminine24Healthy
S72Male44Hypertension
S73Male65Hypertension
S74Male65Diabetes
S75Male82Hypertension
S76Male33Healthy
S77Feminine63Hypertension
S78Male71Hypertension and diabetes
S79Feminine70Hypertension and diabetes
S80Feminine86Healthy
S81Feminine48Hypertension
S82Male57Hypertension and diabetes
S83Male75Healthy
S84Feminine70Healthy
S85Male48Healthy
S86Feminine42Diabetes
S87Male54Healthy
S88Feminine70Healthy
S89Feminine42Diabetes
S90Feminine68Hypertension and diabetes
S91Feminine30Healthy (anemia)
S92Male66Hypertension
S93Male46Healthy
S94Feminine68Diabetes (kidney failure)
S95Feminine44Hypertension
S96Male76Healthy
S97Feminine69Healthy
S98Feminine44Healthy
S99Feminine61Diabetes
S100Feminine73Hypertension (pacemaker)
S101Male75Hypertension and prediabetes
S102Feminine36Tachycardia and arrhythmia, hypotension
S103Feminine27Healthy
S104Feminine66Healthy
S105Feminine51Healthy
S106Feminine43Anemia
S107Male64Hypertension and diabetes
S108Male46Healthy
S109Feminine61Healthy
S110Feminine41Healthy

References

  1. Día Mundial de la Hipertensión 2024—OPS/OMS|Organización Panamericana de la Salud. Available online: https://www.paho.org/es/campanas/dia-mundial-hipertension-2024 (accessed on 29 August 2025).
  2. Cardiovascular Diseases (CVDs). Available online: https://www.who.int/news-room/fact-sheets/detail/cardiovascular-diseases-(cvds) (accessed on 28 August 2025).
  3. Kaptoge, S.; Pennells, L.; De Bacquer, D.; Cooney, M.T.; Kavousi, M.; Stevens, G.; Riley, L.M.; Savin, S.; Khan, T.; Altay, S. World Health Organization cardiovascular disease risk charts: Revised models to estimate risk in 21 global regions. Lancet Glob. Health 2019, 7, e1332–e1345. [Google Scholar] [CrossRef]
  4. Campbell, N.R.; Dattani, S.; Bell, A.; Gelfer, M.; Cloutier, L.; Petrella, R.; Lindsay, P.; Leung, A.A.; McLean, D.; Kaczorowski, J. Urgent need to increase the rates of diagnosing, treating and controlling hypertension in older women: A call for action. Can. Pharm. J. Rev. Pharm. Can. 2020, 153, 264–269. [Google Scholar] [CrossRef]
  5. Slivnick, J.; Lampert, B.C. Hypertension and heart failure. Heart Fail. Clin. 2019, 15, 531–541. [Google Scholar] [CrossRef] [PubMed]
  6. Mousavi, S.S.; Firouzmand, M.; Charmi, M.; Hemmati, M.; Moghadam, M.; Ghorbani, Y. Blood pressure estimation from appropriate and inappropriate PPG signals using A whole-based method. Biomed. Signal Process. Control 2019, 47, 196–206. [Google Scholar] [CrossRef]
  7. Mathur, P.; Srivastava, S.; Xu, X.; Mehta, J.L. Artificial intelligence, machine learning, and cardiovascular disease. Clin. Med. Insights Cardiol. 2020, 14, 1179546820927404. [Google Scholar] [CrossRef]
  8. Poznyak, A.V.; Sadykhov, N.K.; Kartuesov, A.G.; Borisov, E.E.; Melnichenko, A.A.; Grechko, A.V.; Orekhov, A.N. Hypertension as a risk factor for atherosclerosis: Cardiovascular risk assessment. Front. Cardiovasc. Med. 2022, 9, 959285. [Google Scholar] [CrossRef]
  9. Oh, G.C.; Cho, H.-J. Blood pressure and heart failure. Clin. Hypertens. 2020, 26, 1. [Google Scholar] [CrossRef]
  10. Tjitra, M.A.; Anju, N.E.; Sudiana, D.; Rizkinia, M. A Wireless Noninvasive Blood Pressure Measurement System Using MAX30102 and Random Forest Regressor for Photoplethysmography Signals. Computers 2024, 13, 125. [Google Scholar] [CrossRef]
  11. Attivissimo, F.; D’Alessandro, V.I.; De Palma, L.; Lanzolla, A.M.L.; Di Nisio, A. Non-Invasive Blood Pressure Sensing via Machine Learning. Sensors 2023, 23, 8342. [Google Scholar] [CrossRef]
  12. Tarifi, B.; Fainman, A.; Pantanowitz, A.; Rubin, D.M. A Machine Learning Approach to the Non-Invasive Estimation of Continuous Blood Pressure Using Photoplethysmography. Appl. Sci. 2023, 13, 3955. [Google Scholar] [CrossRef]
  13. Fleischhauer, V.; Feldheiser, A.; Zaunseder, S. Beat-to-Beat Blood Pressure Estimation by Photoplethysmography and Its Interpretation. Sensors 2022, 22, 7037. [Google Scholar] [CrossRef] [PubMed]
  14. Yang, S.; Sohn, J.; Lee, S.; Lee, J.; Kim, H.C. Estimation and Validation of Arterial Blood Pressure Using Photoplethysmogram Morphology Features in Conjunction With Pulse Arrival Time in Large Open Databases. IEEE J. Biomed. Health Inform. 2021, 25, 1018–1030. [Google Scholar] [CrossRef] [PubMed]
  15. Lin, W.-H.; Chen, F.; Geng, Y.; Ji, N.; Fang, P.; Li, G. Towards accurate estimation of cuffless and continuous blood pressure using multi-order derivative and multivariate photoplethysmogram features. Biomed. Signal Process. Control 2021, 63, 102198. [Google Scholar] [CrossRef]
  16. Evdochim, L.; Dobrescu, D.; Halichidis, S.; Dobrescu, L.; Stanciu, S. Hypertension Detection Based on Photoplethysmography Signal Morphology and Machine Learning Techniques. Appl. Sci. 2022, 12, 8380. [Google Scholar] [CrossRef]
  17. Yin, S.; Li, G.; Luo, Y.; Lin, L. Cuff-less continuous blood pressure measurement based on multiple types of information fusion. Biomed. Signal Process. Control 2021, 68, 102549. [Google Scholar] [CrossRef]
  18. Fati, S.M.; Muneer, A.; Akbar, N.A.; Taib, S.M. A Continuous Cuffless Blood Pressure Estimation Using Tree-Based Pipeline Optimization Tool. Symmetry 2021, 13, 686. [Google Scholar] [CrossRef]
  19. Schrumpf, F.; Frenzel, P.; Aust, C.; Osterhoff, G.; Fuchs, M. Assessment of Non-Invasive Blood Pressure Prediction from PPG and rPPG Signals Using Deep Learning. Sensors 2021, 21, 6022. [Google Scholar] [CrossRef]
  20. Sun, X.; Zhou, L.; Chang, S.; Liu, Z. Using CNN and HHT to Predict Blood Pressure Level Based on Photoplethysmography and Its Derivatives. Biosensors 2021, 11, 120. [Google Scholar] [CrossRef]
  21. Almarshad, M.; Islam, M.; Al-Ahmadi, S.; BaHammam, A. Diagnostic Features and Potential Applications of PPG Signal in Healthcare: A Systematic Review. Healthcare 2022, 10, 547. [Google Scholar] [CrossRef]
  22. Pandey, D.; Niwaria, K.; Chourasia, B. Machine learning algorithms: A review. Int. Res. J. Eng. Technol. 2019, 6, 916–922. [Google Scholar]
  23. Miller, J.R.; Koren, S.; Sutton, G. Assembly algorithms for next-generation sequencing data. Genomics 2010, 95, 315–327. [Google Scholar] [CrossRef]
  24. Maqsood, S.; Xu, S.; Springer, M.; Mohawesh, R. A benchmark study of machine learning for analysis of signal feature extraction techniques for blood pressure estimation using photoplethysmography (PPG). IEEE Access 2021, 9, 138817–138833. [Google Scholar] [CrossRef]
  25. MAX86150 Datasheet and Product Info|Analog Devices. Available online: https://www.analog.com/en/products/max86150.html (accessed on 29 August 2025).
  26. Esgalhado, F.; Batista, A.; Vassilenko, V.; Russo, S.; Ortigueira, M. Peak detection and HRV feature evaluation on ECG and PPG signals. Symmetry 2022, 14, 1139. [Google Scholar] [CrossRef]
  27. Thupakula, S.; Nimmala, S.S.R.; Ravula, H.; Chekuri, S.; Padiya, R. Emerging biomarkers for the detection of cardiovascular diseases. Egypt. Heart J. 2022, 74, 77. [Google Scholar] [CrossRef]
  28. Fundación Oftalmológica. Available online: https://fundacionzurita.com.mx/ (accessed on 2 September 2025).
  29. AHA Research Grant Funding Opportunities. Available online: https://professional.heart.org/en/research-programs/aha-funding-opportunities (accessed on 29 August 2025).
  30. Carlini, N.; Ippolito, D.; Lee, K.; Tramèr, F.; Jagielski, M.; Zhang, C. Quantifying Memorization Across Neural Language Models. In Proceedings of the Eleventh International Conference on Learning Representations (ICLR), Kigali, Rwanda, 1–5 May 2023; pp. 1–19. [Google Scholar]
  31. Dhar, P.; Singh, R.V.; Peng, K.-C.; Wu, Z.; Chellappa, R. Learning Without Memorizing. In Proceedings of the 2019 IEEE/CVF Conference on Computer Vision and Pattern Recognition (CVPR), Long Beach, CA, USA, 15–20 June 2019; pp. 5133–5141. [Google Scholar] [CrossRef]
  32. Hipertensión. Available online: https://www.who.int/es/news-room/fact-sheets/detail/hypertension (accessed on 29 August 2025).
  33. Módulo de Biosensores Integrado de PPG y ECG Para Dispositivos Móviles MAX86150. Available online: https://www.digikey.com.mx/es/product-highlight/m/maxim-integrated/max86150-integrated-ppg-and-ecg-biosensor-module (accessed on 29 August 2025).
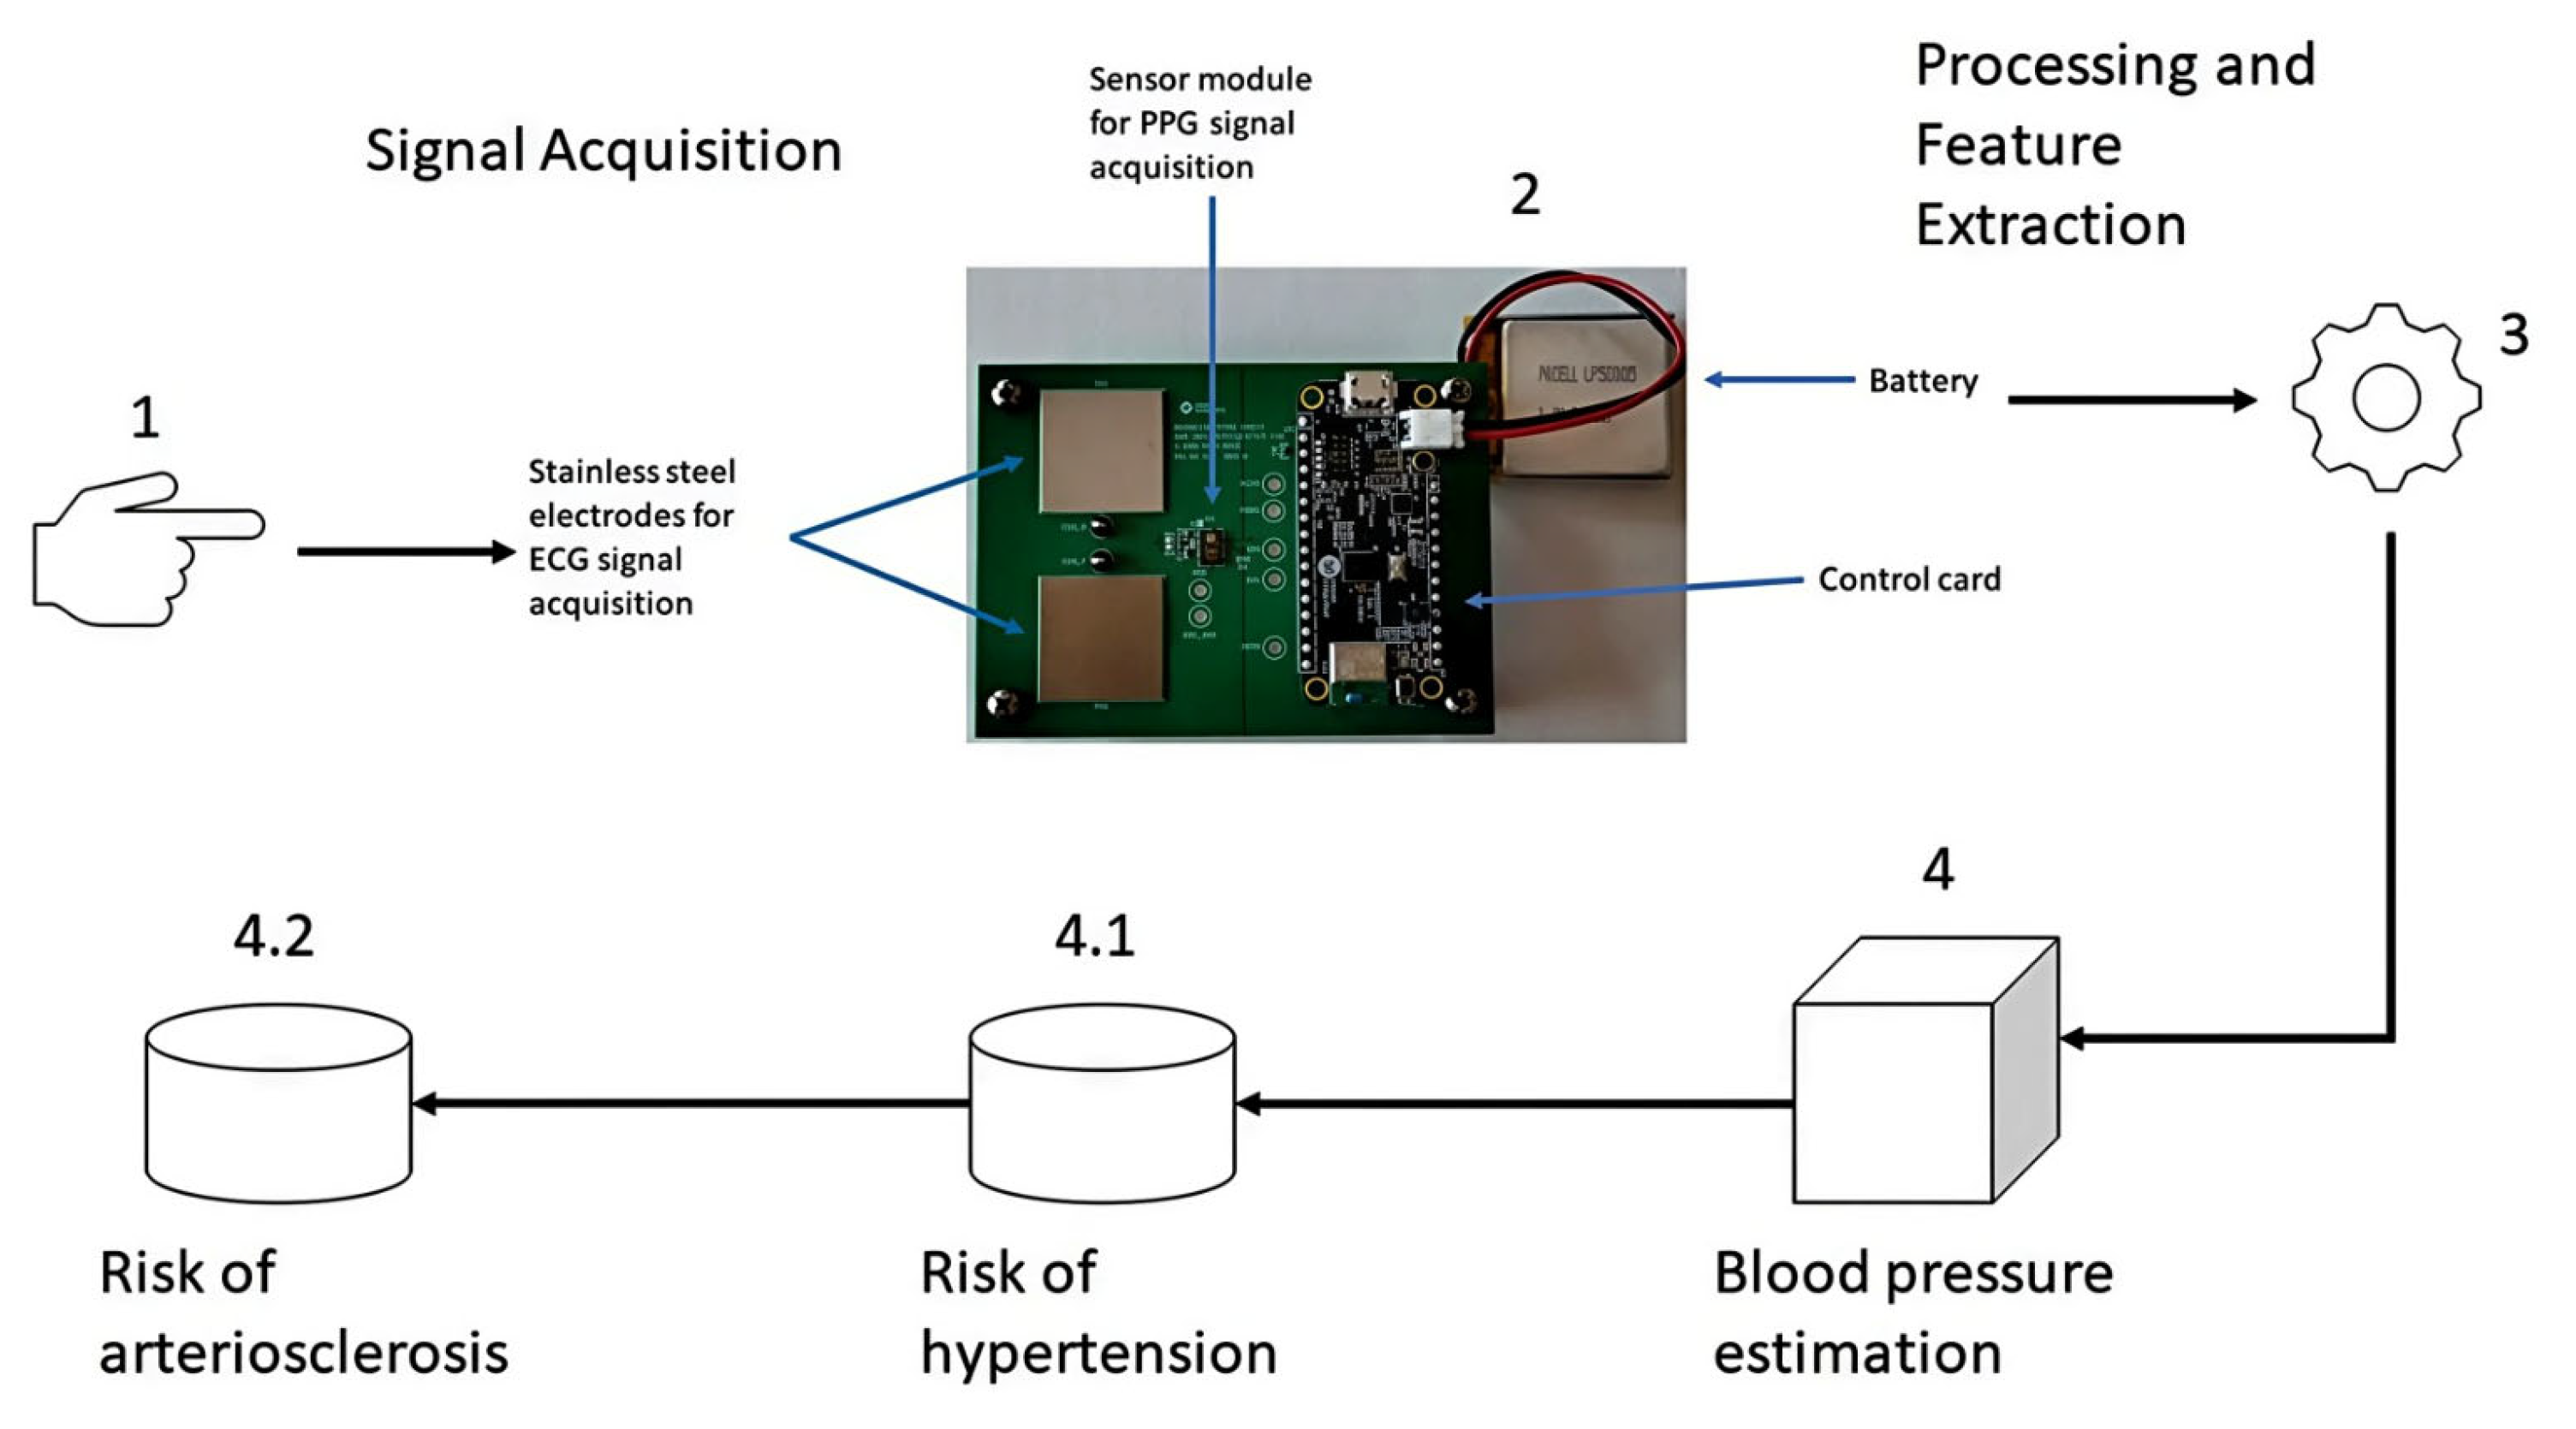
Figure 1. Methodology for blood pressure estimation and identification of cardiovascular risk.
Applsci 15 11829 g001
Figure 2. Difference between ECG and PPG signals.
Applsci 15 11829 g002
Figure 3. Architecture of the Machine Learning model for the prediction of hypertension and arteriosclerosis.
Applsci 15 11829 g003
Figure 4. Three participants for the study with patients of the Doctor Hernández Zurita Foundation.
Applsci 15 11829 g004
Figure 5. PPG S2 signal.
Applsci 15 11829 g005
Figure 6. Inverted S2 signal.
Applsci 15 11829 g006
Figure 7. Blood pressure graph of subject S2.
Applsci 15 11829 g007
Figure 8. Inverted S4 signal.
Applsci 15 11829 g008
Figure 9. Blood pressure graph of subject S4.
Applsci 15 11829 g009
Figure 10. Inverted S14 signal.
Applsci 15 11829 g010
Figure 11. Blood pressure graph of subject S14.
Applsci 15 11829 g011
Table 1. Biomarkers of possible cardiovascular disease to detect [27].
Cardiovascular Health
Cardiovascular DiseasesBiomedical Variables
HypertensionSmokingObesity Diabetes CholesterolAge Gender Triglycerides
Arteriosclerosis >139/89 mmHgYes>30 kg/m2≥200 mg/dL>200 mg/dLYesYes>150 mg/dL
Atherosclerosis
Thoracic aortic disease
Peripheral vascular disease
Blood vessel disease
Table 2. Validation subject S2 (HEALTHY) BP.
Metrics
MSEr2RMSERMSE (CV)
AlgorithmsSBPDBPSBPDBPSBPDBPSBPDBP
KNN_w_distance114.46369544.88305544.652528151.2164471810.69877076.6994817213.04359437.52189411
Bagging_LR40.46525786.322816310.998284340.687762166.361230842.5145210910.5019065.05354269
Knn: k nearest neighboors; Bagging LR: Bagging Linear Regression; MSE: Mean Square Error; SBP: Systolic Blood Pressure; DBP: Diastolic Blood Pressure; r 2 : coefficient of determination; RMSE: Root Mean Square Error; CV: Cross Validation; S2: signal 2; BP: Blood Pressure.
Table 3. Results of the analysis of the PPG signals S2 HBP1.
Metrics
AlgorithmsMSEr2RMSECVPredictions
RMSENormalElevated
KNN_w_distance0.144956320.42017470.38073130.413364090.430.68
Bagging_LR0.098322750.6067090.313564590.375018650.441
Knn: k nearest neighboors; Bagging LR: Bagging Linear Regression; MSE: Mean Square Error; r 2 : coefficient of determination; RMSE: Root Mean Square Error; CV: Cross Validation; S2: signal 2; HBP: high blood pressure.
Table 4. Results of the analysis of the PPG signals S2 of AS1.
Metrics
AlgorithmsMSEr2RMSECVPredictions
RMSENoneLow
KNN_w_distance0.144956320.42017470.38073130.413364090.430.68
Bagging_LR0.098322750.6067090.313564590.375018650.441
Knn: k nearest neighboors; Bagging LR: Bagging Linear Regression; MSE: Mean Square Error; r 2 : coefficient of determination; RMSE: Root Mean Square Error; CV: Cross Validation; S2: signal 2; AS: Arteriosclerosis.
Table 5. Validation subject S4 (DIABETIC) BP.
Metrics
MSEr2RMSERMSE (CV)
AlgorithmsSBPDBPSBPDBPSBPDBPSBPDBP
KNN_w_distance114.34787247.94952734.646808481.3678778910.69335646.9245597213.04842417.66986597
Bagging_LR50.04194665.931156041.471207240.707103417.074033262.4353964910.92540265.09284567
Knn: k nearest neighboors; Bagging LR: Bagging Linear Regression; MSE: Mean Square Error; SBP: Systolic Blood Pressure; DBP: Diastolic Blood Pressure; r 2 : coefficient of determination; RMSE: Root Mean Square Error; CV: Cross Validation; S4: signal 4; BP: Blood Pressure.
Table 6. Results of the analysis of the PPG signals S4 HBP1.
Metrics
AlgorithmsMSEr2RMSECVPredictions
RMSENormalElevated
KNN_w_distance0.192348290.230606830.43857530.48133115 0.64
Bagging_LR0.1158450.536620020.34036010.44666370.481
Knn: k nearest neighboors; Bagging LR: Bagging Linear Regression; MSE: Mean Square Error; r 2 : coefficient of determination; RMSE: Root Mean Square Error; CV: Cross Validation; S4: signal 4; HBP: high blood pressure.
Table 7. Results of the analysis of the PPG signals S4 AS1.
Metrics
AlgorithmMSEr2RMSECVPredictions
RMSENoneLow
KNN_w_distance0.192348290.230606830.43857530.481331150.480.5
Knn: k nearest neighboors; MSE: Mean Square Error; r 2 : coefficient of determination; RMSE: Root Mean Square Error; CV: Cross Validation; S4: signal 4; AS: Arteriosclerosis.
Table 8. Validation subject S14 (HYPERTENSIVE AND DIABETIC) BP.
Metrics
MSEr2RMSERMSE (CV)
AlgorithmSBPDBPSBPDBPSBPDBPSBPDBP
Bagging_LR606.113844188.091128.93154788.2884493724.619379413.714630920.072591911.1174032
Bagging LR: Bagging Linear Regression; MSE: Mean Square Error; SBP: Systolic Blood Pressure; DBP: Diastolic Blood Pressure; r 2 : coefficient of determination; RMSE: Root Mean Square Error; CV: Cross Validation; S14: signal 14; BP: Blood Pressure.
Table 9. Results of the analysis of the PPG signals S14 HBP2.
Metrics
AlgorithmMSEr2RMSECVPREDICTIONS
RMSELEVEL 1LEVEL 2
Bagging_LR0.092985170.628059330.304934690.794580690.430.74
Bagging LR: Bagging Linear Regression; MSE: Mean Square Error; r 2 : coefficient of determination; RMSE: Root Mean Square Error; CV: Cross Validation; S14: signal 14; HBP: high blood pressure.
Table 10. Results of the analysis of the PPG signals S14 AS2.
Metrics
AlgorithmMSEr2RMSECVPREDICTIONS
RMSEHALFHIGH
Bagging_LR0.092985170.628059330.304934690.794580690.430.74
Bagging LR: Bagging Linear Regression; MSE: Mean Square Error; r 2 : coefficient of determination; RMSE: Root Mean Square Error; CV: Cross Validation; S14: signal 14; AS: Arteriosclerosis.
Table 11. Blood pressure confidence interval.
Blood PressureMeasure
SBPAverage prediction = 103.30
SBP95% confidence interval = [90.00, 115.00]
DBPAverage prediction = 67.64
DBP95% confidence interval = [60.00, 75.00]
Disclaimer/Publisher’s Note: The statements, opinions and data contained in all publications are solely those of the individual author(s) and contributor(s) and not of MDPI and/or the editor(s). MDPI and/or the editor(s) disclaim responsibility for any injury to people or property resulting from any ideas, methods, instructions or products referred to in the content.