1. Introduction
Laboratory mechanical testing serves as the principal methodology for determining fundamental rock mechanical parameters. In uniaxial compression testing, the geometric precision of specimen preparation, particularly end-surface flatness and parallelism, critically determines measurement accuracy. Kryshtafovych et al. [
1] investigated frictional contact mechanics of elastic half-planes with periodic surface relief, analyzing both isotropic and anisotropic cases. Their study systematically characterized interface gap geometries for sinusoidal surfaces, providing new insights into contact behavior under varying elastic properties and surface topography conditions. Complementing this research, Kryshtafovych et al. [
2] analytically investigated contact mechanics between anisotropic half-planes with surface recesses. By formulating a Cauchy-type singular integral equation for the gap height, the study solved symmetrical recess problems and conducted strength analysis using Fisher’s failure criterion, providing analytical solutions for imperfect contact interfaces. Nevertheless, the development of rapid and high-precision quantification methods for rock specimen flatness assessment is an urgent research priority. This need is particularly critical given that rock failure is the predominant mechanism triggering instabilities in geotechnical engineering systems. Inherent discontinuities (e.g., microcracks, joints, and pre-existing defects) within rock masses preferentially develop into failure planes underloading, facilitating crack coalescence and ultimately inducing structural collapse [
3,
4]. Notably, the current absence of systematic methodologies for characterizing mechanical behavior in non-standard rock specimens [
5] results in substantial variations in measured strength parameters and other mechanical properties, posing significant challenges for both quantitative and qualitative analyses. Conventional rock mechanics testing employs standardized cylindrical specimens (typically φ 50 mm × 100 mm) to characterize key mechanical properties, including strength, deformation characteristics, and failure modes. These standardized measurements serve as fundamental references for evaluating the geomechanical behavior of target rock formations. While significant research efforts have been devoted to numerical simulations of rock fracture propagation and its influence on mechanical behavior, the critical effect of specimen geometry irregularities on experimental results remains substantially understudied in conventional laboratory testing. In field sampling practice, maintaining strict dimensional tolerances for rock specimens proves particularly challenging. Crucially, even minor deviations from standard geometries can significantly affect the reliability of mechanical test results.
Extensive research has been conducted to understand the mechanical behavior of flawed rock specimens, as pre-existing defects significantly influence their failure characteristics. Yang et al. [
6] conducted uniaxial compression tests on flawed marble specimens from eastern China, revealing that pre-existing flaw geometry significantly reduces UCS, elastic modulus, and peak strain while inducing eight distinct crack types. Complementing these experimental findings, Zhang et al. [
7] developed a damage model to investigate fracture propagation in heterogeneous rocks with pre-existing fractures. Numerical simulations revealed that fracture angle and length significantly affect UCS reduction and failure modes, with tensile failure dominating in heterogeneous rocks and shear failure in homogeneous ones. The investigation of defect effects has been further extended through combined experimental and numerical approaches. Liu et al. [
8] combined experimental tests and numerical simulations (PFC-FJM and DEM-DFN) to investigate anisotropic strength and scale effects in defected tuff. Results reveal defect-dominated failure modes, size-dependent strength variations, and a representative REV size of 5 × 10 m for the rock mass under confinement. Wong et al. [
9] numerically investigated pore-like flaw effects in brittle rock using grain-based modeling. Results demonstrate a 58.6% UCS and a 56.4% elastic modulus reduction for central 15.44 mm pores, with micro-cracks initiating at pore boundaries due to tensile stress concentration, validated through Kirsch equations. Liu et al. [
10] developed a continuous–discontinuous coal model to study bedding effects on rock mechanics. Results show that peak stress reaches 8.16 MPa at a 0° bedding angle, while fracture degree peaks at 90° (3.74%). Bedding strength below 0.5 MPa shows negligible stress variation, and loading rate significantly affects fracture complexity. Recent studies have particularly focused on specific defect configurations and their mechanical implications. Cui et al. [
11] investigated spherical defect effects in rock through lab tests and simulations. Results show a 48% UCS and a 53% modulus reduction for the largest defects, with boundary-proximity defects causing the earliest cracking. Wang et al. [
12] employed PFC2D to simulate rock specimens with combined circular holes and angled cracks (0–90°). Results demonstrate defect-induced strength reduction and three characteristic macro-crack patterns, with crack angles significantly altering stress/displacement fields, providing new insights into fracture evolution in defective rock masses for underground engineering stability control. Fan et al. [
13] experimentally investigated rectangular-flawed sandstone using water-jet cutting. Results show stress concentration at hole sidewalls initiates flaking, with 0–60° flaw angles promoting crack initiation. Four failure stages were identified: flaking, crack propagation, rock burst, and secondary rupture, providing insights for fractured rock stability analysis. Choo et al. [
14] conducted multiscale simulations of flawed gypsum specimens, revealing strong size effects on compressive strength and cracking patterns. Results demonstrate scale-dependent fracture behaviors bridging lab-to-field conditions, with cracking patterns at the field scale resembling those in highly brittle laboratory specimens. Wang et al. [
15] investigated bedded rocks with structural flaws under uniaxial compression, identifying nine crack types, including novel bedding-plane sliding/splitting. Results show bedding inclination critically controls fracture propagation, with steeper angles promoting tensile crack growth along bedding planes and inducing distinct failure mode transitions, providing new insights for slope stability prediction.
Recent advances in numerical modeling have significantly enhanced our understanding of size and defect effects in rock mechanics. Hu et al. [
16] established large-scale flawed rock models using PFC2D to investigate size and defect effects. Results reveal significant influences of length-diameter ratios and flaw positions on crack patterns and strength reduction, with defective specimens showing 5–15% lower strain energy and distinct fracture processes compared to intact rocks. Pan et al. [
17] investigated size effects on plastic concrete through uniaxial tests and PFC2D simulations. Results demonstrate that increasing height-width ratios (1–3) reduces peak stress by 15–30% and shifts failure modes from tensile-dominant to shear-dominant, with crack patterns transitioning from distributed vertical to localized oblique fractures. Chen et al. [
18] investigated size effects on brittle red sandstone through uniaxial compression tests. Results reveal that strength stabilizes at 75–81 MPa beyond critical size, with end effects significantly influencing small specimens. Rigid end pads enhance load capacity but reduce failure energy release, providing guidelines for laboratory-to-field parameter conversion. Tian et al. [
19] employed RFPA2D to investigate size effects on rock failure, analyzing five height-diameter ratios (1.0–3.0). Results demonstrate progressive failure mode transitions: from complex fractures at low ratios (1.0) to axial cleavage (1.5–2.0), pure shear (2.5), and combined axial/end failure at high ratios (3.0).
Acoustic emission monitoring has emerged as a powerful technique for characterizing rock damage processes. Jiang et al. [
20] investigated edge crack effects in rock using PFC2D simulations, revealing that crack length and position significantly influence specimen strength (15–30% reduction) and failure modes. Wei et al. [
21] developed an AE data-driven tensile crack model to predict rock failure, quantifying damage using sub-millimeter source radii. Liang et al. [
22] investigated rock damage processes under three stress paths using experimental and numerical methods. Results show AE event peaks coincide with stress peaks, with cyclic loading causing 40–60% more AE events than displacement-/stress-controlled methods. The study reveals stress-path-dependent fracture patterns and identifies distinct AE quiet periods preceding major crack formation. Song et al. [
23] analyzed granite AE signals under uniaxial compression, revealing loading-rate-dependent parameter correlations. Results demonstrate triangular AE count-duration distributions and quadratic energy-duration relationships, with distribution angles/curvatures varying systematically with loading rates. These characteristic patterns provide a new methodology for AE source identification in underground engineering stability monitoring. Wang et al. [
24] investigated three rock types under uniaxial compression, revealing distinct stress–strain responses and AE patterns. Sandstone showed the highest strength (35–45 MPa) with axial splitting, while coal exhibited shear failure, and mudstone displayed tension-shear fractures. AE energy surges correlated with load drops, and pre-failure AE quiet periods served as effective failure precursors. Wu et al. [
25] investigated muddy shale under triaxial compression (1–50 MPa), revealing linear strength-strain vs. confining pressure relationships.
This investigation employs the Rock Failure Process Analysis system (RFPA3D) to simulate uniaxial compressive failure in five distinct non-standard specimen configurations: (i) localized end surface warping, (ii) end surface inclination, (iii) central protrusion, (iv) eccentric protrusion, and (v) surface grooving. The numerical framework enables systematic analysis of failure mechanisms in geometrically irregular specimens, whereas synchronized acoustic emission monitoring provides quantitative insights into damage progression through characteristic pattern-correlated fracture development.
3. Analysis of Numerical Calculation Results
Numerical simulation results enabled comparative analyses including: failure mode and evolution under uniaxial compression for distinct irregular geometries: localized end-surface warping, inclination, central/eccentric protrusions, and grooving, the uniaxial compressive strength sensitivity to geometric deviation magnitudes across specimen groups, and acoustic emission (AE) response variations during failure, emphasizing energy accumulation, event frequency, and impact count characteristics. These analyses systematically quantified the detrimental effects of geometric imperfections on specimen integrity, with the strength reduction percentages across all defect types summarized in
Table 3. The results establish a clear hierarchy of defect severity: eccentric protrusions represent the most critical imperfection (75.0–83.0% strength reduction), followed by central protrusions (38.0–69.8% reduction), which exhibit strong height-dependent effects. Surface grooving induces moderate strength degradation (18.3–32.6%), while end-surface inclination (7.2–25.3%) and localized warping (1.6–8.8%) demonstrate considerably lower impact. This quantitative comparison provides crucial guidance for specimen preparation protocols, identifying protrusion-type defects as the paramount concern for quality control in rock testing laboratories.
3.1. Specimen Group with End-Surface Central Protrusions
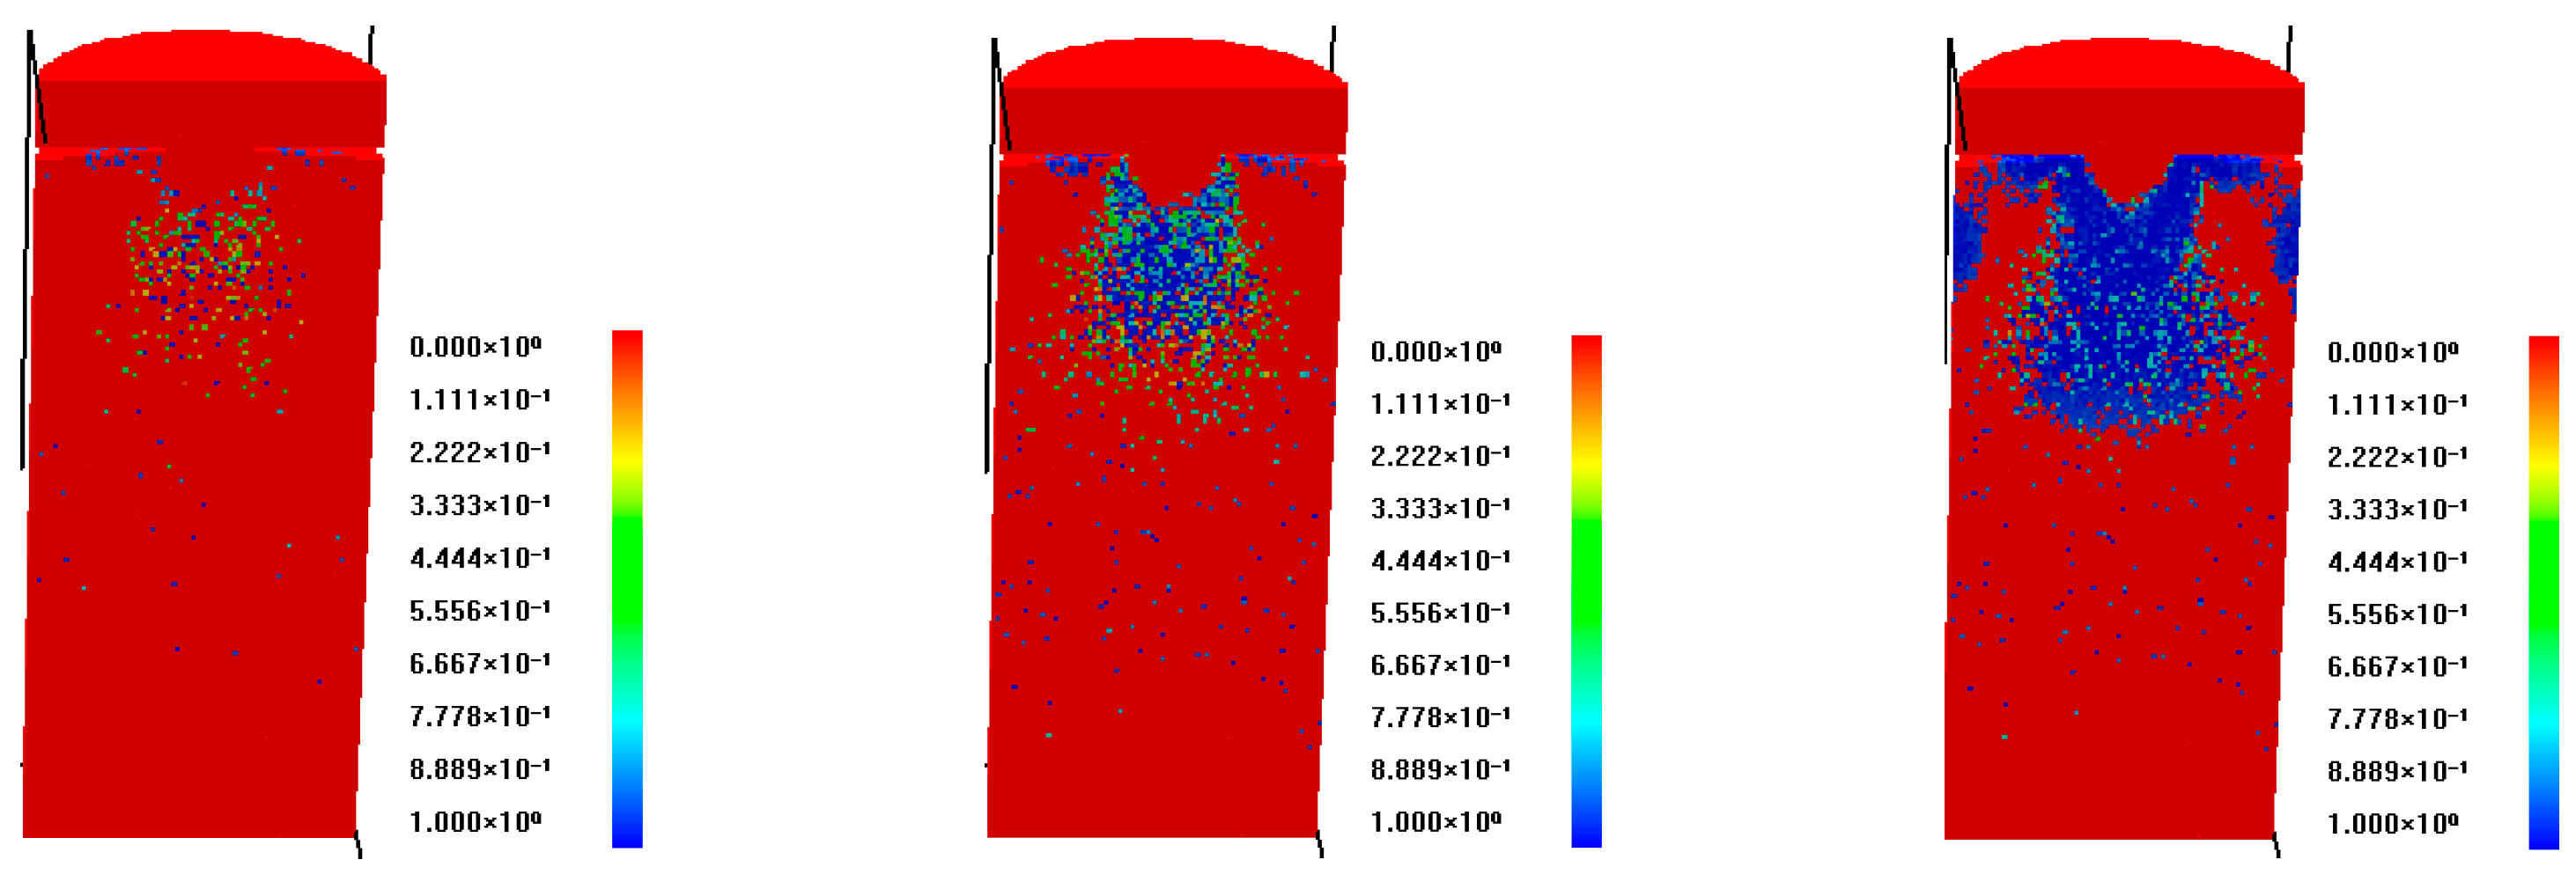
Analysis of the centrally protruded specimens based on the mesh failure evolution in
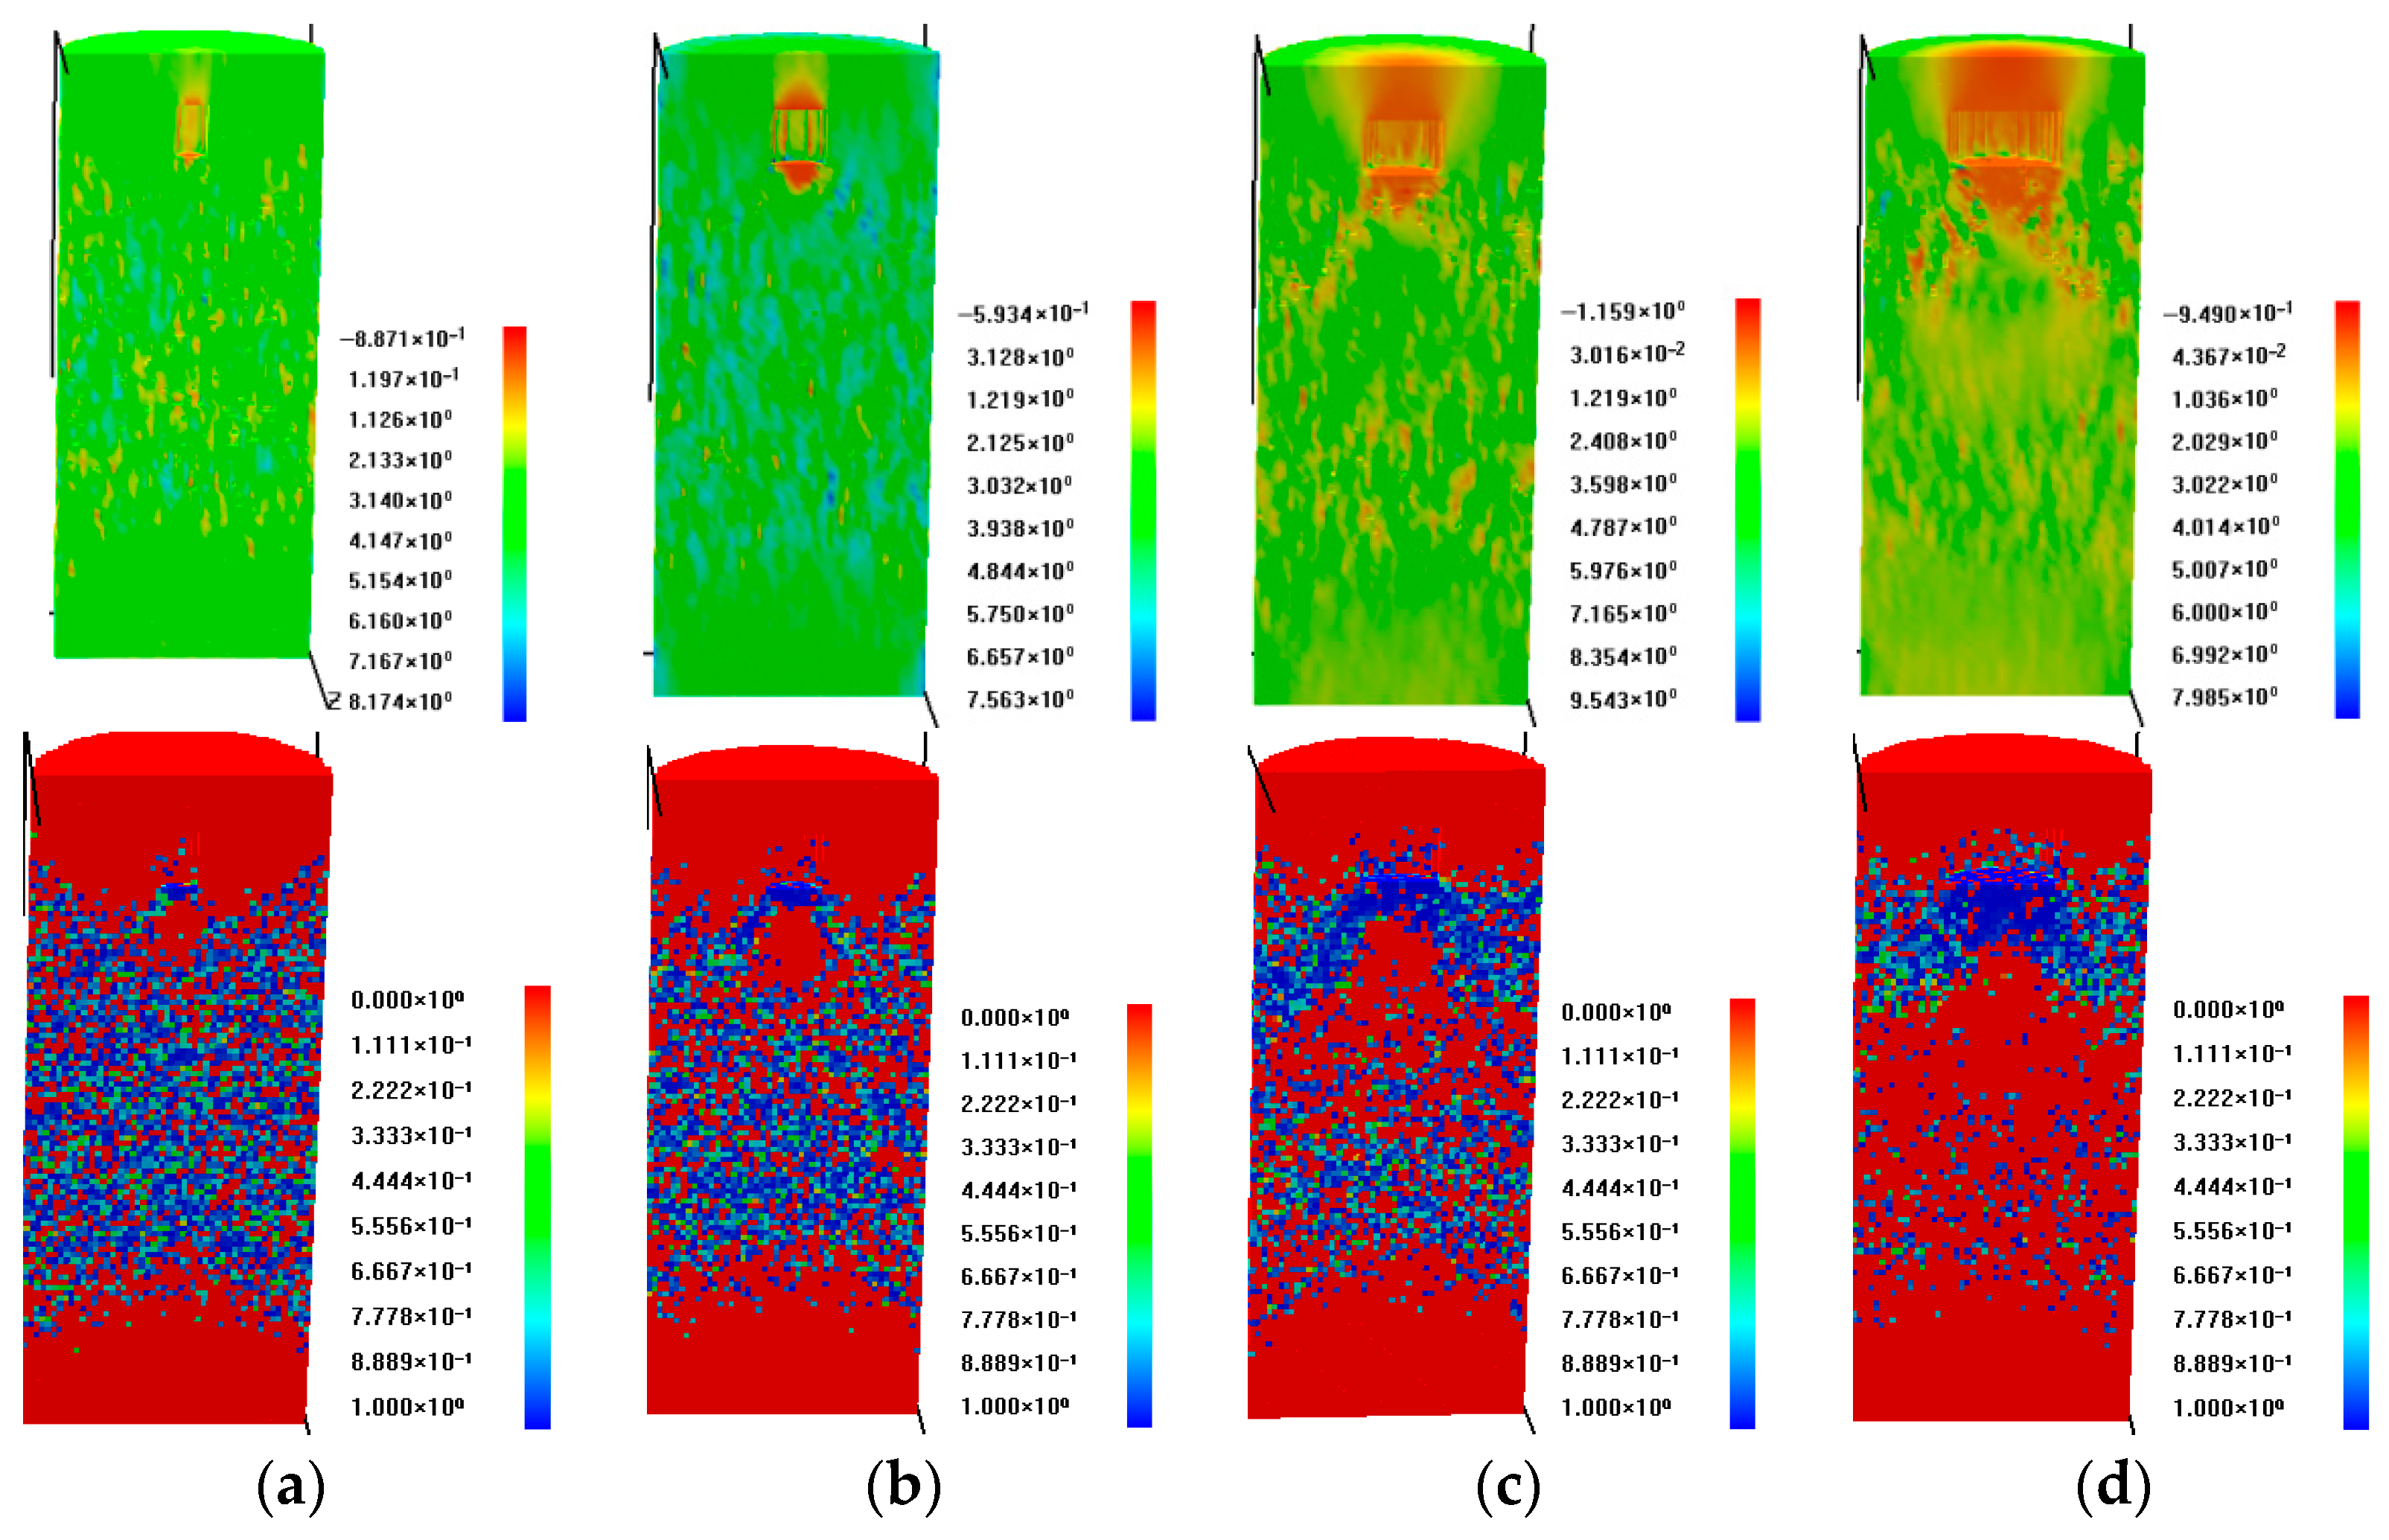
Figure 3 demonstrates the specimens’ characteristic failure modes under uniaxial compression, with initial cracking originating directly beneath the protrusion. With increasing load, cracks propagate predominantly beneath the protrusion, forming a distinct V-shaped distribution. The downward-extending cracks progressively envelop the protrusion, creating an ‘embedded’ effect within the specimen. During final loading stages, these cracks coalesce into throughgoing fractures, culminating in specimen instability. Key observations: The protrusion is encircled by propagating cracks during failure. Cross-section analysis reveals an intact ‘dense core’ within the protrusion, exhibiting neither macroscopic fractures nor visible damage. Stress distribution analysis reveals significantly elevated stress levels within the dense core compared to adjacent damaged zones. This results from triaxial compressive stresses induced by three-dimensional constraints: confinement from the surrounding rock matrix and loading from the upper rigid platen. Despite high stress magnitudes, these constraints prevent core failure. The core acts as a load-transfer mechanism, transmitting stresses downward and driving tensile splitting failure in the underlying rock matrix. The peak strength data for these specimens are detailed in
Table 4.
Analysis of the protruded specimen reveals progressive axial compressive stress accumulation within the contact zone and dense core during loading. A tensile stress concentration zone develops beneath the dense core, extending longitudinally to initiate wing-shaped cracks. Symmetrically distributed crack initiation stresses occur throughout the loading process. The specific loading steps and corresponding displacements are detailed in
Table 5.
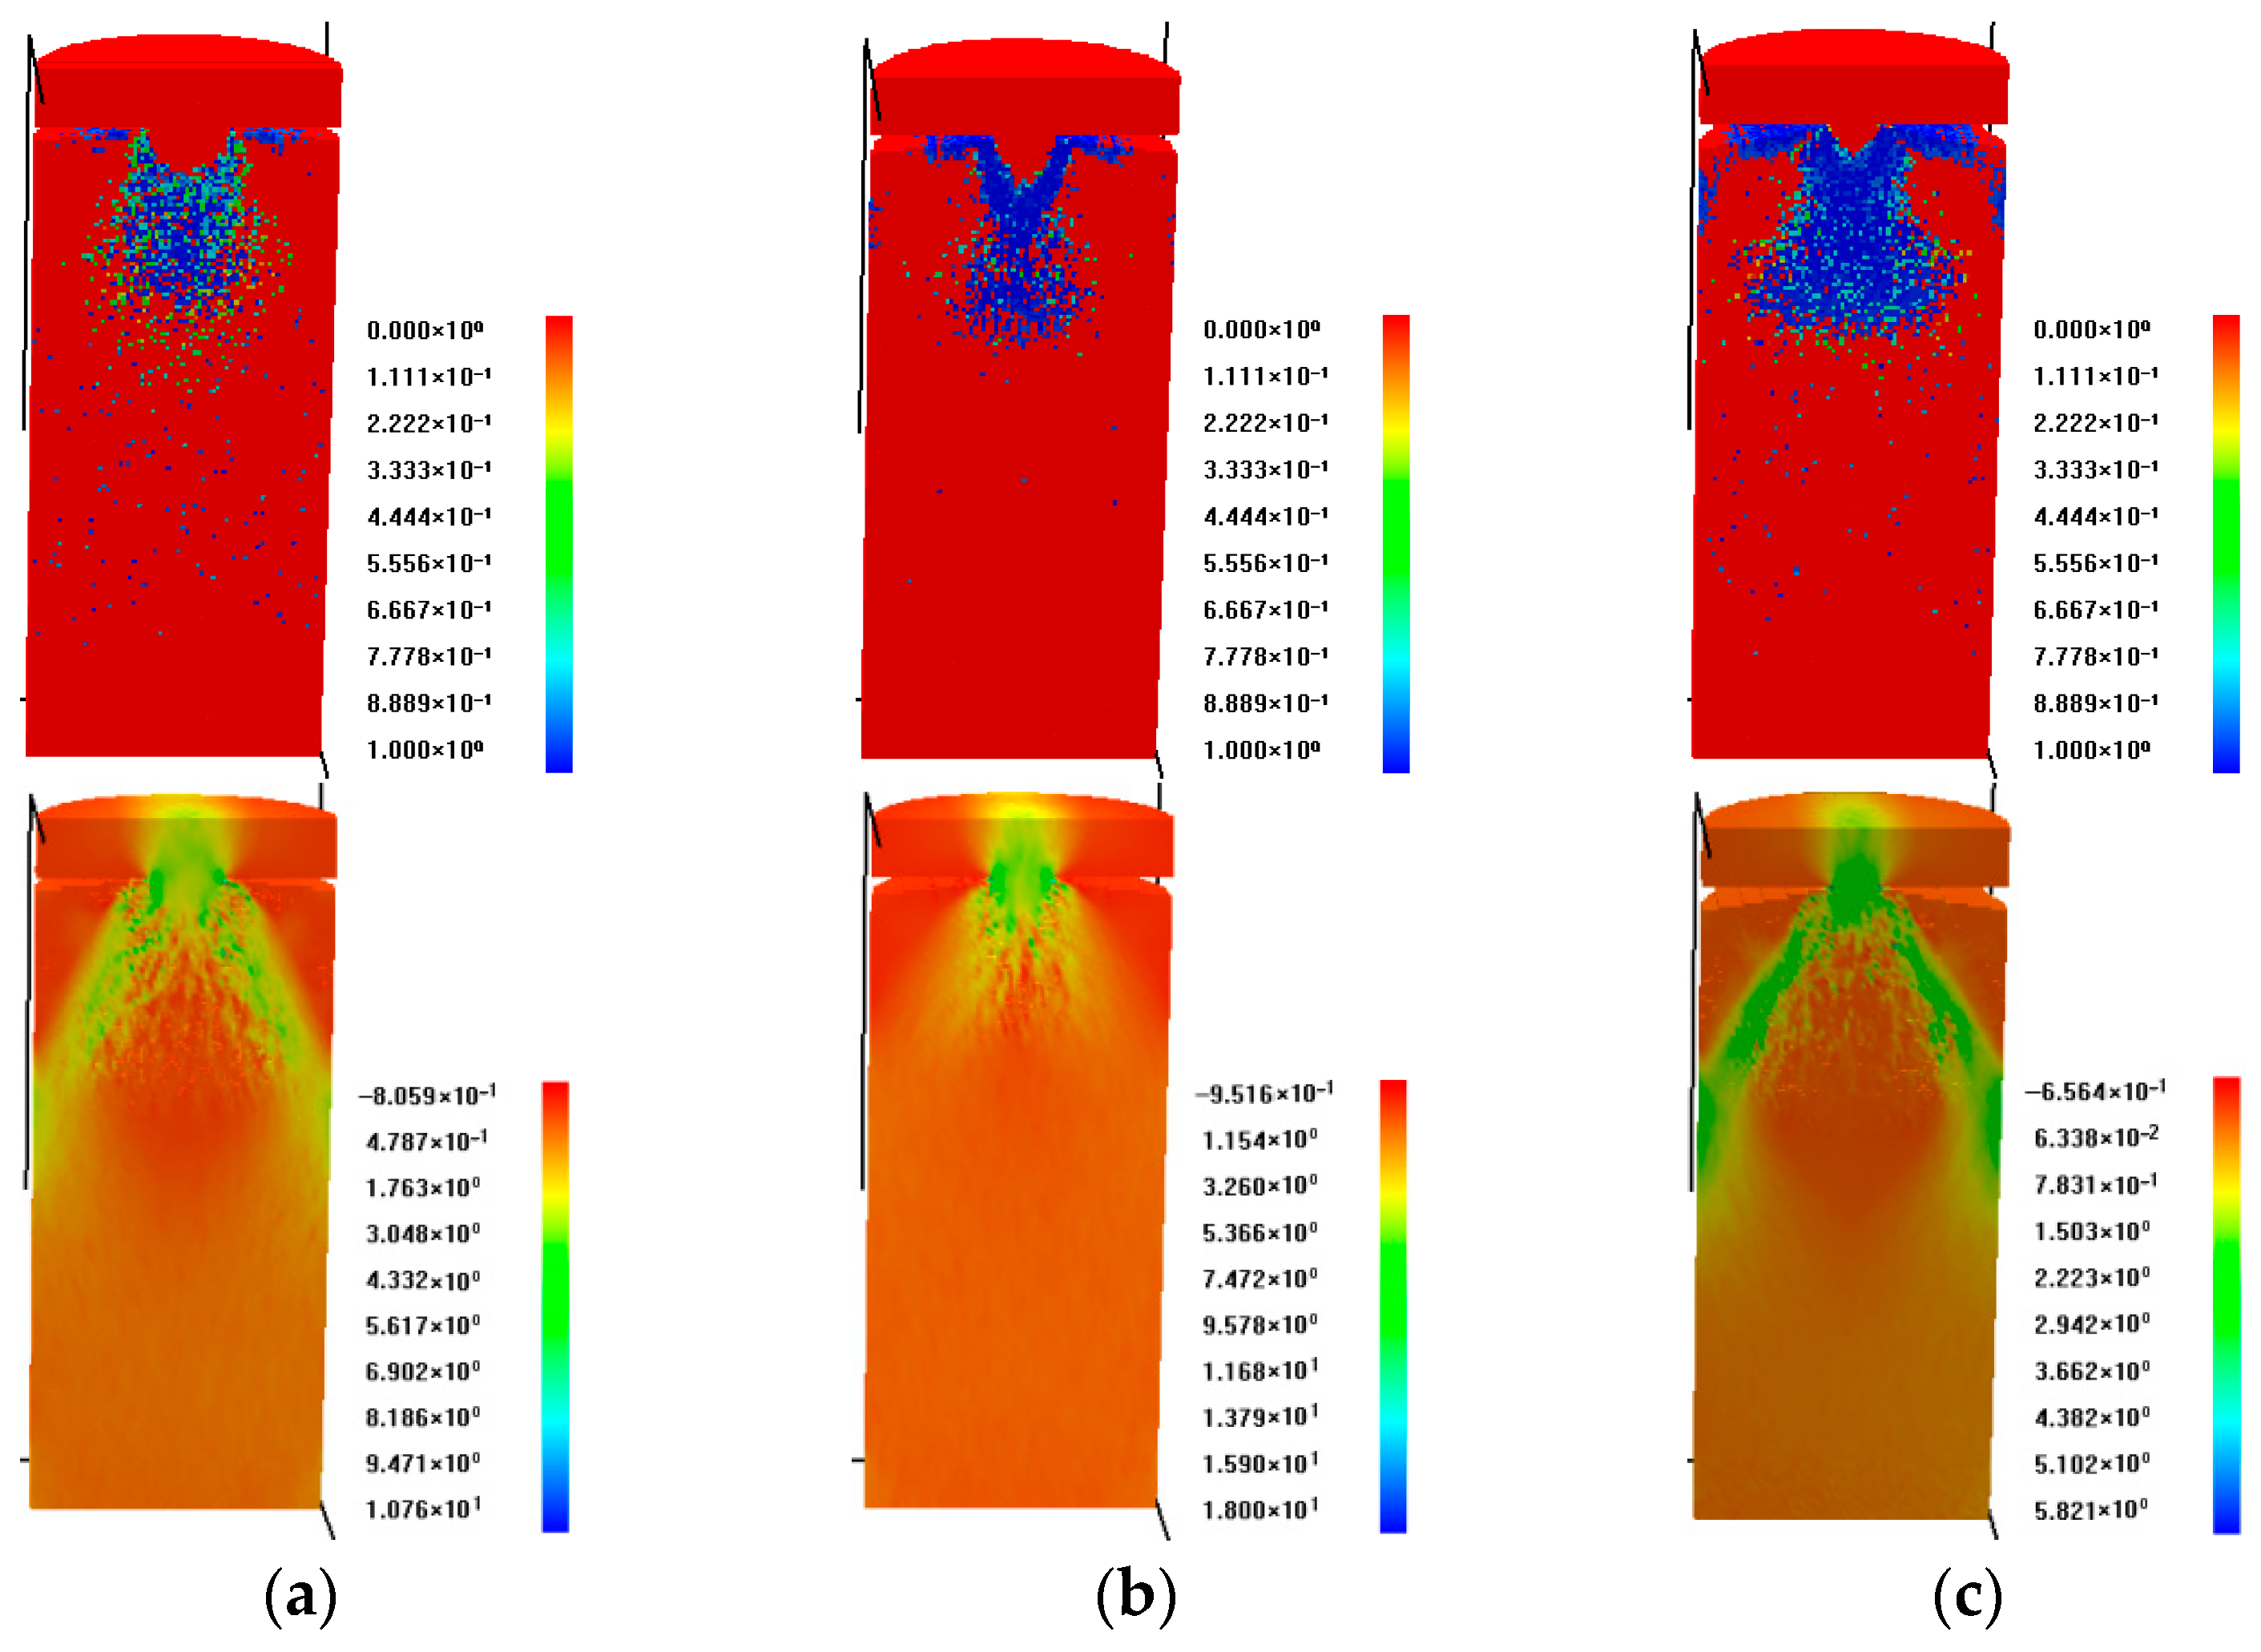
Comparative analysis of specimens with varying protrusion heights reveals distinct failure mechanisms (
Figure 4). Lower protrusion heights generate more extensive crushing zones at the specimen top surface, whereas higher protrusion heights reduce the crushing zone extent and enhance wedging behavior. Notably, specimens with greater protrusion heights develop sharply defined embedded bodies during compressive failure. Mechanical analysis demonstrates that these embedded bodies function as wedges penetrating the underlying specimen matrix, primarily inducing top-section splitting failure. This splitting process is characterized by two dominant slip planes propagating diagonally downward along the specimen sides.
The acoustic emission (AE) activity exhibits distinct phase characteristics during progressive loading. Initial AE events concentrate exclusively beneath the protrusion, which correlates precisely with the first crack initiation zone identified in
Figure 3. Subsequent material degradation in weaker layers (characterized by reduced strength and elastic modulus) generates sporadic AE signals until critical stress accumulation triggers macroscopic fracture, as evidenced by the first prominent stress drop on the stress–strain curve. Continued crack propagation generates intense AE activity within the fracture process zone. Notably, the specimen retains residual load-bearing capacity despite substantial crack development originating from the protrusion region.
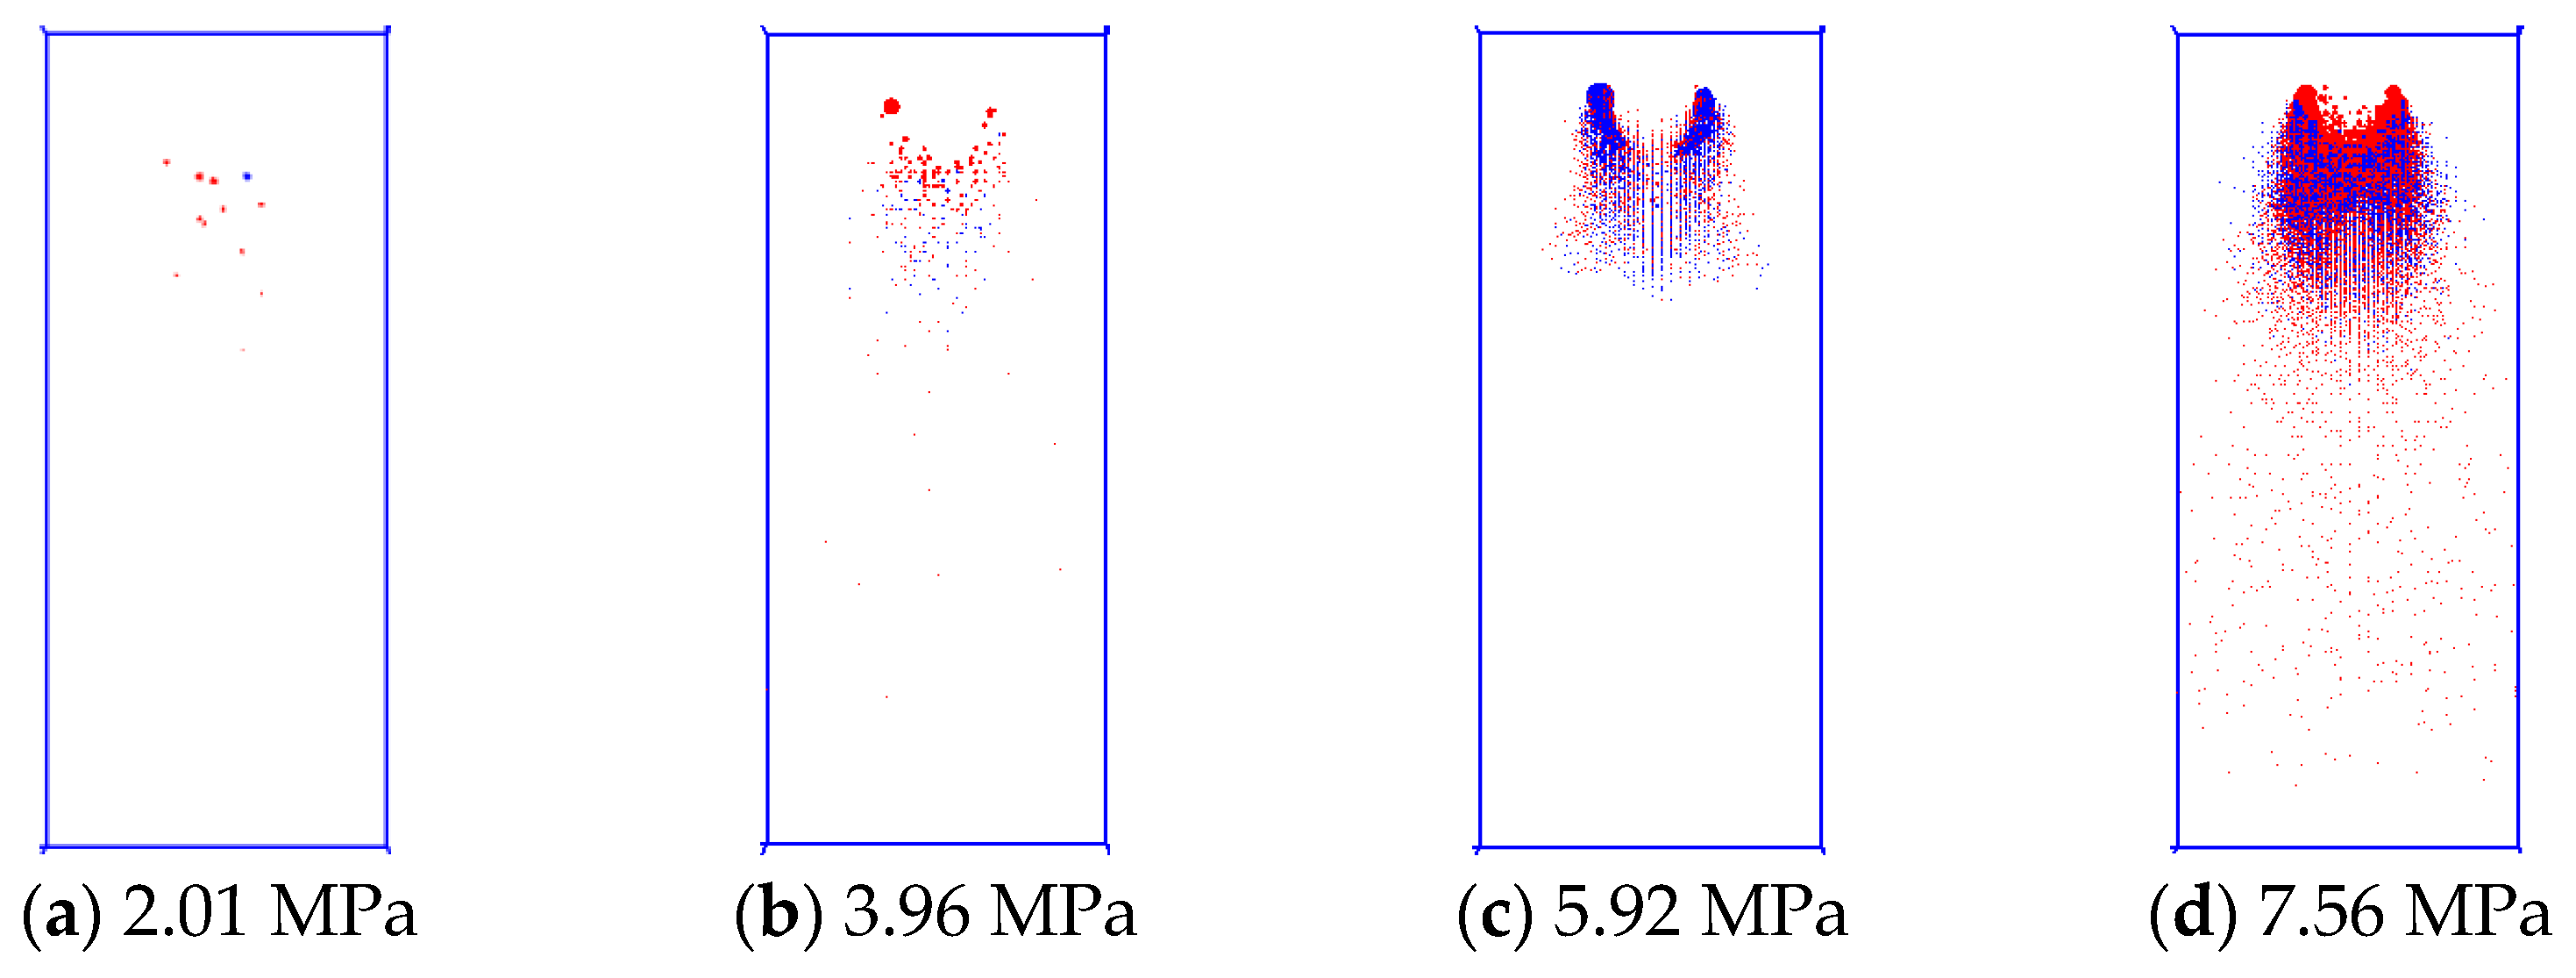
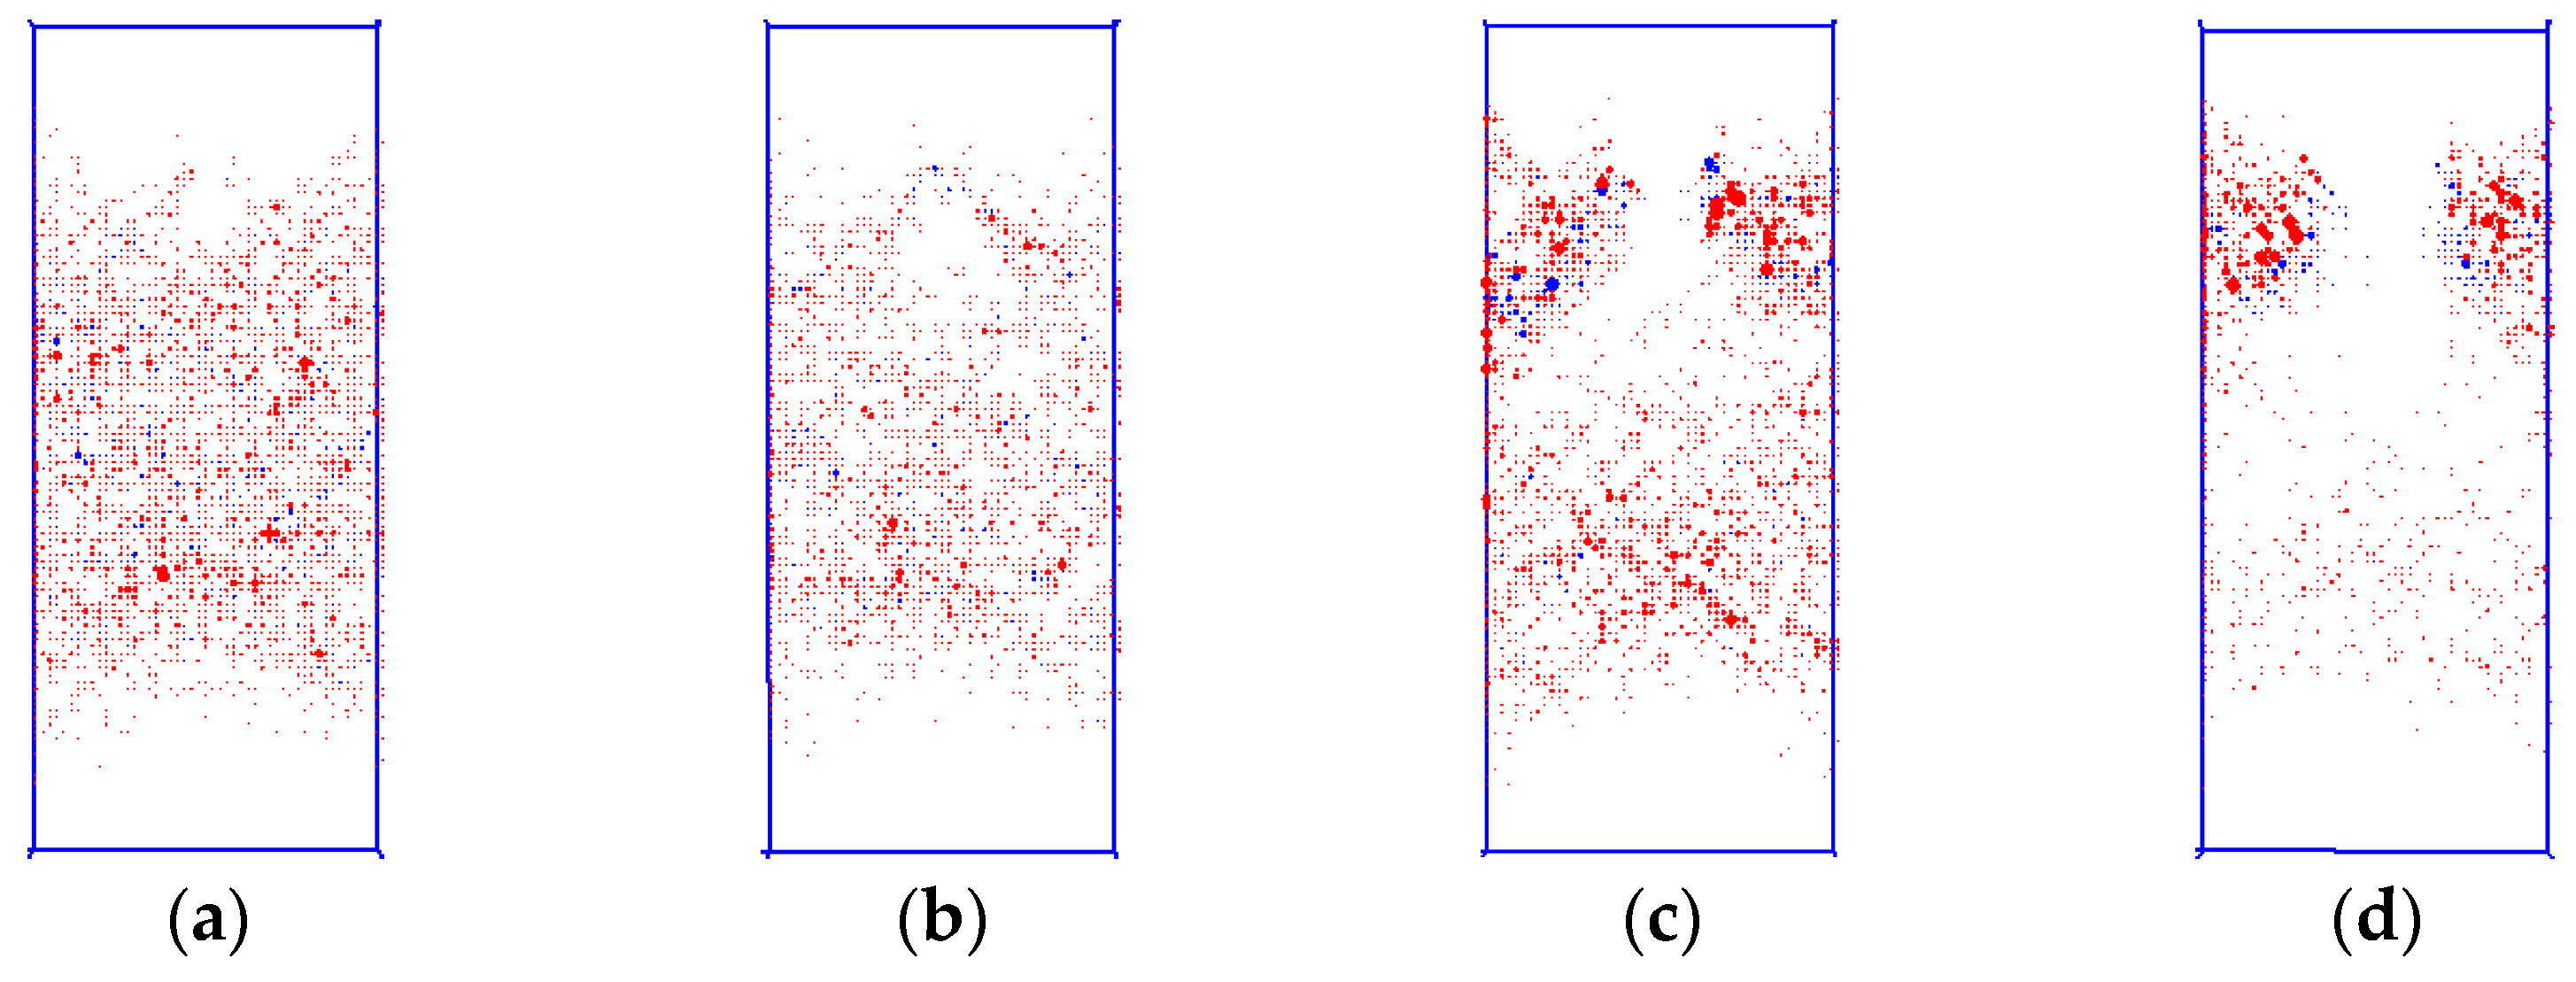
Initial AE events emerge predominantly in the lower protruding section at limited frequencies. Subsequent AE activity maintains strong spatial coherence, concentrating around the initial nucleation zone. The AE spatial distribution, as evidenced in
Figure 5, clearly demonstrates concentrated shear failure along the lower boundary of the dense core in centrally protruded specimens. This shear failure arises from relative displacement along two major slip planes propagating downward from the protrusion. Beneath this shear-dominated zone, the failure mechanism transitions to a mixed shear-tensile mode, caused by the downward wedging action of the high-stress dense core. This persistent wedging generates intense splitting forces within the underlying rock matrix, ultimately controlling the specimen’s global failure behavior.
3.2. Specimen Group with End-Surface Eccentric Protrusions
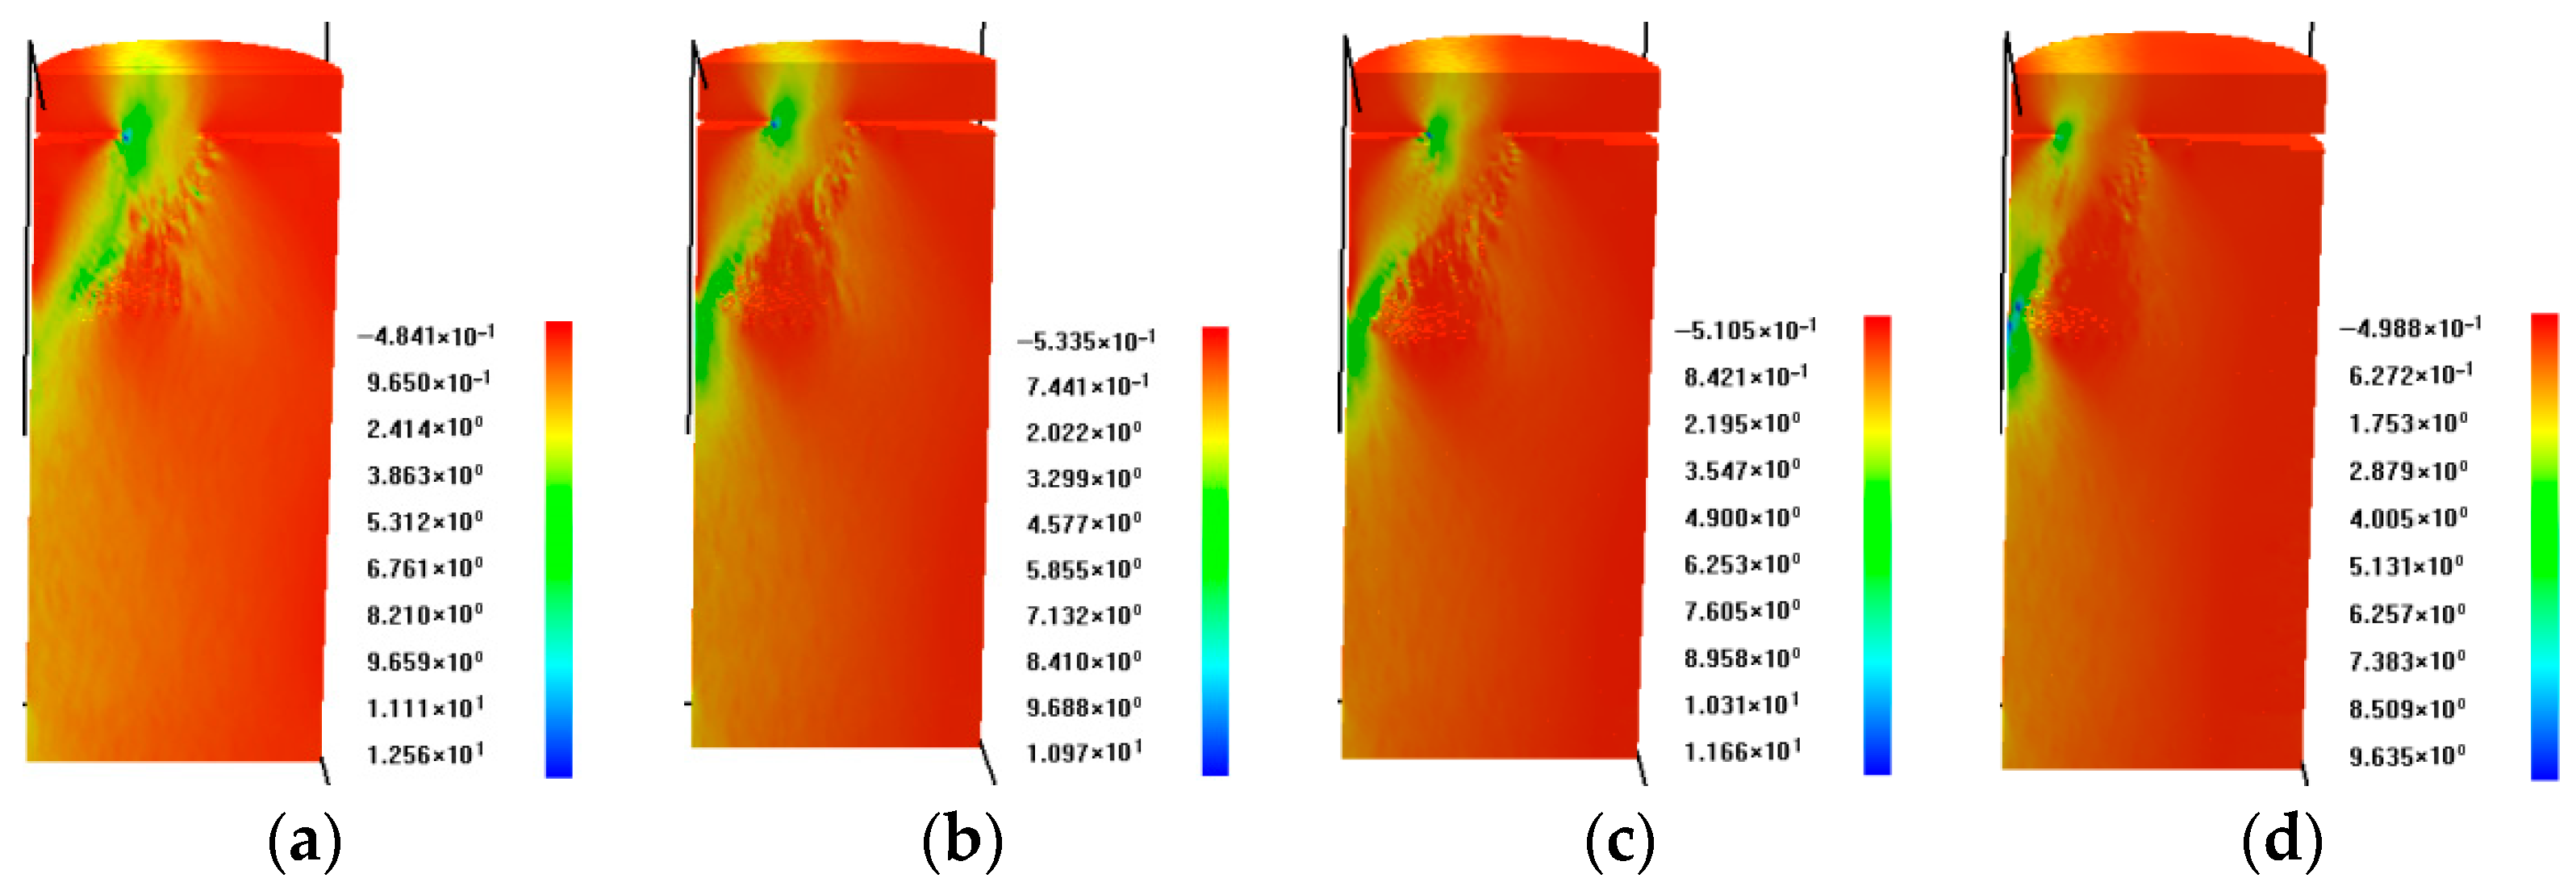
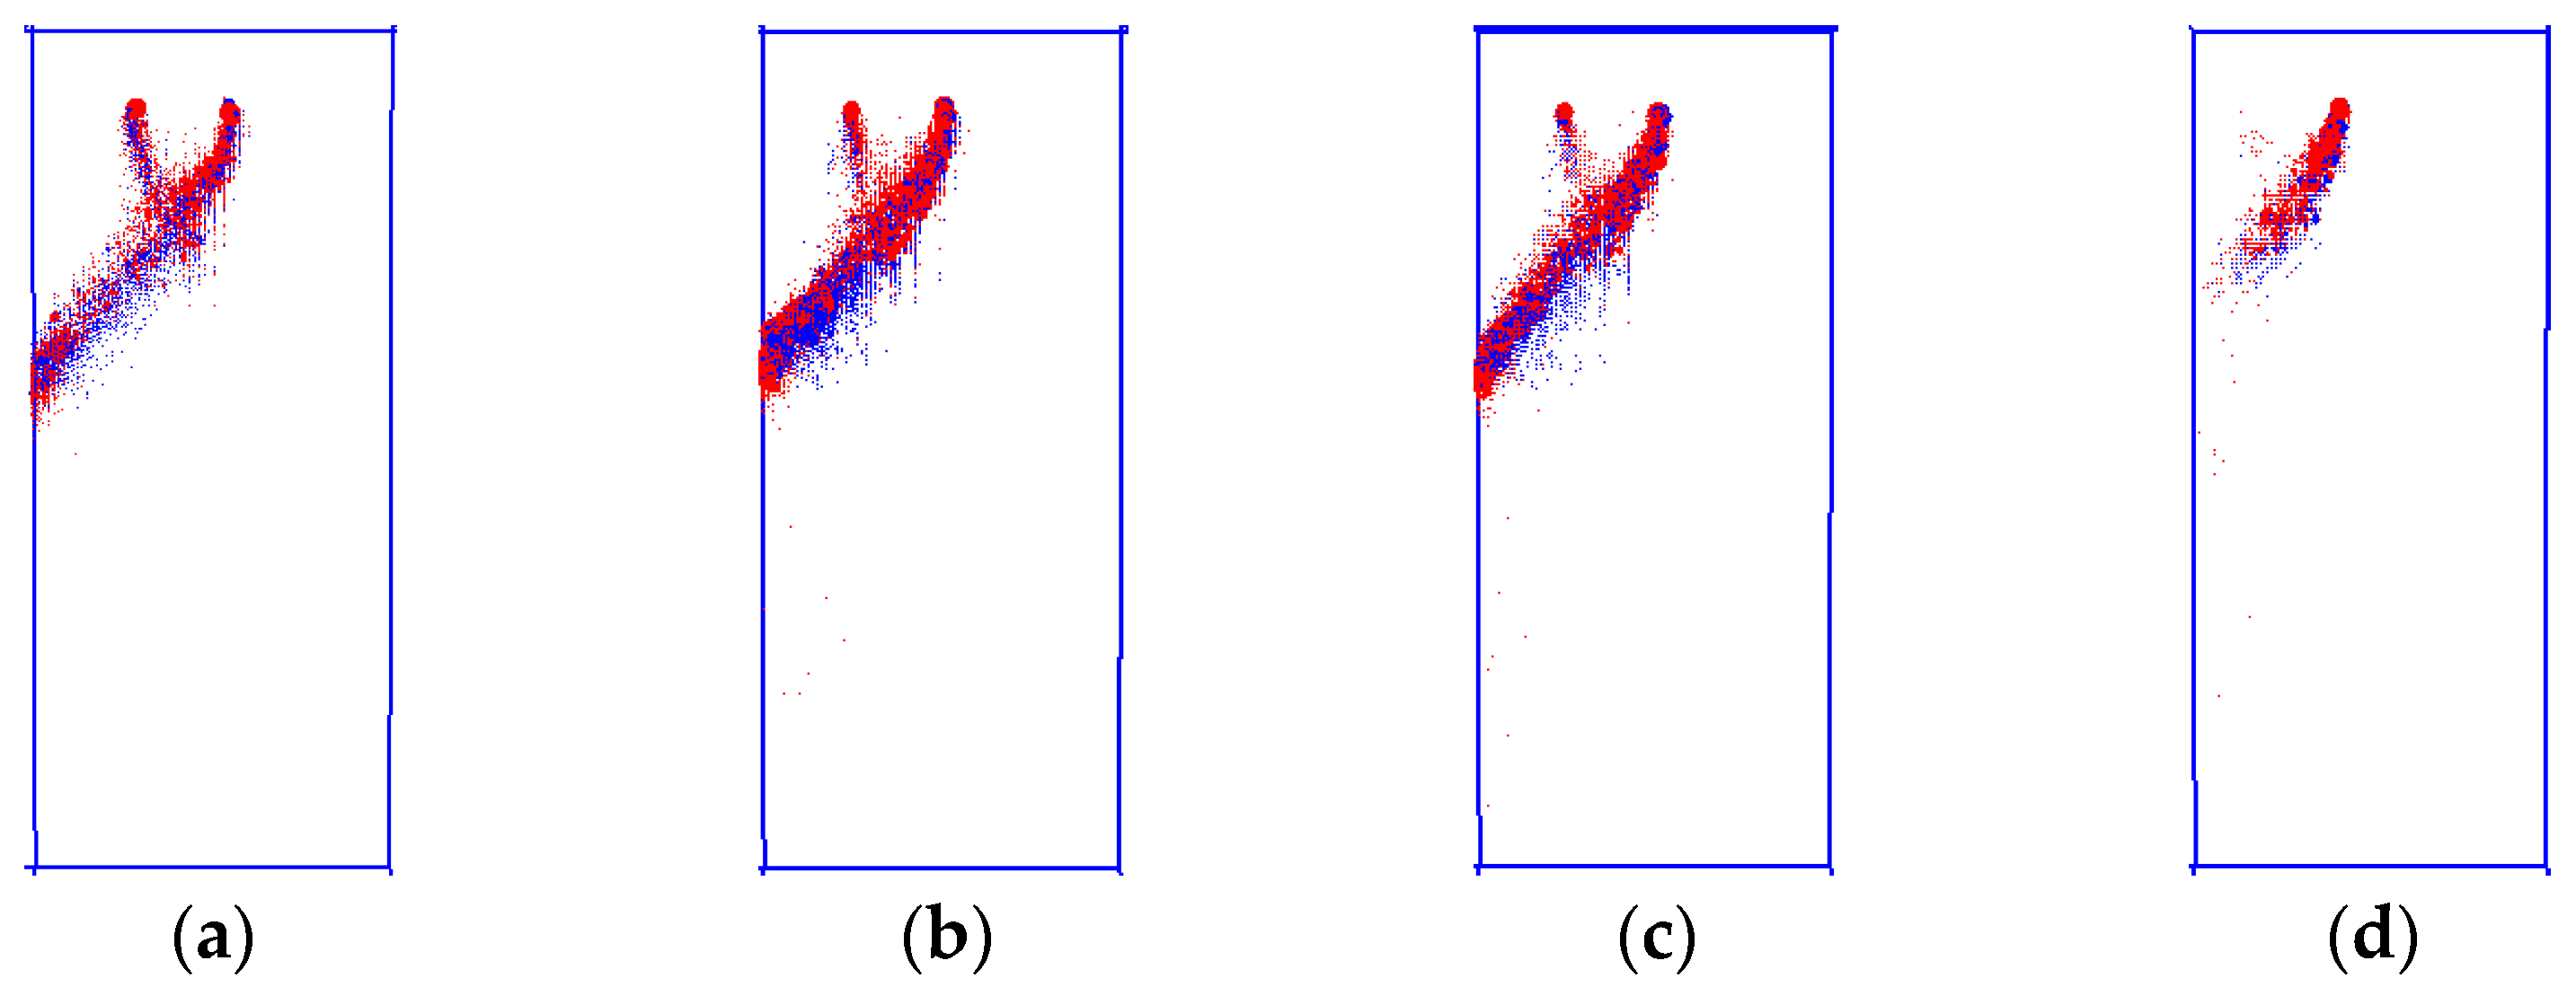
Analysis of the eccentric protrusion specimen failure mode reveals a distinct progression (
Figure 6 and
Figure 7). Initial crack formation initiates preferentially along the eccentric side beneath the protrusion. With increasing load, these cracks propagate diagonally from the upper region of the protrusion near the specimen center toward the lower section, maintaining an eccentric orientation. Continued crack development generates a characteristic y-shaped pattern radiating from the specimen’s central zone toward the eccentric side. The contact interface between the loading platen and specimen also forms a dense core that penetrates downward. Comparative evaluation of varying eccentricity conditions demonstrates that greater eccentricity magnitudes produce more pronounced slip planes with marked displacement from the protrusion toward the eccentric side. Notably, specimens with high eccentricity experience localized failure confined to the protrusion region, with significantly reduced failure zones compared to low eccentricity specimens.
The failure behavior of eccentrically protruded specimens demonstrates distinct asymmetry compared to centrally protruded counterparts, with fracture preferentially localizing along the protruded side. This asymmetric response is characterized by a predominant shear-sliding mechanism developing in the eccentric direction. Mechanical analysis confirms that while all protruded specimens exhibit reduced uniaxial compressive strength, eccentric protrusions induce under equivalent loading conditions more substantial strength degradation than central protrusions. Numerical simulations reveal significant reductions in uniaxial compressive strength for protruded specimens compared to intact specimens, with eccentric protrusions showing more pronounced weakening than central protrusions. As quantified in
Table 6, progressive eccentricity intensifies this strength degradation: specimens with 5 mm, 7 mm, 10 mm, and 15 mm eccentric protrusions demonstrate peak strengths of 25%, 21.8%, 22.6%, and 17% relative to central protrusion specimens, respectively. This establishes a clear inverse relationship between protrusion eccentricity and specimen strength. The peak strength data for these specimens are detailed in
Table 6.
The acoustic emission (AE) characteristics reveal that initial loading induces AE events preferentially along the eccentric edge of protruded specimens, which exhibit angular spatial distribution (
Figure 8). These initial AE locations exhibit a strong correlation with subsequent fracture surfaces observed in failure mode analysis. Comparative analysis demonstrates that specimens with minor eccentricity develop failure along two discrete fracture planes, with AE event distributions demonstrating consistent spatial alignment with eventual failure surfaces. Fracture analysis demonstrates that the outer failure surface terminates upon intersection with the inner surface, confirming that the primary failure path develops along the central edge of protrusion. This dominant fracture surface controls specimen failure through progressive sliding of the protruded section. For specimens with greater eccentricity, global sliding occurs along a well-defined shear plane, indicating that increased eccentricity transforms the failure mechanism to protrusion-dominated shear under uniaxial compression. This mechanistic transition leads to significantly reduced compressive strength.
3.3. Specimen Group with End-Surface Inclination
The inclined specimens in this study exhibit a specific geometric deviation featuring parallel end surfaces with non-perpendicular sidewalls, resulting in axial misalignment that deviates from standard perpendicularity requirements. Under uniaxial compression, the loading configuration ensures full contact between the rigid platen and inclined specimen surface, which accurately replicates experimental press conditions for non-standard specimens.
The failure characteristics of inclined specimens exhibit distinct differences from convex specimens through simulation analysis. As evidenced in
Figure 9c,d, crack initiation preferentially initiates at the base of the inclined surface during initial loading. Progressive loading induces crack propagation, ultimately developing into an interconnected plastic failure zone along the inclined lower region of the specimen. Cross-sectional analysis demonstrates distinct failure patterns on opposing specimen surfaces. The inclined side shows severe basal crushing with localized fragmentation, while the opposing surface develops a more extensive but less severe failure zone. This asymmetric damage distribution stems from progressive load redistribution: initial failure at the inclined base reduces local load-bearing capacity, which transfers greater stresses to the opposing side. Subsequent crack propagation and coalescence under these elevated stresses ultimately induce specimen failure.
Acoustic emission (AE) analysis demonstrates distinct spatial-temporal damage progression during loading. Initial AE events nucleate preferentially in the lower right region of the inclined specimen, with increasing event frequency, which indicates progressive microstructural damage. Subsequent loading stages exhibit AE concentration in bilateral lower regions, but with greater spatial distribution on the right side. Correlated with failure morphology, this AE pattern demonstrates initial right-side crack formation followed by progressive transverse crack coalescence, ultimately controlling specimen failure.
3.4. Specimen Group with End-Surface Localized Warping
The numerical simulation incorporates two distinct specimen configurations to investigate local warping effects: the specimen base maintains full contact with the testing machine support while the warped top surface undergoes eccentric compression. The support base is adjusted to align the warped top surface with the loading platen, resulting in inclined specimen orientation. The adopted simulation methodology employs vertical specimen placement with an interfacial compensator installed at the warped top surface to optimize platen-specimen contact. Both configurations exert a significant influence on deformation and failure characteristics.
Analysis of the failure process in locally warped specimens demonstrates concentrated stress accumulation within the warped region, as demonstrated in
Figure 10. The failure progression, as shown in
Figure 11a–c, initiates with crack formation in the warped zone during initial loading. Subsequent loading causes localized crack propagation that remains constrained to the geometrically distorted section, ultimately resulting in preferential failure in this region.
Acoustic emission (AE) monitoring demonstrates that the warped region shows initial AE activity during loading, followed by rapid event accumulation. These emissions demonstrate distinct spatial alignment along the upper-right to lower-left orientation of the warped section, which confirms localized failure initiation and progression. The resultant failure mechanism features crushing-induced formation of a discrete slip plane within the deformed zone, along which ultimate specimen failure occurs.
3.5. Specimen Group with End-Surface Groove
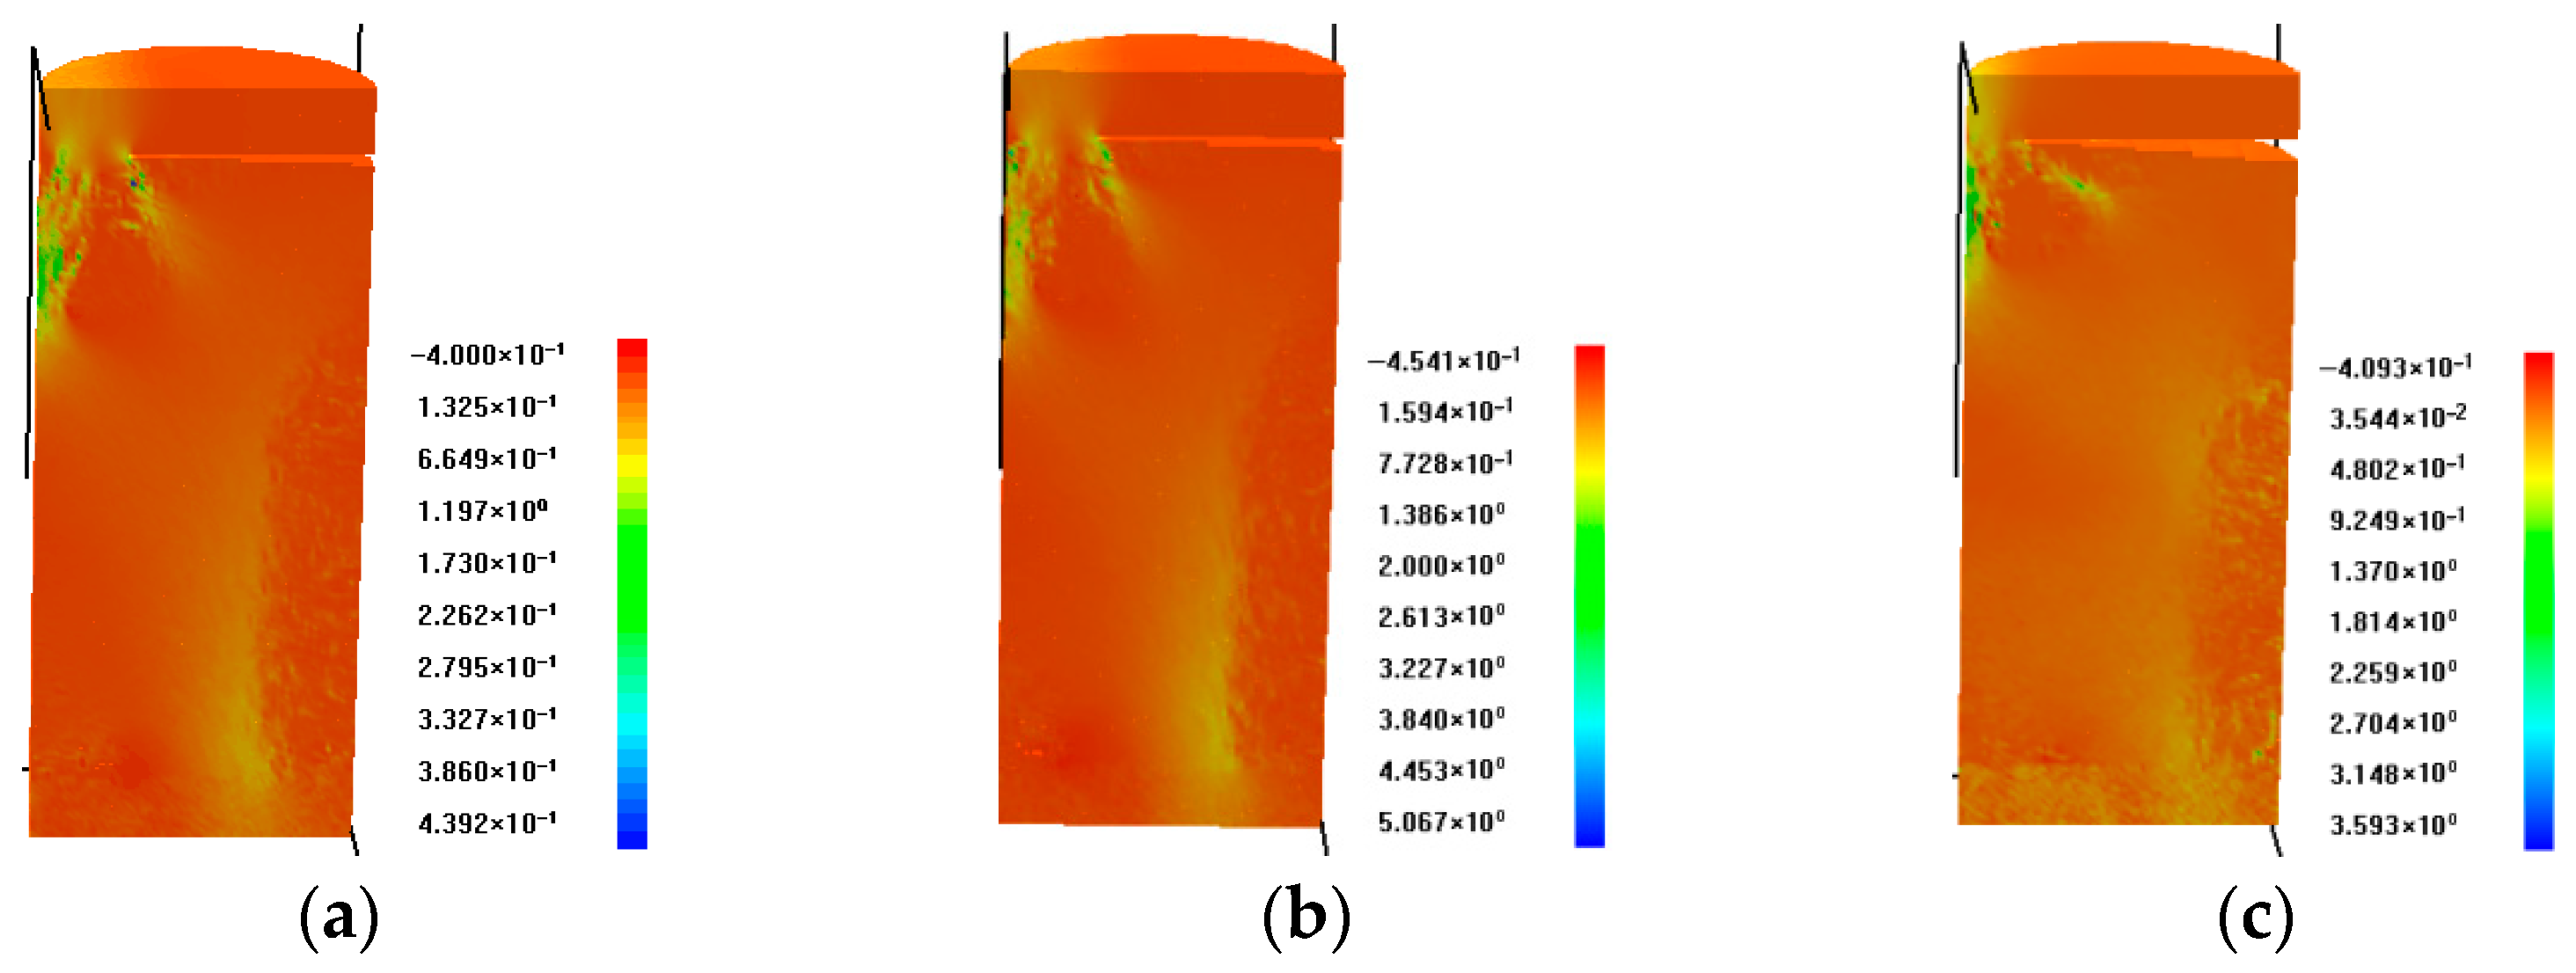
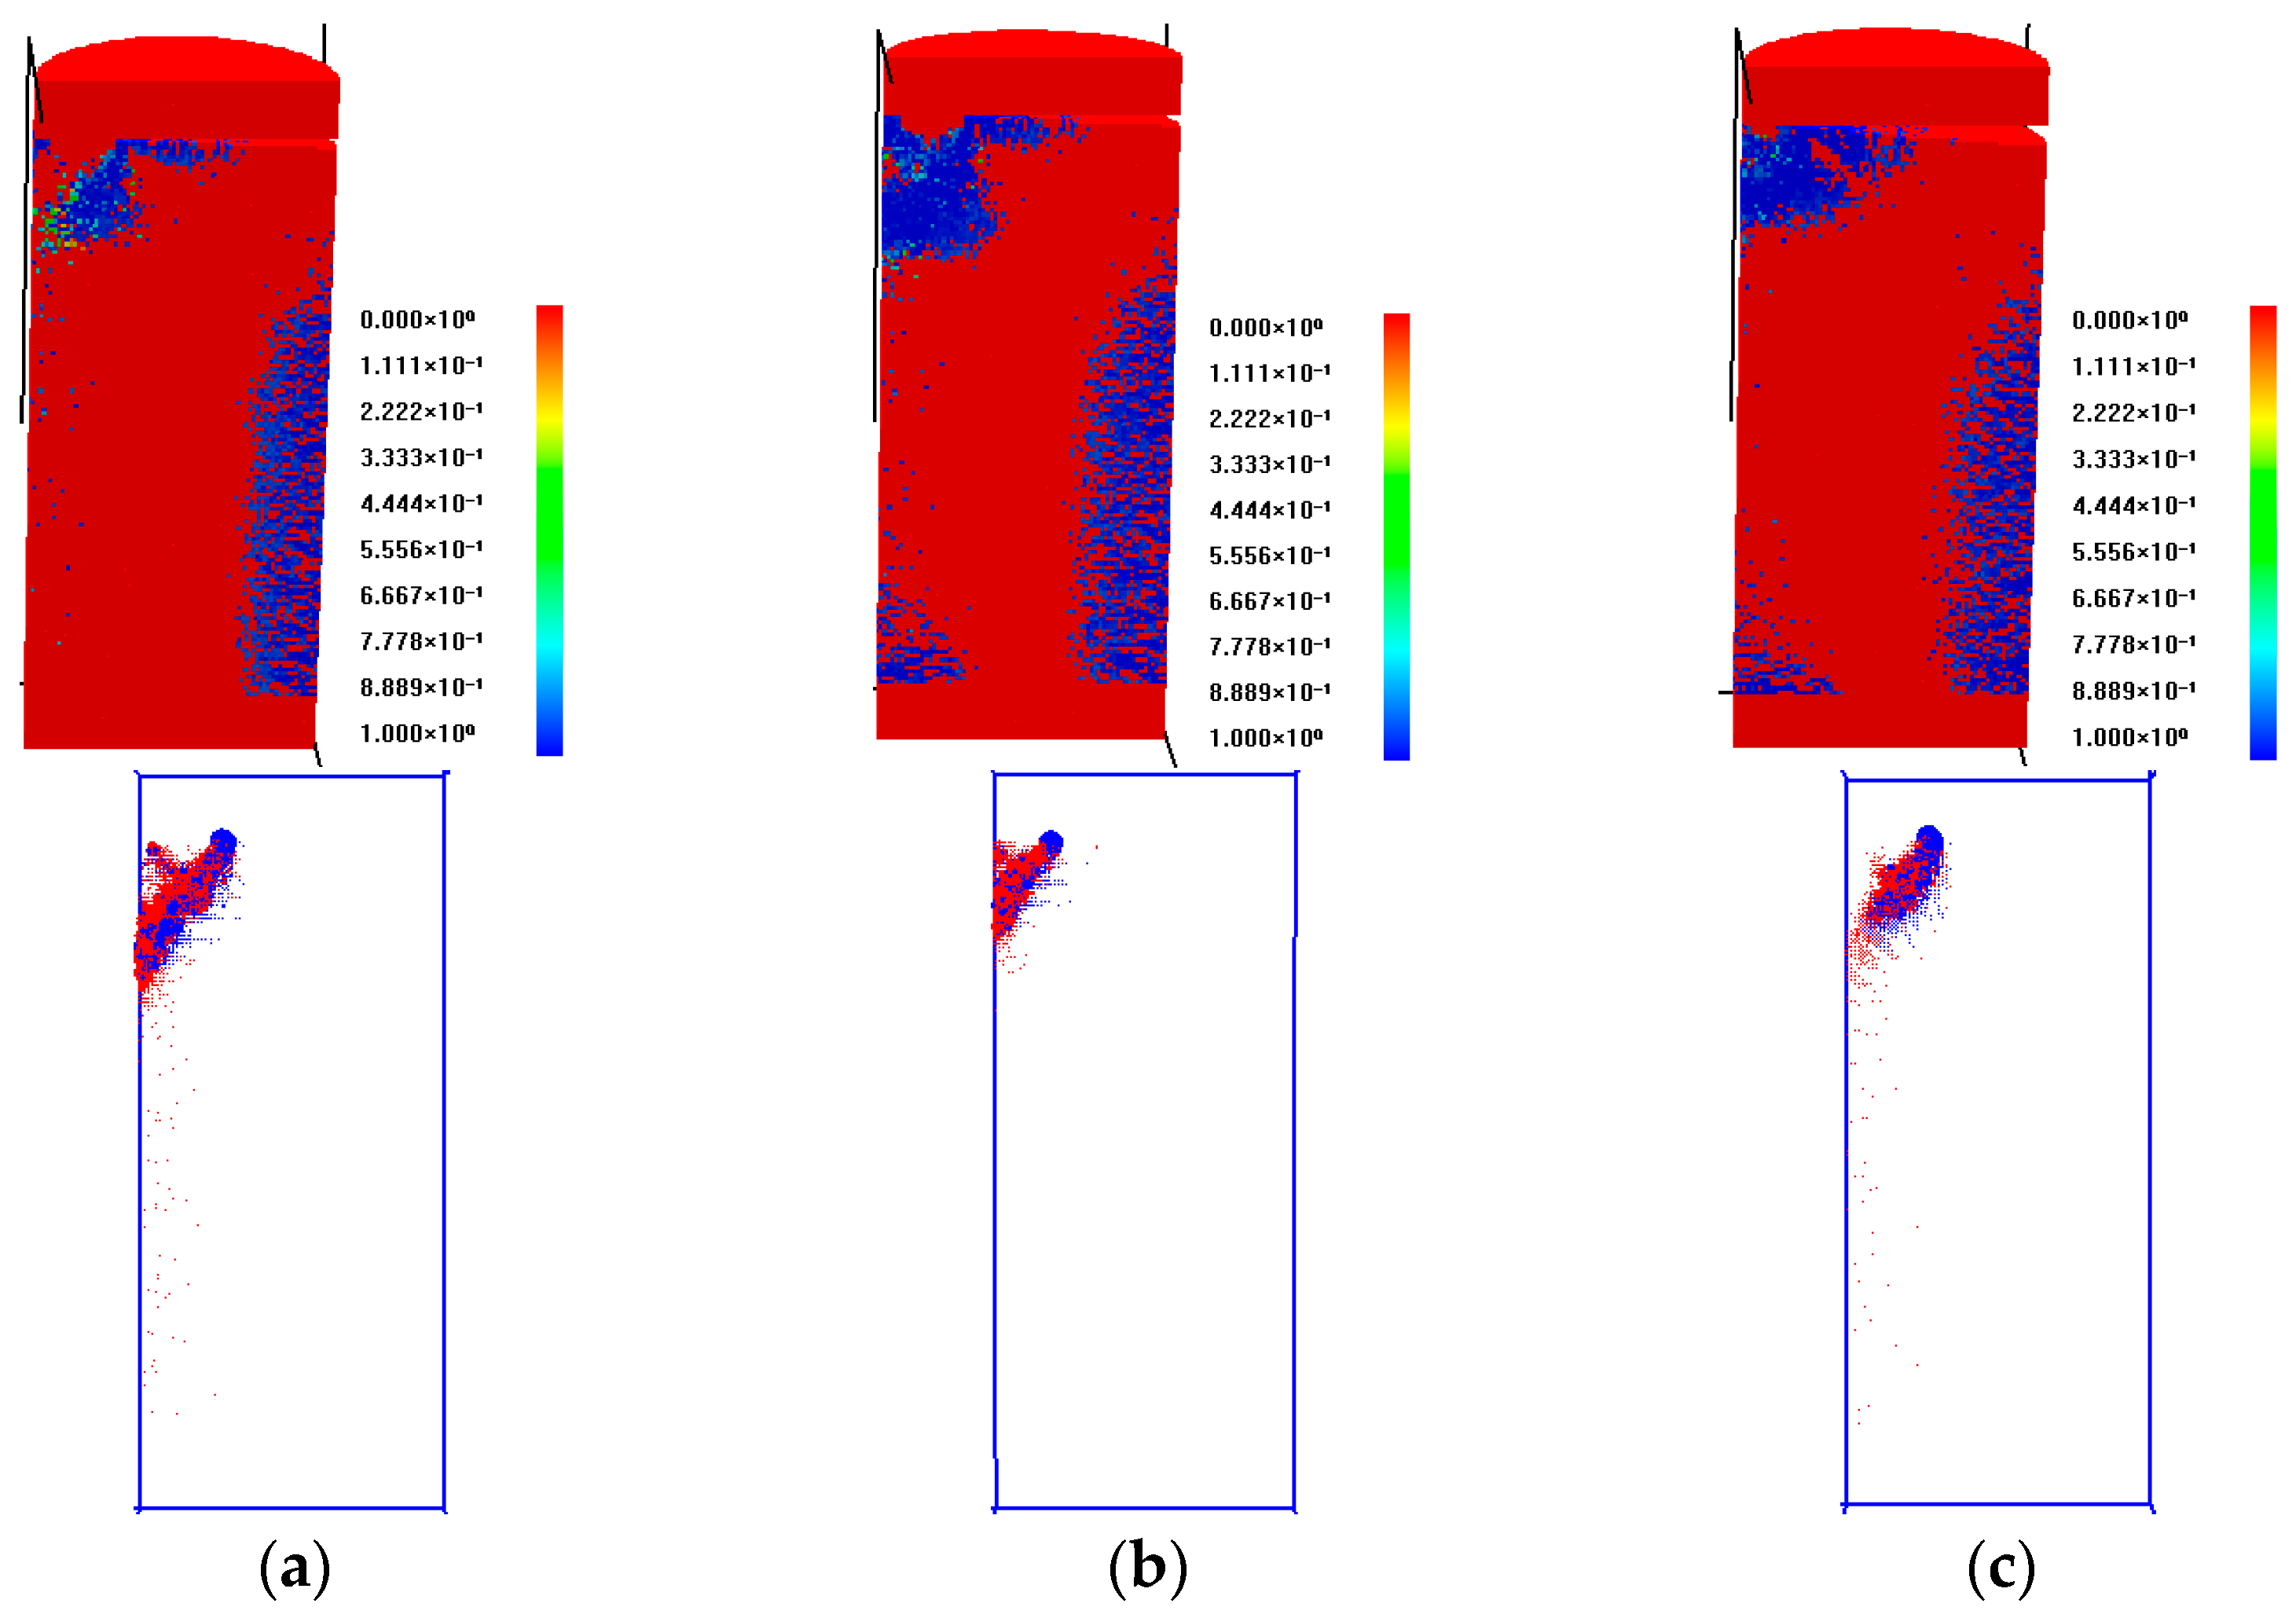
Numerical simulations of grooved specimens show that reduced groove diameters promote more uniform stress distributions during loading, with failure modes similar to intact specimens, as evidenced in
Figure 12. For specimens with larger groove diameters (e.g., 15 mm), cross-sectional analysis identifies distinct failure mechanisms. The unsupported lower groove surface exhibits reduced stress transmission due to the lack of overlying rock confinement, while significant stress concentrations develop at the groove corners. Progressive loading leads to the formation of an inclined shear plane, which ultimately controls specimen failure during final loading stages. The peak strength data for these specimens are detailed in
Table 7.
Acoustic emission (AE) analysis reveals diameter-dependent damage characteristics in grooved specimens. Smaller grooves produce uniform AE distributions comparable to intact specimens, while larger grooves induce localized damage patterns (
Figure 13). As illustrated in
Figure 12a,b, the characteristic conical AE-quiet zone at the specimen base matches undamaged compression zones from end effects. In contrast, the grooved upper section lacks this compression zone, exhibiting damage-related AE activity as shown in
Figure 12a,b. Comparative analysis demonstrates significant failure mode transitions with increasing groove diameter (
Figure 12). While smaller grooves maintain relatively uniform failure, larger grooves promote edge-localized damage with inclined slip surfaces propagating bilaterally from groove boundaries, ultimately governing specimen failure. Distinct failure mechanisms are correlated with groove diameter variations. Specimens with smaller grooves demonstrate combined shear and tensile failure modes, while larger grooves induce localized failure concentrated around the groove periphery. Near-field failure adjacent to larger grooves is predominantly tensile, transitioning to shear failure in far-field regions. These AE patterns match observed failure morphologies, where larger-groove specimens develop distinct slip planes along groove edges, accompanied by crushing of underlying rock material. The comprehensive evaluation demonstrates that increasing groove diameter fundamentally alters failure progression: smaller diameters primarily eliminate the upper conical zone, whereas larger diameters promote slip plane formation and peripheral crushing as the dominant failure mechanisms.
4. Conclusions
(1) This study employed the RFPA3D platform to establish numerical models of five representative non-standard rock specimen configurations. The quantitative analysis establishes a clear hierarchy of defect severity based on induced strength reduction: eccentric protrusions are the most critical (75.0–83.0% strength loss), followed by central protrusions (38.0–69.8% loss) which exhibit strong height-dependent effects. Surface grooving induces moderate degradation (18.3–32.6%), while end-surface inclination (7.2–25.3%) and localized warping (1.6–8.8%) pose considerably lower risk.
(2) Mechanical behavior shows distinct sensitivity to defect geometry. Eccentric protrusions demonstrate the most detrimental effect, with a 15 mm eccentricity causing up to 83.0% strength reduction. This pronounced difference underscores the critical importance of controlling both defect size and spatial distribution, as stress concentration and asymmetric loading mechanisms vary significantly between defect types.
(3) Failure modes transition progressively with defect severity. Central protrusions evolve from localized crushing to pronounced wedging failure as height increases from 2 mm to 4 mm, while eccentric protrusions consistently exhibit characteristic shear-sliding patterns. Damage initiation consistently originates at stress concentration zones, with failure localization intensity increasing by approximately 60% when protrusion dimensions exceed critical thresholds.
(4) The acoustic emission simulation capabilities of RFPA software have been employed to analyze failure processes across five distinct irregular specimen configurations. Analysis of acoustic emission signatures has enabled the identification and verification of specimen-specific failure modes. Acoustic emission monitoring provides a reliable early warning of instability, with over 75% of total AE events preceding macroscopic fracture formation. The spatiotemporal evolution of AE activity consistently identifies strength-critical regions from two to three loading stages before ultimate failure, demonstrating its practical value for progressive rock failure prediction.

