1. Introduction
There have been many attempts to estimate the surface particulate matter (PM) concentrations from satellite observations [
1], however many of them focused on equipment using visible to infrared channels, e.g., Advanced Himawari Imager (AHI) [
2,
3], Geostationary Ocean Color Imager-I/II (GOCI-I/II) [
4,
5,
6,
7,
8], Advanced Geosynchronous Radiation Imager (AGRI) [
9] and Visible Infrared Imaging Radiometer Suite (VIIRS) [
10].
In recent years, additional equipment has been launched into space to provide observation, including a UV-Visible hyper spectrometer named Geostationary Environment Monitoring Spectrometer (GEMS). There are literatures to discuss the challenges and opportunities in the air quality research and monitoring using satellites [
11,
12,
13,
14]. However, studies on data performance mainly focused on the region of Korean Peninsula and rarely on the region of southern China, including Hong Kong (
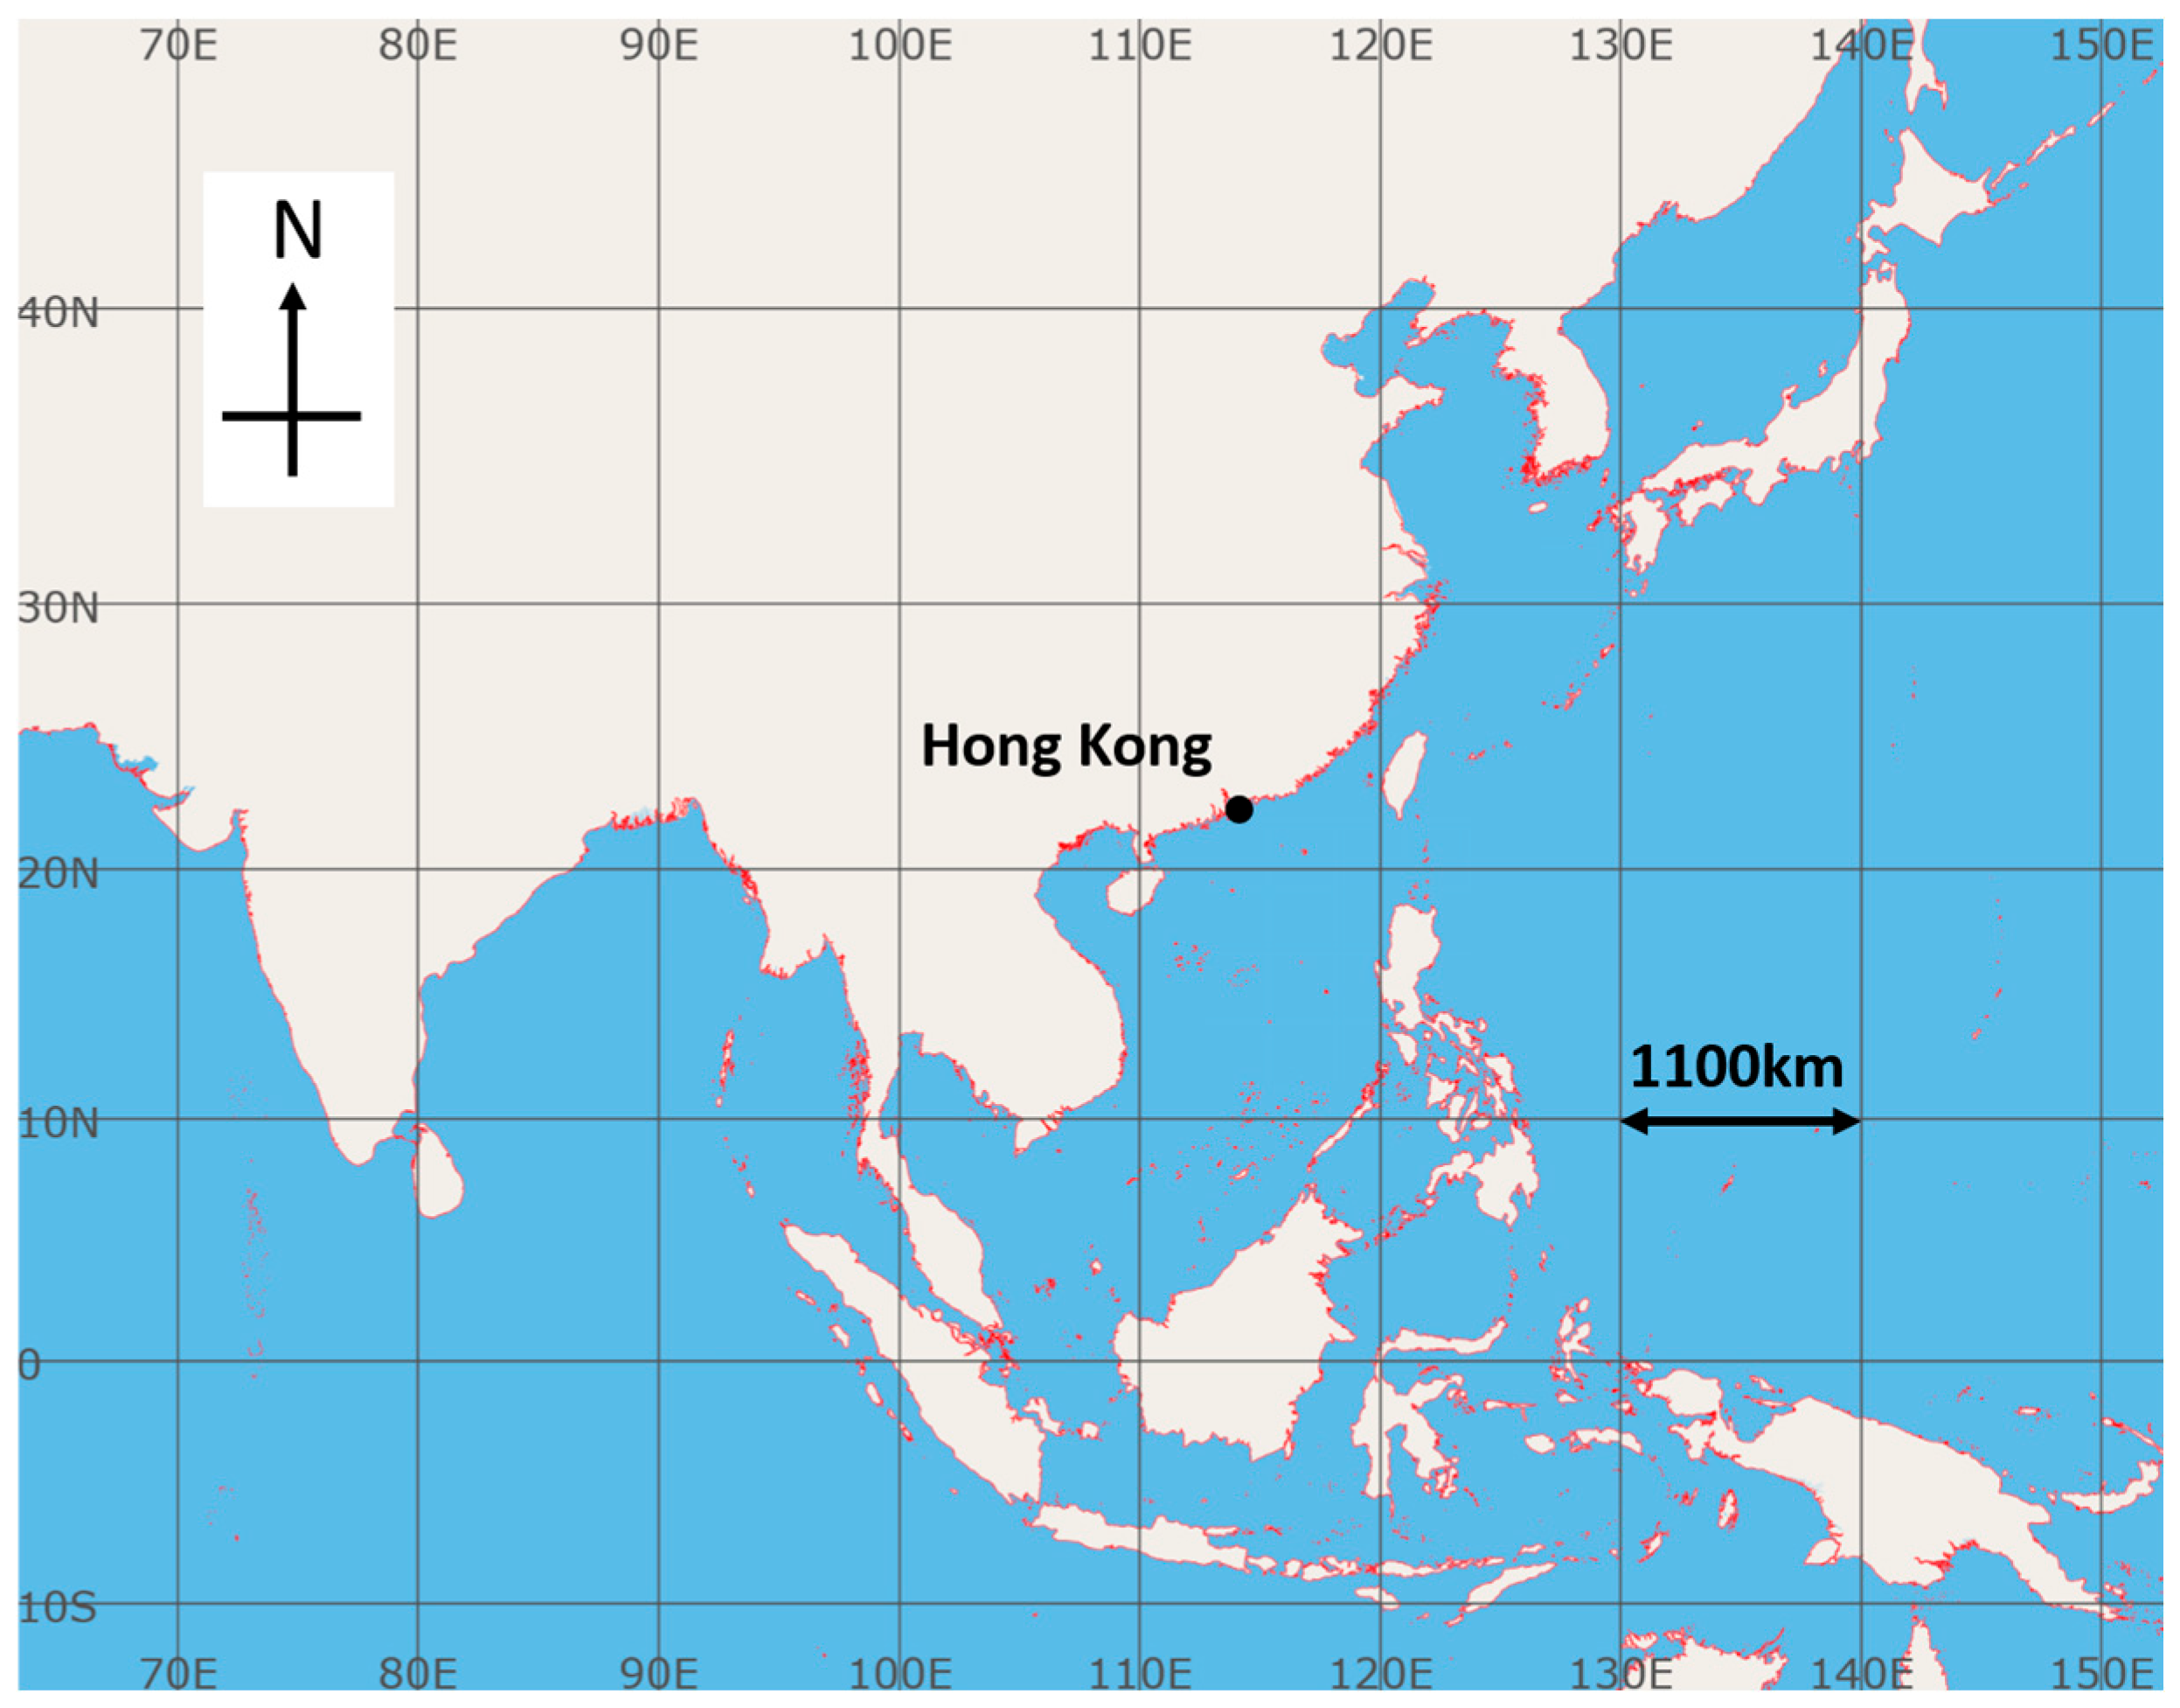
Figure 1).
Monitoring of the aerosol concentrations (in the form of PM10 and PM2.5) upstream of Hong Kong is important for the timely alerting of the possibility of reduced visibility within the territory. The forecasting and timely alerting may be made from considering originating region of the air parcel several days ahead (such as utilizing the forecast trajectory of air parcel) and the aerosol concentration in that region. Over land, it may be possible to have information about the aerosol concentration from air quality station measurements. With the advancement of satellite technology, it is now possible to obtain in real time the PM10 and PM2.5 maps over extensive regions (covering both over land and sea areas) at least in the daytime based on visible observation channels. However, the performance and validity of the various tools remains unknown, especially to the forecasters on the operational bench, until a real episode occurs.
At the Hong Kong Observatory (HKO), real-time PM10 and PM2.5 satellite-based maps are recently available from the geostationary satellite covering East Asian region, Geostationary Korea Multi-Purpose Satellite—2B (GEO-KOMPSAT-2B, or GK2B). In particular, the onboard GEMS provides high resolution maps of Aerosol Optical Depth (AOD) at various wavelengths as well as aerosol concentrations at hourly basis during the day. In this paper, the performance of the GEMS PM10 and PM2.5 maps are studied by considering two episodes of sand/dust weather over continental China. In mid-April 2025, the sand/dust originating from Mongolia was transported across the mountainous region over central and southern China, reaching the south China coastal areas, including Hong Kong. In early to middle May 2025, numerical models for PM forecast that the sand/dust weather might reach southern China again, but this time the sand/dust eventually stayed mainly over central China. Therefore, a positive case and a negative case of sand/dust weather are considered to study the performance of the satellite products, by comparing with numerical model analysis as well as in-situ air quality measurements in southern China, including Hong Kong. This paper conducts a detailed study for the rare events, thus also provides forecasters a very first valuable reference for their use of the new tools in operation in the future.
Polar orbiting satellites with special payload such as VIIRS onboard the NOAA-20 spacecraft are also useful for monitoring AOD and even the classification of the aerosol type. The performance of NOAA-20 VIIRS for the above two sand/dust weather cases is also studied in this paper for the completeness of reference to the cases, and demonstrate the application of aerosol products for real-time assessment of air quality.
2. Materials and Methods
2.1. PM10 and PM2.5 Data Retrieval from GEMS of GK2B Satellite
GEMS mounted on-board of GK2B satellite is a UV-Visible hyper spectrometer that can enable measurements of atmospheric aerosols and other gaseous pollutants such as sulphur dioxide (SO
2) and nitrogen dioxide (NO
2), etc. The algorithm used to estimate the ground-level PM10 and PM2.5 concentrations is based on a machine-learning model developed by the National Institute of Environmental Research (NIER) of the Republic of Korea. The model ingests GEMS’ various products including Aerosol Optical Depth (AOD) and aerosol layer height, meteorological data from the Unified Model-Regional Data Assimilation and Prediction System (UM-RDAPS), ground-based observation data over South Korea, China and Japan, other auxiliary data (e.g., road density and population density data) and applies the real-time learning (RTL) technique for deriving the ground-level PM10 and PM2.5 concentrations. Detailed documentation of the algorithm can be found in NIER’s website [
15]. Similar studies [
1,
2,
4,
5] have been done in the past using machine learning models incorporating meteorological variables, emission data and topographic characteristics for estimating satellite-derived ground-level PM concentrations.
2.2. Analysis Data from Numerical Models
To evaluate the performance of satellite-derived PM10 concentration over China for the two sand/dust events mentioned in
Section 1, the GEMS derived PM10 concentration over the East-Asia domain (10–50° N, 80–140° E) was compared with analysis fields of PM10 concentration from two numerical models available from the Sand and Dust Storm Warning Advisory and Assessment System Asian Regional Centre (SDS-WAS ASIAN-RC) [
16], which is an important source of information about the forecasting of sand/dust in Asian region. The models include the Copernicus Atmosphere Monitoring Service (CAMS) of the European Centre of Medium Range Weather Forecast (ECMWF) and Chinese Unified Atmospheric Chemistry Environment (CUACE) of China Meteorological Administration (CMA). In order to compare with the numerical model data at 0.5-degree resolution, GEMS data were re-gridded and interpolated to a 0.5-degree grid by the nearest neighbor method. Apart from qualitative comparison of satellite-estimated and model-analysed PM10 concentration maps, the relationship between the satellite-estimated and model-analysed values was also studied using scatter plots and linear regression analysis.
2.3. Ground Measurement of PM Concentrations in Hong Kong
There is an air quality monitoring network in Hong Kong, China, operated by the Hong Kong Environmental Protection Department (EPD) [
17]. The network comprises three roadside monitoring stations and fifteen general monitoring stations installed at various locations of Hong Kong. These stations monitoring various air quality parameters including the concentrations of PM2.5, PM10, SO
2 and NO
2, etc. In this paper, only the data for hourly concentrations of PM10, PM2.5 and the ratio PM2.5/PM10 from the 15 general stations are used. The remaining roadside stations are ignored in order to remove the impact on data quality from local roadside conditions.
2.4. Ground Measurement of PM Concentrations in the Southern China
In order to assess the consistency between satellite-derived PM10 retrievals and ground-based air-quality measurements within the southern China, two additional air-quality measurement data in Guangdong, namely Guangzhou and Shaoguan, oeprated by the China National Environmental Monitoring Centre, are also included in this study for comparison between satellite derived values and ground-based measurements [
18]. Data for hourly concentrations of PM10 and the ratio PM2.5/PM10 are used in this study.
2.5. AOD and Aerosol Classification Based on NOAA-20 VIIRS
NOAA-20, launched in November 2017, operates in a 13:30 local-time Sun-synchronous polar orbit. Its onboard VIIRS comprises 22 spectral channels. The channel M3 (0.436–0.454 μm), M4 (0.478–0.498 μm), M5 (0.545–0.565 μm) and M7 (0.662–0.682 μm) are specifically tuned for aerosol retrievals, enabling stable monitoring of atmospheric aerosols over bright surfaces and under low-light level conditions at night [
19]. VIIRS data are processed following a three-tiered workflow: (i) Raw Data Records (RDR); (ii) Sensor Data Records (SDR); and finally (iii) Environmental Data Records (EDR). RDR are radiometrically calibrated and geometrically corrected to yield SDR. The SDRs are fed into the Deep Blue algorithm to produce EDR-level data, e.g., AOD [
20].
In the study we use the EDR product, AERDB_L2_VIIRS_NOAA20. We extract the Aerosol_Optical_Thickness_550_Land_Ocean field (AOD
550) for the atmosphere AOD [
21], and Aerosol_Type_Land_Ocean field for aerosol classification. For the latter, eight aerosol types are resolved, including Background, Dust, Smoke, High Altitude Smoke, Pyrocumulonimbus Clouds, Non-Smoke Fine Mode, Mixed and Fine Dominated [
22]. The results are also viewable from NASA Worldview website [
23].
2.6. Data Comparison
After above observational and model data during the sand/dust weather episodes is gathered from various sources, comparison is directly made to provide a comprehensive picture of the episodes. The side-by-side comparisons, including extensive spatial map and time-series at single location, are performed due to limited duration of observation from two episodes, but are still sufficient to provide direct references to forecasters to view the performance of various tools on these two events.
3. Results
3.1. Comparion Between GEMS Observation and Model Analysis
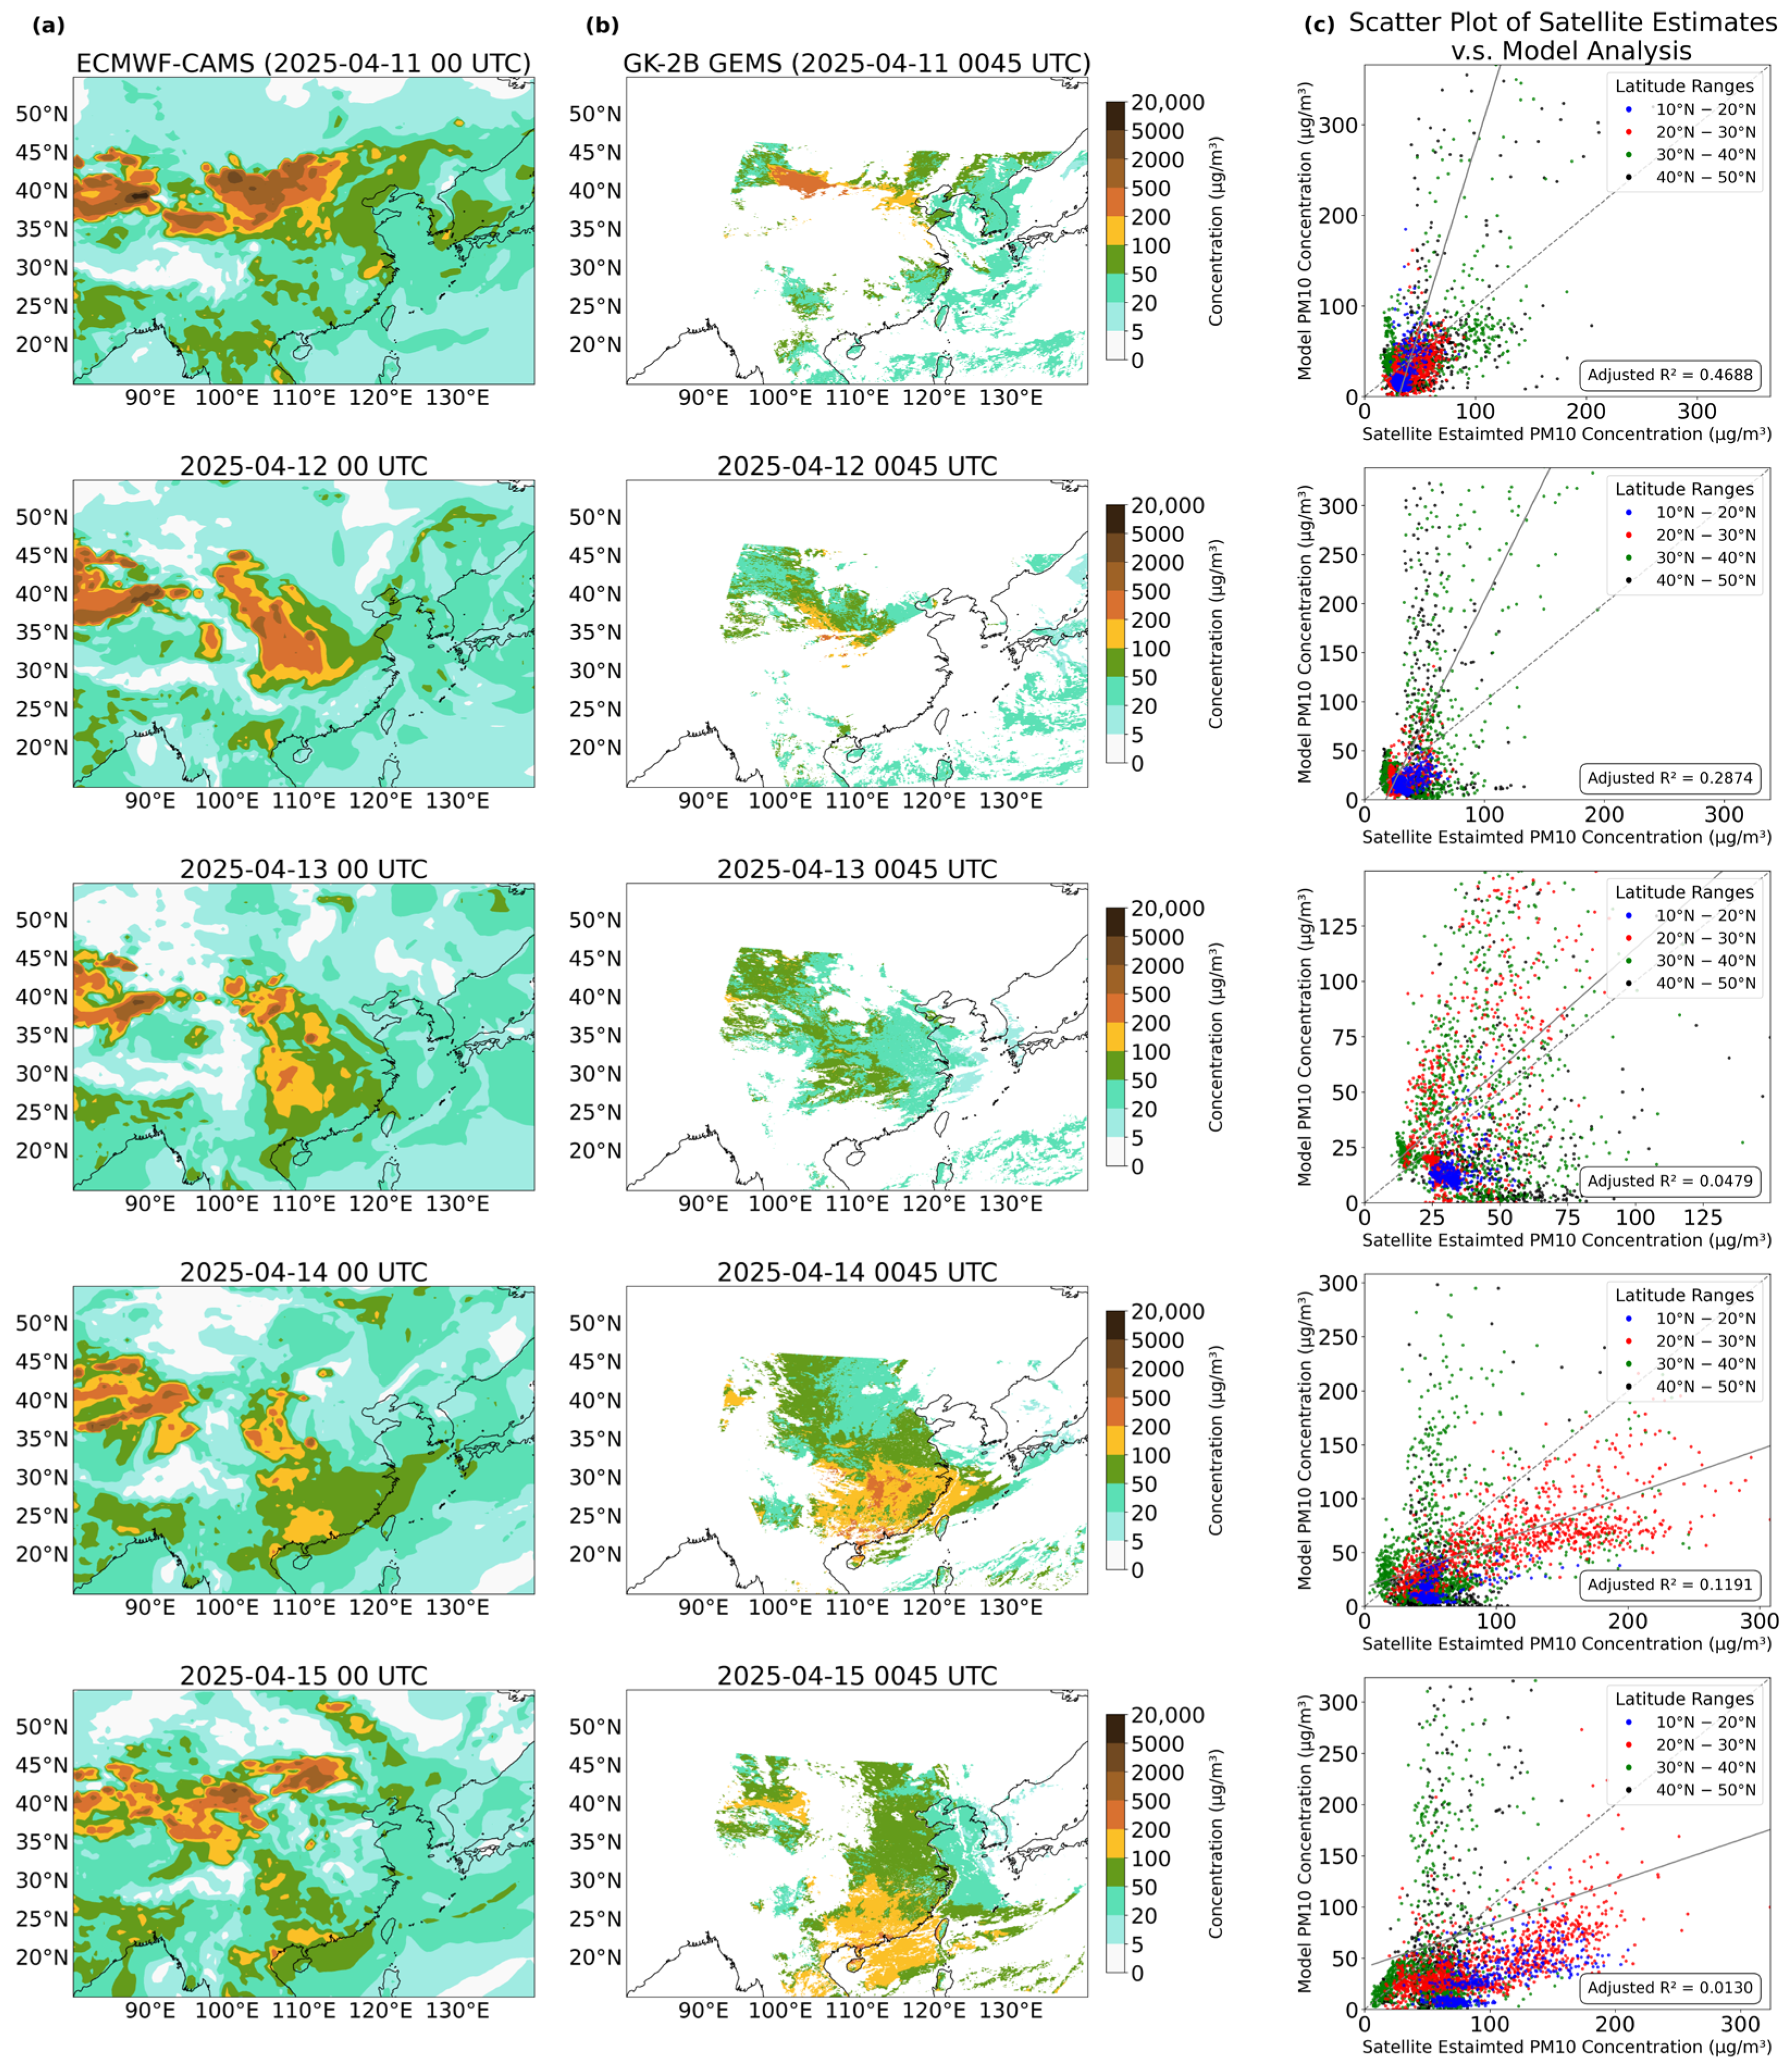
The first case is the sand/dust weather affecting southern China in mid-April 2025. The period under consideration is 11–15 April 2025. The GEMS PM10 images are shown in column (b) in
Figure 2. Sand/dust originating from Mongolia on 11 April (top row) spread southwards gradually and affected southern China on 14 and 15 April (the bottom two rows). As discussed in Chan et al. [
24], the PM10 images are generally consistent with the actual reports of sand/dust weather.
The first model under consideration is CAMS of ECMWF, with the analysis (T = 0 h) shown in column (a) of
Figure 2. Through qualitative comparison, the CAMS analysis and the GEMS PM10 images are generally similar. More quantitative comparisons are conducted by scatter plots, and the results are shown in column (c) of
Figure 2. In each scatter plot, in addition to the overall linear fit, values are stratified into different latitude bands (indicated by different colours) to assess the relationship at different locations. It appears that the surface dust concentration analysis has reasonable correlation with GEMS-estimates of PM10, with the former a couple of orders magnitude higher at mid-latitudes and underestimating at lower latitudes when the sand/dust spreads southwards. Nonetheless, the CAMS analysis seems to capture the overall pattern of the sand/dust and this may form a solid basis for the forecast, which would be studied later in
Section 3.3.
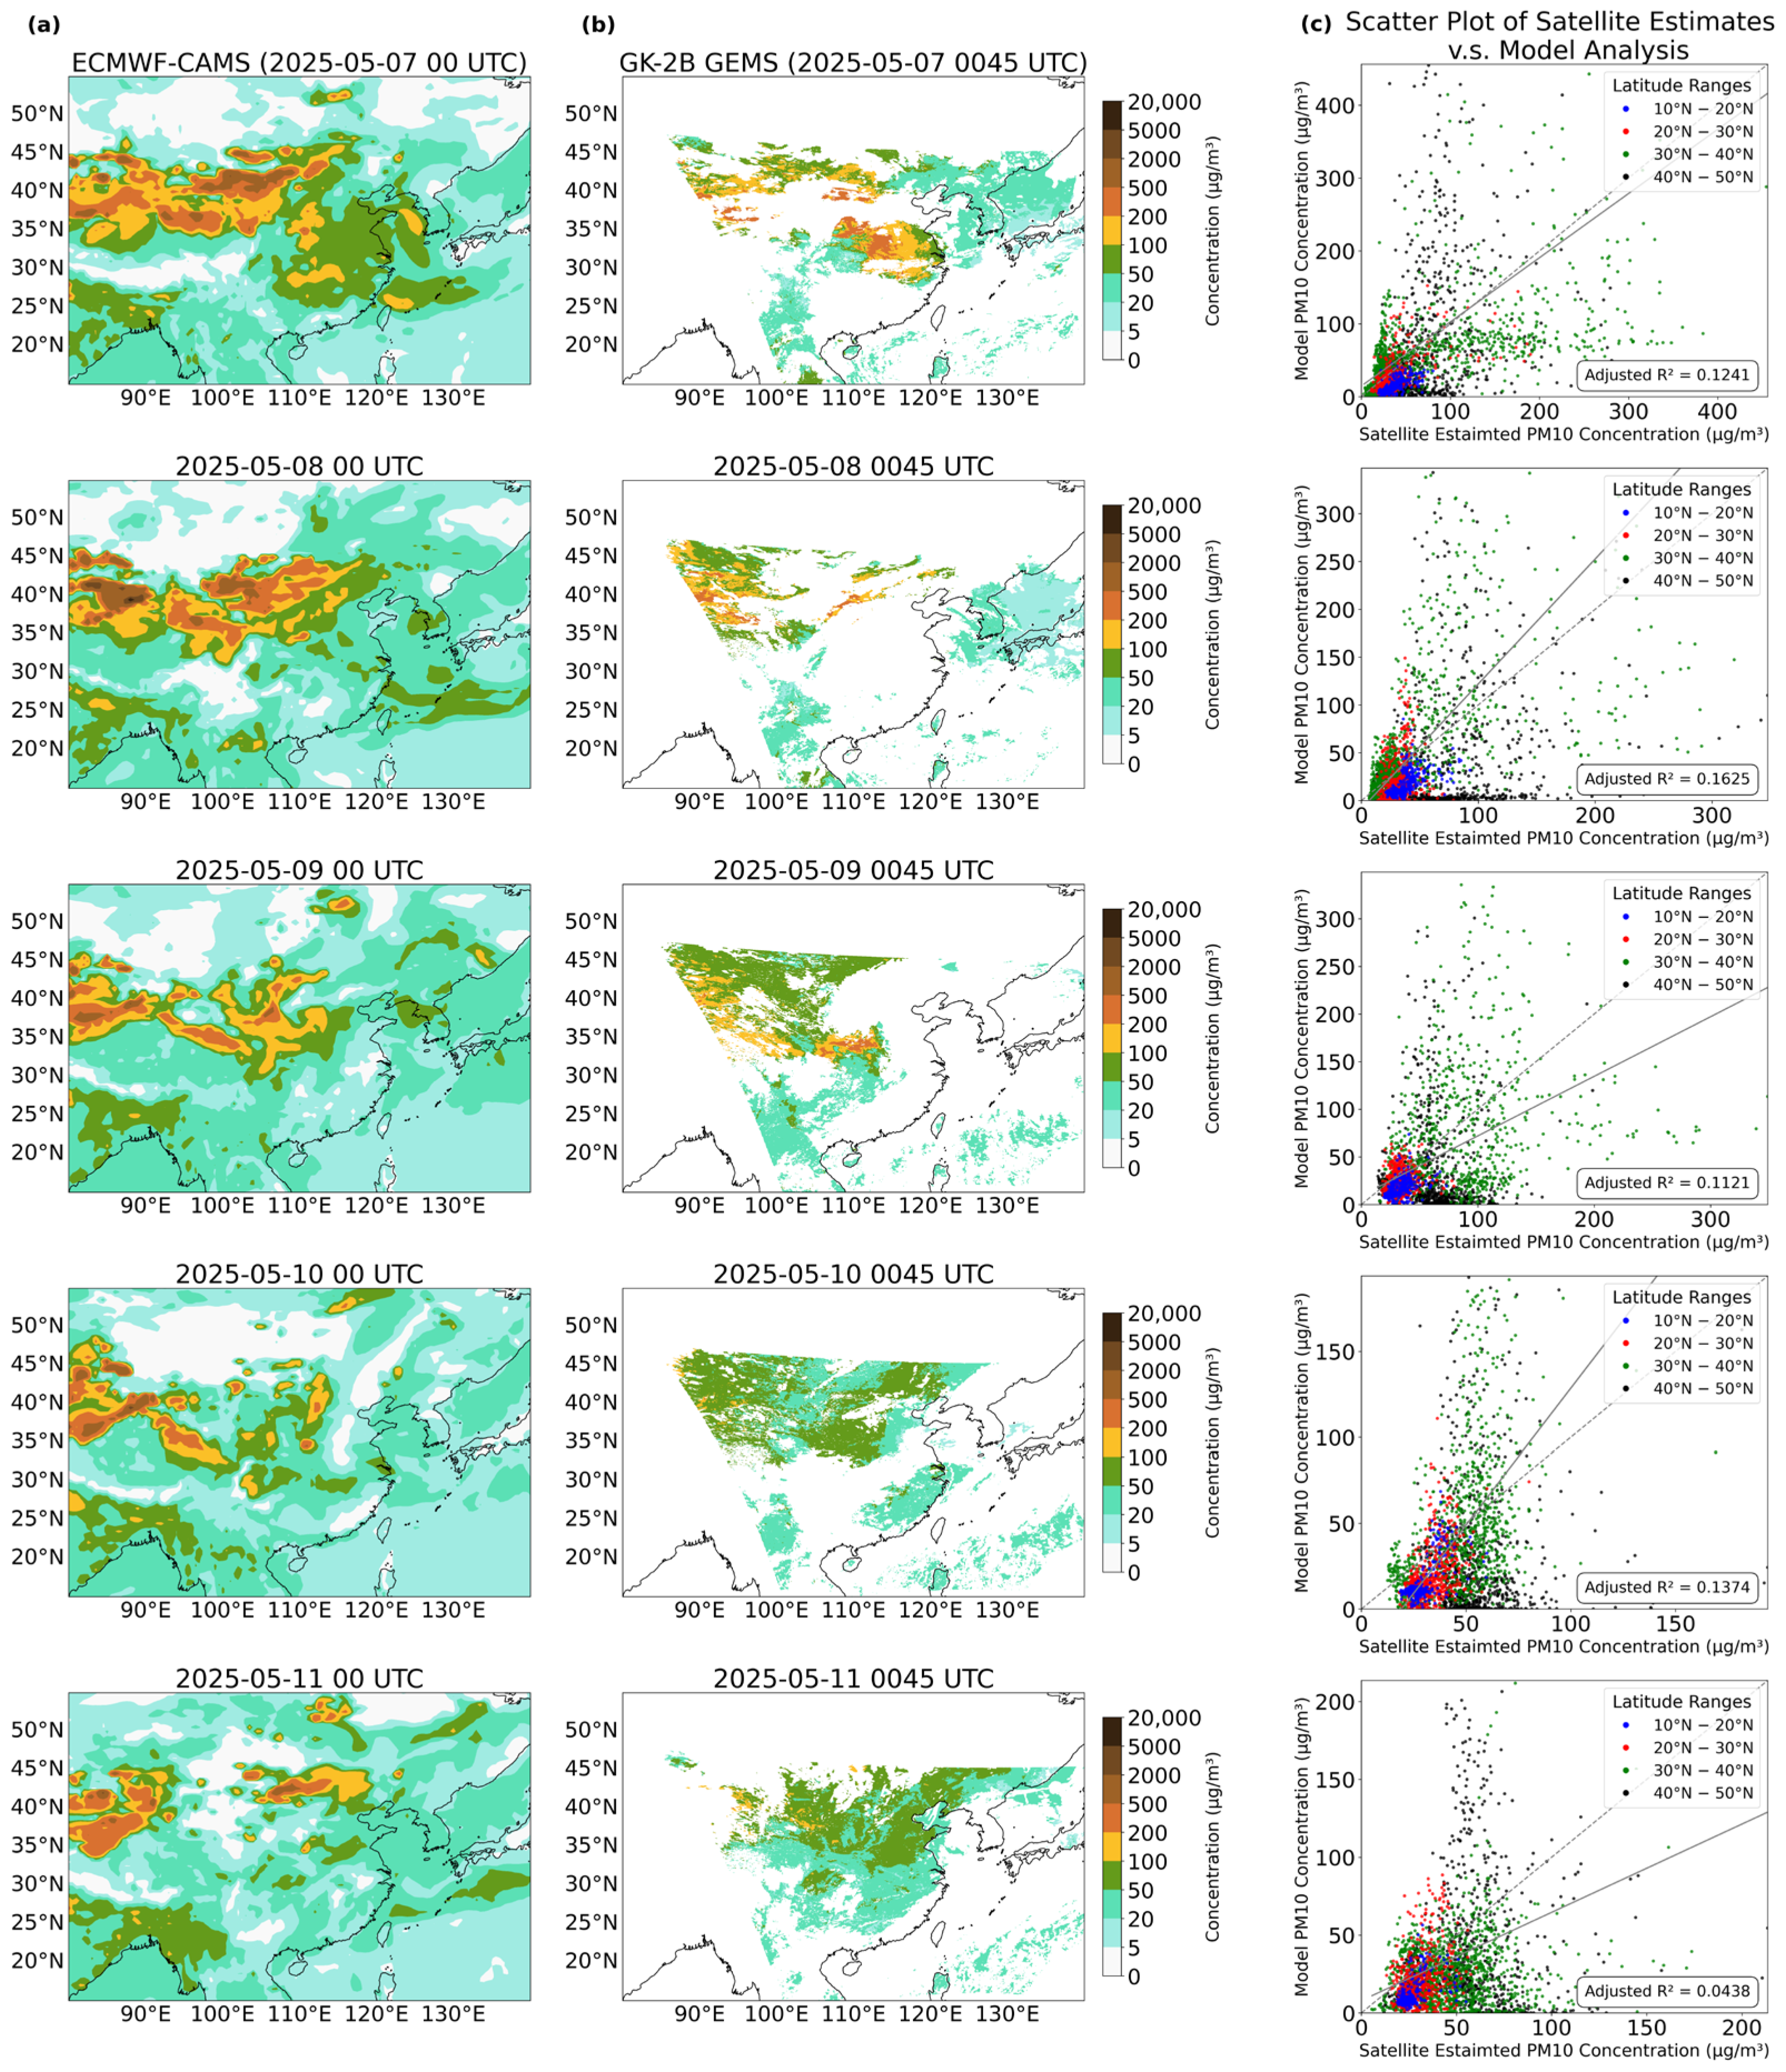
The second case is the negative sand/dust event in mid-May 2025, with the sand/dust accumulating over central China and not managing to reach southern China. The period under consideration is 7–11 May 2025, and the comparison results between GEMS and CAMS are shown in
Figure 3. The model analysis captures the persistence of sand/dust over northern and central China, and the generally cleaner air with much lower dust or PM10 concentration over southern China. The dependence of the comparison results on latitude as shown in the case in April 2025 is observed again in the scatter plots in column (c) of
Figure 3, but in general, the two datasets have reasonable correlation, forming a solid basis for the onward forecasts of the CAMS model.
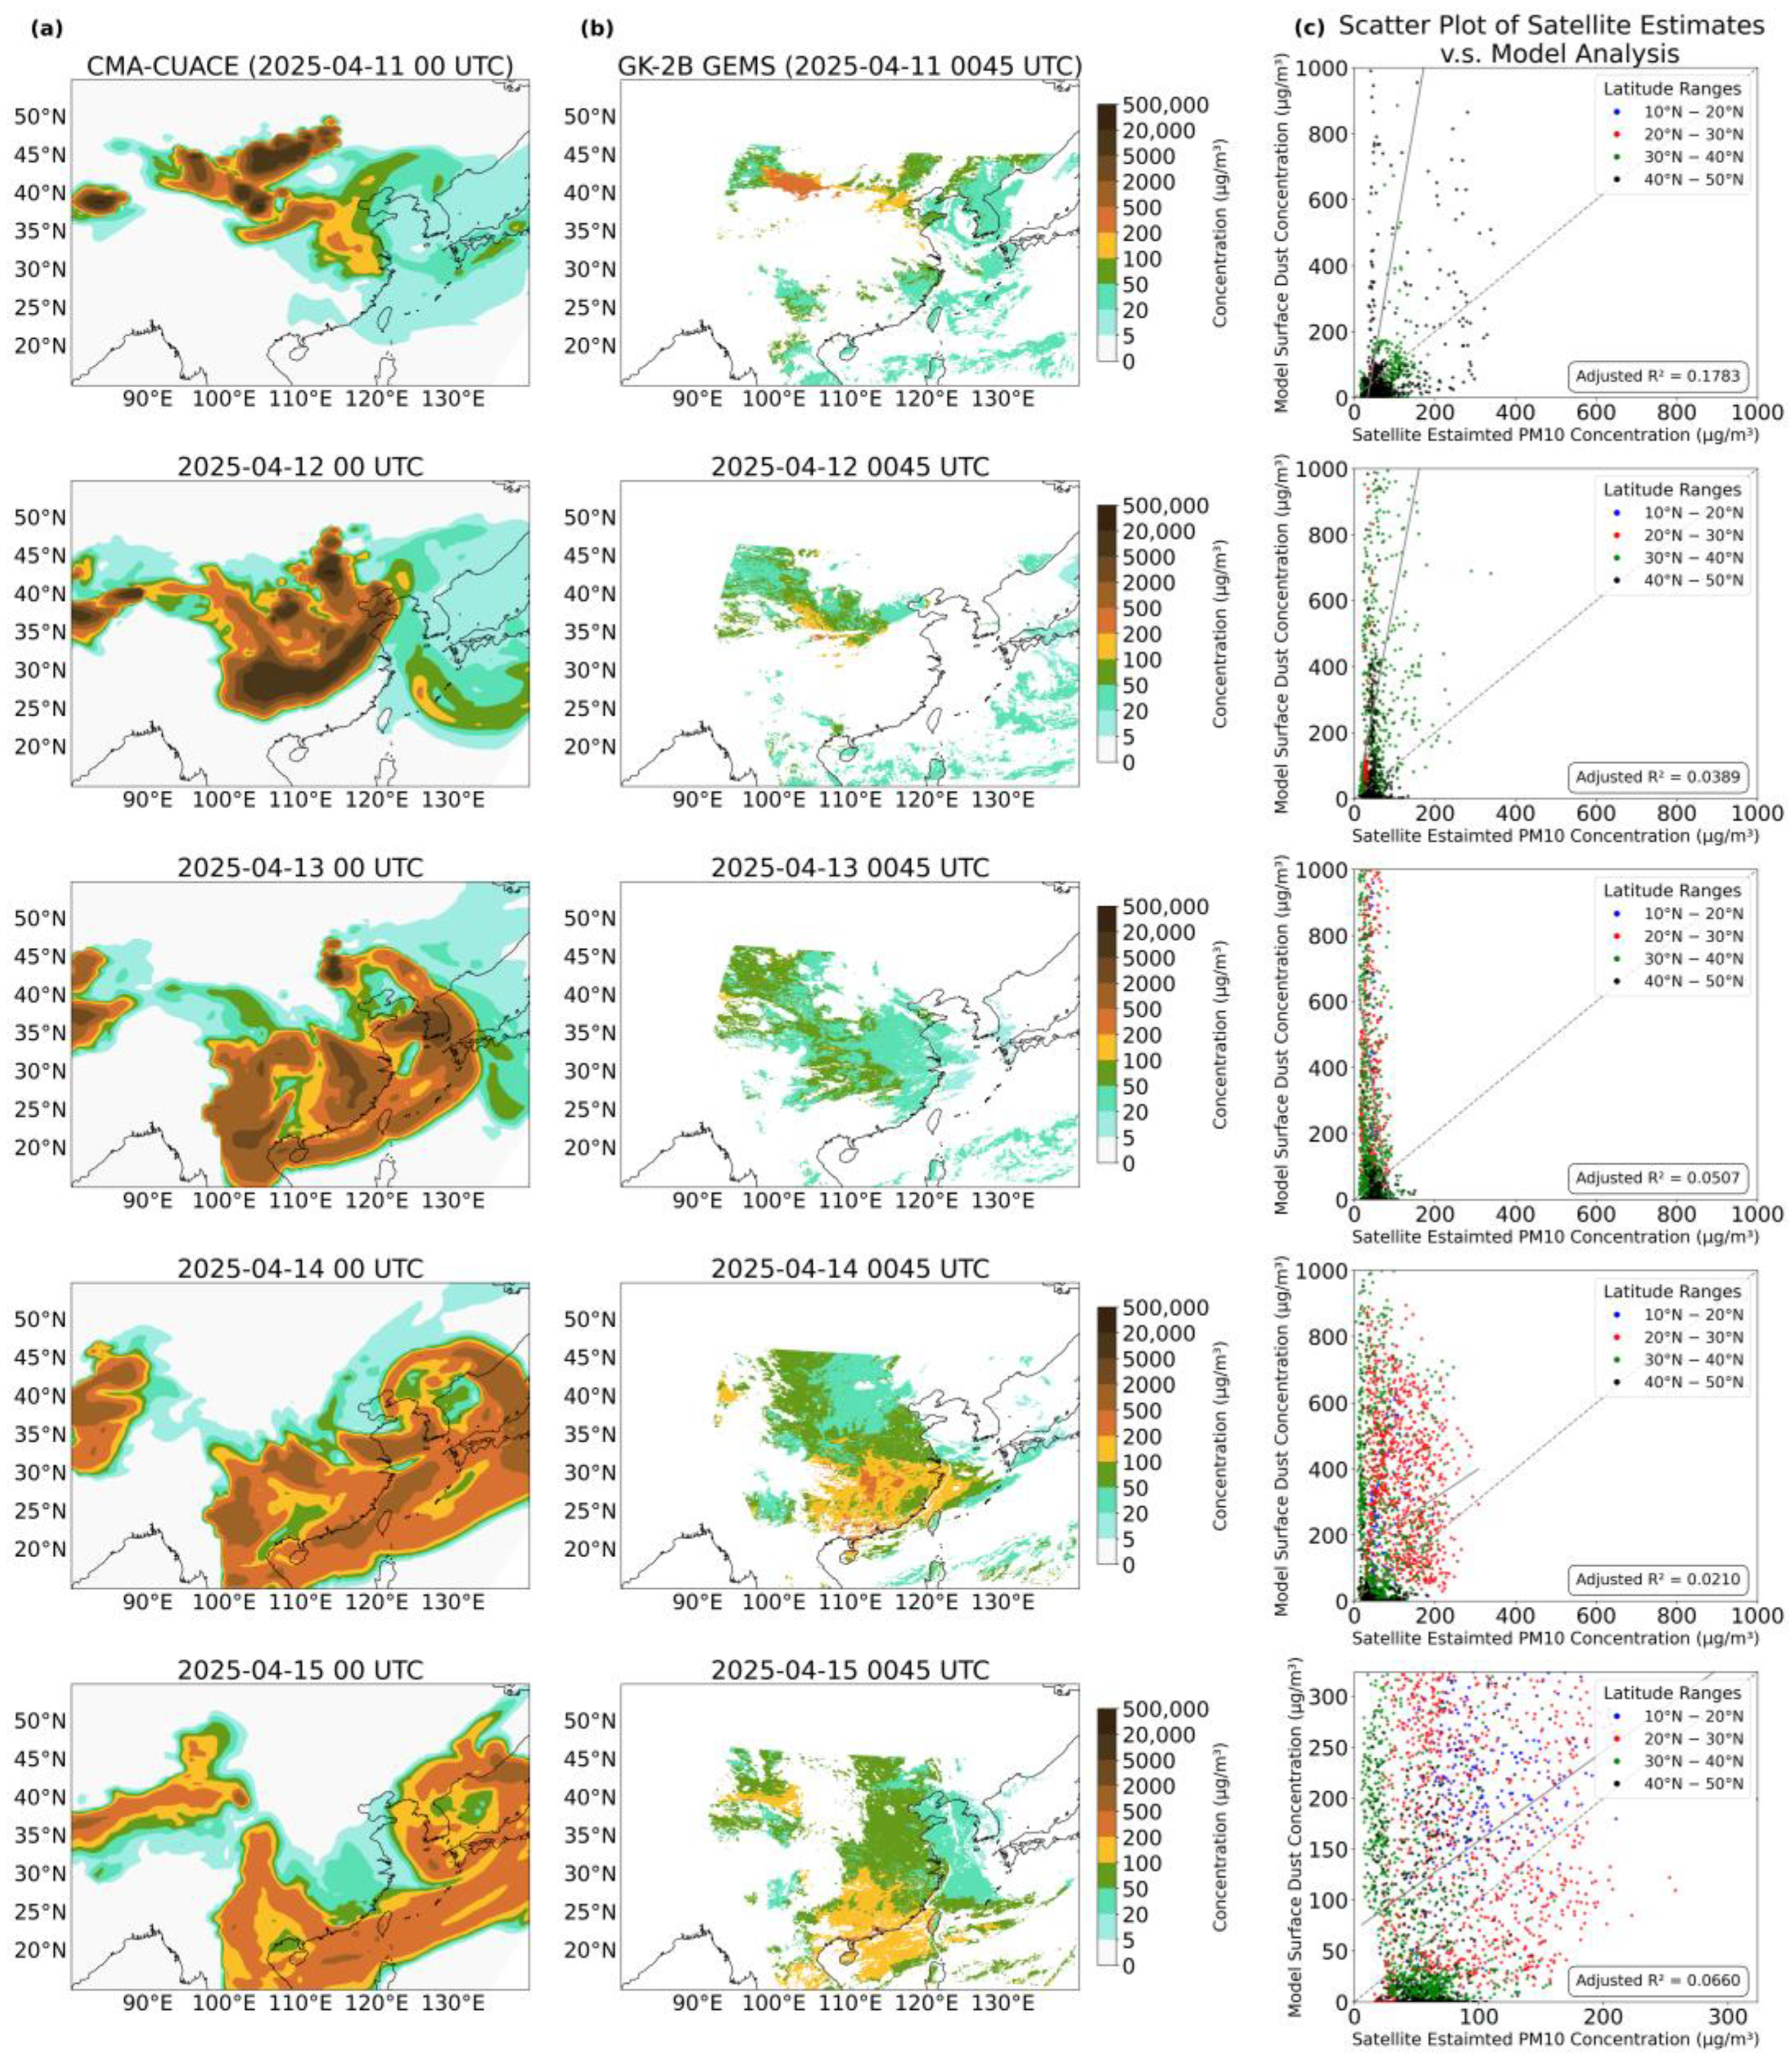
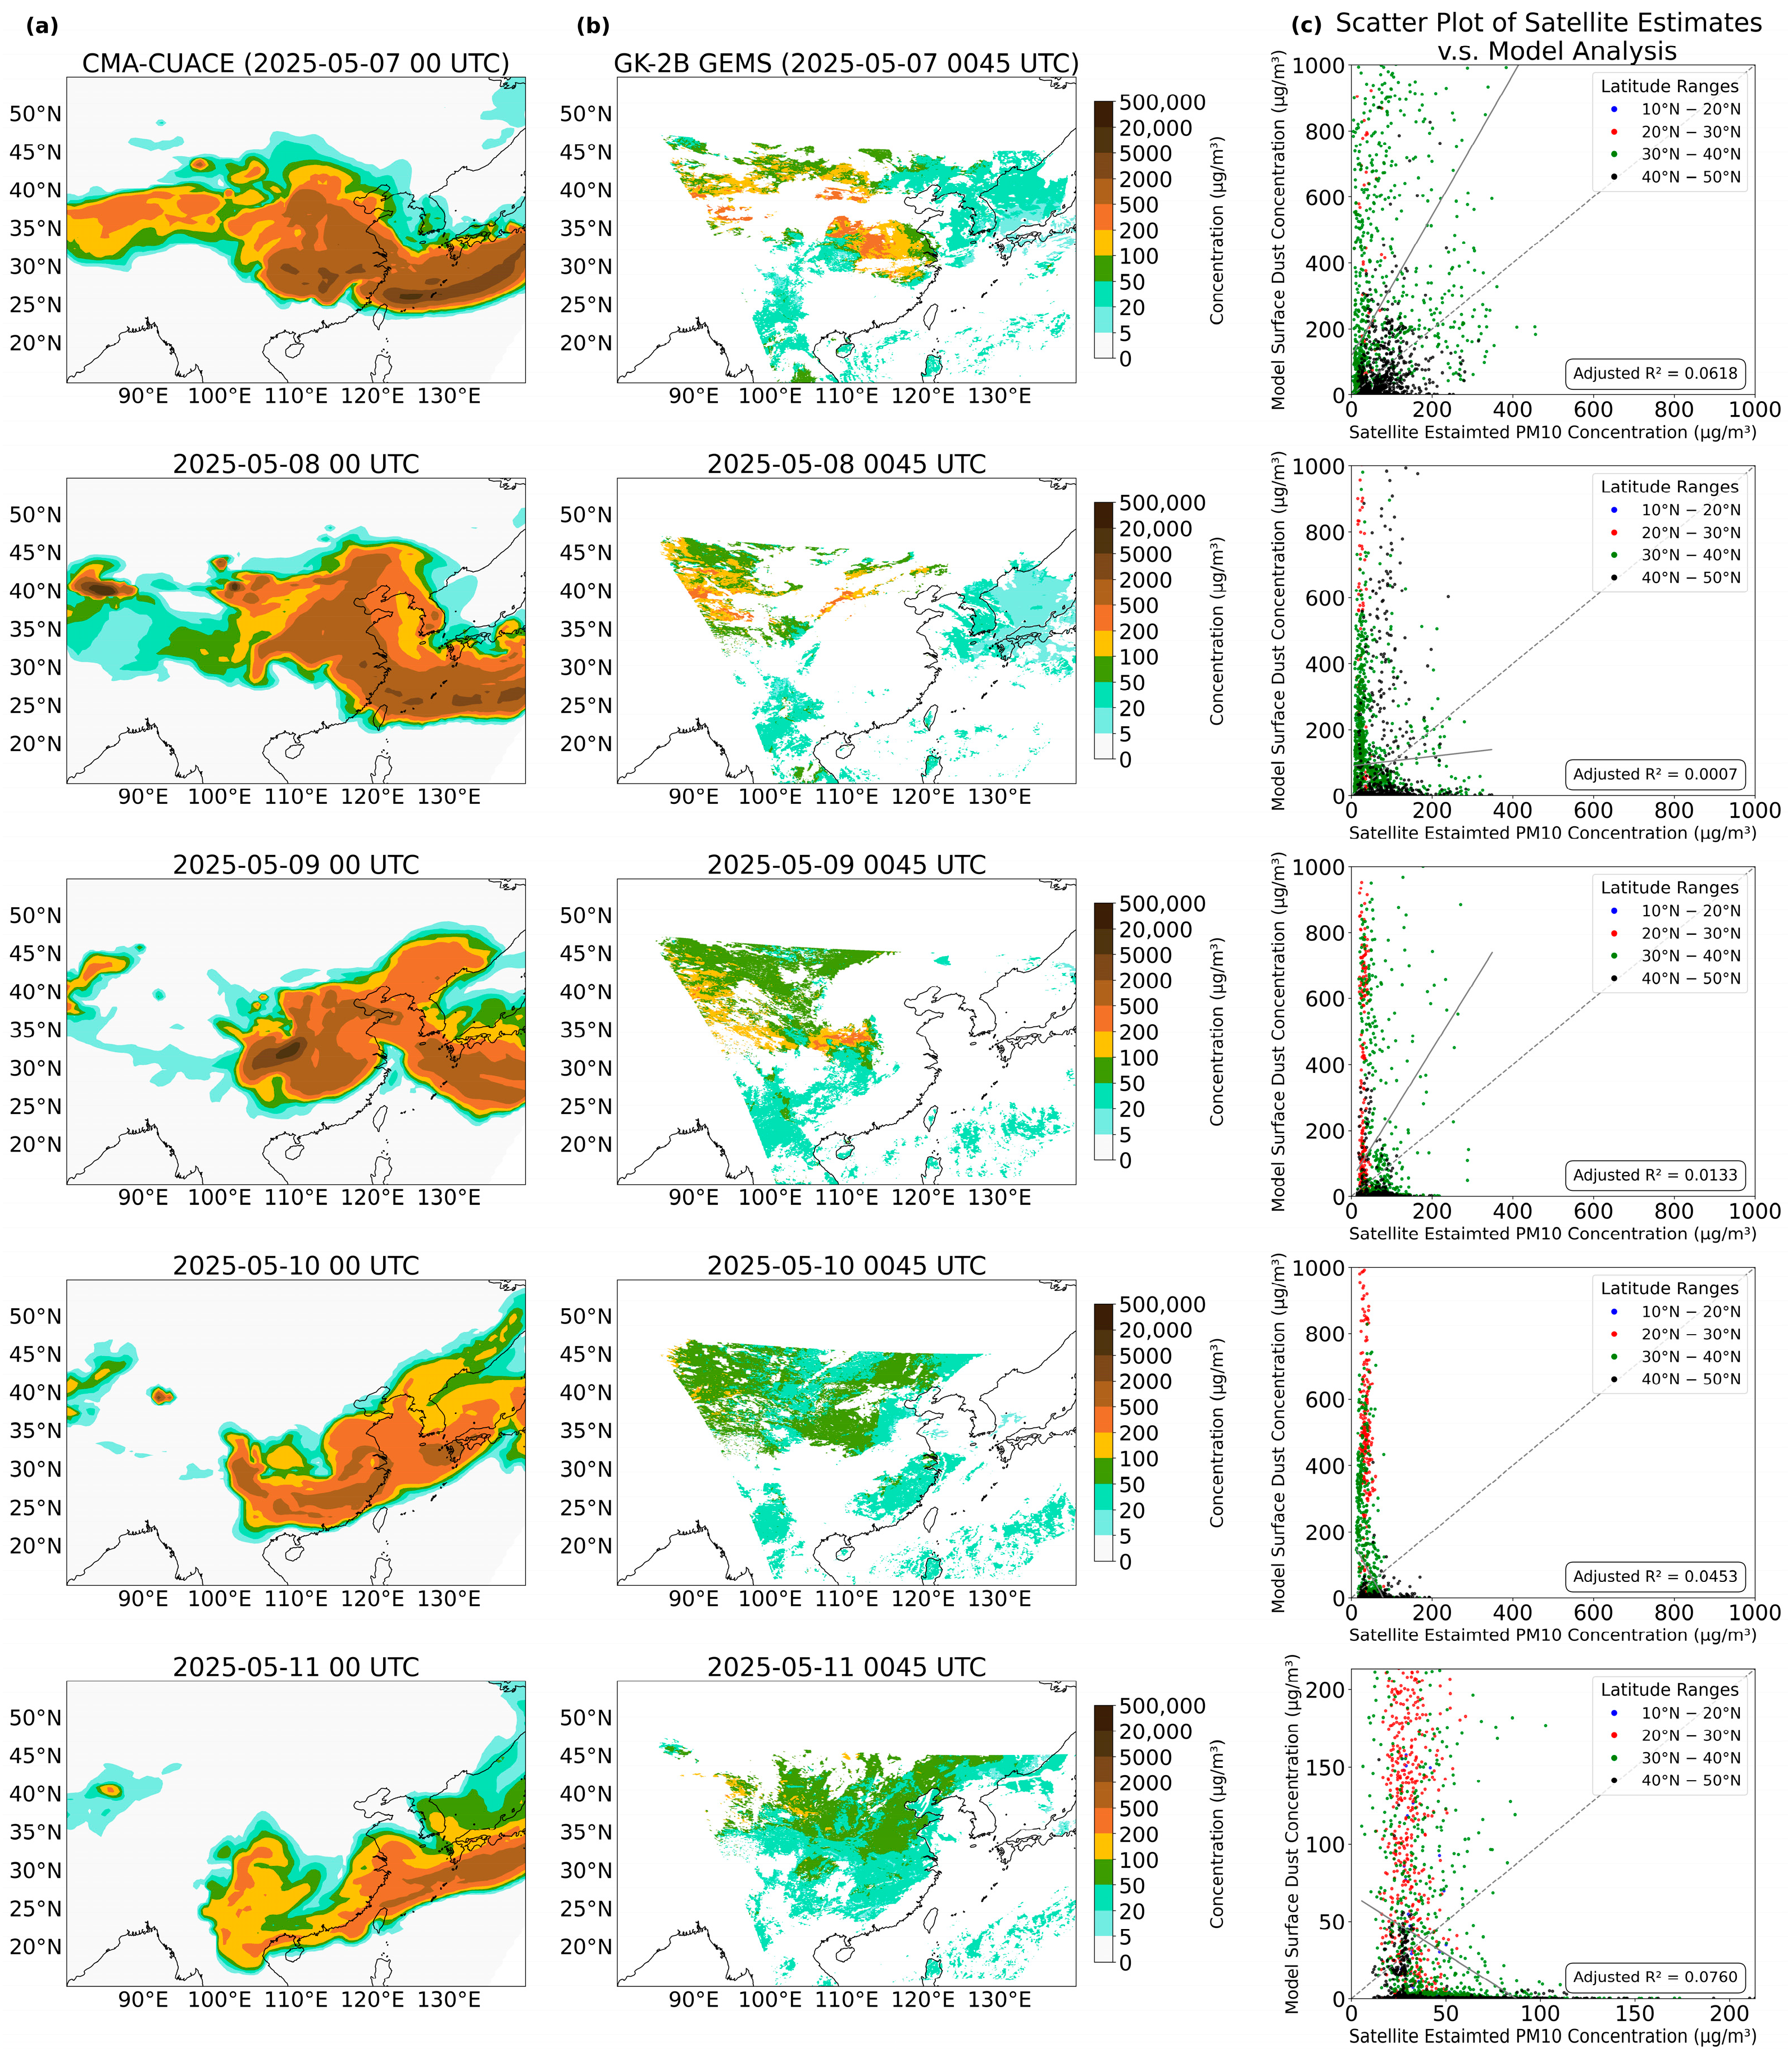
The results for the analysis of second numerical model CUACE of CMA are shown in
Figure 4 and
Figure 5 respectively for the two cases. For the case in April 2025 (
Figure 4), the model analysis manages to capture the southward spreading of the sand/dust, but the analyzed magnitude appears to be generally on the high side. As such, in the scatter plots (column (c) in
Figure 4), the data points are concentrated near the vertical axis, stating general over-estimation of model analysis with respect to satellite observations despite the latitudes. Similar over-estimation is even clearer in the case in May 2025 (
Figure 5). The dust concentration over southern China is analyzed to be too high, and again the data points in the scatter plots are concentrated near the vertical axis. Because of the over-estimation in the analysis, the forecast values tend to be higher, especially over southern China (details to be provided in
Section 3.3).
When directly comparing the spatial distribution of PM10 concentration between model analysis and satellite observation qualitatively on
Figure 2,
Figure 3,
Figure 4 and
Figure 5, one may already observe that CMA-CUACE has tendency of overestimation while ECMWF-CAMS shows a fair result. The better correlation of ECMWF-CAMS is also reflected by the generally higher adjusted R-squared value as shown on the scatter plot.
3.2. Comparison Between GEMS Observation and Ground Measurement
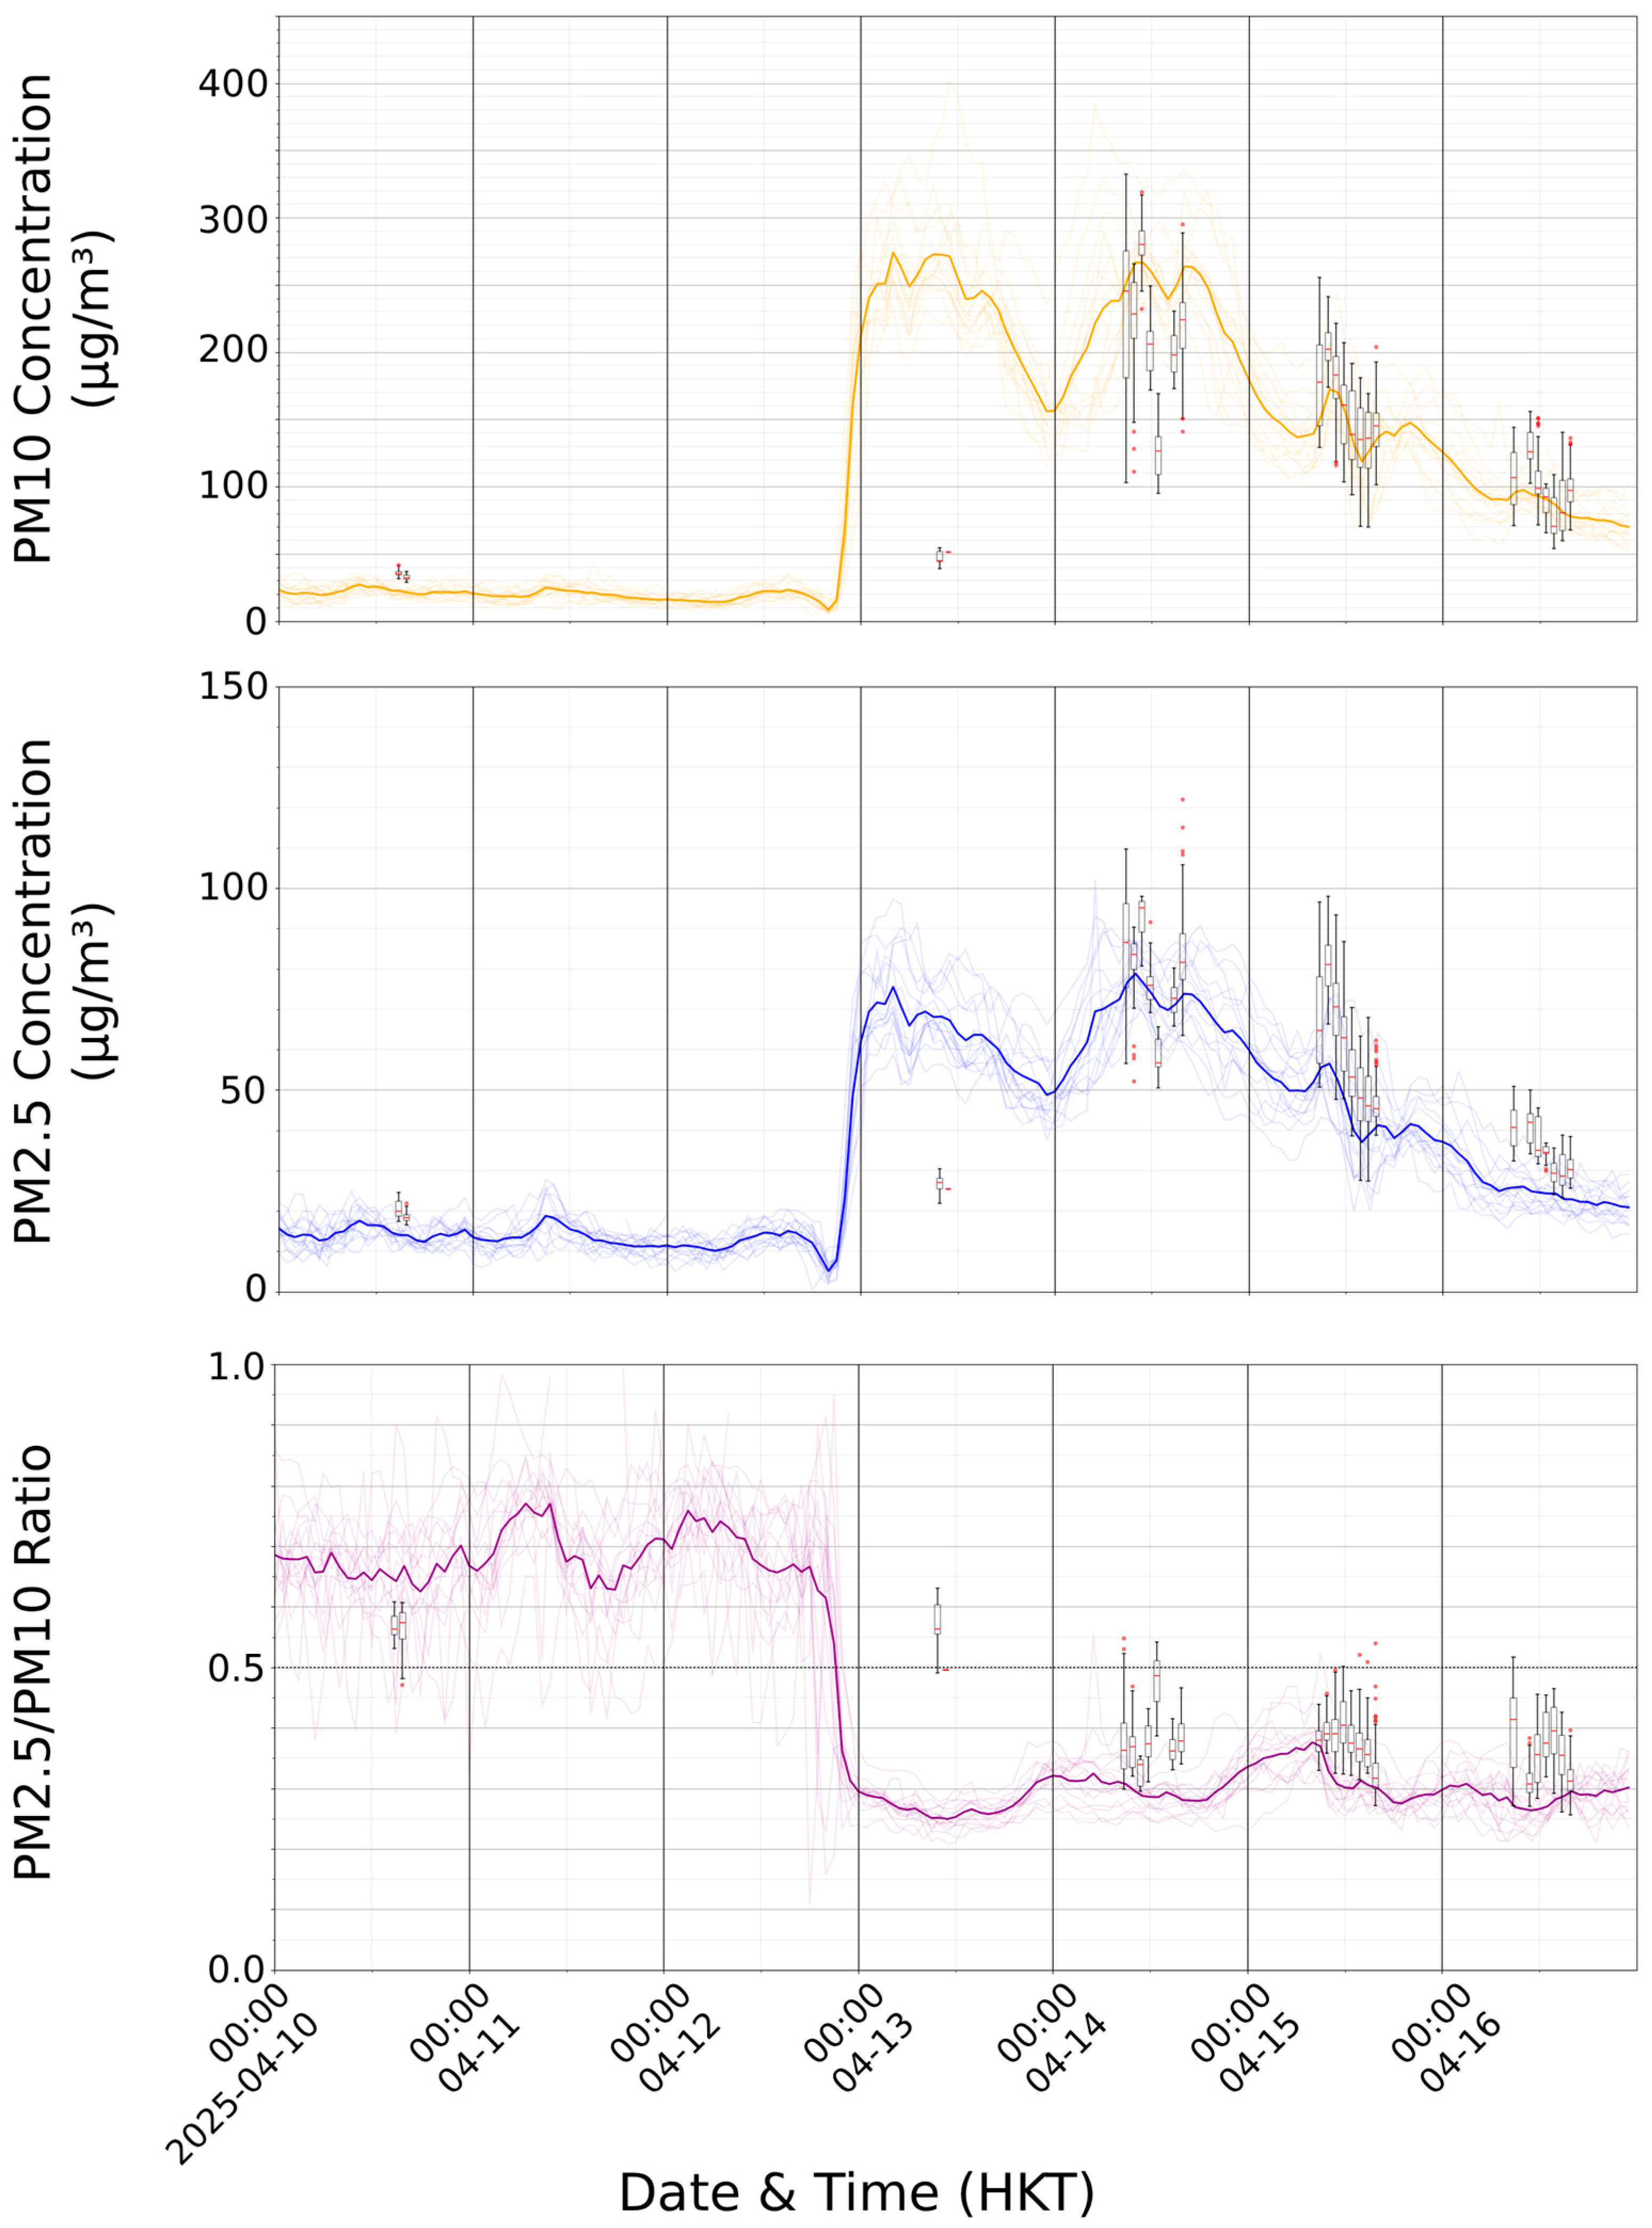
The above is a study of the GEMS PM10 images in terms of their consistency with model analyses. A more stringent test is the comparison of satellite PM10 data at a specific location with the ground-based air quality observations. The air quality data observed in Hong Kong, China are considered here. The time series of PM10 data measured at the various stations are plotted as faint yellow curves in
Figure 6 (upper panel). The mean value is shown as a thicker yellow curve. For comparison, the GEMS PM10 data in the region around Hong Kong (22.133–22.584° N, 113.816–114.517° E) is considered, and plotted as box-and-whisker. The time series of both datasets in the whole mid-April sand/dust event is shown in
Figure 6 (upper panel). It could be seen that the two datasets are generally consistent with each other from quantitative point of view. This is a very stringent test of the accuracy of the GEMS PM10 data, and it is found to give satisfactory result.
Apart from PM10, the GEMS also has PM2.5 data and similar comparison is conducted, as shown in the middle panel of
Figure 6 for the case in April 2025. Again, both datasets are consistent with each other on quantitative sense. The reason for considering both PM10 and PM2.5 is because the ratio PM2.5/PM10 is found to have a good indication for the assessment of sand/dust weather in Hong Kong, before the chemical speciation data (which requires longer time for analysis) are available [
25]. Previous study [
25] suggested that when there is a rapid rise in PM10 together with a drop in ratio PM2.5/PM10 below 0.5, it could distinguish the sand/dust from East-Asian sand/duststorms and particulates generated by the local anthropogenic activity. The previous study suggest that the ratio drop below 0.5 with a rapid As such, for the case in April 2025, the time series of ratio PM2.5/PM10 from both the satellite and the ground observations is calculated and shown in the lower panel of
Figure 6. The overall trends of the two datasets are generally consistent. At least from this case study (a rare case of sand/dust weather in Hong Kong), the satellite-based observations are useful in monitoring the southward spreading of sand/dust, with the wide spatial coverage from the satellite, covering not only the land but also over the ocean. The GEMS data is validated quantitatively, and thus provides good hourly estimation of PM concentrations during the day on the location without ground observation.
3.3. Performance of Numerical Model Forecasts
Model analysis would have significant impacts on the model forecast, which are studied further in this section.
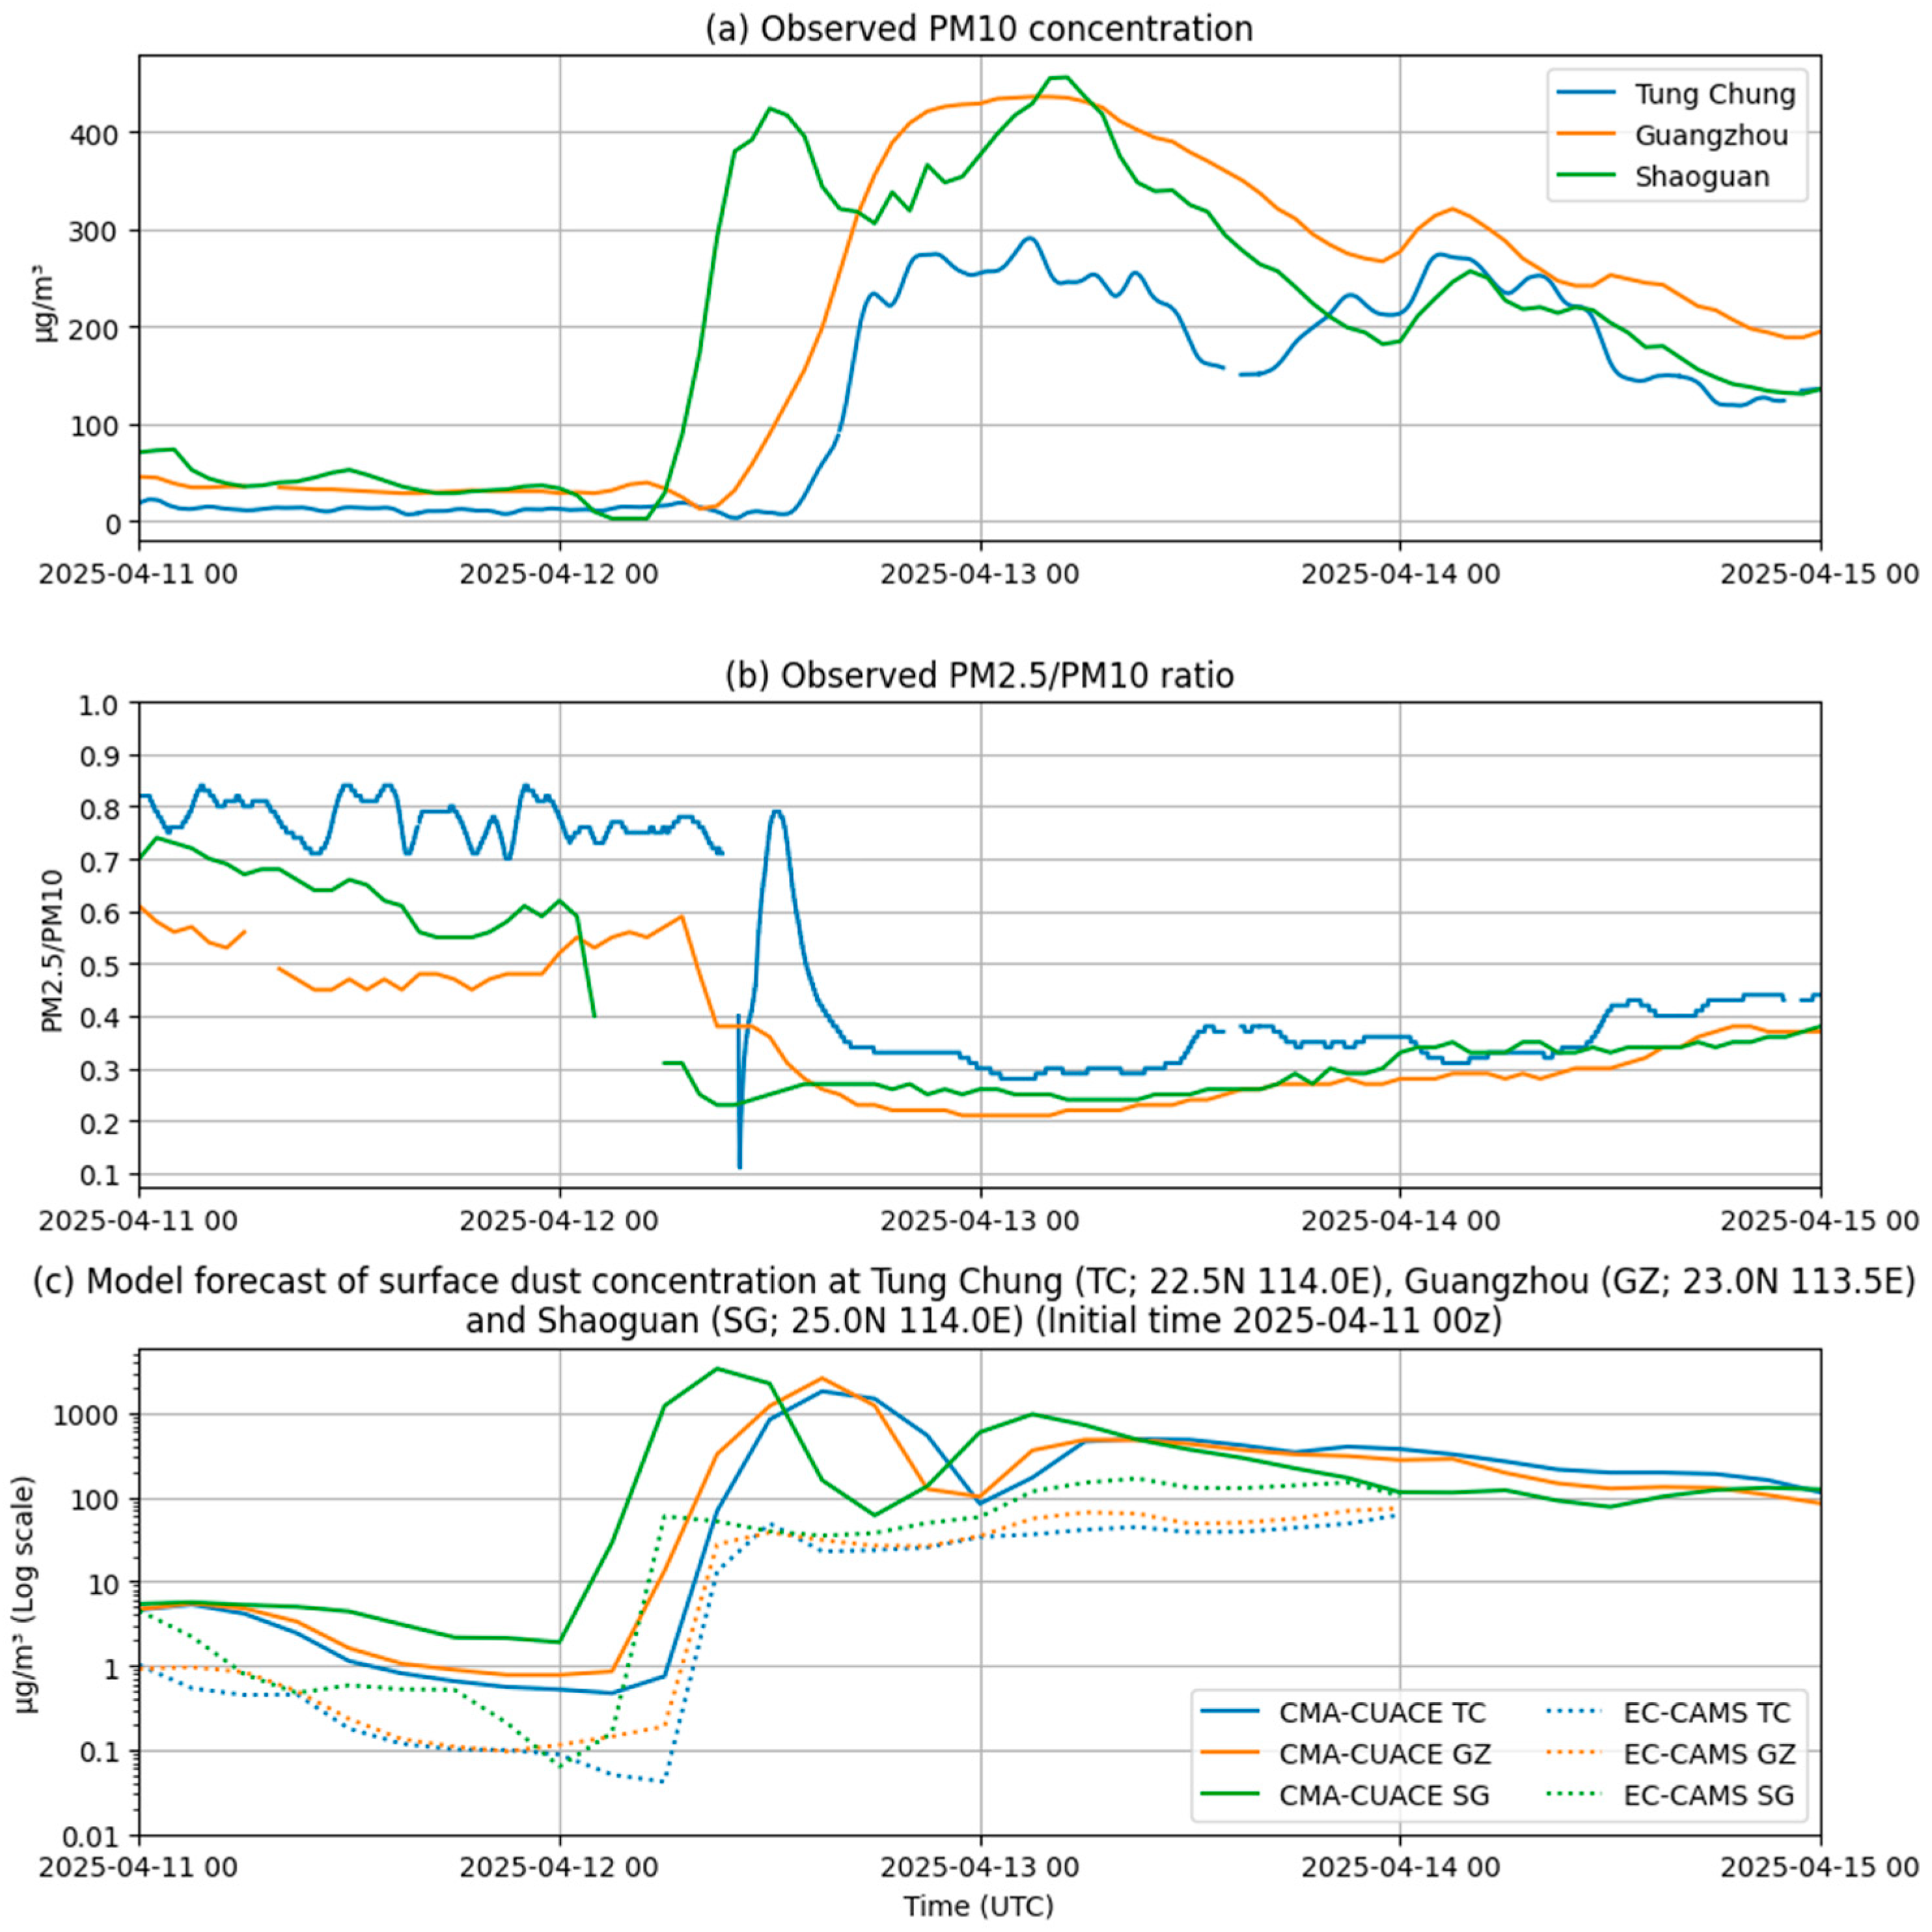
Figure 7 shows the sand/dust event in April 2025, with ground-based observations of PM10 (upper panel) from the stations Shaoguan (northern Guangdong), Guangzhou (central to southern Guangdong) and Tung Chung in Hong Kong (south China coast). For each station, the model values are obtained from the grid point nearest to the site coordinates, (22.5° N, 114.0° E) for Tung Chung, (23.0° N, 113.5° E) for Guangzhou, and (25.0° N, 114.0° E) for Shaoguan. The central panel of
Figure 7 shows the observed ratio PM2.5/PM10. For this sand/dust event in southern China, there was clearly a sharp rise of PM10 concentration and a sharp fall of ratio PM2.5/PM10, indicating the arrival of sand/dust from the north. Various model forecasts are shown in the lower panel of
Figure 7. Probably arising from the analysis, the CUACE model tends to over-forecast the PM10 concentration, whereas CAMS forecast appears to give more reasonable values.
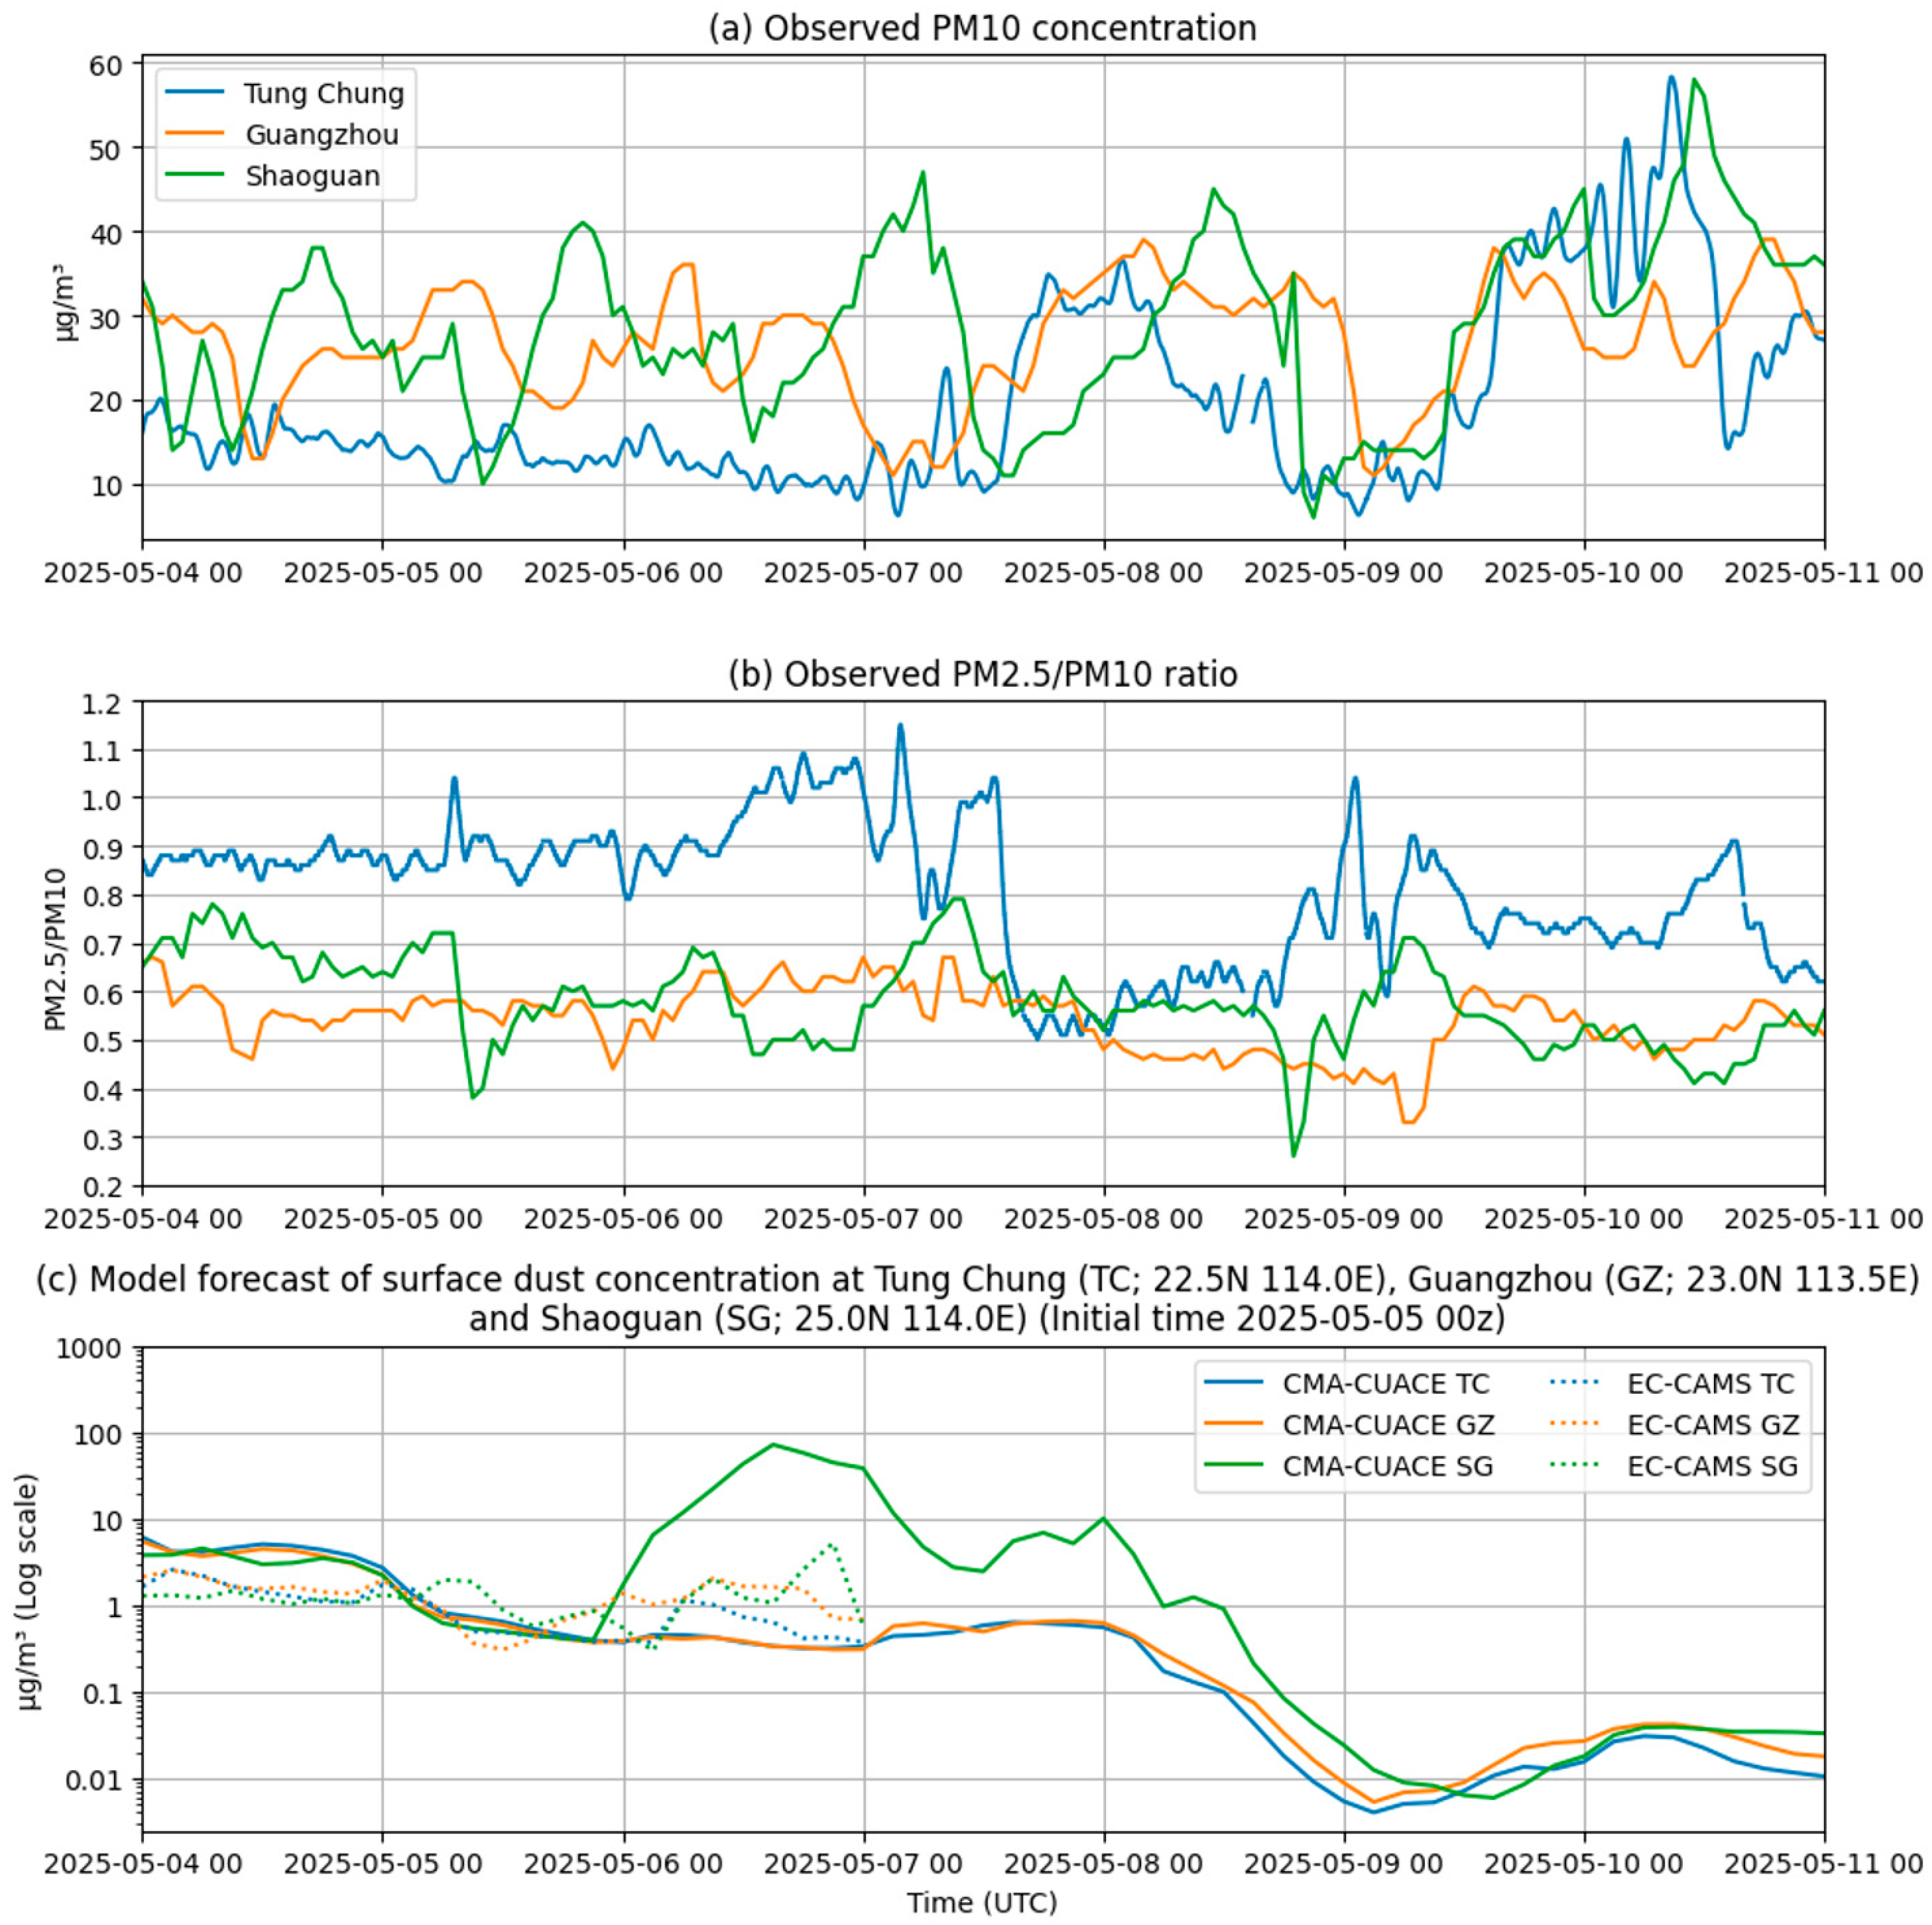
The results of the May 2025 event are shown in
Figure 8. From the time series of observed PM10 concentration and ratio PM2.5/PM10 (upper and central panels of
Figure 8), no sharp changes could be identified in this negative event, showing that the sand/dust did not manage to reach southern China. The model forecasts are shown in the lower panel of
Figure 8. Again, the over-estimation of the analysis of CUACE may lead to over-forecast by the same model, at least for Shaoguan. On the other hand, the performance of CAMS is more reasonable.
3.4. Events Observed by NOAA-20 VIIRS
Above results show comparison results among numerical models, geostationary satellite GK2B and ground stations. It is known for years polar-orbiting satellites could also supplement detailed observations for the events, including AOD and aerosol classification. For sake of completeness and a holistic view of the episodes, the information retrieved from NOAA-20 VIIRS is also provided below for further reference, despite its low update frequency in nature.
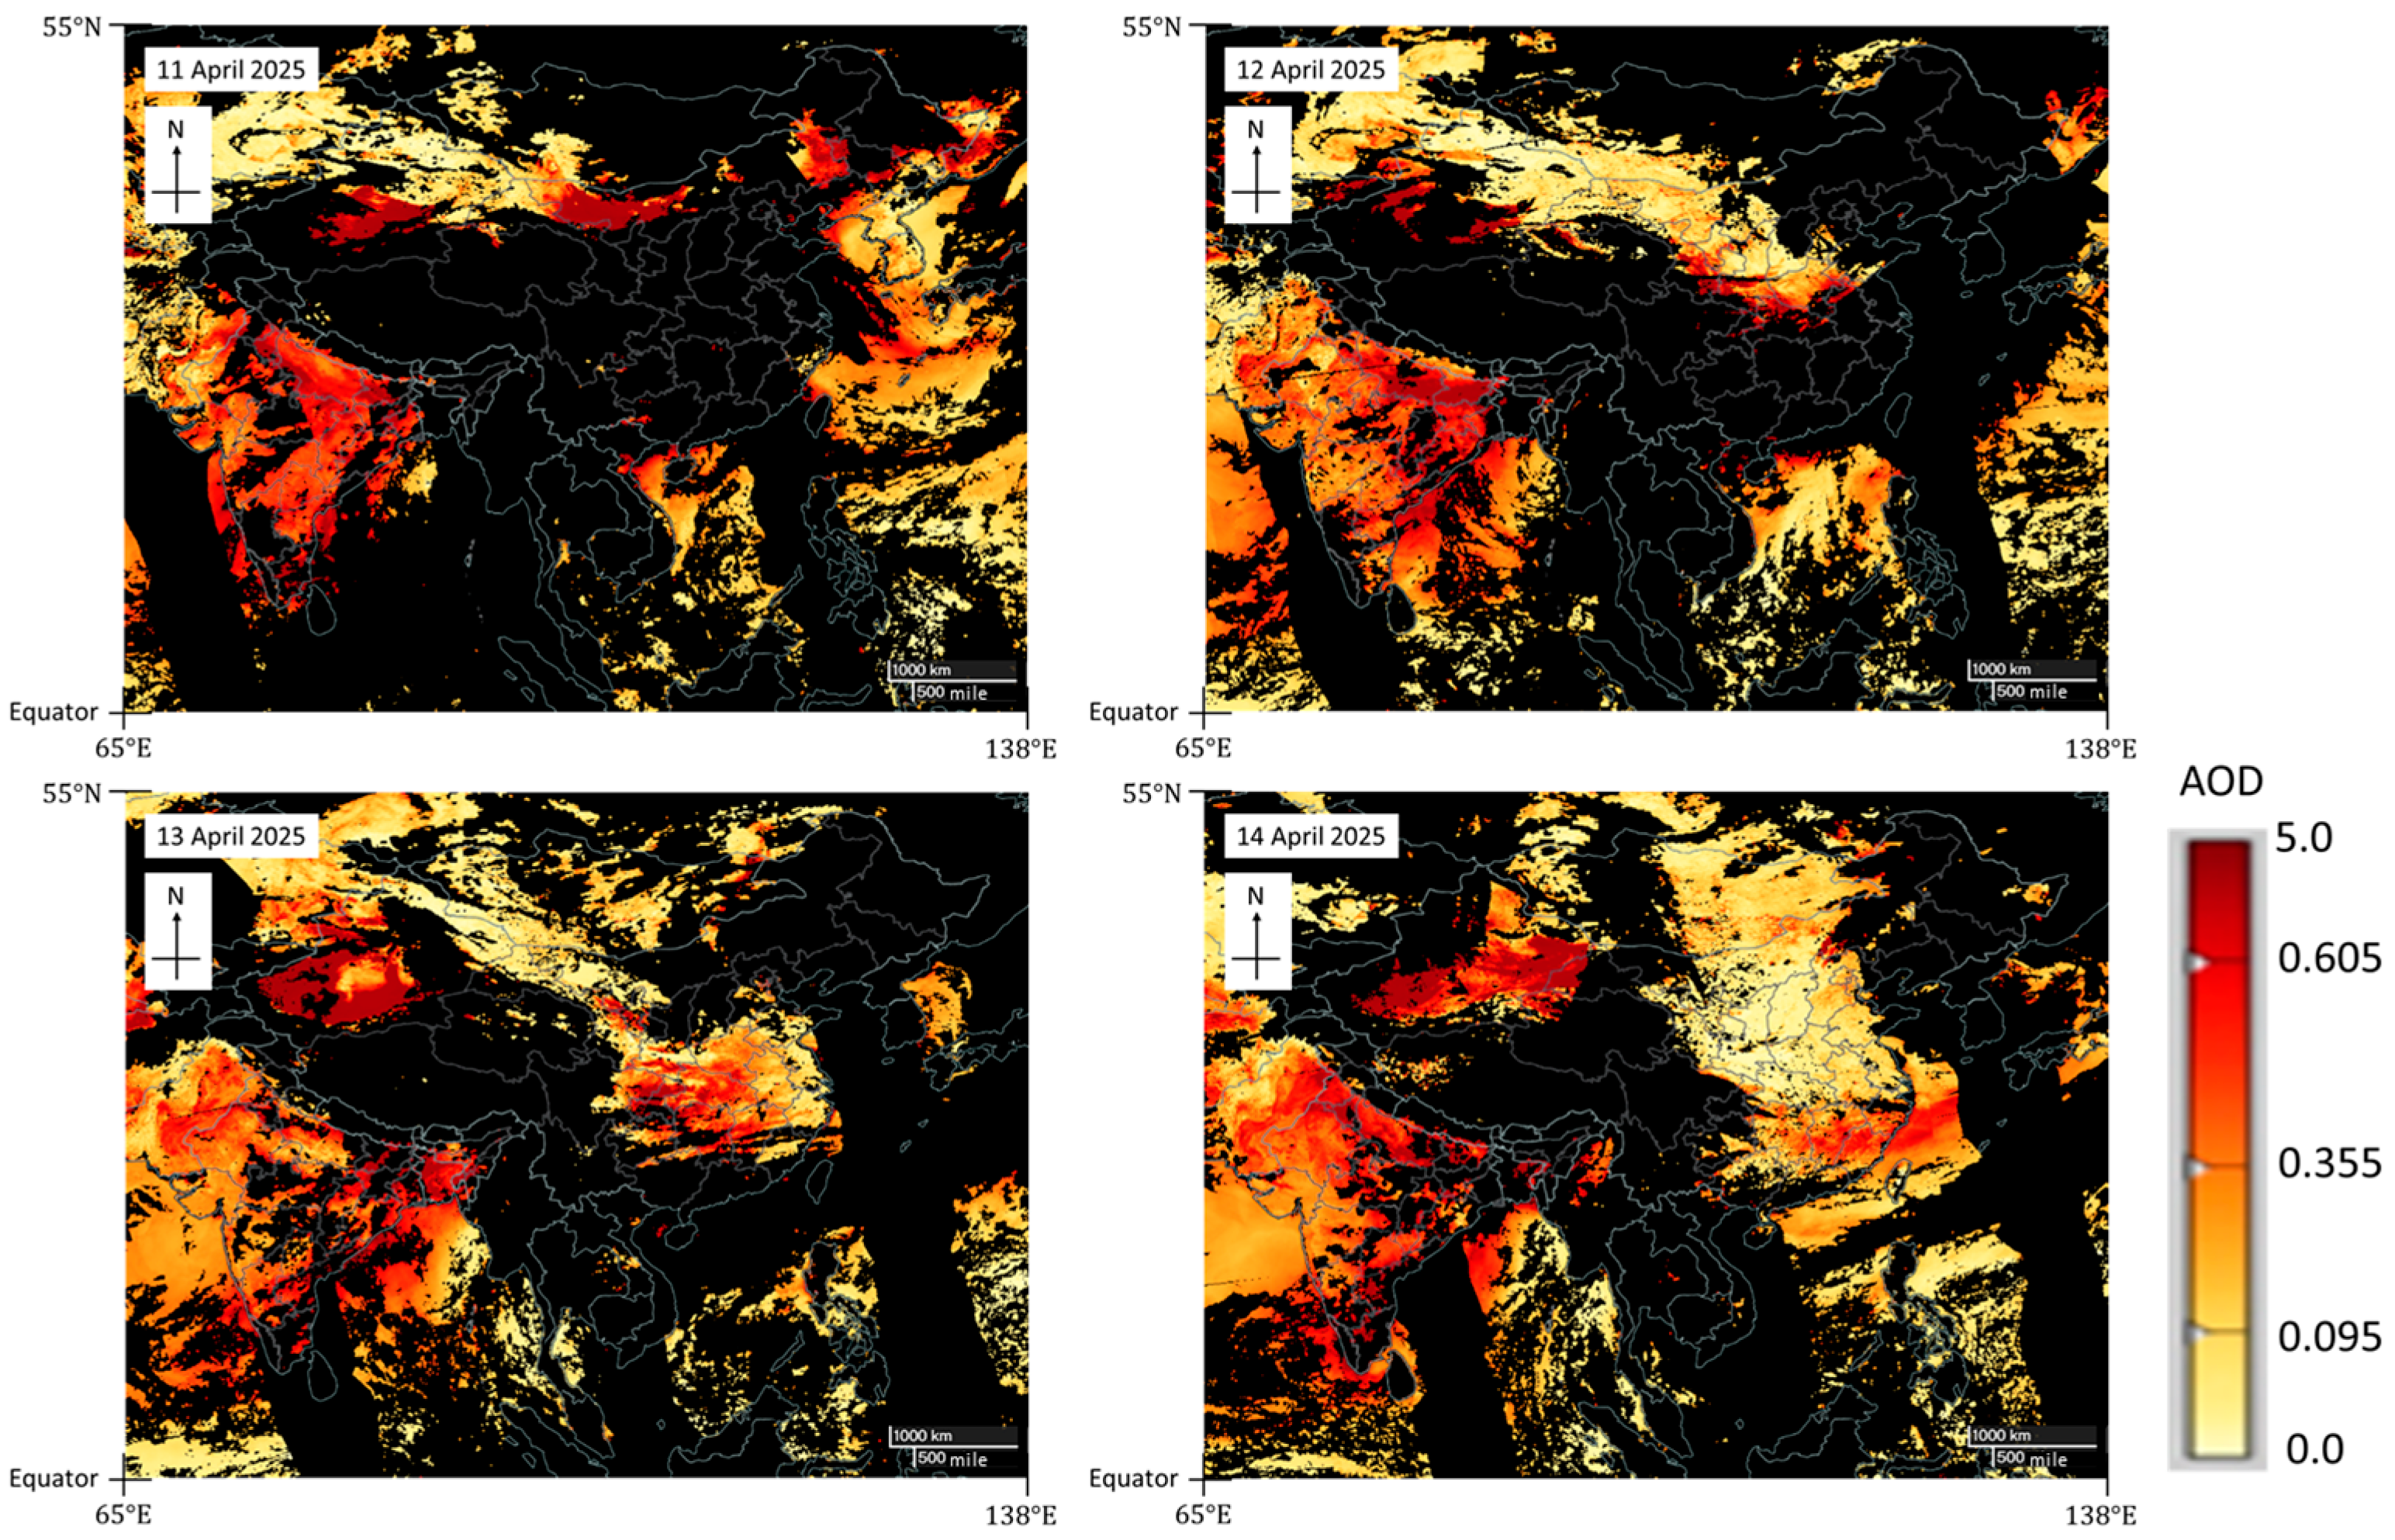
The AOD maps from NOAA-20 VIIRS for the sand/dust event of April 2025 are shown in
Figure 9. It is noted that a non-linear scale is adopted in such images. From 11–14 April 2025, the area with higher AOD spread southwards gradually, starting from Mongolia (11 April), to central China (13 April) and eventually reaching southern China (14 April). Unfortunately, during the propagation of sand/dust to the coast of southern China in 12–13 April, the region was cloudy so AOD data was not available. The trend of higher AOD movement is generally consistent with the ground-based reports [
24] and the PM10 concentration maps from GEMS as discussed earlier in this paper.
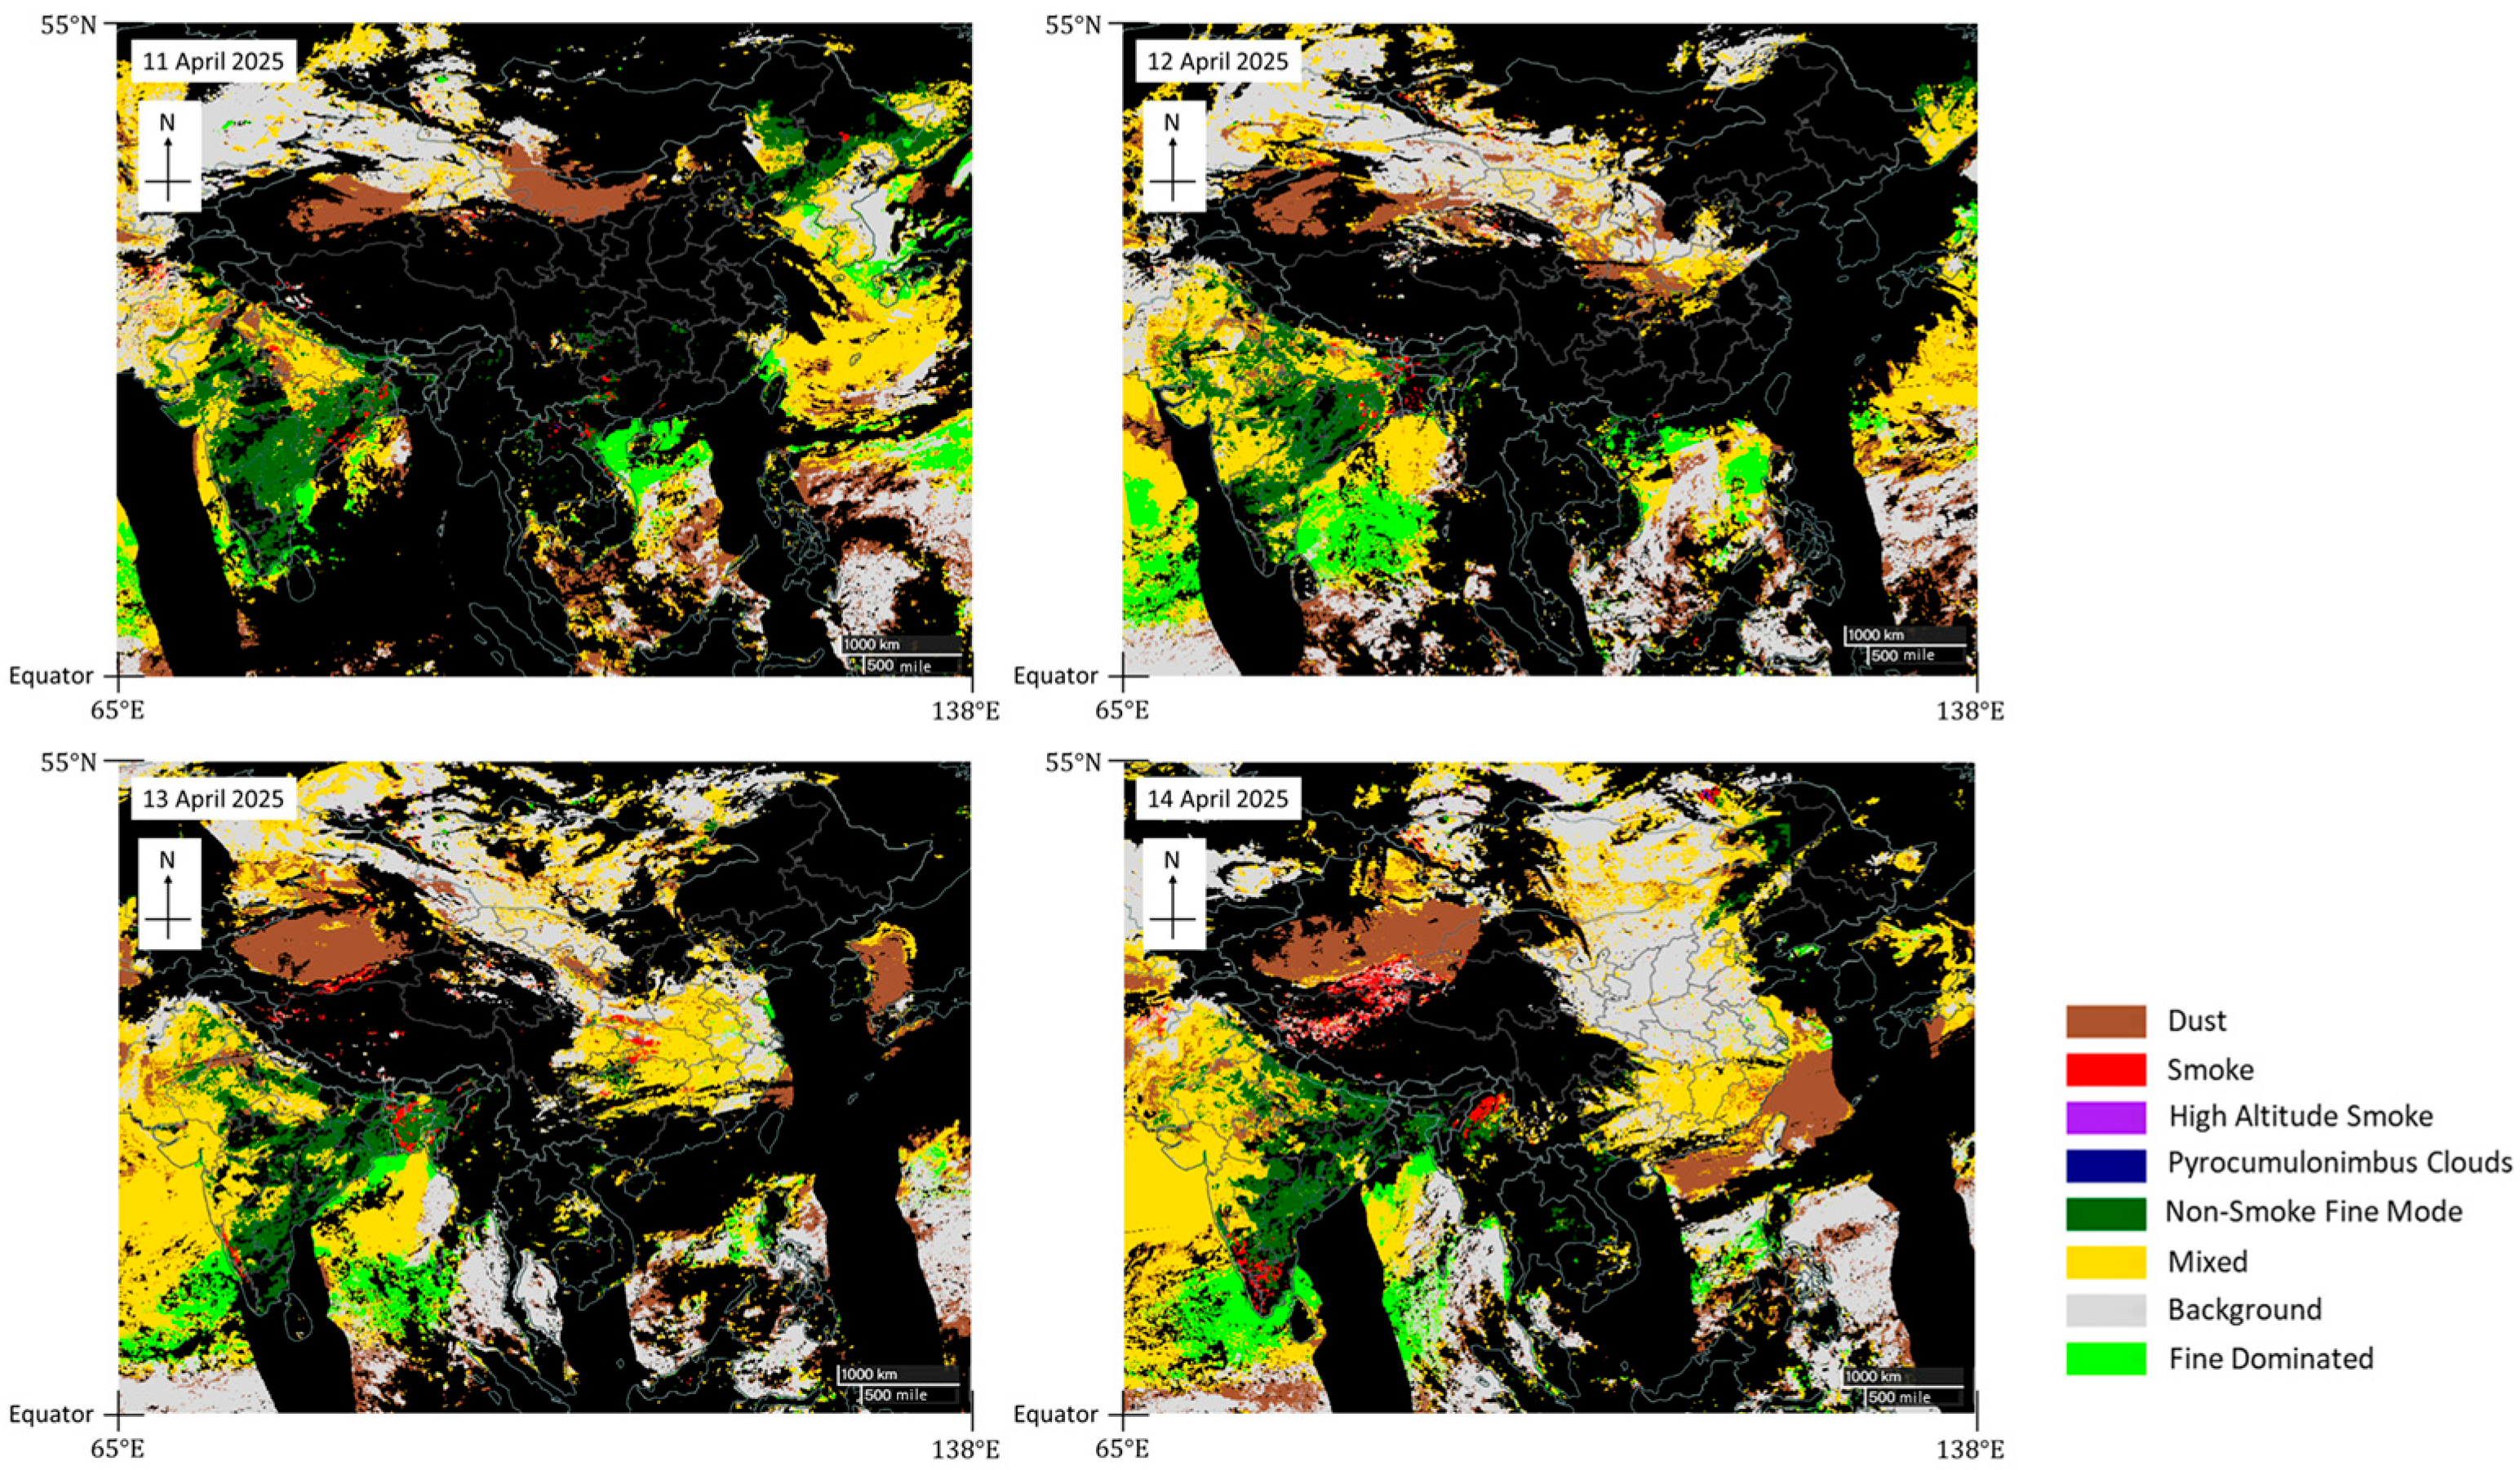
In contract to GK2B-GEMS observation, NOAA-20 VIIRS still has its own value to provide additional detailed information of the aerosol classification.
Figure 10 illustrates the aerosol classification maps in the case in April 2025. In general, it was sand when the sand/dust weather originated from Mongolia on 11 April 2025. On its way to the south, it was taken to be dust (brown) or mixed type (yellow) on 13 and 14 April 2025. Such classifications appear to be reasonable. However, on 13 April 2025, there were some tiny areas of smoke (red). It appears that some fine tuning of the classification algorithm is still required, as there were no smoke reports over central China at that time.
The transition of aerosol types over the coast of southern China from fine particulates and dust during episode proves the usefulness of polar-orbiting satellite observation. It matches with the picture given by the derivation from PM10 concentration observation.
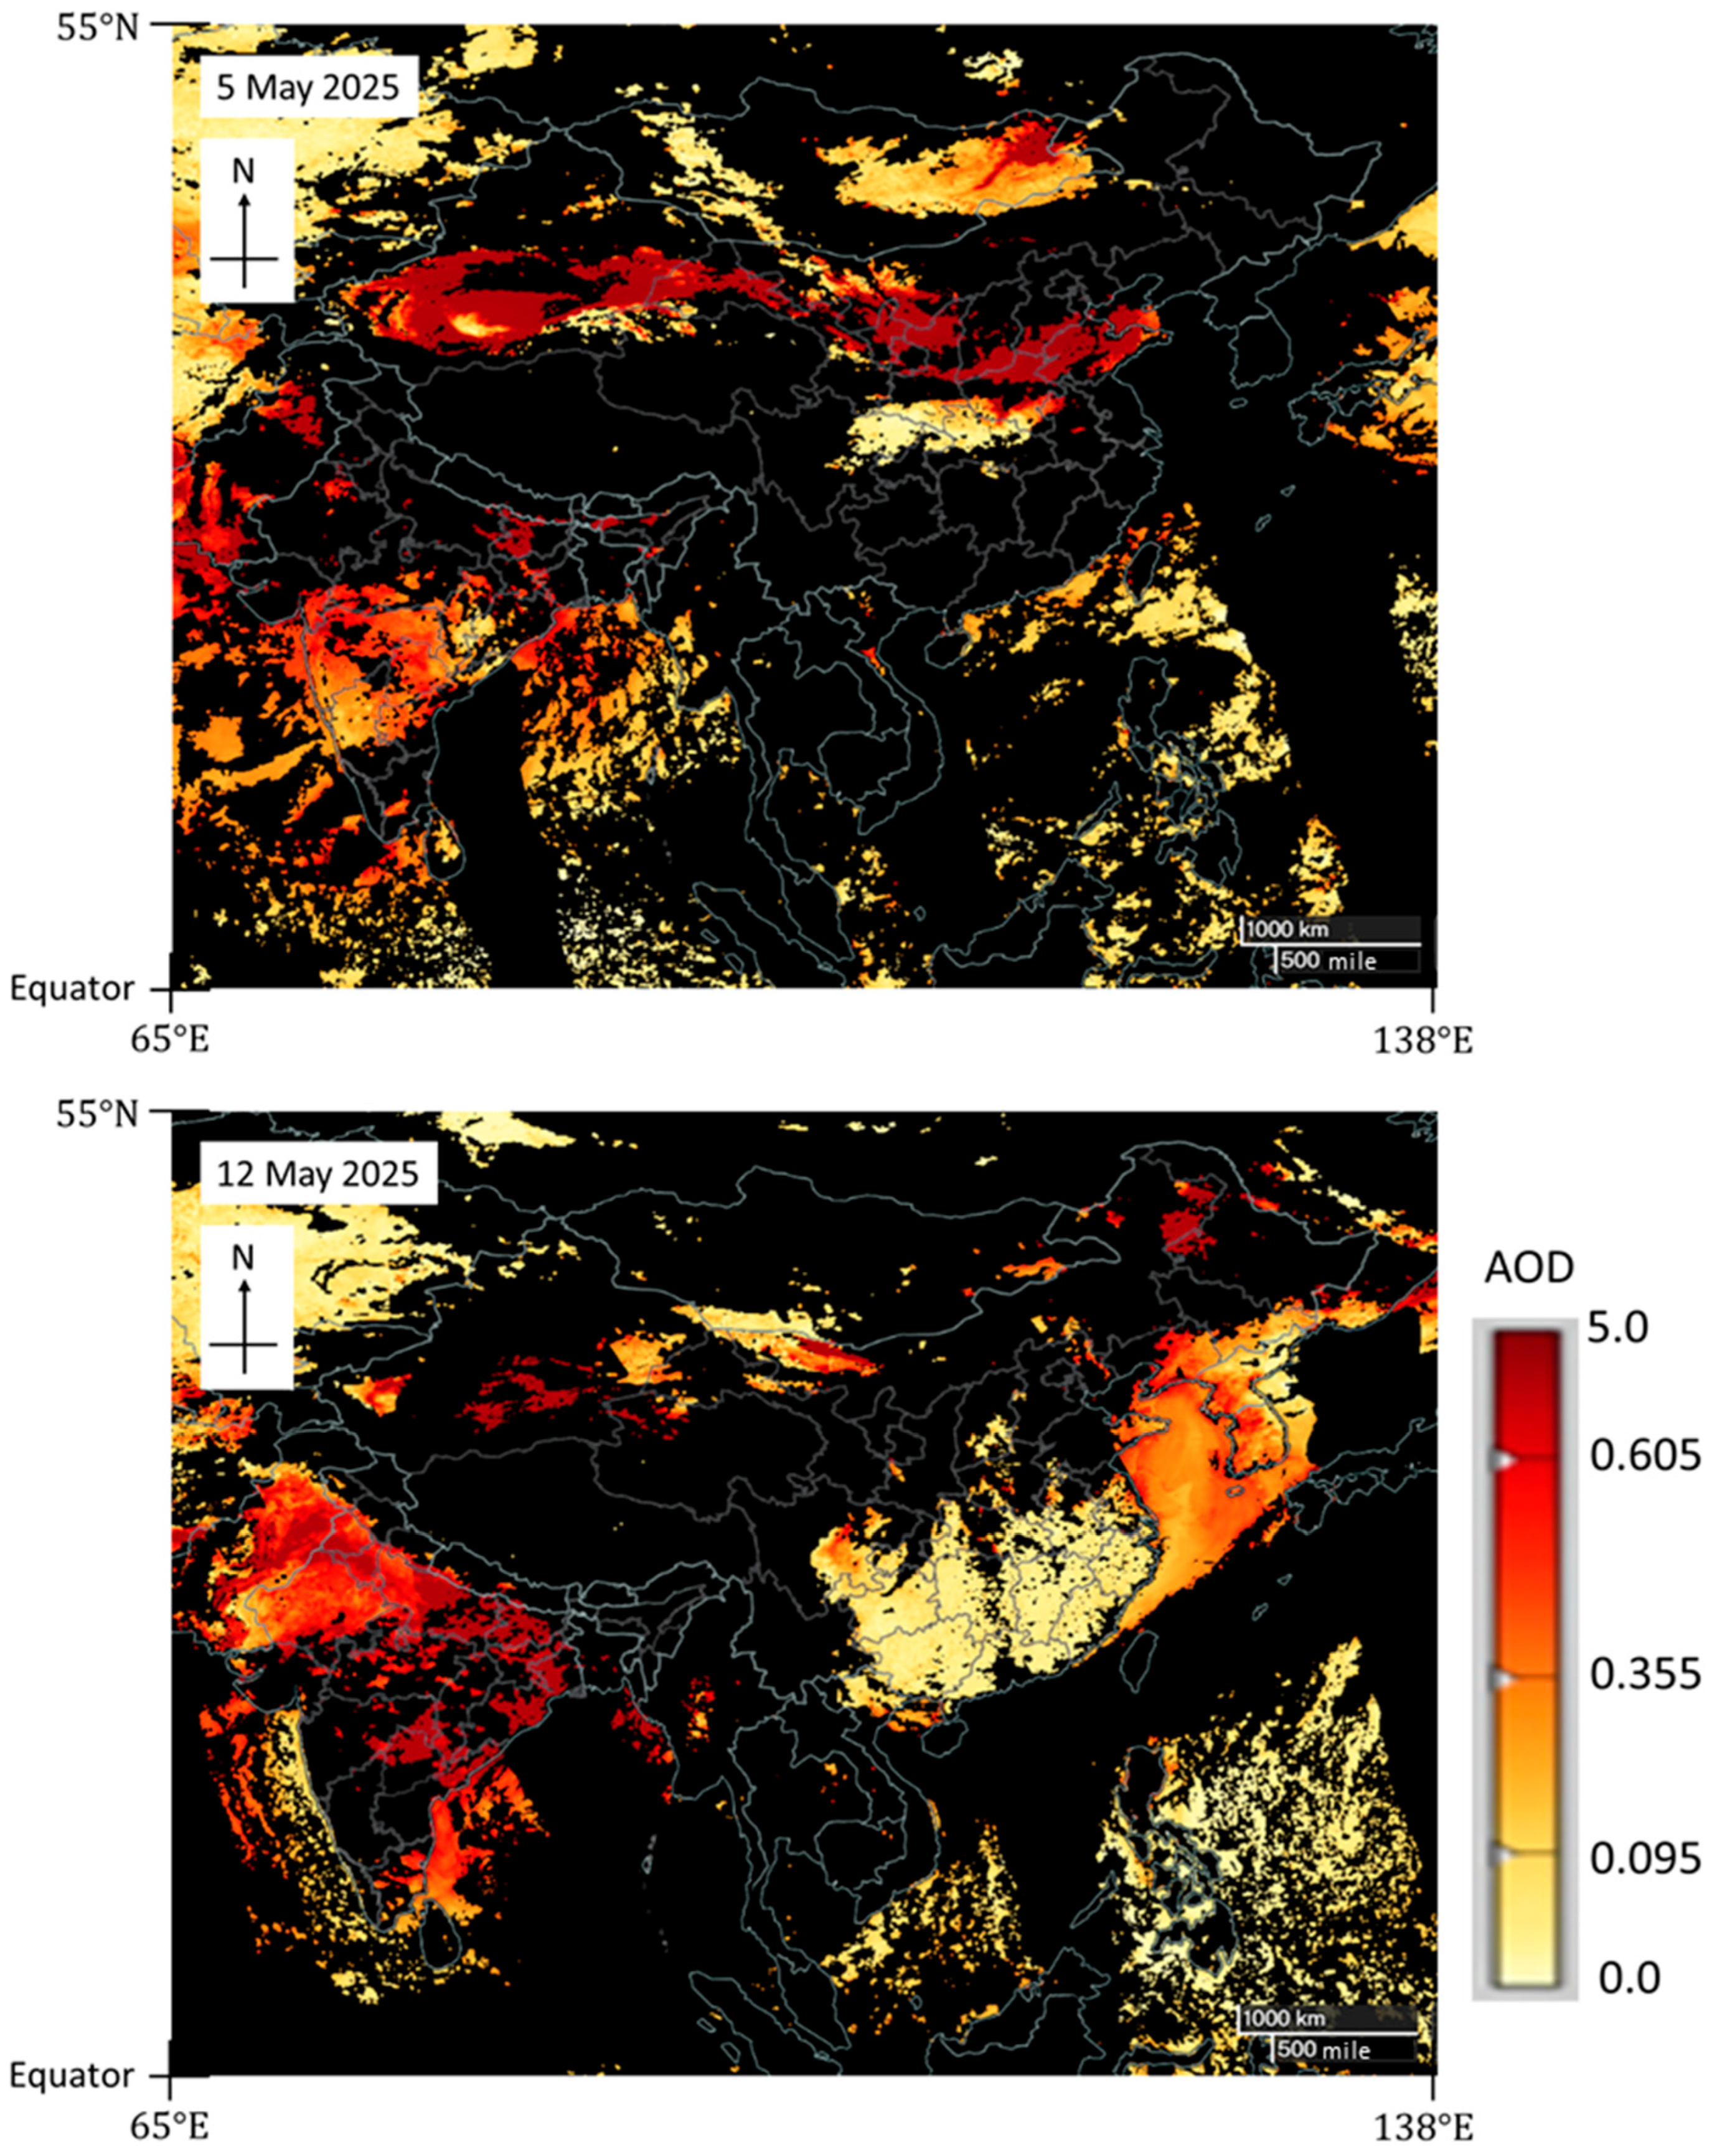
For the case in May 2025, the area with higher AOD values is mainly confined in northern China (
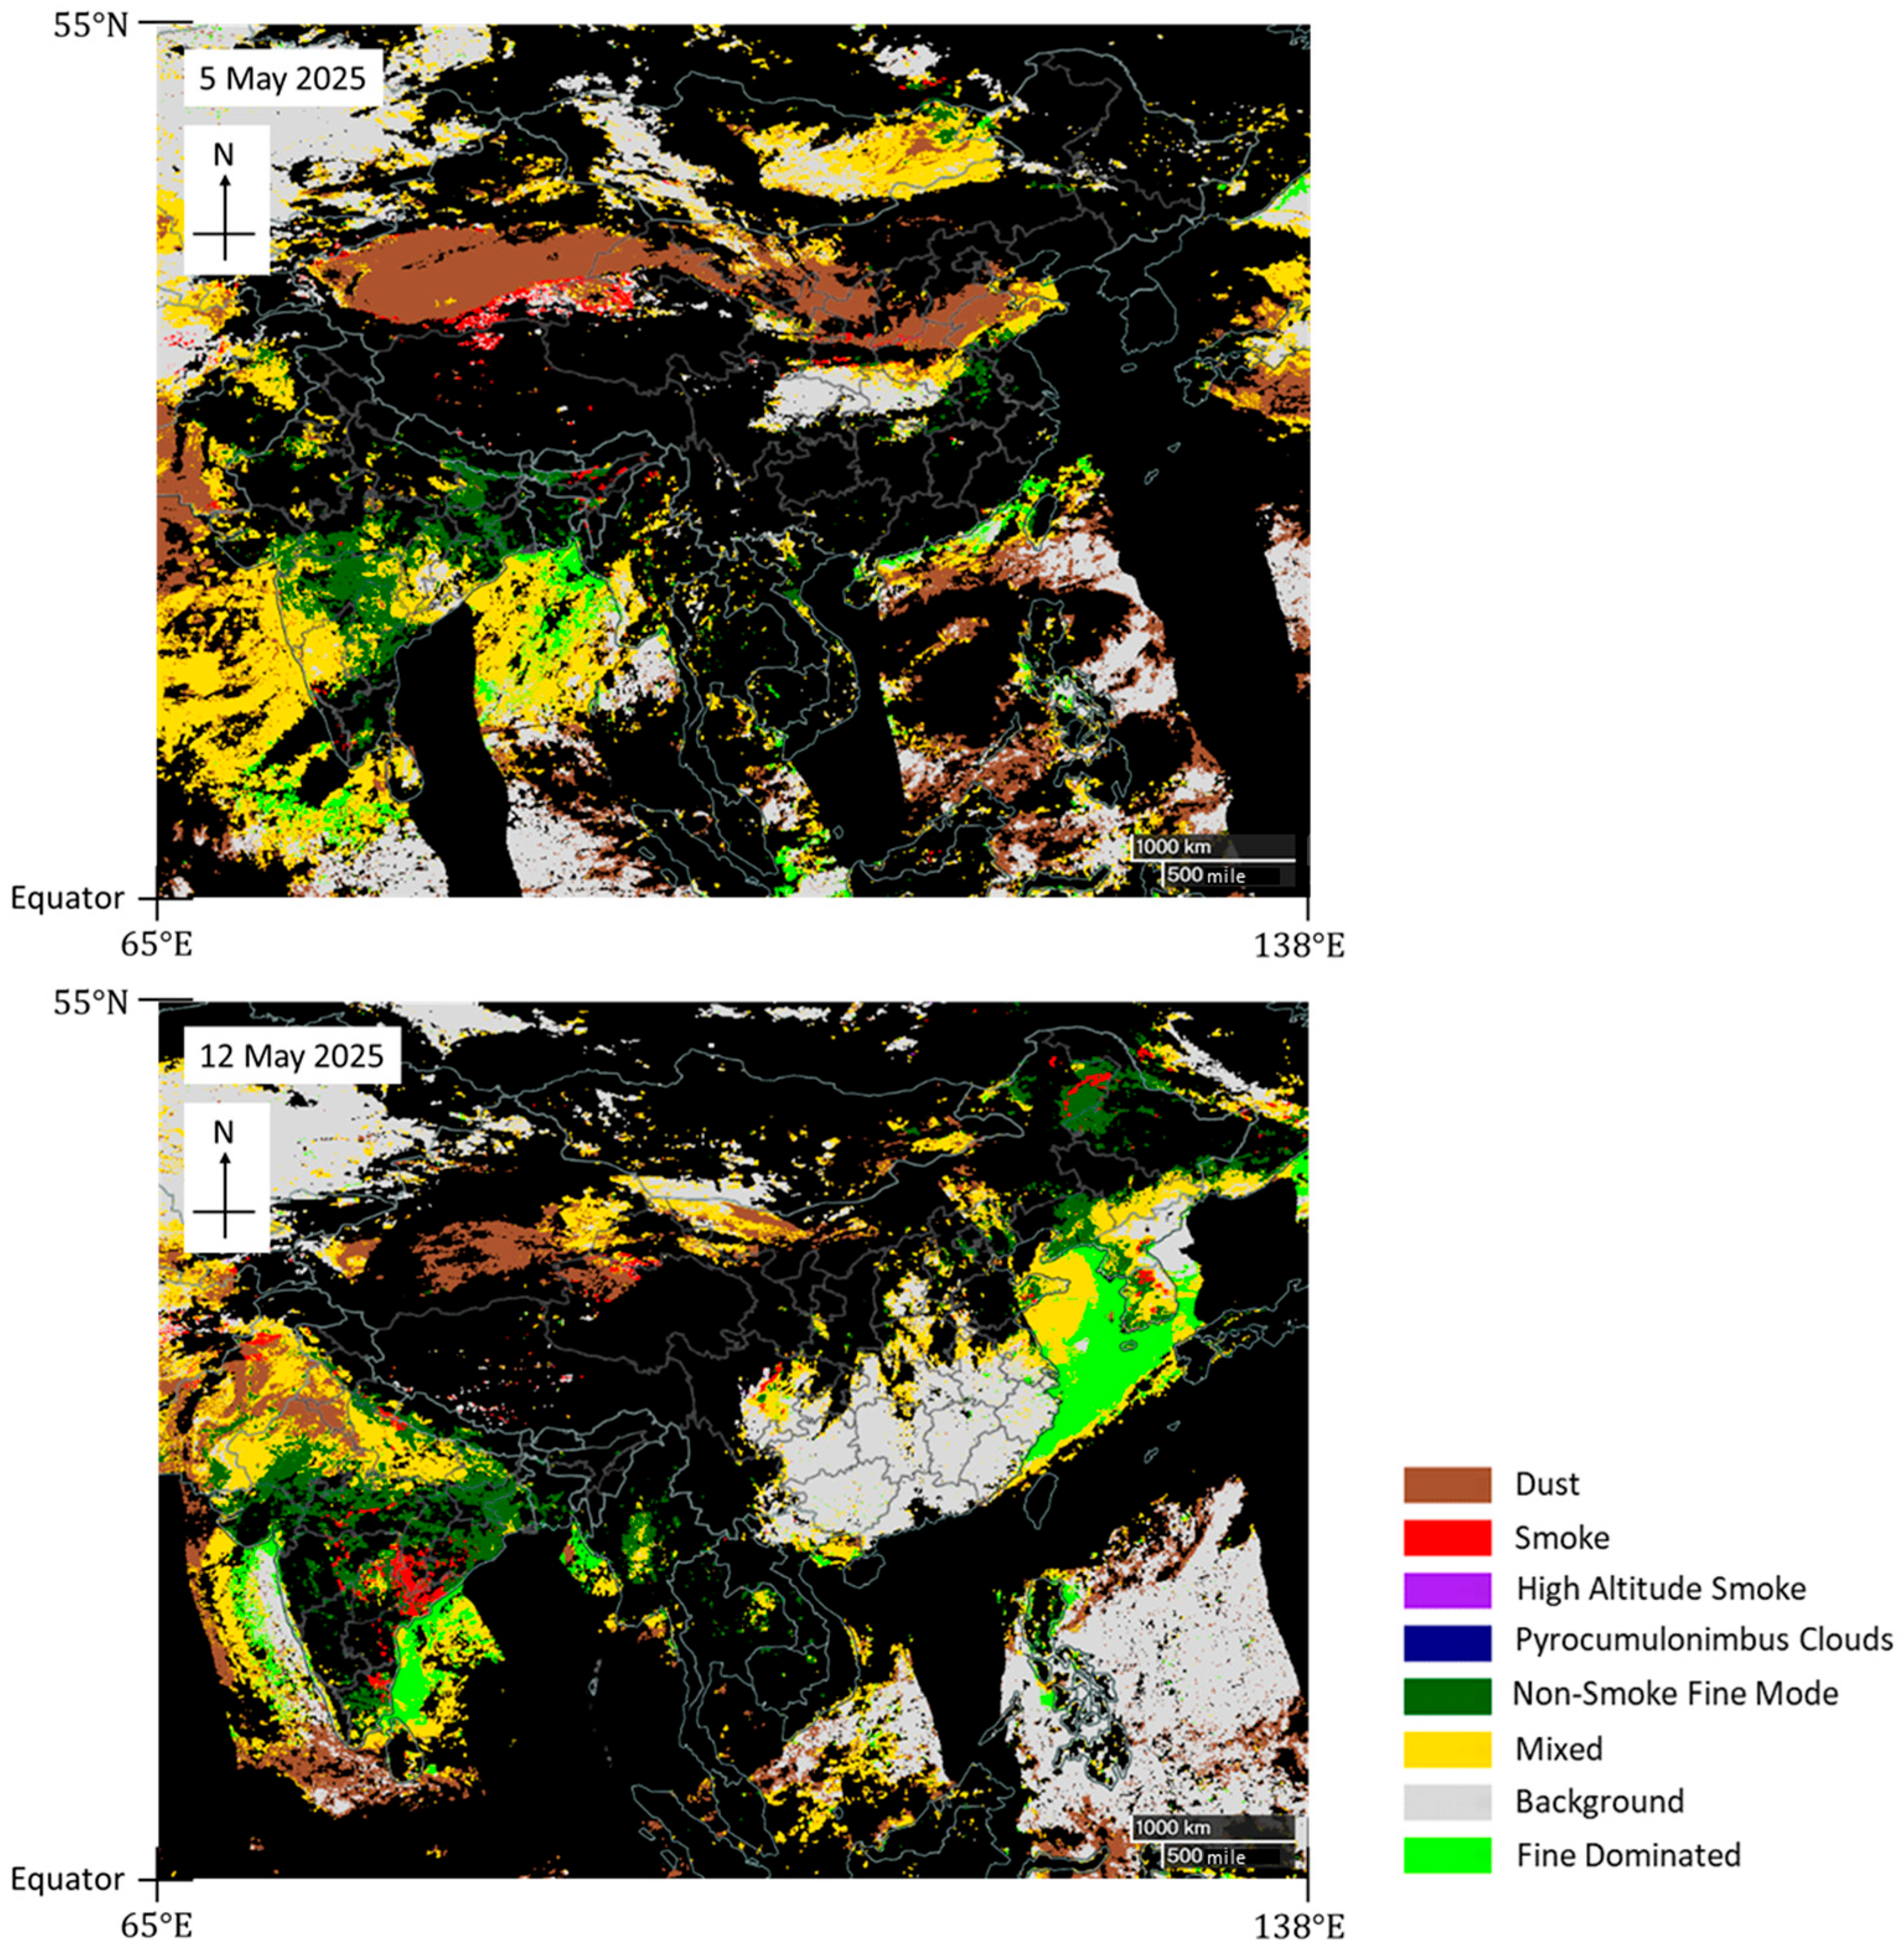
Figure 11). The southern China is generally clean in terms of air quality, with rather low AOD. The aerosol classifications as shown in
Figure 12 are also reasonable. Dust is analyzed over northern China. The southern China is so clean that the aerosol is classified as background. In fact, the PM10 and PM2.5 remain at rather low values over Guangdong and Hong Kong on 12 May 2025.
4. Conclusions
With the advancement of satellite technology, various satellite images on environmental monitoring, such as the concentrations of PM10 and PM2.5, AOD and aerosol classification, become available in real-time. This paper summarizes the performance of these satellite observations through a positive event and a negative event of sand/dust weather over southern China respectively in April and May 2025, and provides a valuable reference to the forecasters for the use of tools in future.
GK2B-GEMS observation of PM concentration over East Asia is compared with two numerical models: ECMWF-CAMS and CMA-CUACE. The former successfully captures the pattern of the sand/dust events in reasonable agreement with satellite observation, while the latter tends to overestimate the PM concentrations.
Quantitative comparison with the ground-based air quality measurements is also made for GK2B-GEMS observation. Using the PM concentrations measured by the air quality monitoring stations in Hong Kong in the event of mid-April 2025 as a ground-truth, the GK2B-GEMS data is found in good agreement with the ground-based measurement. It justifies the satellite data to be taken as “truth” in an extensive domain, especially for the region without ground-based measurement, and to provide a useful tool in assessing the performance of model analysis. Satellite observation provides a basis to further study the model forecasts on sand/dust weather. ECMWF-CAMS model is found to have reasonable performance in forecasting the arrival of sand/dust to southern China by comparison with ground-based measurement at Tung Chung, Guangzhou and Shaoguan, though latitude dependence in the quantitative comparison is observed. On the other hand, CMA-CUACE remains the tendency of overestimation.
Though geostationary satellite images provide wide temporal coverage and frequently updated information about PM10 concentration (hourly update during the day from GK2B-GEMS) in extensive spatial domain, the polar orbiting satellite images are still useful in providing detailed information, e.g., aerosol classification, for diagnosing the air quality. Such aerosol classification information is found to be generally reasonable in the two events as discussed in this paper.
The above study presents a data comparison among satellite observation, ground-based measurement and numerical models for the sand/dust events in April and May 2025. Southward spread of sand/dust weather to southern China is rare, this paper takes the initiative to analyze the rare events in details using the results of satellite advancements in recent years, and provide a holistic view and references to forecasters for using GK2B-GEMS and ECMWF-CAMS in future operation. In long term, more satellite observational data on air quality will be acquired to conduct a comprehensive quantitative study, including the statistical verification of latitude dependence of PM10 concentration. On the other hand, the biomass burning activities in the southeast Asian regions often bring impact to the southern China in springtime, for example the sudden drop in upper-air dew point as observed from radiosonde [
26]. It will be an interesting topic to test the performance of the satellite data from another perspective.
Supplementary Materials
The following supporting information can be downloaded at:
https://www.mdpi.com/article/10.3390/app152111745/s1, Figure S1: Comparison of PM10 concentration (µg/m
3) between ECMWF-CAMS model analysis and GK2B-GEMS satellite estimates for each day during the period of 4–12 May 2025; Figure S2: Comparison of CMA-CUACE model analysis of surface dust concentration (µg/m
3) and GK2B-GEMS satellite estimates of PM10 concentration (µg/m
3) for each day during the period of 4–12 May 2025.
Author Contributions
Conceptualization, P.W.C.; methodology, C.K.H. and H.Y.W.; software, Y.M., H.Y.W. and X.Z.; validation, C.K.H. and H.Y.W.; formal analysis, P.W.C., Y.W.C., C.K.H. and Y.M.; investigation, P.W.C., Y.W.C., C.K.H. and Y.M.; data curation, W.H.T. and H.Y.W.; writing—original draft preparation, P.W.C., Y.W.C., C.K.H. and Y.M.; writing—review and editing, W.H.T. and C.K.H.; visualization, W.H.T. and H.Y.W. All authors have read and agreed to the published version of the manuscript.
Funding
This research received no external funding.
Data Availability Statement
Data will be made available on request.
Conflicts of Interest
The authors declare no conflict of interest.
References
- Shin, M.; Kang, Y.; Park, S.; Im, J.; Yoo, C.; Quackenbush, L.J. Estimating Ground-Level Particulate Matter Concentrations Using Satellite-Derived Data: A Review. GISci. Remote Sens. 2019, 57, 174–189. [Google Scholar] [CrossRef]
- Liu, J.; Weng, F.; Li, Z. Satellite-based PM2.5 estimation directly from reflectance at the top of the atmosphere using a machine learning algorithm. Atmos. Environ. 2019, 208, 113–122. [Google Scholar] [CrossRef]
- Cho, Y.; Kim, J.; Choi, M.; Lim, H.; Lee, S.; Im, J. Fine Particulate Concentrations over East Asia Derived from Aerosols Measured by the Advanced Himawari Imager Using Machine Learning. Atmos. Res. 2023, 290, 106787. [Google Scholar] [CrossRef]
- Park, S.; Shin, M.; Im, J.; Song, C.-K.; Choi, M.; Kim, J.; Lee, S.; Park, R.; Kim, J.; Lee, D.-W.; et al. Estimation of Ground-Level Particulate Matter Concentrations through the Synergistic Use of Satellite Observations and Process-Based Models over South Korea. Atmos. Chem. Phys. 2019, 19, 1097–1113. [Google Scholar] [CrossRef]
- Park, S.; Im, J.; Kim, J.; Kim, S.-M. Geostationary Satellite-Derived Ground-Level Particulate Matter Concentrations Using Real-Time Machine Learning in Northeast Asia. Environ. Pollut. 2022, 306, 119425. [Google Scholar] [CrossRef] [PubMed]
- Choi, H.; Park, S.; Kang, Y.; Im, J.; Song, S. Retrieval of Hourly PM2.5 Using Top-of-Atmosphere Reflectance from Geostationary Ocean Color Imagers I and II. Environ. Pollut. 2023, 323, 121169. [Google Scholar] [CrossRef]
- Lee, J.; Cho, Y.; Lee, S.; Kim, J.; Park, Y.-J. Near-Real-Time Hourly PM2.5 Prediction over East Asia Using Geostationary Satellite Products and Machine Learning. Atmos. Environ. 2024, 334, 120700. [Google Scholar] [CrossRef]
- Pendergrass, D.C.; Jacob, D.J.; Oak, Y.J.; Lee, J.; Kim, M.; Kim, J.; Lee, S.; Zhai, S.; Irie, H.; Liao, H. A Continuous 2011–2022 Record of Fine Particulate Matter (PM2.5) in East Asia at Daily 2-km Resolution from Geostationary Satellite Observations: Population Exposure and Long-Term Trends. Atmos. Environ. 2025, 346, 121068. [Google Scholar] [CrossRef]
- Fu, D.; Shi, H.; Gueymard, C.A.; Yang, D.; Zheng, Y.; Che, H.; Fan, X.; Han, X.; Gao, L.A.; Bian, J.; et al. A Deep-Learning and Transfer-Learning Hybrid Aerosol Retrieval Algorithm for FY4-AGRI: Development and Verification over Asia. Engineering 2024, 38, 164–174. [Google Scholar] [CrossRef]
- Ma, Y.; Zhang, W.; Chen, X.; Zhang, L.; Liu, Q. High Spatial Resolution Nighttime PM2.5 Datasets in the Beijing–Tianjin–Hebei Region from 2015 to 2021 Using VIIRS/DNB and Deep Learning Model. Remote Sens. 2023, 15, 4271. [Google Scholar] [CrossRef]
- Agbehadji, I.E.; Obagbuwa, I.C. Systematic Review of Machine Learning and Deep Learning Techniques for Spatiotemporal Air Quality Prediction. Atmosphere 2024, 15, 1352. [Google Scholar] [CrossRef]
- Choi, H.; Hwang, S.; Kang, E.; Kim, Y.; Yang, S.; Malik, S.; Keya, J.N.; Lee, S.; Im, J. Satellite-based air quality monitoring using artificial intelligence: Research trends and future perspectives. J. Korean Soc. Atmos. Environ. 2025, 41, 179. [Google Scholar] [CrossRef]
- He, T.; Oomen, G.; Tang, W.; Bouarar, I.; Chance, K.; Clerbaux, C.; Edwards, D.P.; Eskes, H.; Gaubert, B.; Granier, C.; et al. Challenges and Opportunities Offered by Geostationary Space Observations for Air Quality Research and Emission Monitoring. Bull. Amer. Meteor. Soc. 2025, 106, E939–E963. [Google Scholar] [CrossRef]
- Oak, Y.J.; Jacob, D.J.; Pendergrass, D.C.; Dang, R.; Colombi, N.K.; Chong, H.; Lee, S.; Kuk, S.K.; Kim, J. Air quality trends and regimes in South Korea inferred from 2015–2023 surface and satellite observations. Atmos. Chem. Phys. 2025, 25, 3233–3253. [Google Scholar] [CrossRef]
- Geostationary Environment Monitoring Spectrometer (GEMS) Algorithm Theoretical Basis Document on Ground-Level Particulate Matter Estimation Algorithm. Available online: https://nesc.nier.go.kr/en/html/satellite/doc/doc.do (accessed on 10 September 2025).
- Sand and Dust Storm Warning Advisory and Assessment System Asian Regional Center. Available online: http://www.asdf-bj.net/ (accessed on 10 September 2025).
- EPD AQHI Air Quality Monitoring Network of Hong Kong. Available online: https://www.aqhi.gov.hk/en/monitoring-network/air-quality-monitoring-network.html (accessed on 11 September 2025).
- Air Quality Data from the China National Environmental Monitoring Centre. Available online: https://www.cnemc.cn/sssj/ (accessed on 18 September 2025).
- Visible Infrared Imaging Radiometer Suite (VIIRS) Sensor Data Record (SDR) User’s Guide. Available online: https://ncc.nesdis.noaa.gov/documents/documentation/viirs-users-guide-tech-report-142a-v1.3.pdf (accessed on 11 September 2025).
- EPS Aerosol Optical Depth (AOD) Algorithm Theoretical Basis Document. Available online: https://www.star.nesdis.noaa.gov/jpss/documents/ATBD/ATBD_EPS_Aerosol_AOD_v3.4.pdf (accessed on 11 September 2025).
- VIIRS Deep Blue Aerosol Algorithm Theoretical Basis Document. Available online: https://ladsweb.modaps.eosdis.nasa.gov/api/v2/content/archives/Document%20Archive/Science%20Data%20Product%20Documentation/Product%20Generation%20Algorithms/VIIRS_Deep_Blue_Aerosol_ATBD_March_2025.pdf (accessed on 11 September 2025).
- VIIRS Deep Blue Aerosol Product User Guide. Available online: https://ladsweb.modaps.eosdis.nasa.gov/api/v2/content/archives//Document%20Archive/Science%20Data%20Product%20Documentation/VIIRS_Deep_Blue_Aerosol_UG_v2_March_2025.pdf (accessed on 11 September 2025).
- NASA Worldview. Available online: https://worldview.earthdata.nasa.gov/ (accessed on 11 September 2025).
- Chan, P.W.; Chan, Y.W.; Ho, C.K.; Tse, W.P.; Jin, J.Q.; Wong, M.S.; Lau, A.K.H. A Very Rare Event of Sand/dust Weather in Hong Kong in Late Spring in 2025—Observational and Forecasting Aspects. Atmos. Environ. 2025, submitted. [CrossRef]
- Lau, S.Y.; Choy, B.L. The PM2.5 to PM10 Ratio as a Possible Indicator for Identifying Atmospheric Sand Dust in Hong Kong—An Exploratory Analysis. Hong Kong Meteorol. Soc. Bull. 2021, 21, 3–20. [Google Scholar]
- Chan, Y.W.; Tang, W.H.; Lau, T.K. A Rare Event on 1–2 April 2024: Reduced Visibility in Hong Kong Under Southerly Winds. Available online: https://www.hko.gov.hk/en/Observatorys-Blog/108747/A-rare-event-on-1-2-April-2024-reduced-visibility-in-Hong-Kong-under-southerly-winds (accessed on 24 October 2025).
Figure 1.
Location of Hong Kong at the black dot.
Figure 1.
Location of Hong Kong at the black dot.
Figure 2.
Comparison of PM10 concentration (µg/m3) between ECMWF-CAMS model analysis and GK2B-GEMS satellite estimates during the period of 11–15 April 2025. Column (a) shows the daily 00UTC 0.5-degree ECMWF-CAMS model analysis, while column (b) shows the GK2B-GEMS satellite estimated values at 0045UTC (refer to legend next to column (b) for the colour scale). Column (c) shows scatter plots of model-analysed PM10 concentration against the GK2B-GEMS estimates interpolated to a 0.5-degree grid with values at different latitude ranges indicated by different colours (refer to legend). The linear regression fit for all data pairs regardless of latitude range is indicated by the solid line with the proportion of variance explained (adjusted R-squared value) shown, while the dashed line is the identity line (y = x) for reference.
Figure 3.
Comparison of PM10 concentration (µg/m
3) between ECMWF-CAMS model analysis and GK2B-GEMS satellite estimates during the period of 7–11 May 2025 (refer to
Figure S1 in Supplementary Material for the comparison in the whole period of 4–12 May 2025). Column (
a) shows the daily 00UTC 0.5-degree ECMWF-CAMS model analysis, while column (
b) shows the GK2B-GEMS satellite estimated values at 0045UTC (refer to legend next to column (
b) for the colour scale). Column (
c) shows scatter plots of model-analysed PM10 concentration against the GK2B-GEMS estimates interpolated to a 0.5-degree grid with values at different latitude ranges indicated by different colours (refer to legend). The linear regression fit for all data pairs regardless of latitude range is indicated by the solid line with the proportion of variance explained (adjusted R-squared value) shown, while the dashed line is the identity line (y = x) for reference.
Figure 4.
Comparison of CMA-CUACE model analysis of surface dust concentration (µg/m3) and GK2B-GEMS satellite estimates of PM10 concentration (µg/m3) during the period of 10–15 April 2025. Column (a) shows the daily 00UTC 0.5-degree CMA-CUACE model analysis, while column (b) shows the GK2B-GEMS satellite estimated values at 0045UTC (refer to legend next to column (b) for the colour scale). Column (c) shows scatter plots of model-analysed surface dust concentration against the GK2B-GEMS estimates of PM10 concentration interpolated to a 0.5-degree grid with values at different latitude ranges indicated by different colours (refer to legend). The linear regression fit for all data pairs regardless of latitude range is indicated by the solid line with the proportion of variance explained (adjusted R-squared value) shown, while the dashed line is the identity line (y = x) for reference. For the sake of clarity, large values of surface dust concentration are omitted.
Figure 5.
Comparison of CMA-CUACE model analysis of surface dust concentration (µg/m
3) and GK2B-GEMS satellite estimates of PM10 concentration (µg/m
3) during the period of 7–11 May 2025. (refer to
Figure S2 in Supplementary Material for the comparison in the whole period of 4–12 May 2025) Column (
a) shows the daily 00UTC 0.5-degree CMA-CUACE model analysis, while column (
b) shows the GK2B-GEMS satellite estimated values at 0045UTC (refer to legend next to column (
b) for the colour scale). Column (
c) shows scatter plots of model-analysed surface dust concentration against the GK2B-GEMS estimates of PM10 concentration interpolated to a 0.5-degree grid with values at different latitude ranges indicated by different colours (refer to legend). The linear regression fit for all data pairs regardless of latitude range is indicated by the solid line with the proportion of variance explained (adjusted R-squared value) shown, while the dashed line is the identity line (y = x) for reference. For the sake of clarity, large values of surface dust concentration are omitted.
![Applsci 15 11745 g005 Applsci 15 11745 g005]()
Figure 6.
Those curves in faint colours show the concentration of PM10 (upper panel), PM2.5 (middle panel), and their ratios PM2.5/PM10 (lower panel) measured by fifteen air quality monitoring stations operated by the Hong Kong Environmental Protection Department (EPD) at various locations in Hong Kong while those thicker curves indicate the corresponding mean values. It is observed that GK2B-GEMS data around Hong Kong plotted as box-and-whiskers are generally consistent with ground observations during the sand/dust event in mid-April 2025. Hong Kong Time (HKT) is 8 h ahead of Coordinated Universal Time (UTC), i.e., HKT = UTC + 8 h.
Figure 7.
(a) Time series of observed PM10 concentration at Tung Chung (TC), Guangzhou (GZ), and Shaoguan (SG) from 11–15 April 2025; (b) Corresponding time series of observed PM2.5/PM10 ratio; (c) The 11 April 2025 00 UTC forecast of surface dust concentration by CMA-CUACE (solid lines) and ECMWF-CAMS (dashed lines) at the grid points corresponding to the three locations. A logarithmic scale is applied to illustrate variations across different order of magnitudes.
Figure 8.
(a) Time series of observed PM10 concentration at Tung Chung (TC), Guangzhou (GZ), and Shaoguan (SG) from 4–11 May 2025; (b) Corresponding time series of observed PM2.5/PM10 ratio; (c) The 4 May 2025 00 UTC forecast of surface dust concentration by CMA-CUACE and ECMWF-CAMS at the grid points corresponding to the three locations. A logarithmic scale is applied to illustrate variations across different order of magnitudes.
Figure 9.
AOD at 550nm from 11 to 14 April 2025 observed by NOAA-20 VIIRS. Region of high AOD was observed to spread southwards gradually, similar to the PM10 concentration from GK2B-GEMS.
Figure 9.
AOD at 550nm from 11 to 14 April 2025 observed by NOAA-20 VIIRS. Region of high AOD was observed to spread southwards gradually, similar to the PM10 concentration from GK2B-GEMS.
Figure 10.
Aerosol classification from 11–14 April 2025 observed by NOAA-20 VIIRS. The type over the coastal region of southern China changed from fine particulate (green) to dust (brown) during the episode.
Figure 10.
Aerosol classification from 11–14 April 2025 observed by NOAA-20 VIIRS. The type over the coastal region of southern China changed from fine particulate (green) to dust (brown) during the episode.
Figure 11.
AOD at 550 nm on 5 and 12 May 2025 observed by NOAA-20 VIIRS. High AOD region was confined to northern China and did not affect southern China.
Figure 11.
AOD at 550 nm on 5 and 12 May 2025 observed by NOAA-20 VIIRS. High AOD region was confined to northern China and did not affect southern China.
Figure 12.
Aerosol classification on 5 and 12 May 2025 observed by NOAA-20 VIIRS. Dust (brown) was confined to northern China. The southern China is so clean that the aerosol was classified as background on 12 May 2025.
Figure 12.
Aerosol classification on 5 and 12 May 2025 observed by NOAA-20 VIIRS. Dust (brown) was confined to northern China. The southern China is so clean that the aerosol was classified as background on 12 May 2025.
| Disclaimer/Publisher’s Note: The statements, opinions and data contained in all publications are solely those of the individual author(s) and contributor(s) and not of MDPI and/or the editor(s). MDPI and/or the editor(s) disclaim responsibility for any injury to people or property resulting from any ideas, methods, instructions or products referred to in the content. |
© 2025 by the authors. Licensee MDPI, Basel, Switzerland. This article is an open access article distributed under the terms and conditions of the Creative Commons Attribution (CC BY) license (https://creativecommons.org/licenses/by/4.0/).
