Article

Analysis on Wind-Induced Fatigue Life of Steel Tall Buildings Based on Wind Tunnel Test and Time-Domain Analysis

1
School of Civil Engineering, Beijing Jiaotong University, Beijing 100044, China
2
School of Civil Engineering, Henan Polytechnic University, Jiaozuo 454000, China
*
Author to whom correspondence should be addressed.
Appl. Sci. 2025, 15(21), 11736; https://doi.org/10.3390/app152111736
Submission received: 26 September 2025 / Revised: 29 October 2025 / Accepted: 2 November 2025 / Published: 3 November 2025
(This article belongs to the Special Issue Recent Advances in Wind Engineering)

Abstract

Dynamic wind-induced vibrations of structures will cause cyclic stresses in structural elements, potentially leading to fatigue damage accumulation or structural failure. Existing research on wind-induced fatigue mainly focuses on tower and large-span steel structures, such as chimneys, signal towers, transmission towers, long-span bridges, and wind turbines. However, existing studies on wind-induced fatigue damage in tall steel buildings remain limited. To determine whether and under what conditions wind-induced fatigue damage needs to be considered in tall steel structures, this study investigates wind-induced fatigue failure through wind tunnel tests and numerical simulations. Specifically, six real tall steel buildings were examined to assess their fatigue life under dynamic wind loads. First, wind tunnel tests using synchronous pressure models were conducted to obtain wind load time histories of these six buildings. Subsequently, time histories of wind-induced displacements and component stresses were calculated. The wind-induced fatigue life of each building was evaluated using the rain-flow counting method and the Palmgren–Miner rule, revealing that the fatigue life generally exceeds 400 years. The results demonstrate that tall steel structures designed according to current standards perform well in resisting wind-induced fatigue damage. Furthermore, when the ratio of the wind-induced root mean square (RMS) stress to the ultimate strength of a structural element reaches 0.125–0.164, the fatigue life of components may fall below the design life, indicating the necessity of considering potential fatigue damage. The RMS stress ratio can be preliminarily compared with the RMS stress ratio threshold proposed in this study to determine whether wind-induced fatigue damage needs to be considered in tall steel buildings. Finally, a simplified fatigue life prediction formula is established to provide approximate estimates for the fatigue life of tall steel buildings.

1. Introduction

As is well known, cyclic stress in structural elements may lead to fatigue phenomena, even if the cyclic stress is smaller than the material’s stress limit [1,2,3,4,5]. For wind-sensitive structures, dynamic wind-induced vibrations will result in fluctuating stress of structural elements. Fluctuating stress may lead to fatigue failure, and many instances of damage or collapses have been observed in various types of structures [6,7]. Extensive research has been conducted on the fatigue problems of wind-sensitive structures. For example, Ribeiro [8] proposed a methodology for assessing the wind-induced fatigue life of tall towers and applied this method to a 120 m cable-stayed steel lattice tower. Huo [9] investigated the wind-induced fatigue analysis of typical pitch-controlled 1.25 MW wind turbine structures. Banday [10] studied the buffeting-induced fatigue damage of long-span bridge decks under uncertain turbulence conditions. Rong [11] examined the wind-induced fatigue performance of large-span transmission tower-line systems, taking into account the combined probability distribution of wind direction and speed. From the perspective of research subjects, existing studies mainly focus on tower and large-span steel structures, including transmission towers [11,12], chimneys [13,14], signal towers [7,8,15], long-span bridges [16,17,18], large-span spatial structures [19,20], wind turbines [21,22,23,24], and other structures [25,26,27,28].
However, unlike the design and studies of other wind-sensitive structures where significant attention is paid to wind-induced fatigue analysis, the wind resistance design of tall buildings primarily focuses on the ultimate bearing capacity of structural elements, with relatively little attention given to cumulative fatigue damage. There is limited research on wind-induced fatigue in steel tall buildings, and few case studies have been conducted on the fatigue life of actual tall structures. Reference [29] mainly proposed an evaluation model for the fatigue life of structural components in buildings equipped with viscoelastic dampers and conducted fatigue analysis on a 15-story building. Reference [30] introduced a generalized cluster analysis framework and applied it to evaluate the crosswind fatigue life of the pinnacle of Burj Khalifa. Although these studies addressed specific technical challenges in fatigue analysis of tall steel structures, the case studies employed were primarily for validating the proposed methodologies rather than systematically investigating the fatigue life of real tall steel buildings. Due to the inadequacy of related research, two critical questions remain unanswered: Is it necessary to consider the fatigue life of steel tall buildings due to wind-induced vibrations under current normal design conditions? Under what specific conditions is it necessary to consider the fatigue life of steel tall buildings?
To address the aforementioned two questions, this study investigates the wind-induced fatigue life through case studies of six actual steel tall buildings. This research aims to evaluate the fatigue life of tall steel structures under current conventional design conditions and identify the specific conditions under which fatigue damage becomes a critical concern for tall steel structures. This study further establishes an empirical fatigue threshold based on the root mean square stress ratio and develops a simplified fatigue life prediction formula, providing practical design references for engineers conducting wind-induced fatigue design of tall steel structures.

2. Prototype Buildings and Wind Tunnel Test

This study examines six steel tall buildings located in three regions of China. The main information is shown in Table 1. The dynamic characteristics such as natural frequencies and corresponding mode shapes were obtained through finite element analysis (FEA) software. The finite element model employed for wind-induced response calculations in this study is a comprehensive three-dimensional spatial model that incorporates all six spatial degrees of freedom and accurately accounts for the mass and stiffness distribution of the structure. Notably, the fundamental dynamic parameters—specifically the first three natural frequencies and mode shapes—are comparatively presented in Table 1.
The above six buildings are all practical tall structures with wind-resistant designs conducted by the author’s research team. Synchronous pressure wind tunnel tests, which enable quantification of wind load spatial correlations, were performed in the WD-1 boundary layer wind tunnel at Wuhan University. The scaled rigid pressure models were fabricated from polymathic methacrylate and Figure 1 shows photographs of the wind tunnel test models for each building. A specific number of pressure points were arranged on the surface of the models to measure the fluctuating wind pressure. The sampling time for the fluctuating pressure was 60 s, and the corresponding prototype sampling durations all exceed 50 min according to similarity theory. The sampling frequency of 331 Hz was calibrated to encompass the fundamental modal frequencies of the prototype structure in compliance with the Nyquist sampling theorem. Simultaneously, the blockage ratio was maintained below 5% to ensure the wind pressure data remained unaffected by blockage effects. The rigid model demonstrated sufficient stiffness and was securely anchored to the base, preventing any wind-induced displacement that could compromise the authenticity of the wind load data. The six buildings examined in this study are all bluff bodies with sharp edges, which exhibit minimal sensitivity to Reynolds number effects. Consequently, such effects are generally considered negligible in structural wind-resistant design [31,32]. The main information of the wind tunnel tests for each building model is presented in Table 2, and the wind direction angles and coordinate definition are illustrated in Figure 2.

3. Probability Distribution of Wind Speed and Direction

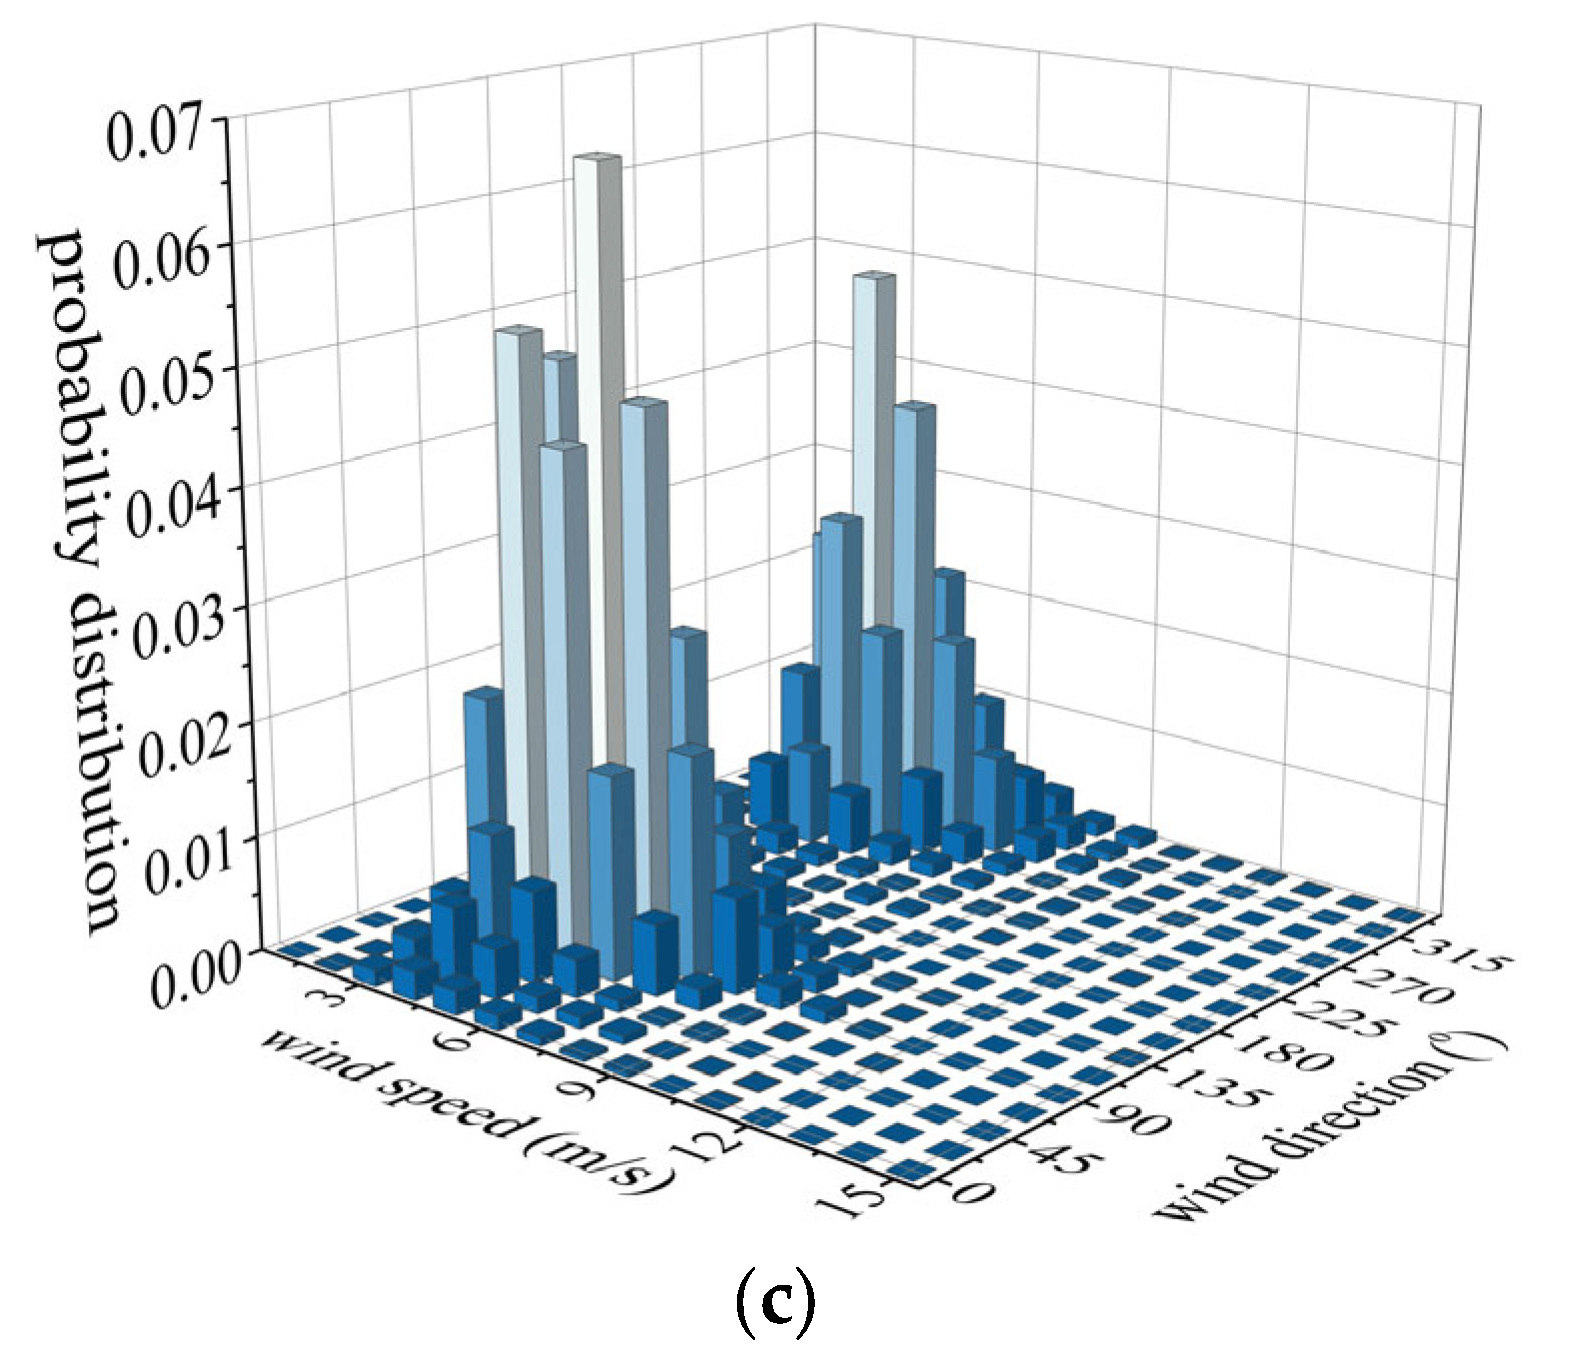
The wind speed and direction samples used in this study are derived from statistical data provided by the China Meteorological Data Network (https://www.cma.gov.cn/ (accessed on 5 January 2022)), specifically the daily maximum wind speed values and corresponding wind direction data at a height of 10 m, with a 10 min average time interval, recorded over the past 30 years at the Changsha, Wuhan, and Huangshi meteorological stations, respectively. Based on the statistical data of wind speed and direction, the probability distributions of wind speed and direction for each region can be obtained (see Figure 3).
After obtaining the frequency distribution of wind speed samples within each wind speed and direction interval, the Gumbel distribution was used to express the joint distribution function of wind speed and direction with the expression:
P ( x , θ ) = f ( θ ) exp exp x b ( θ ) a ( θ )
where x represents the average wind speed value, θ denotes the wind direction angle, P(x, θ) is the probability of occurrence for each wind speed and direction, and f(θ) is the wind direction frequency function that reflects the distribution of extreme wind speed samples across different wind directions; a(θ) and b(θ) are the scale parameter and location parameter, respectively.
The meteorological statistical data are results under discrete wind directions and speeds, while wind vibration analysis requires the density function of all possible wind speeds and directions. To address this issue, harmonic functions [33] were employed to fit the wind direction frequency and the distribution function parameters around the entire circumference. The formulas are shown as follows:
f ( θ ) = c θ + i = 1 n d θ cos ( i θ e θ )
a ( θ ) = c a + i = 1 n d a cos ( i θ e a )
b ( θ ) = c b + i = 1 n d b cos ( i θ e b )
In the above equations, c, d, and e are the undetermined parameters in the harmonic function, with the superscripts θ, a, and b used to distinguish the wind direction frequency function, scale parameter, and shape parameter, respectively; n represents the order of the harmonic function, and n is set to 5 according to accuracy requirements. The least squares method is used to fit each undetermined parameter, thereby obtaining the joint probability distribution model of wind speed and direction for each region, and the fitting results are shown in Figure 4. By comparing the results in Figure 3 and Figure 4, it can be seen that the distribution model is quite consistent with the probability distribution of the original statistical results; meanwhile, calculations show that the correlation coefficient between the fitted results and the actual sample data for each wind direction is above 0.996, indicating a high fitting accuracy.
After obtaining the joint probability distribution function of wind speed and direction at the meteorological station, the joint distribution function at the building location can be derived based on the wind speed conversion relationship, which can then be used for structural wind-resistant design.

4. Calculation of Wind-Induced Response

4.1. Static Wind-Induced Response

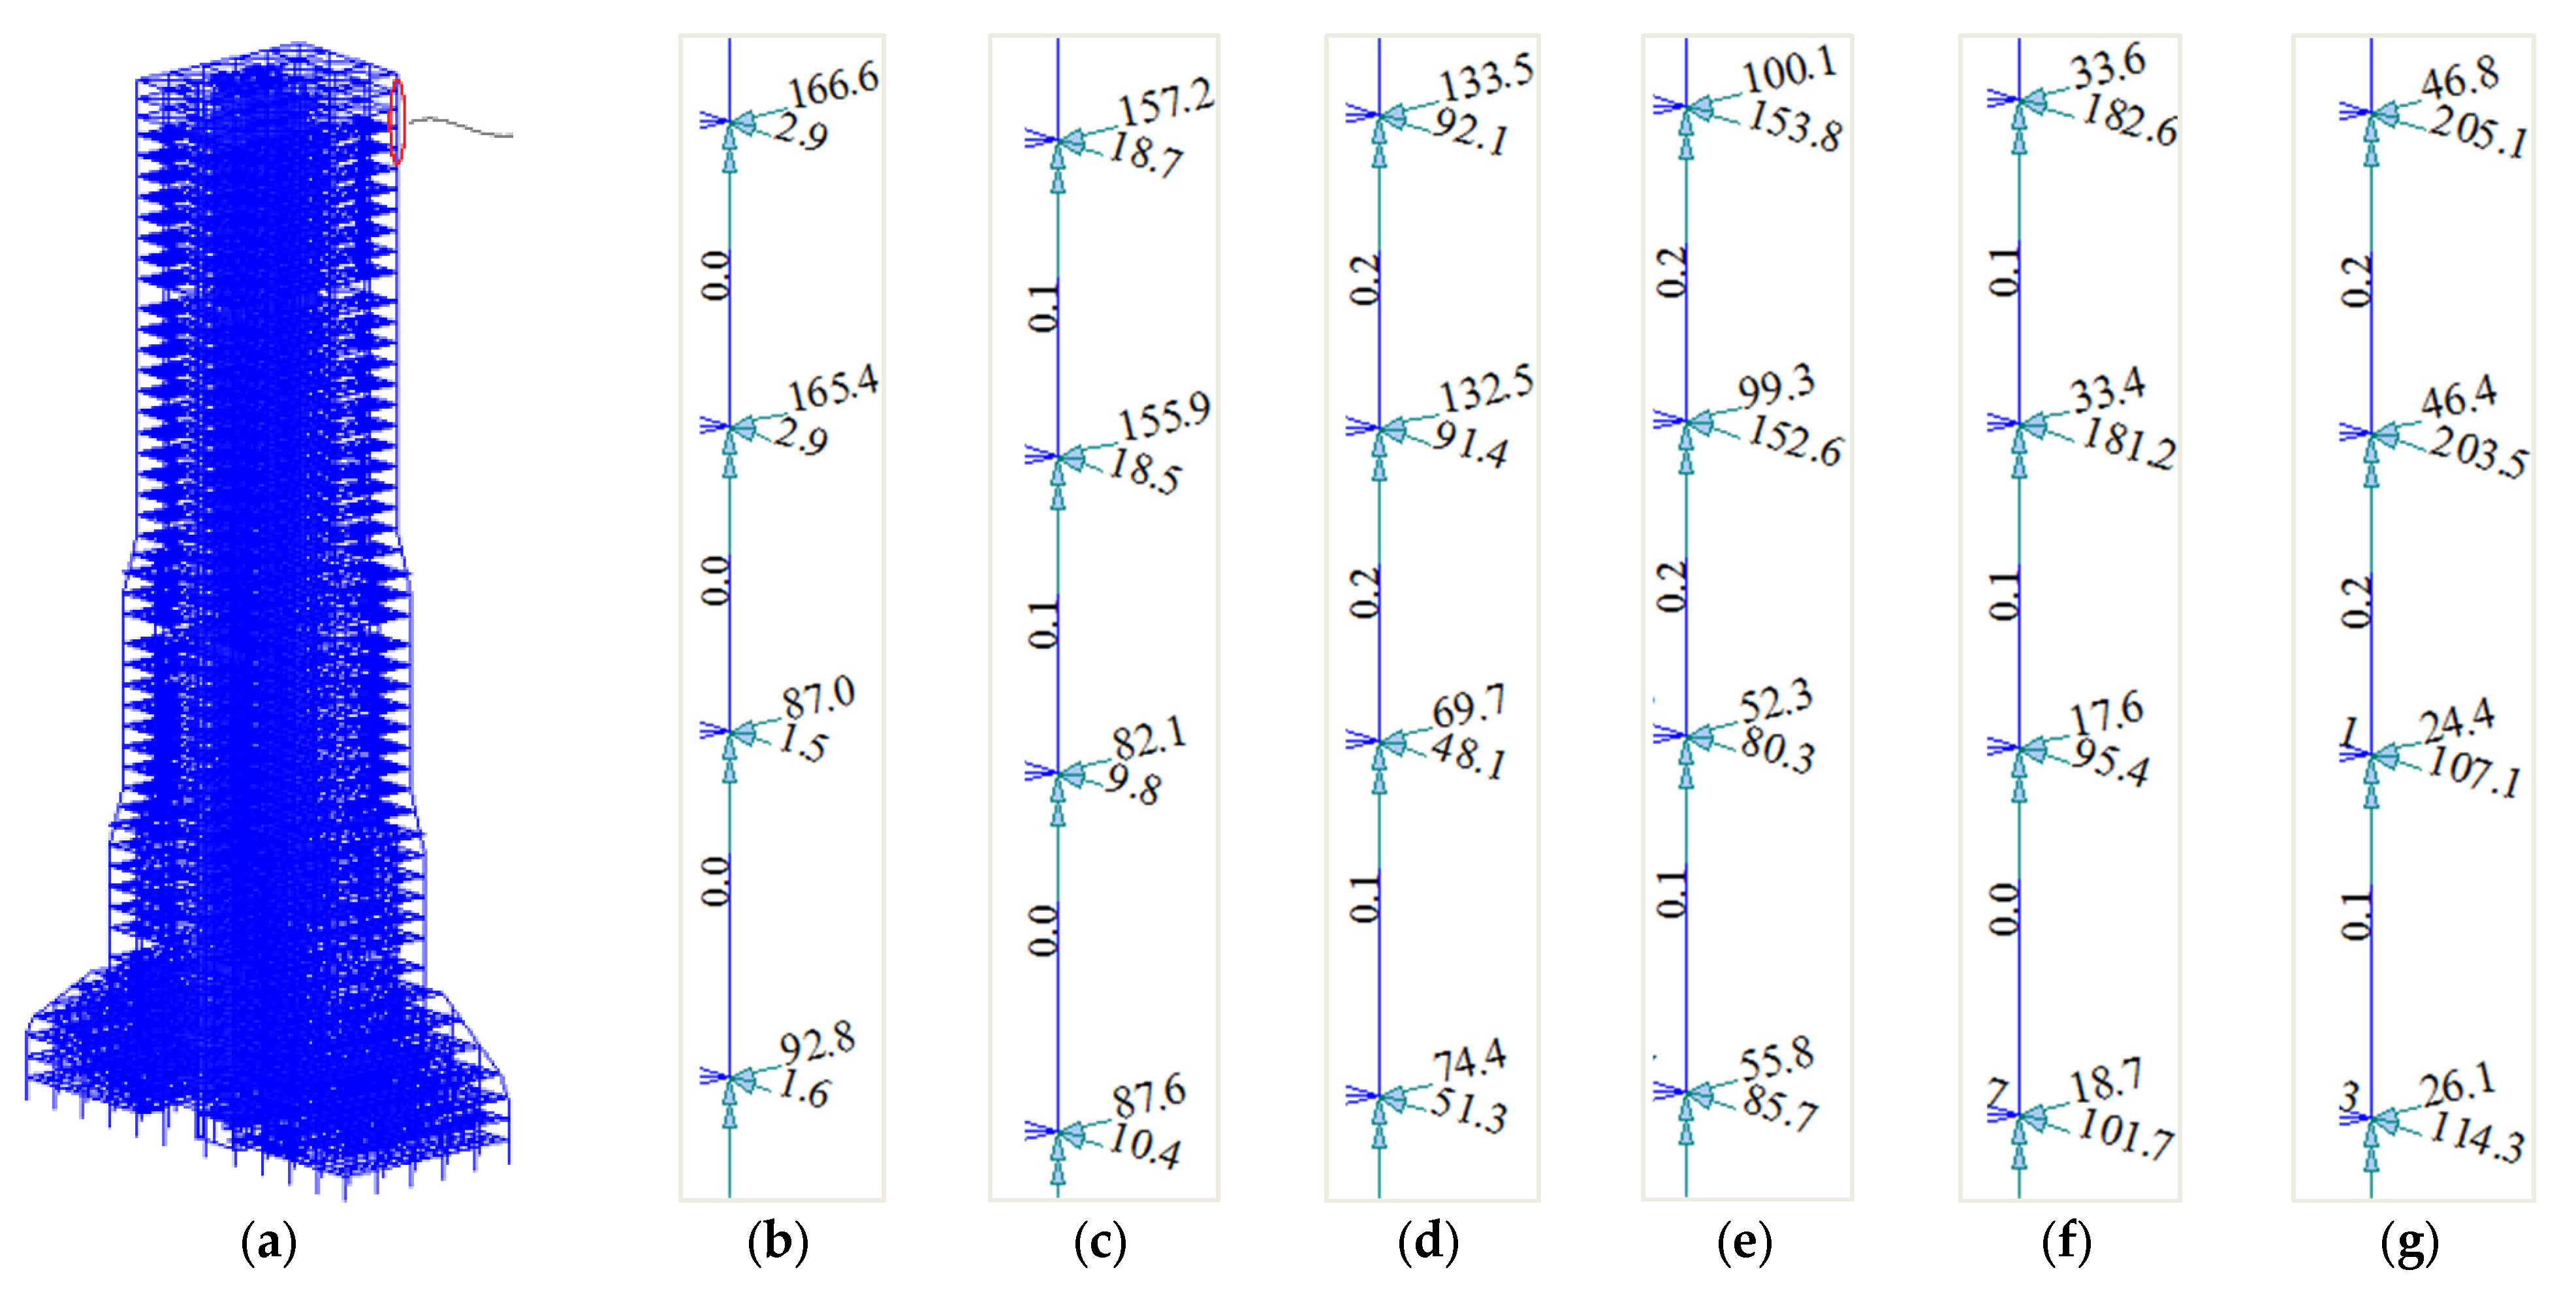
The wind-induced static and dynamic response of the structure can be calculated based on the structural mechanic theory and wind load obtained from wind tunnel tests. First, the mean wind load at each position of the building surface under different wind directions is obtained by averaging the wind load time history. These mean wind loads are then converted into concentrated forces at corresponding positions of structure nodes, which are subsequently applied to the finite element model in the form of nodal forces with three components of orthogonal decomposition. Static analysis of the loaded finite element model yields the mean wind-induced displacements and the mean wind-induced stress responses of structural elements. Taking building 4# as an example, Figure 5, Figure 6, and Figure 7 illustrate the node concentrated force, displacement results, and element stress results for the first six wind directions of the structure, respectively.

4.2. Dynamic Wind-Induced Response

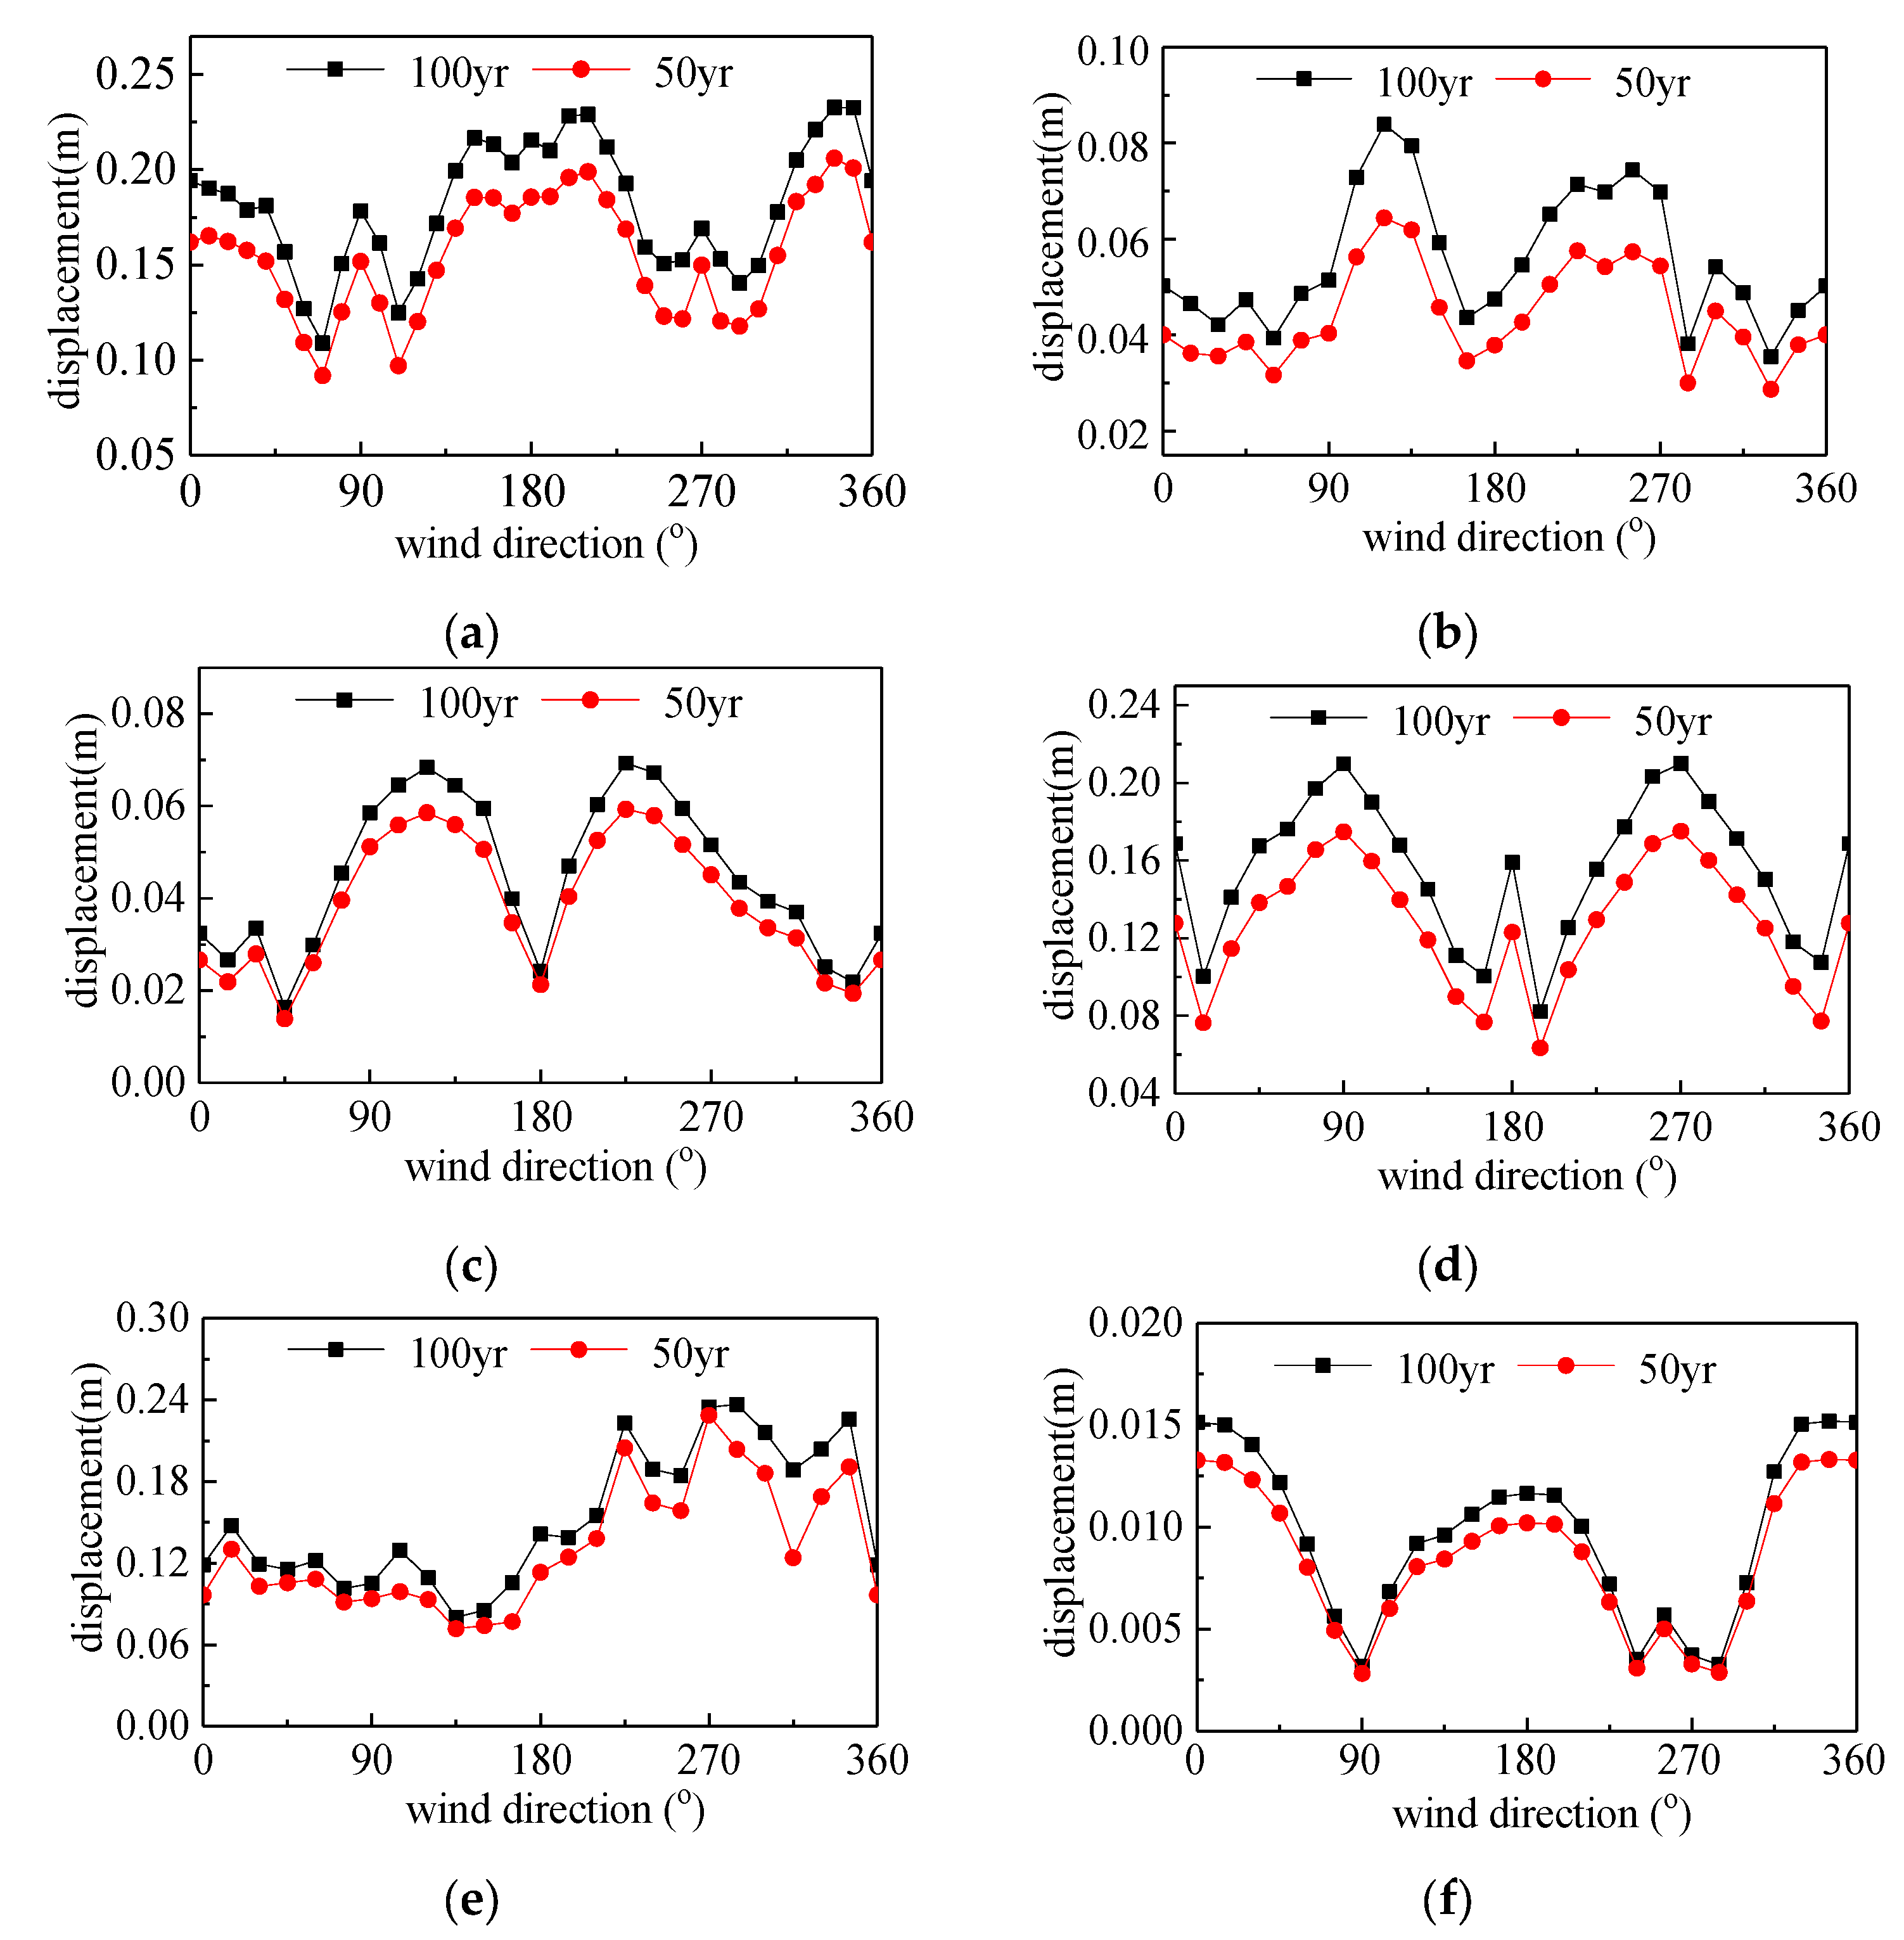
Based on the dynamic wind loads derived from wind tunnel tests and the structural dynamic characteristics, the wind-induced response was calculated using the direct time history integration method. The calculation results indicate that for wind-induced displacement responses, the fundamental modes (Modes 1 to 3, corresponding to two translational modes and one torsional mode) contribute over 95% to the total vibration response, whereas the contributions of Modes 7 to 9 are negligible. Meanwhile, acceleration responses are also dominated by lower-order modes, with higher-order modes (Modes 7 to 9) contributing less than 5%. To ensure computational accuracy, the first nine modes are adopted for dynamic analysis in this study. The above calculation process of wind-induced vibration can be implemented through MATLAB version R2016b programming, and the relevant algorithms are already well-known in the wind engineering field, so the detailed process will not be introduced. After calculating the wind-induced dynamic displacement response time history using time-domain methods and considering the average displacement response obtained in Section 4.1, the total dynamic displacement response of each building can be calculated. Figure 8 shows the dynamic displacement response of six buildings in the weak axial direction at various wind direction angles. Table 3 shows the maximum top lateral displacement of each building, which is the ratio of the extreme displacement to the structural height. According to the results in Table 3, the top lateral displacement is less than 1/1000, which is a very small value. The design codes stipulate that the top lateral displacement of tall buildings should be less than 1/400 [34]; clearly, the lateral displacements of the six buildings discussed in this paper are all significantly smaller than this value.
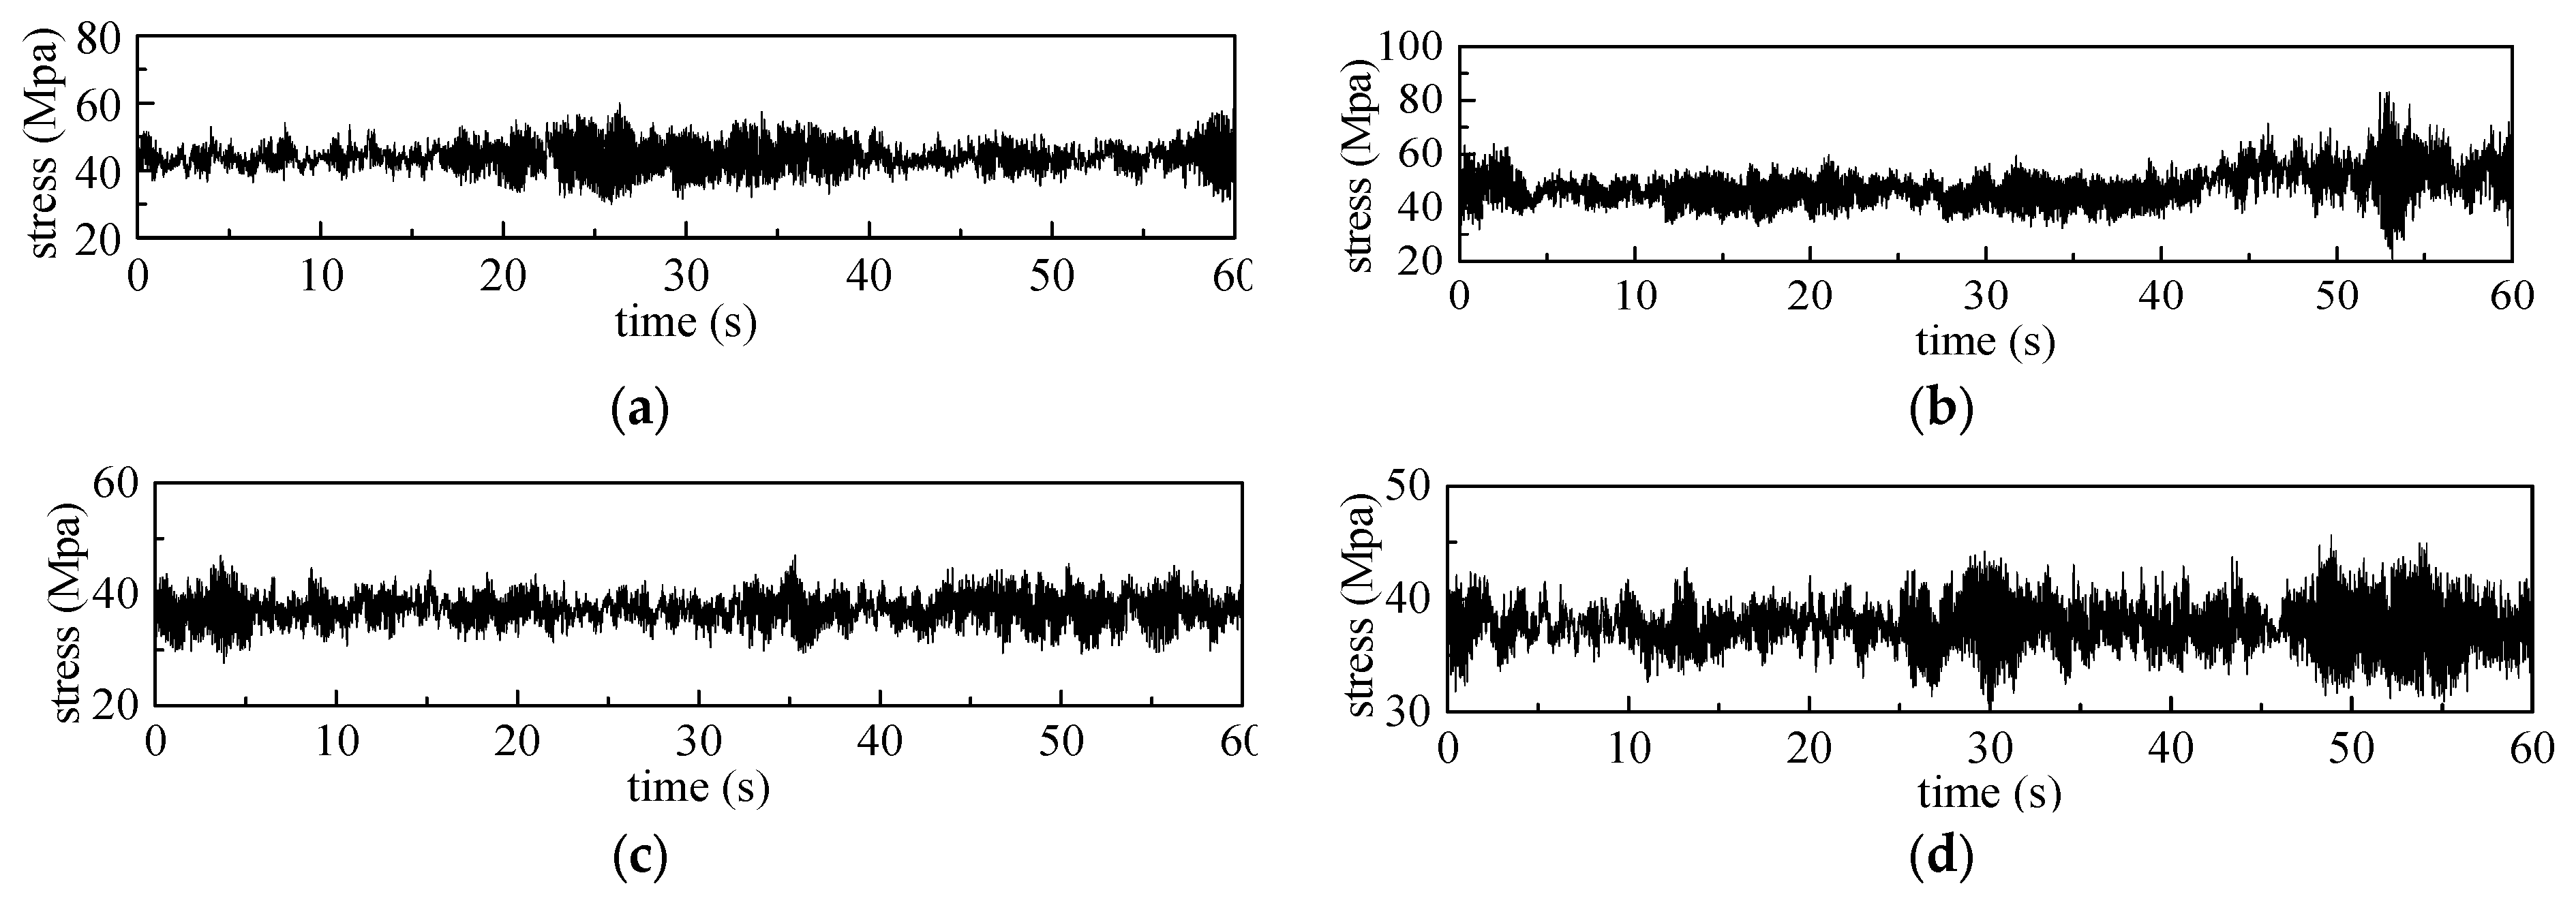
The number of structural elements of each building is about 20,000 to 100,000, so the computational workload is too large to directly calculate the stress time histories of all elements using time-domain methods. To address this, a simplified approach was adopted to compute the time histories of element stress. First, the relationship between structural displacements and element stresses was established through the finite element model loading described in Section 4.1. Based on this relationship and the displacement response time history results from Section 4.2, the stress response time histories of every element can be derived. As is known, locations with maximum stress amplitude are typically the initiation points of fatigue failure [34]. Figure 9 shows the locations of the maximum-stress element (termed “critical element“ in this study) among the steel elements in each building. Figure 10 presents the stress time histories of these critical elements under 0° wind direction with once-in-a-century wind speeds. As shown in Figure 10, the maximum stresses in critical elements of all buildings remain below 100 MPa, much smaller than the ultimate strengths of Q235 and Q345 steel materials.

5. Calculation and Analysis of Fatigue Life

5.1. Calculation Method

Wind tunnel tests can obtain the wind load time history of specific wind speeds and directions over a limited duration, which can be converted into structural wind load time histories for all practical wind speed–direction combinations by applying similarity relationships and considering the ergodic property of wind loads. Subsequently, stress response time histories under different actual wind speeds and directions can be derived through relevant calculations with consideration of joint wind speed–direction distribution. Thereafter, the annual fatigue damage can be calculated as follows:
First, the rain-flow counting method is used to record the number of cycles for each stress amplitude. Miner’s linear damage accumulation rule posits that fatigue damage under variable-amplitude loading can be calculated through linear superposition and is independent of the loading sequence [3]. The number of cycles leading to fatigue failure of the material varies under different stress amplitudes, and the relationship between the two can be described by the well-known S-N equation, expressed as a power function:
N S m = C
where S represents the stress amplitude and N denotes the number of cycles to failure corresponding to the stress amplitude. The constants m and C are material-specific parameters, with values determined according to relevant standards [34]: C = 3.26 × 10¹², m = 3.
Subsequently, the annual fatigue damage can be calculated based on Miner’s linear cumulative damage rule as follows:
D = i = 1 k n i N 1
where k is the number of calculation intervals, n is the actual number of cycles for each stress amplitude, and D represents the cumulative damage value over one year. Fatigue failure occurs when the total cumulative damage value reaches 1.
Thus, the fatigue life can be determined as:
T = 1 D

5.2. Calculation Results and Analysis

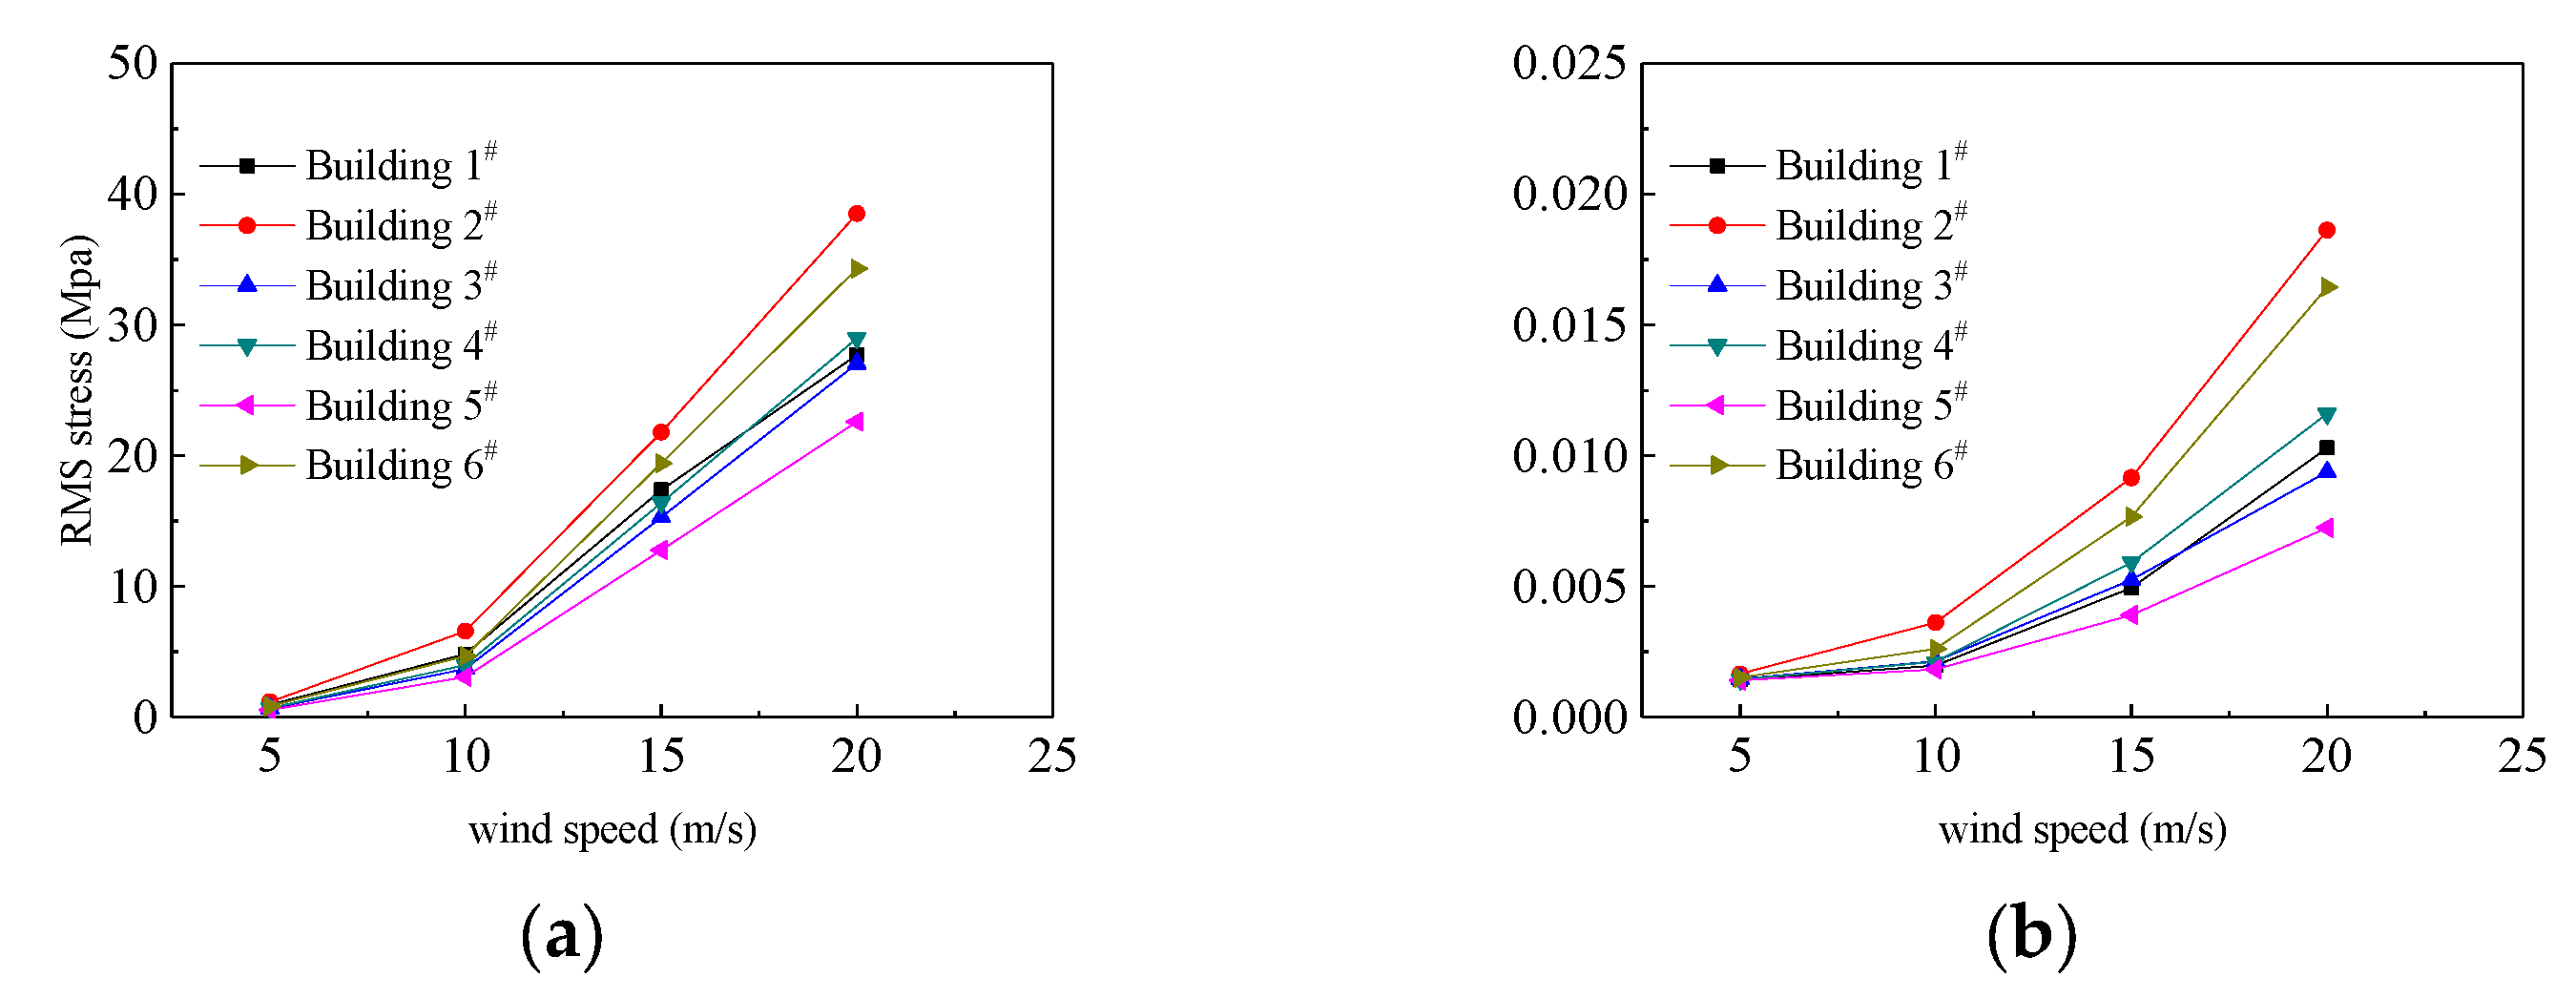
To investigate the impact of different wind speeds on fatigue life, Figure 11 presents the root mean square (RMS) stress values and annual fatigue damage of critical structural components for each building under the most unfavorable wind direction at wind speeds of 5 m/s, 10 m/s, 15 m/s, and 20 m/s. It can be found that the variation trends of RMS stress and fatigue damage with increasing wind speed are generally consistent across all critical components, both exhibiting monotonic growth. When wind speed remains below 10 m/s, the fatigue damage values of all critical components remain relatively close with minimal incremental changes. However, once wind speed exceeds 10 m/s, the amplitude of increase in fatigue damage becomes substantially more pronounced. This phenomenon occurs because stress values at critical structural locations experience accelerated growth beyond the 10 m/s threshold, consequently imposing greater impact on fatigue life and leading to its significant reduction.
Figure 11 presents the fatigue life of critical members in the tall steel structure under the most unfavorable wind direction. However, in reality, the actual fatigue life of structural members differs from that under a single wind direction due to variations in wind direction. To account for the joint distribution of actual wind direction and speed, the calculation results for critical elements are presented in Table 4, where T1 represents the fatigue life of each critical element under the joint distribution of actual wind speed and direction. Since the probability distribution of wind speed and direction varies across different regions, an extreme situation is also considered in this study, where the prevailing wind direction is assumed to mainly occur in the hazardous direction for structure, and the corresponding fatigue life is denoted as T2 in Table 4. As can be seen from Table 4, the fatigue life of each tall building is over 400 years. The design life of large tall buildings is about 100 years according to current design codes [34,35], so the above calculated fatigue life significantly exceeds the design life, which means that wind-induced fatigue failure will not occur within the service life.
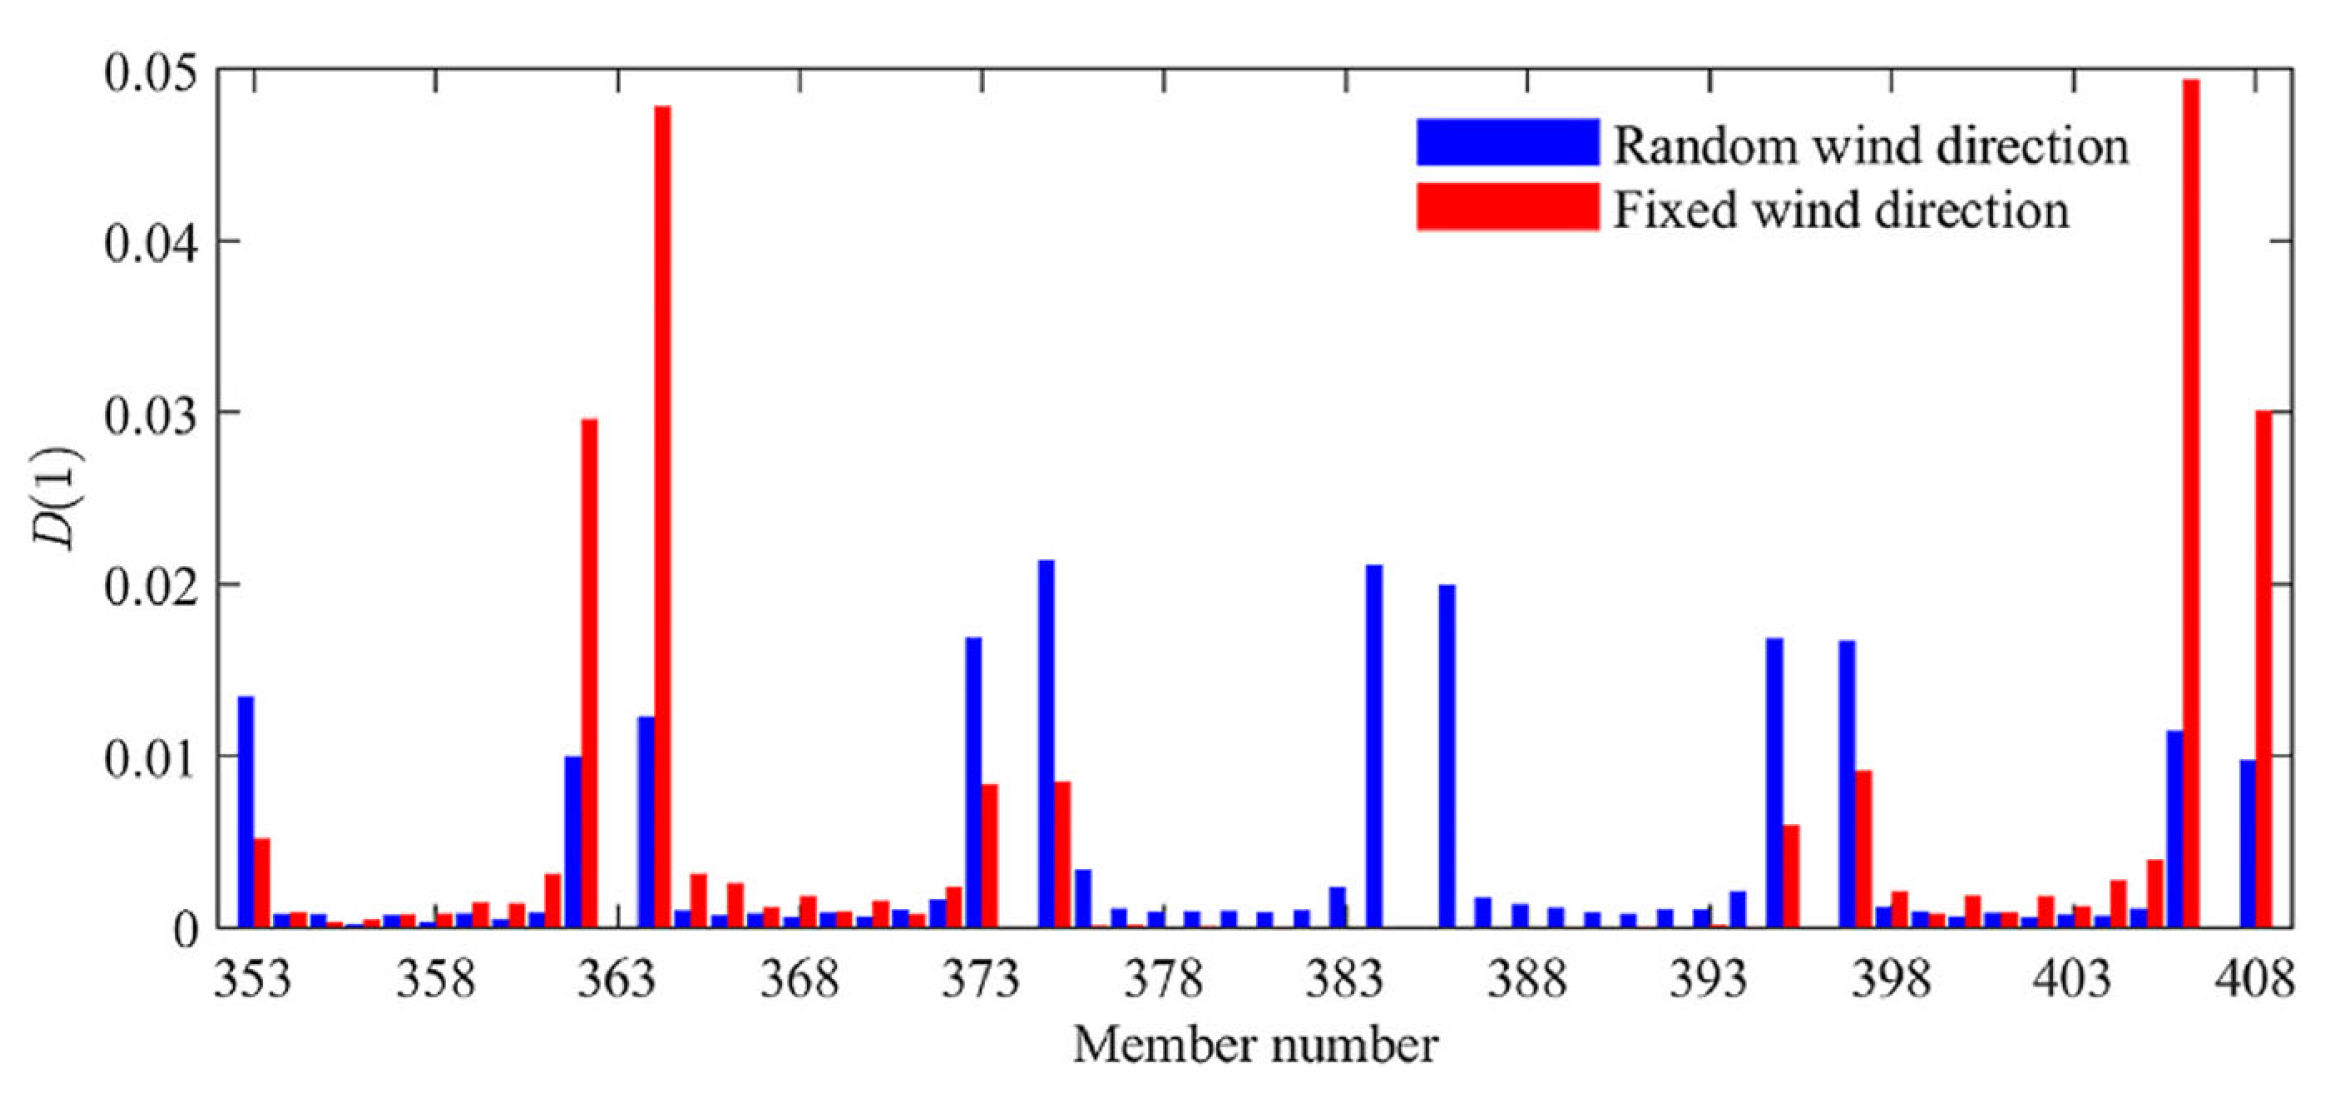
Figure 12 displays the fatigue damage rates of selected members in a long-span structure from reference [19] under both fixed and random wind directions. As shown in Figure 12, the fatigue damage rate under fixed wind direction is higher than that under random wind directions, indicating that the fatigue life under random wind directions exceeds that under fixed wind direction. This observation aligns with the results presented in Table 4 and Figure 11 in this paper, thereby validating the findings of our study. The difference arises because when wind consistently loads the structure from one direction, a small group of members remains perpetually within the most critically affected zone, leading to an unchanged damage distribution pattern.
The above analysis indicates that both the element stresses and fatigue life have significant safety margins for the cases discussed in this study. Since wind speeds vary across different regions, and the design conditions and safety margins of each building may be different, the fatigue life may decrease to some extent when these tall buildings are located in areas with higher wind speeds or when the design margins for element stresses are smaller. To discuss the conditions under which it is necessary to consider fatigue life, the design wind speed is gradually increased until the fatigue life is reduced to 100 years, and then the corresponding element stress conditions are examined. Table 5 presents the RMS stress in the critical elements of each tall building when the fatigue life is 100 years.
In Table 5, the symbol ησ is the ratio of RMS stress of the critical element to its ultimate strength. It can be seen from Table 5 that the fatigue life of the critical elements will be shorter than its design life when the ratio ησ reaches 0.125–0.164, which means it is necessary to consider the fatigue damage of the structure under this condition. Furthermore, under extreme conditions where the prevailing wind predominantly acts in the most hazardous direction for the structure, the fatigue life of the critical element will be shorter than the design life when ησ reaches 0.085–0.118, also necessitating consideration of potential fatigue damage.

5.3. Approximate Method to Estimate Fatigue Life

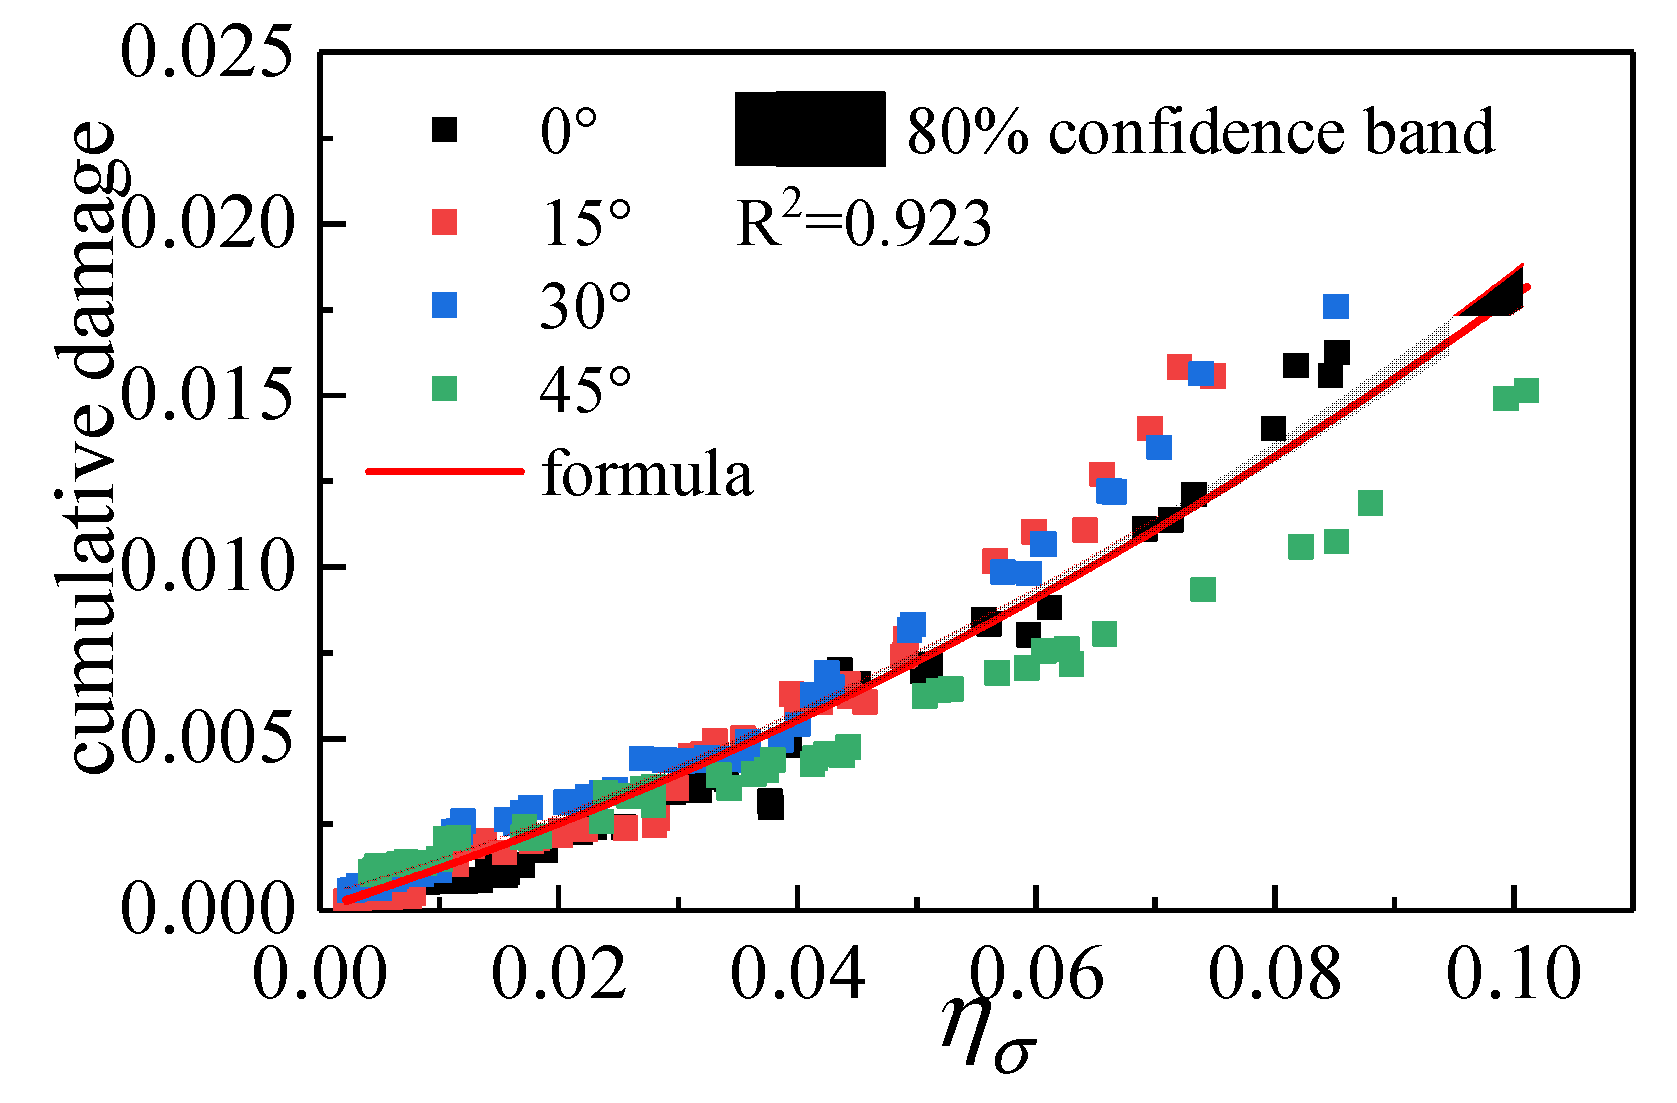
Taking the wind direction angles of 0° to 45° for building 1# as an example, the relationship between the RMS stress of the elements and fatigue damage is shown in Figure 13. It can be observed from Figure 13 that the RMS stress of the elements is positively correlated with fatigue damage, and the fatigue damage increases approximately in a parabolic manner with the rise of RMS stress. To provide a simplified estimation method for the fatigue life of tall buildings, an approximate relationship between fatigue damage and RMS stress is proposed based on the results of Figure 13, as follows:
D = 0.69 η σ 2 + 0.11 η σ
where ησ is also the dimensionless stress value, equal to the ratio of the RMS stress of the critical element to its ultimate tensile strength. The coefficient of determination (R2) for Equation (8) is 0.923. Note that Figure 13 shows that the ησ–fatigue life relationship varies with wind direction; since this study solely provides an approximate method to estimate fatigue life based on case studies, this directional variation was not incorporated.
Based on the estimation formula of Equation (8) and the wind speed–direction joint distribution, the fatigue life of critical elements can be calculated. Table 6 presents a comparison between the fatigue life values derived from the estimation formula and those from time-domain calculations. As seen from Table 6, the results from the two methods show good agreement, with a maximum error within 20%, indicating that the estimation formula has acceptable accuracy and can be used for preliminary estimation of fatigue life.

5.4. About the Application of This Research in Practical Engineering

The main argument of this study is that when the RMS stress ratio ησ reaches a certain value, it becomes necessary to consider the potential fatigue damage of steel tall buildings. The finding can provide reference for two types of professionals in practical engineering: first, wind resistant consultants or researchers in research institutions, and second, structure designers in design institutes.
For wind resistance consultants or researchers, when conducting wind resistance analysis for steel tall buildings on the basis of wind tunnel tests, the time history of wind loads on the building surface can be obtained first. Thereafter, the RMS stress of structural elements can be determined according to the relevant theoretical calculations, and subsequently, the RMS stress ratio ησ can be calculated. This ratio can be used to determine whether fatigue life verification is necessary.
For structural designers in design institutes, another stress ratio can be directly obtained through structural design software during the design process, which is the ratio of equivalent stress to ultimate tensile strength (termed “equivalent stress ratio”). The relationship between the equivalent stress ratio and the RMS stress ratio is derived as follows.
According to random vibration theory, the relationship between the equivalent load and the root mean square load is as follows:
F e = F m + g F σ
where F e , F m , and F σ represent the equivalent wind load, mean wind load, and RMS wind load, respectively. g is the peak factor, and its value can be determined by referring to the relevant wind load code or through statistical analysis of wind tunnel test data.
The equivalent load is equal to the product of the mean load and the wind vibration coefficient, which can be abbreviated as:
F e = β F m
where β is the wind vibration coefficient and its value can be determined by referring to relevant wind load codes.
According to Equations (9) and (10), the relationship between the equivalent load and the RMS load can be expressed as:
F e = g β β 1 F σ
For a given load and structural form, the relationship between the equivalent load and the RMS load also corresponds to the relationship between the equivalent stress and the RMS stress of the structural elements. Therefore, the relationship between the equivalent stress ratio ηe and the root mean square stress ratio ησ is as follows:
η e = g β β 1 η σ
The RMS stress ratio threshold proposed in Section 5.2 of this paper may serve as a reference for wind-resistant design guidelines. After obtaining the RMS stress ratio, designers can compare its value with the RMS stress ratio threshold proposed in Section 5.2 to make a preliminary determination of whether fatigue damage needs to be considered. When the RMS stress ratio of key members reaches 0.125–0.164, the tall steel building should undergo detailed fatigue life assessment. When the structurally most hazardous wind direction aligns with the prevailing wind direction and the RMS stress ratio reaches 0.085–0.118, a refined structural fatigue life evaluation is also required. It is important to note that orienting the building to avoid alignment between the most hazardous wind direction and the prevailing wind direction can significantly enhance both structural safety and economic efficiency.
For the aforementioned two types of professionals, once the need for fatigue life verification is determined, an approximate estimation of the fatigue life can be made using the estimation formula proposed in this study. Alternatively, as the proposed method in this paper is merely an approximate and simplified calculation, the fatigue life can also be accurately calculated based on existing relevant algorithms.

6. Limitations in This Study and Future Research Prospects

This study focused on investigating the fatigue life of primary structural components in tall steel buildings, without modeling non-structural elements. However, as noted in the literature [36], masonry infill walls, cladding, and other non-structural elements may significantly influence the overall behavior of the structural system, particularly under lateral loading conditions. Therefore, to accurately determine the fatigue life of structural members, future studies should incorporate non-structural components in modeling. Additionally, to align with common design scenarios specified in Chinese codes, this study primarily analyzed the structure under linear assumptions and did not account for nonlinear effects such as soil–foundation–structure interaction and local nonlinear effects. Further research incorporating these aspects could enhance the accuracy and comprehensiveness of the findings.
This study is limited to a case study analysis of only six tall steel buildings; therefore the estimation Equation (8) is derived from only six case studies and may not generalize to all tall building configurations since the design parameters such as structure form, building shape, vibration frequency, building height, design wind speed, and ground roughness will affect structure vibrations and fatigue life. Moreover, directional variability and non-Gaussian turbulence effects were not explicitly considered in the simplified approach. and other random parameters of the structure such as randomness in material properties were also not included in Equation (8). For improved accuracy of Equation (8), these factors need to be integrated into future investigations. Similarly, due to the limited sample size in this study, the proposed RMS stress ratio threshold should only be regarded as a preliminary estimation for wind-induced fatigue damage. To establish a widely applicable stress ratio threshold, systematic analysis with a substantially expanded dataset is required.
It should be emphasized that Equation (8) depends on both the structural parameters of tall steel buildings and the characteristics of wind loads, such as building height, structural configuration, modal shapes, and regional wind load characteristics. The structural vibration modes directly determine the dynamic response under wind excitation, consequently influencing stress distribution throughout the structure and thereby critically affecting the wind-induced fatigue life of components. Building height and configuration govern the natural frequencies and modal characteristics, which subsequently modify the wind-induced response and ultimately impact the fatigue life of structural members. Furthermore, wind load characteristics directly govern the dynamic structural response. As demonstrated in Figure 11, significant variations in structural stress patterns under different wind velocities consequently lead to substantial differences in fatigue life.
With the deepening of studies on the impact of multiple hazards on structural safety, the effects of multi-hazard coupling on fatigue damage and the dynamic response of tall steel buildings should become a key focus of future investigations, such as those into wind–earthquake interaction and rain–wind interaction. Additionally, the exploration of advanced technical approaches, such as machine learning-based fatigue estimators trained on larger datasets, could also be pursued to enhance predictive generalization in wind-induced fatigue analysis.

7. Conclusions and Prospect

This study conducts a systematic investigation into the wind-induced fatigue life of six tall steel structures. It firstly determines whether conventionally designed tall steel buildings require consideration of wind-induced fatigue damage. Subsequently, it establishes empirical indicators and corresponding thresholds for assessing when such considerations become necessary in tall building design. Finally, the research provides an approximate empirical formula for preliminary estimation of fatigue life in tall steel structures, thereby furnishing structural designers with evidence-based guidance for evaluating wind-induced fatigue performance. A detailed summary of conclusions is provided below:
(1)
Under the current normal design conditions, both the element stresses and fatigue life of steel tall buildings exhibit significant safety margins. The fatigue life is approximately over 400 years, indicating that wind-induced fatigue failure will not occur within the design life.
(2)
When the ratio of the RMS stress to the ultimate tensile strength reaches 0.125–0.164, the fatigue life of the critical elements will be shorter than the design life. In such cases, it is necessary to consider the potential for fatigue failure of the structure. Designers should take preventive measures to avoid the occurrence of such scenarios.
(3)
Under extreme conditions where the prevailing wind predominantly acts in the most hazardous direction, the fatigue life of critical elements will be shorter than the design life when the stress ratio reaches 0.085–0.118, also necessitating consideration of potential fatigue damage of the steel tall building.
(4)
This paper proposes an approximate estimation formula for the fatigue life of steel structure tall buildings. This approximate formula can assist designers in making preliminary estimations of the wind-induced fatigue life for tall steel buildings. A procedure based on the RMS stress ratio is proposed to preliminarily assess whether structural fatigue life needs to be considered. When the estimation results indicate that the fatigue life is close to the design life, further precise calculations of fatigue life should be conducted.
(5)
It should be mentioned is that this study discusses only six engineering cases; the approximate estimation formula and the proposed RMS stress ratio threshold are derived from only six case studies and may not generalize to all tall building configurations since the design parameters such as structure form, building shape, vibration frequency, building height, design wind speed, and ground roughness will affect structure vibrations and fatigue life. In addition, the simplified approach does not explicitly incorporate directional variability or non-Gaussian turbulence effects. These factors are likely to compromise the accuracy of this empirical formula. Therefore, if a more precise relationship between these design parameters, random parameters of structures, and wind loads and fatigue life could be established, it would provide more accurate guidance for practical engineering applications. If necessary, this work requires more engineering cases and theoretical research in the future.
(6)
With the deepening of studies on the impact of multiple hazards on structural safety, the effects of multi-hazard coupling on fatigue damage and dynamic response of tall steel buildings should become a key focus of future investigations, such as those into wind–earthquake interaction and rain–wind interaction. Additionally, the exploration of advanced technical approaches, such as machine learning-based fatigue estimators trained on larger datasets, could also be pursued to enhance predictive generalization in wind-induced fatigue analysis.

Author Contributions

Conceptualization, L.W.; Software, Z.-K.W. and R.-F.G.; Investigation, R.-F.G.; Data curation, Z.-K.W.; Writing—original draft, Z.-K.W.; Writing—review & editing, L.W.; Funding acquisition, L.W. All authors have read and agreed to the published version of the manuscript.

Funding

This research was supported by the Henan Natural Science Foundation under project No. 232300420079 and China National Natural Science Foundation under project No. 51708186.

Institutional Review Board Statement

Not applicable.

Informed Consent Statement

Not applicable.

Data Availability Statement

The original contributions presented in this study are included in the article. Further inquiries can be directed to the corresponding author.

Conflicts of Interest

The authors declare no conflict of interest.

References

  1. Wöhler, A. Versuche zur Ermittlung der auf die Eisenbahnwagenachsen einwirkenden Kräfte und die Widerstandsfähigkeit der Wagen-Achsen. Z. Bauwes. 1960, 10, 583–614. [Google Scholar]
  2. Dowling, N.E. Fatigue failure prediction for complicated stress strain histories. J. Mater. 1972, 7, 71–87. [Google Scholar]
  3. Miner, M. Cumulative damage in fatigue. J. Appl. Mech. 1945, 12, A159–A164. [Google Scholar] [CrossRef]
  4. Matsuiski, M.; Endo, T. Fatigue of metals subjected to varying stress. Jpn. Soc. Mech. Eng. 1968, 68, 37–40. [Google Scholar]
  5. De Fazio, N.; Placidi, L.; Tomassi, A.; Fraddosio, A.; Castellano, A.; Paparella, F. Different mechanical models for the study of ultrasonic wave dispersion for mechanical characterization of construction materials. Int. J. Solids Struct. 2025, 315, 113352. [Google Scholar] [CrossRef]
  6. Caracoglia, L.; Jones, N.P. Wind-induced failures of highway light poles during winter storms. In Proceedings of the ASME Pressure Vessels and Piping Division Conference, Vancouver, BC, Canada, 23–27 July 2006. [Google Scholar]
  7. Repetto, M.P.; Solari, G. Wind-induced fatigue collapse of real slender structures. Eng. Struct. 2010, 32, 3888–3898. [Google Scholar] [CrossRef]
  8. Ribeiro, D.; Bragana, C.; Montenegro, P.A.; Carvalho, H.; Costa, B.; Marques, F. Wind-induced fatigue analysis of high-rise guyed lattice steel towers. Structures 2022, 36, 719–734. [Google Scholar] [CrossRef]
  9. Huo, T.; Tong, L. An approach to wind-induced fatigue analysis of wind turbine tubular towers. J. Constr. Steel Res. 2020, 166, 105917. [Google Scholar] [CrossRef]
  10. Banday, Z.Z.; Fenerci, A.; Lystad, T.M.; Øiseth, O.A. Buffeting induced fatigue damage assessment of long-span bridge decks under uncertain turbulence conditions. Eng. Struct. 2025, 323, 119292. [Google Scholar] [CrossRef]
  11. Rong, K.; Tian, L.; Luo, J.; Wang, L. Study on wind-induced fatigue performance of large-span transmission tower-line system considering the combined distribution probability of wind direction and speed. Eng. Fail. Anal. 2024, 156, 107785. [Google Scholar] [CrossRef]
  12. Li, C.; Pan, H.; Tian, L.; Bi, W. Lifetime multi-hazard fragility analysis of transmission towers under earthquake and wind considering wind-induced fatigue effect. Struct. Saf. 2022, 99, 102266. [Google Scholar] [CrossRef]
  13. Wang, L.; Fan, X.-Y. Failure cases of high chimneys: A review. Eng. Fail. Anal. 2019, 105, 1107–1117. [Google Scholar] [CrossRef]
  14. Repetto, M.P.; Solari, G. Directional Wind-Induced Fatigue of Slender Vertical Structures. J. Struct. Eng. 2004, 130, 1032–1040. [Google Scholar] [CrossRef]
  15. Barle, J.; Grubisic, V.; Radica, D. Service strength validation of wind-sensitive structures, including fatigue life evaluation. Eng. Struct. 2010, 32, 2767–2775. [Google Scholar] [CrossRef]
  16. Petrini, F.; Bontempi, F. Estimation of fatigue life for long span suspension bridge hangers under wind action and train transit. Struct. Infrastruct. Eng. 2011, 7, 491–507. [Google Scholar] [CrossRef]
  17. Hosomi, M.; Kobayashi, H.; Nitta, Y. Fatigue strength design for vortex-induced oscillation and buffeting of a bridge. J. Wind Eng. Ind. Aerodyn. 1997, 67, 227–237. [Google Scholar] [CrossRef]
  18. Klinger, C.; Michael, T.; Bettge, D. Fatigue cracks in railway bridge hangers due to wind induced vibrations–Failure analysis, measures and remaining service life estimation. Eng. Fail. Anal. 2014, 43, 232–252. [Google Scholar] [CrossRef]
  19. Song, J.; Qu, J.; Huo, L. Lifetime seismic fragility analysis of long-span spatial structures considering the wind-induced fatigue effect. J. Build. Eng. 2024, 87, 109032. [Google Scholar] [CrossRef]
  20. Huang, M.-F.; Ye, H.-K.; Lou, W.-J.; Sun, X.-T.; Ye, J.-Y. Wind-induced vibration and fatigue analysis of long span lattice structures considering distribution of wind speed and direction. J. Zhejiang Univ. (Eng. Sci.) 2019, 53, 1916–1926. [Google Scholar]
  21. Kim, S.H.; Shin, H.K.; Joo, Y.C.; Kim, K.H. A study of the wake effects on the wind characteristics and fatigue loads for the turbines in a wind farm. Renew. Energy 2015, 74, 536–543. [Google Scholar] [CrossRef]
  22. Qing, M.F.; Shi, W.; Chai, W.; Fu, X.; Li, L.; Li, X. Extreme structural response prediction and fatigue damage evaluation for large-scale monopile offshore wind turbines subject to typhoon conditions. Renew. Energy 2023, 208, 450–464. [Google Scholar] [CrossRef]
  23. Chen, T.; Li, W.; Deng, R.; Zuo, H. Fatigue analysis of offshore wind turbines with soil-structure interaction and various pile types. Ocean Eng. 2024, 314, 119786. [Google Scholar] [CrossRef]
  24. Fu, B.; Zhao, J.; Li, B.; Yao, J.; Teifouet, A.R.M.; Sun, L.; Wang, Z. Fatigue reliability analysis of wind turbine tower under random wind load. Struct. Saf. 2020, 87, 101982. [Google Scholar] [CrossRef]
  25. Kumar, K.S. Prediction of wind-induced fatigue on claddings of low buildings. Comput. Struct. 2000, 75, 31–44. [Google Scholar] [CrossRef]
  26. Xhelaj, A.; Orlando, A.; Pagnini, L.; Tubino, F.; Repetto, M.P. Fatigue life assessment of a slender lightning rod due to wind excited vibrations. Procedia Struct. Integr. 2024, 57, 754–761. [Google Scholar] [CrossRef]
  27. Merarda, H.; Toumi, M.; Boutelhig, A. Analysis of heliostat fatigue: Impact of wind speed distribution, studied over six regions of Algeria. Sol. Energy 2024, 278, 112776. [Google Scholar] [CrossRef]
  28. Tan, J.; Tan, P.; Wu, J.; Feng, D. Evaluation of wind-induced fragility and cumulative fatigue damage on seismically isolated high-rise building. J. Wind Eng. Ind. Aerodyn. 2024, 254, 105915. [Google Scholar] [CrossRef]
  29. Palmeri, A.; Ricciardelli, F. Fatigue analyses of buildings with viscoelastic dampers. J. Wind Eng. Ind. Aerodyn. 2006, 94, 377–395. [Google Scholar] [CrossRef]
  30. Arul, M.; Kareem, A.; Kwon, D.K. Identification of Vortex-Induced Vibration of Tall Building Pinnacle Using Cluster Analysis for Fatigue Evaluation: Application to Burj Khalifa. J. Struct. Eng. 2020, 146, 04020234. [Google Scholar] [CrossRef]
  31. Okajima, A. Strouhal numbers of rectangular cylinders. J. Fluid Mech. 1982, 123, 379–398. [Google Scholar] [CrossRef]
  32. Sohankar, A.; Norberg, C.; Davidson, L. Low-Reynolds-number flow around a square cylinder at incidence: Study of blockage, onset of vortex shedding and outlet boundary condition. Int. J. Numer. Methods Fluids 2015, 26, 39–56. [Google Scholar] [CrossRef]
  33. Coles, S.G.; Walshaw, D. Directional modeling of extreme wind speeds. J. R. Stat. Soeiety Appl. Stat. 1994, 43, 139–157. [Google Scholar]
  34. GB 50017-2003; Code for Design of Steel Structures. Progress in Steel Building Structures: Beijing, China, 2010.
  35. AISC 360-22; Specification for Structural Steel Buildings. American Institute of Steel Construction: Chicago, IL, USA, 2022.
  36. Asgarkhani, N.; Kazemi, F.; Jankowski, R. Machine-learning based tool for seismic response assessment of steel structures including masonry infill walls and soil-foundation-structure interaction. Comput. Struct. 2025, 317, 107918. [Google Scholar] [CrossRef]
Figure 1. Wind tunnel test photos of each building: (a) building 1#; (b) building 2#; (c) building 3#; (d) building 4#; (e) building 5#; (f) building 6#.
Applsci 15 11736 g001
Figure 2. Wind direction and coordinates: (a) building 1#; (b) building 2#; (c) building 3#; (d) building 4#; (e) building 5#; (f) building 6#.
Applsci 15 11736 g002
Figure 3. Probability distribution of wind speed and direction: (a) Changsha; (b) Wuhan; (c) Huangshi.
Applsci 15 11736 g003aApplsci 15 11736 g003b
Figure 4. Probability distribution model of wind speed and direction: (a) Changsha; (b) Wuhan; (c) Huangshi.
Applsci 15 11736 g004
Figure 5. Partial details of applied mean wind forces (Unit: N): (a) structural model; (b) 0°; (c) 15°; (d) 30°; (e) 45°; (f) 60°; (g) 75°.
Applsci 15 11736 g005
Figure 6. Mean displacement response of structure (Unit: m): (a) 0°; (b) 15°; (c) 30°; (d) 45°; (e) 60°; (f) 75°.
Applsci 15 11736 g006
Figure 7. Mean stress response of components (Unit: MPa): (a) 0°; (b) 15°; (c) 30°; (d) 45°; (e) 60°; (f) 75°.
Applsci 15 11736 g007
Figure 8. Wind-induced extreme displacement response: (a) building 1#; (b) building 2#; (c) building 3#; (d) building 4#; (e) building 5#; (f) building 6#.
Applsci 15 11736 g008
Figure 9. Critical elements of each building: (a) building 1#; (b) building 2#; (c) building 3#; (d) building 4#; (e) building 5#; (f) building 6#.
Applsci 15 11736 g009
Figure 10. Stress time history of critical element (wind direction: 0°): (a) building 1#; (b) building 2#; (c) building 3#; (d) building 4#; (e) building 5#; (f) building 6#.
Applsci 15 11736 g010aApplsci 15 11736 g010b
Figure 11. Variations of RMS stress and annual fatigue damage with wind speed: (a) RMS stress; (b) annual fatigue damage.
Applsci 15 11736 g011
Figure 12. Fatigue damage rates of selected members in a long-span structure [19].
Applsci 15 11736 g012
Figure 13. Relationship between RMS stress and fatigue damage.
Applsci 15 11736 g013
Table 1. Main information of each building.
BuildingLocationHeightFirst Three ModesFirst Three FrequenciesDesigned Group
1#Changsha347 mApplsci 15 11736 i0010.17 HzHunan Provincial Architectural Design Institute Group Co., Ltd. Changsha, China.
0.18 Hz
0.34 Hz
2#Wuhan187 mApplsci 15 11736 i0020.23 HzWong Tung Group. Hongkong, China.
0.29 Hz
0.35 Hz
3#Wuhan157 mApplsci 15 11736 i0030.27 HzWong Tung Group. Hongkong, China.
0.33 Hz
0.40 Hz
4#Wuhan242 mApplsci 15 11736 i0040.18 HzCITIC Architectural Design & Research Institute Co., Ltd. Wuhan, China.
0.20 Hz
0.28 Hz
5#Wuhan248 mApplsci 15 11736 i0050.16 HzCentral-South Architectural Design and Research Institute Co., Ltd. Wuhan, China.
0.21 Hz
0.26 Hz
6#Huangshi92 mApplsci 15 11736 i0060.39 HzCentral-South Architectural Design and Research Institute Co., Ltd. Wuhan, China.
0.43 Hz
0.46 Hz
Table 2. General information of rigid pressure model test.
BuildingGround Roughness CategoryGeometric Scale RatioWind Direction Pressure Point Number
1#C1:4000–350°, interval 10°360
2#B1:2000–345°, interval 15°582
3#B1:2000–345°, interval 15°574
4#C1:2500–345°, interval 15°510
5#C1:3000–345°, interval 15°499
6#B1:2000–345°, interval 15°402
Table 3. Lateral top displacement of each building.
Building 1#Building 2#Building 3#Building 4#Building 5#Building 6#
structural height347 m187 m157 m242 m248 m92 m
lateral displacement0.23 m0.084 m0.068 m0.21 m0.24 m0.015 m
displacement ratio1/15101/22301/23101/11501/10301/6133
Table 4. Calculated fatigue life of each building.
BuildingMaterialFatigue Life T1Fatigue Life T2
1#Q345533.97 years391.98 years
2#Q345647.63 years468.67 years
3#Q235681.87 years569.87 years
4#Q345732.66 years582.93 years
5#Q345714.72 years611.14 years
6#Q345645.24 years502.90 years
Table 5. The RMS stress when fatigue life is 100 years.
BuildingRMS StressStress Ratio ησRMS Stress in Extreme Conditionsησ in Extreme Conditions
1#71.0 MPa0.14541.8 Mpa0.085
2#61.0 MPa0.12541.9 Mpa0.086
3#61.8 MPa0.16444.3 Mpa0.118
4#77.8 MPa0.15945.1 Mpa0.092
5#62.2 MPa0.12745.8 Mpa0.093
6#66.8 MPa0.13649.6 Mpa0.101
Table 6. Calculation results and fitting results of fatigue life.
BuildingCalculated Fatigue LifeEstimated Cumulative Damage by Equation (8)Estimated Fatigue Life
1#533.97 years0.00199500.68 years
2#647.63 years0.00182548.19 years
3#681.87 years0.00167599.25 years
4#732.66 years0.00155644.49 years
5#714.72 years0.00159627.19 years
6#645.24 years0.00179558.41 years
Disclaimer/Publisher’s Note: The statements, opinions and data contained in all publications are solely those of the individual author(s) and contributor(s) and not of MDPI and/or the editor(s). MDPI and/or the editor(s) disclaim responsibility for any injury to people or property resulting from any ideas, methods, instructions or products referred to in the content.