Abstract
Early diagnosis of pediatric flatfoot is critical to provide effective and timely orthotic intervention to prevent long-term complications. Current methods like manual measurements or three-dimensional (3D) scanning are often not ideal for rapid screening. This study addresses this gap by developing a regression model to predict foot arch height (AH) among Chinese primary schoolchildren by using simple two-dimensional (2D) footprint parameters, thus enabling orthosis prescription in an accessible and timely manner. A correlational study is conducted with 57 Hong Kong children who are 8–12 years old with flatfeet. Anthropometric footprint measurements, including four footprint indexes, Clarke’s Angle (CA), Chippaux–Smirak Index (CSI), Staheli Index (SI), and Sztriter–Godunov index (KY) are obtained from 2D footprints, whereas the arch height (AH) is measured by a caliper. One-way ANOVA is used to identify the measurements associated with flatfoot severity. A stepwise regression analysis is also used to determine the key footprint predictors of AH. The results show that the footprint indexes, heel width, ball width, medial ball length, arch depth and arch breadth significantly differentiated flatfoot severity. The stepwise regression model explains 44% of the variance by identifying the CA, heel width (HW) and arch depth (AD) as the strongest predictors of AH. The CA, HW and AD measured from the 2D footprints can serve as practical predictors of AH in Chinese flatfooted children. This study offers a transformative, accessible tool for pediatric flatfoot screening. Unlike resource-intensive 3D scanning or clinical assessments, our approach uses simple 2D footprints to estimate AH. This enables rapid, preliminary screening in diverse settings, empowering individuals to identify potential issues and seek timely professional evaluation. By democratizing access to early detection, it streamlines referrals, reduces unnecessary complex assessments, and facilitates earlier, personalized orthotic intervention for improved long-term foot health.
1. Introduction
Flatfeet affects 40% of the pediatric population worldwide, and is regarded as the most common clinical foot problem, specifically in younger children aged 3–6 years old with an increasing prevalence of 21% to 57%, respectively [1]. This foot condition further emphasizes the importance of using arch support or orthotic insoles to alleviate the symptoms of foot disorders and restore the alignment and function of the foot. While flat feet are intricately linked to arch height (AH), foot anthropometric measurements are widely performed in orthotic prescription. An inappropriate AH measurement could lead to increased peak plantar pressure, exerting extra stress on the joints and ligaments during movements [2]. Ensuring appropriate AH and adequate support to the arch area can enhance the kinematics and kinetics of gait during daily activities, thus leading to reduced pain and improved physical stability [3].
AH can be measured both directly and indirectly, with each method having its own distinct procedural requirements and measurement principles. Direct methods require the physical presence of an individual, as they involve obtaining measurements from the actual foot by using instruments such as calipers or 3D foot scanners, making them less feasible for rapid or large-scale screening. Furthermore, 3D scanning methods present additional complexity and technical challenges, involuntary movement is recognized as a major limitation in the acquisition of 3D foot shapes, because it causes distortion and voids that impair the quality of the 3D foot models. Obtaining reliable AH remains challenging in practice. According to Williams and McClay [4], the standard and most reliable approach of measuring AH is dividing the dorsum height at 50% of the foot length (FL) by the truncated FL. In contrast, indirect methods estimate AH by analyzing other foot parameters, often derived from footprints. For instance, Neeraj et al. [5] focused on the mid-footprint plantar angle, while Chu et al. [6] introduced the Arch Index, which is used to calculate AH by dividing the midfoot area by the total footprint area, excluding the toes. Notably, the Arch Index has been shown to be positively correlated with radiographically measured angles of the medial longitudinal arch [7].
Unlike 3D scanning or professional clinical assessment, which require special equipment, controlled environments, and trained personnel, footprint analysis using a Podograph is a simple, cost-effective, and widely accessible approach for preliminary foot health screening. Podographs are portable, easy to use, and require minimal training, making them suitable for use in a variety of settings, including schools, and community clinics. By enabling the rapid collection of essential foot parameters, 2D footprint analysis allows for efficient preliminary screening. Individuals with potential foot problems can be promptly identified for professional clinical evaluation and intervention. There is subsequently less need for time-consuming foot evaluations. Offering a practical and accessible method for individuals to estimate their AH without the need for complex calculations or special equipment enables early identification of flatfoot-related issues, and thus facilitate timely referral for professional intervention.
Previous research has demonstrated that the parameters derived from footprint analyses can effectively be used to estimate AH [5,6,7]. While many studies have also explored the relationship between footprint parameters and AH [8,9,10], there has been little mention of whether basic foot measurements obtained from footprint analyses can also serve as reliable predictors of AH. Therefore, the aim of this study is to estimate AH among Chinese children with flatfeet by using a regression model that incorporates footprint measurements and footprint indexes. By simplifying the calculation and estimation process, this study offers a quicker and more accessible method for determining AH, supporting earlier identification and more effective orthotic intervention for pediatric flatfoot.
2. Materials and Methods
2.1. Participants
A random sample of 57 flatfooted children between 8 and 12 years old from local primary schools and health community centers in Hong Kong participated in the study. The sample comprised 26 girls and 31 boys. The inclusion criteria were (1) no lower limb fractures or deformities, and (2) no foot injuries that affect body gestures and normal walking. The body mass index (BMI) cut-off points followed the standards in Cole et al. [11,12]. The BMI cut-off points for underweight males and females are 13.11–14.05 kg/m2 and 13–14.28 kg/m2, respectively. The BMI cut-off points for overweight males and females are 18.44–20.89 kg/m2 and 18.35–21.68 kg/m2, respectively.
2.2. Foot Diagnosis and the Collection of AH
Prior to the start of the study, the parents or guardians of the participants were given information about and details of the study and asked to sign consent forms. The participants were then assessed by an experienced professional orthotist and prosthetist (P&O). AH was obtained by using a caliper. They were diagnosed with flatfeet if pronation, fallen arch and a hindfoot valgus of more than 4° were identified. These subjects with flatfeet were further classified into three groups marked by the severity of their condition: (1) mild, (2) moderate, and (3) serious. All recruitment and foot assessment procedures were performed in accordance with the ethical principles, and approval was received from the Hong Kong Polytechnic University Institutional Review Board under the reference HSEARS20240125006.
2.3. The Collection of Footprint Anthropometric Parameters
Footprints were acquired by using a Podograph in the bipedal position of a full standing weight-bearing posture for 10 s. The shoes and socks of the subjects were removed before recording their footprints. They were asked to keep one foot on the center of the Podograph and maintain the requested position wide feet placed apart at shoulder width while looking straightforward. The footprint recording was repeated for the contralateral foot. A total of 114 (57 subjects × 2 feet) footprints were collected. The subjects had to perform the test once more if they wobbled or any foot movements were observed during the process. Eleven footprint measurements that comprise two angular dimensions, six length dimensions and three width dimensions, as well as four footprint indexes, are analyzed in this study. The definitions and standards of these parameters are shown in Figure 1 and Table 1 [13,14,15,16,17,18,19].
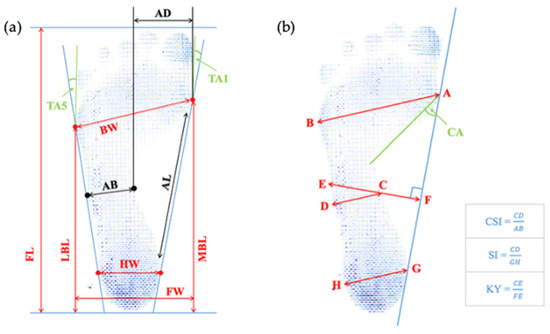
Figure 1.
Diagrams of footprint showing (a) 11 footprint parameters—1st toe angle (TA1), 5th toe angle (TA5), foot length (FL), medial ball length (MBL), lateral ball length (LBL), arch length (AL), arch breadth (AB), arch depth (AD), ball width (BW), heel width (HW) and foot width (FW); (b) 4 footprint indexes and their corresponding calculation methods.

Table 1.
Footprint indexes and their classification standards for flatfeet.
2.4. Data Analysis
The AH, anthropometric measurements of the footprints, and footprint indexes derived from the footprints were analyzed by using IBM Statistical Package for Social Science (SPSS) computer software, SPSS of the version 29.0.2.0 (IBM Corp., Armonk, NY, USA). Foot measurements, except for the angular dimensions, were normalized to the FL [20]. A paired-samples T-test was used to identify the statistical differences between the mean values of the left and right foot measurements. One-way ANOVA test was used to compare the foot variables among the three levels of flatfeet severity (i.e., mild, moderate, or severe). A stepwise linear regression model was developed to estimate AH from the footprint parameters. The significance level for the statistical analysis was set at 0.05.
3. Results
The demographic characteristics of the participants are provided in Table 2. The 57 flatfooted children (26 girls and 31 boys) have a mean age of 9.6 ± 0.9 years old. The incidence of flatfeet is 54.4% among the boys and 45.6% among the girls. The boys are more prone to flatfeet than the girls, which aligns with the results of studies performed with Chinese children in Taiwan in [21,22]. An analysis of the paired-samples T-test results with a 95% confidence interval revealed no significant differences between right and left foot and footprint variables.
Table 2.
Demographic characteristics of participated children (n = 57).
Additionally, discrepancies in identifying flatfeet among the participants can be observed with the use of different footprint indexes (see Figure 2). The diagnostic results from the four footprint indexes used in this study are compared with the assessments of the P&O. Both the CA and CSI classify 48.7% of the participants with flatfeet, while the SI identifies 39.8%, and the KY index classifies 86.7%. The KY index aligns more closely with the assessment of the P&O than the other three indexes, so it appeared to be the most accurate index for diagnosing flatfeet in the study sample.
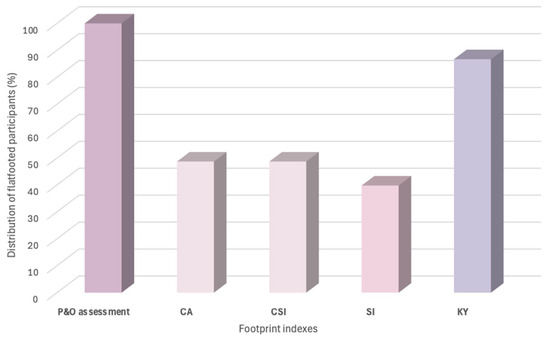
Figure 2.
Percentage distribution of flatfooted participants with reference to the four footprint indexes. Abbreviation: CA (Clarke’s Angle); CSI (Chippaux–Smirak Index); SI (Staheli Index); KY (Sztriter–Godunov Index).
One-way ANOVA was further conducted to evaluate the relationship between the flatfoot severity groups and foot variables. All four footprint indexes can significantly differentiate the degree of flatfoot with p-values less than 0.05 (i.e., p < 0.001) (Table 3). For the absolute foot measurements (Table 4), statistically significant differences were found for the arch depth (AD), arch breadth (AB) and heel width (HW). The AD, AB, HW, medial ball length (MBL) and ball width (BW) were significant when the dimensions were normalized to the FL in categorizing the subjects into three severity groups. Generally speaking, increasing severity of flatfeet seems to be associated with decreased AD, increased AB and increased HW. The results also suggested that the footprint index is helpful in categorizing the degree of flatfeet.
Table 3.
Mean values, standard deviation and p-values of four footprint indexes for the degree of flatfoot severity.
Table 4.
Mean values, standard deviation and p-values of the foot measurements (absolute and normalized) for the degree of flatfoot severity.
Consequently, all 15 footprint variables (4 footprint indexes and 11 footprint measurements) were used to construct a stepwise regression model to predict the AH. Twelve variables were removed. The CA, HW and AD were found to be the key predictors for the AH of the sample. The overall regression obtained was statistically significant (R2 = 0.442, F (3, 67) = 17.715, p < 0.001) and explained 44% of the variability in the sample.
The fitted stepwise regression model is:
AH = −9.759 − CA (0.504) + HW (0.918) + AD (0.286)
4. Discussion
This study explores the feasibility of predicting the AH of 8-to-12-year-old Chinese flatfooted children by using three simple measurable parameters obtained from their footprints. The results showed that CA, HW and AD can estimate AH. In [23,24], AH was found to be related to biomechanical and lifestyle factors, including age, body height, Cole index, gender, residence, time of foot orthotics wedging, and the time spent on playing sports. Our study, however, reports no significance among the demographic factors, including age, body weight, body height, BMI and gender, to predict AH.
In the recent literature, regression analysis has been increasingly applied in pediatric foot biomechanics to understand the relationship between gait parameters and growth-related variables. In [8], regression lines correlating spatial–temporal gait parameters, including cadence and various gait phases such as heel contact and push off, with children’s height were established. In the context of pediatric flatfoot, foot arch parameters obtained from 3D foot scanning were able to detect changes in foot arch morphology [9]. While AH can be obtained from calculations [4,5,6,7] and 3D foot scanning [17,25], formulated predictive equations for the estimation of AH from anthropometric measurements of footprints in a statistical approach are still lacking. To the best of our knowledge, direct application of regression models specifically targeting flatfoot biomechanical variables is also not detailed in the current literature.
Accounting for approximately 44% of the variance in estimating AH (R2 = 0.442), the regression model developed in this study provides insight into the estimation of AH by using a more simple method. The model only requires a single operator to capture the footprint and the angular and linear foot measurements obtained are sufficient for the estimation of AH. Without the need for complex mathematical calculations or special equipment, this process can be easily carried out, even at home. This accessible approach can also serve as a practical preliminary screening tool for the general public to monitor their own foot health. By empowering individuals to assess their foot conditions independently, this method has the potential to facilitate the early detection of arch-related issues and promote proactive foot care.
As observed from the study, AD and HW are significantly associated with the severity of flatfeet. A decrease in AD and an increase in HW are usually found in more severe cases among the subjects. Our results showed that the average AD is reduced from 34.7 mm to 17.06 mm, while the average HW is increased from 41.86 mm to 44.76 mm with increased flatfoot severity. This finding somewhat explains the reason for the regression model selecting CA, AD and HW as the key predictors of AH in flatfooted children. While flexible flatfeet is usually associated with the collapse of the medial longitudinal arch [26], the ankle rolls inward, and the heel bone angles outward into hindfoot valgus [27]. Concurrently, the loss of the arch structure reduces AD, which can also be supported by the decrease in CA. This finding also implies that the insole design for flatfooted children, especially for those with severe collapse of the medial longitudinal arch, should be reinforced with a heel cup and hindfoot control, as well as arch and forefoot support [28]. A deep and rigid heel cup is essential for managing heel motion and mitigates valgus deformity [29]. The heel cup provides robust medial and lateral support, thus stabilizing the heel, correcting foot alignment and preventing excessive eversion [30]. To maintain AH and increase AD, the arch support should feature a well-defined contour and sufficient rigidity to prevent further collapse while allowing flexibility for natural movement.
Study Limitations
The generalizability of this study is majorly limited by the sample size and age. Due to the lack of sufficient and larger volume of data on the flatfooted subjects, with only 57 participants, the reliability of the proposed regression model is affected, thus limiting the application of the model. Increasing the sample size would also enable sub-analyses for age and gender effects. While pediatric research usually divide variables by the independent factor of age [21,31,32], the participant distribution in this study: 8 years old (n = 6), 9 years old (n = 17), 10 years old (n = 29), 11 years old (n = 2), and 12 years old (n = 2), is limited for age-stratified descriptive analysis. Future study with more balanced age distributions should also consider age as an independent factor.
Moreover, the present study highlights the crucial role of footprint indexes in classifying flatfeet and predicting AH. Shiang et al. [33] and Roy et al. [34] concluded that AH is highly correlated with footprint indexes such as the arch angle, arch length index, footprint index and truncated Arch Index. However, a notable limitation of this study is the exclusion of additional footprint parameters, such as the Arch Index, Martirosov’s K Index, Valgus Index or subarch angle [10]. Including these parameters might enhance the interpretation of AH by incorporating a broader range of footprint measurements and indexes that encompass linear, angular, and area dimensions. Additionally, although no statistical difference is found between the left and the right foot in this study, previous studies revealed different AH between dominant and nondominant feet [35]. Expanding the set of parameters would provide a more comprehensive understanding of the relationship between footprint characteristics and AH, thus potentially improving the accuracy and robustness of the prediction models.
5. Conclusions
This study has demonstrated the feasibility of predicting the AH of 8-to-12-year-old Chinese flatfooted children by using three simple footprint-derived parameters: CA, HW, and AD. Offering a practical and accessible method for individuals to estimate their AH without the need for complex calculations or special equipment, the developed regression model thus empowers individuals and their caregivers to conduct preliminary foot health screenings at home, thus potentially facilitating early detection and intervention for flatfoot-related issues. The observed decrease in AD and increase in HW with increasing flatfoot severity underscore the biomechanical changing characteristic of flexible flatfoot and highlight the importance of targeted insole features, such as a deep heel cup and arch support. Future research should aim to include a larger and more diverse sample, as well as a broader array of footprint indexes, to enhance the predictive accuracy and broaden the applicability of the model developed in this study. Such efforts will contribute to a more comprehensive understanding of pediatric flatfoot and support the development of effective screening and intervention strategies.
Author Contributions
Conceptualization, S.-H.L.; methodology, S.-H.L.; formal analysis, S.-H.L.; investigation, S.-H.L. and P.-L.L.; resources, Q.-L.L.; data curation, S.-H.L.; writing—original draft preparation, S.-H.L.; writing—review and editing, P.-L.L. and K.-L.Y.; visualization, S.-H.L.; supervision, K.-L.Y., C.-P.H. and J.Y.; project administration, P.-L.L. and K.-L.Y.; and funding acquisition, K.-L.Y. All authors have read and agreed to the published version of the manuscript.
Funding
The research was funded by The Hong Kong Polytechnic University and the Laboratory for Artificial Intelligence in Design (Project 3-2) under the InnoHK Research Clusters, Hong Kong Special Administrative Region Government.
Institutional Review Board Statement
The study was conducted in accordance with the ethical principles, and approval was received from the Hong Kong Polytechnic University Institutional Review Board under reference HSEARS20240125006.
Informed Consent Statement
Informed consent was obtained from all subjects involved in the study.
Data Availability Statement
The original contributions presented in this study are included in the article. Further inquiries can be directed at the corresponding author.
Acknowledgments
This study was supported by the InnoHK initiative of the Innovation and Technology Commission of the Hong Kong Special Administrative Region Government, and The Hong Kong Polytechnic University. We acknowledge the partial financial support from the Laboratory for Artificial Intelligence in Design (Project 3-2). The team also acknowledges the in-kind sponsorship of Kong Footcare Limited and the clinical advice from TSE Chi-yung, prosthetist and orthotist at the Centre for Orthopaedic Surgery, in this study.
Conflicts of Interest
The authors declare no conflicts of interest.
Abbreviations
The following abbreviations are used in this manuscript:
| AH | Arch Height |
| TA1 | 1st Toe Angle |
| TA5 | 5th Toe Angle |
| FL | Foot Length |
| AL | Arch Length |
| MBL | Medial Ball Length |
| LBL | Lateral Ball Length |
| AD | Arch Depth |
| AB | Arch Breath |
| HW | Heel Width |
| FW | Foot Width |
| BW | Ball Width |
| CA | Clarke’s Angle |
| CSI | Chippaux–Smirak Index |
| SI | Staheli Index |
| KY | Sztriter-Godunov Index |
| P&O | Orthotist and Prosthetist |
| BMI | Body Mass Index |
References
- Ullah, H. Correlation of flexible flatfoot and Q-angle among secondary school students by using Dennis method. Pak. J. Rehabil. 2020, 8, 44–49. [Google Scholar] [CrossRef]
- Fan, Y.; Guo, J.; Mo, Z.; Su, S.; Zhu, R. The effect of arch height and material hardness of personalized insole on correction and tissues of flatfoot. J. Healthc. Eng. 2017, 2017, 8614341. [Google Scholar] [CrossRef]
- Chen, H.; Sun, D.; Fang, Y.; Gao, S.; Zhang, Q.; Bíró, I.; Tafferner-Gulyás, V.; Gu, Y. Effect of orthopedic insoles on lower limb motion kinematics and kinetics in adults with flat foot: A systematic review. Front. Bioeng. Biotechnol. 2024, 12, 1435554. [Google Scholar] [CrossRef] [PubMed]
- Williams, D.S.; McClay, I.S. Measurements used to characterize the foot and the medial longitudinal arch: Reliability and validity. Phys. Ther. 2000, 80, 864–871. [Google Scholar] [CrossRef] [PubMed]
- Neeraj, V.; Puja, D.; Achleshwar, G. A New Approach for Medial Longitudinal Arch Estimation by “Foot Print”: A Comparative Study. Natl. J. Clin. Anat. 2020, 9, 101–107. [Google Scholar] [CrossRef]
- Chu, W.C.; Lee, S.H.; Chu, W.; Wang, T.J.; Lee, M.C. The use of arch index to characterize arch height: A digital image processing approach. IEEE Trans. Biomed. Eng. 1995, 42, 1088–1093. [Google Scholar] [CrossRef]
- Kanatli, U.; Yetkin, H.; Cila, E. Footprint and radiographic analysis of the feet. J. Pediatr. Orthop. 2001, 21, 225–228. [Google Scholar] [CrossRef]
- Agostini, V.; Nascimbeni, A.; Di Nardo, F.; Fioretti, S.; Burattini, L.; Knaflitz, M. Dependence of gait parameters on height in typically developing children. In Proceedings of the 2015 37th Annual International Conference of the IEEE Engineering in Medicine and Biology Society (EMBC), Milan, Italy, 25–29 August 2015; IEEE: New York, NY, USA, 2015. [Google Scholar] [CrossRef]
- Liu, Q.; Zhao, C.; Yang, X.; Tang, J.; Chen, J.; Tang, L.; Wu, J. Biomechanics of transverse axis of medial longitudinal arch of children’s foot based on 3D scanning. Front. Pediatr. 2023, 11, 1197439. [Google Scholar] [CrossRef]
- Chen, C.H.; Huang, M.H.; Chen, T.W.; Weng, M.C.; Lee, C.L.; Wang, G.J. The correlation between selected measurements from footprint and radiograph of flatfoot. Arch. Phys. Med. Rehabil. 2006, 87, 235–240. [Google Scholar] [CrossRef]
- Cole, T.J.; Bellizzi, M.C.; Flegal, K.M.; Dietz, W.H. Establishing a standard definition for child overweight and obesity worldwide: International survey. BMJ 2000, 320, 1240. [Google Scholar] [CrossRef]
- Cole, T.J.; Flegal, K.M.; Nicholls, D.; Jackson, A.A. Body mass index cut offs to define thinness in children and adolescents: International survey. BMJ 2007, 335, 194–197. [Google Scholar] [CrossRef]
- Bhattacharjee, N.; Goswami, M. Footprint analysis and prevalence of flatfoot: A study among the children of South 24 Parganas, West Bengal, India. Anthropol. Rev. 2017, 80, 369–380. [Google Scholar] [CrossRef][Green Version]
- Ghazaleh, L.; Saleh-Sedghpour, B.; Mohajerinejad, N.; Mansoobi, E. Comparing three footprint grades to evaluate footprint indexes for flat foot diagnosis. Phys. Treat. 2019, 9, 137–146. [Google Scholar] [CrossRef]
- Hegazy, F.; Aboelnasr, E.; Abuzaid, M.; Kim, I.J.; Salem, Y. Comparing validity and diagnostic accuracy of clarke’s angle and foot posture index-6 to determine flexible flatfoot in adolescents: A cross-sectional investigation. J. Multidiscip. Healthc. 2021, 14, 2705–2717. [Google Scholar] [CrossRef] [PubMed]
- Mueller, J.; Richter, M.; Schaefer, K.; Ganz, J.; Lohscheller, J.; Mueller, S. How to measure children’s feet: 3D foot scanning compared with established 2D manual or digital methods. J. Foot Ankle Res. 2023, 16, 21. [Google Scholar] [CrossRef] [PubMed]
- Rogati, G.; Leardini, A.; Ortolani, M.; Caravaggi, P. Semi-automatic measurements of foot morphological parameters from 3D plantar foot scans. J. Foot Ankle Res. 2021, 14, 18. [Google Scholar] [CrossRef]
- Szczepanowska-Wołowiec, B.; Sztandera, P.; Kotela, I.; Zak, M. Assessment of the foot’s longitudinal arch by different indicators and their correlation with the foot loading paradigm in school-aged children: A cross sectional study. Int. J. Environ. Res. Public Health 2021, 18, 5196. [Google Scholar] [CrossRef]
- Szczepanowska-Wolowiec, B.; Sztandera, P.; Kotela, I.; Zak, M. Feet deformities and their close association with postural stability deficits in children aged 10–15 years. BMC Musculoskelet. Disord. 2019, 20, 537. [Google Scholar] [CrossRef]
- Mauch, M.; Mickle, K.J.; Munro, B.J.; Dowling, A.M.; Grau, S.; Steele, J.R. Do the feet of German and Australian children differ in structure? Implications for children’s shoe design. Ergonomics 2008, 51, 527–539. [Google Scholar] [CrossRef]
- Chen, J.P.; Chung, M.J.; Wang, M.J. Flatfoot Prevalence and Foot Dimensions of 5- to 13-Year-Old Children in Taiwan. Foot Ankle Int. 2009, 30, 326–332. [Google Scholar] [CrossRef]
- Chang, J.H.; Wang, S.H.; Kuo, C.L.; Shen, H.C.; Hong, Y.W.; Lin, L.C. Prevalence of flexible flatfoot in Taiwanese school-aged children in relation to obesity, gender, and age. Eur. J. Pediatr. 2010, 169, 447–452. [Google Scholar] [CrossRef]
- Pauk, J.; Ezerskiy, V. The Effect of Foot Orthotics on Arch Height: Prediction of Arch Height Correction in Flat-foot Children. Biocybern. Biomed. Eng. 2011, 31, 51–62. [Google Scholar] [CrossRef]
- Morrison, S.C.; Durward, B.R.; Watt, G.F.; Donaldson, M.D.C. Prediction of Anthropometric Foot Characteristics in Children. J. Am. Podiatr. Med. Assoc. 2009, 99, 497–502. [Google Scholar] [CrossRef] [PubMed]
- Yamashita, T.; Yamashita, K.; Sato, M.; Kawasumi, M.; Ata, S. Analysis of skeletal characteristics of flat feet using three-dimensional foot scanner and digital footprint. BioMed. Eng. OnLine 2022, 21, 56. [Google Scholar] [CrossRef]
- Rodriguez, N. Clinical Diagnosis and Assessment of the Pediatric Pes Planovalgus Deformity. Clin. Podiatr. Med. Surg. 2010, 27, 43–58. [Google Scholar] [CrossRef] [PubMed]
- Rose, J.D.; Martorana, V.J. Flat Feet and High-Arched Feet. In The Foot Book: A Complete Guide to Healthy Feet, 1st ed.; Johns Hopkins University Press: Baltimore, MD, USA, 2011; pp. 47–51. [Google Scholar]
- Ali, M.F.M.; Ahmad, N.I.; Yaakub, N. Innovative 3D-Printed Shoe Insole Design for Youth with Flat Feet. In Proceedings of the 2nd International Conference on Innovation and Technology in Sports, ICITS 2023, Kuala Lumpur, Malaysia, 27–28 November 2023; Springer Nature: Singapore, 2023; pp. 297–307. [Google Scholar]
- May, B.J.; Lockard, M.A. Prosthetics & Orthotics in Clinical Practice: A Case Study Approach; F.A. Davis: Philadelphia, PA, USA, 2011. [Google Scholar]
- Evans, A.M. The paediatric flat foot and general anthropometry in 140 Australian school children aged 7–10 years. J. Foot Ankle Res. 2011, 4, 12. [Google Scholar] [CrossRef]
- Ezema, C.I.; Abaraogu, U.O.; Okafor, G.O. Flat foot and associated factors among primary school children: A cross-sectional study. Hong Kong Physiother. J. 2014, 32, 13–20. [Google Scholar] [CrossRef]
- Pfeiffer, M.; Kotz, R.; Ledl, T.; Hauser, G.; Sluga, M. Prevalence of Flat Foot in Preschool-Aged Children. Pediatrics 2006, 118, 634–639. [Google Scholar] [CrossRef]
- Shiang, T.Y.; Lee, S.H.; Lee, S.J.; Chu, W.C. Evaluating different footprints parameters as a predictor of arch height. IEEE Eng. Med. Biol. Mag. 1998, 17, 62–66. [Google Scholar] [CrossRef]
- Roy, H.; Bhattacharya, K.; Deb, S.; Ray, K. Arch index: An easier approach for arch height (a regression analysis). Al Ameen J. Med. Sci. 2012, 5, 137–146. [Google Scholar]
- Zifchock, R.A.; Davis, I.; Hillstrom, H.; Song, J. The Effect of Gender, Age, and Lateral Dominance on Arch Height and Arch Stiffness. Foot Ankle Int. 2006, 27, 367–372. [Google Scholar] [CrossRef]


Disclaimer/Publisher’s Note: The statements, opinions and data contained in all publications are solely those of the individual author(s) and contributor(s) and not of MDPI and/or the editor(s). MDPI and/or the editor(s) disclaim responsibility for any injury to people or property resulting from any ideas, methods, instructions or products referred to in the content. |
© 2025 by the authors. Licensee MDPI, Basel, Switzerland. This article is an open access article distributed under the terms and conditions of the Creative Commons Attribution (CC BY) license (https://creativecommons.org/licenses/by/4.0/).