Article

Changes in Electrical Properties of Graphite Coatings Annealed in Air and Nitrogen Environments

by
Yusof-den Jamasali
1,2,*,
Abdul Mannan Majeed
3,
Sandra Stanionytė
4,
Valdas Šablinskas
5,
Gediminas Kreiza
3,
Algirdas Mekys
3 and
Patrik Ščajev
3,*
1
Department of Physics, College of Natural Sciences and Mathematics, Mindanao State University, Marawi City 9200, Lanao del Sur, Philippines
2
Department of Physics, Faculty of Science, Kastamonu University, 37200 Kastamonu, Türkiye
3
Institute of Photonics and Nanotechnology, Faculty of Physics, Vilnius University, Saulėtekio av. 3, 10257 Vilnius, Lithuania
4
Center for Physical Sciences and Technology, Saulėtekio av. 3, 10257 Vilnius, Lithuania
5
Institute of Chemical Physics, Faculty of Physics, Vilnius University Saulėtekio av. 3, 10257 Vilnius, Lithuania
*
Authors to whom correspondence should be addressed.
Appl. Sci. 2025, 15(21), 11727; https://doi.org/10.3390/app152111727
Submission received: 13 October 2025 / Revised: 27 October 2025 / Accepted: 31 October 2025 / Published: 3 November 2025
(This article belongs to the Section Electrical, Electronics and Communications Engineering)

Abstract

Graphite has fascinated researchers since its discovery because of its unique features and potential applications. Graphite can be applied as a coating onto other materials to tailor their functionality for specific device applications. In the present study, graphite spray was deposited onto glass substrates and then annealed in air and in a N2 gas environment at different temperatures (50 °C to 500 °C). SEM, Raman, and XRD characterization techniques were employed. SEM showed the deposited graphite material has flake-like structures. Raman spectra reveal three prominent spectral bands at ~1350.91 cm−1, ~1579.19 cm−1 and ~2691.47 cm−1, which signify the G, D, and 2D vibrational modes of graphite, respectively. XRD results show three signature peaks of hexagonal graphene sheets at 2θ ≈ 26.4, 54.3, and 77.7 deg corresponding to (002), (004), and (110), respectively. Electrical conductivity of the films was investigated with the use of two- and four-probe methods. In a N2 gas environment, the annealing temperature did not have much effect on crystallinity, while significant changes in the conductivity of the graphite coatings were observed using different annealing temperatures.

1. Introduction

Controlling the functionality of the material’s surface is one of the biggest challenges in materials science and nanotechnology. Coating the surface with a proper choice of material can address this issue. With the appropriate technique and compatibility of materials, especially at the interface of the coating and the substrate material, the desired characteristics and properties could be achieved for specific device applications.
Properties like enhanced electrical conductivity are important in electronic and optoelectronic devices [1], damage sensing coatings [2], and strain gauges [3]; piezoresistivity is among the bases of mechanisms utilized in pressure sensors [4]; optical properties have high importance in solar cells and LEDs [5,6].
Among the interesting materials that have fascinated many researchers for a long time is graphite. It has high mechanical strength, high thermal stability, high thermal conductivity, and high electrical conductivity [1,7,8]
Graphite is composed of carbon atoms arranged in a planar hexagonal honeycomb lattice structure, which is a consequence of 3 out of 4 valence electrons undergoing sp2 orbital hybridization in the carbon atom [9,10,11]. Also due to this hybridization, in-plane carbon atoms are more tightly bonded to each other. Out-of-plane bonding between adjacent graphite sheets is much weaker. Hence, planes of graphene can be stripped off more easily (e.g., by exfoliation), and electrical conduction is possible along the plane but not perpendicularly to it [12]. A single sheet of graphite is known as graphene [3,13].
Graphite can be incorporated into other nanomaterials in numerous device applications, such as shielding against microwave pollution in devices [14] and in thermal management systems in batteries [15]. Graphite can serve as a filler in the matrices of nanocomposites to achieve special sensing capabilities in a textile sensor [3]. Fabricating graphite as an anode in Li-ion batteries improves their performance [16].
Recently, graphite thin layers have been deposited on magnesium alloys [17], hot-rolled mild steel sheet substrates [18], Cr3C2-25 (Ni20Cr) [19], AlZn/nickel [20], low-density polyethylene [21], stainless steel, copper [22], nickel foam [23], chromium nickel steel [24], polydopamine [25], and paper [26,27] by using spray coating, chemical vapor deposition, laser processing, dip coating, and the direct drawing methods. Such coatings can be applied for various protective and lubricative purposes as well for devices such as gas sensors, photocatalysts, light/microwave absorbers, electromagnetic interference shields, battery/capacitor electrodes, and photosensors [5,28,29]. Many researchers have shown changes in crystallinity and conductive properties in graphite materials by synthesizing them at high temperature ranges [15,16,30]. Graphite layers can also be deposited on silicon carbide paper through the reverse abrasion method. It has been observed that the average surface roughness and conductivity have improved in the thick layers [31,32]. Ersu et al. used a laser annealing technique to observe the conductivity of the graphite films on paper through spray coating and the direct drawing method. It was observed that after high-power laser annealing, the resistance decreased from 16.5 kΩ to 2.5 kΩ [26]. Bartolomeo at el. deposited graphite thin films on a low-density polyethylene substrate through spray-coating technology, using a commercial lacquer, Graphit 33. A good graphite material has been confirmed by Raman spectroscopy measurements with 321 Ω resistance at 20 °C [21]. Nguyen et al. analyzed the electrical properties of graphite through gamma ray irradiations. An increase in gamma ray irradiation dose leads to an exponential increase in the electrical conductance and a gradual decrease in the interlayer spacing, accompanied by indistinguishable changes in morphology [33]. Nonetheless, there is a knowledge gap in applying commercial graphite as coatings prepared in different environments using various annealing temperatures.
In this study, graphite was deposited onto glass substrates using a commercially available graphite coating spray. The coated samples were subsequently annealed in both air and nitrogen gas (N2) environments at temperatures ranging from 100°C to 500°C. Scanning Electron Microscopy (SEM), X-ray Diffraction (XRD), and Raman Spectroscopy were employed to investigate the surface morphology, crystallinity, and Raman-active phonon modes of the graphite films, respectively. Electrical conductivity measurements were also conducted to assess the influence of annealing conditions on the electrical performance of the samples.

2. Materials and Methods

Glass substrates (with 1.1 mm thickness) from AvantorTM (Avantor, Phillipsburg, NJ, USA) were cut into 20 mm × 25 mm samples. These were cleaned in ultrasonic cleaner for 15 min in the following sequence: in soap and distilled water, in distilled water, then in acetone, and then in isopropanol. Then, they were dried with a N2 gas gun. These glasses were then placed inside a chamber for activation by ozone under UV light (NOVASCAN PSDP-UV4T). Then, glass substrates were placed horizontally in a cubical vessel. Kontakt Chemie Graphit 33 was sprayed onto the glass substrates for four seconds at an optimal distance of 25 cm. The samples were then dried in air for 30 min. Then, the samples were annealed on hot plates at different temperatures (50 to 500 °C) either in air or in a N2 gas environment in an MBRAUN glove box (M. BRAUN INERTGAS-SYSTEME GMBH, Garching, Germany). For glovebox annealing, we used O2; H2O < 0.1 ppm, N2 purity of 99.999%, N2 overpressure of 2.3 mbar, and a regulated hotplate (VWR 4 × 4 CER). The temperature ramp rate was 35 °C/min; the dwell time was 30 min. A thermocouple was placed on the reference glass substrate surface at the hotplate center. For air annealing, samples were annealed on a hot plate in ambient air (40% RH). We placed the samples in the middle of the PC-400D hotplate (Corning, Glendale, AZ, USA) where the temperature was uniform. The sample production scheme is provided in Figure 1.
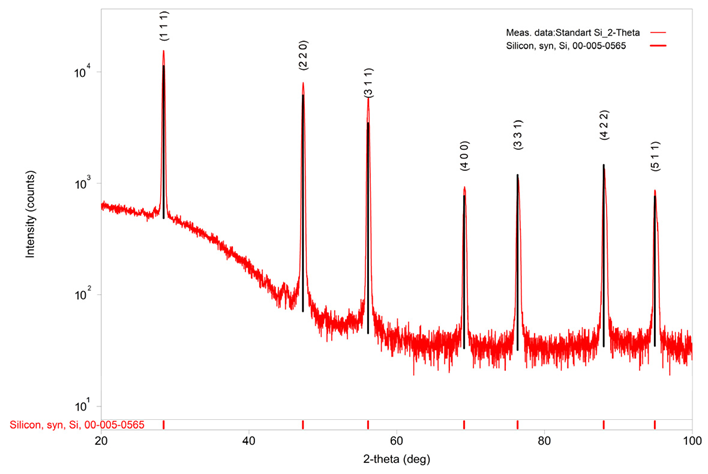
A Hitachi SU8230 microscope was used for the scanning electron microscopy (SEM) measurements. The X-ray diffraction (XRD) patterns of the graphite samples were collected using a SmartLab diffractometer (Rigaku) equipped with a 9 kW Cu rotating anode X-ray tube and an SC-70 scintillation detector. Grazing incidence geometry was employed, with the incidence angle of the Cu Kα beam set to 0.5° to minimize the influence of the substrate [34,35]. The observed peak widths (βobs) are a combination of true crystallite effects and the instrumental effects, which are described by the equation β2obs = β2sample + β2instr. The instrumental width of βinstr = ~0.3° FWHM was determined by using a reference Si powder (see Appendix B), allowing us to obtain the true crystallite effects (βsample) and finally the crystallite size D. This procedure is referred to as Scherrer broadening correction.
For Raman spectra acquisition, a Confocal Raman Grating Spectrometer with a microscope “MonoVista CRS” (S&I GmbH, Warstein, Germany) was used [36]. The Raman spectra were measured at 532 nm wavelength, using an edge-pass filter and a 100× objective with 0.8 numeric aperture. The spectra were summed over 50 exposures with a 1 s duration. The laser power used on the sample was P = 3 mW, focused on a 5 μm diameter spot. It induces a maximum temperature change ΔT in the sample according to equation ΔT = αP/(πk) = 97 °C [37], where α = 5.5 × 10⁶ m−1 [38] is the absorption coefficient of graphite at 532 nm, while k = 170 Wm−1K−1 is its average thermal conductivity [39]. For all samples, we used the same excitation conditions to equalize temperature-induced Raman peak position shifts [40].
In preparation for the conductivity measurements, silver electrodes (Ag) of 30 nm thickness were deposited onto the graphite samples using a thermal evaporator SQM-160 (INFICON, Bad Ragaz, Switzerland) at a deposition rate of 1 Å/s. Then copper wires were attached with a silver paste. The conductivity measurements were performed using a two-probe technique with a Keithley 2401 source meter operated in the LabView environment. Additionally, electrical measurements were carried out in a four-probe Van der Pauw configuration, using a Keithley 6430 source meter as the current source and a Keithley 6514 electrometer for voltage sensing. The applied voltage was varied from −1 V to +1 V, resulting in source currents ranging from microamperes up to milliamperes depending on the sample. For low sample resistivity, the contact resistance has considerable impact on the measurements, and hence the four-probe method is more favorable. The heating due to current flow through the layers was visualized using a Flir One Pro thermal camera (Teledyne Technologies, Thousand Oaks, CA, USA).

3. Results

The film characterization results are as follows.

3.1. SEM Morphology

Figure 2 shows the SEM micrographs of the samples (a) prepared in air at 20 °C, (b) annealed in air at 500 °C, and (c) annealed in a N2 gas environment at 500 °C at 20 kx magnifications. Flake-like structures in random order are observed, a characteristic feature of graphite [41,42]. More holes in the structures are observed in samples annealed at 500 °C in both environments as indicated in the figure, suggesting the evaporation of some impurities which could be coming from the graphite spray. Figure 2d shows the cross section of the sample annealed in air at 100 °C. The thickness of the sample is not uniform; it ranges from about 10 to 15 μm.

3.2. XRD Characterization

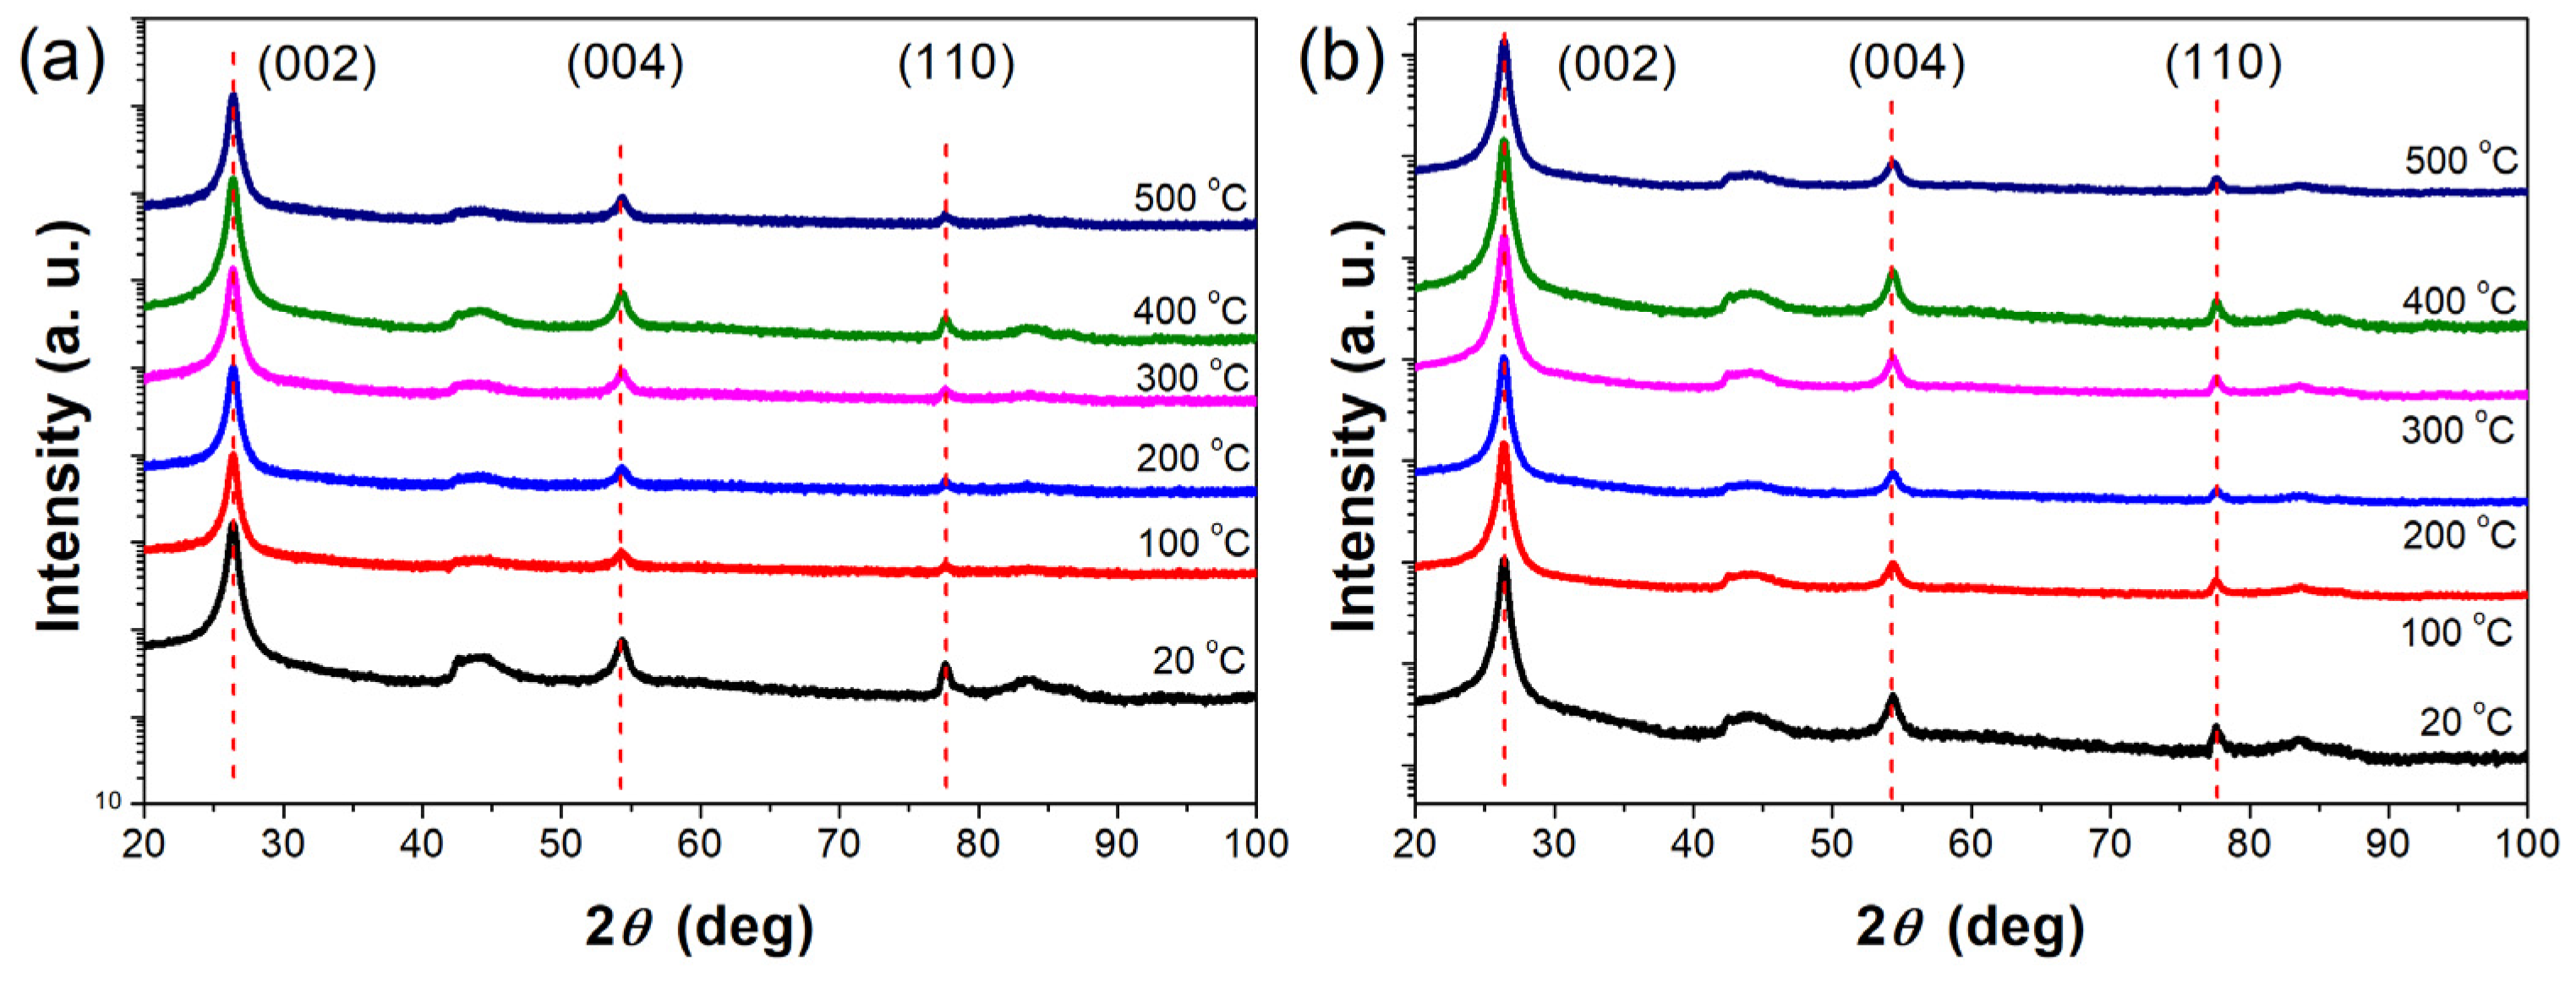
Figure 3 shows the XRD spectrum scans ranging from 2θ = 20 to 100 deg of samples prepared (a) in air and (b) in a N2 gas environment annealed at 100–500 °C. To filter out the information wanted, the Savitzky–Golay (SG) method was employed in the data smoothing of the raw XRD spectra. Characteristic peaks of hexagonal graphene are present based on the PDF card No.: 04-014-0362. Three prominent peaks at 2θ ≈ 26.4 deg, 2θ ≈ 54.3 deg, and 2θ ≈ 77.7 in both sets of samples correspond to (002), (004), and (110) reflections of graphite.
The average in-plane crystallite sizes (Da) were determined from the respective (110) full width at half maximum (FWHM) values, whereas the out-of-plane crystallite sizes (Dc) were determined from (002) FWHM values by the Scherrer equation [43,44,45]:
D = K λ β cos θ
where β = βsample = (π/180)FWHM, λ is the X-ray wavelength, and θ is the diffraction angle coefficient K = 0.89 for (002) (and 1.84 for (110)). Peak position, 2θ, and FWHM for (002) and (110) were obtained upon applying the Pearson VII fitting function to each peak separately. Peak positions, FWHM, and calculated Dc and Da are listed in Table 1 below. These parameters assess the structural anisotropy of the samples, like Da/Dc ratio, which estimates the shape of crystallite [46]. The obtained Da/Dc ratios are 2.21–2.63 and 2.05–3.82 for samples prepared in an air and N2 gas environment, respectively.
The interplanar distance d based on (002) reflection was calculated using Equation (2) [47]:
d ( 002 ) = λ 2 sin θ
And we obtained a value of 3.38 Å for all the samples. The packing density of layers is calculated from Equation (3) [48].
ρ = 0.762 d ( 002 )
where d ( 002 ) is in nm, and a value of 2.26 g/cm3 was obtained for all the samples. Individual values of additional parameters are listed in Table A3 in Appendix A.

3.3. Raman Analysis

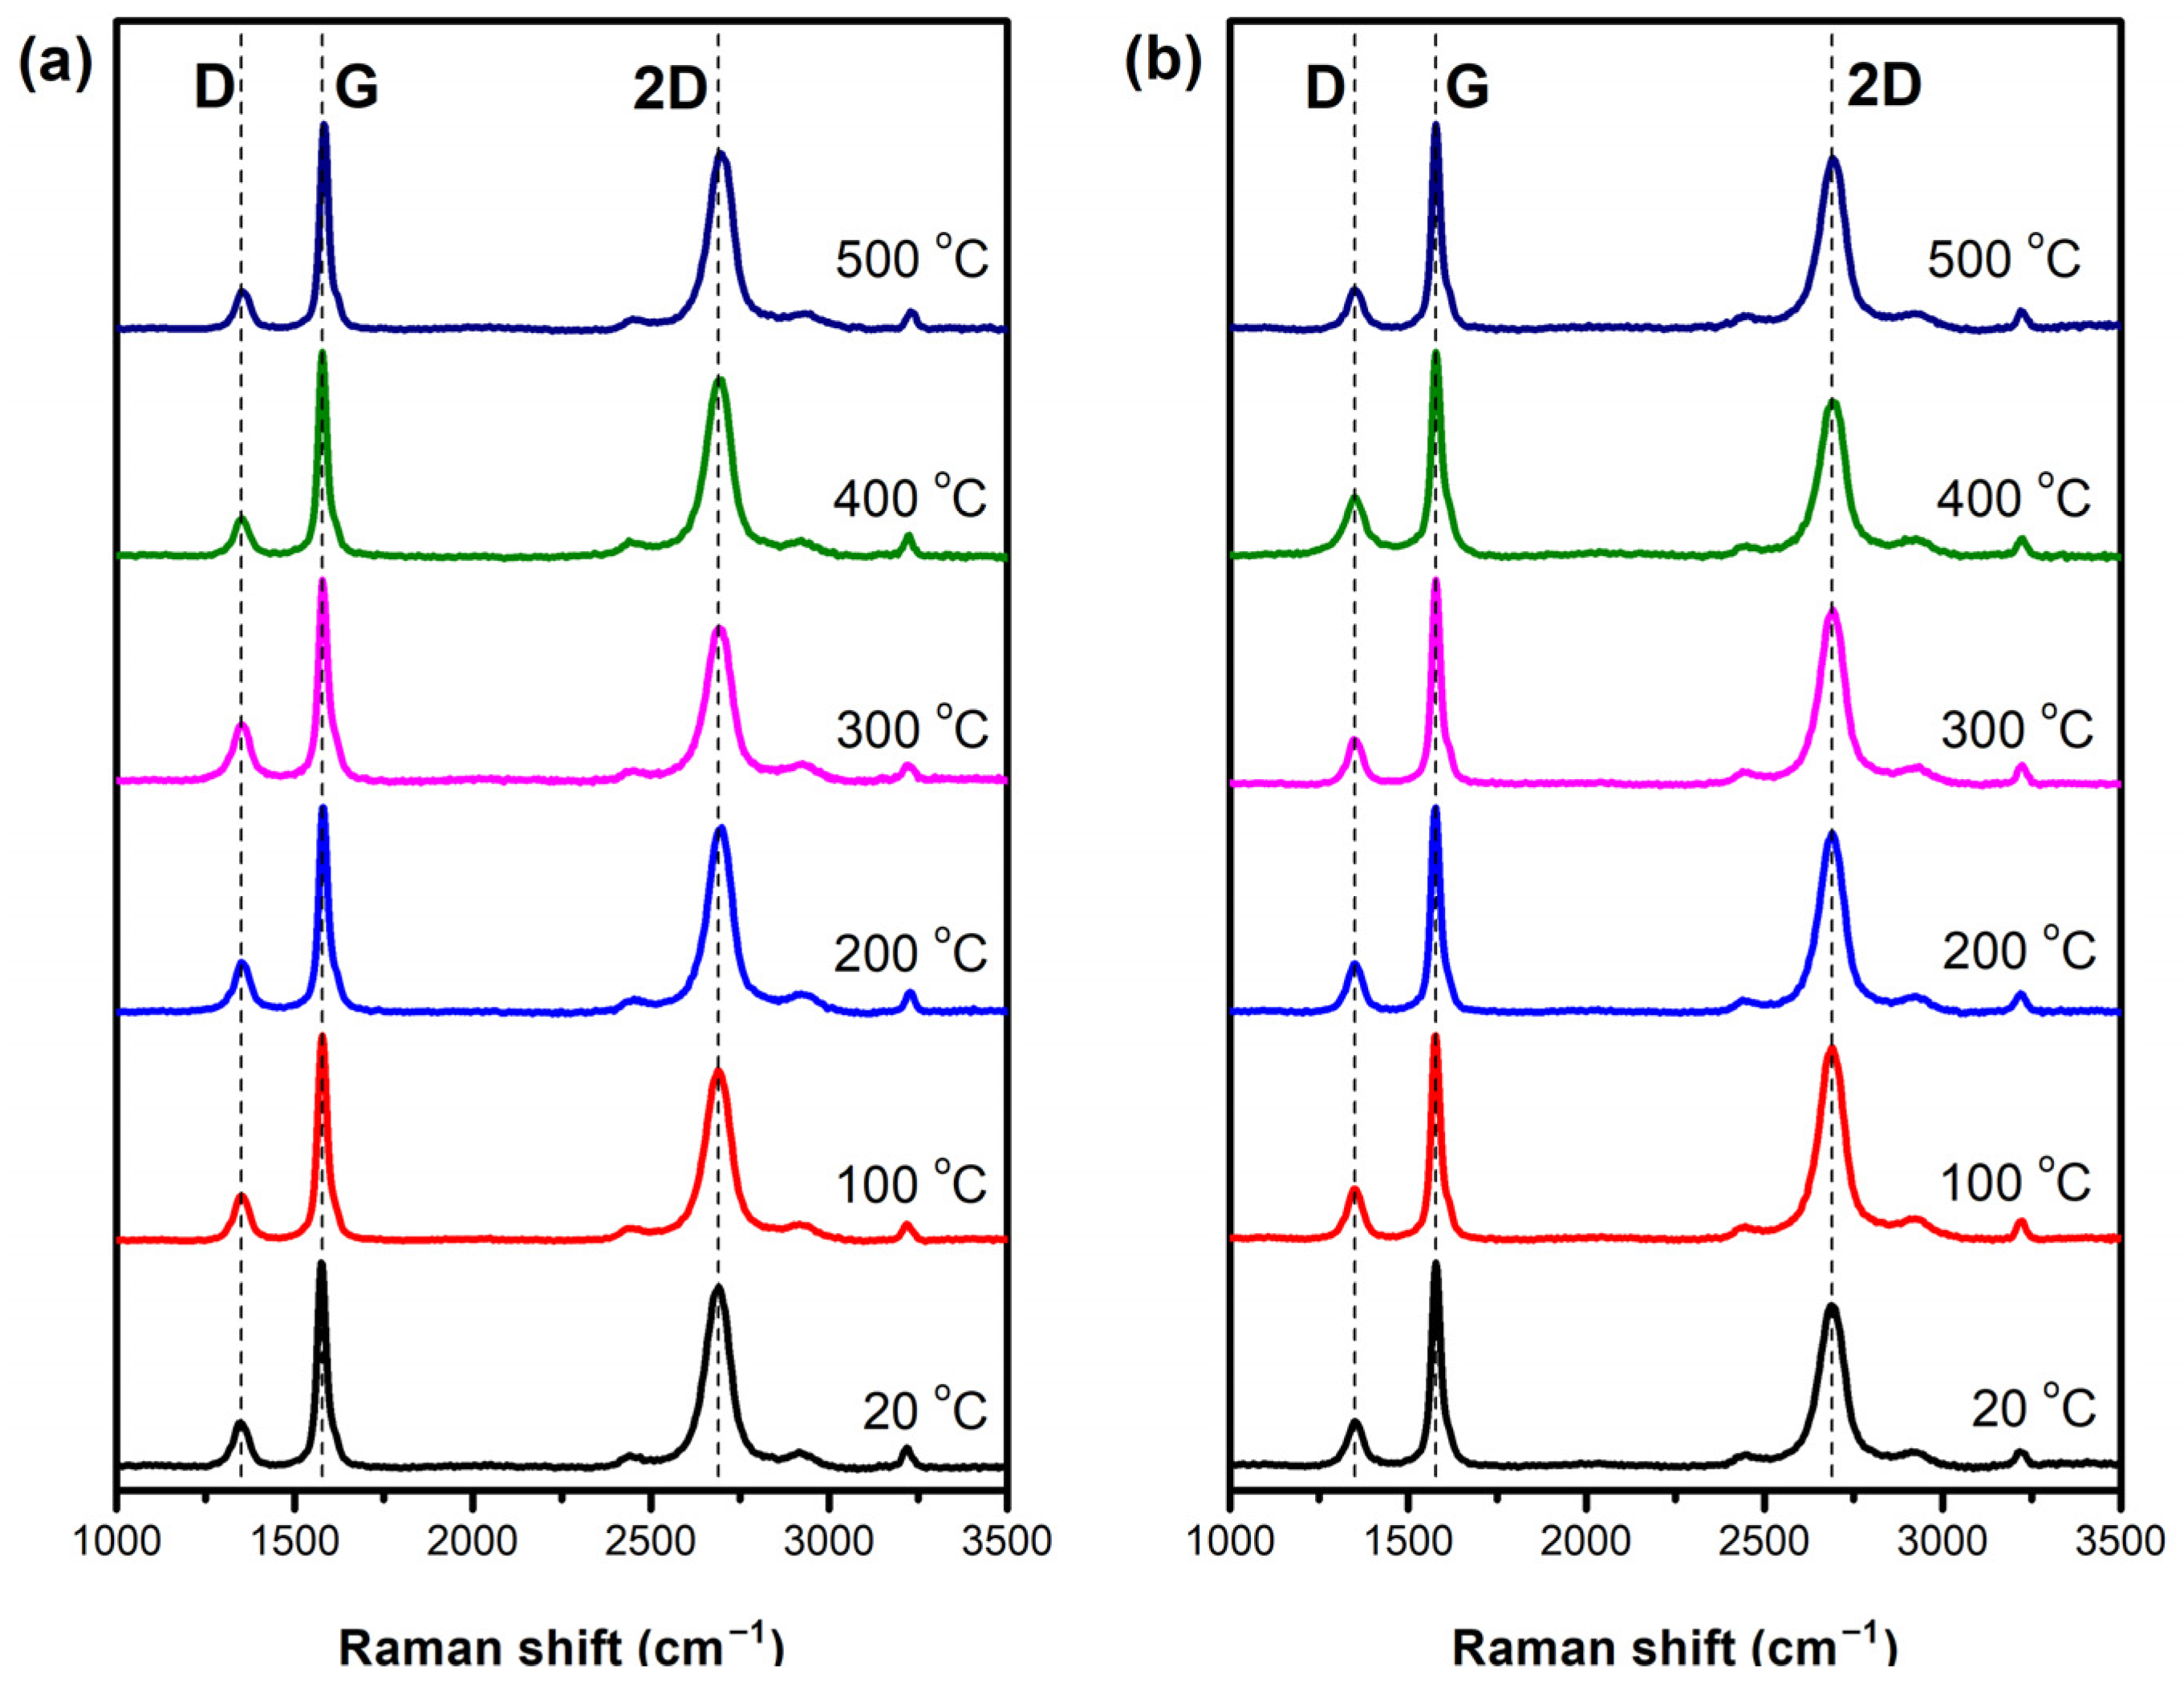
Figure 4 shows the Raman spectra of samples prepared in (a) air and (b) a N2 gas environment at different annealing temperatures. SG function was employed in smoothing the raw Raman spectra (line width was not distorted, see spectra in Figure A1). And then the peak location, intensity, and FWHM of the signature peaks were obtained with the aid of the Lorentz fitting function. The calculated Raman parameters are listed in Table A1 and Table A2 in Appendix A.
Three prominent peaks are observed, as follows: the peak at 1350.00–1347.25 cm−1 represents A1g breathing mode of the sp2 rings and is identified as the disorder peak (D band) [34,49,50,51,52,53,54,55]; the peak at 1578.14–1574.04 cm−1 is the first-order G peak corresponding to the E2g symmetric vibration and stretching mode of the in-plane sp2 C–C bond [34,50,51,52,53,55,56]; and the peak at 2685.29–2695.75 cm−1 is the second-order overtone 2D peak via the inter-valley double resonance process and provides information about the stacking order of graphitic layers along the c axis [34,49,50,52,55,56,57].
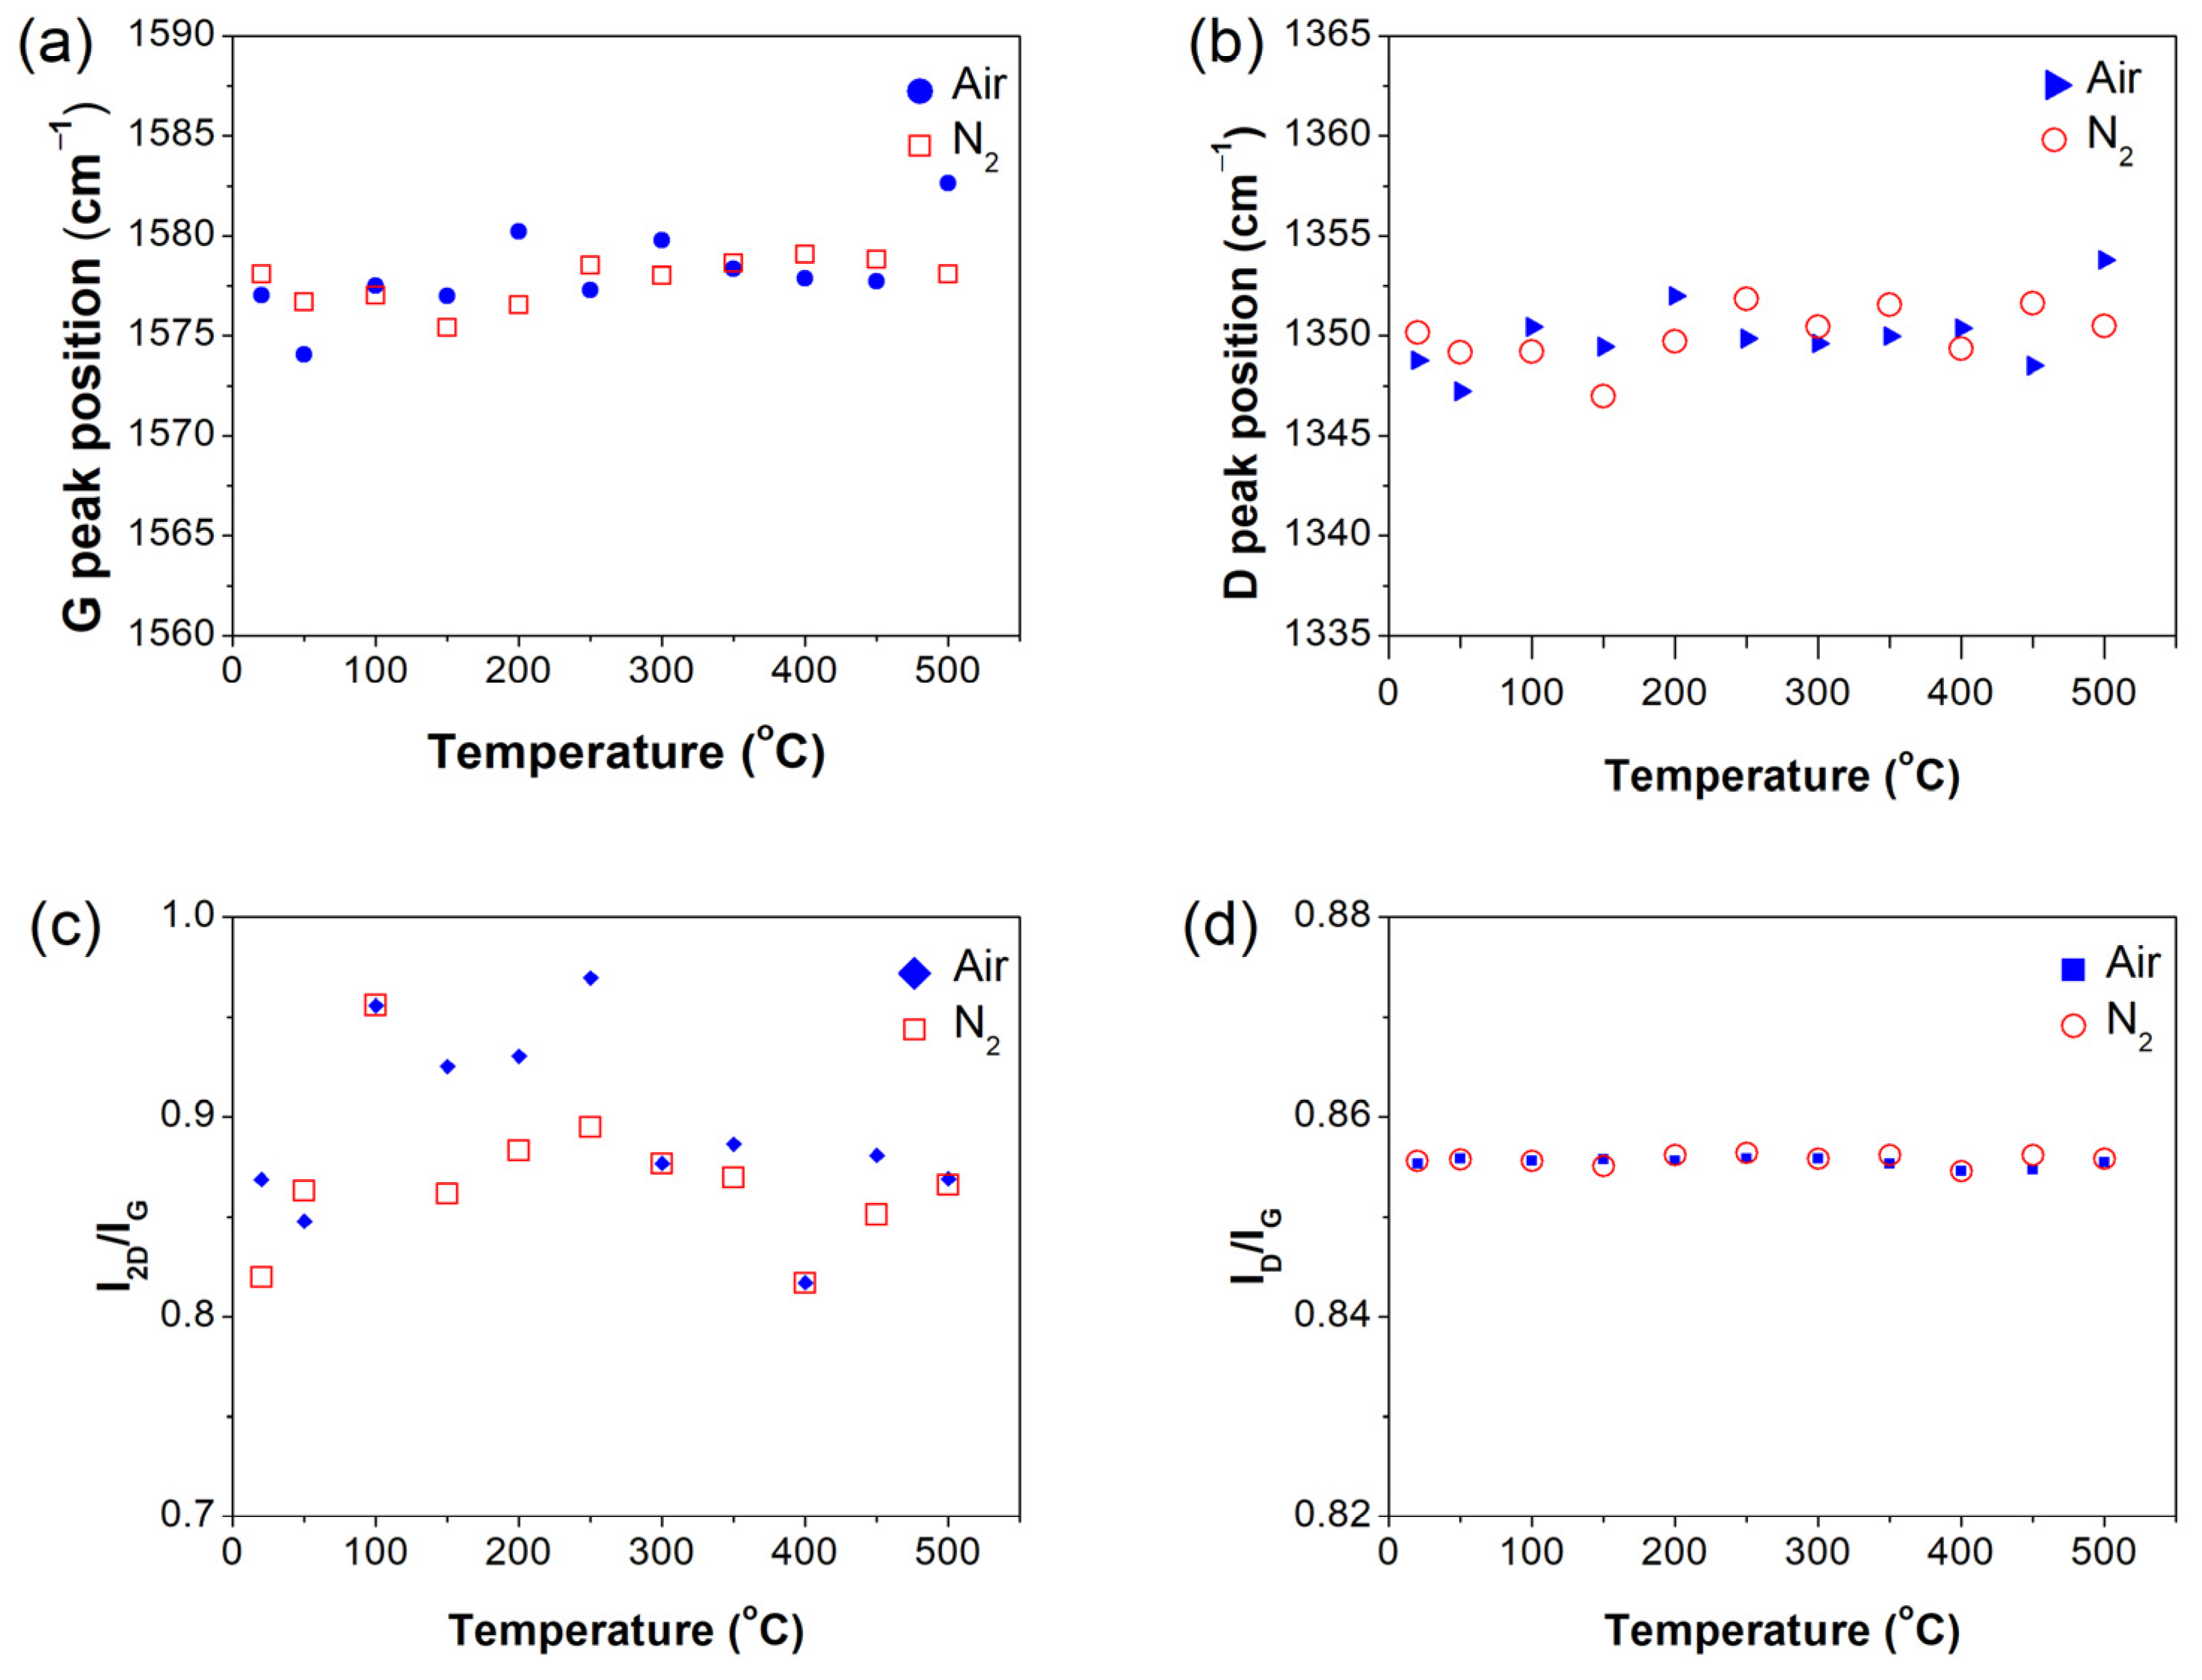
The calculated G-peak location, FWHM of the 2D peak, and intensity ratios I2D/IG and ID/IG for both sets of samples are shown in Figure 5.
There is slight blue-shift in G-peak positions with increasing temperature, which suggests a small deformation of graphene [28]. Based on linear fitting, the peak shift in air is 0.008 cm−1/°C, while in a N2 gas environment, it is −0.004 cm−1/°C. These small values suggest very slight distortion in graphene structure. Graphene structure is more stable in a N2 gas environment than in air, where uncontrolled movements of various kinds of gas molecules take place. The presence of the D peak is an indicator that the samples are not perfect graphite crystals. The intensity of the D peak is strictly related to the number of defects and six-fold carbon rings, which is widely used to assess the disorder [30]. I2D/IG is an indication of the graphene quality or number of layers. I2D/IG ratios of samples prepared in air and in a N2 gas environment were in the range of 0.81 to 0.94 and −0.82 to 0.96, respectively. These values are <1, estimating that the samples contain multilayered graphene [58,59]. Figure 5c shows that this ratio is not constant across the two sets of samples. This suggests that there are different numbers of graphene layers; e.g., samples prepared at 400 °C in both environments have fewer graphene layers than samples prepared at other temperatures. ID/IG, which is often used to correlate the structural purity of graphite, also indicates whether the sample is composed mainly of nanocrystalline graphite or not. Most researchers consider the ratio ID/IG as an indicator of the level of graphitization. As seen in Figure 5d, this ratio is almost constant, which suggests that the graphitization level of all prepared samples is almost the same, which is in good agreement with the XRD results.

3.4. Conductivity

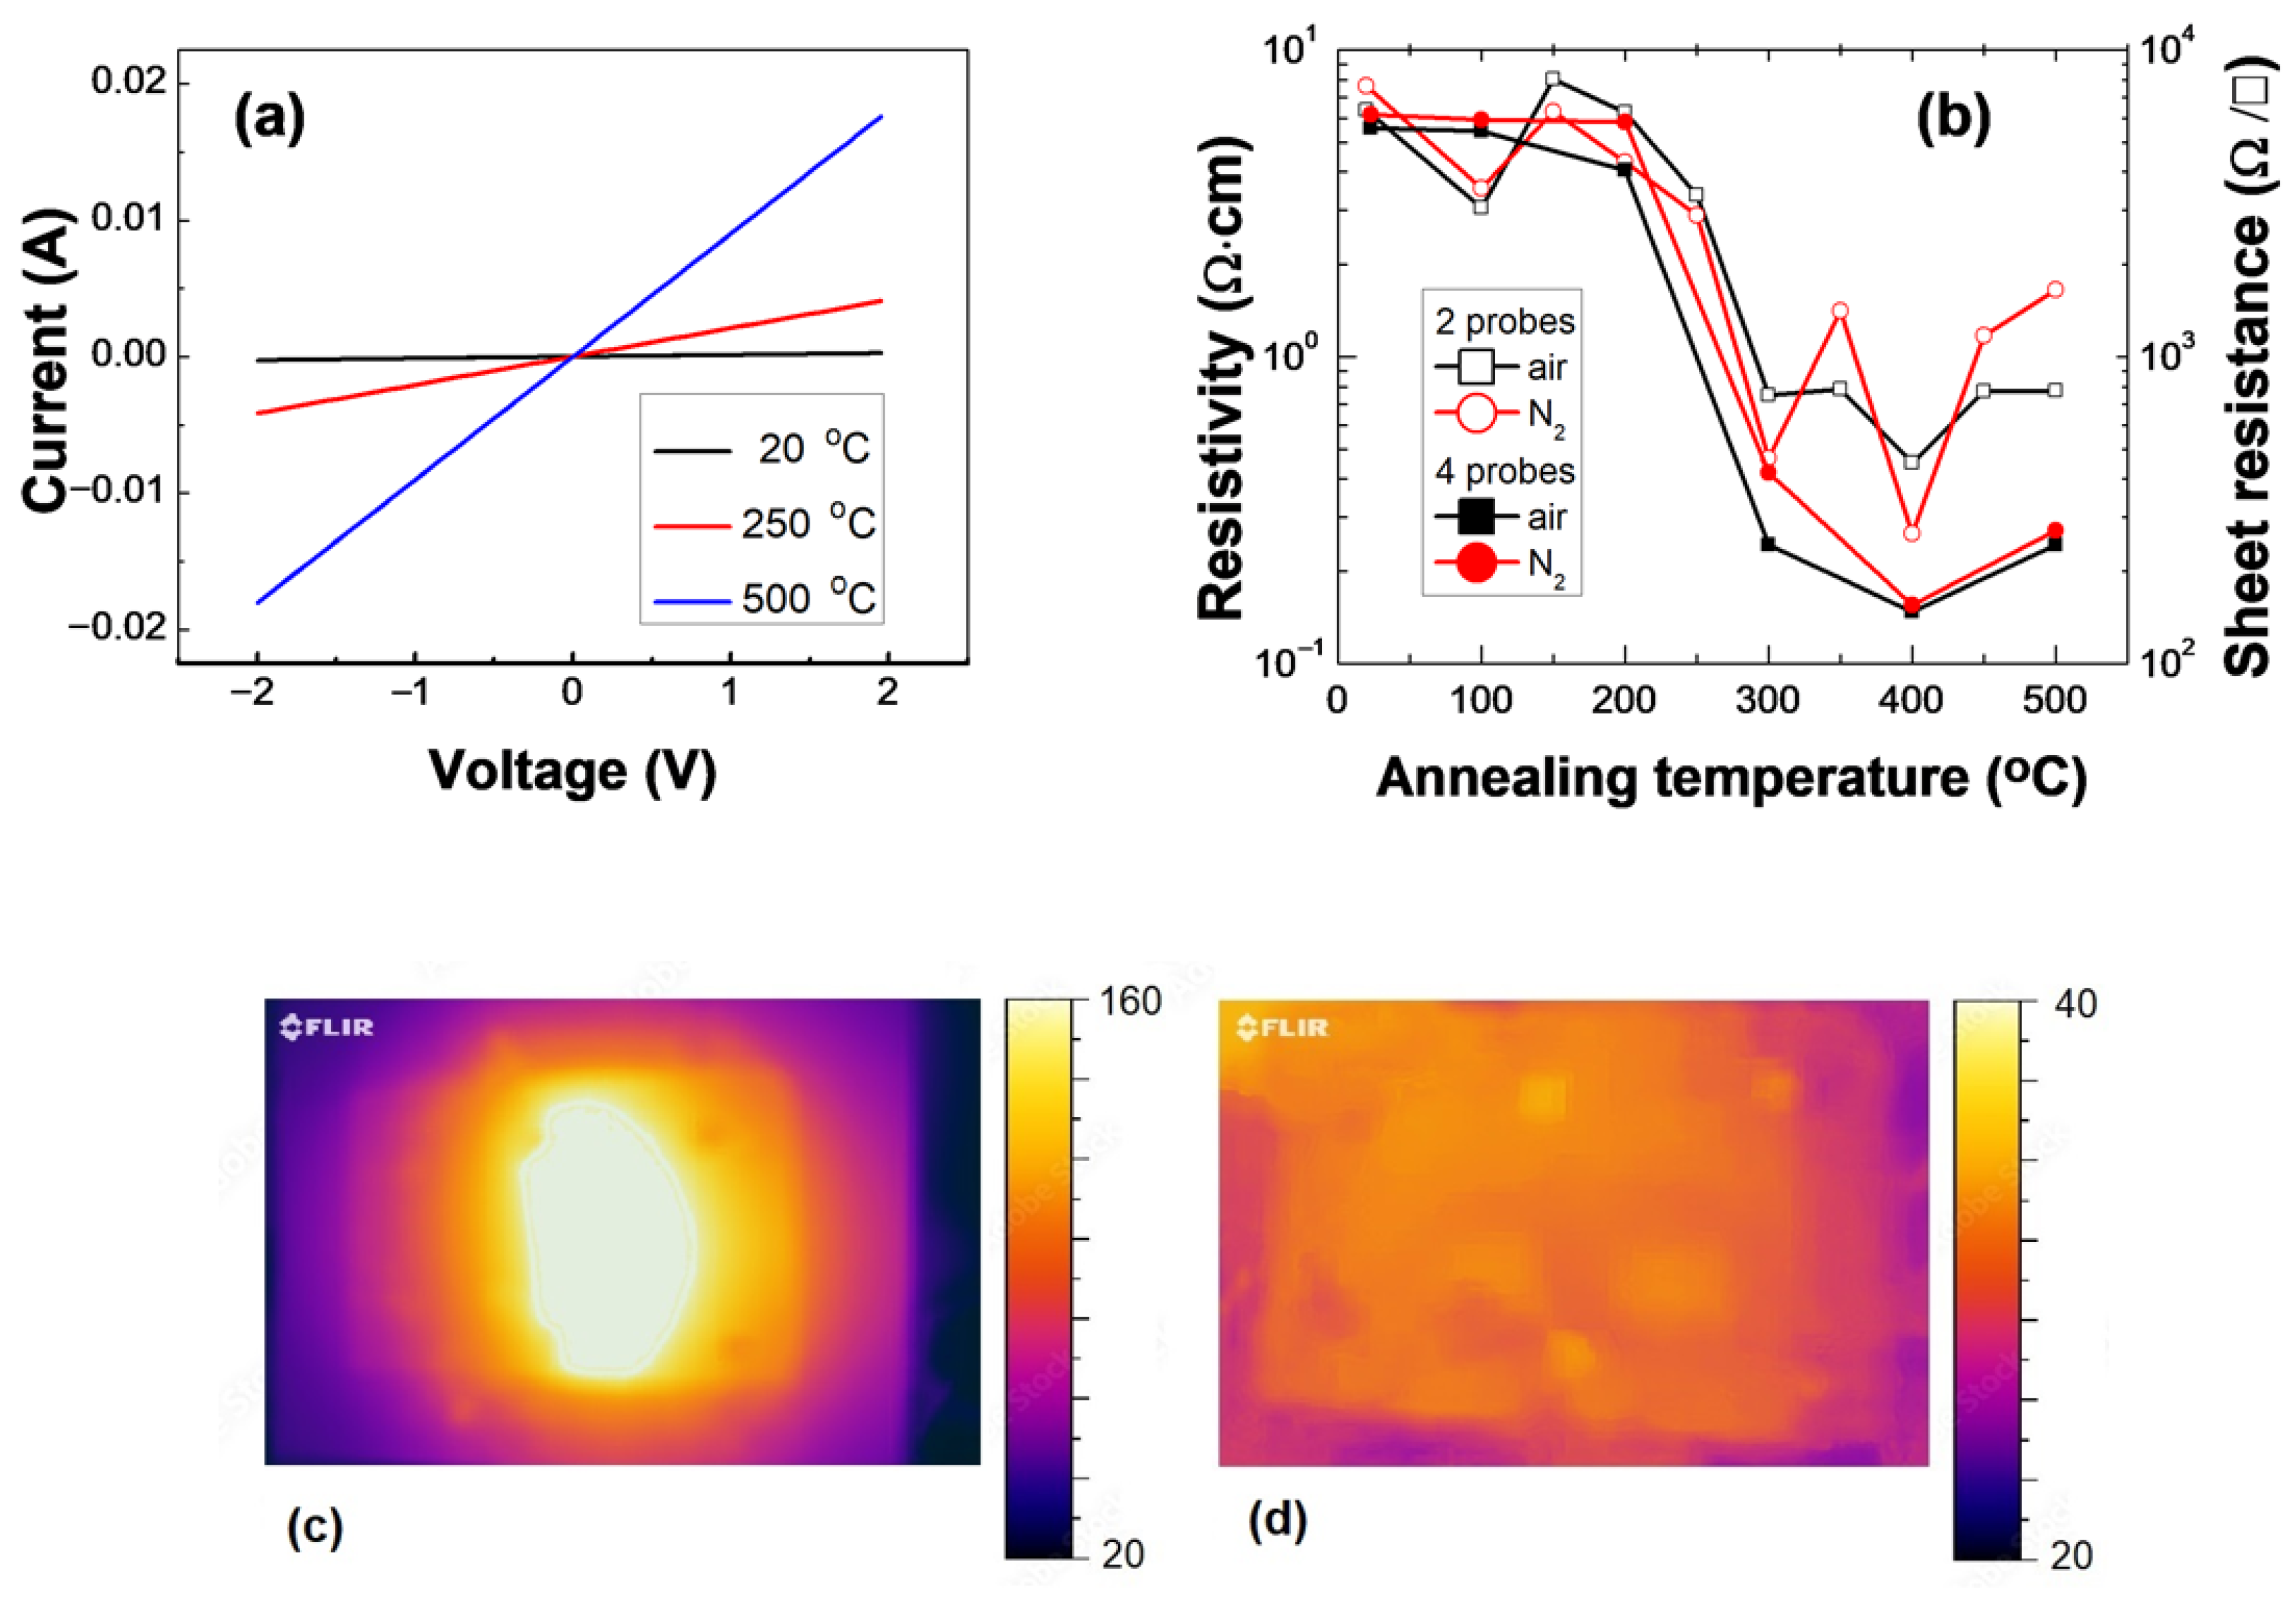
Figure 6 shows (a) the IV curves of samples annealed in air at 20 °C, 250 °C, and 500 °C and (b) the resistivity of both sets of samples vs. the annealing temperature. IV curves are linear, allowing the determination of Ohmic resistance. While the drop in resistivity of both samples at 100 °C may have been caused by unintended thicker deposition of graphite samples, the decrease in both at 300 °C to 500 °C is strikingly evident. This suggests that more impurities in the samples have been removed at higher temperatures, which enables the graphite material to conduct electricity better. Furthermore, this result also suggests that impurities may have settled in the plane of hexagonal graphene layers in the material, partially obstructing the electrical conductivity. The four-probe method provided more precise values of resistivity, especially at the highest annealing temperatures when the contact resistance has an impact. The thermal images of differently annealed samples, when a 5 mA current is applied, are shown in Figure 6c,d. The 400 °C annealed sample has lower resistance; thus, much weaker heating occurs. The contacts appear as hotter points due to their resistance.
Surprisingly, annealing up to 500 °C shows no measurable XRD peak shift, probably because graphite’s lattice structure and interlayer spacing remain unaffected, but it alters the surface chemistry and defect states, which strongly affect electron transport, therefore changing the conductivity [60]. Moreover, annealing could improve the inter-particle contacts, or conductivity could increase due to the removal of adsorbates or amorphous carbon at temperatures higher than room temperature (this could be the cause of increased amounts of holes/morphological pores). XRD is volume-averaged, so low oxidation at the surfaces or edges contributes very weakly to the total signal.

4. Conclusions

Graphite was successfully deposited on glass substrates and annealed at different temperatures. SEM micrographs show that both sets of samples prepared in air and in a N2 gas environment are composed of flake-like structures. Raman and XRD spectra show the signature peaks of the graphite crystal. The results also reveal that increasing the annealing temperature of the samples increases the presence of holes or pores in the structure, suggesting the removal of some impurities, as indicated in Raman spectra. While the degree of crystallization remains almost the same in the range of annealing temperatures from 100 °C to 500 °C, the resistivity decreases more than one order of magnitude. This elucidates the effect of the annealing temperature on the electrical conductivity in sprayed graphite coatings. Therefore, this research contributes to the improvement of the properties of graphite layers in the lower temperature regime to make them suitable for the coating industries.

Author Contributions

Y.-d.J.: Sample preparation, Formal analysis, Investigation, Methodology, Writing—original draft. A.M.M.—Sample preparation, Formal analysis, Investigation, Methodology, review and editing. S.S., V.Š., G.K. and A.M.: investigation, data curation. P.Š.: Conceptualization, Formal analysis, Funding acquisition, Investigation, Methodology, Supervision, Review and editing. All authors have read and agreed to the published version of the manuscript.

Funding

This research was funded by the Research Council of Lithuania, Project No. S-MIP-24-81.

Data Availability Statement

The original contributions presented in this study are included in the article. Further inquiries can be directed to the corresponding authors.

Conflicts of Interest

The authors declare no conflicts of interest.

Abbreviations

The following abbreviations are used in this manuscript:
SGSavitzky–Golay
FWHMFull Width at Half Maximum

Appendix A

Table A1 and Table A2 present the calculated Raman parameters for samples prepared in air and in a N2 gas environment, respectively.
Table A1. Calculated Raman parameters for samples prepared in air.
Peak Location (cm−1)FWHM (cm−1)Intensity Ratio
Temp.DG2DDGID/IGI2D/IG
201348.091575.702686.8351.3630.200.8560.909
1001350.431577.512687.8446.2230.460.8560.835
2001352.021580.202693.0155.2631.600.8560.935
3001349.611579.792690.4173.7035.240.8540.813
4001350.391577.902689.6854.5029.330.8560.896
5001353.7241582.672696.1047.4827.970.8550.870
Table A2. Calculated Raman parameters for samples prepared in a N2 gas environment.
Peak Location (cm−1)FWHM (cm−1)Intensity Ratio
Temp.DG2DDGID/IGI2D/IG
201350.151578.112688.11957.7931.710.8560.820
1001349.221577.032687.8351.4330.790.8560.956
2001349.721576.572687.6549.2630.440.8560.883
3001350.451578.032689.3848.8729.590.8560.876
4001349.351579.092690.0279.3036.750.8540.817
5001350.471578.102690.3249.5529.820.8560.866
Table A3 presents additional calculated XRD parameters for samples prepared in air and in a N2 gas environment, respectively.
Table A3. Additional XRD parameters.
EnvironmentAirN2 Gas
Temp.
(°C)
2θ (deg) Average Layer per Domain 2θ (deg) Average Layer per Domain
(002)(110)Da/DcInterplanar d(002) (Å)Packing Density(002)(110)Da/DcInterplanar d(002) (Å)Packing Density
2026.3677.682.5341.633.382.2626.3677.643.8242.163.382.26
10026.3677.692.3742.503.382.2626.3677.662.3841.643.382.26
20026.3777.692.6341.683.382.2626.3677.692.0542.753.382.26
30026.3677.672.2142.173.382.2626.3677.652.5441.863.382.26
40026.3677.682.4641.643.382.2626.3677.682.4741.583.382.26
50026.3777.662.2743.063.382.2626.3677.682.5541.133.382.26

Appendix B

XRD pattern of reference silicon powder.
Phase NameFormulaFigure of MeritPhase Reg. DetailDB Card Number
Silicon, synSi0.130ICDD (PDF – 4 + 2023)00-005-0565
Applsci 15 11727 i001
Phase Namea (A)b (A)c (A)Alpha (deg)Beta (deg)Gamma (deg)V (A^3)
Silicon, syn5.4316685.4316685.43166890.00000090.00000090.000000160.250575

Appendix C

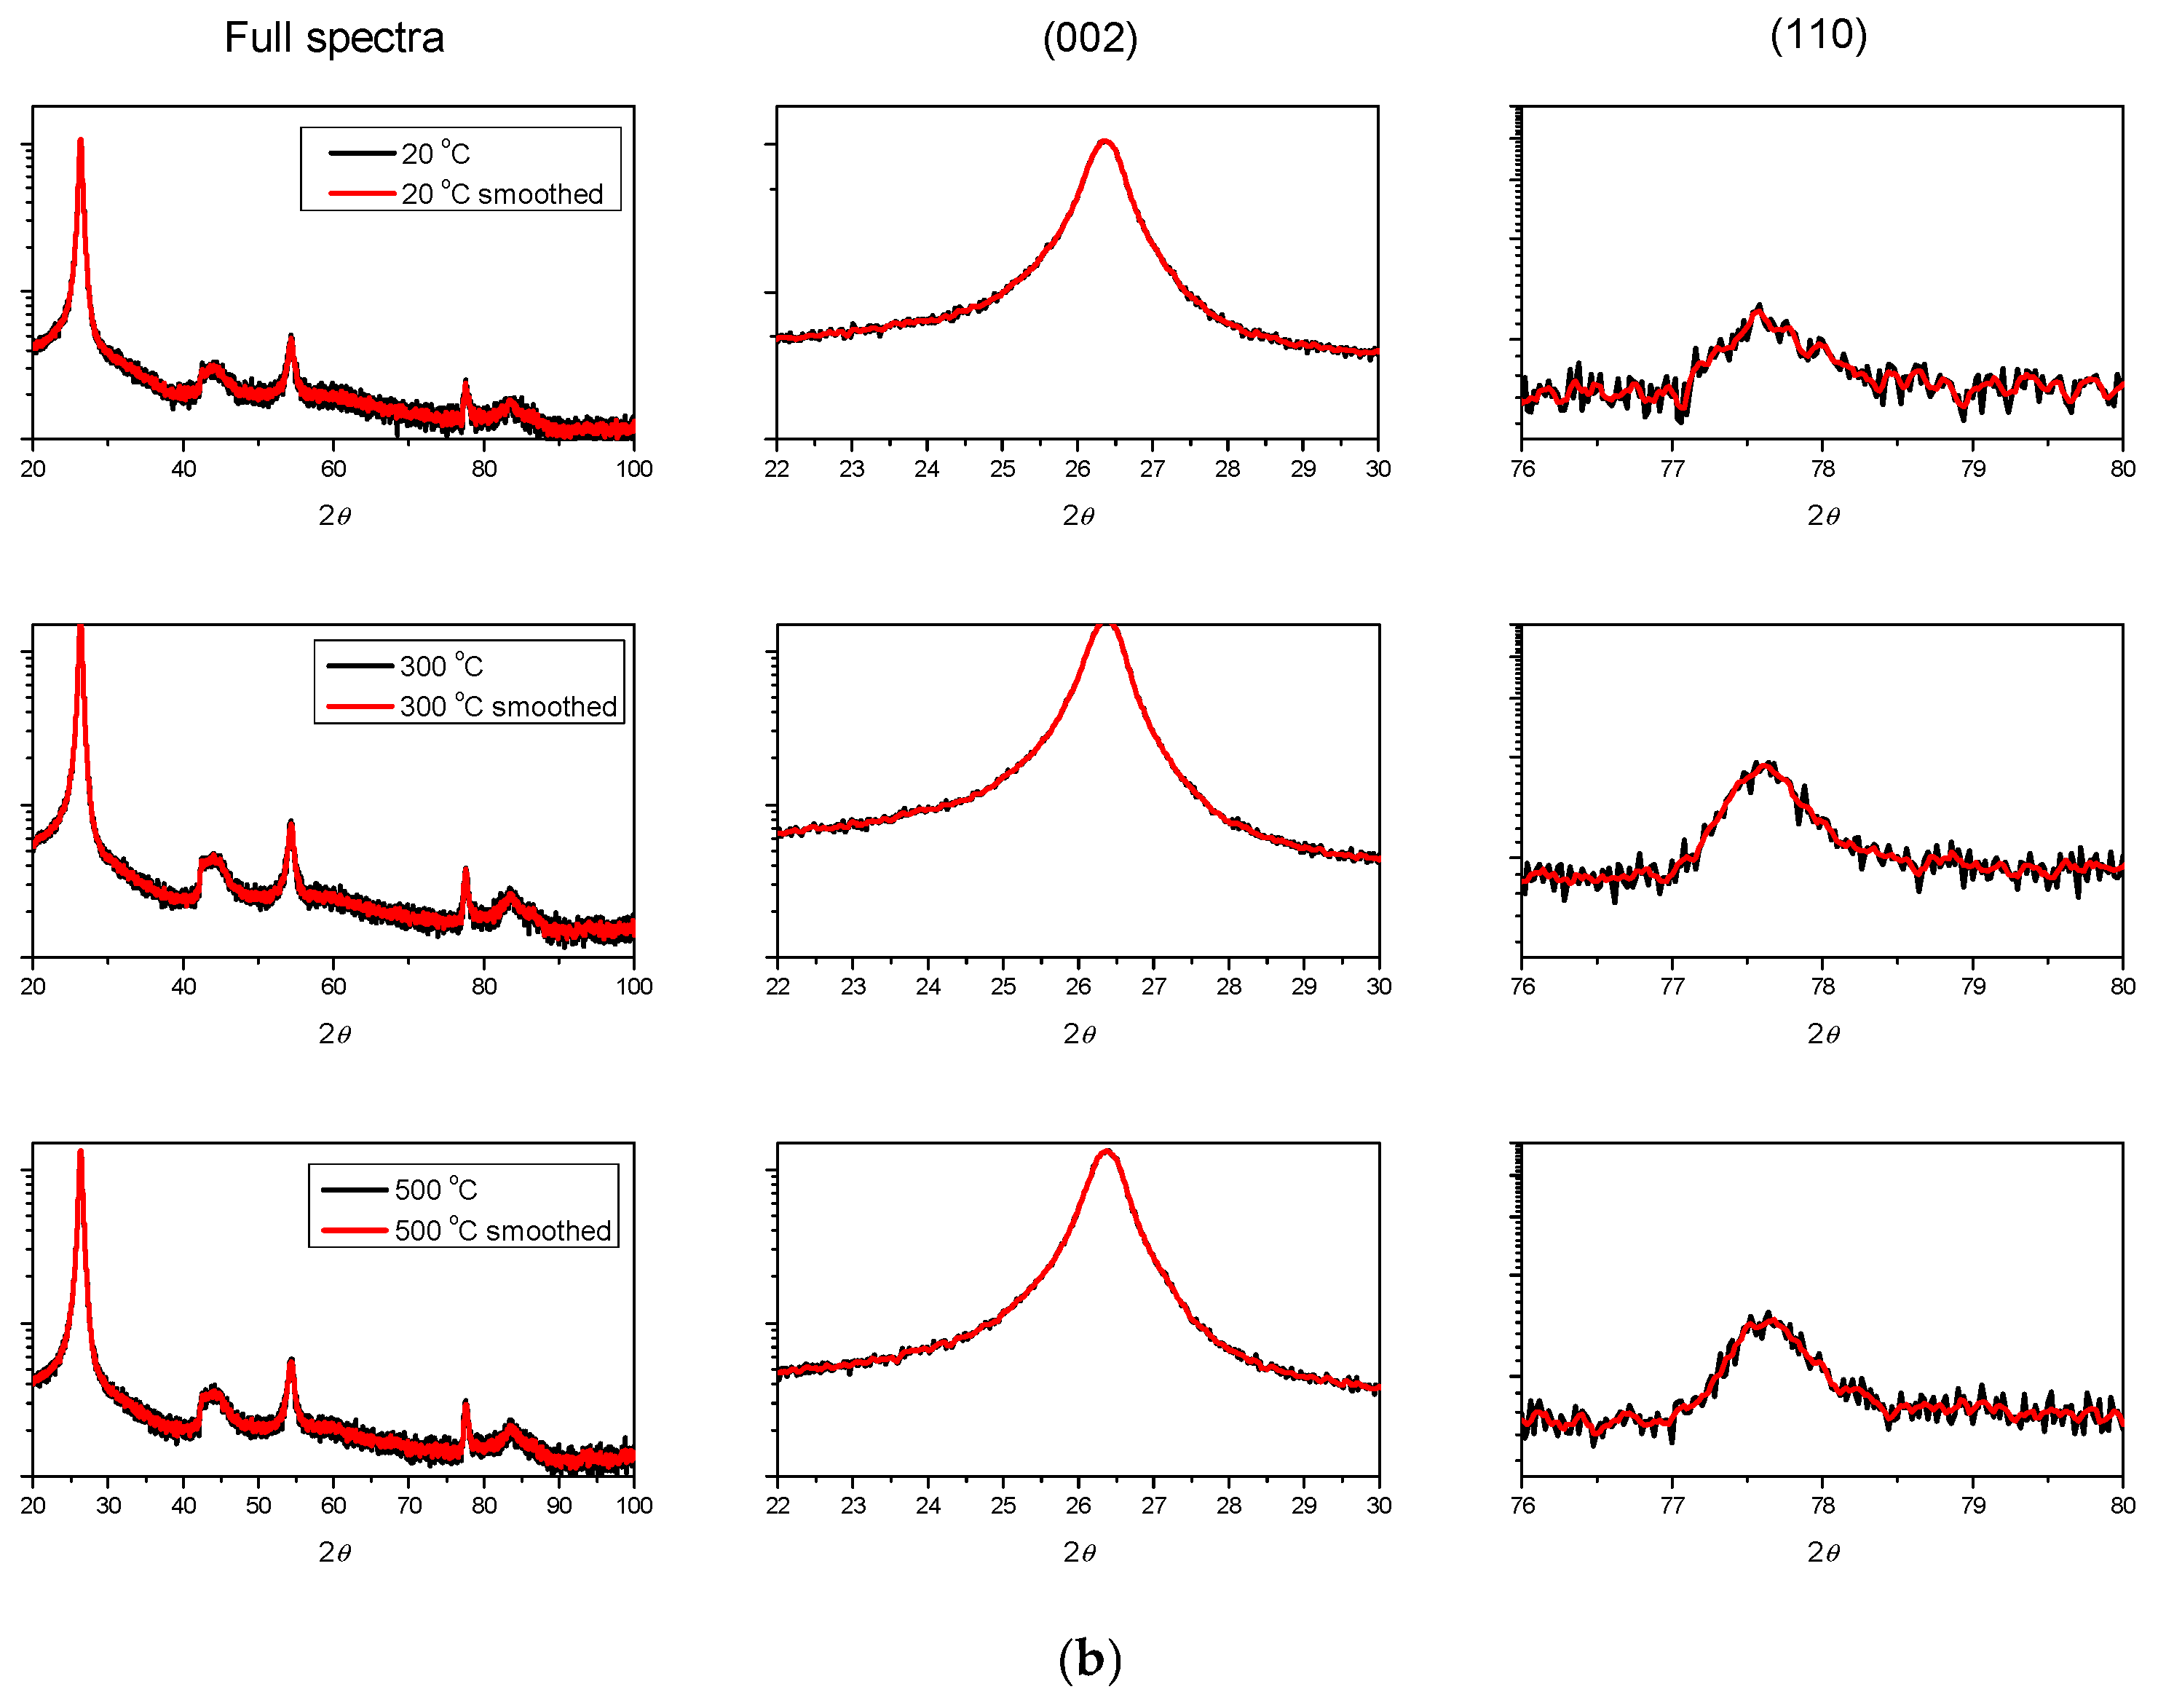
Figure A1. Effects of smoothing on XRD patterns of samples with air (a) and nitrogen (b) annealing.
Applsci 15 11727 g0a1aApplsci 15 11727 g0a1b

References

  1. Kumar, A.; Gupta, R.K. 2D Semiconducting Materials for Electronic, Photonic, and Optoelectronic Devices, 1st ed.; CRC Press: Boca Raton, FL, USA, 2024. [Google Scholar] [CrossRef]
  2. Wei, J.; Sun, L.; Han, J.; Huang, W. MWCNTs/CB Waterborne Conductive Smart Coating for Damage Monitoring of Composites: Design, Fabrication, Characterization, and Verification. Prog. Org. Coat. 2022, 172, 107136. [Google Scholar] [CrossRef]
  3. Orts Mercadillo, V.; Chan, K.C.; Caironi, M.; Athanassiou, A.; Kinloch, I.A.; Bissett, M.; Cataldi, P. Electrically Conductive 2D Material Coatings for Flexible and Stretchable Electronics: A Comparative Review of Graphenes and MXenes. Adv. Funct. Mater. 2022, 32, 2204772. [Google Scholar] [CrossRef]
  4. Liu, M.-Y.; Hang, C.-Z.; Zhao, X.-F.; Zhu, L.-Y.; Ma, R.-G.; Wang, J.-C.; Lu, H.-L.; Zhang, D.W. Advance on Flexible Pressure Sensors Based on Metal and Carbonaceous Nanomaterial. Nano Energy 2021, 87, 106181. [Google Scholar] [CrossRef]
  5. Shaker, L.M.; Abdulamie, A.A.; Al-Amiery, A.A. Graphene-Enabled Advancements in Solar Cell Technology. J. Alloys Compd. 2025, 1020, 179583. [Google Scholar] [CrossRef]
  6. Majeed, A.M.; Vaitkevičius, A.; Stanionytė, S.; Miasojedovas, S.; Kreiza, G.; Ščajev, P. Highly Stable Solution-Processed CsZnPbI3 Perovskite Distributed Feedback Lasers. Adv. Opt. Mater. 2025, e01896. [Google Scholar] [CrossRef]
  7. Chandrasekhar, P. Conducting Polymers, Fundamentals and Applications: Including Carbon Nanotubes and Graphene; Springer International Publishing: Cham, Switzerland, 2018. [Google Scholar] [CrossRef]
  8. Guo, Y.; Zhong, M.; Fang, Z.; Wan, P.; Yu, G. A Wearable Transient Pressure Sensor Made with MXene Nanosheets for Sensitive Broad-Range Human–Machine Interfacing. Nano Lett. 2019, 19, 1143–1150. [Google Scholar] [CrossRef]
  9. Burchell, T.; Pavlov, T. Graphite: Properties and Characteristics. In Comprehensive Nuclear Materials; Elsevier: Amsterdam, The Netherlands, 2020; Volume 7, pp. 355–381. [Google Scholar]
  10. Malhotra, B.D. Graphene Based Biomolecular Electronic Devices; Micro and Nano Technologies Series; Elsevier: San Diego, CA, USA, 2023. [Google Scholar]
  11. Kumar, N.; Salehiyan, R.; Chauke, V.; Joseph Botlhoko, O.; Setshedi, K.; Scriba, M.; Masukume, M.; Sinha Ray, S. Top-down Synthesis of Graphene: A Comprehensive Review. FlatChem 2021, 27, 100224. [Google Scholar] [CrossRef]
  12. Yao, J.; Kim, C.; Nian, Q.; Kang, W. Copper-Graphene Composite (CGC) Conductors: Synthesis, Microstructure, and Electrical Performance. Small 2024, 20, e2403241. [Google Scholar] [CrossRef]
  13. Mbayachi, V.B.; Ndayiragije, E.; Sammani, T.; Taj, S.; Mbuta, E.R.; Khan, A.U. Graphene Synthesis, Characterization and Its Applications: A Review. Results Chem. 2021, 3, 100163. [Google Scholar] [CrossRef]
  14. Chung, D.D.L. A Perspective on Electromagnetic Interference Shielding Materials Comprising Exfoliated Graphite. Carbon 2024, 216, 118569. [Google Scholar] [CrossRef]
  15. Zhao, J.; Chen, Y.; Chen, M. Battery Thermal Management with a Modified Metal Alloy/Expanded Graphite/Paraffin Composite Phase Change Material. J. Energy Storage 2025, 113, 115652. [Google Scholar] [CrossRef]
  16. Zhao, H.; Zuo, H.; Wang, J.; Jiao, S. Practical Application of Graphite in Lithium-Ion Batteries: Modification, Composite, and Sustainable Recycling. J. Energy Storage 2024, 98, 113125. [Google Scholar] [CrossRef]
  17. Leng, Z.; Li, T.; Wang, X.; Zhang, S.; Zhou, J. Effect of Graphite Content on the Conductivity, Wear Behavior, and Corrosion Resistance of the Organic Layer on Magnesium Alloy MAO Coatings. Coatings 2022, 12, 434. [Google Scholar] [CrossRef]
  18. Abe, A.; Goss, J.A.; Zou, M. Exploring the Impact of Spray Process Parameters on Graphite Coatings: Morphology, Thickness, and Tribological Properties. Coatings 2024, 14, 714. [Google Scholar] [CrossRef]
  19. Żórawski, W.; Góral, A.; Makrenek, M.; Soboń, D.; Trelka, A.; Bara, M. Optimization of Mechanical Properties of Cr3C2-Ni20Cr/Graphite Cold Sprayed Coatings. Materials 2021, 14, 3458. [Google Scholar] [CrossRef]
  20. Zhou, L.; Zheng, Z.; Wang, Q.; Wu, F.; Hong, J.; Xie, S.; Ni, H.; Feng, Q.; Zhou, M.; Li, M.; et al. A Study on the Effect of Nickel-Plated Graphite Content on the Microstructure and Properties of AlZn/Nickel-Plated Graphite Composite Cold Spray Coatings. Materials 2025, 18, 388. [Google Scholar] [CrossRef]
  21. Di Bartolomeo, A.; Iemmo, L.; Urban, F.; Palomba, M.; Carotenuto, G.; Longo, A.; Sorrentino, A.; Giubileo, F.; Barucca, G.; Rovere, M.; et al. Graphite Platelet Films Deposited by Spray Technique on Low Density Polyethylene Substrates. Mater. Today Proc. 2020, 20, 87–90. [Google Scholar] [CrossRef]
  22. Crespi, A.E.; Nordet, G.; Peyre, P.; Ballage, C.; Hugon, M.-C.; Chapon, P.; Minea, T. The Use of Sacrificial Graphite-like Coating to Improve Fusion Efficiency of Copper in Selective Laser Melting. Materials 2023, 16, 2460. [Google Scholar] [CrossRef]
  23. Wu, G.-Y.; Lin, C.-H.; Zhan, K.-Y.; Tseng, C.-J. The Corrosion Characteristics of Graphite Coatings on Nickel Foam and Their Applications in High-Temperature Proton Exchange Membrane Fuel Cells. Int. J. Hydrog. Energy 2025, 137, 1000–1008. [Google Scholar] [CrossRef]
  24. Proskuryakov, V.; Rodionov, I.; Borodina, S. The Effect of Graphite Coating on the Composition, Structure and Microhardness of the Surface of Structural Chromiumnickel Steel during Laser Pulse Processing. J. Phys. Conf. Ser. 2020, 1695, 012069. [Google Scholar] [CrossRef]
  25. Abe, A.; Zou, M. Enhanced Scratch Resistance of Graphite Coating Using a Polydopamine Adhesive Underlayer. Coatings 2025, 15, 690. [Google Scholar] [CrossRef]
  26. Ersu, G.; Kuriakose, S.; Goldie, S.J.; Al-Enizi, A.M.; Nafady, A.; Munuera, C.; Backes, C.; Island, J.O.; Castellanos-Gomez, A. Improving the Conductivity of Graphite-Based Films by Rapid Laser Annealing. Nanoscale Adv. 2022, 4, 4724–4729. [Google Scholar] [CrossRef] [PubMed]
  27. Santhiago, M.; Strauss, M.; Pereira, M.P.; Chagas, A.S.; Bufon, C.C.B. Direct Drawing Method of Graphite onto Paper for High-Performance Flexible Electrochemical Sensors. ACS Appl. Mater. Interfaces 2017, 9, 11959–11966. [Google Scholar] [CrossRef] [PubMed]
  28. Levchenko, I.; Baranov, O.; Riccardi, C.; Roman, H.E.; Cvelbar, U.; Ivanova, E.P.; Mohandas, M.; Ščajev, P.; Malinauskas, T.; Xu, S.; et al. Nanoengineered Carbon-Based Interfaces for Advanced Energy and Photonics Applications: A Recent Progress and Innovations. Adv. Mater. Inter. 2023, 10, 2201739. [Google Scholar] [CrossRef]
  29. Ščajev, P.; Malinauskas, T.; Seniutinas, G.; Arnold, M.D.; Gentle, A.; Aharonovich, I.; Gervinskas, G.; Michaux, P.; Hartley, J.S.; Mayes, E.L.H.; et al. Light-Induced Reflectivity Transients in Black-Si Nanoneedles. Sol. Energy Mater. Sol. Cells 2016, 144, 221–227. [Google Scholar] [CrossRef]
  30. Rong, K.; Li, H.; Wang, X.; You, C.; Liu, H.; Ma, X.; Bai, L.; Hou, C.; Li, Z.; Zhou, Q.; et al. Constructing Robust Conductive Graphite with Local Sp3 Hybridization by High Pressure and High Temperature. J. Solid State Chem. 2025, 350, 125490. [Google Scholar] [CrossRef]
  31. Cao, K.-Z.; Ma, J.-H.; Dong, Y.-L.; Duan, Y.; Zheng, R.-T.; Bundhooa, D.; Liu, H.-Q.; Lei, Y. Graphitic Carbons: Preparation, Characterization, and Application on K-Ion Batteries. Rare Met. 2024, 43, 4056–4075. [Google Scholar] [CrossRef]
  32. Baca Arroyo, R. Graphite Intended for Green Engineering Developed by Noncontaminant Reverse Abrasion. Adv. Mater. Sci. Eng. 2016, 2016, 7016457. [Google Scholar] [CrossRef]
  33. Nguyen, A.T.; Lee, Y.; Nguyen, P.Q.H.; Dera, P.; Yoon, S.-H.; Lee, W. Enhancing the Electrical Properties of Graphite Nanoflake through Gamma-Ray Irradiation. Sci. Rep. 2022, 12, 14824. [Google Scholar] [CrossRef]
  34. Ščajev, P.; Miasojedovas, S.; Mekys, A.; Kreiza, G.; Čeponkus, J.; Šablinskas, V.; Malinauskas, T.; Medvids, A. Oxidized Graphite Nanocrystals for White Light Emission. Crystals 2024, 14, 505. [Google Scholar] [CrossRef]
  35. Ščajev, P.; Durena, R.; Onufrijevs, P.; Miasojedovas, S.; Malinauskas, T.; Stanionyte, S.; Zarkov, A.; Zukuls, A.; Bite, I.; Smits, K. Morphological and Optical Property Study of Li Doped ZnO Produced by Microwave-Assisted Solvothermal Synthesis. Mater. Sci. Semicond. Process. 2021, 135, 106069. [Google Scholar] [CrossRef]
  36. Grivickas, V.; Ščajev, P.; Miasojedovas, S.; Voss, L.; Grivickas, P. Self-Trapped-Exciton Radiative Recombination in β–Ga2O3: Impact of Two Concurrent Nonradiative Auger Processes. ACS Appl. Electron. Mater. 2025, 7, 1829–1841. [Google Scholar] [CrossRef] [PubMed]
  37. Abraham, E.; Halley, J.M. Some Calculations of Temperature Profiles in Thin Films with Laser Heating. Appl. Phys. A 1987, 42, 279–285. [Google Scholar] [CrossRef]
  38. Smausz, T.; Kondász, B.; Gera, T.; Ajtai, T.; Utry, N.; Pintér, M.; Kiss-Albert, G.; Budai, J.; Bozóki, Z.; Szabó, G.; et al. Determination of UV–Visible–NIR Absorption Coefficient of Graphite Bulk Using Direct and Indirect Methods. Appl. Phys. A 2017, 123, 633. [Google Scholar] [CrossRef]
  39. Das, A.; Brown, A.K.; Mah, M.L.; Talghader, J.J. Photon Diffusion in Microscale Solids. J. Phys. Condens. Matter 2019, 31, 335703. [Google Scholar] [CrossRef]
  40. Liu, H.-N.; Cong, X.; Lin, M.-L.; Tan, P.-H. The Intrinsic Temperature-Dependent Raman Spectra of Graphite in the Temperature Range from 4K to 1000K. Carbon 2019, 152, 451–458. [Google Scholar] [CrossRef]
  41. Wang, C.; Su, Y.; Ouyang, Q.; Zhang, D. Effects of Graphite Flake Size on the Properties of Aligned Graphene Nanoplatelets Covered Graphite Flakes/Aluminum Composites. Diam. Relat. Mater. 2021, 116, 108381. [Google Scholar] [CrossRef]
  42. Li, Y.; Bi, Y.; Liu, X.; Dong, L.; Cai, W.; Lv, J.; Huang, L.; Duan, H.; Jia, Q.; Aygul Yeprem, H.; et al. Preparation and Properties of Alumina-Carbon Castables Using SiC Nanofiber Coated Graphite Flake. Appl. Surf. Sci. 2023, 615, 156275. [Google Scholar] [CrossRef]
  43. Hussain, S.A.; Ali, S.; Islam, Z.U.; Khan, M. Low-Temperature Synthesis of Graphite Flakes and Carbon-Based Nanomaterials from Banana Peels Using Hydrothermal Process for Photoelectrochemical Water-Splitting. Phys. E Low-Dimens. Syst. Nanostructures 2022, 141, 115231. [Google Scholar] [CrossRef]
  44. Kahraman, O.; Cevik, P.K.; Turunc, E.; Çelik, A.; Koyuncu, İ.; Binzet, R. Eco-Friendly Synthesis and Biomedical Assessment of Graphene Nanomaterials Using a Holoparasitic Plant Template. Diam. Relat. Mater. 2025, 157, 112551. [Google Scholar] [CrossRef]
  45. Silva Filho, J.C.; Venancio, E.C.; Silva, S.C.; Takiishi, H.; Martinez, L.G.; Antunes, R.A. A Thermal Method for Obtention of 2 to 3 Reduced Graphene Oxide Layers from Graphene Oxide. SN Appl. Sci. 2020, 2, 1450. [Google Scholar] [CrossRef]
  46. Milev, A.; Wilson, M.; Kannangara, G.S.; Tran, N. X-Ray Diffraction Line Profile Analysis of Nanocrystalline Graphite. Mater. Chem. Phys. 2008, 111, 346–350. [Google Scholar] [CrossRef]
  47. Zielinski, P.; Kühne, M.; Kärcher, D.; Paolucci, F.; Wochner, P.; Fecher, S.; Drnec, J.; Felici, R.; Smet, J.H. Probing Exfoliated Graphene Layers and Their Lithiation with Microfocused X-Rays. Nano Lett. 2019, 19, 3634–3640. [Google Scholar] [CrossRef]
  48. Popova, A.N. Crystallographic Analysis of Graphite by X-Ray Diffraction. Coke Chem. 2017, 60, 361–365. [Google Scholar] [CrossRef]
  49. Zólyomi, V.; Koltai, J.; Kürti, J. Resonance Raman Spectroscopy of Graphite and Graphene. Phys. Status Solidi 2011, 248, 2435–2444. [Google Scholar] [CrossRef]
  50. Vetrivendan, E.; Hareesh, R.; Ningshen, S. Synthesis and Characterization of Chemical Vapour Deposited Pyrolytic Graphite. Thin Solid. Film. 2022, 749, 139180. [Google Scholar] [CrossRef]
  51. Kaplas, T.; Jakstas, V.; Biciunas, A.; Luksa, A.; Setkus, A.; Niaura, G.; Kasalynas, I. Effect of High-Temperature Annealing on Graphene with Nickel Contacts. Condens. Matter 2019, 4, 21. [Google Scholar] [CrossRef]
  52. Chen, J.; Guo, X.; Tang, Q.; Zhuang, C.; Liu, J.; Wu, S.; Beake, B.D. Nanomechanical Properties of Graphene on Poly(Ethylene Terephthalate) Substrate. Carbon 2013, 55, 144–150. [Google Scholar] [CrossRef]
  53. Singh, S.B.; Dastgheib, S.A. Comparative Characteristics of Coal-Based and Graphite-Based Reduced Graphene Oxide Materials. Carbon Trends 2025, 20, 100511. [Google Scholar] [CrossRef]
  54. Ferrari, A.C. Raman Spectroscopy of Graphene and Graphite: Disorder, Electron–Phonon Coupling, Doping and Nonadiabatic Effects. Solid. State Commun. 2007, 143, 47–57. [Google Scholar] [CrossRef]
  55. Scardaci, V. Laser Synthesized Graphene and Its Applications. Appl. Sci. 2021, 11, 6304. [Google Scholar] [CrossRef]
  56. Kuliček, J.; Yamada, T.; Taniguchi, T.; Rezek, B. Visible-Frequency Plasmonic Enhancement at the Edge of Graphene/h-BN Heterostructures on Silicon Substrate. Carbon 2024, 219, 118836. [Google Scholar] [CrossRef]
  57. Ray, S.C. Applications of Graphene and Graphene-Oxide Based Nanomaterials; Elsevier: Amsterdam, The Netherlands, 2015. [Google Scholar] [CrossRef]
  58. Liu, W.; Li, H.; Xu, C.; Khatami, Y.; Banerjee, K. Synthesis of High-Quality Monolayer and Bilayer Graphene on Copper Using Chemical Vapor Deposition. Carbon 2011, 49, 4122–4130. [Google Scholar] [CrossRef]
  59. Lee, H.; Perumal, S.; Cheong, I. Amphiphilic Fluorinated Block Copolymer Synthesized by RAFT Polymerization for Graphene Dispersions. Polymers 2016, 8, 101. [Google Scholar] [CrossRef]
  60. Zhang, H.; Chen, J.; Cui, X.; Hu, Y.; Lei, L.; Zhu, Y.; Jiang, W. Thermal Annealing Induced Enhancement of Electrical Properties of a Co-Continuous Polymer Blend Filled with Carbon Nanotubes. Compos. Sci. Technol. 2018, 167, 522–528. [Google Scholar] [CrossRef]
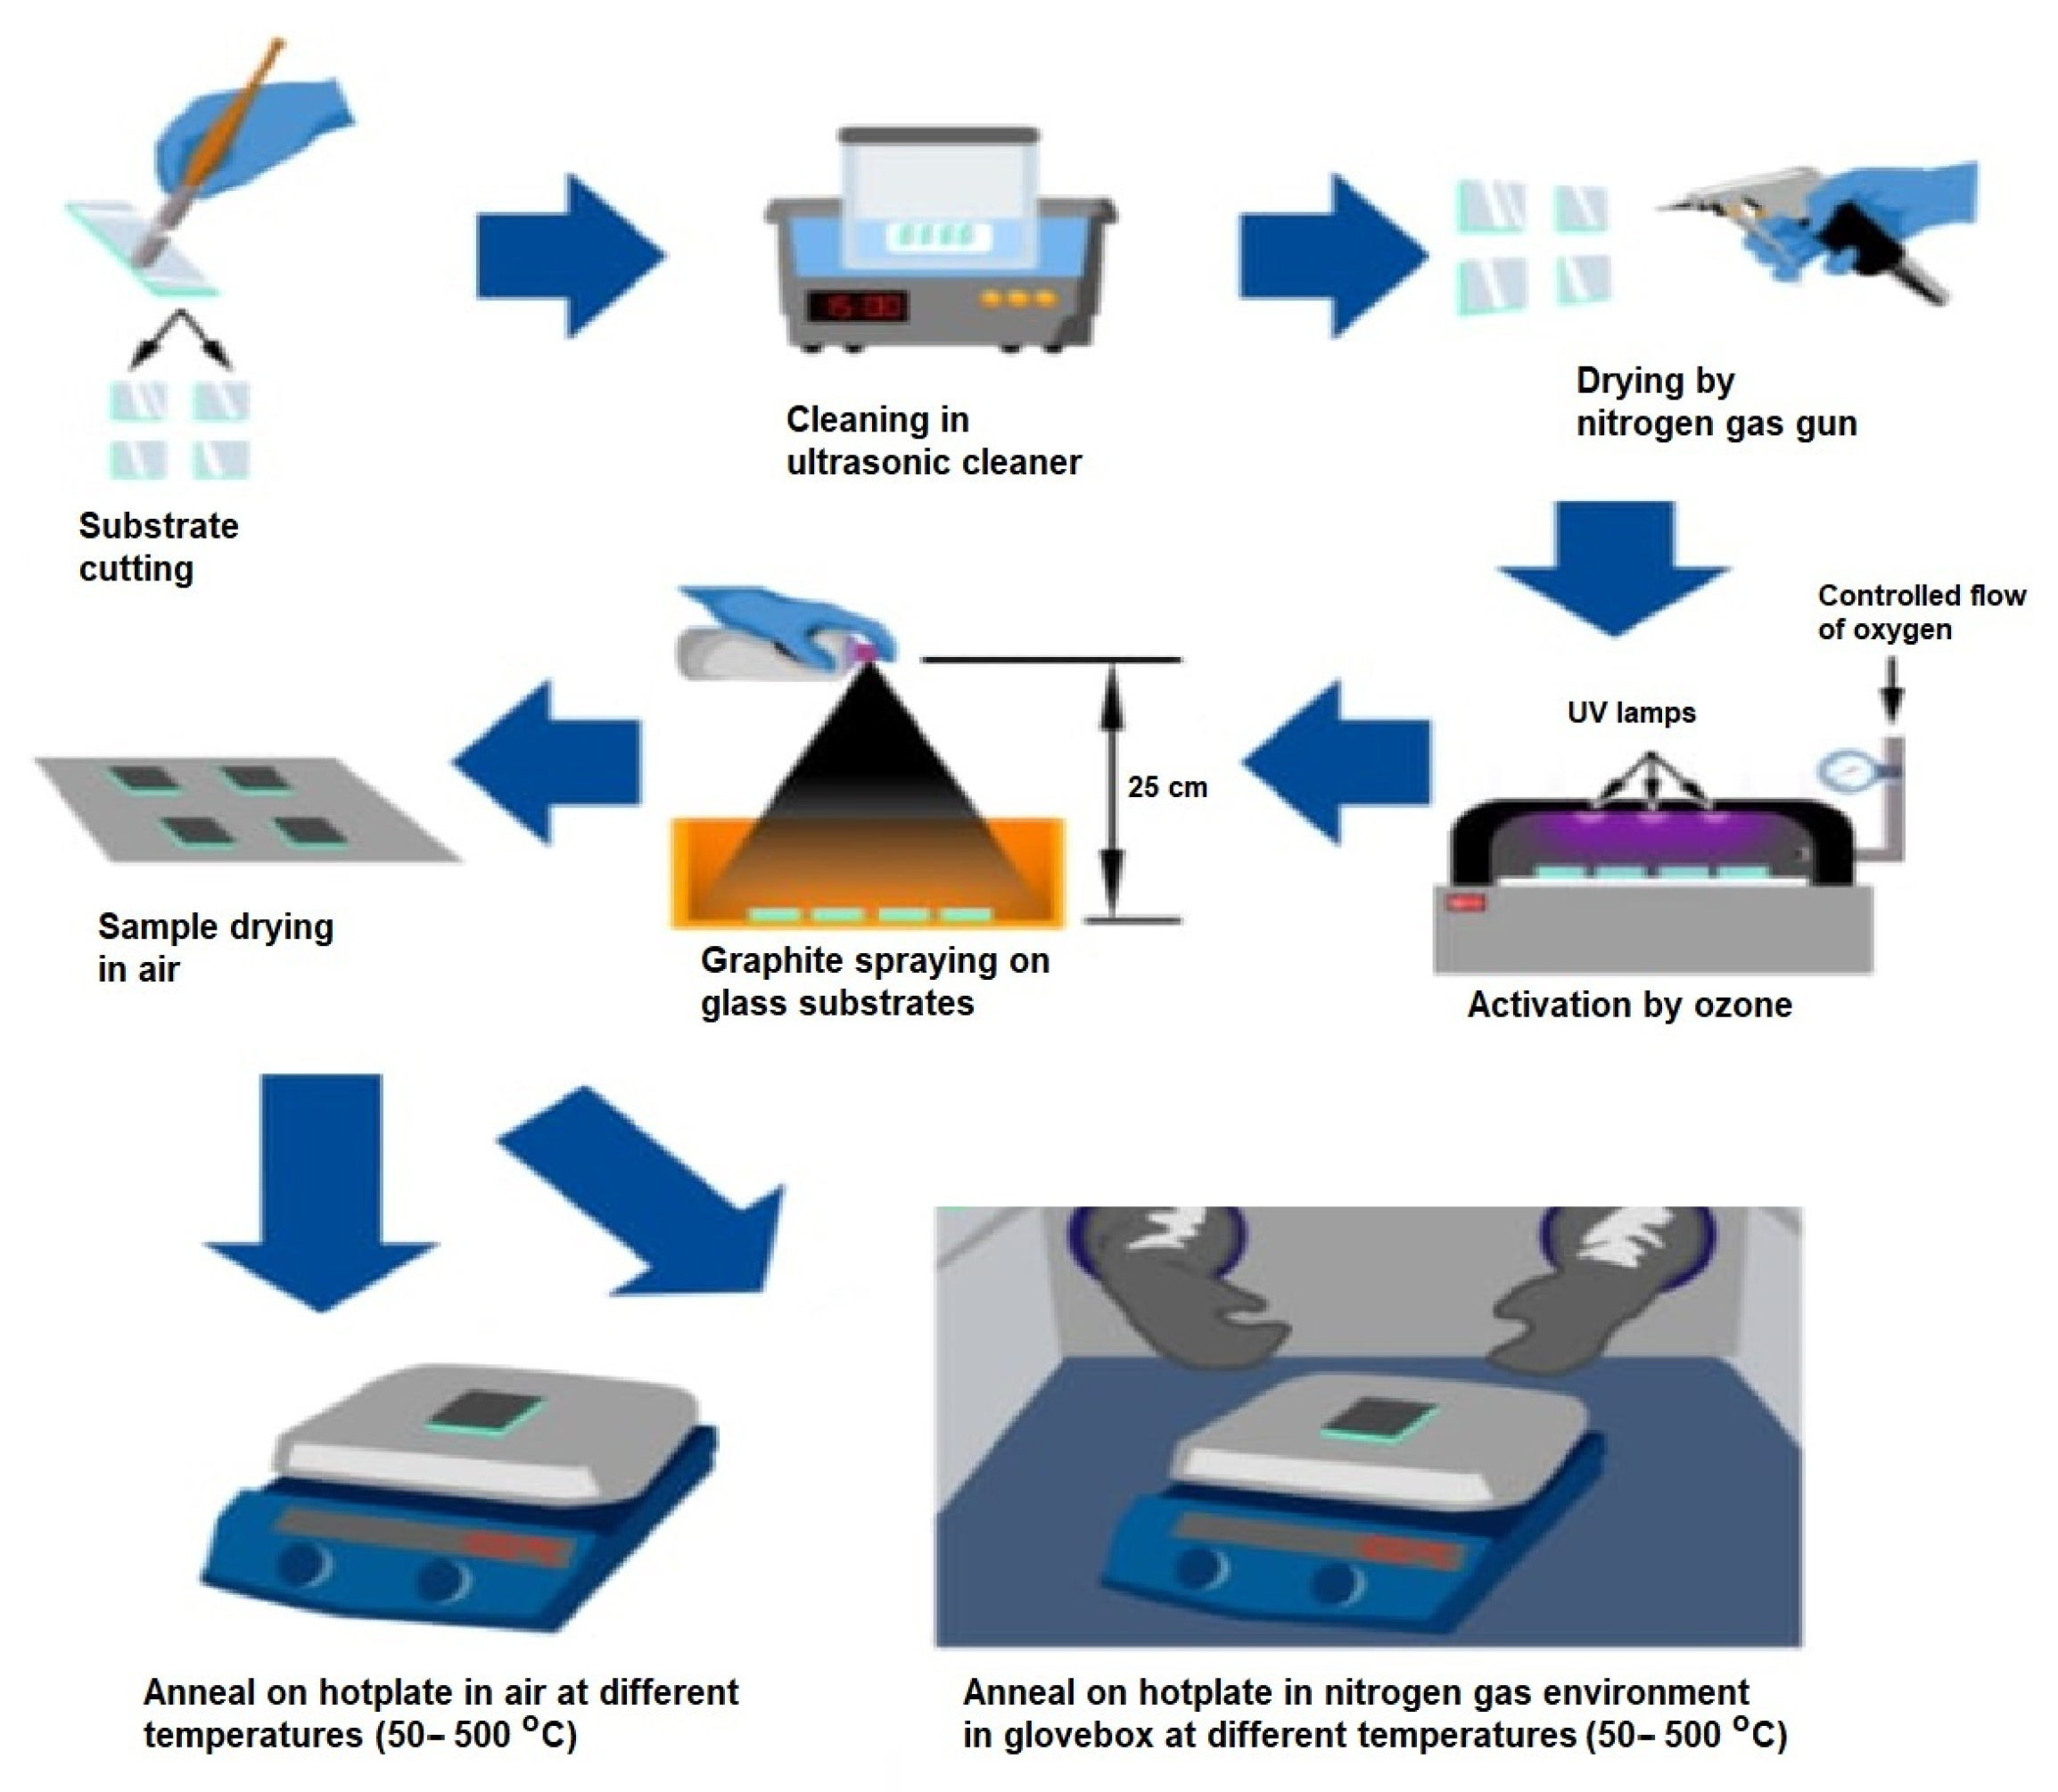
Figure 1. Sample production scheme.
Applsci 15 11727 g001
Figure 2. SEM micrographs of samples (a) prepared in air at 20 °C, (b) annealed in air at 500 °C, and (c) annealed in a N2 gas environment at 500 °C. (d) The layer cross section.
Applsci 15 11727 g002
Figure 3. XRD spectra (plotted in log scale) of samples prepared in (a) air and (b) a N2 gas environment at different annealing temperatures.
Applsci 15 11727 g003
Figure 4. Raman spectra of samples prepared in (a) air and (b) a N2 gas environment at different annealing temperatures.
Applsci 15 11727 g004
Figure 5. (a) G-peak position, (b) D-peak position, (c) I2D/IG, (d) ID/IG..
Applsci 15 11727 g005
Figure 6. (a) IV curves of samples annealed in air at 20 °C, 250 °C, and 500 °C. (b) Resistivity–annealing temperature dependence. Thermal images of the N2 100 °C (c) and 400 °C (d) annealed samples when the applied current is 5 mA (at 30 V and 0.9 V voltages, respectively). The distance between the current contacts is 1 cm (the current is applied to the left contacts in both samples).
Applsci 15 11727 g006
Table 1. Calculated XRD parameters.
EnvironmentAirN2 Gas
Temp.
(°C)
2θ (deg)βobs, FWHMDc (nm)Da (nm)2θ (deg)βobs, FWHMDc (nm)Da (nm)
(002)(110)(002)(110)(002)(110)(002)(110)(002)(110)(002)(110)
2026.3677.680.590.6015.919.426.3677.640.580.3916.240.2
10026.3677.690.580.6316.618.326.3677.660.590.6415.917.9
20026.3777.690.590.5715.920.626.3677.690.570.7216.615.4
30026.3677.670.580.6716.316.626.3677.650.580.5916.119.7
40026.3677.680.590.6215.918.726.3677.680.590.6115.918.8
50026.3777.660.570.6516.717.626.3677.680.600.6015.619.3
Disclaimer/Publisher’s Note: The statements, opinions and data contained in all publications are solely those of the individual author(s) and contributor(s) and not of MDPI and/or the editor(s). MDPI and/or the editor(s) disclaim responsibility for any injury to people or property resulting from any ideas, methods, instructions or products referred to in the content.