Article

Dual Intelligent Prediction of Strength and Energy Absorption Performance of Rubber-Modified Concrete via Machine Learning and Metaheuristic Optimization Algorithms

1
School of Resources and Safety Engineering, Central South University, Changsha 410083, China
2
China State Construction Engineering Corporation (CSCEC), Beijing 100029, China
3
State Key Laboratory of Geomechanics and Geotechnical Engineering, Institute of Rock and Soil Mechanics, Chinese Academy of Sciences, Wuhan 430071, China
*
Authors to whom correspondence should be addressed.
Appl. Sci. 2025, 15(21), 11680; https://doi.org/10.3390/app152111680
Submission received: 22 September 2025 / Revised: 15 October 2025 / Accepted: 29 October 2025 / Published: 31 October 2025

Abstract

This study presents a dual intelligent framework for predicting the uniaxial compressive strength (UCS) and energy transmission rate (ETR) of rubber-modified concrete, a promising aseismic material. An artificial neural network (ANN) was integrated with three advanced metaheuristic optimization algorithms, dream optimization algorithm (DOA), football optimization algorithm (FbOA), and hiking optimization algorithm (HOA), to enhance predictive accuracy. A database comprising 150 experimental results from UCS and ETR tests was used for model training and validation. Comparative evaluation revealed that the DOA-ANN model achieved the highest accuracy with a coefficient of determination (R2) of 0.9857, root mean square error (RMSE) of 0.9501, mean absolute error (MAE) of 0.5756, and variance accounted for (VAF) of 98.5716% for UCS prediction and R2 of 0.9708, RMSE of 1.5334, MAE of 0.9211, and VAF of 97.5063% for ETR prediction, outperforming other optimized ANN, random forest (RF), and conventional machine learning (ML) models. Shapley additive explanations (SHAP) analysis quantified feature importance, highlighting cement and specimen mass as critical predictors, while rubber content exhibited a dual role in strength reduction and energy absorption enhancement. A visual software tool embedding the optimal DOA-ANN model was further developed to enable rapid material design and real-time prediction. This work provides an efficient and interpretable artificial intelligence (AI)-driven approach for advancing the performance evaluation and design of sustainable aseismic concrete.

1. Introduction

Earthquakes pose a significant threat to underground infrastructure, particularly tunnel structures, where material failure can lead to catastrophic consequences [1,2,3]. The development of advanced construction materials with superior energy dissipation and structural resilience has thus become a pressing need in geotechnical and structural engineering. Rubber-modified concrete, which incorporates recycled rubber particles into conventional cementitious mixtures, has emerged as a promising solution for enhancing the shock resistance of such infrastructures [4,5]. This composite not only improves the mechanical damping capacity and elasticity but also offers an environmentally friendly approach to managing waste rubber. Two key metrics often used to evaluate the seismic performance of such materials are uniaxial compressive strength (UCS) and energy transmission rate (ETR), the latter being a proxy for energy absorption efficiency [6]. These properties are typically measured through laboratory testing, including the use of universal testing machines for UCS and split-Hopkinson pressure bar (SHPB) systems for ETR assessments [7,8]. However, the experimental process can be time-consuming and resource-intensive due to the need for meticulous sample preparation and extensive instrumentation, particularly in short construction timelines where real-time decision-making is critical [6].
To address these limitations, researchers have increasingly turned to data-driven prediction models. Machine learning (ML), such as artificial neural networks (ANNs), random forest (RF), support vector regression (SVR), back propagation neural networks (BPNNs), extreme learning machines (ELMs), and kernel-based models, has proven effective for modeling complex nonlinear relationships in material behavior [9,10,11,12]. In the context of improved concrete material performance, RF and ANN models stand out for their adaptability, universal approximation capability, and strong performance in multivariate prediction tasks. For instance, Atici [13] developed two models (multiple regression and ANN) to forecast the UCS of multiple regression analysis. The prediction results indicated that the ANN model obtained a higher prediction accuracy than that of the multiple regression model, with a correlation coefficient (R) of 0.951. Kostić and Vasović [14] used 75 concrete samples to train an ANN model for predicting the UCS of basic concrete mixtures. Under the 95% prediction interval, the proposed ANN model has a satisfactory prediction performance represented by a coefficient of determination (R2) value of 0.87. Zhao et al. [15] generated two ANN-based models to predict the UCS of manufactured-sand concrete materials. Firstly, the traditional ANN model was trained using regular approaches, and the second one was optimized using metaheuristic algorithms. The results demonstrated that the prediction accuracy of the traditional ANN model for forecasting UCS was lower compared to that of the optimized ANN model. For the rubber-modified concrete, Dadashi et al. [16] used a feedback neural network model to predict the strength of rubber-containing concrete. Feng et al. [17] applied the beetle antennae search (BAS) algorithm to select the optimal hyperparameters of several ML models for predicting UCS of rubber-modified recycled aggregate concrete. The performance comparison results of models showed that the ANN model with back propagation was the best prediction model, with R2 of 0.9721. Mei et al. [18] also developed several ANN models with back propagation to estimate the UCS of a novel rubber-sand concrete (RSC) material. Similarly, although fewer studies have focused on ETR prediction, recent work suggests that ANN-based models can effectively approximate energy transmission behavior. Mei et al. [6] utilized six ML models to predict the ETR of rubber-modified concrete materials. The results of the performance evaluation indicated that the RF model, considering five input features, obtained the highest prediction accuracy among all models. After this model, several neural network-based models (e.g., ANN, ELM, and kernel-ELM) also demonstrated good prediction performance. Nevertheless, compared to the RF model, which has already been tested for its performance in ETR prediction, the advantages of the ANN model in terms of computational resource consumption, training time, and noise robustness have yet to be demonstrated.
In fact, both the strength and energy absorption characteristics of concrete materials often need to be considered simultaneously. When subjected to high-intensity dynamic loads, rubber-modified concrete without ultra-high strength can transform destructive energy into other forms of energy through its excellent energy absorption properties, ensuring the safety and stability of concrete structures. Therefore, the ideal predictive goal is to simultaneously obtain the UCS and ETR performance of rubber-modified concrete materials [19]. Nevertheless, studies often treated strength and energy absorption capacity as independent properties, despite their strong interdependence in structural performance and material design. However, the simultaneous prediction of UCS and ETR is crucial because enhancing energy absorption typically compromises strength, and vice versa. On this basis, improving the model’s predictive performance as much as possible is another issue of interest to researchers. Existing research indicates that selecting model hyperparameters based on metaheuristic optimization algorithms to improve model performance is an effective approach [20,21,22]. With the iterative development of algorithms, the application of newly proposed optimization algorithms combined with RF or ANN in UCS and ETR prediction of concrete is worth exploring. Furthermore, the application visualization of the model constrains the widespread adoption of predictive models. Effectively addressing these issues will undoubtedly improve the performance evaluation accuracy of rubber-modified concrete and deepen material design. Existing ML-based studies have not established a unified predictive framework to capture this trade-off mechanism, primarily due to (i) limited integrated datasets containing both UCS and ETR measurements, (ii) the challenge of modeling nonlinear coupled relationships between them, and (iii) few optimization approaches were utilized to improve model’s prediction accuracy. To address this gap, this study proposes an ANN and RF-based framework optimized by three metaheuristic algorithms to predict UCS and ETR, providing a more holistic and practical tool for material design and performance optimization. Then, several performance metrics, regression analysis, and error analysis were used to assess and compare model performance. Furthermore, a visualized user interface was designed to integrate the predictive model, enabling real-time prediction of material properties and design adjustments.

2. Materials

To strengthen the seismic resilience of tunnel structures, Mei et al. [5,19] designed a novel material mixture incorporating rubber particles and river sand to improve concrete performance. In this composite, cement is used to ensure the concrete’s strength, rubber serves to improve deformability and energy dissipation through its elastic and damping characteristics, whereas river sand ensures adequate load-bearing capacity. In this work, 150 novel concrete specimens were prepared for concrete performance testing. The preparation of these specimens complied with the following experimental standards: (a) Material proportioning: rubber particles, river sand, and cement were weighed according to the designed mix ratios and blended to achieve uniform distribution. The composition and mix design process for each combination can be found in reference [6,18]; (b) Casting: the prepared mixture was stirred for approximately five minutes to ensure homogeneity, then immediately poured into cylindrical molds; (c) Demolding: after 24 h of curing in molds, specimens were removed and their surfaces polished to meet the required dimensional specifications; (d) Curing: all samples were stored under controlled conditions of 20 °C and 95% relative humidity until testing; (e) Mechanical testing: following 28 days of curing, a total of 150 specimens were subjected to laboratory experiments for UCS and ETR evaluation. As shown in Figure 1, the universal testing machine was utilized to calculate the material’s UCS and an SHPB device was used to measure specimen’s ETR values. The UCS and the ETR can be defined using Equations (1)–(3), respectively.
S s p e c i m e n = C max   /   A s p e c i m e n
E I ( t ) = E M b a r ν S b a r 0 t ε I 2 ( t ) d t
E T ( t ) = E M b a r ν S b a r 0 t ε T 2 ( t ) d t
where S s p e c i m e n and A s p e c i m e n represent the UCS and the compression area of the tested specimen, respectively. C max is the maximum collapse load. E I and ε I represent the incident energy and the measured strains on the incident bar, respectively. E T and ε T indicate the transmitted energy and the measured strains on the transmission bar, respectively. For the SHPB, E M b a r is the elasticity modulus, ν is the stress wave velocity, and S b a r is the cross-sectional area.
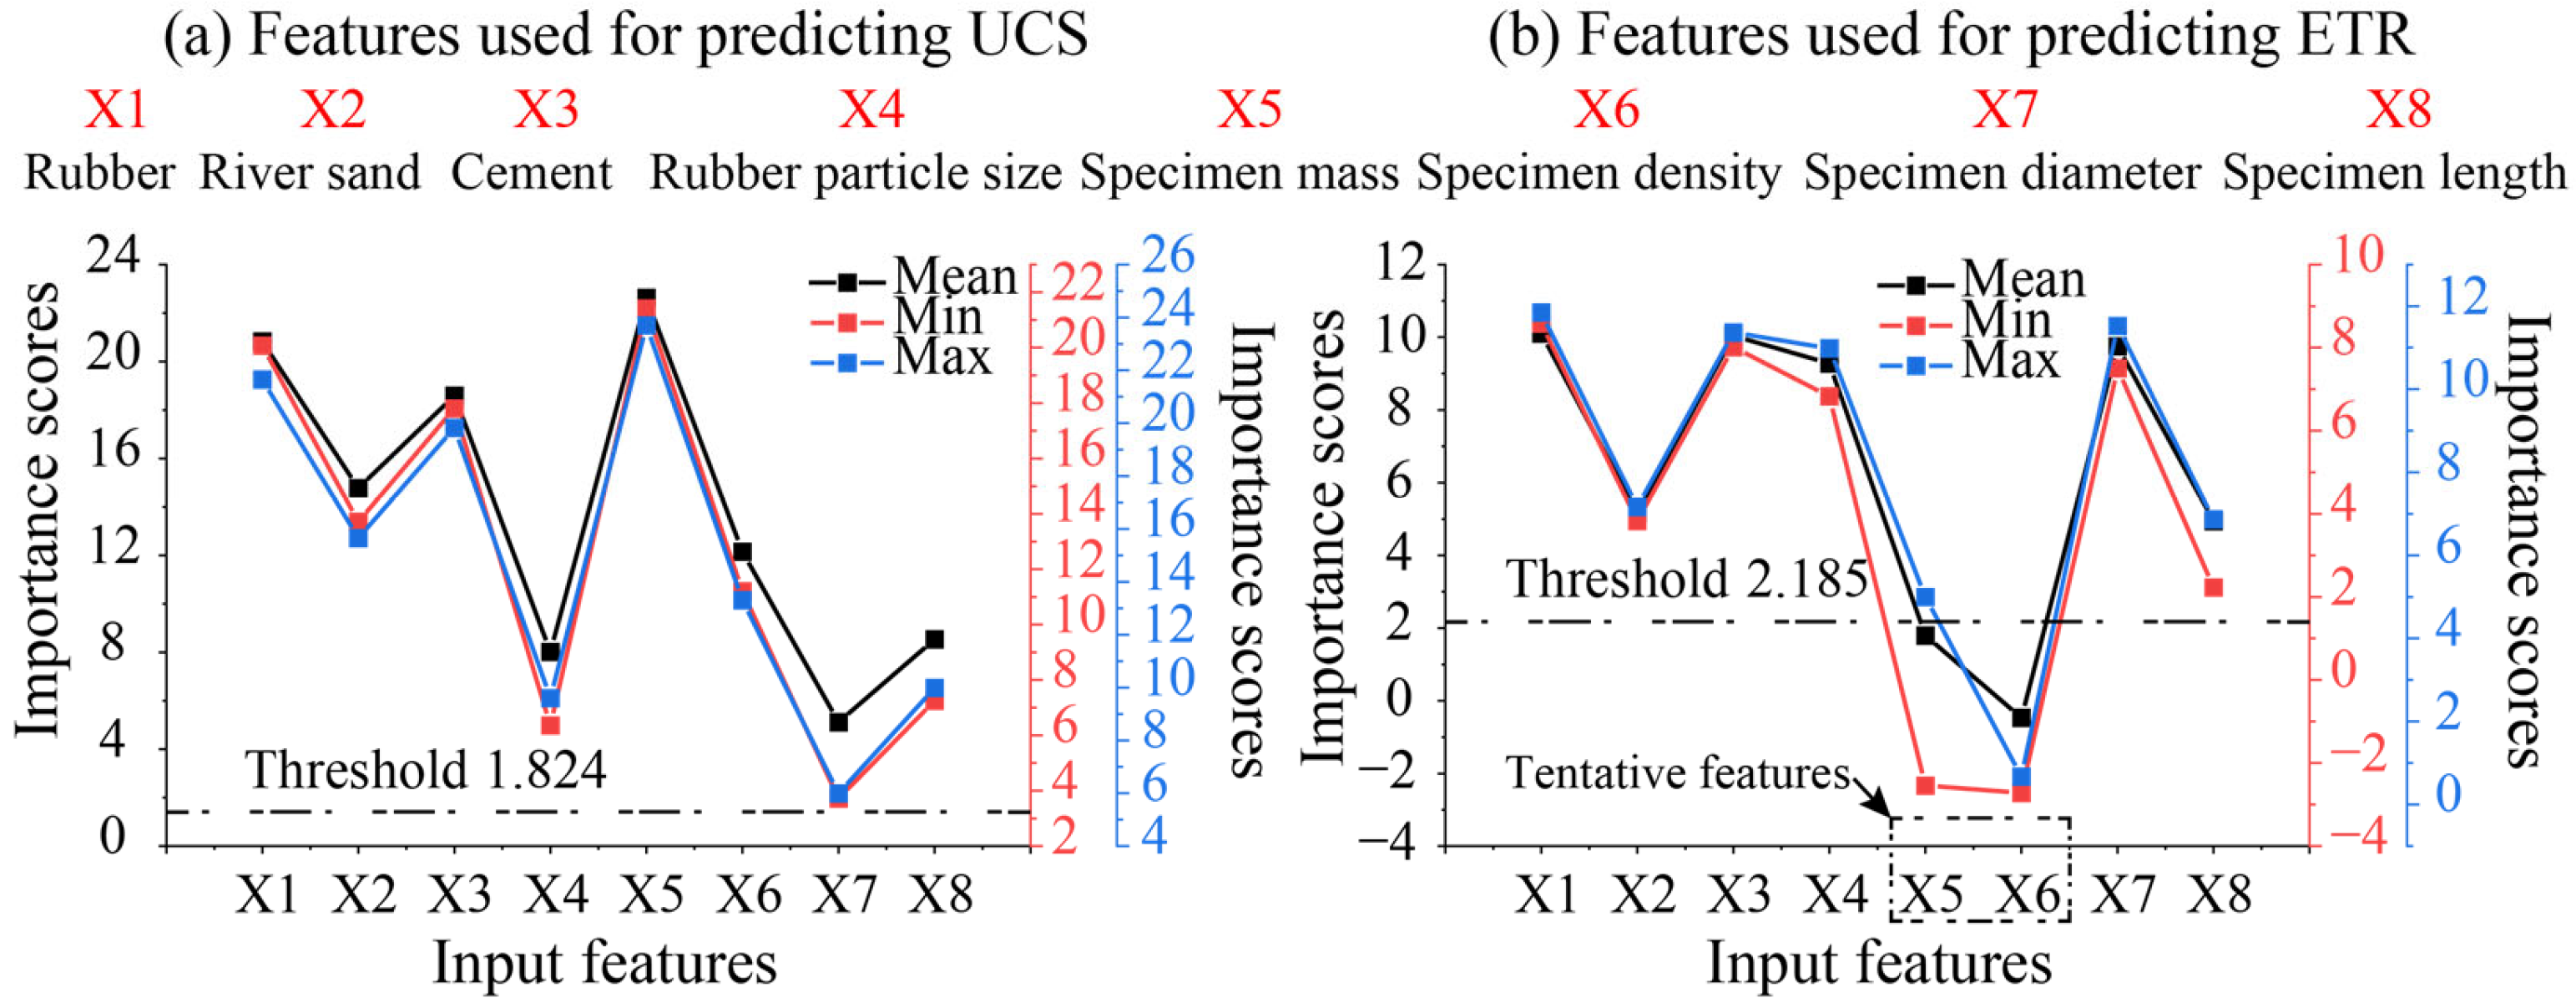
Each specimen in this investigation was produced with distinct properties, meaning that no two samples were identical. Differences existed in mixture composition, such as the amount and size of rubber particles, the proportion of river sand, and cement dosage. Note that the river sand was moderately collected and sieved to a particle size range of 0.5–1 mm for use as fine aggregate in the concrete, while Ordinary Portland Cement (Type I) with an average particle size of approximately 0.15 mm was employed as the cementitious material. In addition, variations in physical attributes—including bulk mass and overall density—as well as geometric dimensions, like diameter and height, contributed to the diversity of the dataset. A detailed overview of these input factors is provided in Table 1 and Table 2. Nevertheless, not every recorded variable was equally suitable for predicting UCS or ETR. To clarify their significance, the Boruta algorithm was utilized to calculate the importance score for each feature. The Boruta algorithm evaluates feature importance by comparing original features with shuffled ‘shadow features’ as random controls. The process involves the following: (1) generating shadow features via random permutation; (2) training a random forest to compute feature importance; (3) comparing each real feature’s importance to the maximum among shadows; (4) labeling features as ‘important’, ‘unimportant’, or ‘tentative’; and (5) repeating the process until all features are clearly classified. This yields a stable and comprehensive set of relevant features. The results of feature selection are shown in Figure 2. As illustrated in Figure 2a, for the UCS prediction, the minimum importance scores for all features are higher than the importance threshold (1.824). Thus, no feature needs to be removed for predicting the UCS. On the other hand, the importance scores of all features were re-calculated using the ETR database; the results are illustrated in Figure 2b. It can be observed that the importance score values of specimen mass (M) and specimen density (r) are lower than the importance threshold (2.185), especially for r. This result indicated that these two features should be removed from the ETR database, which is unbeneficial for training models with high prediction accuracy. As a result, eight features including rubber (Ru), river sand (RS), cement (Ce), rubber particle size (RPS), M, r, specimen diameter (D), and specimen length (L) were selected as input features to train models for predicting concrete’s UCS. In addition, six features, including Ru, RS, Ce, RPS, D, and L, were combined to train models for predicting concrete’s ETR.

3. Methodologies

3.1. ANN Model

ANNs are computational models inspired by biological neural systems, comprising an input layer, multiple hidden layers, and an output layer (see Figure 3). The architecture’s core strength lies in its ability to model complex nonlinear relationships through hierarchical feature transformation [23]. In an ANN model, key hyperparameters include the number of hidden layers (Nh) and the number of neurons per layer (Nn). The former determines the depth and representational capacity and the latter influences the network’s granularity in feature extraction. Compared to traditional ML models, ANNs demonstrate superior performance in handling high-dimensional data, spatial or temporal patterns, and large-scale datasets due to their distributed parallel processing and adaptive learning mechanisms [24]. In the field of concrete performance prediction and mix design optimization, ANNs demonstrate the ability to autonomously extract implicit relationships from extensive experimental and engineering data through deep nonlinear transformations, without requiring pre-assumed constitutive relations or explicit analytical equations [25]. This enables ANNs to uncover influence mechanisms that have not been formally described by classical theories. For inverse material design, ANNs can rapidly generate novel mix proportions that meet specific performance targets via back propagation-based optimization, significantly reducing the need for trial-and-error experimentation and shortening development cycles [26].

3.2. RF Model

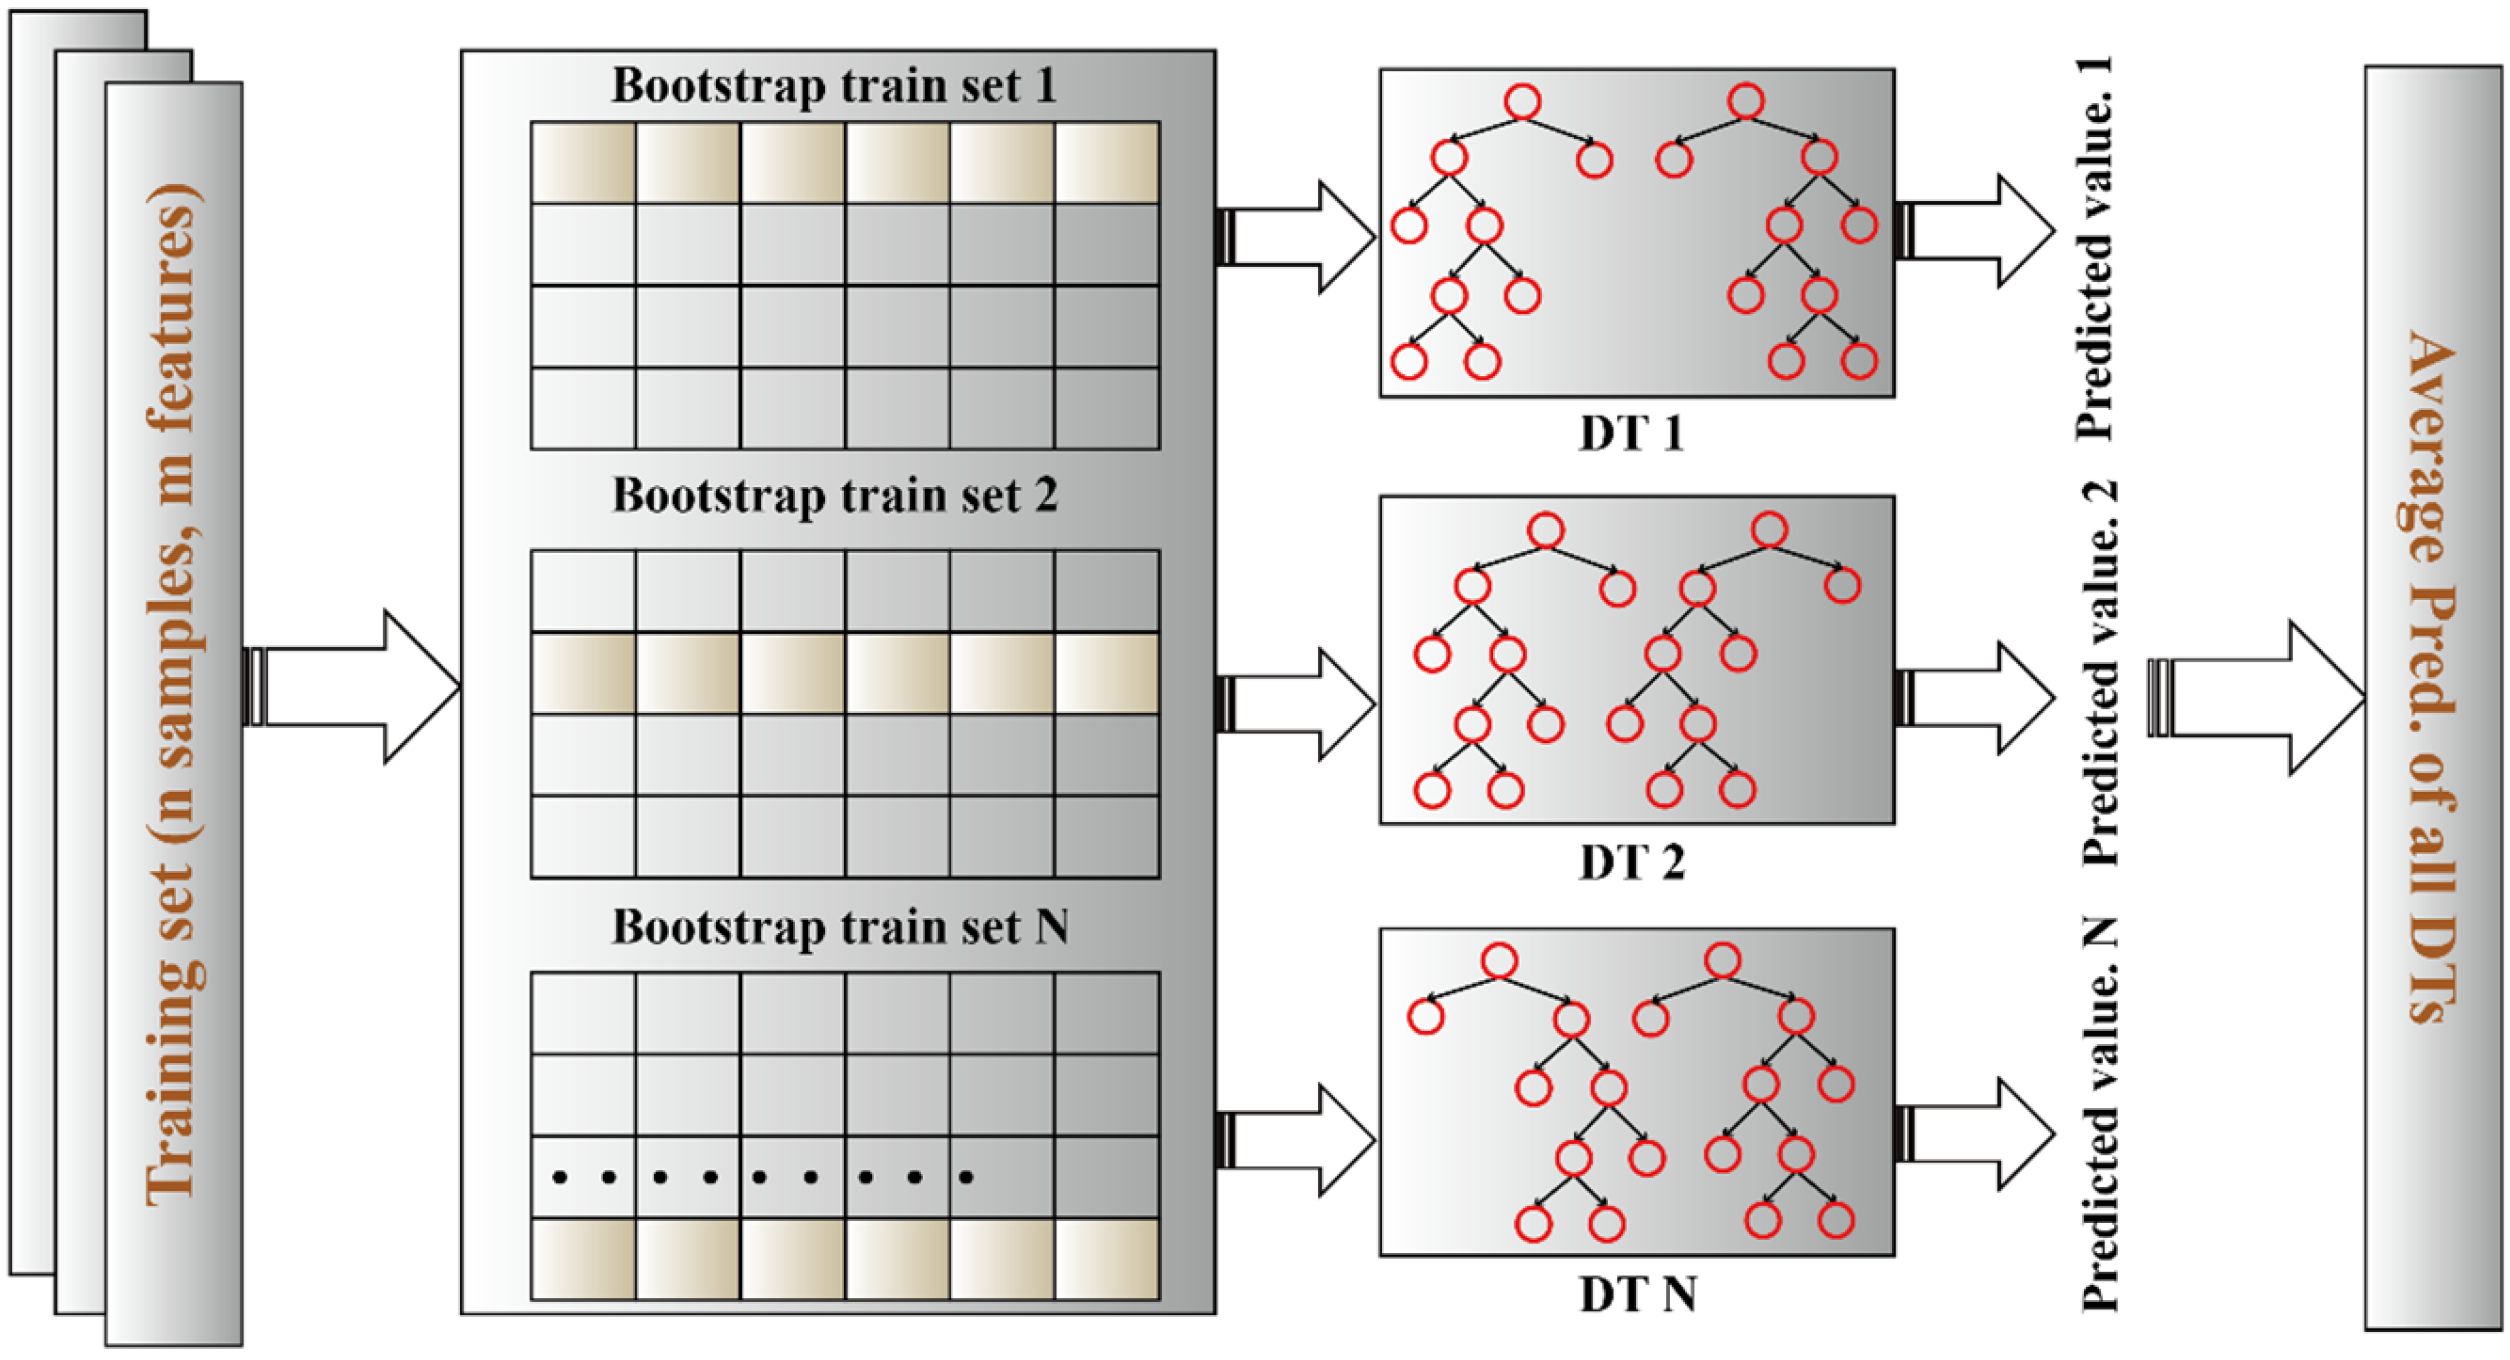
RF is a robust ensemble learning algorithm with strong nonlinear modeling capability. By aggregating a large number of decision trees trained on different bootstrapped samples and feature subsets, RF effectively reduces model variance in regression tasks and enhances generalization performance [27]. Two key hyperparameters, the number of trees (Nt) and the maximum depth (Md), play a central role in determining predictive performance. The former controls the ensemble stability, where a larger number of trees generally leads to reduced prediction variance at the cost of increased computational burden. The latter dictates the complexity of individual trees, with greater depth enabling the capture of more intricate feature interactions but also raising the risk of overfitting [28]. In regression tasks, each decision tree produces a numerical output, and the final prediction is obtained by a weighted average, as shown in Figure 4. Compared with traditional linear regression or single-tree models, RF is less sensitive to noise and outliers in the data, while providing an inherent mechanism for feature selection by quantifying the importance of each input variable in relation to the prediction target. This capacity offers a scientific basis for material design. In particular, under engineering scenarios characterized by high-dimensional variables and limited sample sizes, the efficiency and interpretability of RF make it a powerful tool for performance modeling and parameter optimization, thereby opening a new pathway for intelligent mix design of green high-performance concrete.

3.3. Metaheuristic Optimization Algorithms

3.3.1. Dream Optimization Algorithm

Dream optimization algorithm (DOA) was proposed by Lang and Gao [29] and originates from cognitive neuroscience, specifically the neurological mechanisms underlying human dreams during rapid eye movement (REM) sleep. Inspired by the selective memory and self-organizing nature of dreams, the DOA treats agents as dreamers with varying memory capacities. At each step, agents recall past optima, forget certain variables, and restore them via logical reorganization or peer interaction. Within regression modeling tasks, DOA proceeds by exploring the high-dimensional parameter space via structured perturbations in early iterations, while gradually shifting to intensive exploitation through refined search in fewer dimensions. For the optimization task, the framework of DOA can be divided into the following:
(1)
Initialization phase
At the beginning, a population of candidate solutions is randomly distributed over the problem domain using the following formula:
D i = D l o w + r a n d ( D u p D l o w )
where D i represents the initial position of the i-th candidate solution. D l o w and D u p represent the lower and upper boundaries of the searching space, respectively. r a n d is a random number within the range of [0, 1].
(2)
Exploration phase
In the early stage of dreaming, each individual partially forgets previous memories and attempts new combinations via controlled randomness. Individuals are grouped based on memory capacity, and update only a subset of dimensions:
D i t + 1 = D b e s t t + D l o w + r a n d ( D u p D l o w ) 1 2 cos π t + T max T d T max + 1
where D i t + 1 represents the position of the i-th candidate solution at the t + 1 iteration. D b e s t t represents the best position of candidate solution at the t iteration. t, Tmax, and Td are the current iteration time, the maximum number of iterations, and the maximum number of iterations in the current phase, respectively.
(3)
Exploitation phase
As iterations progress, all individuals focus on refining solutions around the globally best memory. This phase decreases randomness and enforces stability:
D i t + 1 = D b e s t t + D l o w + r a n d ( D u p D l o w ) 1 2 cos π t T max + 1

3.3.2. Football Optimization Algorithm

Football optimization algorithm (FbOA) was introduced by El-Kenawy et al. [30] to solve the optimization problem, which is inspired by the strategic and cooperative dynamics of football matches. The algorithm models each agent as a football player, where actions such as passing and repositioning represent diverse search strategies. This framework captures the balance between exploration and exploitation through dynamic decision-making and information exchange, analogous to team play in football. In regression applications, each player corresponds to a candidate solution (i.e., a set of regression coefficients). During training, players adjust their positions based on tactical maneuvers and feedback from previous plays (i.e., fitness evaluations), incorporating both global strategies (team-wide information) and local refinements (individual adjustments). For the optimization task, the framework of FbOA can be divided into the following:
(1)
Initialization phase
The players are placed randomly across the search domain to simulate an unbiased starting lineup:
P i = P l o w + r a n d ( P u p P l o w )
where P i represents the initial position of the i-th player. P l o w and P u p represent the lower and upper boundaries of the searching space, respectively.
(2)
Exploration phase
In this phase, players perform long-range operations (e.g., long passes) that increase diversity and allow broad sampling of the solution space:
P b e s t = 1 k n = 0 k P max n 2 2 n + 1 2
where P b e s t represents the best position of the players. k represents an exponential factor. P max is the maximum force, which is the upper bound of velocity. 2 n + 1 2 controls the iteration process.
(3)
Exploitation phase
As the match progresses, players focus on coordinated attack by targeting the best-known position:
P i t + 1 = P i + z P i t + k sin ( π I t e r a t i o n )
where P i t + 1 represents the position of the i-th player at the t + 1 iteration. z is a control parameter.

3.3.3. Hiking Optimization Algorithm

Hiking optimization algorithm (HOA) was developed by Oladejo et al. [31], which is inspired by the conceptual foundation from the physical and strategic aspects of hiking in mountainous terrain. The core inspiration lies in the varying velocities and directional changes in hikers navigating slopes, as governed by Tobler’s Hiking Function, which mathematically describes walking speed as a function of terrain slope. In HOA, hikers adaptively traverse the optimization landscape, modulating their search velocity and direction based on perceived steepness (i.e., gradient or difficulty of the search space). In HOA, agents behave like hikers adjusting their steps based on the error landscape: they take small steps in rugged regions and larger strides in smooth areas. This adaptive strategy enables efficient exploration of complex, high-variance parameter spaces. The framework of HOA can be divided into the following:
(1)
Initialization phase
To simulate hikers randomly entering the hiking region, hikers are initialized across the feasible domain as follows:
H i = H l o w + r a n d ( H u p H l o w )
where H i represents the initial position of the i-th hiker. H l o w and H u p represent the lower and upper boundaries of the searching space, respectively.
(2)
Exploration phase
During this phase, hikers evaluate terrain steepness via Tobler’s Hiking Function and adjust their speed and direction to explore valleys and ridges:
w i t = w i t 1 + γ H b e s t α H i t
where w i t and w i t 1 represent the velocities of the i-th hiker at the t-th and t − 1-th iterations, respectively. γ and α represent a uniformly distributed number and sweep factor, respectively. H b e s t and H i t represent the best position and current position of the i-th hiker at the t-th iterations, respectively.

4. Development of Prediction Models

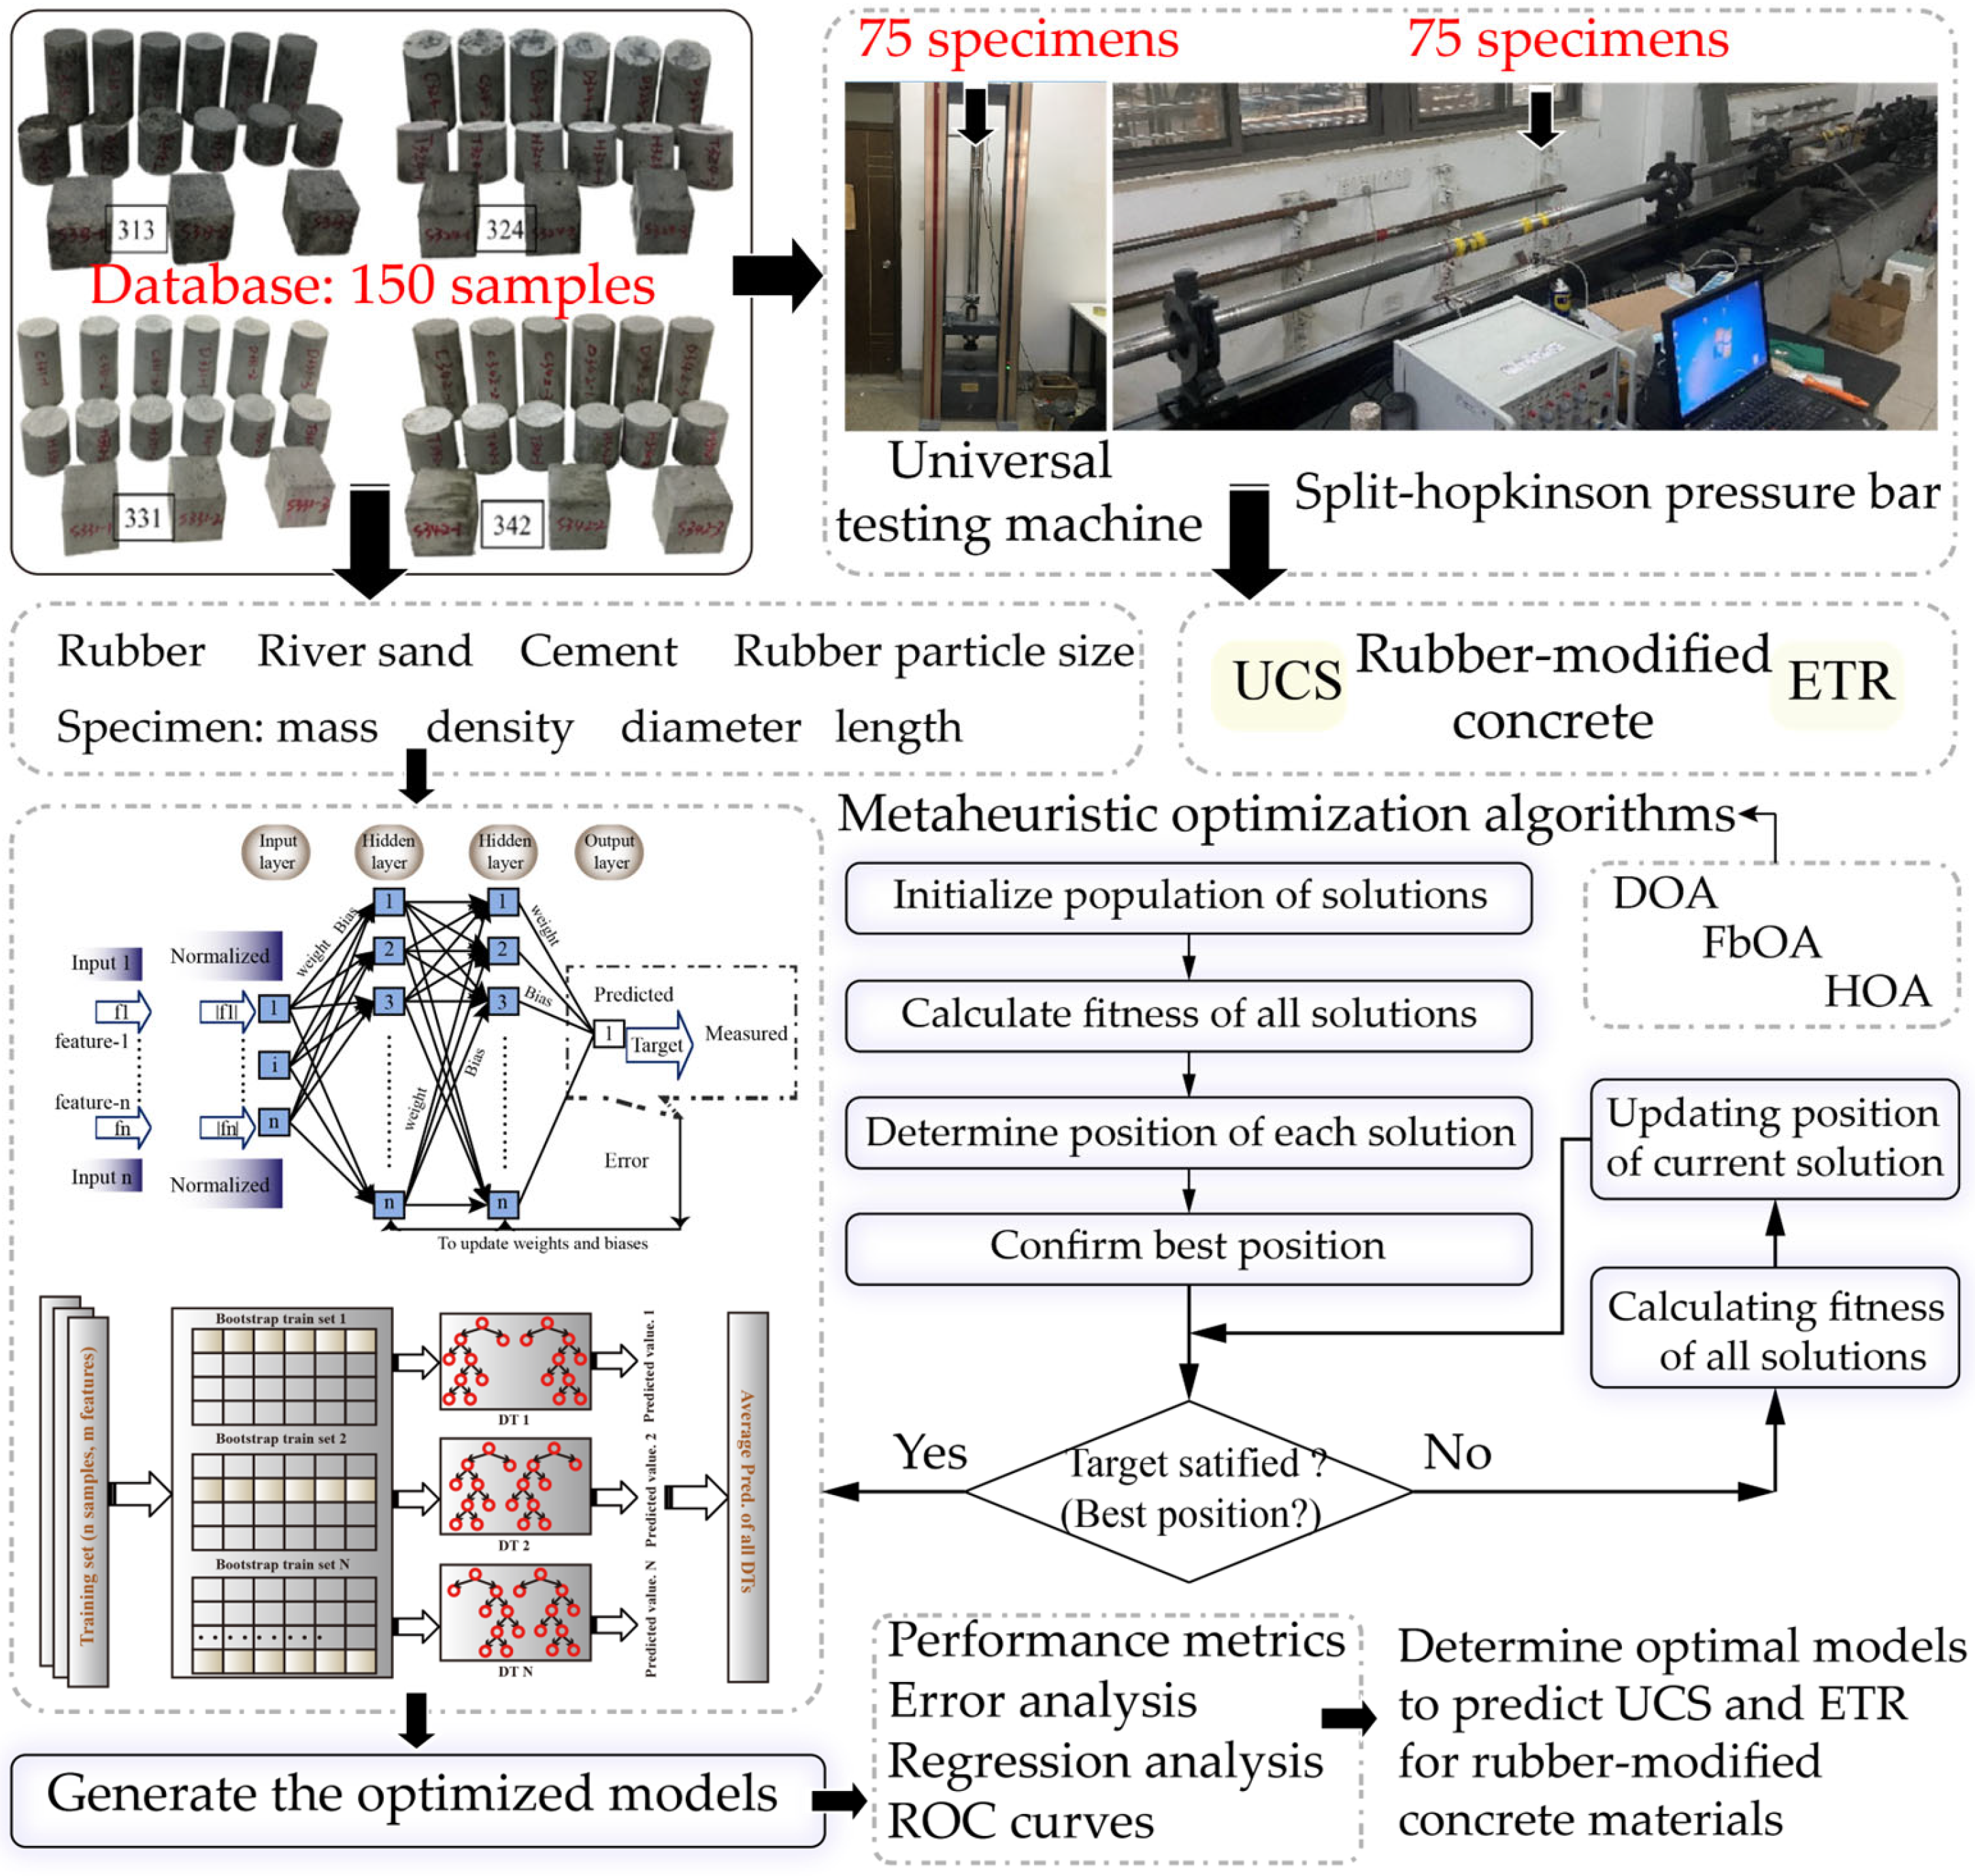
In this paper, three novel metaheuristic optimization algorithms were used to optimize the proposed ANN and RF models for predicting the UCS and the ETR of rubber–concrete materials. As illustrated in Figure 5, the framework can be organized into three parts:
(a)
Database generation: As mentioned in Section 2, 75 samples were used to predict the UCS of rubber-modified concrete material, and another 75 samples were used to predict ETR. Based on similar studies [18,19], the ratio of training set to test set was set equal to 80%:20%. To avoid performance anomalies in the model caused by differences in feature scales, all features are normalized to the range of −1 to 1.
(b)
Model construction: In this work, DOA, FbOA, and HOA were combined with ANN and RF models to generate different prediction models, i.e., DOA-ANN, DOA-RF, FbOA-ANN, FbOA-RF, HOA-ANN, and HOA-RF. For the ANN mode, the range of Nh and Nn are [1, 3] and [1, 10], respectively. For the RF model, the ranges of Nt and Md are [1, 100] and [1, 10], respectively. On the other hand, for optimization algorithms, the settings of population size and iteration count significantly affect optimization performance. A larger population size helps increase the coverage of the search space and improves the probability of finding the global optimal solution, but it also raises computational cost [32]. In contrast, a smaller population size tends to localize the search process, making it more likely to converge to a local optimum. On the other hand, the number of iterations is positively correlated with the probability of finding the optimal solution. However, excessive iterations may lead to overfitting, thus increasing computation time. In the preliminary experiments, increasing the population size beyond 100 (e.g., to 125 or 150) did not necessarily improve the model’s predictive accuracy or fitness value (R2 or RMSE), while computational time increased significantly (more than double in some cases) [18]. Therefore, the population sizes were set as 25, 50, 75, and 100 to search for the optimal solutions during 200 iterations. Moreover, the hybrid fitness function established by statistical index and cross-validation was used to evaluate optimization performance. In this paper, the root mean square error (RMSE) without absolute values was adopted as a statistical metric, and five-fold cross-validation was employed to prevent overfitting. The definition of the developed fitness function is expressed using Equation (12).
f i t n e s s = 1 5 f o l d = 1 5 R M S E f o l d = 1 , 2 , 3 , 4 , 5
(c)
Performance evaluation: To quantitatively assess model performance in predicting the UCS and ETR of the novel aseismic concrete, four statistical indicators were employed. R2, commonly referred to as the goodness-of-fit index, quantifies the proportion of variance in the observed data that is explained by the model predictions. An R2 value approaching unity indicates nearly perfect agreement between estimated and actual values. The variance accounted for (VAF) is another metric used to evaluate how effectively the model captures the variability present in the target dataset. RMSE provides a robust measure of prediction accuracy by penalizing large deviations between actual and predicted values. Complementarily, the mean absolute error (MAE) offers an intuitive understanding of average prediction error without emphasizing outliers. Together, these metrics provide a comprehensive framework for evaluating the regression capability of different predictive approaches [32,33,34,35,36,37,38,39,40].
R 2 = 1 n = 1 N ( a n p n ) 2 n = 1 N ( a n a ¯ ) 2
VAF = 1 var ( a n p n ) var ( a n ) × 100 %
RMSE = 1 N n = 1 N a n p n 2
MAE = 1 N n = 1 N a n p n
where N is the maximum number of samples used in the dataset. an and pn are the actual and predicted values of the n-th sample, respectively. a ¯ is the average of the actual values.

5. Results and Discussion

5.1. Model Optimization

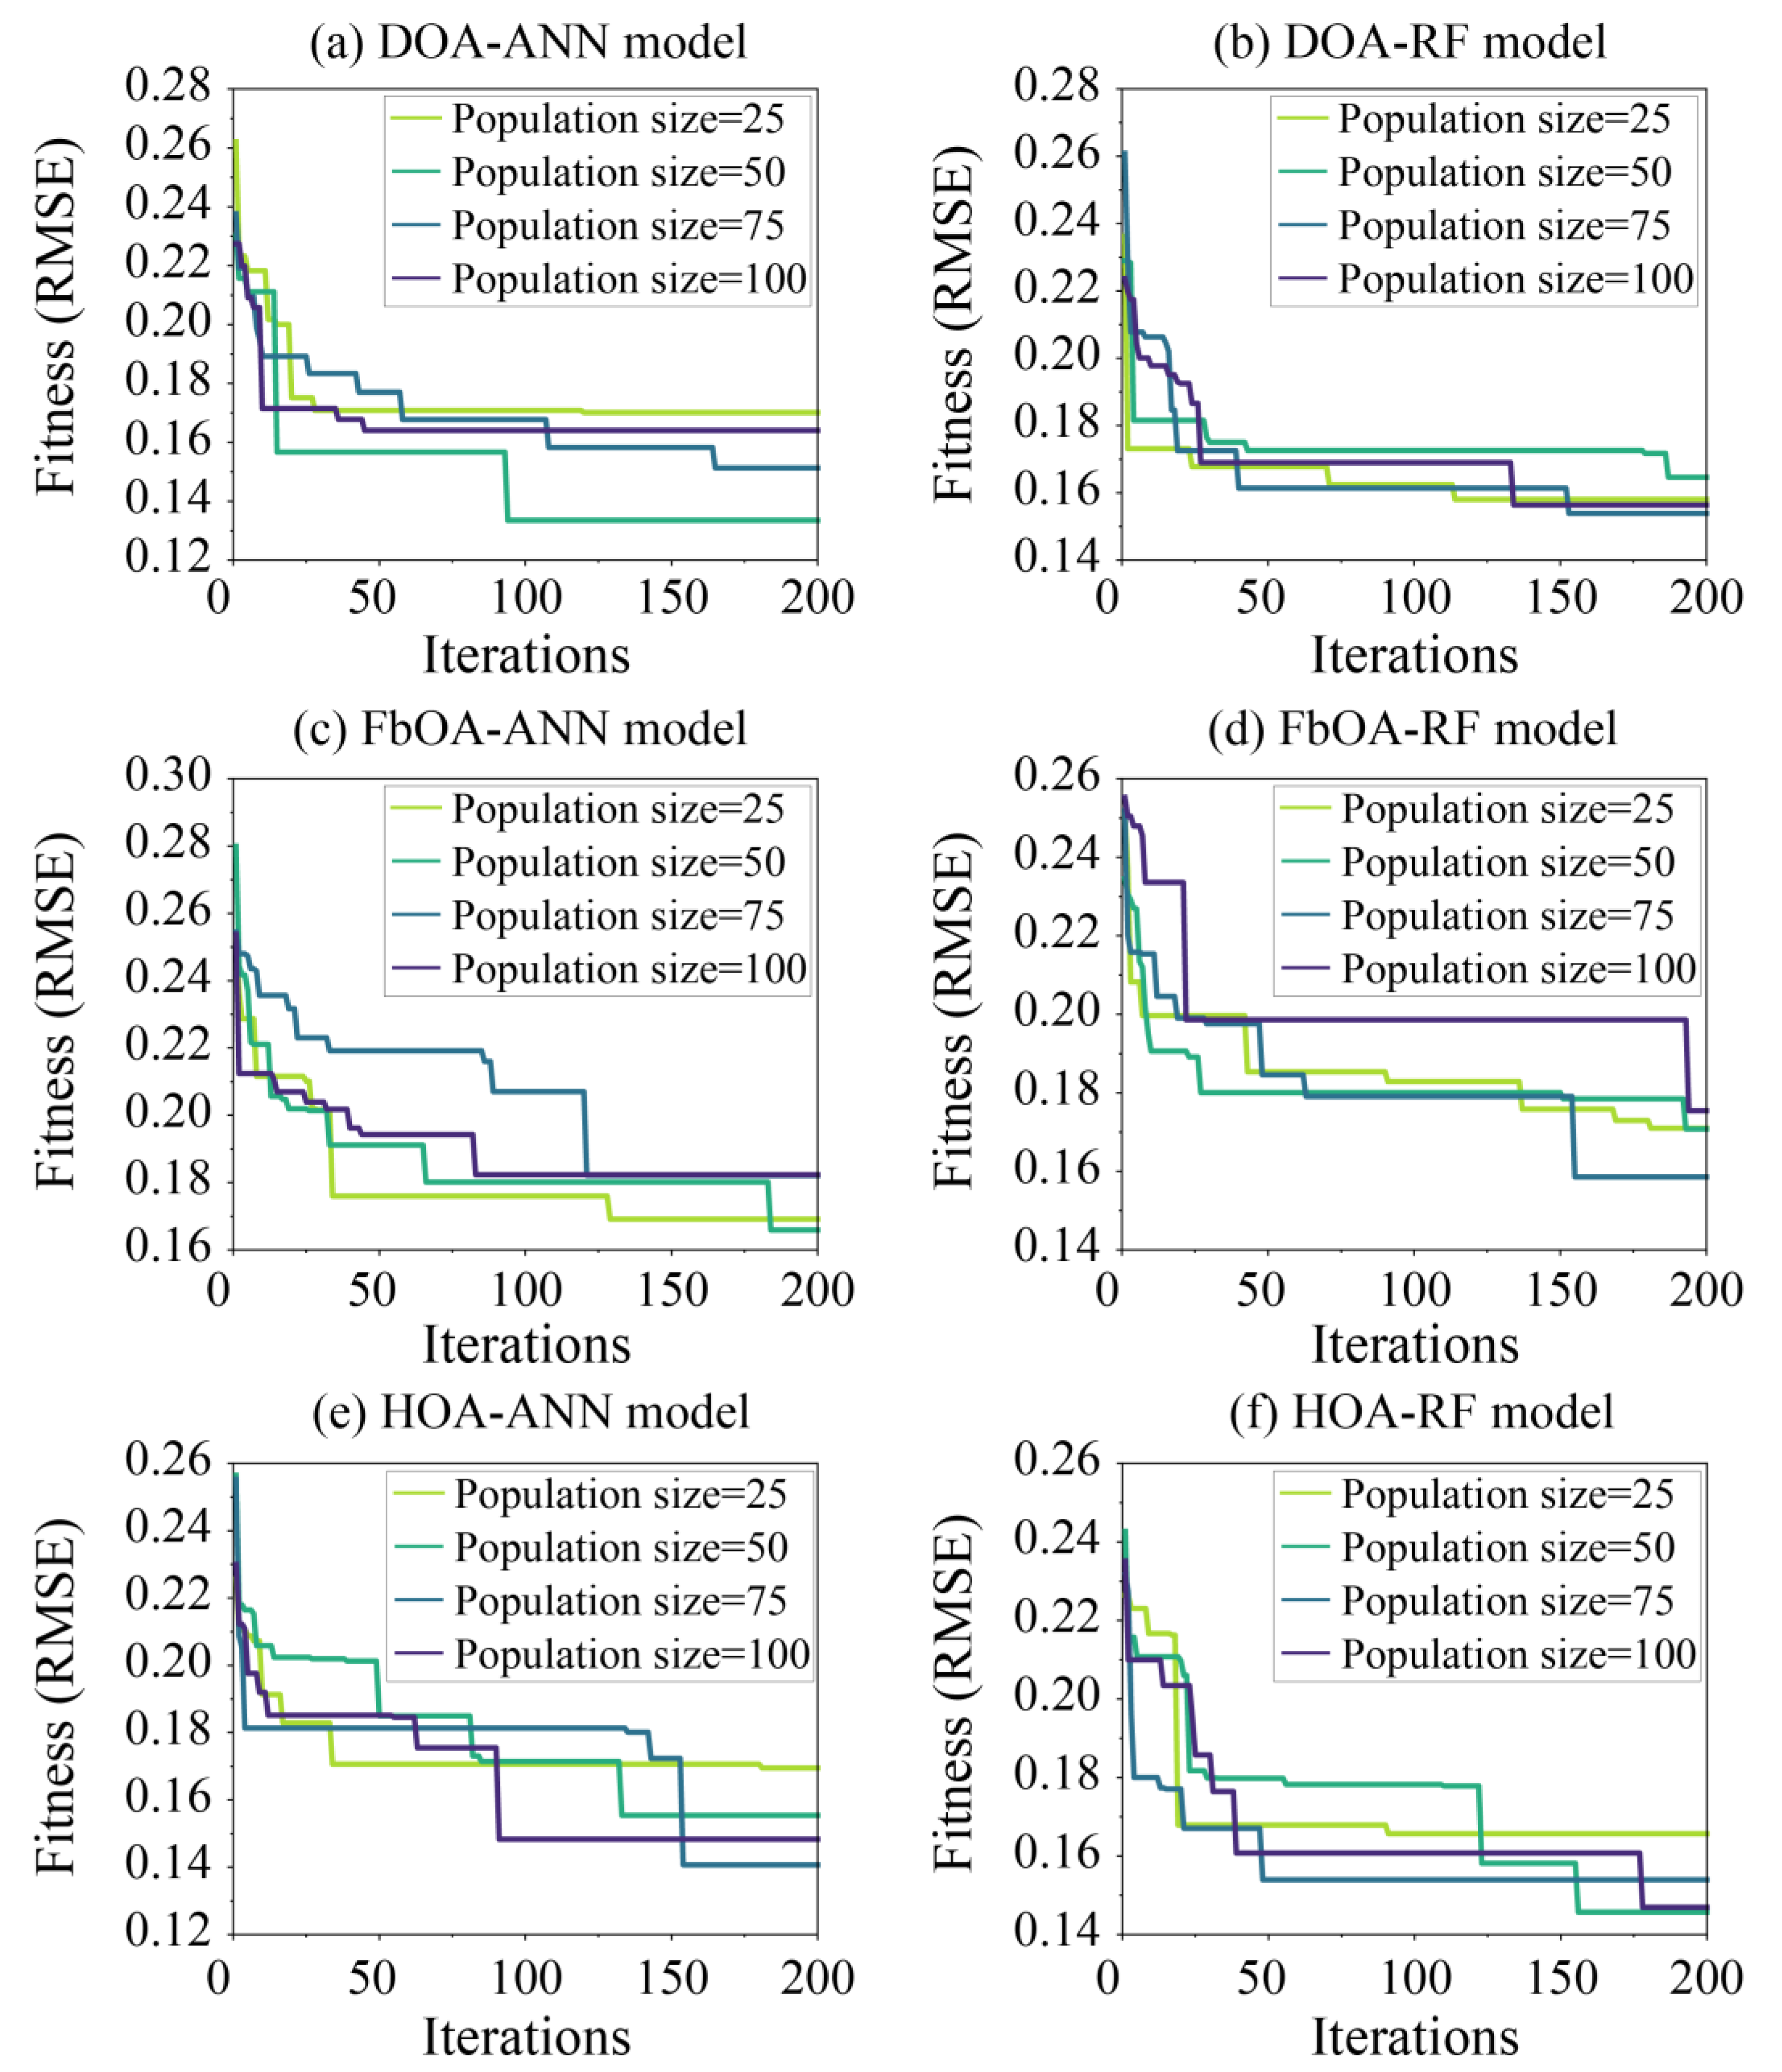
In this work, three novel metaheuristic optimization algorithms were utilized to determine the optimal hyperparameters for ANN and RF models. In the optimization process, a varying number of population individuals are set to search for the optimal solution during iterations. Figure 6 illustrates the iteration curves of all developed models used for predicting concrete’s UCS during 200 iterations. It is clearly observed that all models reach a minimum fitness value at a certain population size before iteration termination, indicating that an optimal solution exists for each population size setting. For instance, the fitness values of the DOA-ANN and FbOA-ANN models are significantly lower at a population size of 50 compared to other population sizes, whereas the HOA-ANN model finds the optimal solution at a population size of 75. A similar situation is observed in the RF model optimization process. In the UCS prediction task, both the DOA-RF and FbOA-RF models achieve the optimal solution at a population size of 75. The optimized iteration curves of each model in the concrete’s ETR prediction task are shown in Figure 7. Except for the DOA-RF model, all other models attain the minimum fitness value at a population size of 75 through 200 iterations, which signifies the identification of the optimal hyperparameter combination.
Table 3 and Table 4 present the fitness values obtained by all models under different population size settings for the comprehensive evaluation of optimization performance. For example, when the population size is set to 25 (used for predicting UCS), the DOAs and HOAs exhibit strong optimization performance for the RF model, resulting in the lowest fitness values for the generated hybrid models. When the population size is set to 50, the FbOA algorithm outperforms other algorithms in optimizing the ANN model, with a fitness value of 0.1539 for the generated hybrid model. When the population size is set to 75, the combination of FbOA and ANN achieves the lowest fitness value in the ETR prediction. At a population size of 100, the fitness values for the ANN and RF models under all optimization algorithms are higher than those at other population sizes. Based on the optimal hyperparameter selection rule, each optimized model yields a unique solution (see Table 3 and Table 4).

5.2. Model Evaluation

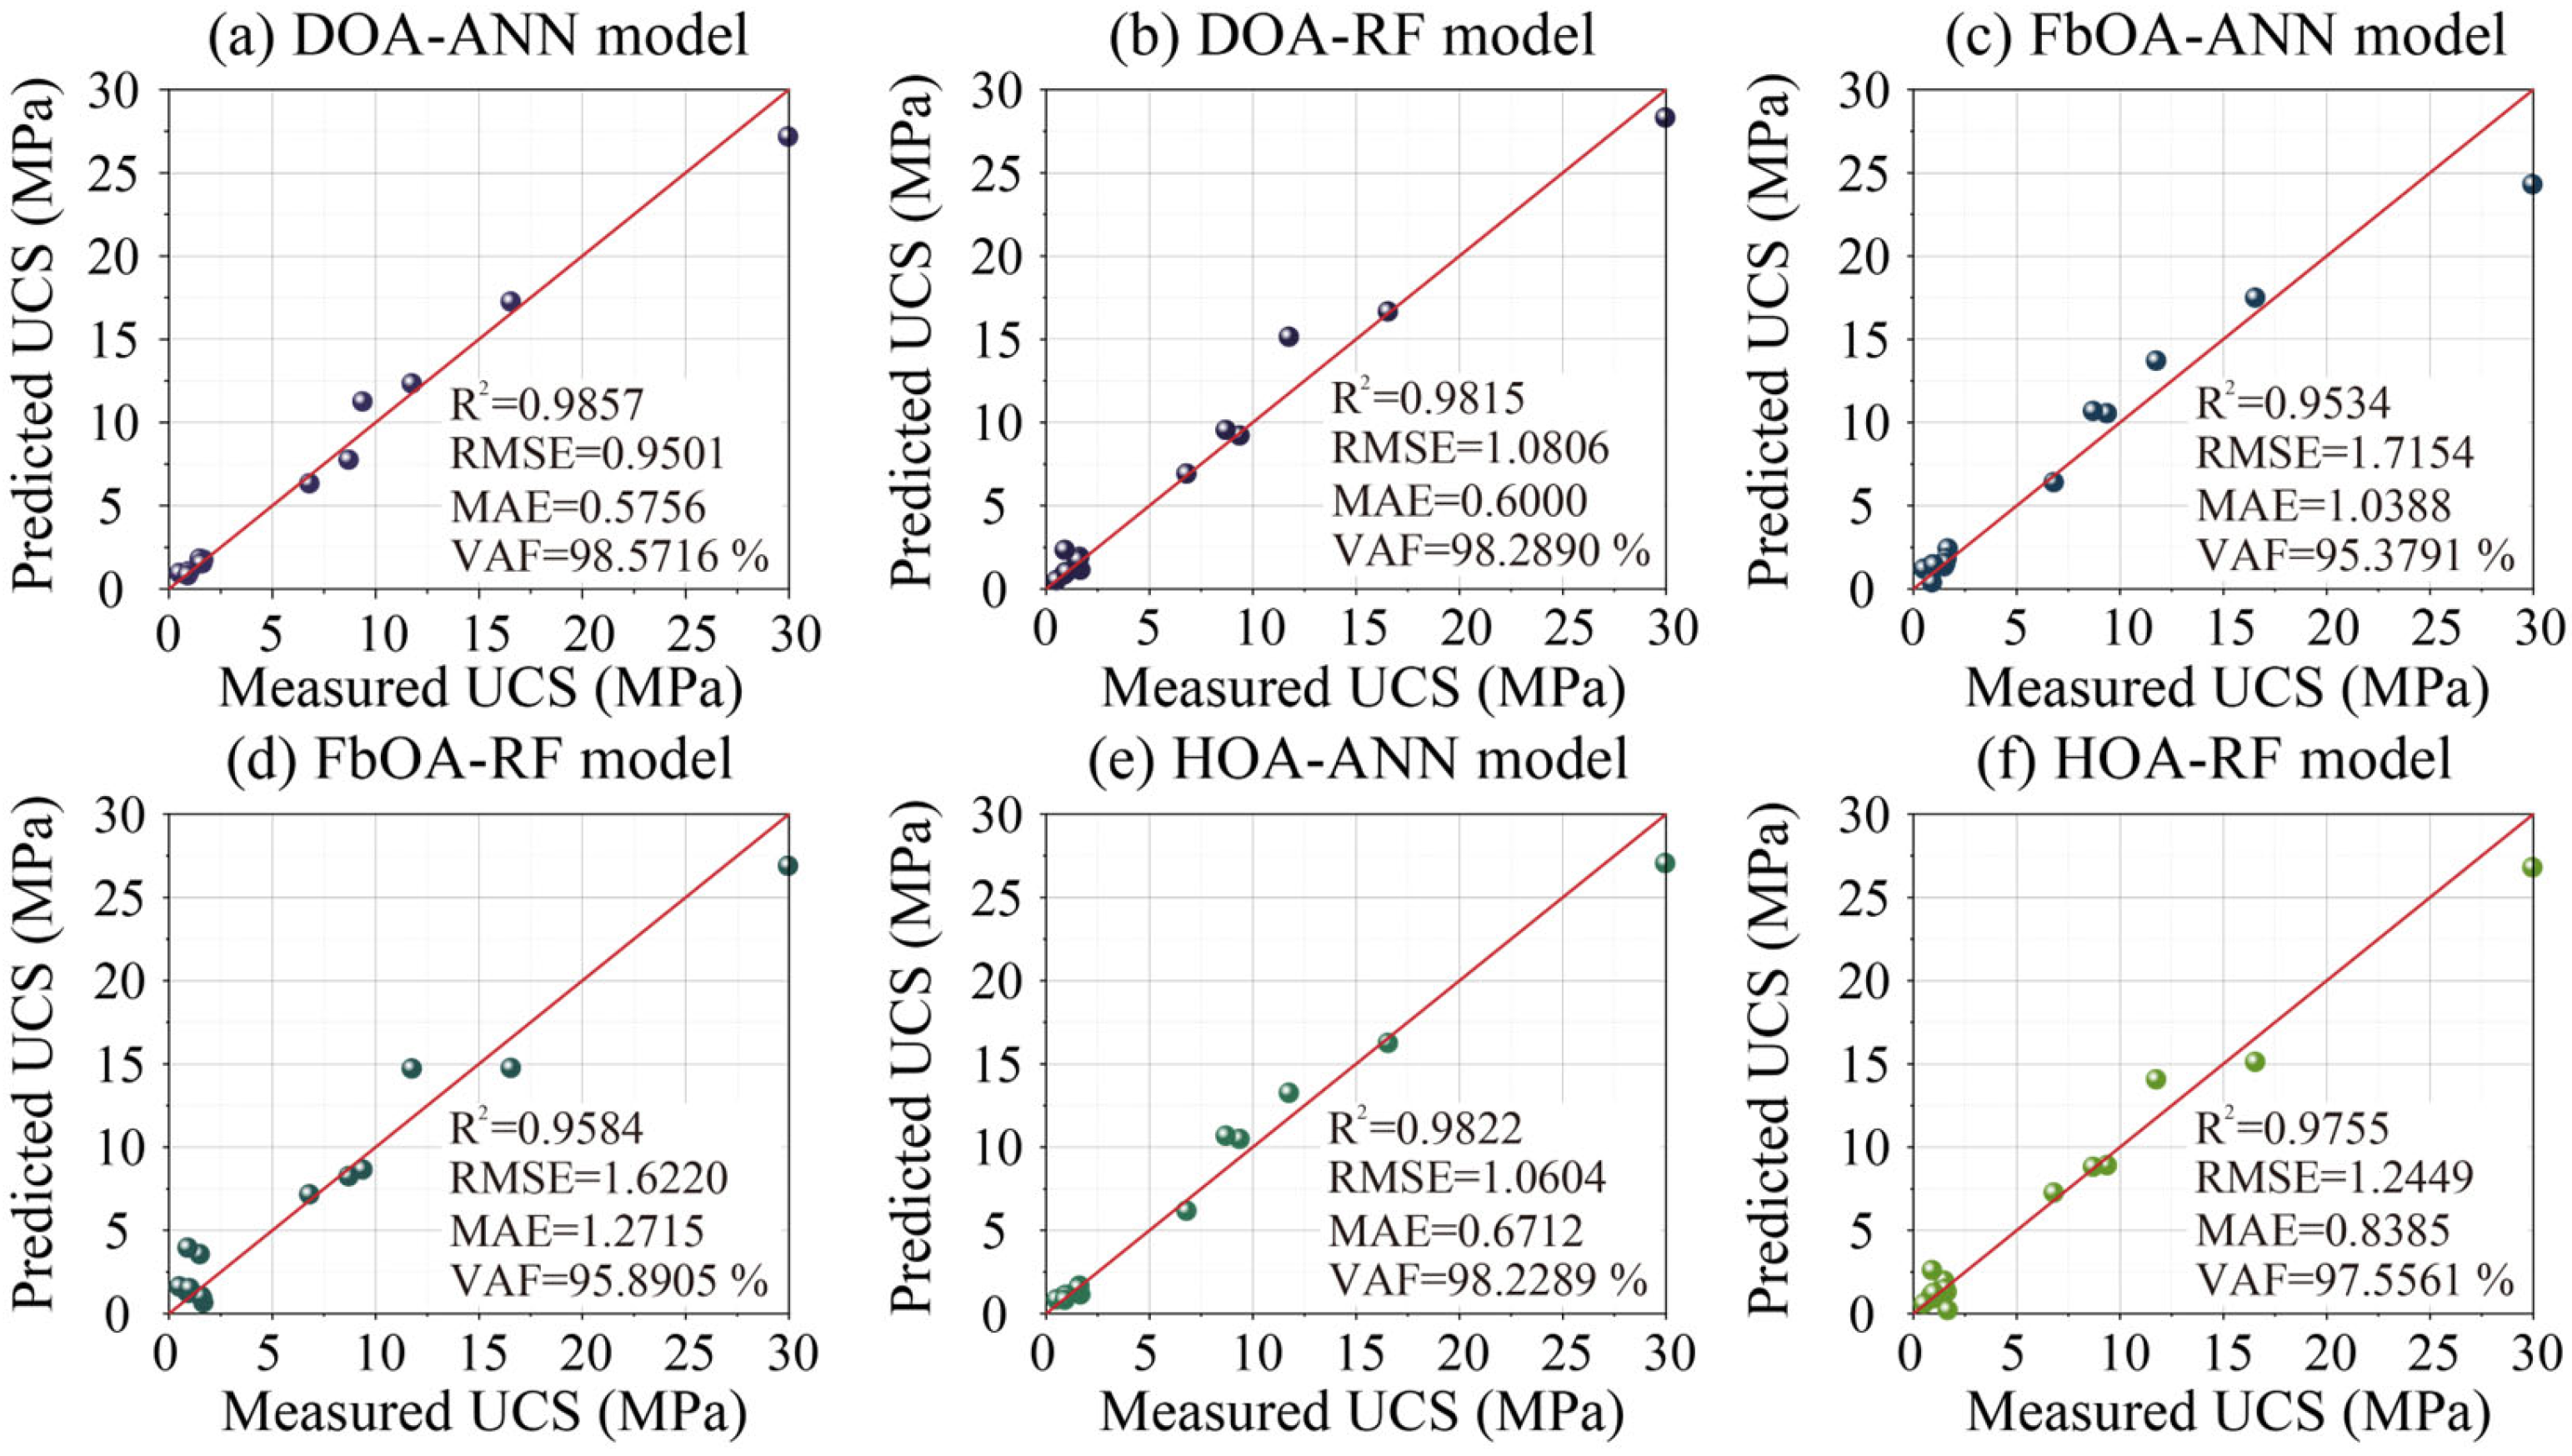
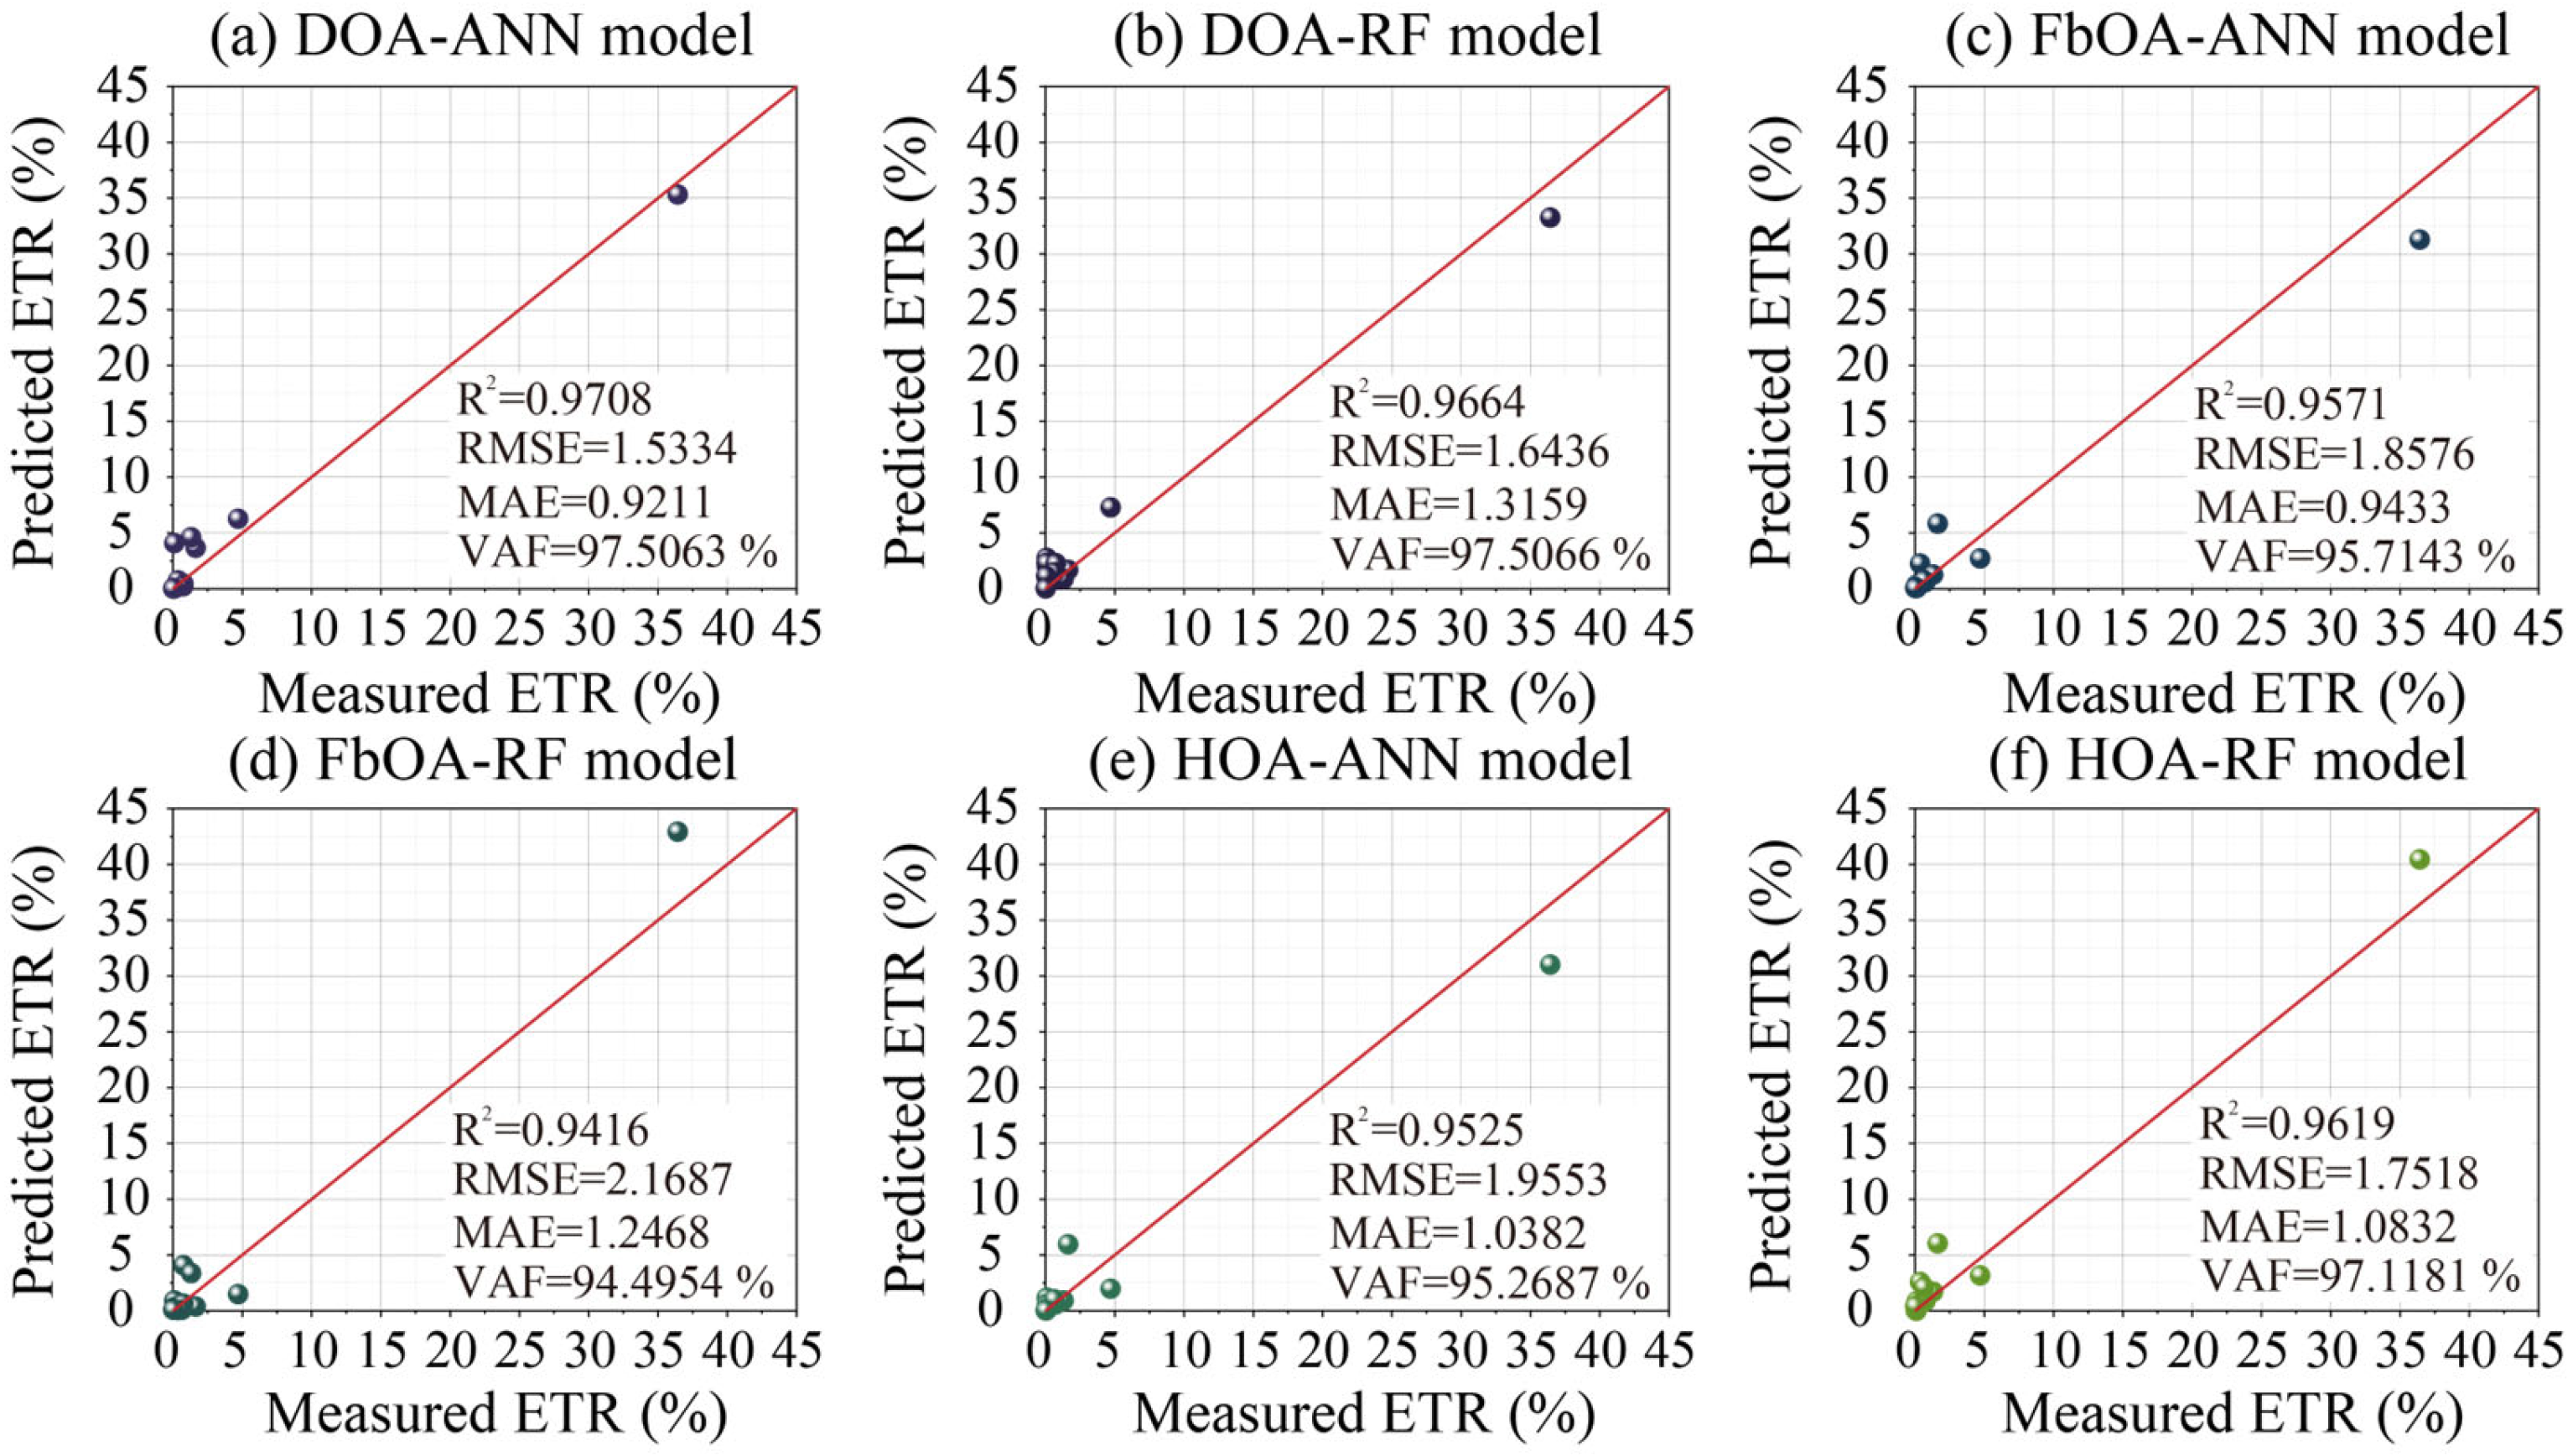
After determining the optimal hyperparameters of all developed models using the training set, the predictive performance of these models should be evaluated using test samples before being deployed for practical use. As mentioned in Section 4, four statistical indices are commonly used to initially compare the predictive performance between models. As illustrated in Table 5, for the concrete’ UCS prediction, the DOA-ANN model obtained the highest prediction accuracy, with R2 of 0.9857, RMSE of 0.9501, MAE of 0.5756, and VAF of 98.5716% among all models. Following this model, HOA-ANN, DOA-RF, and HOA-RF achieved higher predictive performance than other models, especially the FbOA-ANN model (R2 of 0.9534, RMSE of 1.7154, MAE of 1.0388, and VAF of 95.3791%). On the other hand, for the concrete’s ETR prediction, DOA-ANN also obtained a stronger performance than other models using the same database. This model obtained the highest values of R2 and VAF (0.9708 and 97.5063%) and the lowest values of RMSE and MAE (1.5334 and 0.9211) among all the models developed in this paper. In addition, except for the evaluation indices of DOA-RF and HOA-RF, which are both satisfactory and similar, the evaluation indices of other models are less favorable, especially the FbOA-RF model.
Additionally, Figure 8 and Figure 9 display the regression diagrams of each model in the UCS and ETR prediction tasks. In a diagram, the position of each data sample is determined by both the measured and predicted values. For instance, when the measured value is greater than the predicted value, the data sample is positioned in the lower-right area. Only when the measured and predicted values are close or equal do the corresponding data samples lie along the diagonal line or in its vicinity. Firstly, for UCS prediction samples in the middle value range, all models exhibit good predictive performance, with data points located near the diagonal line. However, for samples in other value ranges, only the DOA-ANN and HOA-ANN models show most data points near or along the diagonal line, particularly for low-value samples. In contrast, for high-value samples, the FbOA model demonstrates a noticeable prediction bias, causing the data points to shift away from the diagonal. On the other hand, in the ETR prediction, the predictive performance of all models is satisfactory, with data points concentrated near the diagonal line. For low-value samples, most models predict values higher than the measured values, causing the data points to be distributed above the diagonal line. For high-value samples, only the DOA-ANN model produces predictions close to the measured values, bringing the corresponding data points closer to the diagonal.
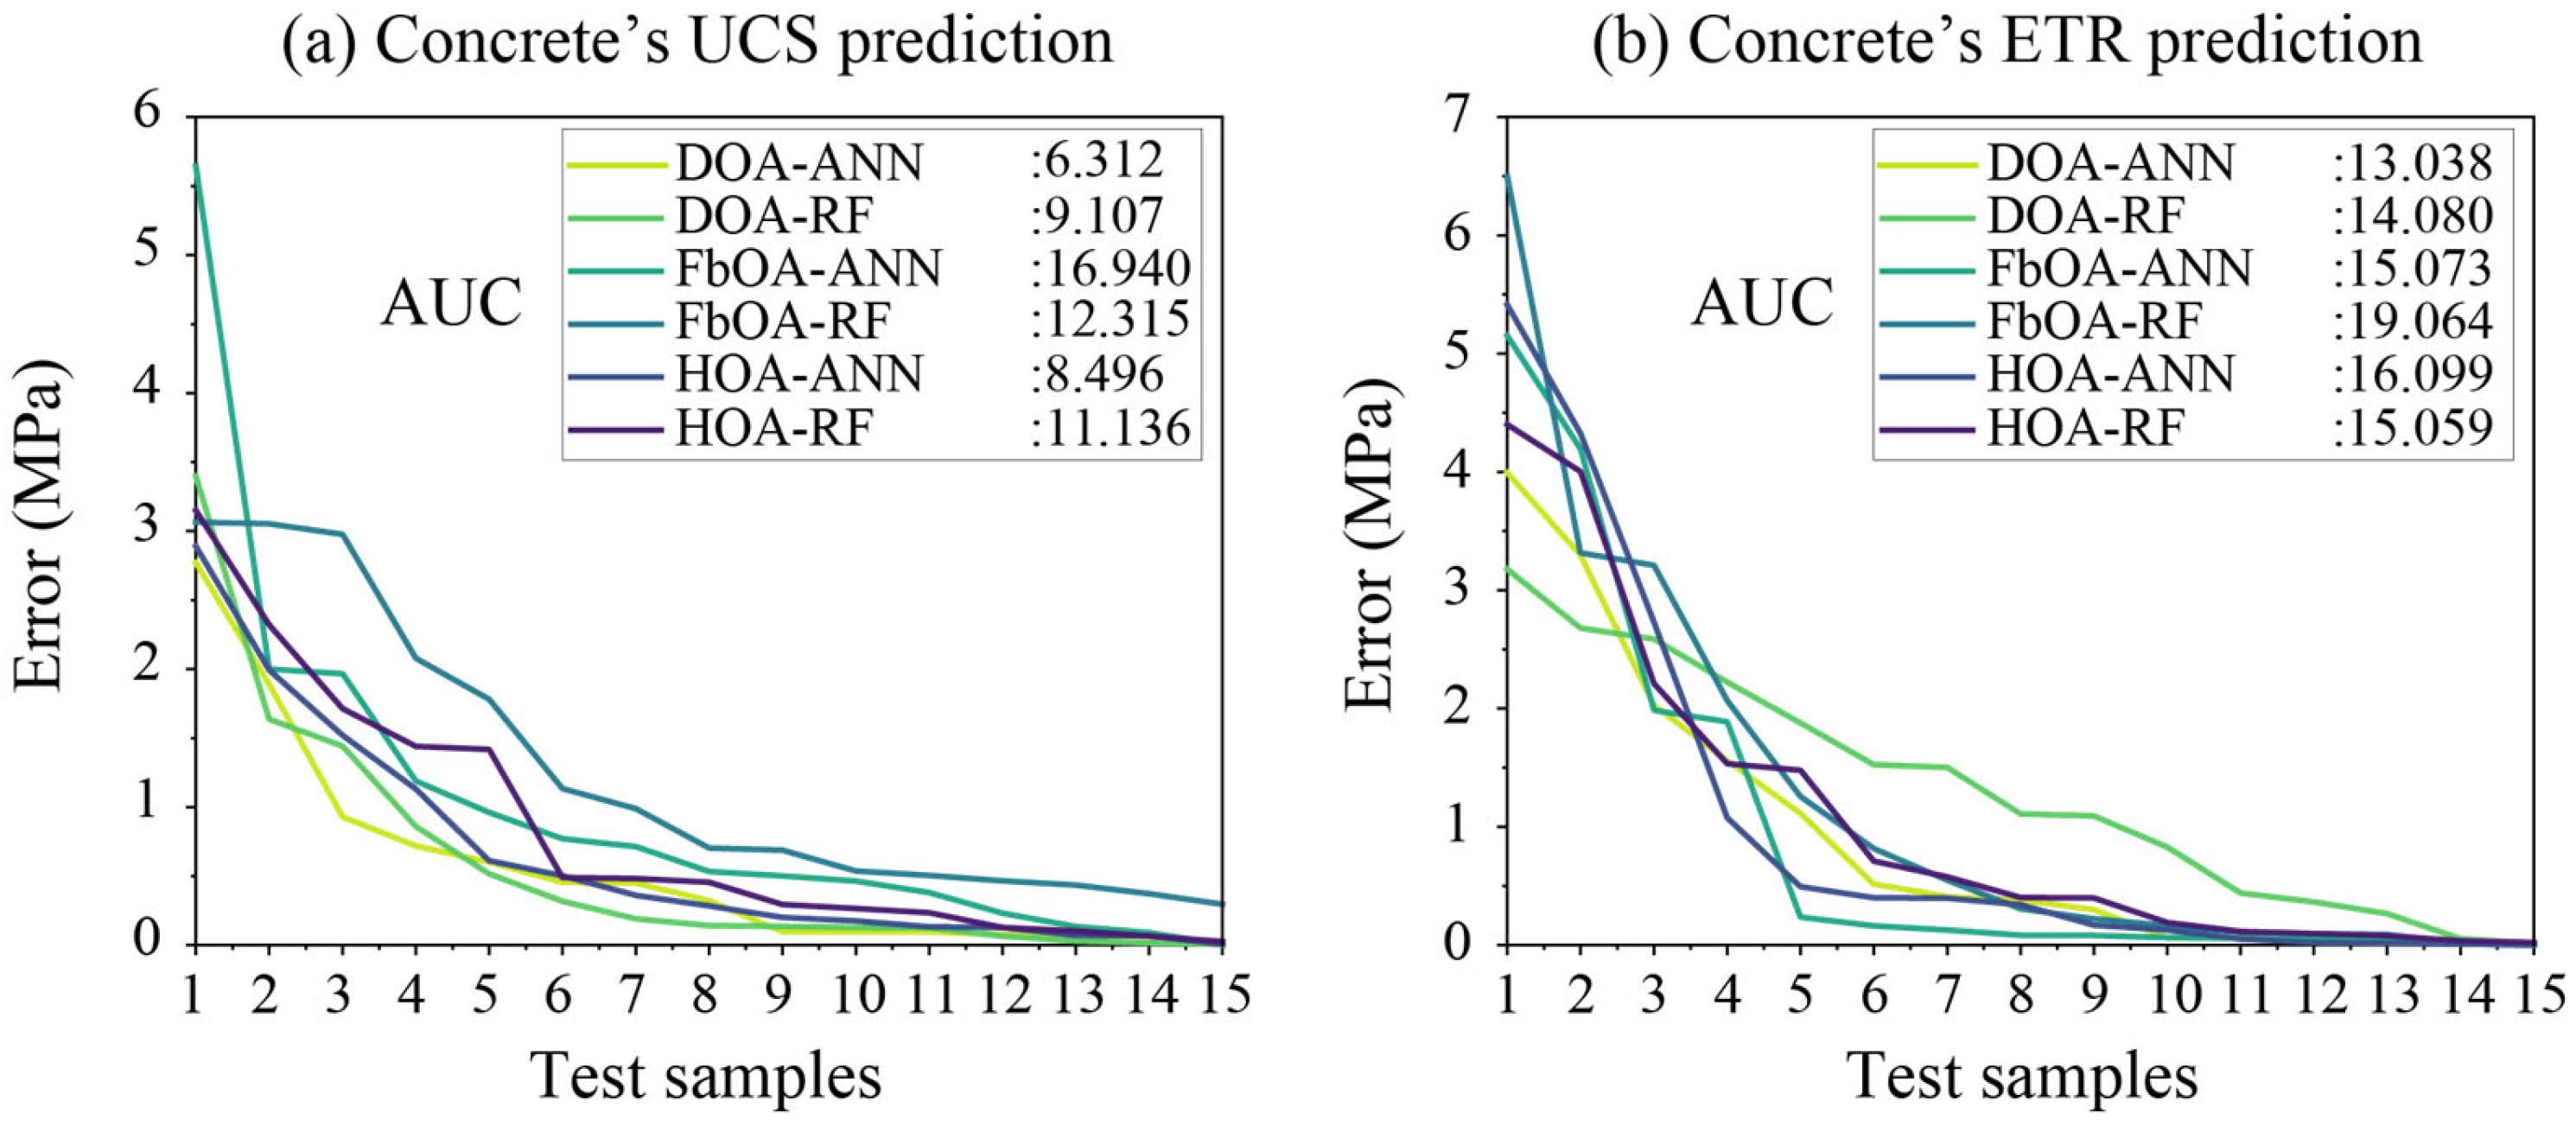
Furthermore, an error analysis was conducted to further evaluate the model performance for predicting concrete’s UCS and ETR. First, the errors between the measured and predicted values were statistically analyzed to generate error curves based on a descending order principle. Then, the area under the curve (AUC) values were calculated to determine the model’s performance. For a well-performing model, a low AUC value indicates that the model produces smaller prediction errors under the same data samples. As shown in Figure 10a, DOA-ANN obtained the lowest value of AUC (6.312) among all models using UCS’s test set. After this model, DOA-RF, HOA-ANN, and HOA-RF also obtained low AUC values, resulting in high prediction accuracy. Note that the FbOA-ANN model obtained the highest AUC value (16.940) caused by poor predictive performance. As shown in Figure 10b, the AUC values of all models were higher than those obtained in the UCS prediction, indicating that the models exhibit greater deviation when predicting ETR. Among all the models, the DOA-ANN model still performed the best, with the lowest AUC value (13.038). Based on the AUC values in ascending order, the performance ranking of the other models was as follows: DOA-RF, HOA-RF, FbOA-ANN, HOA-ANN, and FbOA-RF. In general, the DOA-ANN model was considered as the optimal model for predicting the concrete’s UCS and ETR performance among the six models developed in this paper.
To verify the advantage of the optimization algorithm employed in this study in improving prediction accuracy (i.e., selecting the optimal hyperparameters of models), an evaluation index (R2) was compared with those reported in previous studies. Table 6 presents the performance differences among these models. For instance, it is evident that the proposed model outperforms the gazelle optimization algorithm (GOA)-based RF model developed by Mei et al. [6] in the independent prediction of ETR. For the simultaneous prediction of both properties, the proposed model achieves comparable accuracy to that of Mei et al. [19] in UCS prediction, while exhibiting superior performance in ETR prediction. Given that the training sample sizes are similar, the observed performance improvement can be primarily attributed to the enhanced capability of the optimization algorithm. Therefore, the adoption of the DOA optimization algorithm has a positive effect on improving the overall predictive accuracy of the model.
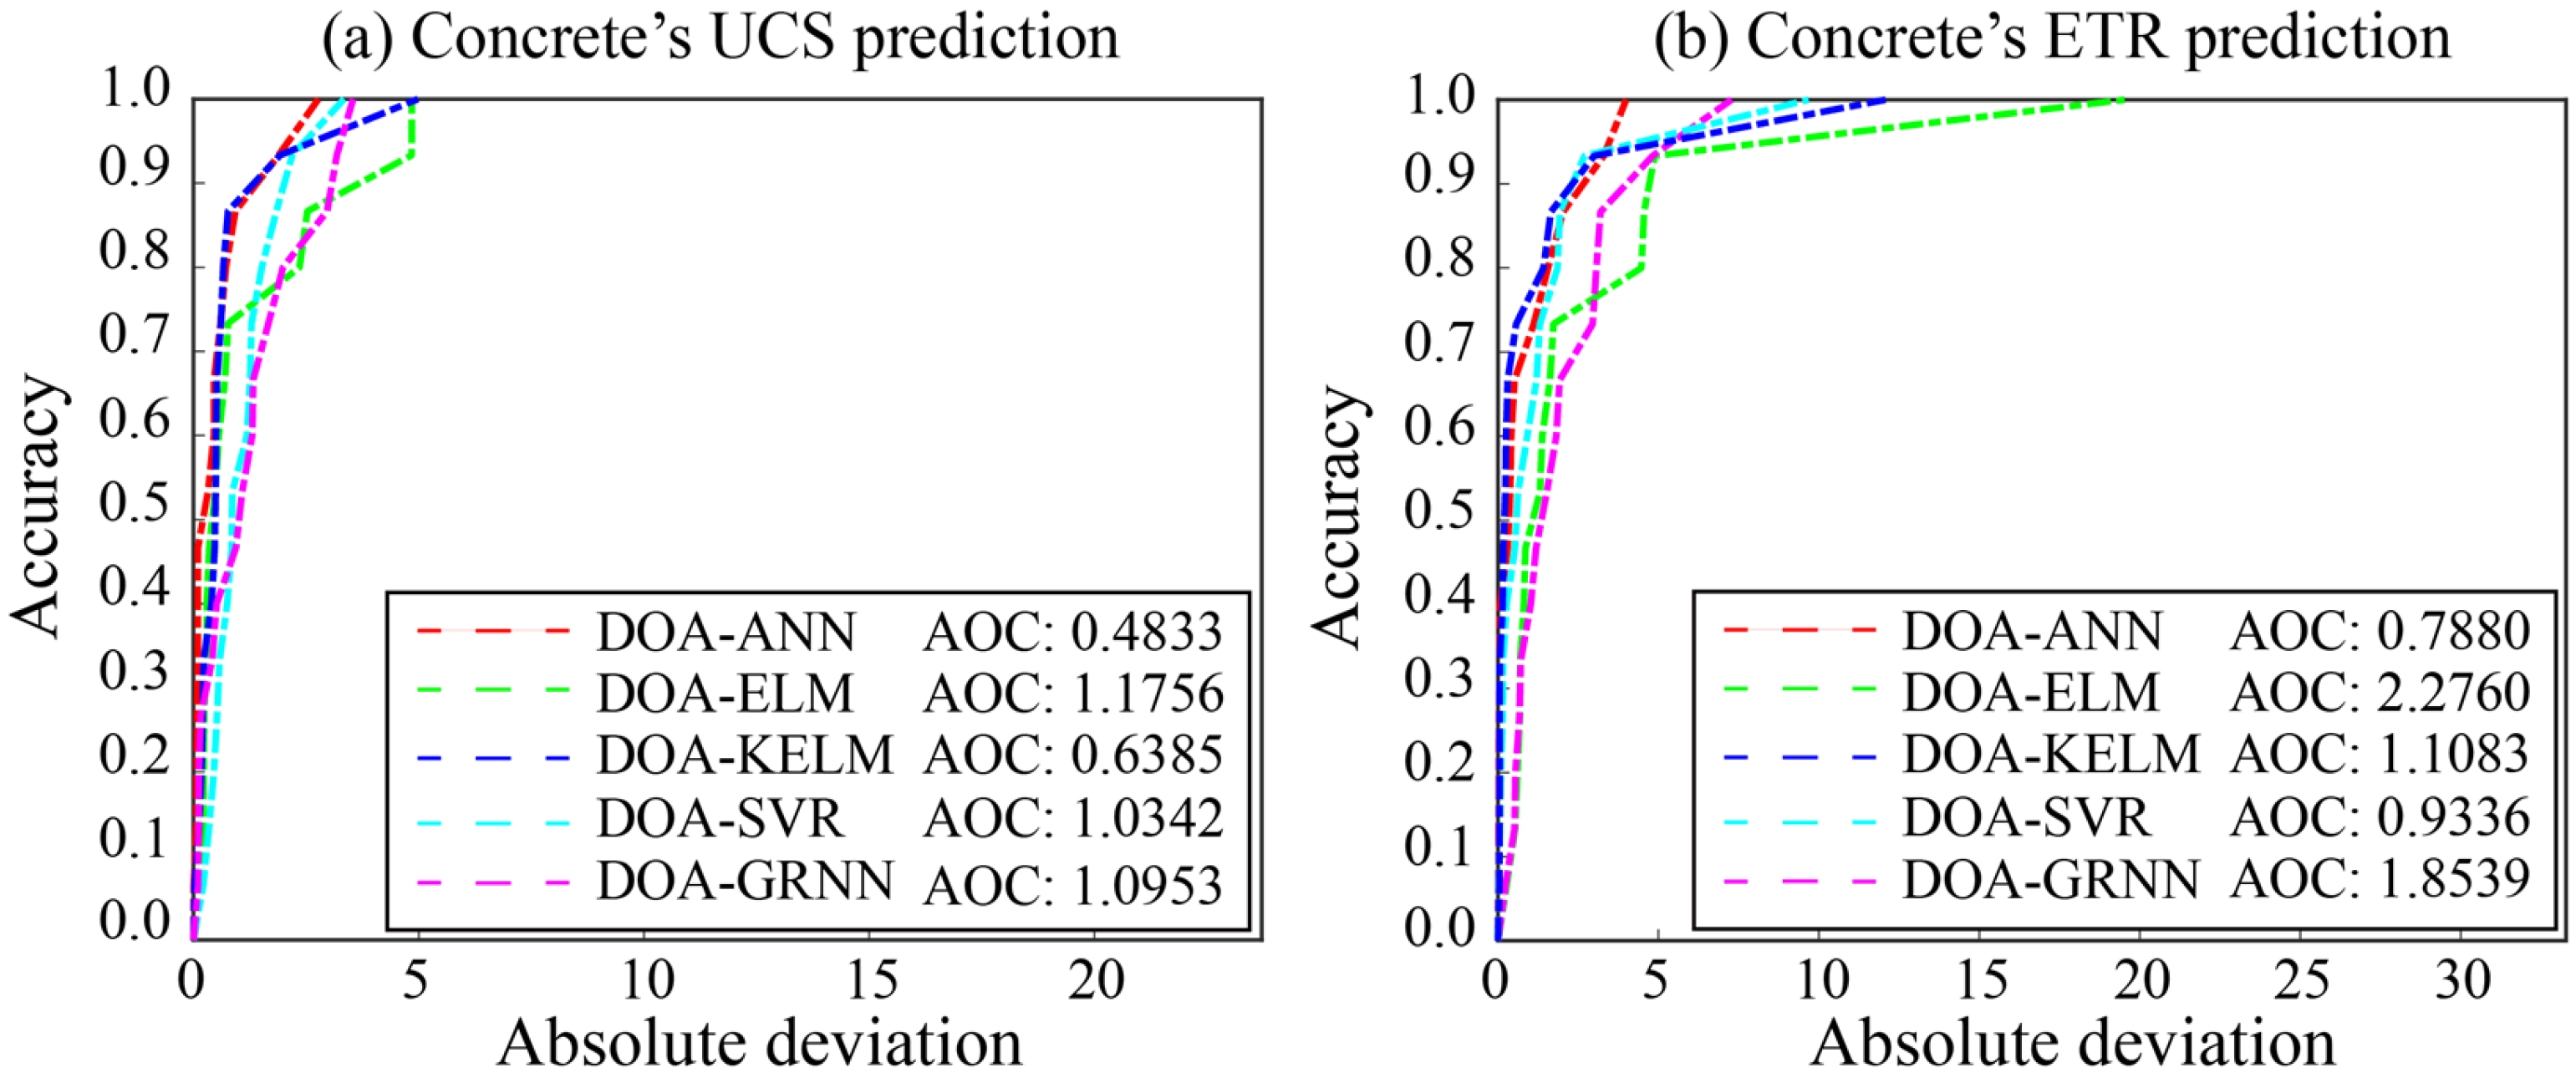
However, the performance differences between many commonly used ML models and the best model proposed in this study for UCS and ETR prediction have not been discussed. Therefore, four commonly used ML models (ELM, kernel-ELM (KELM), SVR, and generalized regression neural network (GRNN)) were introduced to predict the UCS and ETR. To ensure the validity of the performance comparison, the DOA was employed to select the optimal hyperparameter combinations for these models. Additionally, all model comparisons are conducted using the same test set samples. The calculated performance indices are shown in Table 7. It can be observed that both KELM and SVR demonstrate strong competitiveness in predicting UCS and ETR among the newly established four ML models. However, the performance of the ELM model was inferior to the others, despite its highest computational efficiency. In addition, the regression error characteristic (REC) curves based on accuracy and absolute deviation are employed to further determine the best model. For one of the curves, the area over the curve (AOC) corresponds to the model’s performance. This means that a smaller AUC indicates higher model accuracy and smaller absolute deviation. Based on the evaluation criteria, REC curves for the four newly established ML models and the proposed best model are generated in Figure 11. It can be observed that the AOC values of the established four ML models are greater than those of the proposed DOA-ANN model. The result means that the prediction performance of the proposed model is superior to that of the other ML models for predicting both concrete’s UCS and ETR.

5.3. Sensitivity Analysis

Although the best prediction model has been determined in performance evaluation, the importance of all input features for predicting the UCS and the ETR is unknown. Furthermore, understanding the contribution of each feature to the prediction target is beneficial for further explaining the model’s predictive mechanism. As shown in Figure 12a,b, the importance scores of all features used for predicting concrete’s UCS and ETR were calculated through the Shapley additive explanations (SHAP) analysis tool. It can be observed that specimen mass and cement were the most important features for predicting concrete’s UCS and ETR, respectively. In addition, the rubber content is also crucial for predicting UCS and ETR, with its importance score significantly higher than that of the other features. On the other hand, the contribution of each feature to the UCS and ETR’s prediction was demonstrated in Figure 12c,d, respectively. For the concrete’s UCS, rubber, rubber particle size, and specimen density contribute negatively to the prediction, while the remaining features are positively correlated with it. Moreover, cement has a positive contribution to the ETR prediction, while the correlation between rubber and ETR remains negative. In general, the SHAP results confirm that rubber content negatively impacts the UCS while positively contributing to the ETR, consistent with experimental observations in the literature. This trade-off arises from the inherent characteristics of rubber particles: their low modulus of elasticity reduces the overall matrix stiffness and bonding strength between the aggregate and cement paste, which lowers compressive strength. However, the same deformability and damping properties of rubber enhance energy dissipation under dynamic loading, increasing the energy transmission rate. Thus, the ML model’s prediction aligns with the established mechanical behavior of rubberized concrete, and the SHAP analysis provides interpretable confirmation of this trade-off.

5.4. Prediction Visual

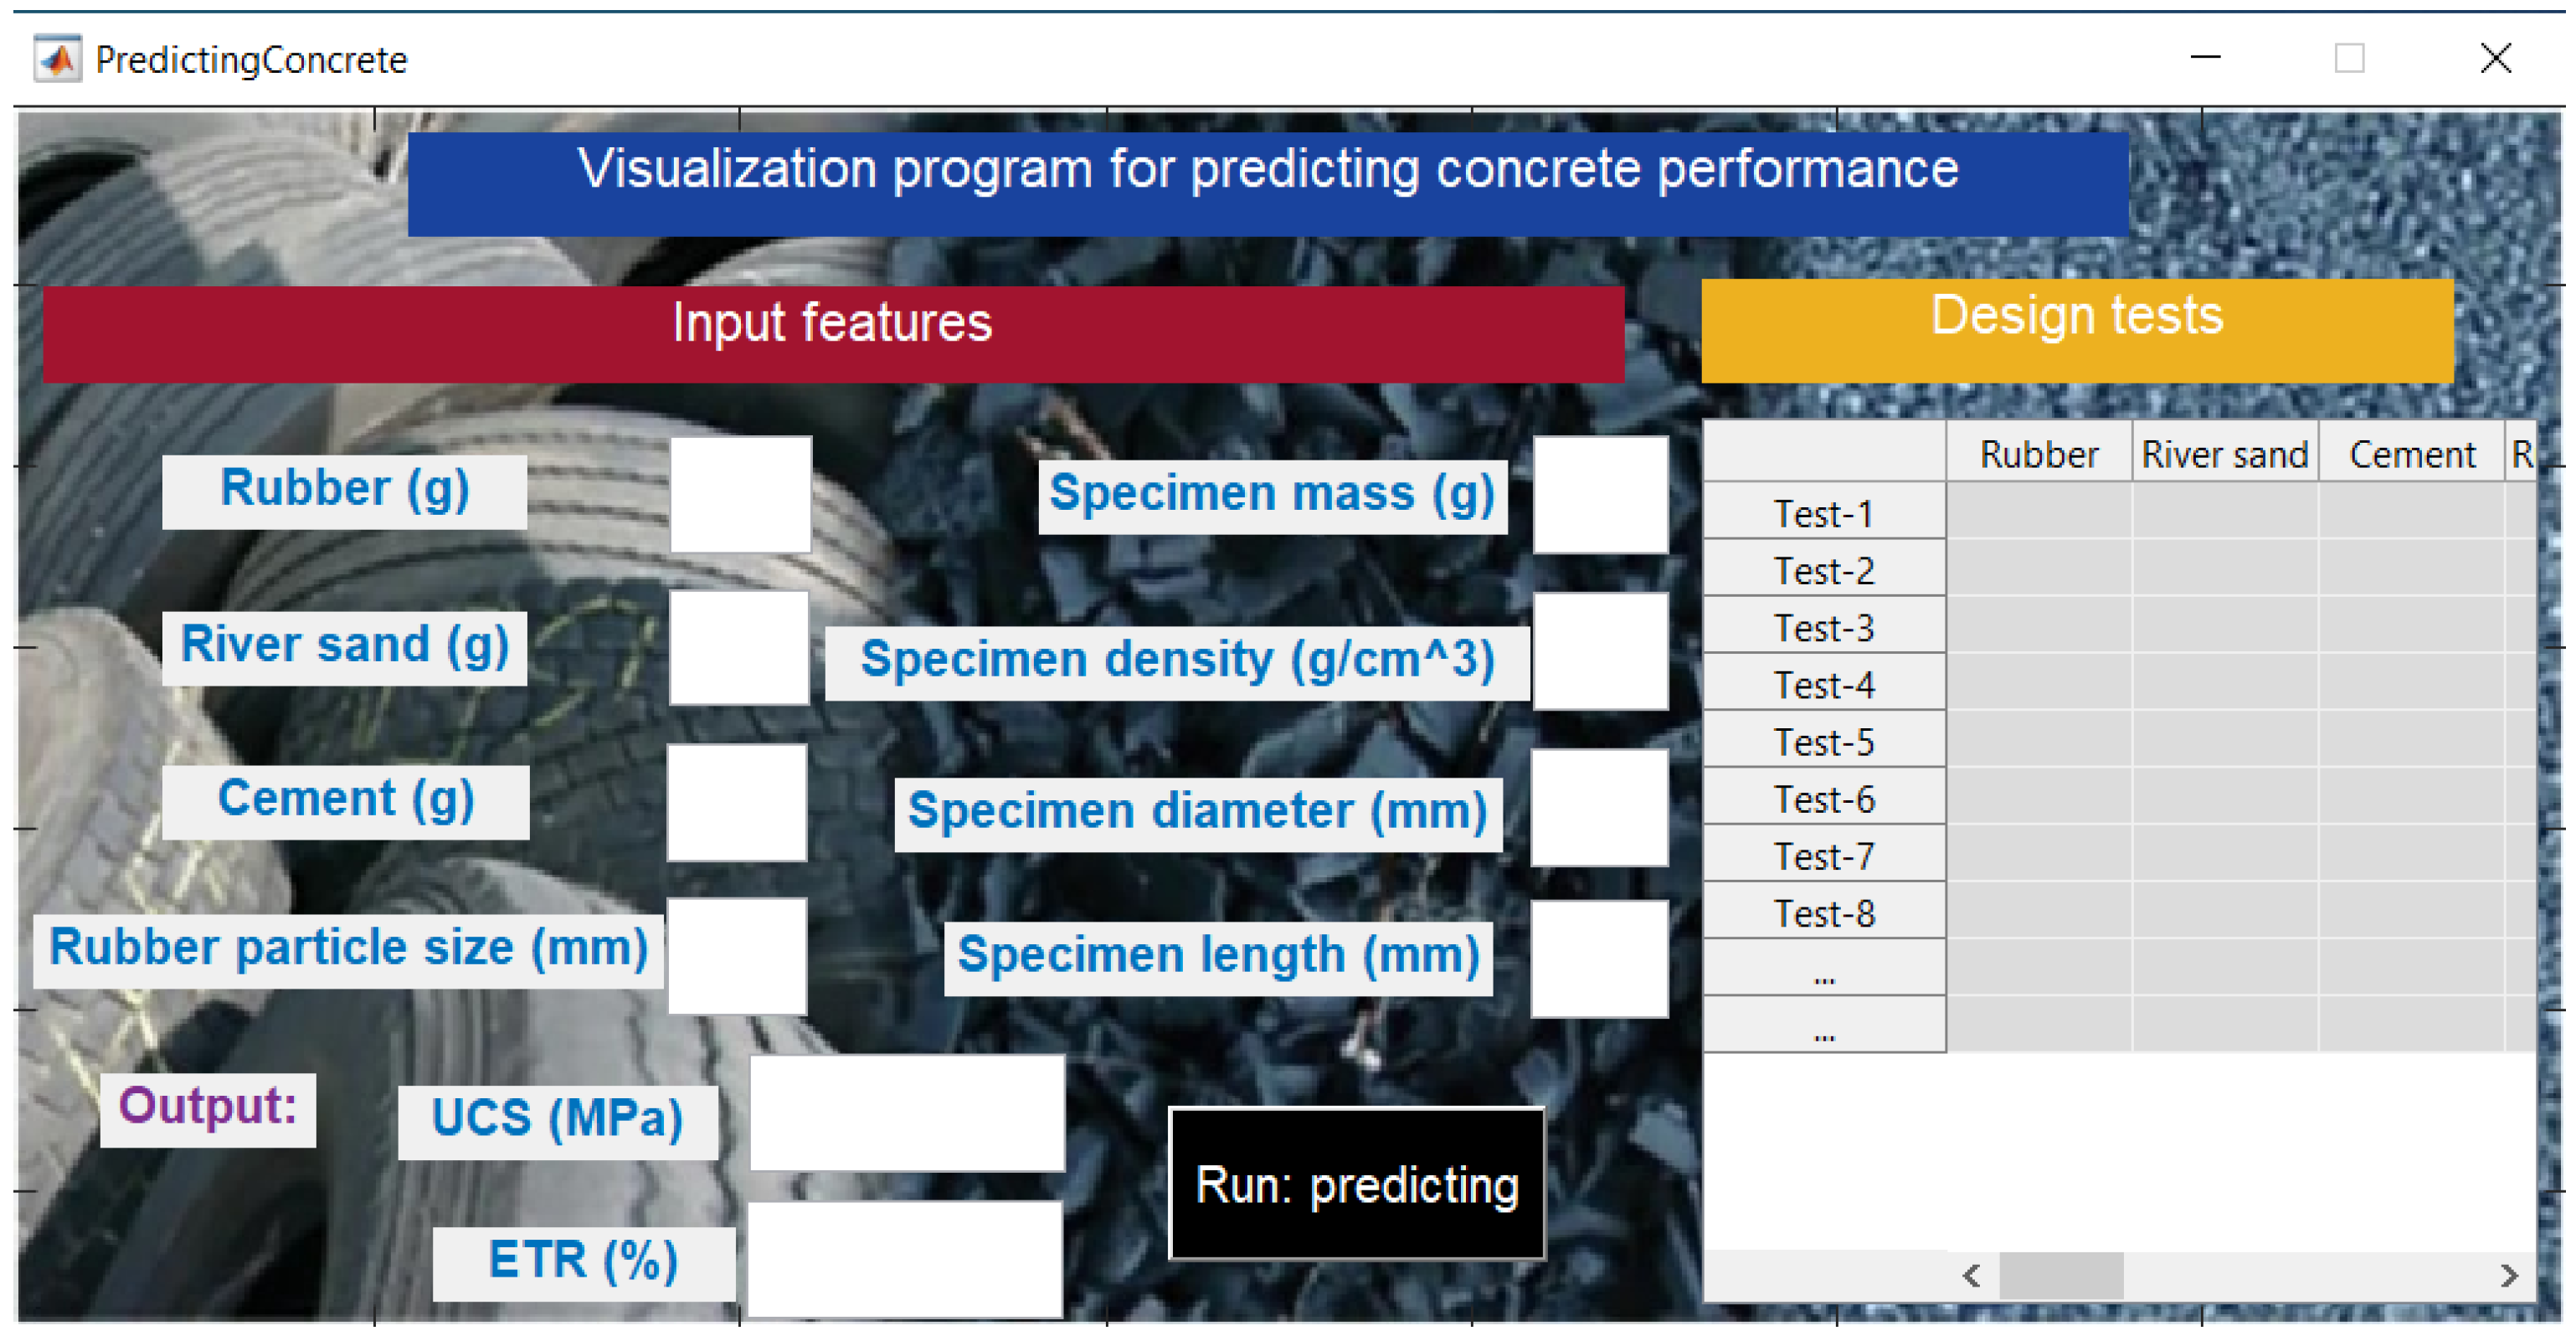
Based on the established high-accuracy prediction model and completed feature analysis, a visualization program has been developed to enable real-time prediction and rapid design of concrete performance. As shown in Figure 13, the program consists of an input feature module, performance output, and design testing module. Users can input known or unknown values for all features and then click ‘Run: predicting’ to directly obtain the output target value. The optimal DOA-ANN model used for predicting the target value was embedded in the program for convenient direct invocation. Subsequently, each run value is directly recorded in the design testing module for easy reference and verification by the user. To test the practicality of the proposed visualization program, two concrete samples (see Table 8) were selected for performance adjustment. However, the strength of No. 1 sample does not meet the engineering standards, while the high ETR value of No. 2 sample affects its stability under high-impact dynamic loading conditions. Table 9 shows the modified performance of these two concrete samples by adjusting values for main input features. For the No. 1 sample, reducing the rubber content and increasing the cement content can effectively enhance its strength. For No. 2 sample, although rubber and ETR are negatively correlated, it can be observed that increasing the rubber content does not significantly reduce the ETR value until the rubber content reaches 35 g. The overall time for the above tests is only a few seconds, which significantly improves design efficiency compared to traditional laboratory testing.

6. Conclusions

In summary, this work establishes a robust ML framework integrating ANN with metaheuristic optimization to simultaneously predict the strength and energy absorption performance of rubber-modified concrete. The results highlight the feasibility of intelligent modeling as an alternative to costly and time-consuming laboratory testing. The main conclusions are summarized as follows:
(1)
The DOA-ANN model achieved the best predictive capability for both UCS and ETR, surpassing other optimized ANN, RF, and benchmark ML models. These results indicate the ANN’s superior ability to capture nonlinear and coupled relationships between input variables and target properties compared with RF and other ML models. The model effectively balances generalization and precision, confirming its robustness in predicting both the material’s strength and energy absorption performance.
(2)
SHAP analysis revealed cement and specimen mass as dominant predictors for ETR and UCS, respectively, while rubber content significantly influenced both properties, demonstrating a trade-off between strength and energy absorption.
(3)
To enhance practical applicability, a visualization interface embedding the optimized DOA-ANN model was developed. This tool allows engineers to input mix parameters, instantly predict mechanical performance, and iteratively adjust designs in real time. The system bridges model computation with practical engineering design, significantly improving design efficiency and facilitating performance-driven mix proportioning for aseismic and sustainable concrete structures.
However, this study remains limited by the moderate dataset size, controlled laboratory conditions, and absence of field-scale validation, which may not fully represent material variability in real construction environments. Future work should therefore focus on (1) expanding datasets through multi-source experimental and field data collection, (2) integrating environmental and curing conditions into the model to enhance generalization, (3) conducting on-site and full-scale validation tests to assess robustness under real structural loading, and (4) deploying the visualization system within industry or construction workflows to evaluate its effectiveness as a decision-support platform. These steps will facilitate the transition from laboratory-scale modeling to practical implementation, advancing the application of intelligent material design in sustainable civil engineering.

Author Contributions

Conceptualization, C.L. and X.M.; methodology, C.L.; software, P.W.; validation, J.Z., C.L. and P.W.; formal analysis, P.W.; investigation, C.L.; writing—original draft preparation, C.L.; writing—review and editing, P.W.; visualization, J.Z.; supervision, X.M.; funding acquisition, J.Z. All authors have read and agreed to the published version of the manuscript.

Funding

The study reported here is financially supported by the National Natural Science Foundation of China (42177164) and Deep Earth Probe and Mineral Resources Exploration — National Science and Technology Major Project (2025ZD1010703).

Institutional Review Board Statement

Not applicable.

Informed Consent Statement

Not applicable.

Data Availability Statement

The data used in this article are confidential.

Conflicts of Interest

Author Pu Wang was employed by the China State Construction Engineering Corporation (CSCEC). The remaining authors declare that the research was conducted in the absence of any commercial or financial relationships that could be construed as a potential conflict of interest.

References

  1. Roy, N.; Sarkar, R. A review of seismic damage of mountain tunnels and probable failure mechanisms. Geotech. Geol. Eng. 2017, 35, 1–28. [Google Scholar] [CrossRef]
  2. Bird, J.F.; Bommer, J.J. Earthquake losses due to ground failure. Eng. Geol. 2004, 75, 147–179. [Google Scholar] [CrossRef]
  3. Lai, J.; He, S.; Qiu, J.; Chen, J.; Wang, L.; Wang, K.; Wang, J. Characteristics of seismic disasters and aseismic measures of tunnels in Wenchuan earthquake. Environ. Earth Sci. 2017, 76, 94. [Google Scholar] [CrossRef]
  4. Saad, A.G.; Sakr, M.A.; Khalifa, T.M.; Darwish, E.A. Structural performance of concrete reinforced with crumb rubber: A review of current research. Iran. J. Sci. Technol. Trans. Civ. Eng. 2025, 49, 3211–3254. [Google Scholar] [CrossRef]
  5. Mei, X.C.; Ding, C.D.; Zhang, J.M.; Li, C.Q.; Cui, Z.; Sheng, Q.; Chen, J. Application of optimized random forest regressors in predicting maximum principal stress of aseismic tunnel lining. J. Cent. South Univ. 2024, 31, 3900–3913. [Google Scholar] [CrossRef]
  6. Mei, X.; Li, J.; Zhang, J.; Cui, Z.; Zhou, J.; Li, C. Predicting energy absorption characteristic of rubber concrete materials. Constr. Build. Mater. 2025, 465, 140248. [Google Scholar] [CrossRef]
  7. Sathiparan, N.; Jeyananthan, P. Predicting compressive strength of cement-stabilized earth blocks using machine learning models incorporating cement content, ultrasonic pulse velocity, and electrical resistivity. Nondestruct. Test. Eval. 2024, 39, 1045–1069. [Google Scholar] [CrossRef]
  8. Khan, M.M.; Iqbal, M.A. Dynamic increase factor of concrete subjected to compression and tension by using split Hopkinson pressure bar setup: Overview. Mech. Solids 2023, 58, 2115–2131. [Google Scholar] [CrossRef]
  9. Hussain, A.; Sakhaei, A.H.; Shafiee, M. Machine learning-based constitutive modelling for material non-linearity: A review. Mech. Adv. Mater. Struct. 2024, 1–19. [Google Scholar] [CrossRef]
  10. Hong, Y.; Hou, B.; Jiang, H.; Zhang, J. Machine learning and artificial neural network accelerated computational discoveries in materials science. Wiley Interdiscip. Rev. Comput. Mol. Sci. 2020, 10, e1450. [Google Scholar] [CrossRef]
  11. Garg, A.; Zheng, W.; Raman, R.; Li, L. Machine Learning in Functionally Graded Materials and Nano FGMs: A Comprehensive Review of Predictive Modeling for Mechanical Behavior. Arch. Comput. Methods Eng. 2025, 1–43. [Google Scholar] [CrossRef]
  12. Khawaja, L.; Asif, U.; Onyelowe, K.; Al Asmari, A.F.; Khan, D.; Javed, M.F.; Alabduljabbar, H. Development of machine learning models for forecasting the strength of resilient modulus of subgrade soil: Genetic and artificial neural network approaches. Sci. Rep. 2024, 14, 18244. [Google Scholar] [CrossRef] [PubMed]
  13. Atici, U. Prediction of the strength of mineral admixture concrete using multivariable regression analysis and an artificial neural network. Expert Syst. Appl. 2011, 38, 9609–9618. [Google Scholar] [CrossRef]
  14. Kostić, S.; Vasović, D. Prediction model for compressive strength of basic concrete mixture using artificial neural networks. Neural Comput. Appl. 2015, 26, 1005–1024. [Google Scholar] [CrossRef]
  15. Zhao, Y.; Hu, H.; Song, C.; Wang, Z. Predicting compressive strength of manufactured-sand concrete using conventional and metaheuristic-tuned artificial neural network. Measurement 2022, 194, 110993. [Google Scholar] [CrossRef]
  16. Dadashi, F.; Naderpour, H.; Mirrashid, M. Mechanical Property Prediction in Silica Fume and Crumb Rubber–Modified Concrete: Soft Computing and Experimental Approach. Pract. Period. Struct. Des. Constr. 2024, 29, 04024049. [Google Scholar] [CrossRef]
  17. Feng, W.; Wang, Y.; Sun, J.; Tang, Y.; Wu, D.; Jiang, Z.; Wang, J.; Wang, X. Prediction of thermo-mechanical properties of rubber-modified recycled aggregate concrete. Constr. Build. Mater. 2022, 318, 125970. [Google Scholar] [CrossRef]
  18. Mei, X.; Li, C.; Sheng, Q.; Cui, Z.; Zhou, J.; Dias, D. Development of a hybrid artificial intelligence model to predict the uniaxial compressive strength of a new aseismic layer made of rubber-sand concrete. Mech. Adv. Mater. Struct. 2023, 30, 2185–2202. [Google Scholar] [CrossRef]
  19. Mei, X.; Cui, Z.; Sheng, Q.; Zhou, J.; Li, C. Application of the improved POA-RF model in predicting the strength and energy absorption property of a novel aseismic rubber-concrete material. Materials 2023, 16, 1286. [Google Scholar] [CrossRef]
  20. Nematzadeh, S.; Kiani, F.; Torkamanian-Afshar, M.; Aydin, N. Tuning hyperparameters of machine learning algorithms and deep neural networks using metaheuristics: A bioinformatics study on biomedical and biological cases. Comput. Biol. Chem. 2022, 97, 107619. [Google Scholar] [CrossRef]
  21. Akay, B.; Karaboga, D.; Akay, R. A comprehensive survey on optimizing deep learning models by metaheuristics. Artif. Intell. Rev. 2022, 55, 829–894. [Google Scholar] [CrossRef]
  22. Bacanin, N.; Bezdan, T.; Tuba, E.; Strumberger, I.; Tuba, M. Optimizing convolutional neural network hyperparameters by enhanced swarm intelligence metaheuristics. Algorithms 2020, 13, 67. [Google Scholar] [CrossRef]
  23. Abiodun, O.I.; Jantan, A.; Omolara, A.E.; Dada, K.V.; Mohamed, N.A.; Arshad, H. State-of-the-art in artificial neural network applications: A survey. Heliyon 2018, 4, e00938. [Google Scholar] [CrossRef] [PubMed]
  24. Abiodun, O.I.; Jantan, A.; Omolara, A.E.; Dada, K.V.; Umar, A.M.; Linus, O.U.; Arshad, H.; Kazaure, A.A.; Gana, U.; Kiru, M.U. Comprehensive review of artificial neural network applications to pattern recognition. IEEE Access 2019, 7, 158820–158846. [Google Scholar] [CrossRef]
  25. Badini, S.; Regondi, S.; Pugliese, R. Unleashing the power of artificial intelligence in materials design. Materials 2023, 16, 5927. [Google Scholar] [CrossRef]
  26. Ng, W.L.; Goh, G.L.; Goh, G.D.; Ten, J.S.J.; Yeong, W.Y. Progress and opportunities for machine learning in materials and processes of additive manufacturing. Adv. Mater. 2024, 36, 2310006. [Google Scholar] [CrossRef]
  27. Salman, H.A.; Kalakech, A.; Steiti, A. Random forest algorithm overview. Babylon. J. Mach. Learn. 2024, 2024, 69–79. [Google Scholar] [CrossRef]
  28. Halabaku, E.; Bytyçi, E. Overfitting in Machine Learning: A Comparative Analysis of Decision Trees and Random Forests. Intell. Autom. Soft Comput. 2024, 39, 987–1006. [Google Scholar] [CrossRef]
  29. Lang, Y.; Gao, Y. Dream Optimization Algorithm (DOA): A novel metaheuristic optimization algorithm inspired by human dreams and its applications to real-world engineering problems. Comput. Methods Appl. Mech. Eng. 2025, 436, 117718. [Google Scholar] [CrossRef]
  30. El-Kenawy, E.S.M.; Rizk, F.H.; Zaki, A.M.; Mohamed, M.E.; Ibrahim, A.; Abdelhamid, A.A.; Khodadadi, N.; Almetwally, E.M.; Eid, M.M. Football optimization algorithm (FbOA): A novel metaheuristic inspired by team strategy dynamics. J. Artif. Intell. Metaheuristics 2024, 8, 21–38. [Google Scholar] [CrossRef]
  31. Oladejo, S.O.; Ekwe, S.O.; Mirjalili, S. The Hiking Optimization Algorithm: A novel human-based metaheuristic approach. Knowl.-Based Syst. 2024, 296, 111880. [Google Scholar] [CrossRef]
  32. Ahmad, W.; Ahmad, A.; Ostrowski, K.A.; Aslam, F.; Joyklad, P.; Zajdel, P. Application of advanced machine learning approaches to predict the compressive strength of concrete containing supplementary cementitious materials. Materials 2021, 14, 5762. [Google Scholar] [CrossRef]
  33. Huynh, A.T.; Nguyen, Q.D.; Xuan, Q.L.; Magee, B.; Chung, T.; Tran, K.T.; Nguyen, K.T. A machine learning-assisted numerical predictor for compressive strength of geopolymer concrete based on experimental data and sensitivity analysis. Appl. Sci. 2020, 10, 7726. [Google Scholar] [CrossRef]
  34. Dai, L.; Zhao, X.; Pan, Y.; Luo, H.; Gao, Y.; Wang, A.; Ding, L.; Li, P. Microseismic criterion for dynamic risk assessment and warning of roadway rockburst induced by coal mine seismicity. Eng. Geol. 2025, 357, 108324. [Google Scholar] [CrossRef]
  35. Du, K.; Yang, C.; Su, R.; Tao, M.; Wang, S. Failure properties of cubic granite, marble, and sandstone specimens under true triaxial stress. Int. J. Rock Mech. Min. Sci. 2020, 130, 104309. [Google Scholar] [CrossRef]
  36. Shang, M.; Li, H.; Ahmad, A.; Ahmad, W.; Ostrowski, K.A.; Aslam, F.; Joyklad, P.; Majka, T.M.; Majka, T.M. Predicting the mechanical properties of RCA-based concrete using supervised machine learning algorithms. Materials 2022, 15, 647. [Google Scholar] [CrossRef] [PubMed]
  37. Song, Y.; Zhao, J.; Ostrowski, K.A.; Javed, M.F.; Ahmad, A.; Khan, M.I.; Aslam, F.; Kinasz, R.; Kinasz, R. Prediction of compressive strength of fly-ash-based concrete using ensemble and non-ensemble supervised machine-learning approaches. Appl. Sci. 2021, 12, 361. [Google Scholar] [CrossRef]
  38. Vargas, J.F.; Oviedo, A.I.; Ortega, N.A.; Orozco, E.; Gómez, A.; Londoño, J.M. Machine-learning-based predictive models for compressive strength, flexural strength, and slump of concrete. Appl. Sci. 2024, 14, 4426. [Google Scholar] [CrossRef]
  39. Al-Kahtani, M.S.M.; Zhu, H.; Ibrahim, Y.E.; Haruna, S.I.; Al-Qahtani, S.S.M. Study on the mechanical properties of polyurethane-cement mortar containing nanosilica: RSM and machine learning approach. Appl. Sci. 2023, 13, 13348. [Google Scholar] [CrossRef]
  40. Jing, W.; Yin, S.; Li, J. Using a machine learning method with novel optimization algorithms in estimating compressive strength rates in ultra-high performance concrete. Int. J. Knowl. -Based Intell. Eng. Syst. 2025, 29, 171–187. [Google Scholar] [CrossRef]
Figure 1. Experimental setup and specimen preparation for measurements of concrete’s UCS and ETR.
Applsci 15 11680 g001
Figure 2. The demonstration of feature selection: (a) for UCS prediction and (b) for ETR prediction.
Applsci 15 11680 g002
Figure 3. The common structure of the ANN model in the regression problem.
Applsci 15 11680 g003
Figure 4. The prediction framework of RF model in the regression task.
Applsci 15 11680 g004
Figure 5. The framework of predicting UCS and ETR of rubber-modified concrete via machine learning and metaheuristic optimization.
Applsci 15 11680 g005
Figure 6. Iteration curves of the proposed models for predicting rubber-modified concrete’s UCS.
Applsci 15 11680 g006
Figure 7. Iteration curves of the proposed models for predicting rubber-modified concrete’s ETR.
Applsci 15 11680 g007
Figure 8. The regression diagrams of the proposed models for predicting UCS in testing phase.
Applsci 15 11680 g008
Figure 9. The regression diagrams of the proposed models for predicting ETR in testing phase.
Applsci 15 11680 g009
Figure 10. Error analysis for the proposed models for predicting UCS and ETR of rubber-modified concrete.
Applsci 15 11680 g010
Figure 11. Performance comparison between the proposed and common ML models using AOC.
Applsci 15 11680 g011
Figure 12. Influence of features on concrete performance: (a) Importance scores of features for predicting UCS; (b) Importance scores of features for predicting ETR; (c) SHAP values of features for predicting UCS; (d) SHAP values of features for predicting ETR.
Applsci 15 11680 g012
Figure 13. Visual operation interface for rubber-modified concrete performance prediction.
Applsci 15 11680 g013
Table 1. The detailed description of all considered parameters for the UCS prediction.
VariablesSignUnitMinMaxMeanMedianSt. D
RubberRug0.00106.5060.6865.5525.65
River sandRSg0.00249.0096.5274.9061.58
CementCeg54.00235.80128.25129.7547.18
Rubber particle sizeRPSmm0.161.500.550.380.49
Specimen massMg169.50415.00285.46279.5067.95
Specimen densityrg/cm30.9350.5913.831.6421.32
Specimen diameterDmm49.1750.5950.1150.150.29
Specimen lengthLmm95.57102.6798.9799.151.26
Uniaxial compressive strengthUCSMPa0.5031.106.434.396.54
Table 2. The detailed description of all considered parameters for the ETR prediction.
VariablesSignUnitMinMaxMeanMedianSt. D
RubberRug0.0048.0628.8830.6612.19
River sandRSg0.00120.9045.9536.7829.24
CementCeg24.36109.1461.0260.4022.31
Rubber particle sizeRPSmm0.161.500.550.380.49
Specimen massMg78.70201.50135.86137.9032.22
Specimen densityrg/cm30.892.151.451.460.33
Specimen diameterDmm48.4749.9849.4449.410.31
Specimen lengthLmm46.2850.1548.6348.830.80
Energy transmission rateETR%0.0036.431.890.135.59
Table 3. The fitness results of the proposed models for predicting UCS.
PopulationFitness (RMSE)
UCS
DOA-ANNDOA-RFFbOA-ANNFbOA-RFHOA-ANNHOA-RF
250.17010.13350.15130.16410.17010.1335
500.15800.16460.15390.15640.15800.1646
750.16920.16600.18220.18230.16920.1660
1000.17100.17080.15860.17540.17100.1708
Best hyperparameters combination
Nh2/2/1/
Nn4; 2/4; 3/5/
Nt/58/49/52
Md/1/1/1
Table 4. The fitness results of the proposed models for predicting ETR.
PopulationFitness (RMSE)
ETR
DOA-ANNDOA-RFFbOA-ANNFbOA-RFHOA-ANNHOA-RF
250.19760.18340.16820.17010.19760.1834
500.20170.18070.19730.20810.20170.1807
750.23970.24410.23510.25500.23970.2441
1000.31520.30520.30010.30700.31520.3052
Best hyperparameters combination
Nh2/1/1/
Nn4; 2/6/4/
Nt/44/37/49
Md/1/7/1
Table 5. The performance indices of the proposed models for predicting UCS and ETR.
ModelsUCS prediction
R2RMSEMAEVAF (%)
DOA-ANN0.98570.95010.575698.5716
DOA-RF0.98151.08060.600098.2890
FbOA-ANN0.95341.71541.038895.3791
FbOA-RF0.95841.62201.271595.8905
HOA-ANN0.98221.06040.671298.2289
HOA-RF0.97551.24490.838597.5561
ModelsETR prediction
R2RMSEMAEVAF (%)
DOA-ANN0.97081.53340.921197.5063
DOA-RF0.96641.64361.315997.5066
FbOA-ANN0.95711.85760.943395.7143
FbOA-RF0.94162.16871.246894.4954
HOA-ANN0.95251.95531.038295.2687
HOA-RF0.96191.75181.083297.1181
Table 6. The performance difference between the proposed and previous models for predicting UCS and ETR.
ReferenceDatasetsTargetModelsR2
This paper75 samplesUCSDOA-ANN0.9857
UCSHOA-ANN0.9822
UCSFbOA-RF0.9584
Mei et al. [18]81 samplesUCSPSO-BPNN0.8898
UCSFOA-BPNN0.9011
UCSLSO-BPNN0.9165
UCSSSA-BPNN0.8129
Mei et al. [19]70 samplesUCSPOA-RF0.9663
UCSLHSPOA-RF0.9857
UCSCMPOA-RF0.9726
This paper75 samplesETRDOA-ANN0.9708
ETRHOA-RF0.9619
ETRFbOA-ANN0.9571
Mei et al. [6]80 samplesETRGOA-RF0.9342
Mei et al. [19]70 samplesETRPOA-RF0.8790
ETRLHSPOA-RF0.9065
ETRCMPOA-RF0.9047
Note: PSO-Particle swarm optimization algorithm; FOA-Fruit fly optimization algorithm; LSO-Lion swarm optimization algorithm; SSA-Sparrow search algorithm; POA-Pelican optimization algorithm; LHSPOA-Latin hypercube sampling-POA; CMPOA-Chaotic mapping-POA.
Table 7. The performance of the other four ML models using test set.
Models
DOA-
UCS predictionHyperparameter
Performance indices
R2RMSEMAEVAF (%)
ELM0.93572.01601.256893.7914Nn = 110
KELM0.96911.39721.145697.3872Rc = 142.3; k1 = 0.44
SVR0.96711.44140.804596.7133Rc = 108.9; k2 = 0.26
GRNN0.95341.71631.293796.3714Sf = 0.3
Models
DOA-
ETR prediction
Performance indices
R2RMSEMAEVAF (%)
ELM0.62055.52602.926962.1447Nn = 65
KELM0.90242.80262.096591.6196Rc = 125.6; k1 = 0.56
SVR0.90652.74281.430890.6531Rc = 174.8; k2 = 0.74
GRNN0.86743.26671.336187.4631Sf = 0.2
Note: Rc means regularization coefficient; k1 means a kernel parameter; k2 means a kernel parameter; Sf means a smooth factor.
Table 8. The detailed information of case concrete samples.
VariablesNo. 1No. 2
Rubber (g)22.27.3
River sand (g)199.865.5
Cement (g)148.0109.1
Rubber particle size (mm)0.20.2
Specimen mass (g)370.0/
Specimen density (g/cm3)1.9/
Specimen diameter (mm)50.350.0
Specimen length (mm)99.148.0
UCS (MPa)16.1/
ETR (%)/36.4
Table 9. The prediction results of UCS and ETR for the case concrete samples through the proposed visualization program.
VariablesNo. 1No. 2
Rubber (g)18.915.010.0152535
River sand (g)203.1199.8199.865.565.540
Cement (g)148155.2160.2101.491.4106.9
Rubber particle size (mm)0.20.20.150.20.20.2
Specimen mass (g)370370370///
Specimen density (g/cm3)1.91.91.9///
Specimen diameter (mm)50.350.350.3505050
Specimen length (mm)99.199.199.1484848
UCS (MPa)18.421.824.7///
ETR (%)///35.334.822.9
Disclaimer/Publisher’s Note: The statements, opinions and data contained in all publications are solely those of the individual author(s) and contributor(s) and not of MDPI and/or the editor(s). MDPI and/or the editor(s) disclaim responsibility for any injury to people or property resulting from any ideas, methods, instructions or products referred to in the content.