Article

A Digital Testing Framework for Design Improvements of Three-Piece Alloy Wheels Through Finite Element Analysis

Department of Engineering, University of Staffordshire, College Road, Stoke-on-Trent ST4 2DE, UK
*
Authors to whom correspondence should be addressed.
Appl. Sci. 2025, 15(21), 11654; https://doi.org/10.3390/app152111654 (registering DOI)
Submission received: 8 October 2025 / Revised: 24 October 2025 / Accepted: 28 October 2025 / Published: 31 October 2025

Abstract

Three-piece alloy wheels are widely used across the automotive industry, favoured due to their lightweight construction and ease of customisation. Vehicle wheels must withstand forces generated during acceleration, braking, cornering, and impacts, ensuring safety and durability under real-world conditions. Finite element analysis (FEA) plays a crucial role in simulating these loading conditions, thoroughly assessing structural performance prior to manufacturing. This study develops and validates a digital FEA testing framework tailored to low-volume wheel manufacturers, demonstrating that FEA can replace traditional physical wheel fatigue tests where such facilities are unavailable. This research was conducted in collaboration with a UK company specialising in the design and manufacture of bespoke, limited-production three-piece alloy wheels. However, the absence of dedicated structural testing procedures caused many of their existing designs to be overengineered, resulting in excessive material usage, increased weight, and high production costs. In some cases, lack of testing also contributed to wheel failures. This work selected three of the company’s existing wheel designs and subjected them to comprehensive analysis. Using FEA, each wheel was evaluated under industry-standard radial, cornering, biaxial, and impact tests. To verify the simulations, a known case of wheel failure was analysed and compared to real-world values. Once verified, any design issues were addressed. The redesigned wheels achieved substantial weight reduction (up to 25%), while still meeting or exceeding the relevant safety standards and allowing for manufacturability. Ultimately, this work demonstrated that applying digital simulation techniques can significantly improve the performance and safety of custom three-piece alloy wheels.

1. Introduction

The wheel is a fundamental component of a vehicle, enabling movement and transportation while providing structural support [1]. As Genta [2] suggests, the forces and torques acting on a vehicle’s wheel are some of the most crucial internal forces and torques within chassis design. These forces include tractive, braking, and cornering forces, and consider tyre characteristics, rolling resistance, and weight transfer.
To counter these forces and enhance vehicle safety, high-strength wheel rims can be designed. However, this can compromise vehicle performance due to increased wheel mass and inertia. In contrast, the automotive industry often favours lightweight wheels with minimal material usage, allowing for lower consumer costs. These can, however, be susceptible to fatigue cracking [1], ultimately leading to premature failure.
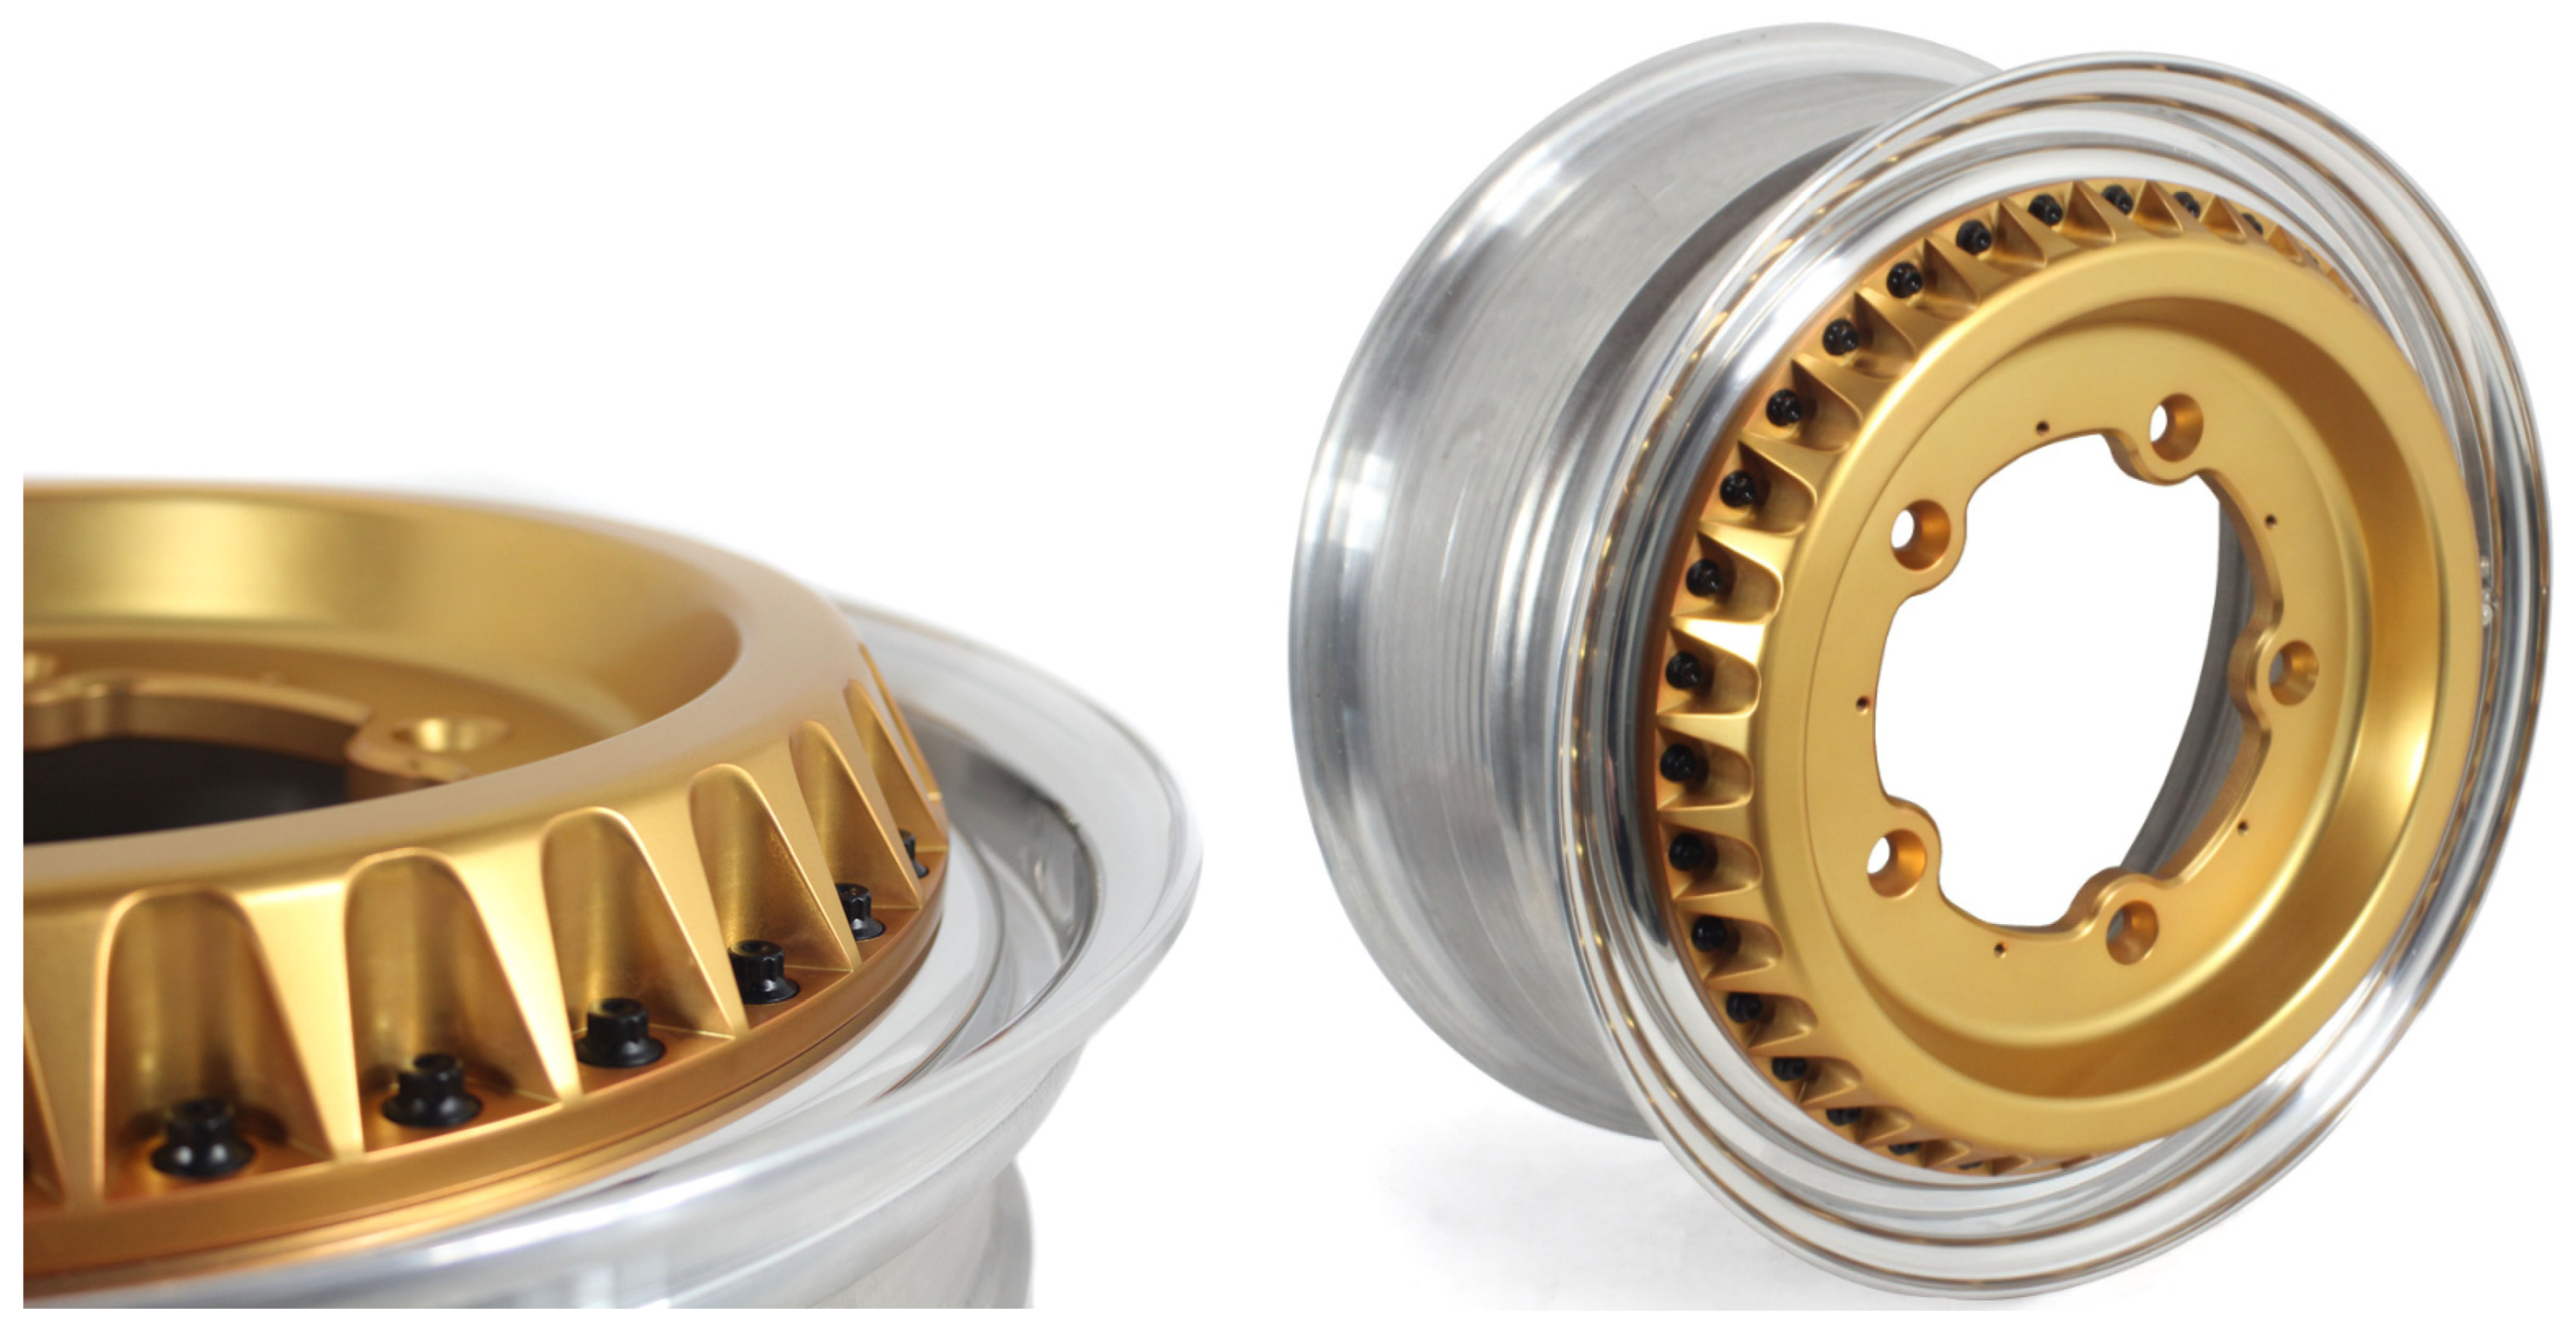
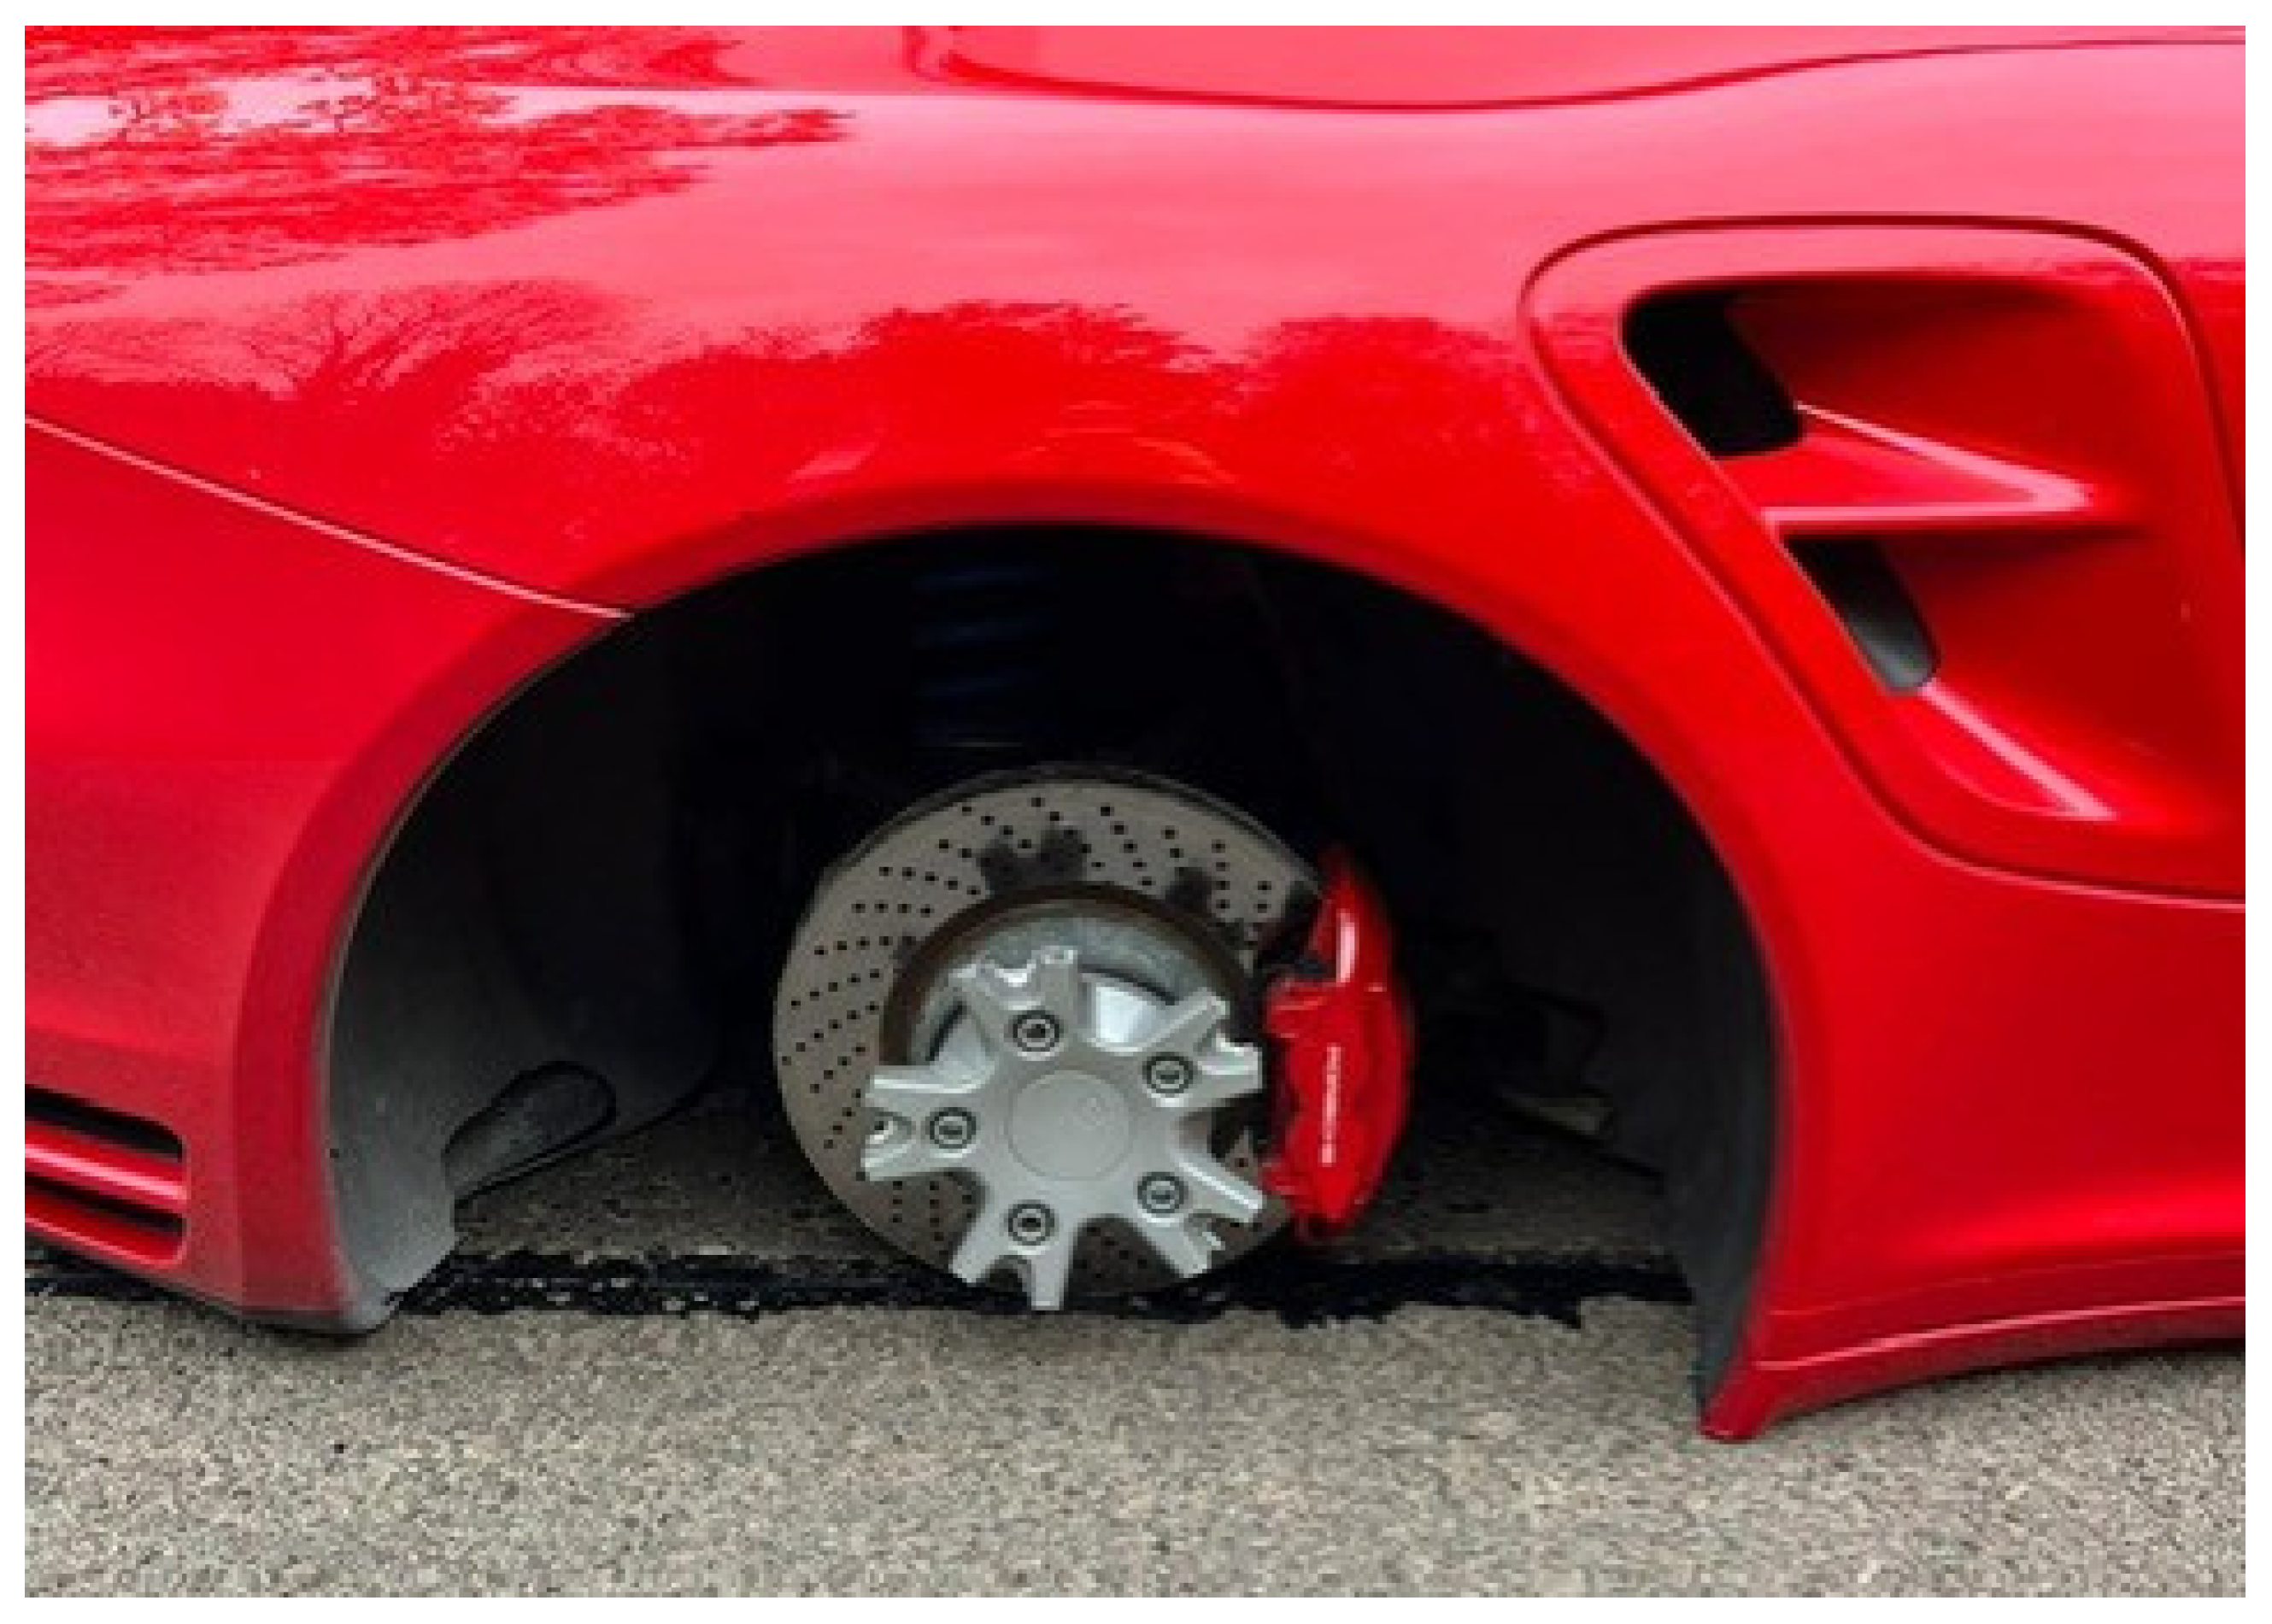
While many companies have developed multiple unique wheel designs (see Figure 1), a common issue is the lack of dedicated structural testing capabilities, often due to the added expense or inaccessibility of physical testing. As a result, many wheel designs are overengineered, with excessive material usage, increased weight, higher production costs, and bulkier designs. Furthermore, the absence of rigorous design testing can contribute to stress fractures and wheel failures (see Figure 2).
These challenges are widespread throughout the alloy wheel industry (specific examples provided in the Background Research and Knowledge Gaps Section). However, many mass-produced wheel manufacturers have successfully addressed these risks by incorporating finite element analysis (FEA), allowing for the validation of the structural integrity of designs prior to production
Several studies demonstrate the effectiveness of FEA in the identification and mitigation of wheel failures (covered in detail in the Background Research and Knowledge Gaps Section). Recent research has even extended beyond conventional FEA-based wheel design towards topology optimisation and generative design techniques, enabling faster and more efficient redesigns [3]. Other studies have also investigated the use of lightweight composite materials to further enhance wheel performance [4], and artificial intelligence (AI) is becoming increasingly popular to develop frameworks for automotive component testing and geometric optimisation [5]. However, these methods typically require high computational power, large datasets, and increased costs. Consequently, limited research addresses the application of FEA for small-scale alloy wheel manufacturers, where physical testing or AI approaches may not be financially viable. This has created a knowledge gap in ideal testing practices.
This study therefore addressed the challenges faced by bespoke, limited-production wheel manufacturers who cannot justify the expense of full-scale physical testing. A validated digital testing framework is proposed which adapts physical simulation methods into a computational methodology for bespoke wheel manufacturers to replicate, ultimately leading to lighter, more efficient, and safer wheels, whilst ensuring industry standards are met.
To ensure that this research contributed towards a real-world engineering problem, it was centred around a UK-based engineering company specialising in the design of bespoke, limited-production aftermarket multi-piece alloy wheels. Throughout this report, they are referred to as Company A for confidentiality.

Background Research and Knowledge Gaps

The wheel is a fundamental circular component of a vehicle that revolves on its axis, enabling movement and transportation of objects while providing structural support [1]. Modern wheels are commonly manufactured from aluminium alloy. As suggested by Rao, Rajesh, and Babu [6], aluminium alloy wheels not only enable more aesthetically appealing designs but are also significantly lighter than their steel counterparts. This reduced weight decreases the energy required for rotation, enhancing fuel efficiency, acceleration, and braking performance.
Companies specialising in wheel design often favour multi-piece wheels to meet bespoke customer requirements. ‘Multi-piece wheels are composed of two or three separate components—typically an inner rim, an outer rim, and a wheel centre—that are bolted together’ [7].
This modular technique allows for ease of customisation, simplified damage repair through individual component replacement, and weight reduction.
Wheels are required to withstand tensile and compressive forces transmitted by the tyre from the road, as well as vehicle load transmitted to the wheel through the hub. These forces can be categorised into the following:
  • Vertical loads from the tyre contact patch;
  • Lateral forces occurring during vehicle cornering;
  • Braking and acceleration torque applied at the wheel hub;
  • Sudden load variations caused by interactions with the terrain, such as potholes or speedbumps [8].
As suggested by Padmanabhan [1] to ensure that a wheel can withstand these forces, spokes are used to connect the wheel hub to the rim. The design and rigidity of spokes is crucial to prevent wheel failure. A study by Zanchini et al., [4] demonstrates the fatigue cracking of a poorly designed aluminium Ferrari 488 Pista wheel caused by a significant bending moment at a sharp corner of a spoke, causing a stress concentration to occur. Similar failures are seen in studies by Firat et al. [9] and Raju et al. [10] where cracks are initiated at various points along the spokes of both alloy and steel wheels during radial fatigue tests.
To minimise the risk of alloy wheel failure through compliance with international wheel design standards, fatigue testing methods are often employed. ‘The main objective in fatigue analysis is to predict the accumulated number of cycles at which a small crack appears at a stress raising geometrical feature’ [11], where a crack is defined as ‘material separation with a propagation of more than 10 mm occurring during a test’ [12].
Fatigue tests include cornering, radial, and biaxial tests [4]. As suggested by Kocabicak and Firat [11], the cornering fatigue test is designed to simulate dynamic loading occurring during cornering. This loading includes the vertical and lateral forces which generate a bending moment at the wheel hub.
The radial fatigue test applies a radial load to an alloy wheel in contact with a rotating drum. This test is conducted over several cycles, and eventually, the wheel fails, allowing for the determination of its cycle life [13].
The biaxial fatigue test combines both radial and cornering tests, emulating real-world driving conditions, such as ‘cornering, straight driving and parking, as well as driving on rough roads’ [14]. This is achieved through the application of both radial and lateral loads to a wheel situated within a moveable rotating drum representing the ground.
The full procedures of each fatigue test are documented in detail in ISO 3006:2015 [12]. Any defects which should be checked for are further described in ISO 14400:2021 Section 6 [15], where it is noted that wheel rims with any fracture, crack, corrosion, deformation, or other non-conformity should be removed from the vehicle and disposed of [16].
SAE J328:202107 Section 2.2.3 [16] states that the minimum cycle life for aluminium wheel cornering and radial fatigue tests is 50,000 and 600,000, respectively. The required FOS for wheels are also specified as 2.0 for cornering, and 2.5 for radial tests.
During driving, alloy wheels can also experience severe impact loads, such as striking a curb during parking or colliding with road debris. To address this, regulations specify a standardised impact test. According to SAE J175:200309 Section 4.3 [17], the procedure involves dropping a mass calculated by Equation (1):
M a s s = 0.6 W + 180
where W represents the maximum static wheel load in kilograms [17]. The Mass is dropped onto the wheel rim at an angle of 13 degrees, after which the wheel is inspected for cracks and other forms of damage.
The above tests are usually carried out through physical testing; however, similar scenarios can be simulated through finite element analysis (FEA), which ‘has been established as one of the major techniques to evaluate structural behaviour during product development’ [18]. Wheel manufacturers often use finite element analysis (FEA) tools to minimise material usage and costs, while ensuring that designs comply with international standards. FEA software (ANSYS Workbench 2024 R2) computationally applies complex sets of equations ‘to validate and test designs safely, quickly, and economically by creating virtual models of real-world assets’ [19]. This allows manufacturers to identify potential failure points in their wheels prior to production.
The FEA process typically involves three main stages: pre-processing, solving, and post-processing. According to Boart, Anderson, and Elfström [18]. Pre-processing includes several critical steps. First, the geometry is defined by importing a 3D CAD model. Next, a mesh is generated over the model using elements of varying shapes and sizes. As suggested by Chang and Yang [20], tetrahedral meshes are commonly used for wheels due to their irregular geometry where uniform meshes are difficult to generate. Finally, the solver inputs are defined by applying boundary conditions such as supports, forces, and moments. The factors to be solved for are also selected, such as stress, strain, or deformation.
In the solving stage, software solves partial differential equations across all mesh elements. While increasing the number of mesh elements improves solution accuracy, it also significantly raises the computational cost. To ensure reliability, a mesh independence study is often conducted to determine the point at which the results no longer vary with further mesh refinement. The final stage, post-processing, enables the user to interpret and analyse the simulation results, providing valuable insight into the structural performance of the model.
Korkut et al. [21] used FEA to redesign alloy wheel spokes. The analysis identified areas of stress concentration and moderate deflection, enabling targeted design modifications to be made by adding or removing material as necessary. In this case, minimal stress and deflection were observed on the outer spoke edge, while small stress concentrations appeared within pockets near to the wheel hub. To address this, the design was adjusted by reducing the pocket size and removing excess material from the outer spoke, ultimately decreasing the wheel’s weight while improving the design strength.
Additionally, Zanchini et al. [4] analysed a sports car wheel through FEA, revealing that the fatigue life of the spokes was insufficient. This finding directly correlates with the crack propagation observed when physically testing the wheel, proving the validity of FEA in preparing wheels for manufacture.
The insights gained from the above research directly informed the methodology of this work.

2. Materials and Methods

The following methodology was implemented throughout this work: Three wheels from Company A’s existing range were selected for detailed analysis. Then, plans were developed to replicate industry-standard wheel test procedures accurately within FEA software. Mathematical calculations were used to determine the maximum forces experienced by wheels under typical operating conditions, such as braking, cornering, and curb impacts. Comprehensive FEA simulations were then conducted on a wheel with a known failure point. The results were used to validate both the mathematical calculations and the FEA setup. The three selected wheels were then subjected to FEA testing. The results were analysed to assess design performance under load, and to identify potential weaknesses or areas of high material usage. Based on the FEA results, design alterations were then made to reduce material usage or enhance structural integrity of the wheels. Finally, the revised wheel designs were simulated again to confirm improvements prior to manufacture.
Three of Company A’s existing three-piece alloy wheels were chosen to be tested and improved throughout this work. Each wheel was chosen based on high customer popularity, and was referred to throughout this study as shown below:

2.1. Proposed Testing Procedures and Their Validation

This study focused on developing and validating a digital FEA framework capable of accurately representing alloy wheel testing procedures. To achieve this, as outlined in the Background Research and Knowledge Gaps Section, three key test methods were required to be modelled as follows: cornering, radial, and biaxial tests. Each method was simulated within FEA software following established FEA industry practices (see Section 2.3). To ensure realistic results, the framework was required to consider the forces experienced during real-world driving, which required mathematical calculations to be carried out to determine maximum wheel loads.
To validate both the accuracy of these calculations and the reliability of FEA, a known case of wheel failure was selected for initial analysis, referred to as Wheel D (see Figure 2), originally designed for Company A customer’s sports car. At the time of production, Wheel D underwent minimal testing, leading to a real-world wheel failure which occurred during harsh braking from a high speed in dry asphalt conditions. To replicate this failure, the maximum expected driving forces were calculated (see Section 2.2) and applied within an FEA simulation. If the FEA results aligned with the observed failure locations, this would validate both the FEA method and the applied loading conditions, providing confidence in the subsequent analysis of the three wheels shown in Figure 3.

2.2. Wheel Force Calculations

This section presents an overview of the calculations used to determine the maximum forces acting on Wheel D during driving. All equations used throughout this section were adopted from Smith [22], Singh and Gabel [23], SAE International [17], and Wiegand [24]. All numerical inputs (see Table 1) were assumed either from commonly accepted values, (such as μT = 0.7 for a vehicle in dry asphalt conditions [25]), or directly from Company A’s customer vehicle specification where published data was unavailable.
Using Table 1, Wheel D forces and velocity of the impact test striker were calculated.

2.2.1. Radial Forces Due to Mass Transfer During Vehicle Braking

Acceleration and braking result in longitudinal mass transfer between a vehicle’s front and rear axles, increasing the radial load on the wheels. According to Dhakar and Ranjan [26], drivers experience greater g-forces during deceleration than acceleration; therefore, only braking conditions were considered for this analysis.
As explained by Day and Bryant [27], braking shifts weight from the rear to the front axle, increasing the load on the front wheels and causing a forward pitching motion known as “dive” (Figure 4). The magnitude of this weight transfer depends on several factors, including vehicle speed, brake system components (such as pads, callipers, and hydraulic pressure), road surface conditions, and the location of the vehicle’s centre of gravity (COG).
To calculate the radial load on a front wheel during braking, a series of calculations were carried out, starting with an analysis of the vehicle’s braking system.
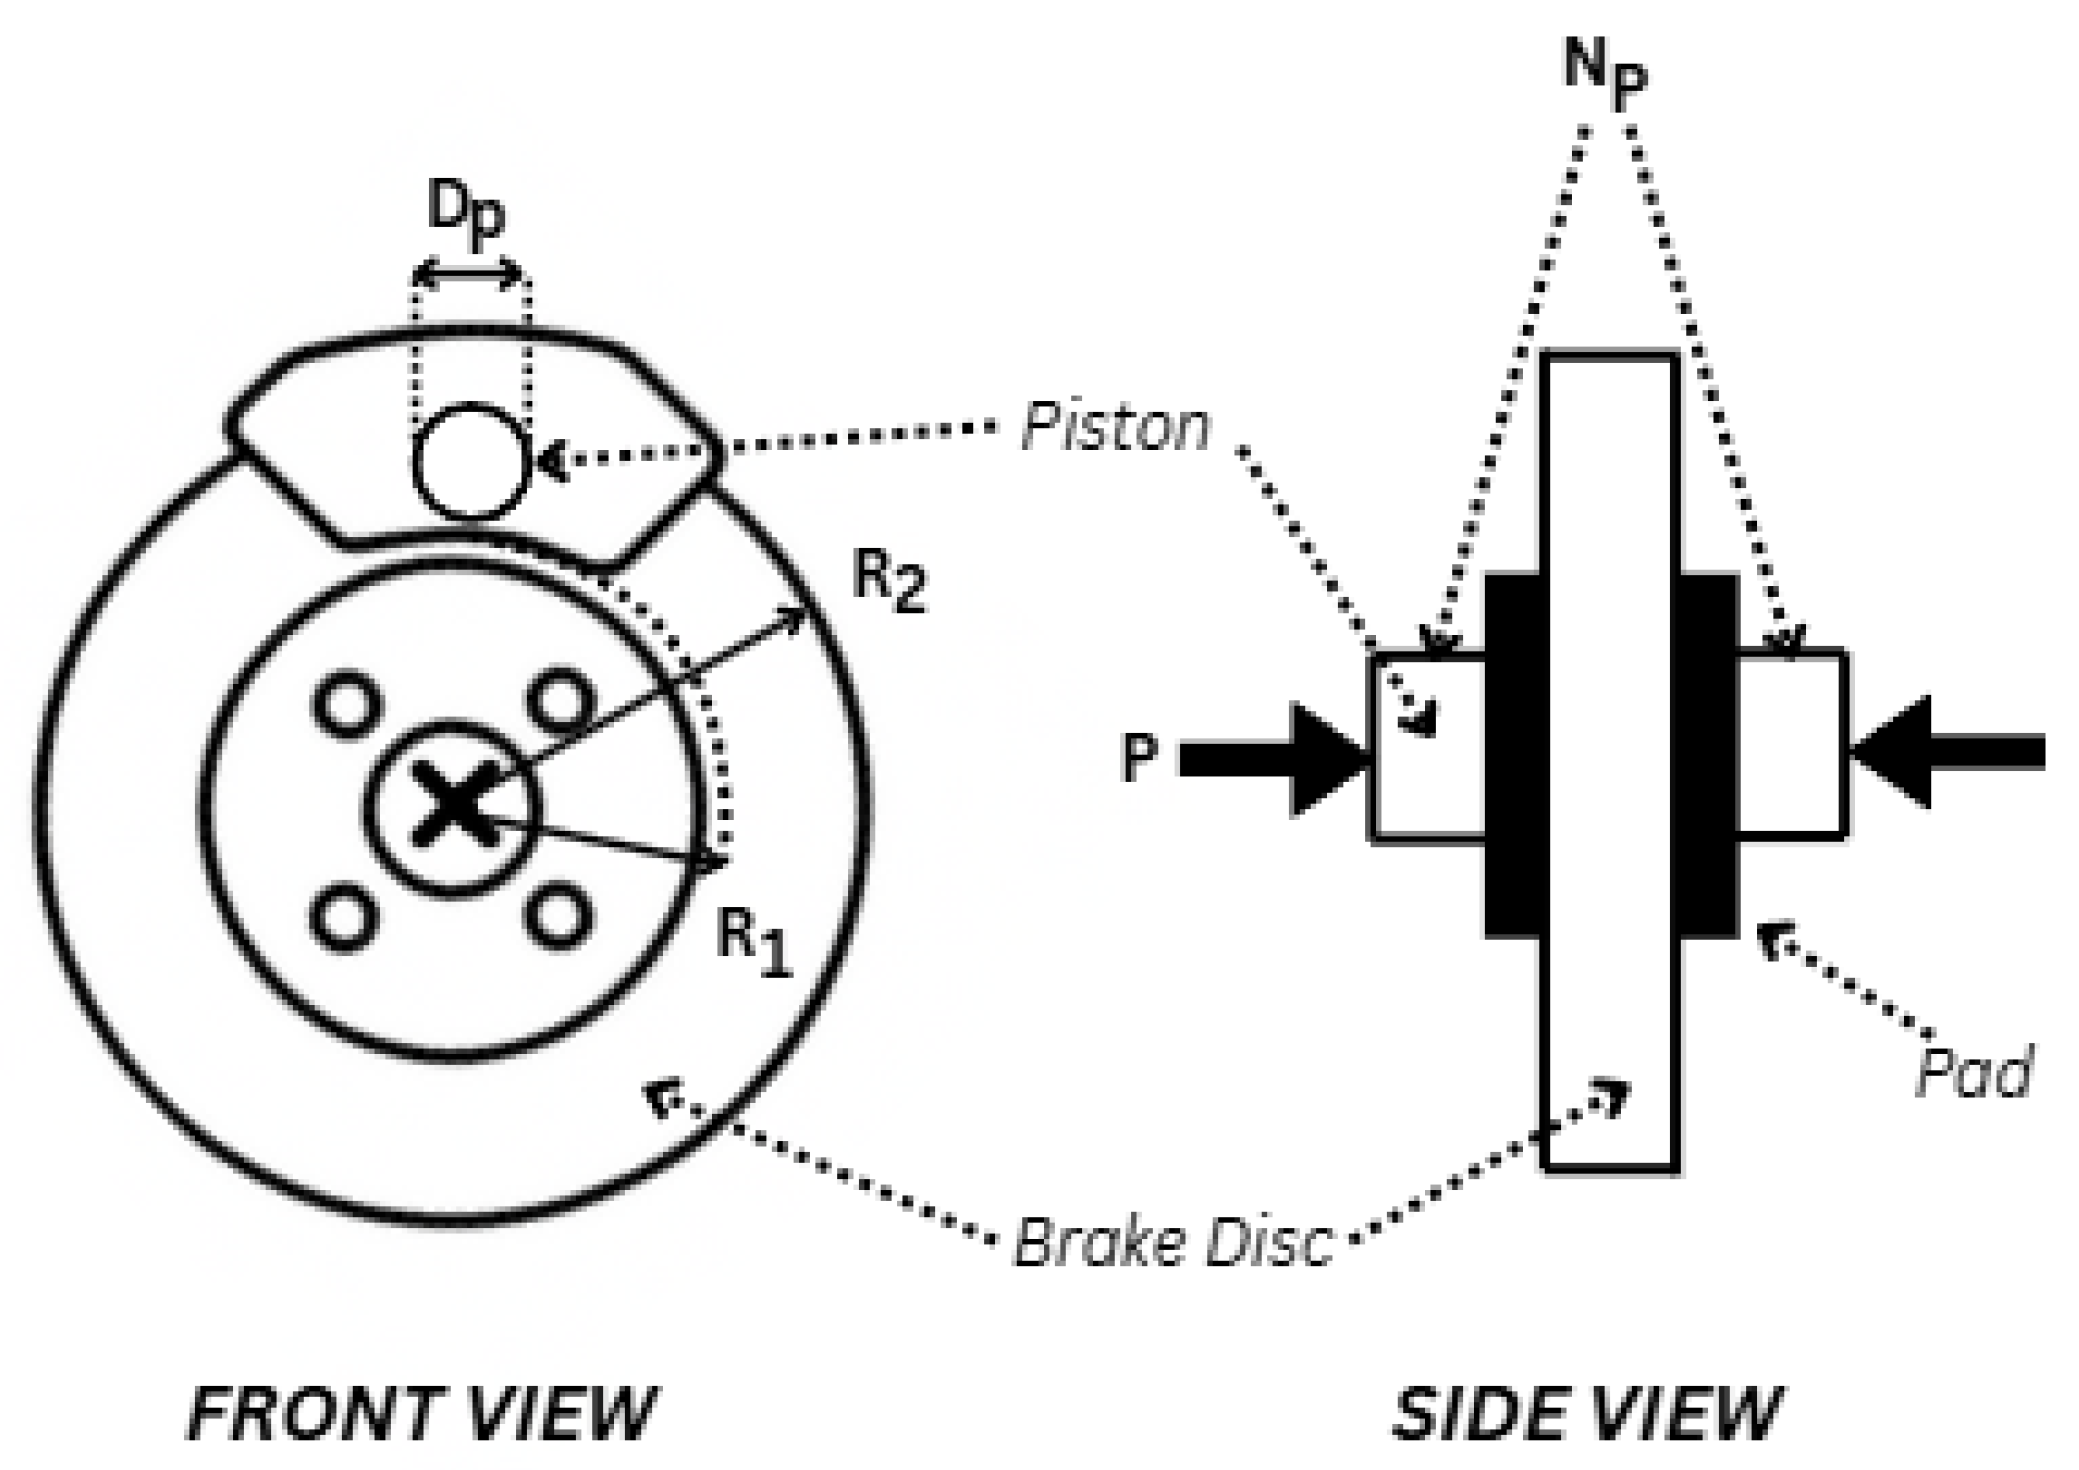
Brake callipers operate using hydraulic pressure generated when the driver presses the brake pedal, activating multiple pistons. These pistons press the brake pads against a rotating disc attached to the wheel, creating friction that slows the vehicle (see Figure 5). This frictional force enables the calculation of braking torque, which, in turn, allows determination of the force at the tire–road contact patch. From this, the radial load on the wheel can be calculated.
Table 2 shows a brief overview of the calculations used, alongside the results for each step of the process.

2.2.2. Lateral Forces Due to Vehicle Cornering

During cornering, a vehicle experiences lateral weight transfer towards the outer wheels (Figure 6). While this transfer is generally less significant than that caused by braking, it generates a lateral frictional force at the tire’s contact patch. This force can be used to determine opposing forces within the wheel that help maintain the system’s equilibrium. Lateral weight transfer itself results from a combination of the vehicle’s centrifugal force, gyroscopic effects of the rotating wheels, and the vehicle’s weight. Table 3 shows a brief overview of the calculations used, alongside the results for each step of the process.

2.2.3. Impact Test Calculations

As stated in SAE J175:200309 (see Section Background Research and Knowledge Gaps), during the impact test, a striker contacts a wheel rim at a specified mass and height. For the FEA simulation of this test, the velocity of the striker was required to be known. Table 4 shows a brief overview of the calculations used to find this velocity, alongside the results for each step of the process.
All calculated forces acting on Wheel D are depicted in Figure 7.

2.3. Finite Element Simulation Setup

All forces acting on Wheel D were now ready to be applied within FEA software. Ansys Workbench 2024 R2 was used for the analysis, and this software allows for the use of real-world engineering scenarios to validate designs through simulations [28].
As discussed in the Background Research and Knowledge Gaps Section, FEA can be split into three key areas: pre-processing, solving, and post processing. Each area is covered in Section 2.3.1, Section 2.3.2 and Section 2.3.3 below.

2.3.1. Pre-Processing

Ansys Granta Edupack 2022 R2 software offers a range of materials and associated data to be seamlessly integrated within both CAD and FEA tools [29], and was used to gather the simulation’s material data for aluminium alloy 6082T6 (see Table 5).
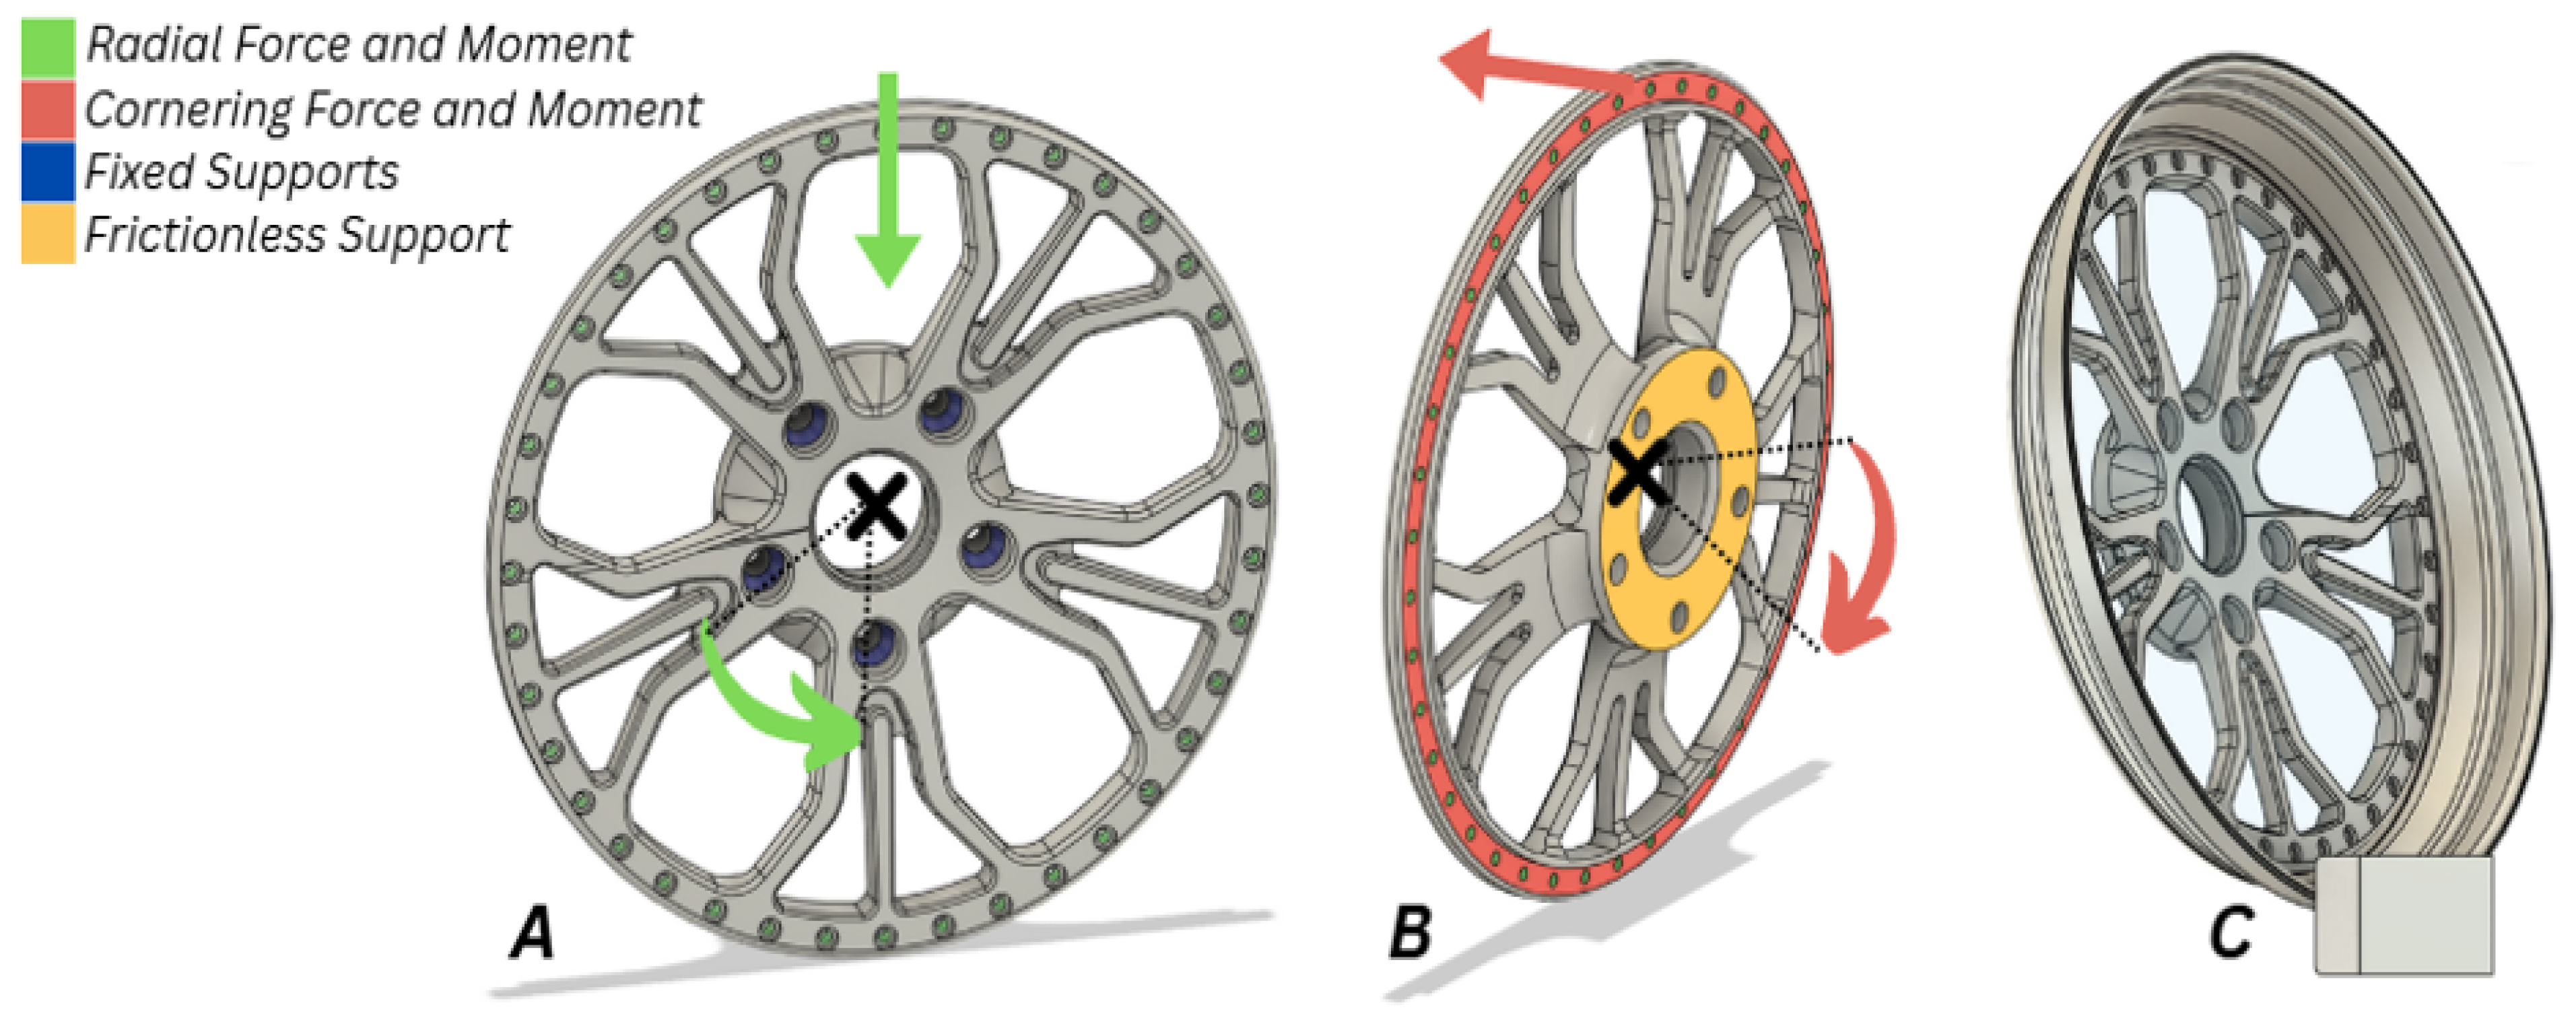
The CAD geometry of Wheel D was imported into Ansys, and boundary conditions were applied to replicate realistic wheel-to-hub interactions. As shown in Figure 8A, a fixed support was assigned to each bolt-hole surface along the inner PCD, constraining all translational and rotational degrees of freedom. This represented the bolted connection between the wheel centre and the vehicle hub. However, bolt pretention was not modelled; the interface was therefore assumed as rigid.
Frictionless support was then applied to the backpad of the wheel (see Figure 8B) to represent its contact with the wheel hub when bolted to a vehicle. This boundary condition allowed longitudinal sliding of the wheel but prevented lateral movement. Friction was omitted from the analysis due to its minor effect on results, which also allowed for higher computational efficiency.
As outlined in the Background Research and Knowledge Gaps Section, four distinct tests were conducted, each involving the application of different force types. For the radial test, the forces and moments occurring during braking (see Section 2.2) were distributed over each surface of the lock ring PCD (see Figure 8A). For the cornering test, the lateral load and cornering moment were distributed over the rear face of the wheel. In both cases, load distribution represented the mechanical connection between the wheel lip, barrel, and centre.
The biaxial test combined both radial and cornering loads, with all corresponding forces applied simultaneously.
For the impact test, a striker was required to be simulated; thus, a new simulation within Ansys Explicit dynamics was required. Explicit dynamics is ‘a time integration method used to perform dynamic simulations when speed is important’ [30]. In this setup, a model of the wheel rim and the striker mass was developed. A fixed support was applied to the rear face of the wheel where it contacts the hub, and the striker was assigned a velocity of 2.12 m/s (see Section 2.2) to impact the wheel at 13 degrees (see Figure 8C). It should be noted that strain rate sensitivity was excluded from impact runs for simulation simplicity.
A tetrahedral mesh was generated for the wheel geometry and a mesh independence study was conducted to find an appropriate element size. Peak deformation and von Mises stress results for element sizes between 2 mm and 15 mm were compared in Graph 1. It was observed that the solution became independent of the mesh at an element size of 3.5 mm (301,000 elements). Therefore, this mesh size was selected for use in the final analysis.
Graph 1. Wheel D mesh independence study.
Applsci 15 11654 gr001

2.3.2. Solving

The purpose of the Wheel D tests was to validate the FEA setup and mathematical calculations by comparing failure locations observed experimentally with those predicted computationally. Thus, only the factor of safety (FOS) was required for this validation.
However, the analysis of the three wheels later in the report also included deformation, von Mises stress, and equivalent strain to better assess performance under typical driving conditions:
Factor of safety (FOS) results are categorised under fatigue analysis. Fatigue is defined as the progressive structural degradation that occurs when a material is exposed to cyclic (fully reversed) or fluctuating (zero-based) loads, ultimately leading to complete failure [31]. In the case of the radial fatigue test for a rotating wheel, the applied load was considered fully reversed; the wheel experiences a maximum positive load, returns to zero, and then undergoes a maximum negative load, representing alternating tension and compression as the wheel rotates. As the forces involved in the cornering test act laterally and are not influenced by rotation, a zero-based loading approach was used, where load began at zero before reaching a maximum value and repeating.
As stated in SAE J328:202107 Section 2.2.3 [16], the cycle life of the radial and cornering tests were set to 600,000 and 50,000 cycles, respectively.
The Goodman fatigue criterion, which, as suggested by Farhat [32], is used to predict the fatigue life at a defined stress ratio, was used for all wheel tests. Material S-N data for aluminium 6082-T6 was gathered from Ansys Granta [29]. It should be noted that a clean machined surface with no further surface treatments was also assumed for all wheel tests. Residual stresses from manufacturing were also neglected from the analysis.

2.3.3. Radial Test Post-Processing (Results of Validation Study)

Wheel D failed during the use of Company A’s customers car; thus, in-service load data for Wheel D was unavailable. Therefore, a full calibration of model accuracy was not possible. However, results obtained using the framework were compared with findings from the existing literature (see Section 3). These comparisons showed strong similarities, supporting the validity of the developed framework. However, a qualitative consistency check was performed, and the FOS results for Wheel D under radial loading were compared against the known failure case for Wheel D (Figure 9). A minimum FOS of 0.353 was recorded. As explained by Shrivastava [33], the factor of safety represents how much stronger a component is compared to the applied load, with values below one indicating failure.
The FOS of 0.353 was observed at the inter-spoke connections of the Wheel D centre (highlighted in red in Figure 9), corresponding with the failure sites observed in the experimental test of Wheel D during braking. The FOS indicated failure at 35.3% of the applied load. The low FOS value and its alignment with the experimental failure location provided strong evidence that both the FEA setup and the supporting calculations were accurate and valid.

2.3.4. Cornering, Biaxial, and Impact Test Post-Processing (Results of Validation Study)

The cornering test produced a minimum safety factor of 1.47. However, unlike the radial test, the minimum FOS regions identified in these simulations did not fully align with the experimental failure locations.
The cyclically symmetrical fracture pattern observed in Wheel D (see Figure 9) suggested that cornering loads were unlikely to be the primary cause of failure. This is further supported by the simulation results, which indicated that the low FOS regions due to cornering were concentrated around the lower two spokes and covered a broader area than the actual failure region.
As the biaxial test involved a combination of radial and cornering loads, it required both fully reversed and zero-based loading scenarios. However, it was not accurate to assign both load cases simultaneously due to software constraints which would cause the load applied to the wheel to be excessively high, meaning that calculating a safety factor was neither practical nor applicable. Therefore, the biaxial test was excluded from the Wheel D analysis. It should be noted that a damage-accumulation approach could be considered instead of FOS to obtain a service life result for Wheel D during biaxial testing. During impact testing, Wheel D achieved a safety factor of 2.63 at the rear of the spoke nearest the point of impact, confirming the design’s ability to withstand impact loads.

2.4. Wheel Analysis and Results

With the FEA setup and the supporting calculations deemed accurate and valid, analysis of the three wheels could begin. Using the calculations discussed in Section 2.2, the forces acting on each wheel during braking and cornering were calculated. A summary of the calculated forces is shown in Table 6.
Table 7 summarises the results, highlighting maximum and minimum values and their locations. This information supported material reduction or addition to improve the wheel designs in Section 2.5.
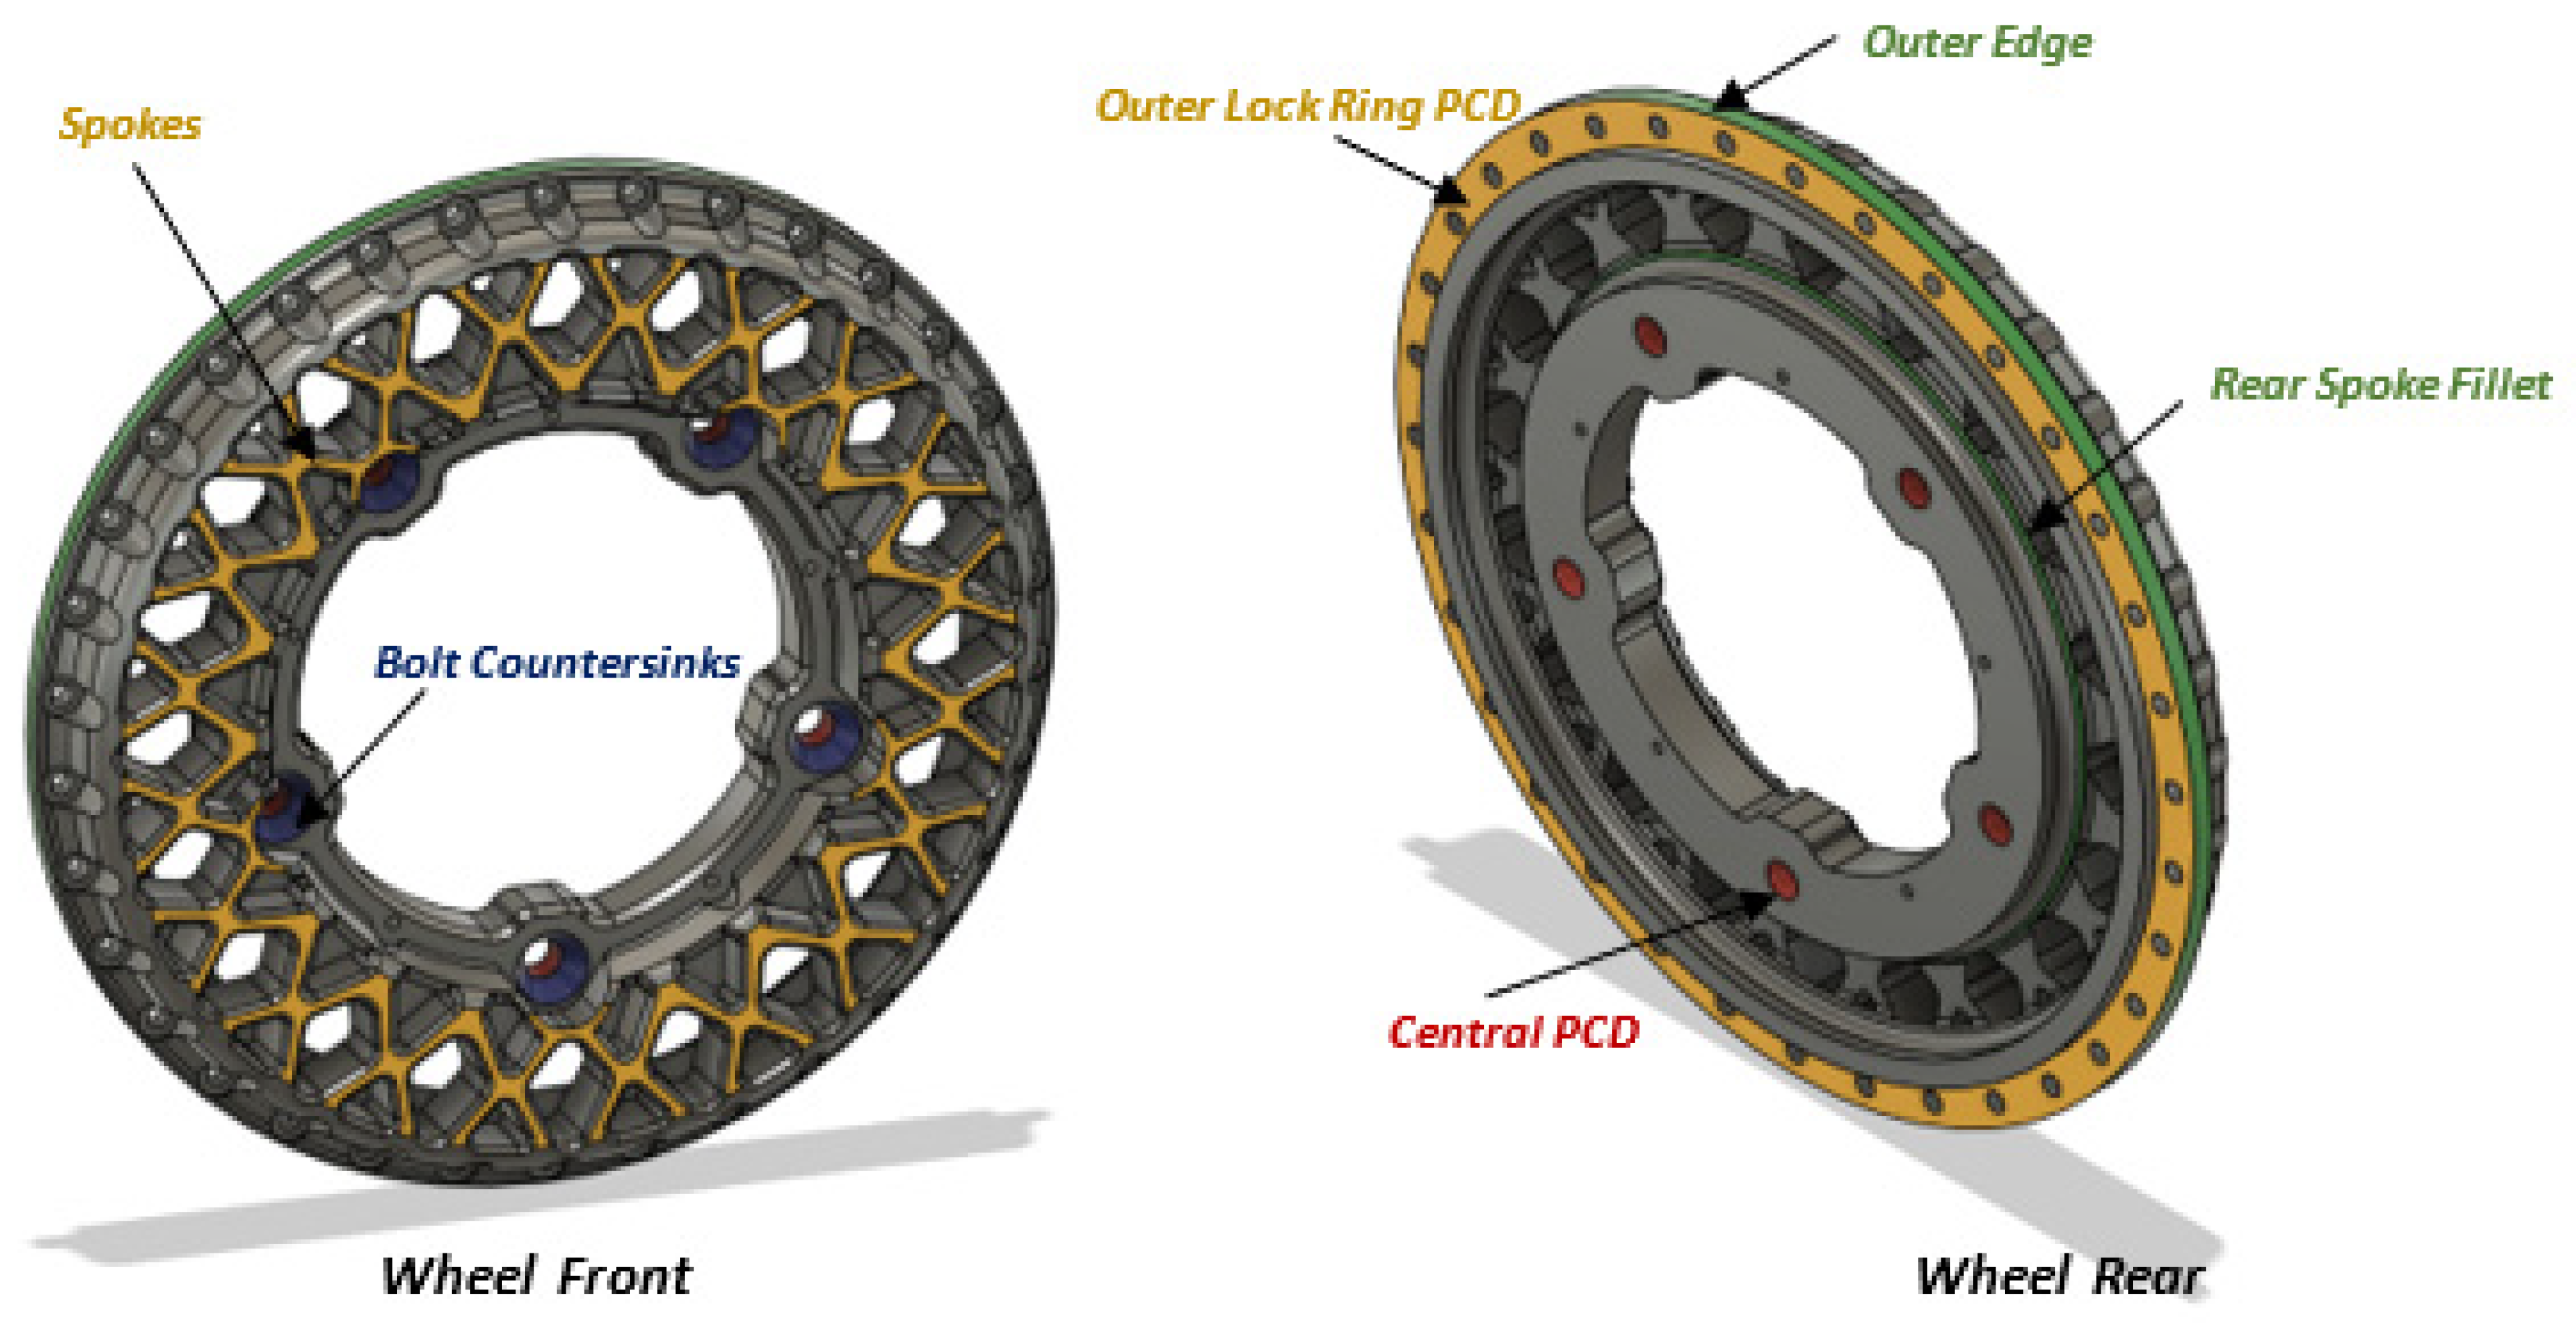
Figure 10 illustrates example wheel design features from Table 7 for ease of reference. While Wheel C is shown here, similar conventions apply to Wheels A and B.
Table 7. FEA analysis summary.
WheelTest(s)Area(s) of InterestConcern(s)Comment(s)Change Identifier
Wheel ARadial, BiaxialBolt CountersinksFOS = 2.58, and increased stress and strain regionReduce sharp transitions through use of fillets or provide larger surface area1, Figure 11
CorneringInner FilletFOS = 7.02, stress and strain increaseIncrease fillet radius2, Figure 11
Rear ChamferReduce chamfer angle, add fillets3, Figure 11
ImpactRear Chamfer and Inner FilletFOS = 1.82Increase fillet radius and reduce chamfer angle2, 3, Figure 11
All TestsMain Wheel BodyFOS = 15. Low stress, strain, and zero deformationRemove material4, Figure 11
Wheel BRadialBolt CountersinksFOS = 2.16, and increased stress and strain regionReduce sharp transitions through use of fillets or provide larger surface area.1, Figure 12
Radial, BiaxialSpokesMinor increase in stress and strain, FOS reduced slightlyRemove some, but not significant, material from spokes2, Figure 12
CorneringLock Ring PCD (both front and rear faces)Increased stress and strainDo not significantly thin area during redesign3, Figure 12
ImpactLock Ring PCDAll values increased
All TestsArea Surrounding Inner PCDFOS = 15. Low stress, strain, and zero deformationRemove material4, Figure 12
Wheel CRadial, Cornering, BiaxialSpokes and Spoke FilletsMinor increase in stress and strain, FOS reduced slightlyIncrease fillet radius and remove material1, Figure 13
Radial, CorneringBolt CountersinksLower FOS, and increased stress and strainReduce sharp transitions through use of fillets or provide larger surface area.2, Figure 13
ImpactLock Ring PCD0.42 mm deformationDo not significantly thin area during redesign.3, Figure 13
All TestsArea Surrounding Inner PCD and The Outer Surface of The WheelFOS = 15. Low stress, strain, and zero deformationRemove material

2.5. Design Improvements Based on FEA Results

Using the FEA results in Table 7, alterations were made to each wheel to optimise their design for reduced mass, while ensuring adequate safety factors and acceptable levels of stress, strain, and deformation. The change identifier column in Table 7 can be used to cross reference the design alterations with Figure 11, Figure 12 and Figure 13 below.
Figure 11. Old (A,A’) versus new (B,B’) Wheel A, see Table 7 to reference the numbers in the Figure.
Applsci 15 11654 g011
Figure 12. Old (A,A’) versus new (B,B’) Wheel B, see Table 7 to reference the numbers in the Figure.
Applsci 15 11654 g012
Figure 13. Old (A,A’) versus new (B,B’) Wheel C, see Table 7 to reference the numbers in the Figure.
Applsci 15 11654 g013
  • Figure 11 shows a comparison between the original and revised Wheel A. Wheel mass was decreased by 599.5 g (from 2.508 kg to 1.909 kg), or 23.9%.
  • Figure 12 shows a comparison between the original and revised Wheel B. Wheel mass was decreased by 1.203 kg (from 4.446 kg to 3.242 kg), or 27.07%.
  • Figure 13 shows a comparison between the original and revised Wheel C. Wheel mass was decreased by 887.7 g (from 3.972 kg to 3.084 kg), or 22.3%.3.

3. Results Discussion

3.1. Redesigned Wheel A Analysis

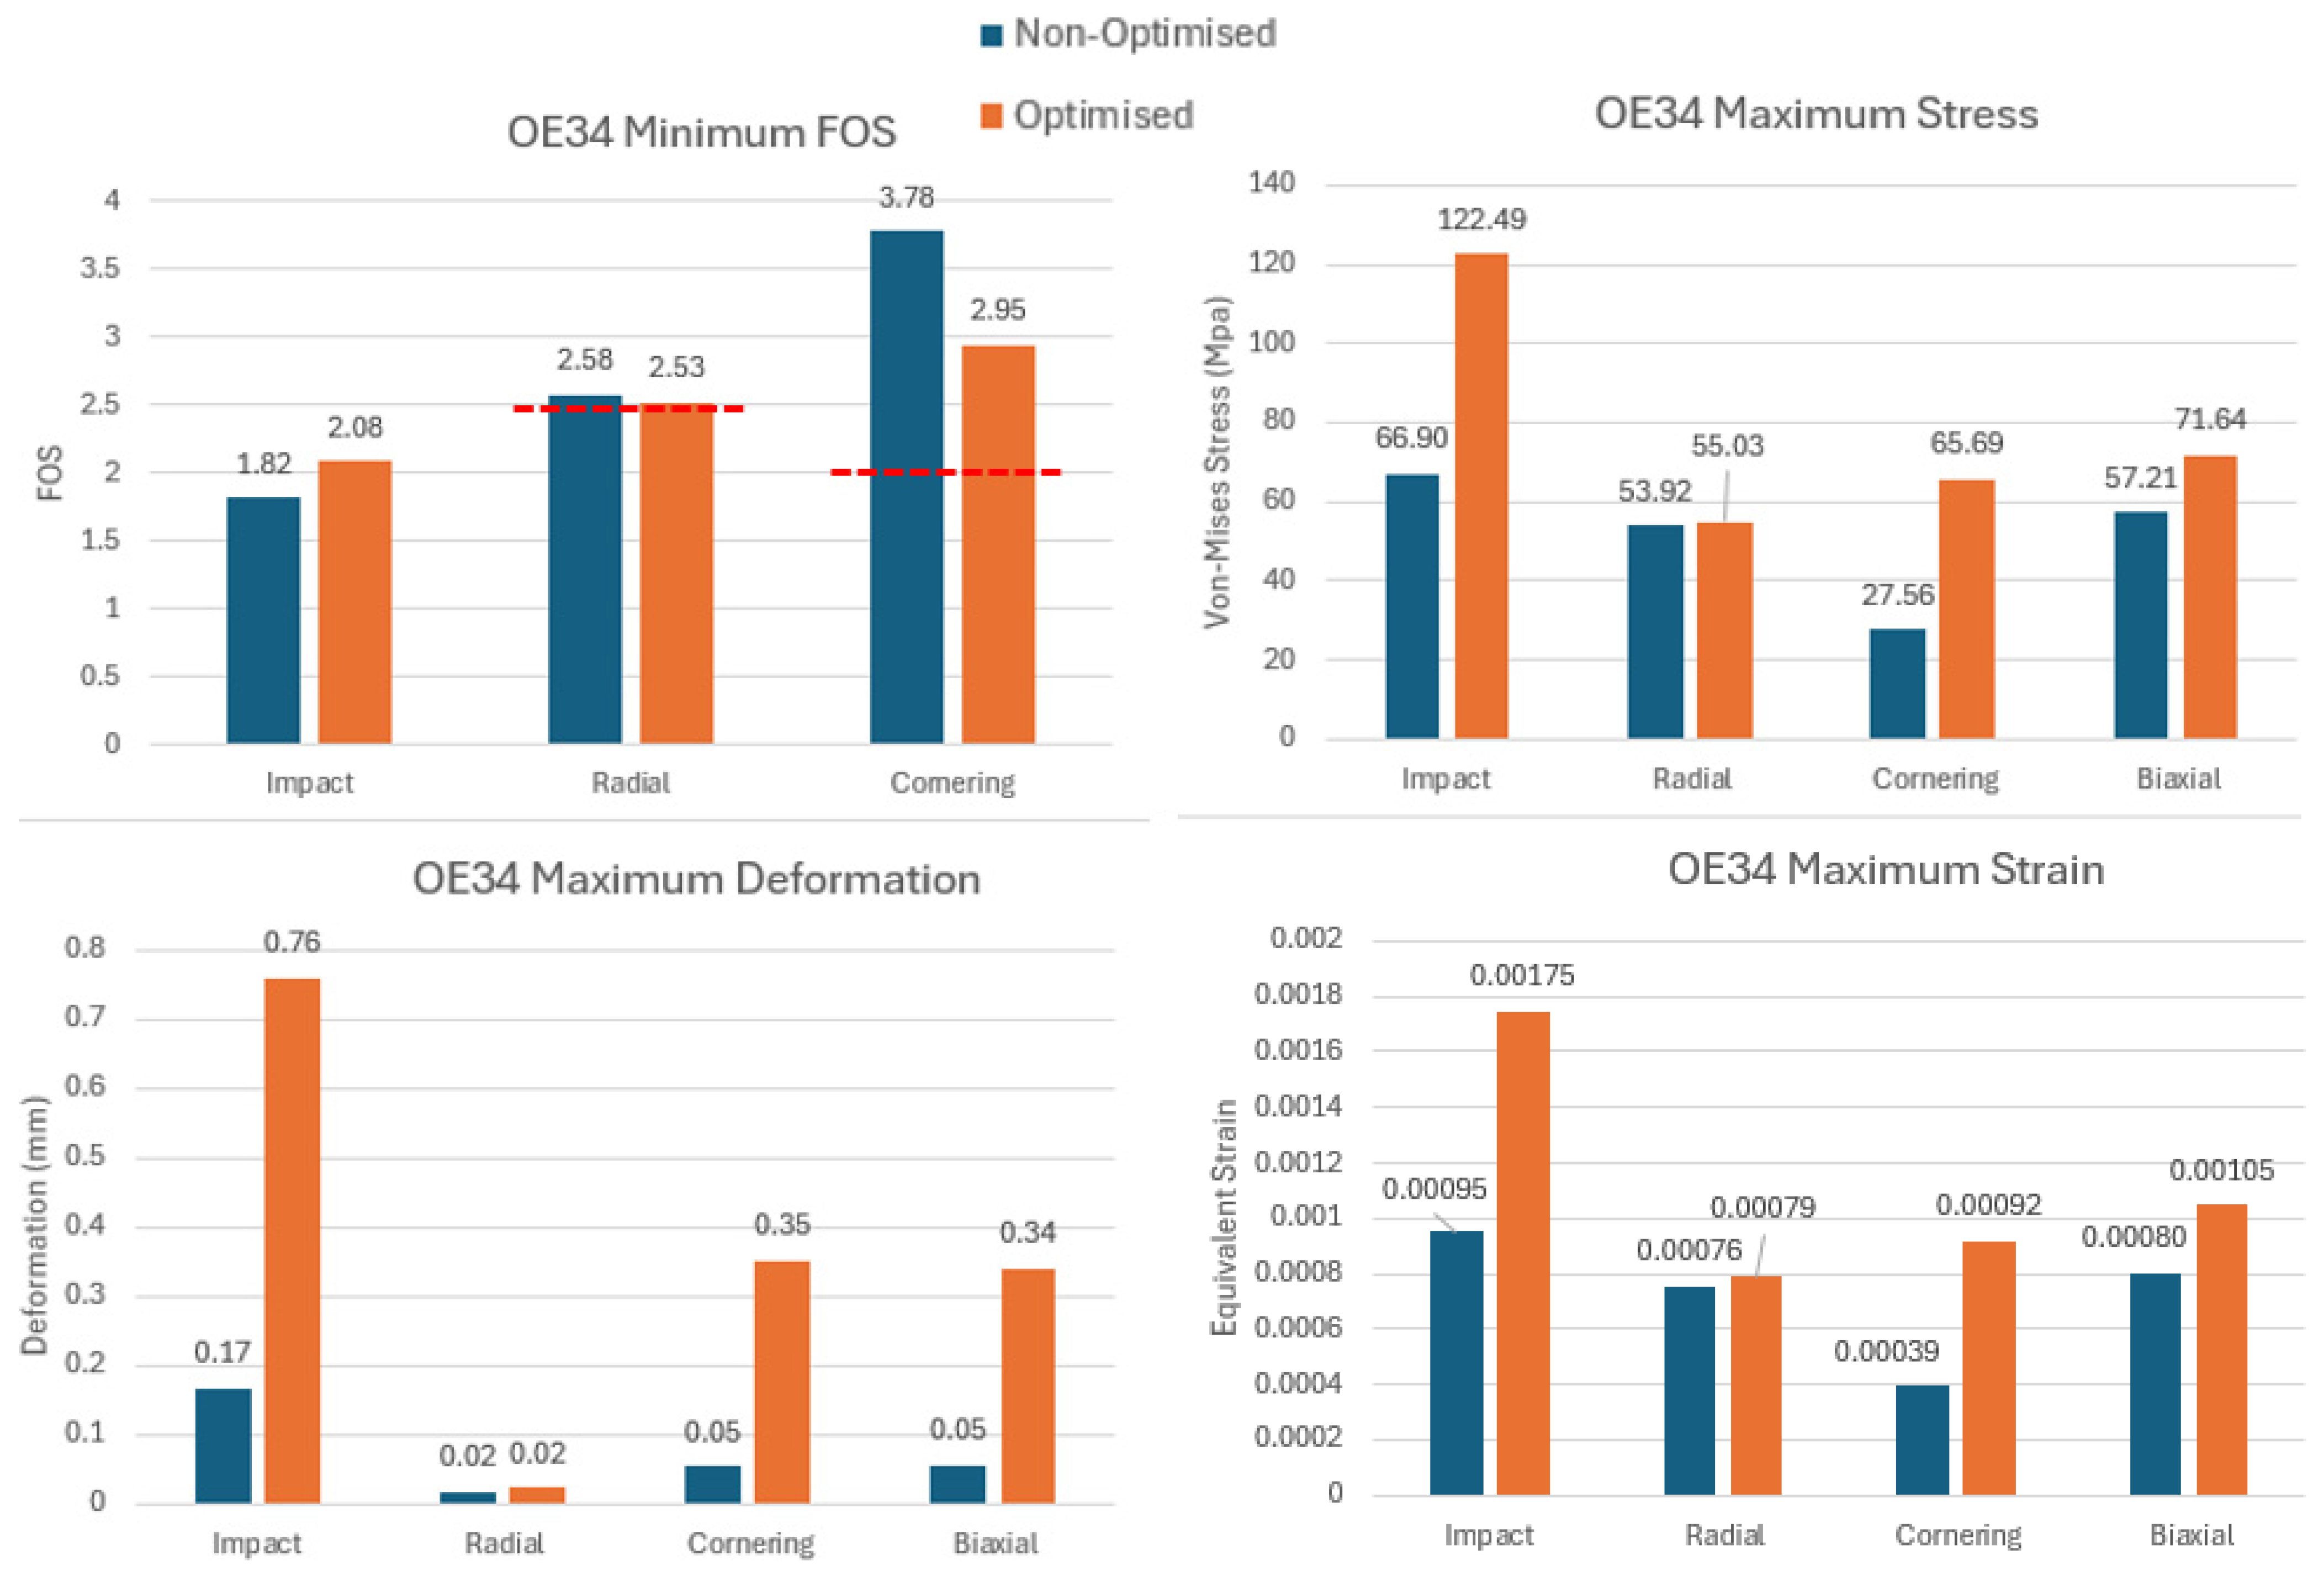
The FEA tests carried out in Section 2.4 were repeated for the revised Wheel A Design. A comparison of results is shown in Figure 14 and Table 8 below.
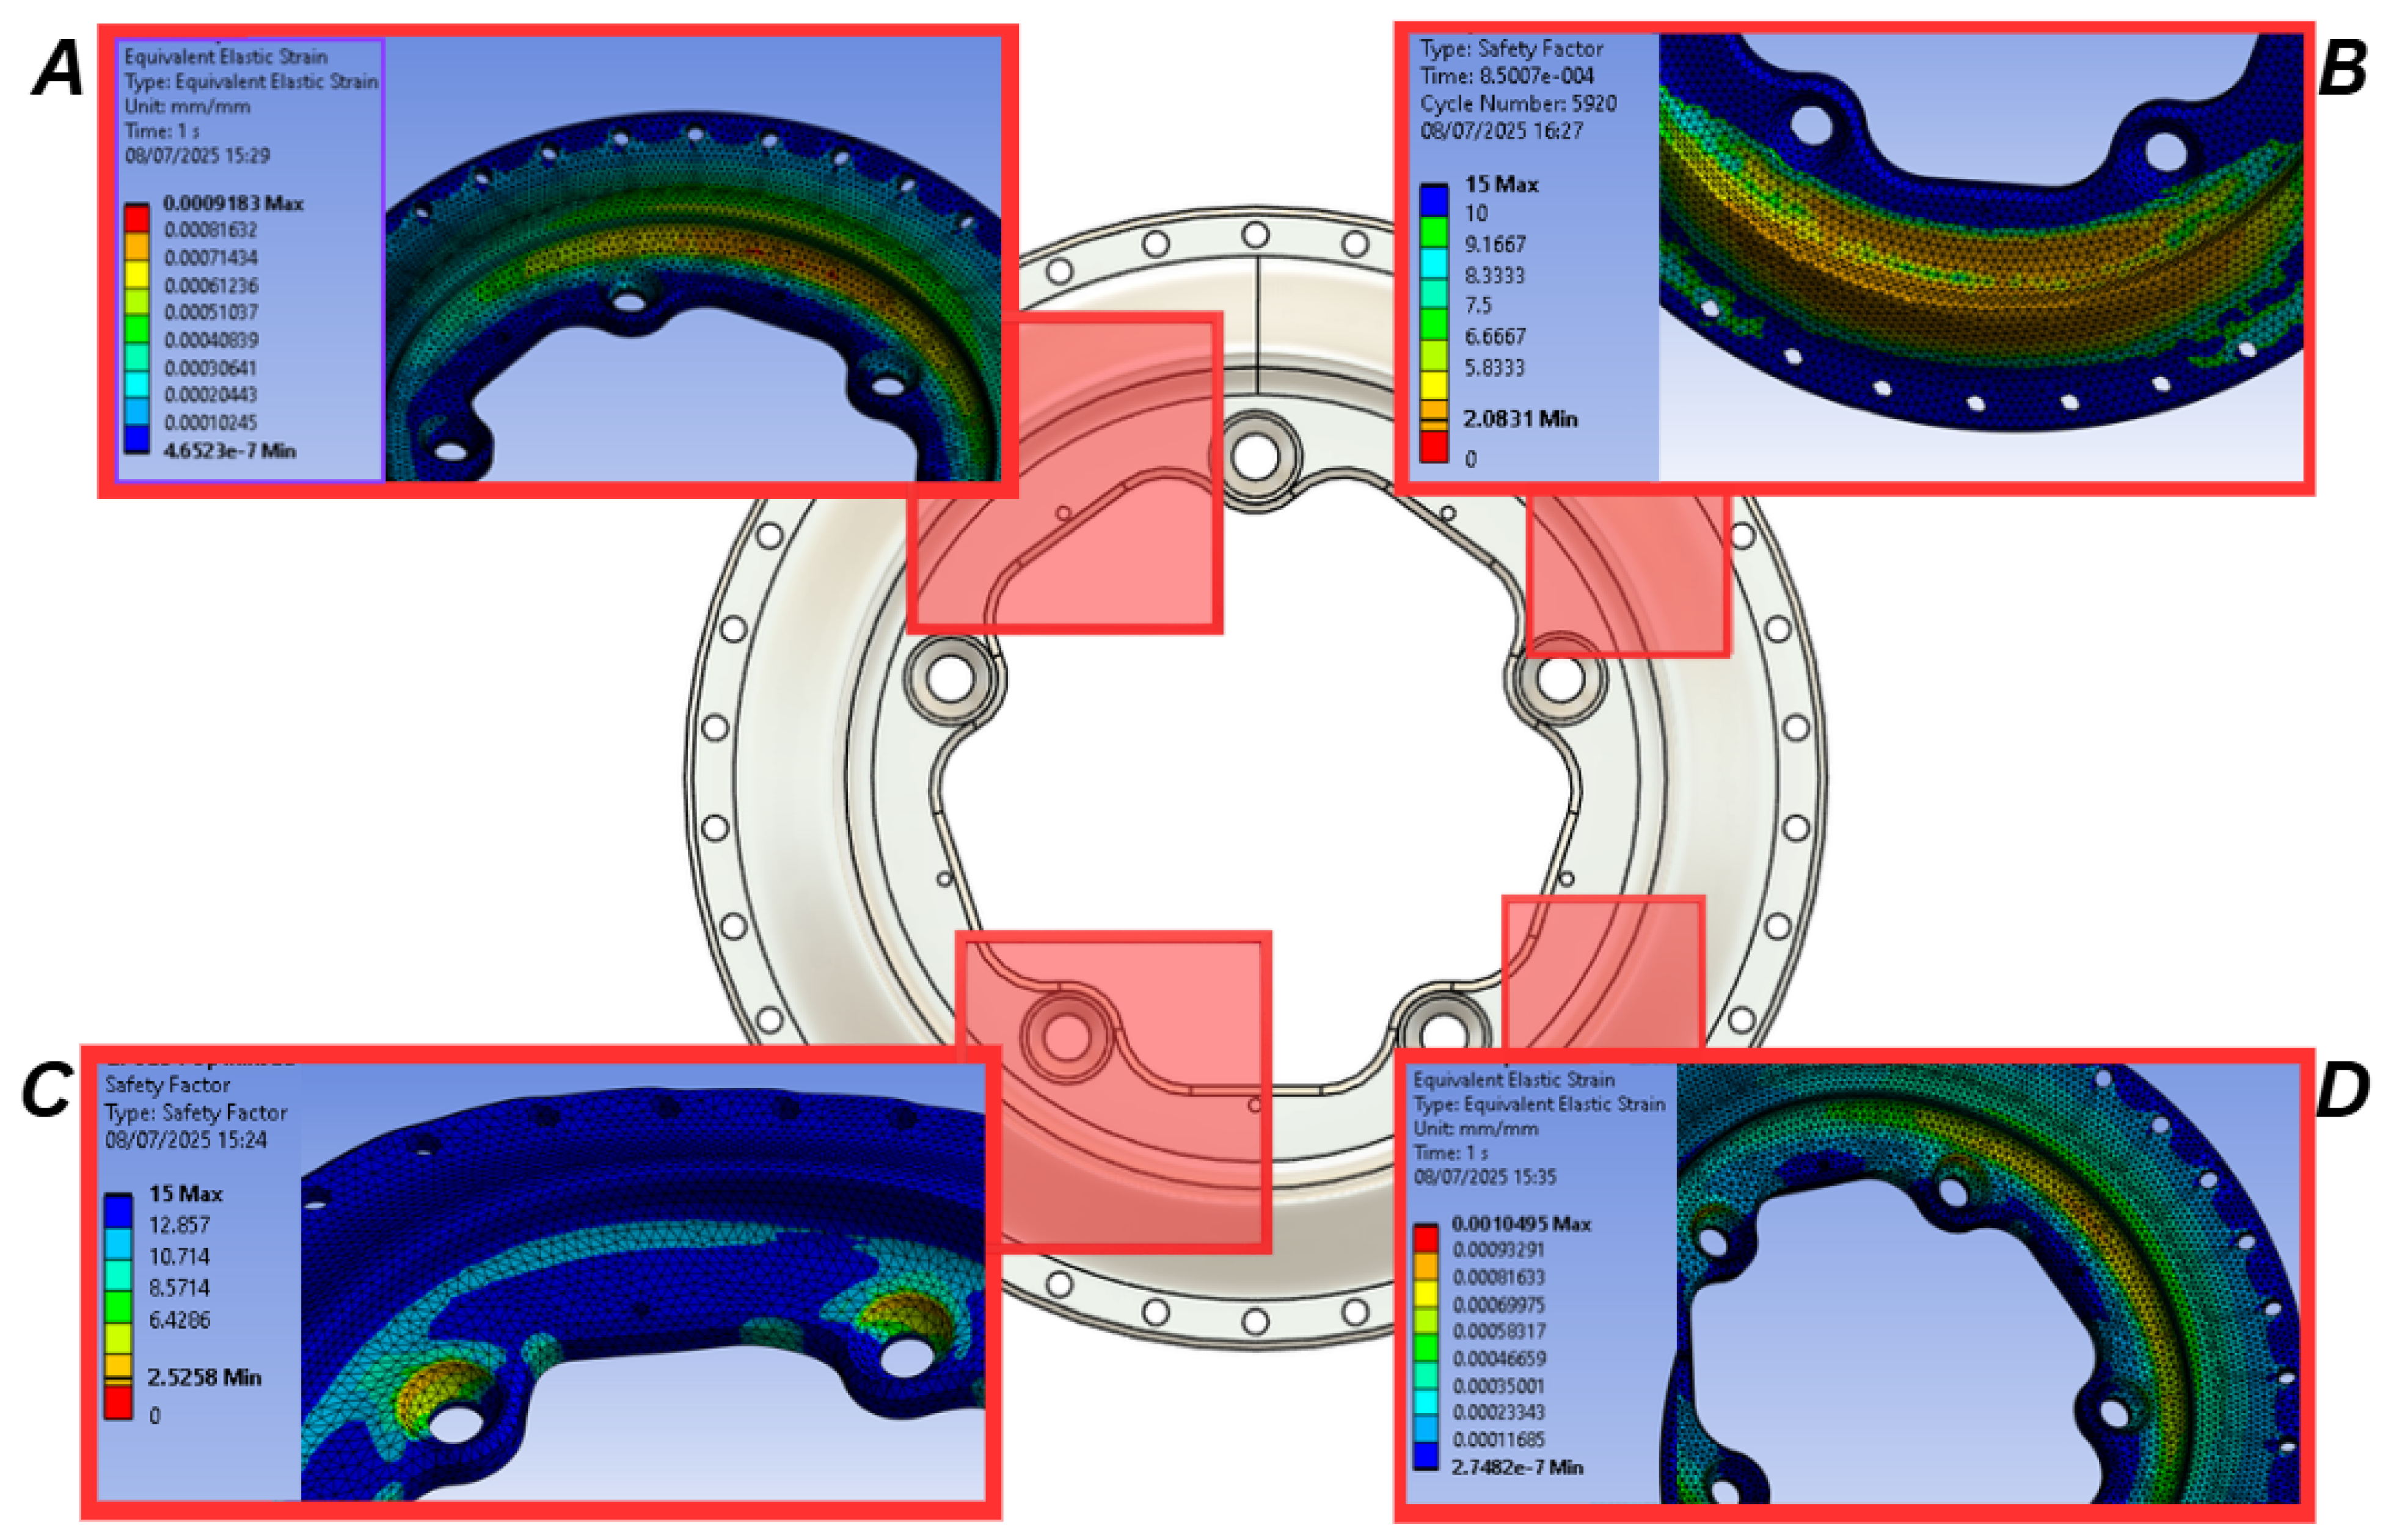
The below discussion refers to data from Figure 14, Table 8, and Figure 15. The redesigned and original Wheel A showed minimal differences under the radial test. Stress increased slightly by 1.11 MPa, strain rose from 0.00076 to 0.00079, and deformation remained unchanged. Despite a 23.9% reduction in wheel mass, the safety factor remained above 2.5 and was concentrated around the wheel bolt countersinks (Figure 15C).
More significant changes were observed in the cornering test. Stress increased from 27.56 MPa to 65.69 Mpa, strain rose from 0.00039 to 0.00092, and deflection by 600% (Figure 15A). Although 600% represents a large percentage change, the absolute displacement remained small: the maximum deformation of 0.35 mm is comparable to other studies, such as Das [34], who observed deflection of 0.32 mm in alloy wheels under similar cornering conditions, and even reached up to 0.73 mm under radial loading.
As a result of the altered geometry, the FOS decreased from 3.78 to 2.95. While notably lower, this FOS still exceeded the minimum threshold of 2 as stated in SAE J328:202107, Section 2.2.3.
The biaxial test showed similar trends to the cornering test, with increased stress, strain (Figure 15D), and deformation, as anticipated. However, in the revised design, these values were distributed over a wider surface area, likely due to the improved use of material.
In the impact test, stress increased by 55.59 MPa and strain by 0.00075. The revised design, with reduced material usage, likely resulted in greater flexibility, allowing deformation in the impact plane to rise from 0.17 mm to 0.76 mm. This increased compliance also led to a FOS of 2.08 (Figure 15B), compared to the 1.82 of the original design.

3.2. Redesigned Wheel B Analysis

The FEA tests carried out in Section 2.4 were repeated for the revised Wheel B Design. A comparison of results is shown in Figure 16 and Table 9 below.
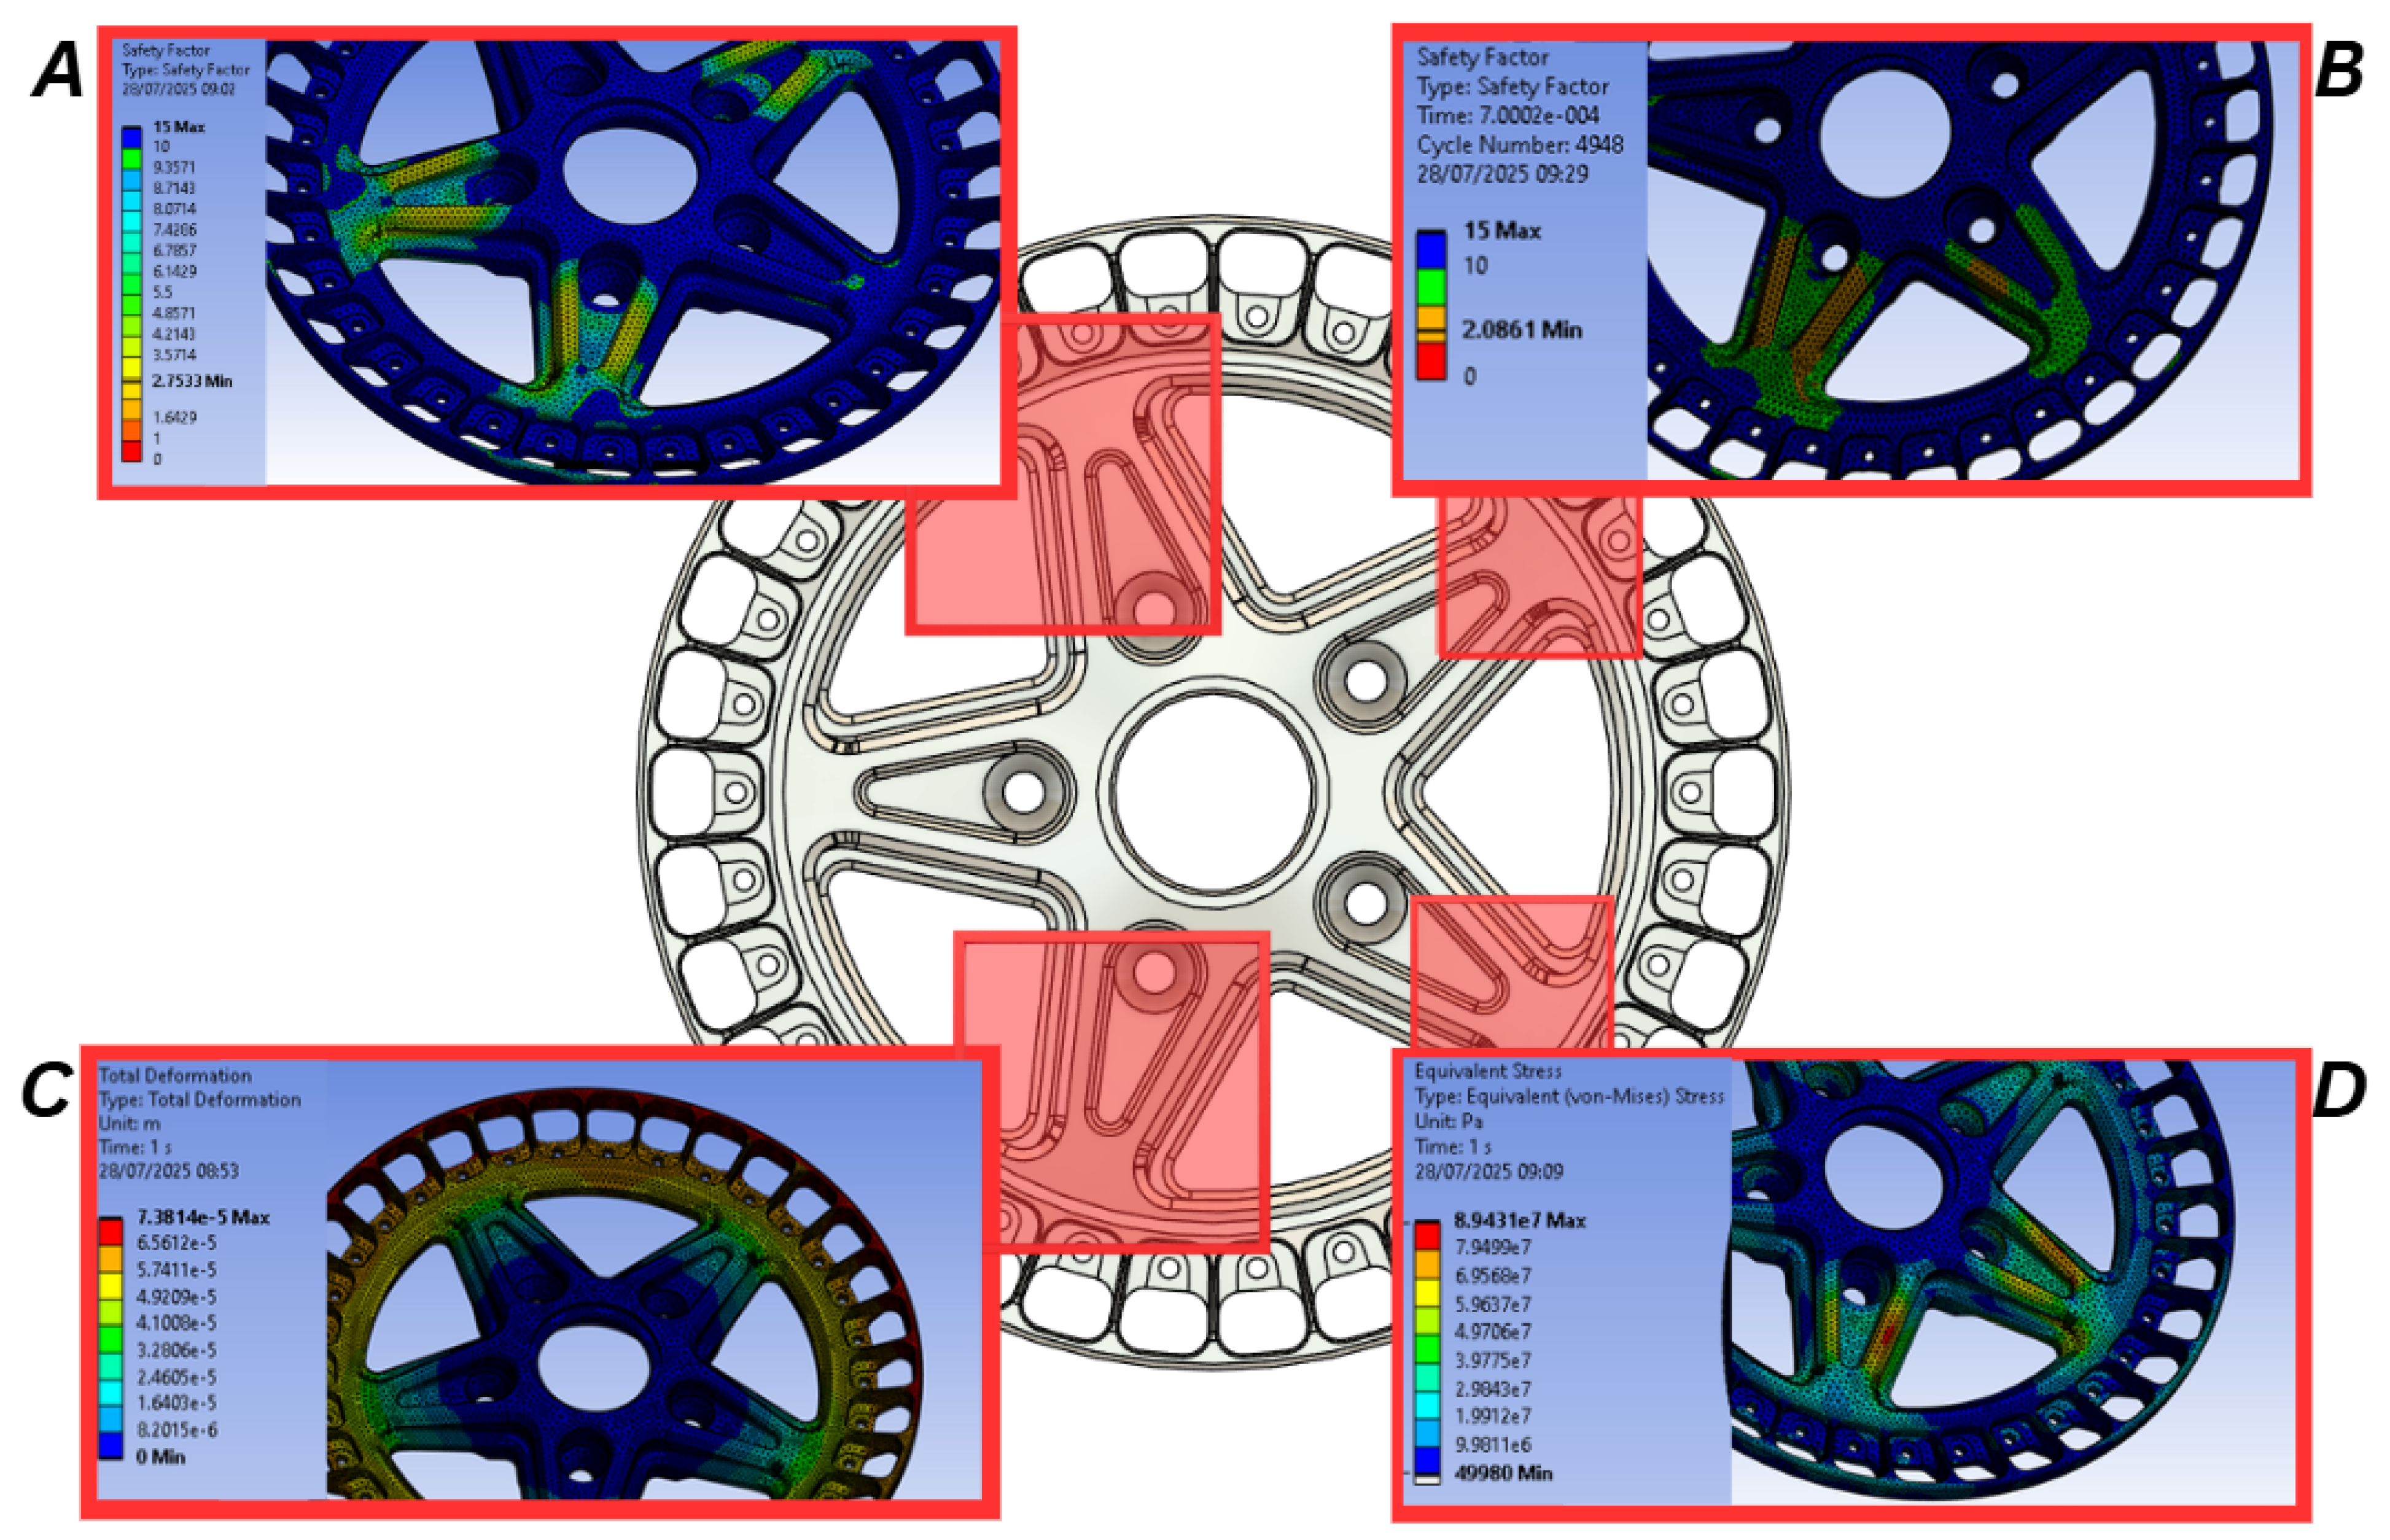
The below discussion refers to data from Figure 16, Table 9, and Figure 17. The redesigned Wheel B demonstrated improved performance in radial load testing. With a mass reduction of 27.07%, the safety factor increased from 2.16 to 2.60, exceeding the required minimum FOS of 2.5. Deformation at the outer wheel edge rose slightly by just 0.02 mm (Figure 17C), while maximum strain at the wheel bolt PCD decreased by 6.38%, attributed to a larger contact area and smoother geometry transitions. The maximum stress (concentrated at the inner bolt PCD) was also seen to decrease by 17.91% to 53.41 Mpa. This value aligns well with published results; Das [34] reported approximately twice this stress under roughly twice the applied radial load, further supporting the validity of the findings.
During cornering, the FOS at the wheel spokes decreased from 3.35 to 2.75, yet remained comfortably above the required minimum of 2 (Figure 17A). The original design exhibited negligible deformation due to excessive material usage. In contrast, the updated Wheel B design allowed for a minimal deformation of 0.6 mm under cornering loads. Maximum stress and strain were recorded at 78.58 MPa and 0.0011, respectively.
Biaxial testing revealed an increase in deformation to 0.59 mm at the outer wheel edge, compared to the previous 0.05 mm. Peak stress reached 89.43 MPa at the spokes, primarily driven by cornering forces, while stress levels remained low throughout the rest of the design (Figure 17D). Strain at the spokes also increased by 48.94%.
During impact testing, a maximum FOS of 2.09 was achieved, shifting from the lock ring PCD (as seen in the original Wheel B) to the wheel spokes. Although the FOS decreased by 22.59%, this reduction was considered acceptable given the substantial material savings in the redesigned model (Figure 17B). Deformation increased to 0.84 mm at the impact site, while stress and strain at the spoke nearest the point of impact rose to 124.26 MPa and 0.0017, respectively.

3.3. Redesigned Wheel C Analysis

The FEA tests carried out in Section 2.4 were repeated for the revised Wheel C Design. A comparison of results is shown in Figure 18 and Table 10 below.
The below discussion refers to data from Figure 18, Table 10, and Figure 19. During radial testing of the redesigned Wheel C, the FOS decreased from 3.78 to 2.88 (Figure 19A). Although reduced, this value remained above the minimum legislative requirement of 2.5. The design revisions resulted in a 22.3% reduction in wheel mass while maintaining structural integrity. The more efficient material distribution led to slight increases in stress and strain—rising by 11.43 MPa and 0.00015, respectively. Maximum deformation doubled, reaching 0.04 mm; however, this remained minimal and occurred only at the wheel’s outer edges.
While substantial material removal was limited to maintain an adequate FOS during the radial test, the redesigned wheel still achieved a high safety factor of 3.7 in the cornering test, well above the required minimum of 2. Stress and strain increased slightly more under cornering loads, primarily concentrated around the now thinner wheel spokes (Figure 19C). Maximum deformation occurred at the outer edge of the wheel but remained low at just 0.2 mm.
As expected, the combined radial and cornering load case produced the highest values across all measured categories. Maximum stress and strain increased by 85% and 86%, respectively, with peak concentrations again observed in the thinner spoke regions (Figure 19B). Reduced material usage resulted in deformation rising from 0.07 mm to 0.24 mm at the wheel’s outer edge, while zero deformation was maintained at the wheel centre.
Despite a 22.3% reduction in material, the impact test results remained relatively consistent between the original and revised designs. Maximum stress and strain increased by only 18% and 29%, respectively, with concentrations primarily around the wheel spokes. Deformation was greatest at the outer edge, where the striker made contact, peaking at 0.68 mm. The minimum FOS was 1.47, indicating that the revised design could withstand approximately 1.5 times the applied impact force (Figure 19D).

3.4. Manufacturing Viability

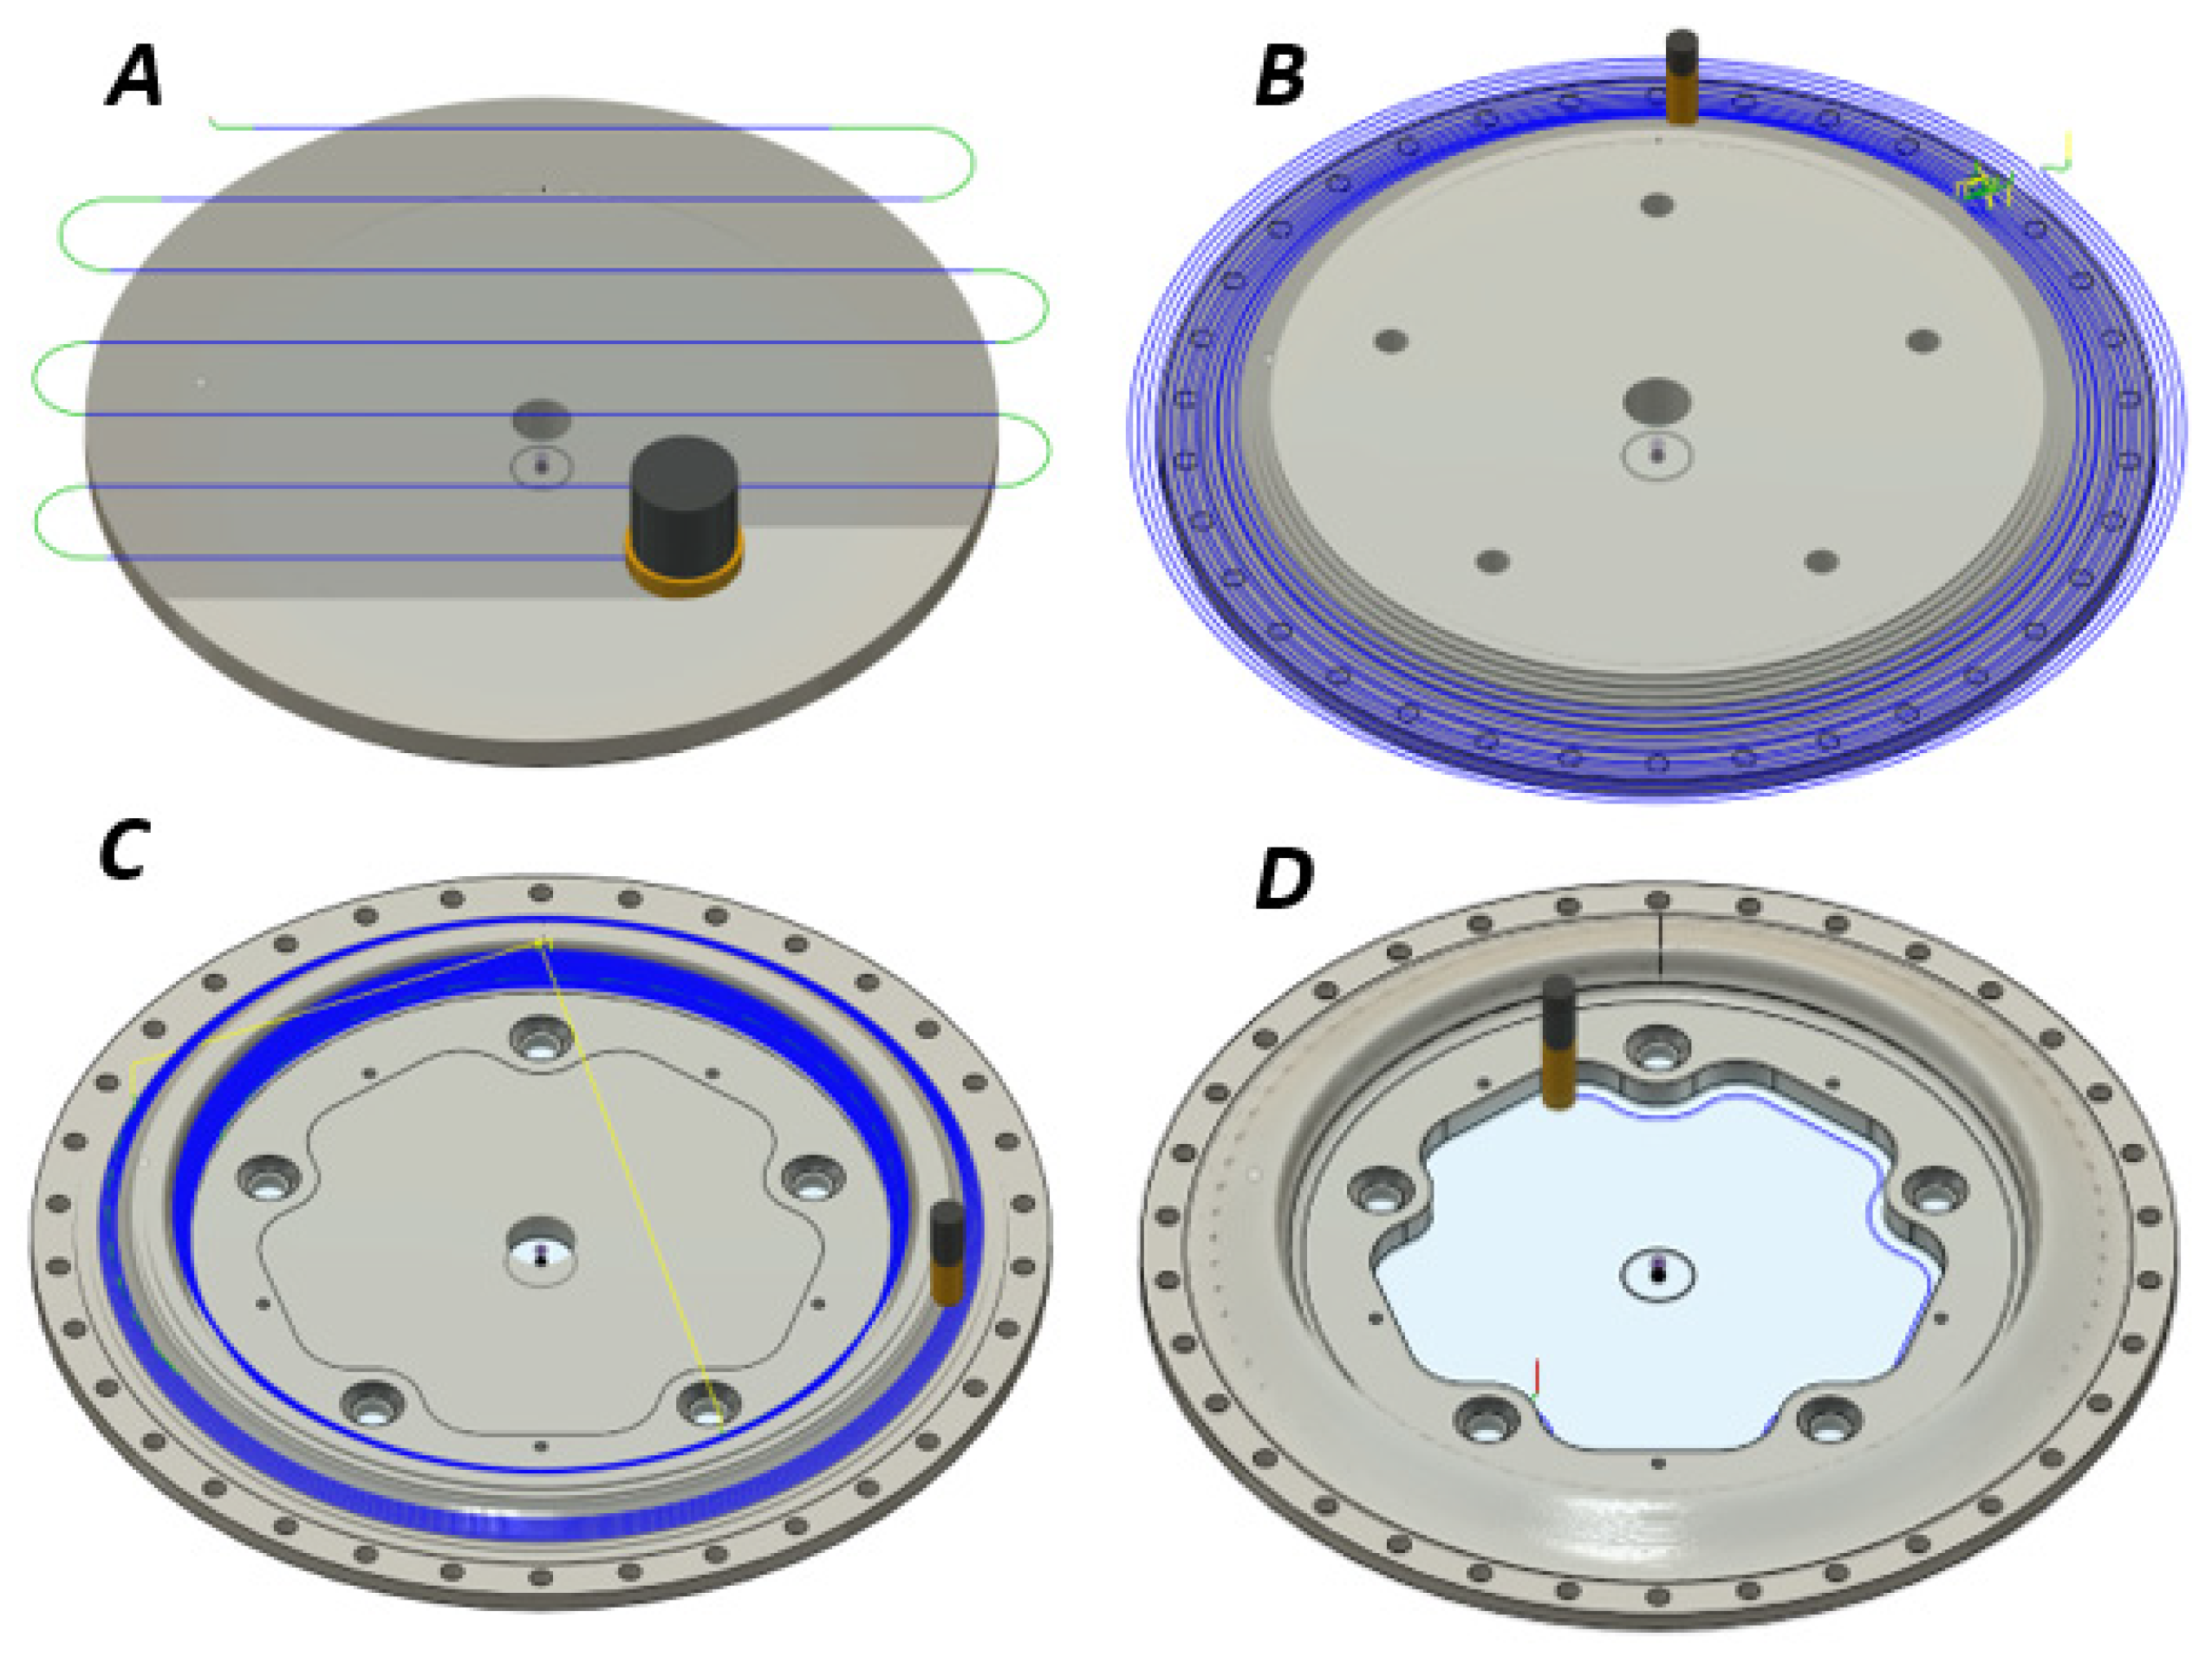
Low-volume wheel manufacturers typically utilise Computer Numerical Control (CNC) machining processes for alloy wheel production, as traditional methods such as casting involve substantial initial tooling costs. Consequently, all wheel geometries in this study were designed to be manufacturable using a three-axis CNC Mill, requiring only two machining operations per wheel (see example machining operation in Figure 20).
From a cost perspective, the 22.3% to 27.07% reduction in wheel mass directly increased the amount of aluminium removed from the billet, thereby maximising recoverable recyclable material and reducing overall material usage. Although some revised and more intricate geometries were expected to increase programming and cycle times due to their complexity, these effects were offset by the shorter overall machining duration.
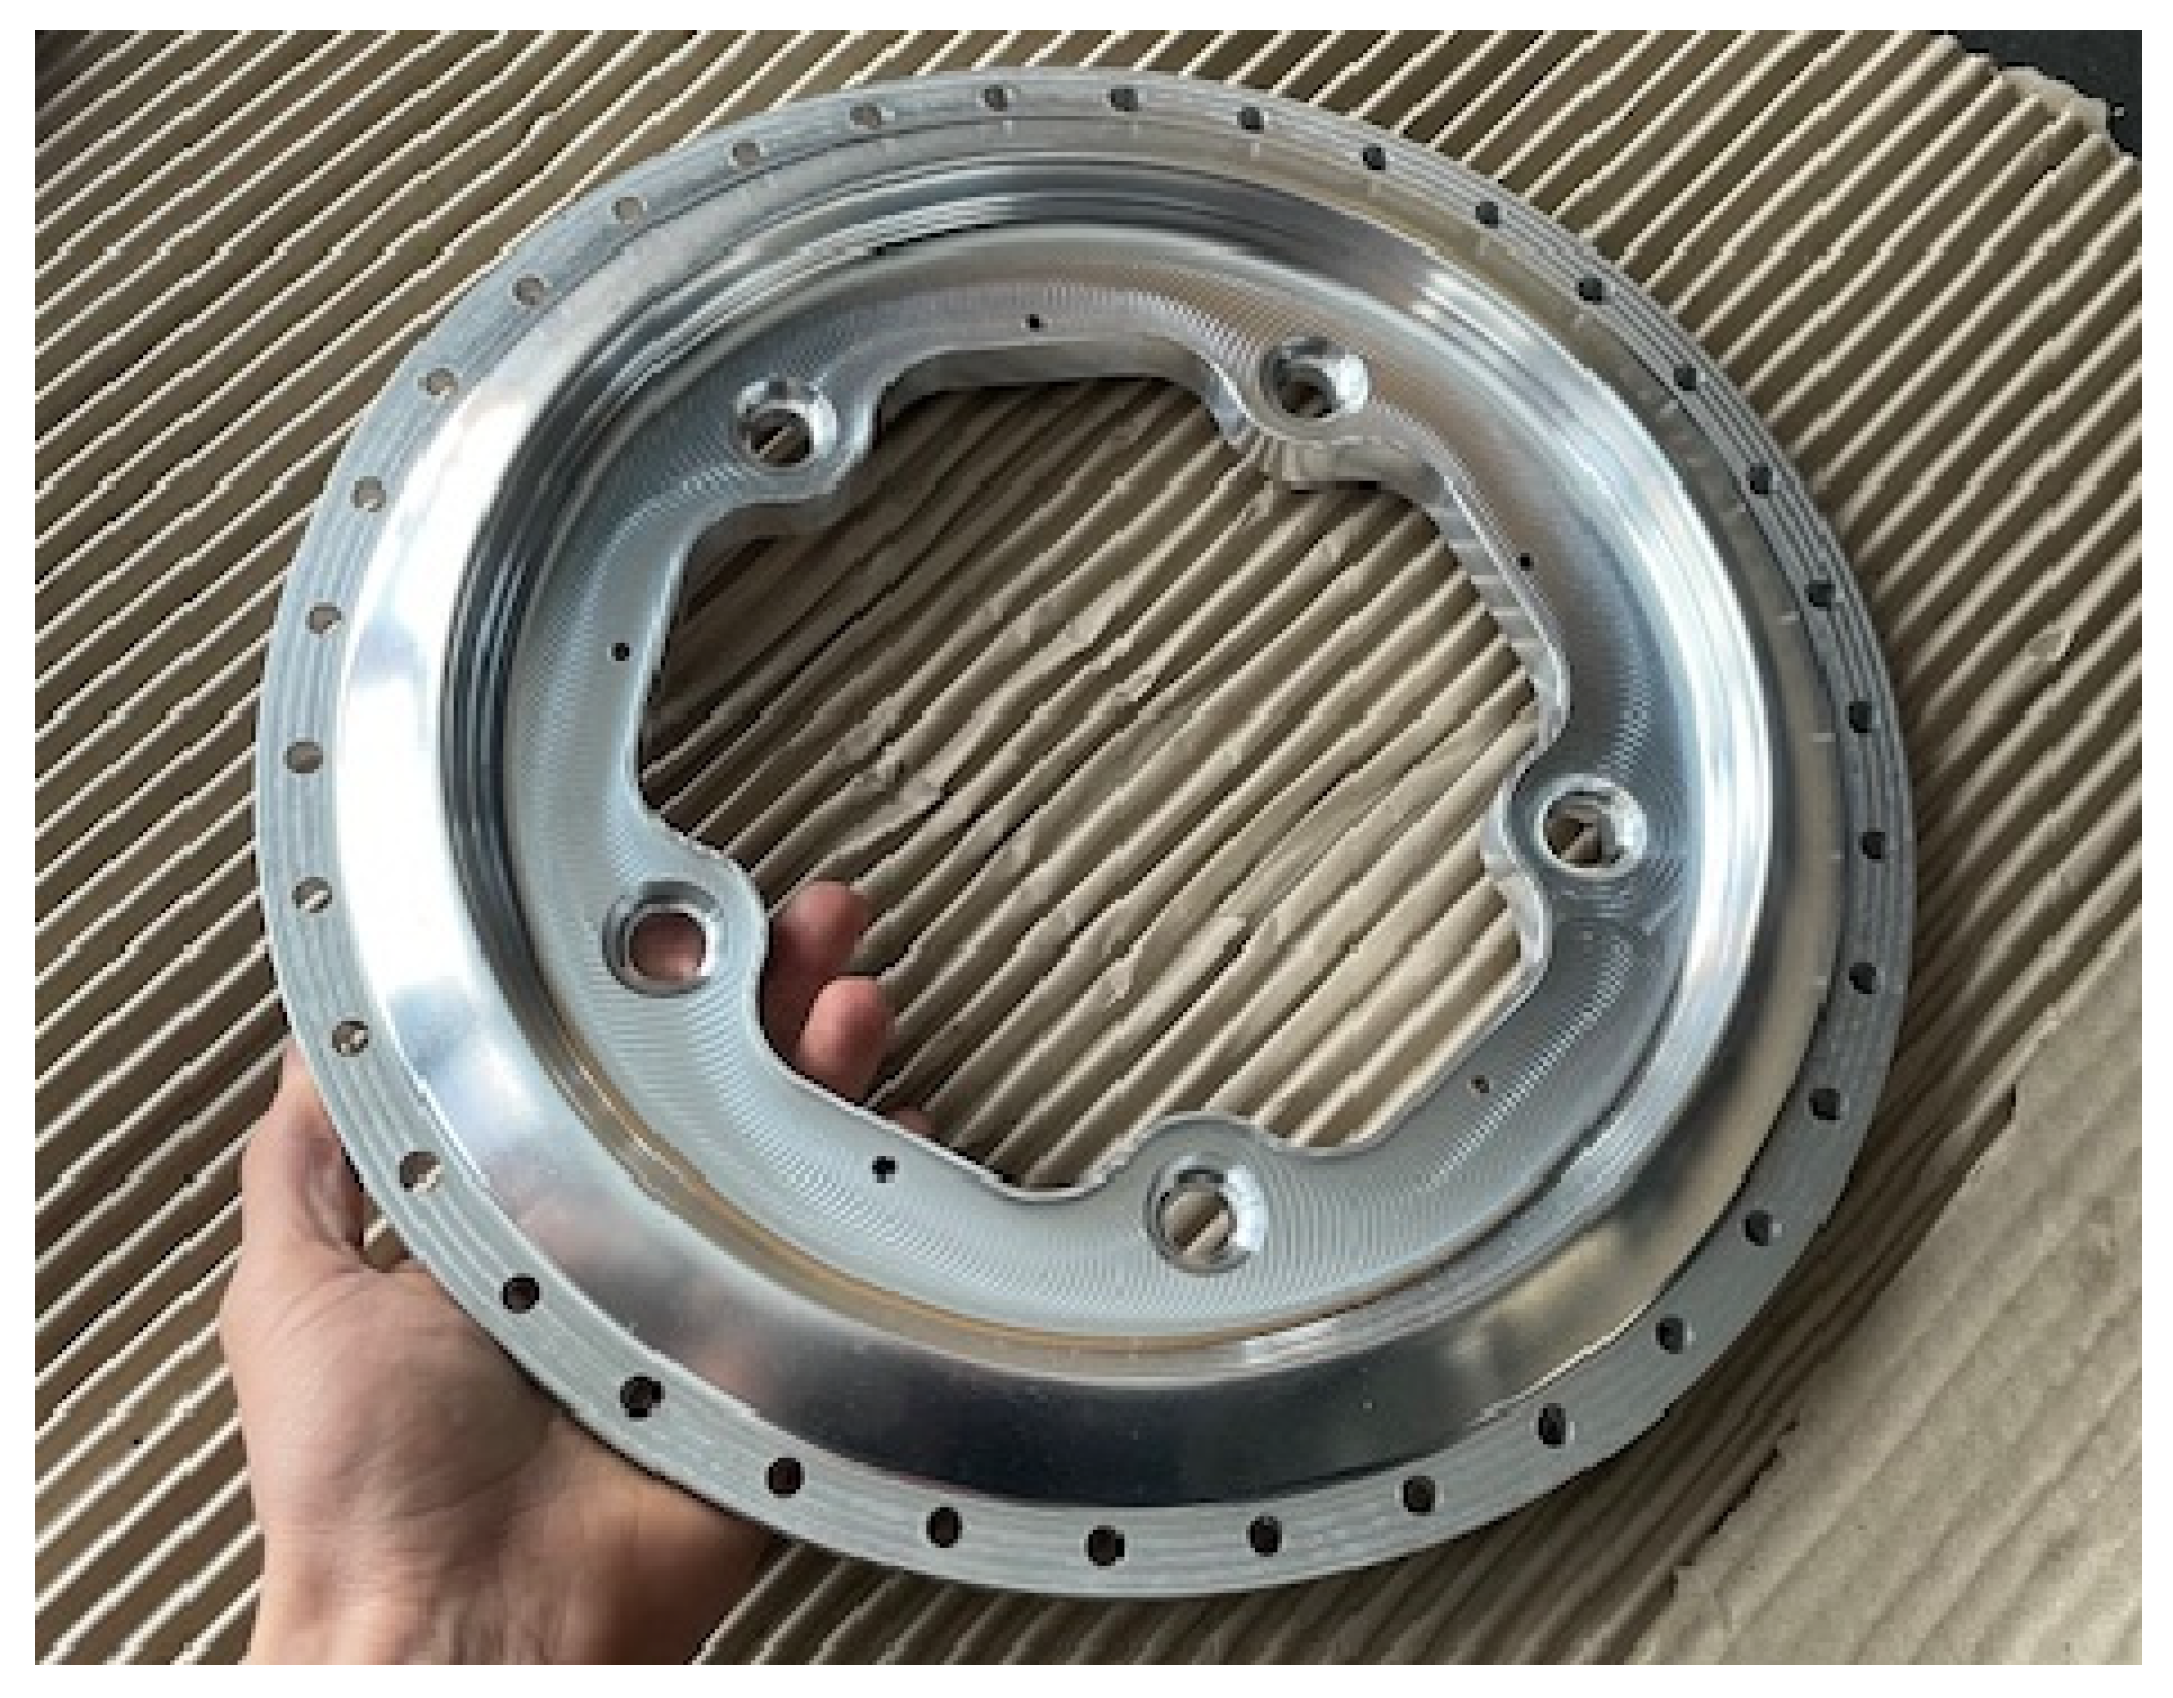
To confirm practical manufacturability, Wheel A was successfully machined at a total cost of £108.95. This value includes labour and material costs, but excludes the profit gained from recycled aluminium (Figure 21).

4. Conclusions

4.1. Summary of Key Points

This research successfully tested and redesigned three-piece alloy wheels, demonstrating compliance with safety standards and structural performance requirements through a digital testing framework. In conclusion, we achieved the following:
  • Comprehensive finite element analysis (FEA) was carried out on three of Company A’s existing alloy wheels. Each design was evaluated under realistic loading conditions, including radial, cornering, biaxial, and impact scenarios. This identified key stress and strain concentrations, areas of excessive deformation, and the factor of safety of designs.
  • Based on the FEA results, targeted design modifications were made to optimise material distribution throughout the wheel designs. Each wheel achieved a weight reduction of up to 25%.
  • All designs met the following international standards:
    • ISO 3006:2015 [12].
    • ISO 14400:2021 [15].
    • SAE J328:202107 [16].
    • SAE J175:200309 [17].
    Minimum FOS above 2.5 were achieved in the radial fatigue tests, and above 2 in the cornering fatigue tests, both in full compliance with ISO 3006:2015. All wheel designs successfully withstood impact loading as specified in SAE J175:200309, and simulation results indicated no predicted crack initiation or excessive deformation, complying with the criteria outlined in ISO 14400:2021.
  • Wheel A was successfully CNC machined at a reasonable cost, confirming practical manufacturability.

4.2. The Next Steps

This work demonstrated that combining FEA and design improvements can significantly enhance the structural performance and manufacturability of bespoke three-piece alloy wheels. However, there are several opportunities for future development and expansion:
  • Further Virtual Testing:
    Further work will involve fatigue life estimation of wheels using the Goodman and S-N curve methods, providing a more comprehensive safety evaluation beyond FOS results.
  • Physical Testing:
    To fully validate the simulation results, it was recommended that Wheel D and all three revised wheel designs be physically manufactured and subjected to fatigue and impact testing using dedicated wheel testing equipment to gather further quantitative data.
  • Broader Range of Wheels:
    Following successful validation, the wheel testing and redesign process should be extended across Company A’s full range of wheels, improving performance, reducing weight, and lowering manufacturing costs.
  • Material Exploration:
    Due to supplier constraints, the wheels in this research were limited to aluminium 6082T6. Future investigations could assess the viability of other materials such as carbon fibre or steel.

Author Contributions

Conceptualization, J.L.; methodology, J.L. and M.F.; software, J.L.; validation, J.L. and M.F.; formal analysis, J.L.; investigation, J.L., M.F. and A.W.A.; writing—original draft preparation, J.L.; writing—review and editing, M.F., A.W.A. and S.I.; supervision, M.F.; project administration, M.F., A.W.A. and S.I. All authors have read and agreed to the published version of the manuscript.

Funding

This research received no external funding.

Institutional Review Board Statement

Not applicable.

Informed Consent Statement

Not applicable.

Data Availability Statement

The original contributions presented in this study are included in the article. Further inquiries can be directed to the corresponding authors.

Conflicts of Interest

The authors declare no conflicts of interest.

Abbreviations

The following abbreviations are used in this manuscript:
AIArtificial Intelligence
FEAFinite Element Analysis
CADComputer-Aided Design
CfCoefficient of Friction
CNCComputer Numerical Control
PCDPitch Circle Diameter

References

  1. Padmanabhan, S.; Vinod Kumar, T.; Thiagarajan, S.; Gopi Krishna, B.; Sudheer, K. Investigation of lightweight wheel design using alloy materials through structural analysis. Mater. Today Proc. 2023; in press. [Google Scholar] [CrossRef]
  2. Genta, G. Motor Vehicle Dynamics; World Scientific: Singapore, 1997. [Google Scholar]
  3. Zhang, Y.; Shan, Y.; Liu, X.; He, T. An integrated multi-objective topology optimization method for automobile wheels made of lightweight materials. Struct. Multidisc. Optim. 2021, 64, 1585–1605. [Google Scholar] [CrossRef]
  4. Zanchini, M.; Longhi, D.; Mantovani, S.; Puglisi, F.; Giacalone, M. Fatigue and failure analysis of aluminium and composite automotive wheel rims: Experimental and numerical investigation. Eng. Fail. Anal. 2023, 146, 107064. [Google Scholar] [CrossRef]
  5. Thomas, D. Intelligence in the Mesh: How AI and FEA are Revolutionising Failure Analysis in Automotive Engineering. J. Fail. Anal. Prev. 2025, 25, 1971–1973. [Google Scholar] [CrossRef]
  6. Rao, K.S.; Rajesh, M.; Babu, G.S. Design and analysis of alloy wheels. Int. Res. J. Eng. Technol. (IRJET) 2017, 4, 2036–2042. [Google Scholar]
  7. Advanced Structural Technologies Inc. One-Piece vs Multi-Piece Wheels. 2024. Available online: https://astforgedwheels.com (accessed on 30 June 2025).
  8. Cheng, L.; Nianzu, R.; Qingsong, Y.; Chao, C.; Cheng, T.; Zhengguo, L. Stress State Measurement and Result Analysis of Car Wheels. IOP Conf. Ser. Mater. Sci. Eng. 2020, 784, 12021. [Google Scholar] [CrossRef]
  9. Firat, M.; Kozan, R.; Ozsoy, M.; Mete, O.H. Numerical modeling and simulation of wheel radial fatigue tests. Eng. Fail. Anal. 2009, 16, 1533–1541. [Google Scholar] [CrossRef]
  10. Raju, P.R.; Satyanarayana, B.; Ramji, K.; Babu, K.S. Evaluation of fatigue life of aluminum alloy wheels under radial loads. Eng. Fail. Anal. 2007, 14, 791–800. [Google Scholar] [CrossRef]
  11. Kocabicak, U.; Firat, M. Numerical analysis of wheel cornering fatigue tests. Eng. Fail. Anal. 2001, 8, 339–354. [Google Scholar] [CrossRef]
  12. ISO 3006; Road Vehicles—Passenger Car Wheels for Road Use—Test Methods. International Organization for Standardization: Geneva, Switzerland, 2015.
  13. Janardhan, J.; Kumar, V.R.; Narayana, R.L. Radial Fatigue Analysis of An Alloy Wheel. Int. J. Eng. Res. Appl. 2014, 4, 253–258. [Google Scholar]
  14. Santiciolli, F.M.; Möller, R.; Krause, I.; Dedini, F.G. Simulation of the scenario of the biaxial wheel fatigue test. Adv. Eng. Softw. 2017, 114, 337–347. [Google Scholar] [CrossRef]
  15. ISO 14400; Road Vehicles—Wheels and Rims—Use, General Maintenance and Safety Requirements and Out-of-Service Conditions. International Organization for Standardization: Geneva, Switzerland, 2021.
  16. J328_202107; Wheels—Passenger Car and Light Truck Performance Requirements and Test Procedures. SAE International: Warrendale, PA, USA, 2021. [CrossRef]
  17. J175_202312; Wheels—Lateral Impact Test Procedure—Road Vehicles. SAE International: Warrendale, PA, USA, 2023. [CrossRef]
  18. Boart, P.; Andersson, P.; Elfström, B. Knowledge enabled pre-processing for structural analysis. In Proceedings of the 1st Nordic Conference on Product Lifecycle Management, Göteborg, Sweden, 25–26 January 2006; p. 89. [Google Scholar]
  19. Ansys. What is Finite Element Analysis (FEA)? Available online: https://www.ansys.com/simulation-topics/what-is-finite-element-analysis (accessed on 3 July 2025).
  20. Chang, C.; Yang, S. Simulation of wheel impact test using finite element method. Eng. Fail. Anal. 2009, 16, 1711–1719. [Google Scholar] [CrossRef]
  21. Korkut, T.B.; Armakan, E.; Ozaydin, O.; Ozdemir, K.; Goren, A. Design and comparative strength analysis of wheel rims of a lightweight electric vehicle using Al6063 T6 and Al5083 aluminium alloys. J. Achiev. Mater. Manuf. Eng. 2020, 2, 57–63. [Google Scholar] [CrossRef]
  22. Smith, J. Smith’s Fundamentals of Motorsport Engineering; Thornes: Cheltenham, UK, 2013. [Google Scholar]
  23. Singh, K.; Gabel, K. Calculation of Dynamic Forces and Analysis of Front Upright for ATV. Int. Res. J. Eng. Technol. (IRJET) 2020, 7, 6314–6319. [Google Scholar]
  24. Wiegand, B.P. Mass properties and automotive braking. In Proceedings of the 81st SAWE International Conference on Mass Properties Engineering, Savannah, GA, USA, 21–25 May 2022. [Google Scholar]
  25. Zhao, L.; Zhao, H.; Cai, J. Tire-pavement friction modeling considering pavement texture and water film. Int. J. Transp. Sci. Technol. 2024, 14, 99–109. [Google Scholar] [CrossRef]
  26. Dhakar, A.; Ranjan, R. Force calculation in upright of a FSAE race car. Int. J. Mech. Eng. Technol. (IJMET) 2016, 7, 168–176. [Google Scholar]
  27. Day, A.J.; Bryant, D. Braking of Road Vehicles, 2nd ed.; Elsevier Science: San Diego, CA, USA, 2022. [Google Scholar]
  28. Ansys. Ansys Workbench. 2024. Available online: https://www.ansys.com/en-gb/products/ansys-workbench (accessed on 15 June 2025).
  29. Ansys. Materials. 2025. Available online: https://www.ansys.com/en-gb/products/materials (accessed on 30 June 2025).
  30. Ansys. What is Explicit Dynamics? 2022. Available online: https://www.ansys.com/en-gb/blog/what-is-explicit-dynamics (accessed on 30 June 2025).
  31. Islam, M.S.; Shahruzzaman, M.; Khan, M.N.; Islam, M.M.; Kabir, S.F.; Mallik, A.K.; Rahman, M.M.; Haque, P. 1—Composite materials: Concept, recent advancements, and applications. In Renewable Polymers and Polymer-Metal Oxide Composites; Elsevier Inc.: Amsterdam, The Netherlands, 2022; pp. 1–43. [Google Scholar]
  32. Farhat, H. Operation, Maintenance, and Repair of Land-Based Gas Turbines, 1st ed.; Elsevier Science: San Diego, CA, USA, 2021. [Google Scholar]
  33. Shrivastava, A. Introduction to Plastics Engineering, 1st ed.; Elsevier Science: San Diego, CA, USA, 2018. [Google Scholar]
  34. Das, S. Design and Weight Optimization of Aluminium Alloy Wheel. Int. J. Sci. Res. Publ. 2014, 4, 1–12. [Google Scholar]
Figure 1. Three-piece aluminium wheel example (picture used with Company A permission).
Applsci 15 11654 g001
Figure 2. Wheel D example failure (picture used with Company A permission).
Applsci 15 11654 g002
Figure 3. Wheel A (A), Wheel B (B), and Wheel C (C) (used with Company A permission).
Applsci 15 11654 g003
Figure 4. Example vehicle weight transfer during braking.
Applsci 15 11654 g004
Figure 5. Braking system nomenclature.
Applsci 15 11654 g005
Figure 6. Example vehicle weight transfer during cornering.
Applsci 15 11654 g006
Figure 7. Maximum forces acting on Wheel D centre.
Applsci 15 11654 g007
Figure 8. FEA boundary conditions and setup for radial (A), cornering (B), and impact (C) tests.
Applsci 15 11654 g008
Figure 9. Experimental (A) versus computational (B) results.
Applsci 15 11654 g009
Figure 10. Wheel nomenclature.
Applsci 15 11654 g010
Figure 14. Wheel A results comparison.
Applsci 15 11654 g014
Figure 15. Revised Wheel A FEA Strain (A,D) and FOS (B,C) results.
Applsci 15 11654 g015
Figure 16. Wheel B results comparison.
Applsci 15 11654 g016
Figure 17. Revised Wheel B FEA FOS (A,B), deformation (C), and strain (D) results.
Applsci 15 11654 g017
Figure 18. Wheel C results comparison.
Applsci 15 11654 g018
Figure 19. Revised Wheel C FEA FOS (A,D) and Strain (B,C) results.
Applsci 15 11654 g019
Figure 20. Wheel A machining operations: facing (A), roughing (B), smoothing (C), and finishing (D).
Applsci 15 11654 g020
Figure 21. Manufactured Wheel A.
Applsci 15 11654 g021
Table 1. Wheel force parameters.
ParameterSchematic AbbreviationValueUnits
Brake Line PressureP13,790,000Pa
Brake Piston DiameterDP0.034m
Number of Pistons Per CalliperNP6(−)
Disc Useable Outside RadiusR20.175m
Disc Useable Inside RadiusR10.073m
Cf of Pad Against Discμ0.5(−)
Tire DiameterDT0.714m
Cf of Tire Against RoadμT0.7(−)
Vehicle MassM1580kg
Single Passenger Mass 62kg
Number of Passengers 4(−)
Number of Wheels 4(−)
Vehicle VelocityV86.28m/s
Centre of Gravity HeightHCOG0.5m
Front Weight DistributionWF0.5(−)
WheelbaseWB2.35m
Unsprung Corner Mass (ONE Corner) 30kg
Corner RadiusRC100m
Track WidthTW1.49m
Wheel and Tire Mass Per CornerMWT14.9kg
Wheel Lock Ring PCDDLR0.418m
Table 2. Longitudinal wheel force calculations.
ResultEquation
0.005448   m 2 T o t a l   p i s t o n   a r e a = π × ( B r a k e   P i s t o n   D i a m e t e r 2 ) 2 × n u m b e r   o f   p i s t o n s   p e r   c a l l i p e r (2)
75127.92   N C l a m p i n g   f o r c e   o f   c a l l i p e r N = B r a k e   l i n e   p r e s s u r e P a × T o t a l   p i s t o n   a r e a   ( m 2 ) (3)
0.124   m D i s c   r a d i u s   ( m ) = D i s c   u s e a b l e   o u t s i d e   d i a m e t e r m + D i s c   u s e a b l e   i n s i d e   d i a m e t e r   ( m ) 4 (4)
4657.93   N m B r a k i n g   T o r q u e   N m = D i s c   R a d i u s m × C l a m p i n g   F o r c e   ( N ) × C f   o f   p a d   a g a i n s t   d i s c (5)
13047.43   N B r a k i n g   F o r c e   a t   T i r e   ( N ) = B r a k i n g   T o r q u e T i r e   D i a m e t e r / 2 (6)
4483.17   N N o r m a l   F o r c e   a t   R o a d = V e h i c l e   M a s s N u m b e r   o f   W h e e l s × G r a v i t y (7)
3138.219   N B r a k i n g   F o r c e   a t   T i r e   ( N ) C f   o f   T i r e   A g a i n s t   R o a d × N o r m a l   F o r c e   a t   R o a d (8)
6.867   m / s 2 D e c e l e r a t i o n   ( m / s 2 ) = B r a k i n g   F o r c e   a t   T i r e V e h i c l e   M a s s / N u m b e r   o f   W h e e l s (9)
6276.44   k g L o n g i t u d i n a l   M a s s   T r a n s f e r   ( k g ) = V e h i c l e   M a s s × D e c e l e r a t i o n × C O G   H e i g h t (10)
5818.58   N W h e e l   L o a d   ( N ) = ( M a s s × W e i g h t   D i s t r i b u t i o n × G r a v i t y × W h e e l b a s e ) + M a s s   T r a n s f e r 2 × W h e e l b a s e (11)
6112.88   N V e r t i c a l   F r o n t   W h e e l   L o a d   d u e   t o   U n s p r u n g   M a s s   ( N ) = U n s p r u n g   M a s s × G r a v i t y (12)
Table 3. Lateral wheel force calculations.
ResultEquation
32.094   m / s V e l o c i t y = M i n i m u m   C o r n e r   R a d i u s × C f   o f   T i r e   A g a i n s t   R o a d × G r a v i t y (13)
1053.09   N C e n t r i f u g a l   F o r c e   f o r   O n e   W h e e l   ( N ) = M a s s × V e l o c i t y 2 × C O G   H e i g h t 4 × C o r n e r   R a d i u s × T r a c k   W i d t h (14)
73.055   N G y r o s c o p i c   F o r c e   ( N ) = 4 × O N E   W h e e l   M a s s × T i r e   R a d i u s 2 2 × V e l o c i t y 2 T i r e   R a d i u s × C o r n e r   R a d i u s (15)
5609.32   N V e r t i c a l   L o a d   o n   O N E   W h e e l   ( N ) = C e n t r i f u g a l + G y r o s c o p i c + ( V e h i c l e   M a s s N u m b e r   o f   W h e e l s × G r a v i t y ) (16)
3926.524   N L a t e r a l   F r i c t i o n a l   F o r c e   a t   C o n t a c t   P a t c h   ( N ) = C f   o f   T i r e   A g a i n s t   R o a d × V e r t i c a l   L o a d (17)
1390   N F 1 = Σ M F 2 C o n t a c t   P a t c h   L a t . F r i c t . F o r c e   ( N ) × ( T i r e   R a d i u s R i n g   P C D 2 ) F 1 (18)
3926.524   N m N e t   L a t e r a l   F o r c e = F 2 F 1 (19)
1401.663   N m I n d u c e d   C o r n e r i n g   M o m e n t = ( F 1 + F 2 ) × ( W h e e l   L o c k   R i n g   P C D / 2 ) (20)
Table 4. Impact test calculations.
ResultEquation
454.2   k g I m p a c t   S t r i k e r   M a s s   ( k g ) = ( 0.6 × T o t a l   V e h i c l e   M a s s N u m b e r   o f   W h e e l s ) + 180 (21)
1024.8   J P o t e n t i a l   E n e r g y   ( J ) = M a s s × G r a v i t y × H e i g h t (22)
2.12   m / s V e l o c i t y = K i n e t i c   E n e r g y 0.5 × M a s s (23)
Table 5. Aluminium 6082T6 material data.
ParameterValueUnits
Elastic Modulus71.9722GPa
Yield Strength2.5923 × 108Pa
Ultimate Tensile Strength318559000Pa
Poisson’s Ratio0.329962(-)
Density2699.83Kg/m3
Table 6. Braking and cornering forces, and striker velocities acting on chosen wheels.
Wheel NameWheel AWheel BWheel C
Radial Load (N)4582.364582.364582.36
Braking Torque (Nm)3022.193022.193022.19
Cornering Load (N)3140.643142.363140.64
Cornering Moment (Nm)1067.821106.111067.82
Striker Velocity (m/s)2.122.122.12
Table 8. Wheel A results comparison table.
Test TypeResultOriginal DesignRevised DesignChange (%)
N/AMass (kg)2.511.91−23.90
RadialFOS2.582.53−1.94
Deformation (mm)0.020.020.00
Strain0.000760.000793.95
Stress (MPa)53.9255.032.06
CorneringFOS3.782.95−21.96
Deformation (mm)0.050.35600.00
Strain0.000390.00092135.90
Stress (MPa)27.5665.69138.35
BiaxialDeformation (mm)0.050.34580.00
Strain0.00080.00125.00
Stress (MPa)57.2171.6425.22
ImpactFOS1.822.0814.29
Deformation (mm)0.170.76347.06
Strain0.000950.001778.95
Stress (MPa)66.90122.4983.09
Table 9. Wheel B results comparison table.
Test TypeResultOriginal DesignRevised DesignChange (%)
N/AMass (kg)4.453.24−27.07
RadialFOS2.162.6020.37
Deformation (mm)0.050.0740
Strain0.000940.00088−6.38
Stress (MPa)64.4453.41−17.12
CorneringFOS3.352.75−17.91
Deformation (mm)0.010.605900
Strain0.000140.0011685.71
Stress (MPa)8.1878.58860.64
BiaxialDeformation (mm)0.050.591080
Strain0.000940.001448.94
Stress (MPa)64.5189.4338.63
ImpactFOS2.702.09−22.59
Deformation (mm)0.160.84425
Strain0.00140.001721.42
Stress (MPa)96.08124.2629.33
Table 10. Wheel C results comparison table.
Test TypeResultOriginal DesignRevised DesignChange (%)
N/AMass (kg)3.973.08−22.3
RadialFOS3.782.88−23.81
Deformation (mm)0.020.04100
Strain0.000520.0006728.85
Stress (MPa)36.8048.2331.06
CorneringFOS3.963.70−6.57
Deformation (mm)0.060.20233.33
Strain0.000450.0008384.44
Stress (MPa)31.8758.5383.65
BiaxialDeformation (mm)0.070.24242.86
Strain0.000590.001186.44
Stress (MPa)41.3776.6985.38
ImpactFOS1.971.47−25.38
Deformation (mm)0.420.6861.90
Strain0.00170.002229.41
Stress (MPa)131.01155.0418.34
Disclaimer/Publisher’s Note: The statements, opinions and data contained in all publications are solely those of the individual author(s) and contributor(s) and not of MDPI and/or the editor(s). MDPI and/or the editor(s) disclaim responsibility for any injury to people or property resulting from any ideas, methods, instructions or products referred to in the content.