Abstract
Laser Powder Bed Fusion (LPBF) technology represents one of the most promising additive manufacturing methods, enabling the production of components with high geometric complexity and a wide range of industrial and biomedical applications. In this study, the influence of both standard and high-productivity process parameters on the microstructure, porosity, surface roughness, and hardness of three commonly used materials, stainless steel 316L, aluminum alloy AlSi10Mg, and titanium alloy Ti6Al4V, was analyzed. The investigations were carried out on samples fabricated using the EOS M290 system, and their characterization was performed with scanning electron microscopy (SEM), electron backscatter diffraction (EBSD), porosity analysis by point counting, Vickers hardness measurements, and optical profilometry. The obtained results revealed significant differences depending on the alloy and the applied parameters. For stainless steel 316L, the high-productivity variant led to grain refinement and stronger crystallographic orientation, albeit at the expense of increased porosity (0.11% vs. 0.05% for the standard variant). In the case of AlSi10Mg alloy, high-productivity parameters enabled a substantial reduction in porosity (from 0.82% to 0.27%) accompanied by an increase in hardness (from 115 HV1 to 122 HV1), highlighting their particular suitability for engineering applications. For the Ti6Al4V alloy, a decrease in porosity (from 0.17% to 0.07%) was observed; however, the increase in mechanical anisotropy resulting from a stronger texture may limit its application in cases requiring isotropic material behavior. The presented research confirms that optimization of LPBF parameters must be strictly tailored to the specific alloy and intended application, ranging from industrial components to biomedical implants. The results provide a foundation for further studies on the relationship between microstructure and functional properties, as well as for the development of hybrid strategies and predictive models of the LPBF process.
1. Introduction
Laser Powder Bed Fusion (LPBF) is one of the most widely applied methods for fabricating three-dimensional metallic objects in a layer-by-layer manner. LPBF belongs to the group of processes known as Additive Manufacturing (AM), in which powder is selectively melted and consolidated layer by layer using a high-energy laser beam [1,2,3]. The components are produced by sequential deposition of successive layers according to the design data derived from a CAD (Computer-Aided Design) file [3,4,5,6]. The LPBF technology was developed by Fockele and Schwarze from Stereolithographie-technik GmbH in collaboration with Meiners from the Fraunhofer Institute for Laser Technology (ILT) in Germany, enabling the production of components from a wide range of metallic and alloy powders [7,8]. Currently, the LPBF process is used for manufacturing components made of steels, aluminum alloys, titanium, cobalt, and nickel, as well as shape memory alloys (NiTi), magnesium alloys, intermetallic compounds, and ceramics, including those specifically designed for orthopedic medical applications [5,9,10,11].
Additive manufacturing represents a viable alternative to conventional manufacturing techniques, and its development is of particular importance in sectors such as the automotive industry, biomedicine, nuclear energy, aviation, and space exploration [10,11,12,13,14,15]. Considering global automotive trends such as electromobility, a further intensive expansion of AM applications can be anticipated [16]. The need to design lighter components capable of supporting heavy batteries while ensuring more efficient thermal management systems will be critical for extending their service life. Consequently, in the automotive industry, cost pressures and production volume requirements are significantly higher than in other sectors [17]. This poses a challenge for LPBF technology, which must deliver high-quality products while simultaneously reducing costs and maintaining efficiency in serial production processes. Nevertheless, in recent years, leading OEMs have begun to employ LPBF for the serial production of aluminum components for new products [17].
The LPBF technology offers numerous advantages, particularly a high degree of design flexibility, enabling the fabrication of complex shapes that would be economically unjustifiable or even impossible to produce using traditional processes [4,5,10,14,15]. In contrast to conventional metalworking methods, which require dedicated tools tailored to specific components and production volumes, LPBF eliminates the need for such tooling [3,17]. Moreover, owing to its flexibility, this process allows for extensive customization of components, the production of parts with complex geometries and high spatial resolution at an acceptable cost [18]. This enables the manufacturing of unique elements with mechanical properties comparable to, and in many cases even superior to, those obtained by conventional technologies, while simultaneously reducing production time and cost—particularly in small-batch production—and lowering the overall weight of the product [6,19]. One of the main advantages of LPBF is its ability to realize complex shapes thanks to geometric freedom, which fosters the development of innovative design solutions [2,11]. For this reason, the process is widely used in rapid prototyping (RP) and is gaining increasing popularity in the production of high-quality functional parts with medium to high surface quality [3,4].
A limitation of the LPBF process is its relatively low build rate and the potential occurrence of inhomogeneities in the mechanical properties of manufactured components. The mechanical performance and durability of LPBF parts are closely correlated with the presence of material defects such as porosity, high surface roughness, residual stresses, and local inclusions [6,18,20,21,22,23,24,25]. Therefore, LPBF process parameters should be carefully adjusted to specific alloys and applications in order to increase the build rate while maintaining an acceptable quality of the components. It should be emphasized that high process efficiency may lead to a higher frequency of material defects.
In industrial applications, the LPBF process is used for the fabrication of complex components from widely applied materials such as steels, aluminum alloys, titanium, chromium, and cobalt, while retaining favorable mechanical properties. Through the use of lightweight metals, LPBF enables the production of complex and lightweight components by reducing mass while maintaining the required strength parameters [11,18,26,27,28].
The unique features of LPBF technology allow for the fabrication of geometries with a high degree of complexity, virtually unattainable by traditional casting processes. The design freedom resulting from the additive nature of the process enables the creation of structures fully optimized in terms of biomechanical, anatomical, and functional requirements. This is of particular importance in medicine, especially in implantology, where it is possible to design and manufacture implants individually tailored to the patient’s anatomy based on data obtained from computed tomography (CT) or magnetic resonance imaging (MRI). As a result, the implant can replicate not only the external shape of a bone or joint but also its internal microstructure, thereby improving mechanical stability and patient comfort [29,30,31,32,33,34,35].
The LPBF technology further enables the fabrication of porous structures with strictly controlled pore size and distribution, which promotes osseointegration, i.e., the ingrowth and permanent bonding of bone tissue with the implant. Porosity can be designed in a gradient manner: high in the zones of contact with tissue to enhance biological anchorage, and low or absent in regions requiring high mechanical strength. The LPBF process also allows for the integration of complex internal channels, holes, and functional networks that can serve various roles—from drug delivery and healing-supporting agents, through cooling or heating systems, to conduits and housings for miniature sensors monitoring the patient’s health status in real time. Such integrated solutions open new perspectives for next-generation smart implants, combining mechanical, biological, and diagnostic functions within a single structure [36,37,38,39,40,41,42]. As a result, LPBF technology enables not only the production of implants with exceptional precision and biocompatibility but also mass reduction without compromising strength, optimization of stress distribution, and shortening of production time. It also facilitates the implementation of patient-specific solutions, which is particularly important in procedures requiring rapid surgical intervention.
In addition to literature reports indicating the high application potential of the discussed technology, there are also studies highlighting discrepancies in the quality of materials produced by LPBF. Vaudreuil et al. point out that the LPBF process is characterized by high variability, resulting in low repeatability [11]. In contrast, Gupta et al. emphasize that LPBF ensures very good repeatability [3]. In the LPBF process, numerous parameters—such as layer thickness, laser power, scanning speed, hatch spacing, and scanning strategy—have a significant influence on the surface topography of printed elements. Achieving high-quality components is therefore challenging due to the large number of process parameters and the complex physics involved [19]. For this reason, surface topography measurements and characterization are crucial for quality control of additively manufactured parts. Both destructive and non-destructive testing are essential, including porosity and defect qualification, determination of surface roughness parameters, microstructural analysis, and evaluation of mechanical properties. Process repeatability is of particular importance in the automotive industry, where compliance with strict standards such as IATF 16949 is required.
The main objective of this study is to investigate and compare different commonly used industrial materials manufactured with sets of process parameters that allow for both high (standard) and low (high productivity) build rates, in order to meet the stringent requirements of manufacturers. To justify the economic feasibility of serial production, it is necessary to ensure consistently high quality at the maximum possible process speed and at minimal cost.
2. Materials and Methods
In this study, three different metallic powders were used to examine the influence of process speed and cost on the quality of the fabricated products. Some of the most commonly applied materials in industrial applications were selected, namely the Ti6Al4V alloy, stainless steel 316L, and the AlSi10Mg alloy. The use of these materials aimed to demonstrate that high product quality does not preclude the possibility of employing a process with relatively low cost. The samples were produced using an EOS M290 machine (EOS GmbH, Krailling (near Munich), Germany) equipped with a 400 W laser and dedicated powders: EOS Titanium Ti64, EOS StainlessSteel 316L, and EOS Aluminium AlSi10Mg [29,30,31]. Gas-atomized powders supplied by EOS were used for the LPBF process. The Al10SiMg powder had a particle size distribution of 25–70 µm, the Ti6Al4V powders ranged from 20 to 80 µm, and the 316L stainless steel powder from 20 to 65 µm.
In the LPBF process, cubic samples with an edge length of 10 mm were manufactured. That type of samples commonly is used as benchmark for process parameter optimization due to their convenient size and the possibility of applying that size as parameter in scanning strategies such as the chessboard, island or stripe. This geometry allows for efficient parameter development and ensures good scalability to larger components. It represents a practical “golden mean” widely adopted in both scientific research and industrial practice.
Two sets of parameters within the process window of the machine were applied. The “standard” parameters were characterized by a higher build rate, which allowed for reduced manufacturing time and lower costs. In contrast, the “performance” parameters were applied to achieve the highest printing quality at the expense of longer production times.
Due to the supplier’s proprietary know-how, the produced samples were compared in terms of volume rate (VR) and Volume Energy Density as indirect parameters. Selected parameters are summarized in Table 1. VR and VED were calculated as follows:
where P is the laser power (W), v is the scanning speed (mm/s), h is the hatch distance (mm), and t is the layer thickness (mm).

Table 1.
The set of parameters used for sample fabrication.
According to the manufacturer’s data, the chemical composition of the materials used in the LPBF process with the EOS M290 machine and dedicated powders is presented in Table 2, Table 3 and Table 4.
Table 2.
The chemical composition of Al-Sil0-Mg LPBF [29].
Table 3.
The chemical composition of 316L steel LPBF [30].
Table 4.
The chemical composition of Ti6Al4V LPBF [31].
To determine the influence of the “standard” and “performance” parameters, the roughness, microstructure, porosity, and hardness of all obtained samples were characterized.
After completion of the LPBF process, the samples were cut from the build plate without any additional finishing operations. They were subsequently sectioned using a precision saw, followed by grinding, polishing, and etching to reveal the microstructure.
Microstructural analysis was performed using scanning electron microscopes (SEM)—Inspect S50 (FEI) and Nova NanoSEM (FEI). Secondary electron (SE) and backscattered electron (BSE) contrast were used for characterization. To identify grain morphology and crystallographic orientation, electron backscatter diffraction (EBSD) was also employed. EBSD maps were recorded for each sample in a plane parallel to the build direction (BD), over an area of 540 × 540 µm2 with a step size of 1 µm.
The obtained data were analyzed using the MTEX package (5.11.2 April 2024) [32] within the Matlab 2022a environment (The MathWorks Inc., Natick, MA, USA). Grain boundaries were defined for misorientation angles above 10°. Based on the grain boundary data, the equivalent circle diameter (ECD) and aspect ratio were determined. For all samples, inverse pole figure (IPF) maps, high-angle grain boundaries, and pole figures (PF) were generated, whereas for the Ti6-Al-4V alloy, additional reconstruction of primary β-phase grains and phase-distribution maps was performed.
Porosity was analyzed using the point counting method. To determine the volume fraction of pores (Vv), SEM BSE images were employed. A regular grid with a fixed density comprising 1050 points was superimposed on at least five images for each sample. The total analyzed porosity area was no less than 1,400,000 µm2.
Porosity (V%) was calculated according to Equation (1). The method error (δ) was determined based on Equation (2).
Hardness measurements were carried out using a Duramin-40 hardness tester (Struers, Kraków, Denmark) with a Vickers indenter under a 1 kg load. The average hardness value was determined from at least 10 measurements performed in the central area of planes parallel and perpendicular to the build direction (BD). For all samples, the measurements were taken in the middle region on the polished surface.
The surface roughness parameters of the top and side surfaces of the “as-printed” samples were evaluated using a Wyko NT930 optical profilometer (Veeco, Plainview, NY, USA). Based on the obtained roughness profiles, the parameters Ra (arithmetic mean roughness) represents the average deviation of the surface profile from the mean line, while Rz (average maximum height of the profile) is defined as the average vertical distance between the five highest peaks and the five deepest valleys within the evaluation length. The roughness tests were performed on samples without any finishing operations.
3. Results and Discussion
3.1. Surface Roughness
Figure 1, Figure 2 and Figure 3 present the surface roughness of the top and side surfaces of samples produced by the LPBF method from 316L stainless steel (Figure 1), AlSi10Mg alloy (Figure 2), and Ti6Al4V alloy (Figure 3). In all examined samples, surface morphologies characteristic of the LPBF process were observed. On the side surfaces, cyclic effects associated with the deposition of successive layers were visible, whereas on the top surfaces, protrusions and elongated ridges resulting from the solidification of melt pool tracks were observed.
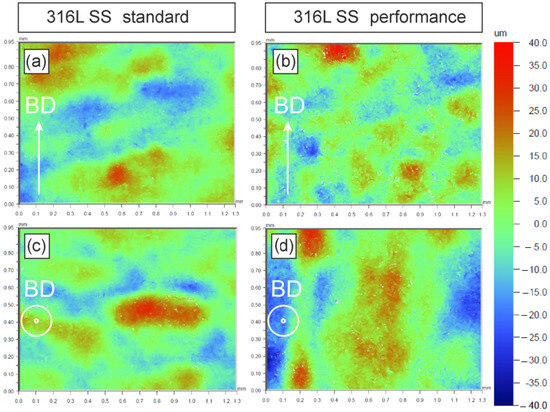
Figure 1.
Surface Roughness maps of 316L for (a,b) side wall and (c,d) top surface optical profiler.
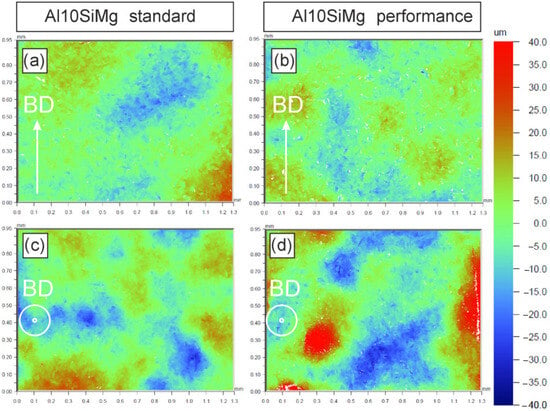
Figure 2.
Surface Roughness maps of AlSi10Mg for (a,b) side wall and (c,d) top surface, optical profiler.
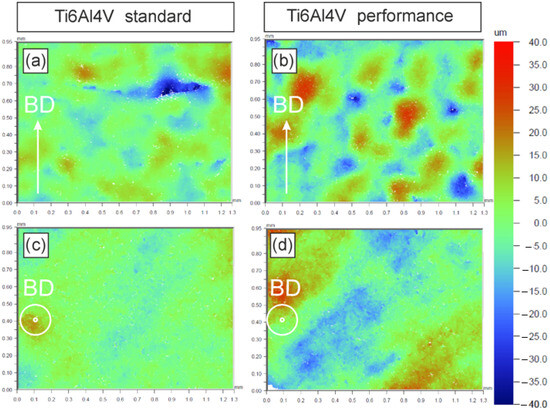
Figure 3.
Surface Roughness maps of Ti6Al4V for (a,b) side wall and (c,d) top surface, optical profiler.
For 316L stainless steel, the surface roughness was comparable for samples produced with both the “standard” and “performance” parameter sets. Only a slightly higher Ra value was noted for the “standard” sample on the side surfaces, which may be attributed to the presence of partially melted powder particles. The spacing between peaks and valleys was larger in the “standard” sample, which may indicate a greater hatch distance during the LPBF process and wider melt pools. On the top surface, elongated ridges formed by the solidification of melt pool tracks were observed. No significant differences between the samples were identified for this surface.
For the AlSi10Mg alloy, the performance variant was characterized by lower Ra and Rz values on the side surfaces, which can be linked to a smaller powder layer thickness in this parameter set. Conversely, for the top surface of the performance sample, the Ra and Rz values were approximately two and three times higher, respectively, compared to the “standard” sample. The increase in top surface roughness was associated with a smaller hatch distance, which promoted the creation of random elevations and creation of small protrusions. Despite the noticeable pronounced elevations on the top surface, they did not exhibit characteristics of balling and were instead random distributed [33].
For the Ti6Al4V alloy, both in the “standard” and “performance” variants, the Ra and Rz values were higher for the side surfaces compared to the top surfaces. On the side surface of the performance sample, a greater number of defects in the form of sintered powder particles were observed, whereas in the “standard” sample such defects occurred only sporadically. Similarly to 316L stainless steel, elongated ridges formed along the laser scanning tracks were observed on the top surfaces. In the “standard” sample, a significantly higher Rz value was recorded on the side surface, which was associated with the sporadic occurrence of large voids between layers.
For the 316L stainless steel samples, no significant differences in surface roughness were observed, suggesting that both parameter sets enable the achievement of satisfactory surface quality without the formation of surface defects during the LPBF process. In the case of AlSi10Mg and Ti6Al4V alloy samples produced using performance parameters, a decrease in Ra and Rz values was recorded for the side surfaces compared to the top surfaces. The reduction in side surface roughness is attributed to the lower hatch distance and higher VEDin the performance variant. Conversely, the increase in top surface roughness is associated with the use of parameters with higher VED, particularly a smaller hatch distance, which can lead to the formation of spherical or elongated protrusions at the melt pool boundaries due to the interaction of the molten metal with the laser beam and the higher energy concentration in a smaller volume [33,34].
A comparison of Ra and Rz parameters for the side and top surfaces of the LPBF-fabricated samples is presented in Figure 4. The results indicate that 316L stainless steel is relatively insensitive to process parameter variations in terms of surface roughness, whereas the AlSi10Mg and Ti6Al4V alloys show a pronounced dependence on the applied strategy. In particular, the performance mode led to smoother side surfaces; however, for the AlSi10Mg alloy, it resulted in a significant deterioration of top surface quality due to the increased volumetric energy density. This phenomenon is consistent with the observed complex interaction between melt pool dynamics, hatch distance, and the powder consolidation process in LPBF technology.
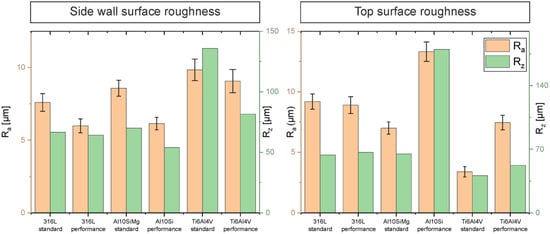
Figure 4.
Columnar diagram of Ra and Rz parameters for 316L steel, Ti6Al4V alloy and AlSi10Mg alloy manufactured in “standard” and “performance” variants for side wall and top surface of cube samples.
From an application perspective, it is crucial that the obtained Ra values for all investigated alloys significantly exceed the recommended threshold of 0.8 µm for metallic biomaterials [35]. This indicates that, in the context of implantology, “as-printed” surfaces do not meet the requirements that promote osseointegration and reduce the risk of premature failure. It should be emphasized that high surface quality with low roughness is a prerequisite for stable implant integration with bone tissue, as overly rough surfaces may lead to unfavorable biological or mechanical effects. Although the surface of LPBF-fabricated components can be improved through finishing operations, in the case of implants as well as thin-walled and lightweight structures, this aspect becomes critical rather than secondary. High-precision biomedical applications therefore require additional processing, such as machining or surface treatment, to ensure adequate quality, safety, and biocompatibility of the components [36].
3.2. Microstructure
To provide a more comprehensive characterization of the obtained samples, a microstructural analysis of 316L stainless steel manufactured by LPBF using two sets of process parameters was performed. The SEM images enabled the identification of grain morphology, the presence of precipitates and porosity, as well as an assessment of differences between the “standard” and “performance” modes.
In Figure 5a,b, optical microscope images showing the surface of the unetched sample are presented. In contrast, Figure 6 shows the microstructure of 316L stainless steel (SS) produced by LPBF in the standard mode. In the SEM SE contrast image (Figure 5a) of the plane parallel to the build direction (BD), grains with a characteristic V-shaped morphology are visible. Their width in most cases corresponds to the width of the melt pool. These grains do not exhibit a clear tendency to elongate along the BD. A similar effect was observed in the SEM SE image of the plane perpendicular to the BD (Figure 5e). In addition to V-shaped grains, other irregular grains occur near the boundaries of the remelted melt pools.
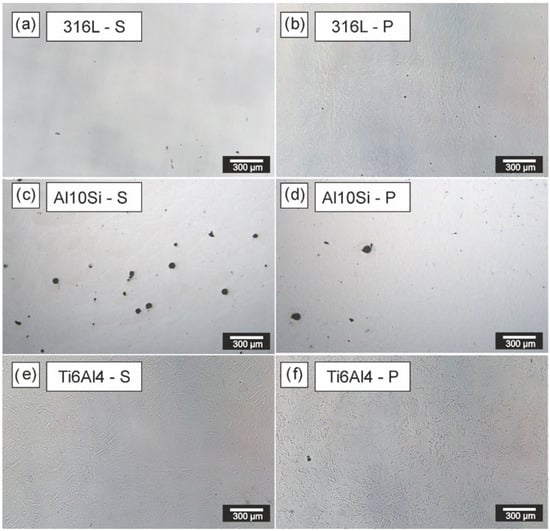
Figure 5.
Optical microscope images of the surface from cross-sections of unetched samples: (a) 316L—S, (b) 316L—P, (c) Al10SiMg—S, (d) Al10SiMg—P, (e) Ti6Al4V—S, (f) Ti6Al4V—P. LM.
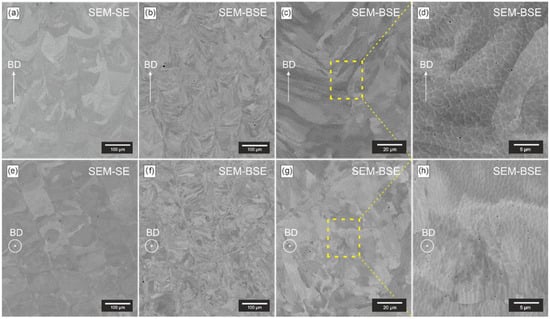
Figure 6.
Microstructure of LPBF 316L SS obtained in “standard” mode of process parameters: (a,b) overview of the melt pool boundaries in SE and BSE modes; (c,d) detailed view of cellular–dendritic microstructure within a single melt pool; (e,f) microstructure at the bottom region of the build direction (BD); (g,h) magnified view showing the cellular boundaries and subgrain features along BD.
The SEM BSE images of both planes (Figure 5b,f) reveal the presence of precipitates composed of light elements, observed as randomly distributed black dots inside the grains. According to the literature, these may be identified as Si and Mn-rich oxide inclusions [37]. These precipitates are clearly visible in the higher-magnification BSE images (Figure 5d). Furthermore, within the grains, the occurrence of a cellular microstructure was noted. Its formation is associated with the rapid solidification of melt pools and the accompanying microsegregation of Cr and Mo [38]. The estimated porosity of the 316L SS sample in the standard mode was 0.05%.
The microstructure of 316L SS produced in the performance mode is shown in Figure 7. The parameter set applied in this variant promotes the formation of smaller grains with a tendency to elongate in a direction close to the BD. V-shaped grains are not visible in this case (Figure 6a,b). In addition, equiaxed grains appear near the boundaries of the remelted melt pools. Compared to the standard mode, in the cross-section perpendicular to the BD, it was observed that the laser tracks do not correspond to the grain width. This indicates that the performance process was conducted at a higher volumetric energy density, with higher melt pool depth and a smaller hatch distance. SEM BSE images at higher magnification (Figure 6c,d,g,h) revealed the presence of a cellular microstructure inside the grains, as well as randomly distributed oxide inclusions similar to those observed in the standard mode. The porosity of the performance sample was 0.11%, which is slightly higher than in the standard variant. SEM observations in SE and BSE contrast indicate that the application of different printing modes leads to changes in grain morphology and porosity. The fact that the performance sample exhibits higher porosity may be related to overheating of the molten powder during the manufacturing process and the higher risk of keyhole porosity formation.
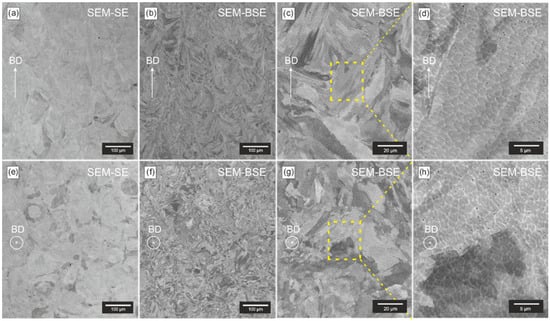
Figure 7.
Microstructure of LPBF 316L SS obtained in “performance” mode of process parameters: (a,b) overview of the melt pool boundaries in SE and BSE modes; (c,d) detailed view of the cellular–dendritic microstructure with finer cell spacing within a single melt pool; (e,f) microstructure in the bottom region along the build direction (BD), showing a more homogeneous structure compared to the standard mode; (g,h) magnified view of cell and subgrain boundaries along the BD direction, revealing differences in morphology and boundary density compared with the samples shown in Figure 6.
Figure 8 presents the microstructure of the AlSi10Mg alloy produced by LPBF in the standard mode. The microstructure is characterized by wide and shallow melt pools, while finer grains can be distinguished near their boundaries (Figure 8a,b). A similar morphology was observed in the cross-section perpendicular to the build direction (BD) (Figure 8e,f), where finer equiaxed grains occupy the melt pool boundaries. SEM BSE images (Figure 8b,f) reveal the presence of spherical inclusions and/or pores randomly distributed inside the grains. In addition, irregularly shaped discontinuities were observed. SEM SE images at higher magnification show the presence of a cellular microstructure inside the grains (Figure 8c,d,g,h). The cell boundaries consist of an α+Si eutectic mixture, which is consistent with the literature data [39]. The cell interiors additionally contain fine spherical precipitates. The size distribution of the cells is heterogeneous, larger cells occur near the melt pool boundaries, which is related to the influence of the heat-affected zone that promotes their growth [40]. The estimated porosity of the standard sample is 0.82%, consisting mainly of large gas porosity and sporadically observed lack-of-fusion porosity.
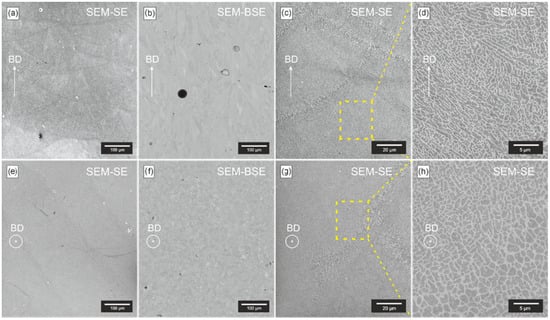
Figure 8.
Microstructure of LPBF AlSi10Mg obtained in “standard” mode of process parameters: (a,b) overview of the melt pool boundaries in SE and BSE modes, showing uniform layer fusion; (c,d) detailed view of the fine cellular–eutectic microstructure within a single melt pool; (e,f) microstructure in the bottom region along the build direction (BD), showing a homogeneous distribution of solidified zones; (g,h) magnified view highlighting the cellular and eutectic network of α-Al matrix with Si-rich boundaries along the BD direction.
Figure 9 presents the microstructure of the AlSi10Mg alloy produced using performance parameters. The overall microstructural characteristics are similar to those of the standard sample. However, as shown in Figure 9a,e, in both the parallel and perpendicular cross-sections to the BD, the performance variant is characterized by relatively smaller melt pools. This is associated with the lower volumetric energy density, resulting from the smaller hatch distance and/or thinner powder layer in the LPBF process. The use of performance parameters proved beneficial in terms of porosity reduction, which was 0.27%. Similarly to the standard sample, the sources of porosity are gas pores and local lack-of-fusion defects; however, the gas pores are smaller than those observed in the standard variant.
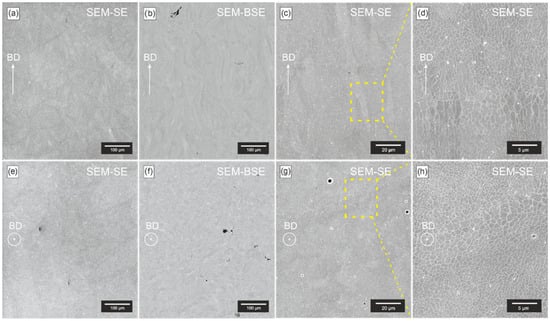
Figure 9.
Microstructure of LPBF AlSi10Mg obtained in “performance” mode of process parameters: (a,b) overview of the melt pool boundaries in SE and BSE modes, showing well-fused tracks and smooth transition between layers; (c,d) detailed view of the refined cellular–eutectic microstructure within a single melt pool, indicating enhanced solidification dynamics; (e,f) microstructure in the bottom region along the build direction (BD), showing high uniformity and reduced porosity compared to the standard mode; (g,h) magnified view of the α-Al matrix with a fine Si network along BD, revealing improved homogeneity and continuity of the eutectic structure.
Figure 10 presents the microstructure of the Ti6Al4V alloy produced by LPBF in the standard mode. Due to the presence of phase transformations in this alloy, the post-LPBF microstructure consists of α′-phase plates formed as a result of rapid solidification [41,42]. These plates are distributed within the prior β-phase grains (Figure 10a,b,e,f). In this sample preparation, melt pool contours were not revealed. Higher-magnification images clearly show parallel plates (Figure 10c,g). Moreover, the SEM BSE images (Figure 10d,h) reveal bright regions between the α′-phase plates. Since in BSE contrast areas containing heavier elements appear brighter, these regions may correspond to β-phase enriched with vanadium [42,43]. Additional microstructural analyses of the Ti6Al4V alloy produced by LPBF are discussed in the following subsection. The standard sample was characterized by lack-of-fusion porosity and gas porosity with a total value of 0.17%.
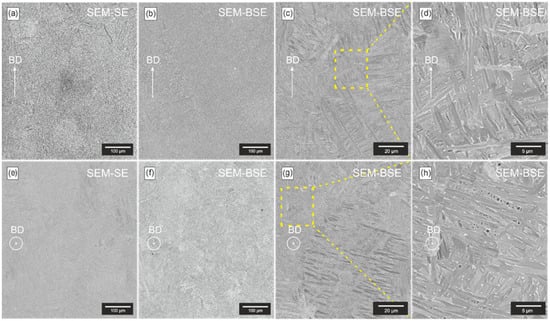
Figure 10.
Microstructure of LPBF Ti6Al4V obtained in “standard” mode of process parameters: (a,b) overview of the melt pool boundaries in SE and BSE modes, showing characteristic overlapping melt tracks; (c,d) detailed view of the fine acicular α′-martensitic structure formed within the prior β grains along the build direction (BD); (e,f) microstructure in the bottom region along BD, illustrating consistent layer fusion and columnar grain growth; (g,h) magnified view revealing the typical needle-like morphology of α′-phase and its orientation along the BD, indicating rapid solidification and directional solid-state transformation.
The microstructure of the Ti6Al4V alloy obtained using performance parameters is shown in Figure 11. It is similar to the microstructure of the standard sample. SEM SE and BSE examinations did not reveal significant differences in the microstructural features. The performance samples also contained gas pores and lack-of-fusion defects, with a total porosity of 0.07%. For a more in-depth analysis, SEM investigations were complemented with EBSD analysis.
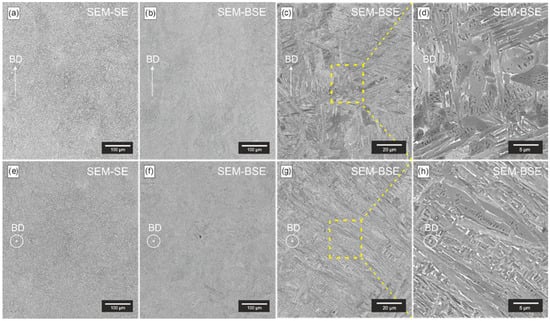
Figure 11.
Microstructure of LPBF Ti6Al4V obtained in “performance” mode of process parameters: (a,b) overview of the melt pool boundaries in SE and BSE modes, revealing dense structure and well-fused layers; (c,d) detailed view of the α′-martensitic laths within prior β grains, showing finer morphology compared to the standard mode; (e,f) microstructure in the bottom region along the build direction (BD), exhibiting uniform solidification and reduced porosity; (g,h) magnified view illustrating the acicular α′-phase aligned along BD, with distinct columnar features and evidence of rapid solid-state transformation.
The conducted microstructural analysis revealed significant differences among 316L stainless steel, AlSi10Mg alloy, and Ti6Al4V alloy manufactured by LPBF using two sets of process parameters. For 316L stainless steel, the microstructure in the standard mode was characterized by V-shaped grains and the presence of a cellular substructure, with relatively low porosity (0.05%). In contrast, the performance variant promoted the formation of smaller grains with a tendency to elongate along the BD and exhibited higher porosity (0.11%), which may result from powder overheating during the process.
For the AlSi10Mg alloy, a cellular microstructure with cell boundaries formed by an α+Si eutectic mixture was observed in both process variants. The standard variant exhibited distinctly higher porosity (0.82%), dominated by gas porosity and sporadic lack-of-fusion defects, whereas in the performance variant a significant reduction in porosity to 0.27% was achieved. These differences were associated with smaller melt pools resulting from lower volumetric energy density.
For the Ti6Al4V alloy, the microstructure in both process variants mainly consisted of α′-phase plates distributed within the β phase, formed as a result of rapid solidification. The standard variant was characterized by porosity of 0.17%, whereas the performance variant yielded a lower porosity of 0.07%. The slight differences between the variants were primarily related to the amount of gas porosity and lack-of-fusion defects.
The applied LPBF process parameters significantly influence the microstructure and porosity of the investigated materials. In the case of the AlSi10Mg and Ti6Al4V alloys, the performance variant enabled a considerable reduction in porosity, while for 316L stainless steel it resulted in increased porosity. These findings confirm that LPBF parameter optimization must be strictly tailored to the material type in order to ensure the desired microstructure and minimize defects, which is of key importance in the context of industrial and biomedical applications.
3.3. Grain Size and Orientation
To provide a more comprehensive characterization of the sample microstructure, EBSD analysis was performed, including grain size, orientation, and crystallographic texture. This enabled the assessment of the influence of LPBF process parameters on grain morphology and orientation variation in the investigated alloys. Table 5 presents a set of quantitative values for grain size, shape and texture for 316L samples. Figure 12 presents EBSD IPF maps, grain size maps with colors corresponding to the average crystallographic orientation, and pole figures (PF) for 316L stainless steel in the standard and performance variants. Figure 13 shows the distribution of equivalent circle diameters (ECD) and aspect ratios (AR). The results indicate that in 316L stainless steel produced in the standard mode, the grains exhibit a V-shaped morphology. Individual grains are arranged in narrow columns oriented parallel to the build direction (BD). Between these columns, small, elongated grains are present, located mainly in the overlapping regions of the melt pools. The pole figures do not indicate the presence of a dominant crystallographic texture.
Table 5.
A set of mean grain size, shape factors and the maximum texture coefficient for the investigated materials.
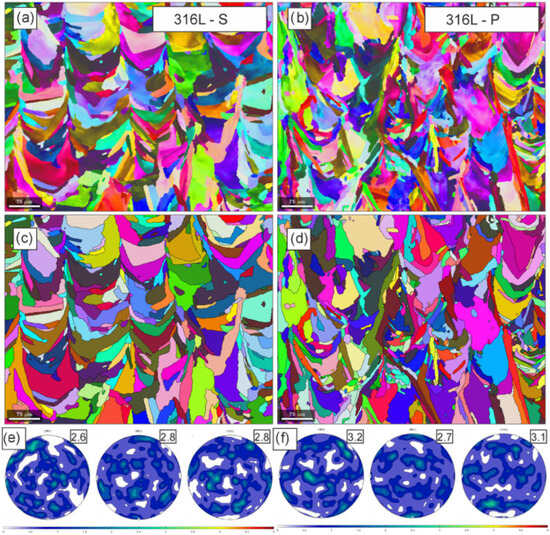
Figure 12.
IPF maps, grains and pole figures for (001), (011) and (111) planes of additively manufactured (a,c,e) 316L SS “standard” and (b,d,f) 316L SS “performance” samples, respectively. The maximum texture coefficients are shown in the boxes. SEM and EBSD.
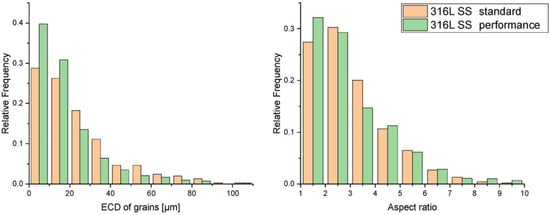
Figure 13.
Histograms of ECD and AR of grains for 316L samples in parallel to BD plane.
Based on the analysis of ECD and AR histograms (Figure 13), it was found that the material contained grains ranging from a few micrometers to approximately 100 µm, with the majority being smaller than 30 µm in diameter. Grains with ECD above 50 µm were present but represented a limited fraction. More than 50% of the grains exhibited an AR below 3. No significant number of grains strongly elongated along the BD, which are typical for 316L stainless steel produced by LPBF, were observed. Instead, a considerable portion of grains elongated perpendicular to the BD were attributed to the characteristic V-shaped morphology.
The microstructure of 316L stainless steel produced in the performance variant differed significantly from that of the standard sample and exhibited greater variability. V-shaped grains were observed in the boundary regions of the melt pools, fine equiaxed grains in the overlapping zones of the melt pools, and elongated columnar grains aligned with the BD in the central regions of the melt pools. Similarly to the standard variant, no dominant crystallographic texture was detected; however, the texture coefficients were slightly higher, which may result from stronger orientation along the BD. The ECD and AR analysis revealed an increased fraction of grains with ECD below 20 µm, accompanied by a reduction in the number of larger grains. A few grains with ECD on the order of 100 µm were still present.
In 316L stainless steel produced in the performance variant, more than 30% of the grains exhibited an AR ratio below 2. The fraction of small grains was higher, which most likely resulted from the more frequent occurrence of overlapping melt pool regions, a consequence of the smaller hatch distance compared to the standard variant. In addition, a slightly higher fraction of grains with high AR values (above 4) was recorded, which can be associated with smaller melt pools and a larger number of grains distributed within their volume.
Huang and co-workers investigated the influence of high laser power in the LPBF process on increasing the build rate. They observed that at higher laser power, the equivalent circle diameter (ECD) of grains was larger [44]. This suggests that in the standard variant, a higher laser power was applied than in the performance variant. However, the overall volumetric energy density may have been similar in both variants due to the greater powder layer thickness and larger hatch distance used in the standard variant of 316L stainless steel.
The greater number of grains elongated along the BD indicates partial epitaxial growth across multiple layers. This phenomenon occurs in face-centered cubic (FCC) crystals when the growth direction of grains in the new layer coincides with the orientation of grains in the preceding layer [45]. In the performance variant, this effect was observed in the central regions of the melt pools, where the growth of new grains proceeded parallel to the BD. In contrast, in the standard variant this was not significant, which can be explained by the formation of different crystallographic orientations in the upper and lower parts of the melt pool, resulting from variations in the thermal gradient direction [46].
Figure 14 presents EBSD IPF maps, grain size maps with colors corresponding to the average orientation, and pole figures (PF) for the AlSi10Mg alloy in the standard and performance variants. Table 5 presents a set of quantitative values for grain size, shape and texture for Al10SiMg samples.
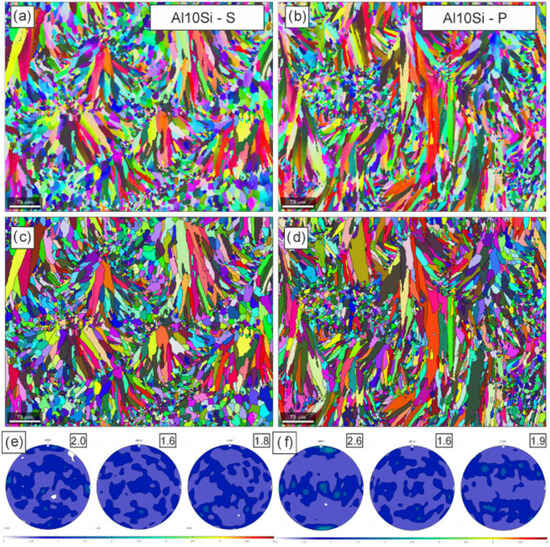
Figure 14.
IPF maps, grains and pole figures for (001), (011) and (111) planes of additively manufactured (a,c,e) AlSi10Mg_S and (b,d,f) AlSi10Mg_P samples, respectively. The maximum texture coefficients are shown in the boxes. SEM and EBSD.
For aluminum alloys, both in the standard and performance variants, a bimodal microstructure was observed, consisting of fine equiaxed grains located in regions with higher cooling rates, such as melt pool boundaries. In addition to the fine grains, elongated grains were also present, located along the melt pool axes and growing in the direction of the thermal gradient.
The analysis of the equivalent circle diameter (ECD) showed that in the standard variant less than 70% of the grains had a size below 10 µm. Furthermore, a significant portion of the grains exhibited an equiaxed morphology. In the performance variant the fraction of grains with an ECD below 10 µm exceeded 80% (Figure 15). This variant also exhibited a lower fraction of equiaxed grains and a higher fraction of grains with aspect ratios (AR) above 4, which is consistent with the SEM observations.
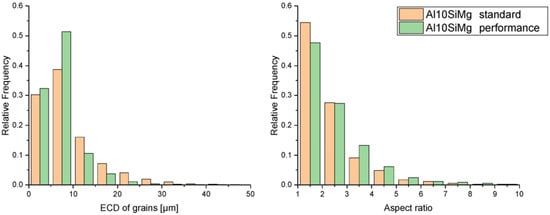
Figure 15.
Histograms of ECD and AR of grains for AlSi10Mg samples in parallel to BD plane.
In the standard variant of the AlSi10Mg alloy, larger melt pools were observed, leading to lower cooling rates and the presence of larger grains compared to the performance variant. In the performance sample, sporadic epitaxial growth between grains of successive material layers was noted.
In the pole figures (PF) for both variants, a weak cube-type texture component ({001} <100>) was observed, with the standard variant showing a noticeably weaker intensity. This is likely due to the lower fraction of elongated grains in this variant. In contrast, for equiaxed grains no dominant texture was present, which resulted in very low texture coefficient values in the observed PF.
The obtained observations regarding grain morphology and orientation are consistent with the findings of Lie et al. [47], who reported the formation of a bimodal microstructure when high laser power was combined with increased powder layer thickness, corresponding to the microstructure of the standard variant. With increasing layer thickness, these authors noted a weakening of the <001> texture, resulting from a higher fraction of equiaxed grains at the melt pool boundaries and the suppression of epitaxial growth of columnar grains. The formation of a bimodal microstructure in aluminum alloys produced by LPBF is a common phenomenon, as also confirmed by Ma et al. in the Al-Mg-Sc-Zr alloy [48]. According to the literature, such a microstructure may contribute to increased material strength, although this effect largely depends on the relative arrangement of the grains [49,50].
The acceleration of the manufacturing process is of key importance from an economic perspective. In the case of the AlSi10Mg alloy, microstructural changes are significant and may strongly affect the material’s ductility, primarily due to the increased fraction of equiaxed grains and the reduced fraction of columnar grains.
Figure 16 presents EBSD IPF maps, grain maps with colors corresponding to the average orientation, and pole figures (PF) for the investigated Ti6Al4V alloy. Figure 17 shows EBSD IPF maps with marked prior β-phase grain boundaries. While, in Table 5 a set of quantitative values for lath width, primary grain size and texture coefficient for Ti6Al4V samples were shown.
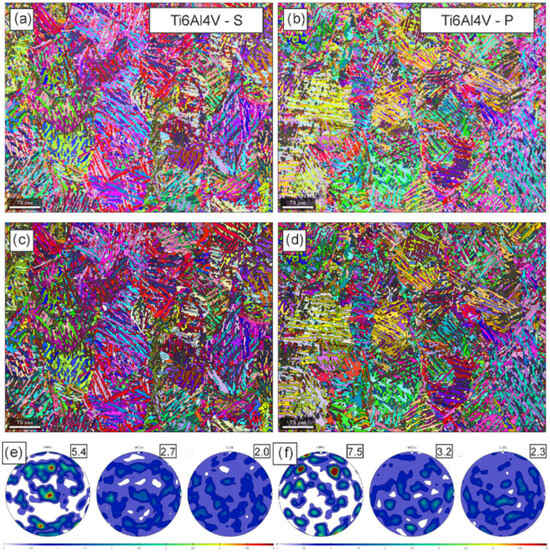
Figure 16.
IPF maps, grains and pole figures for (001), (011) and (111) planes of additively manufactured (a,c,e) Ti6Al4V_S and (b,d,f) Ti6Al4V _P samples, respectively. The maximum texture coefficient are shown in the boxes. SEM, EBSD.
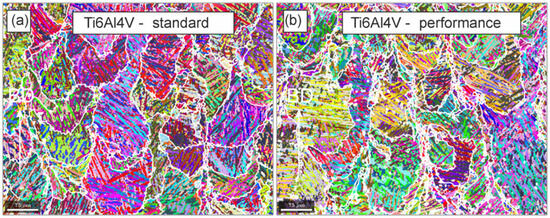
Figure 17.
IPF maps for Ti6Al4V with reconstruction of primary β grains for (a) Ti6Al4V_S and (b) Ti6Al4V_P. SEM, EBSD.
As described earlier, the microstructure of the Ti6Al4V alloy in both process variants was characterized by the presence of α′-phase plates formed by the rapid cooling of the prior β phase during the LPBF process. The average lamella thickness differed significantly between the standard and performance variants, reflecting differences in cooling rates. The calculated thicknesses were 1.0 ± 0.4 µm and 1.4 ± 0.5 µm, corresponding to cooling rates of 9.9 × 10⁶ and 9.9 × 10⁶ K/s, respectively [https://link.springer.com/article/10.1007/BF02662396] (accessed on 10 October 2025). The prior β-phase grains reconstructed using MTEX software, shown in Figure 17, revealed that in both variants the majority had ECD in the range of 40–100 µm. In the standard variant, similar to 316L stainless steel, the prior β grains exhibited a V-shaped morphology, whereas in the performance variant elongated grains predominated, accompanied by numerous regions of fine grains located in the overlapping zones of the melt pools. Although the average primary grain size was similar for both variants, it was observed that in the performance variant a higher number of both small and large grains formed. Such observations are consistent with the much lower cooling rate in the performance variant, which promotes the formation of large columnar grains [51]. In the performance variant, a higher texture coefficient for the α′ phase was recorded, most likely resulting from the formation of more regular columnar grains of the prior β phase. Figure 18 presents IPF maps of the α phase (Figure 18a) and the β phase (Figure 18b). SEM EBSD analysis confirmed the observations made by SEM, indicating the presence of the residual β phase between the α′-phase plates and the partial inhibition of its transformation due to mechanical interaction. The β phase occurs in the form of fine grains with similar crystallographic orientation.
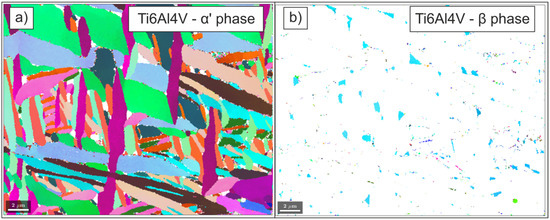
Figure 18.
IPF maps for Ti6Al4V_S for (a) α phase and (b) β phase. SEM and EBSD.
The texture, grain size, and morphology of the Ti6Al4V alloy produced by LPBF are strongly dependent on the VED. Cepeda-Jiménez et al. [51] demonstrated that high VED values typically lead to the formation of strongly oriented columnar grains of the prior β phase, while low VED values favor the formation of equiaxed grains with random orientation, which is in line with our results.
The presence of a small fraction of the β phase in the Ti6Al4V alloy is closely related to the process parameters. According to the literature, the formation of this phase occurs when the material is overheated above the transformation temperature during LPBF cycles [52,53]. Overheating most often results from the use of high laser power and/or a small hatch distance. In the case of the standard variant, the occurrence of the β phase was associated with the high laser power compensating for the larger hatch distance. In contrast, in the performance variant, overheating resulted from the reduced hatch distance and the significant overlap of the melt pools.
It should be noted, however, that for many applications of titanium alloys, further heat treatment is required to reduce residual stresses, eliminate anisotropy, and develop the desired microstructure. For this reason, medical-grade Ti alloys produced by LPBF are subjected to heat treatment, and the initial microstructure is of secondary importance due to the need to modify the microstructure to achieve higher ductility and higher fatigue resistance [https://doi.org/10.3390/met10081006]. The α′ microstructure forms as a result of rapid cooling during the process and is characterized by higher strength and lower ductility compared to, for example, the α + β structure that develops after slow cooling [https://link.springer.com/article/10.1007/BF02662396, https://doi.org/10.3390/met10081006].
EBSD analysis demonstrated that the selection of LPBF parameters significantly influences the grain morphology and orientation in the investigated metallic alloys. In Table 5 results of quantitative analysis of microstructure were present. In 316L stainless steel, the standard variant led to the formation of larger V-shaped grains with relatively low porosity, whereas the performance variant produced a distinctly finer and more heterogeneous microstructure, with an increased fraction of grains elongated along the BD and a higher degree of epitaxial growth. In the AlSi10Mg alloy, a bimodal microstructure was observed in both variants; however, the performance variant was characterized by a higher fraction of fine grains (more than 80% with ECD < 10 µm) and stronger elongation, which may improve strength but reduce ductility. In the case of the Ti6Al4V alloy, both variants exhibited the presence of α′ plates, but in the performance variant columnar β grains with stronger texture predominated, whereas in the standard variant V-shaped grains were dominant.
When comparing the investigated materials, it can be concluded that, from the perspective of additive manufacturing, the performance variant of Ti6Al4V and AlSi10Mg alloys exhibits the most favorable features, where the fine-grained microstructure and stronger texture promote improved mechanical properties and material homogeneity. In the case of 316L stainless steel, the standard variant was characterized by lower porosity, whereas the performance variant provided more controlled grain orientation and greater heterogeneity, which may be advantageous in the design of cyclically loaded components. Ultimately, the performance variants can be considered more promising in the context of 3D printing, provided that the process parameters are properly tailored to the specific alloy.
3.4. Hardness
Figure 19 presents the hardness measurements in planes parallel and perpendicular to the build direction (BD) for all investigated materials in both process variants. For 316L stainless steel produced by LPBF, the hardness in both planes was comparable; however, the performance sample exhibited slightly higher values. In the standard variant, the hardness was approximately 185 HV1, while in the performance variant it reached 190 HV1. The observed increase in hardness in the performance variant is associated with the smaller grain size, which is consistent with the Hall–Petch relationship—reduction in the average grain size leads to an increase in alloy hardness [54,55]. Tucho et al. [56] also demonstrated that a slight increase in hardness in LPBF-produced 316L stainless steel is linked to higher volumetric energy density.
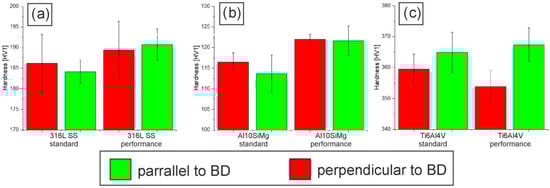
Figure 19.
Hardness of (a) LPBF 316L SS, (b) LPBF AlSi10Mg, (c) LPBF Ti6Al4V.
A similar effect was observed for the AlSi10Mg alloy, where the differences in hardness between the planes were negligible, while the increase in hardness in the performance variant was more pronounced. The microstructure of this variant is characterized by a smaller equivalent circle diameter (ECD) and thus a higher fraction of fine equiaxed grains, which results in higher hardness. The hardness of the standard sample was approximately 115 HV1, whereas the performance sample reached 122 HV1. These values are consistent with the hardness data for AlSi10Mg alloy produced by LPBF reported by Serjouei et al. [57,58,59,60,61,62,63,64].
A different situation was observed for the Ti6Al4V alloy, where differences in hardness were found between the planes perpendicular and parallel to the BD, while the changes between process variants were negligible. The performance variant exhibited greater differences in hardness values between the planes than the standard variant. In the standard sample, the hardness in the parallel section was approximately 359 HV1, while in the perpendicular section it was 365 HV1. For the performance sample, these values were 354 HV1 and 367 HV1, respectively. These results indicate that the performance sample is characterized by greater anisotropy of properties, which may be related to the higher texture coefficient in this variant, as described in Section 3.3. The obtained values are comparable to the hardness of alloys with a dominant α′ phase in conventional Ti6Al4V alloys [43,65,66,67,68,69,70,71,72].
The obtained results indicate that the use of the performance parameter set in the LPBF process for 316L stainless steel and Ti6Al4V alloy is not justified, it leads only to a slight increase in hardness without providing additional benefits. Moreover, in the case of Ti6Al4V, it promotes strong texturing, which in certain applications may be considered undesirable. In contrast, for the AlSi10Mg alloy, the application of performance parameters proved advantageous, clearly reducing porosity and increasing hardness. Overall, the ability to tailor the microstructure through the selection of LPBF process parameters broadens the potential application areas of this technology. However, the final choice of optimal parameters should be strongly linked to the intended application of the alloy, since at comparable quality levels (e.g., porosity or surface roughness), the microstructure and mechanical properties may differ significantly.
The study demonstrated that the influence of LPBF parameters on the hardness of the analyzed alloys is diverse. In 316L stainless steel, the differences between the planes parallel and perpendicular to the build direction were insignificant, and the performance variant exhibited only a slightly higher hardness, which can be attributed to the finer microstructure and the Hall–Petch relationship. In the AlSi10Mg alloy, a clear increase in hardness was observed in the performance sample, resulting from a higher fraction of fine equiaxed grains, confirming the beneficial effect of process parameter modification on the mechanical properties of this alloy. Conversely, in the Ti6-Al-4-V alloy, the differences between the variants were negligible, while the performance sample showed greater anisotropy of properties, associated with a higher degree of texturing.
The application of performance parameters in the case of 316L stainless steel and Ti6-Al-4-V alloy does not provide significant benefits in terms of hardness, and for Ti6-Al-4-V may even lead to undesirable anisotropy. The most favorable effects were obtained in the AlSi10Mg alloy, where the performance variant simultaneously increased hardness and reduced porosity, making it optimal from the perspective of 3D printing applications.
4. Conclusions
This study provides a cross-material comparative assessment of the influence of Laser Powder Bed Fusion (LPBF) process parameters on the microstructure, porosity, surface roughness, and mechanical response of three widely used metallic alloys—316L stainless steel, AlSi10Mg aluminum alloy, and Ti6Al4V titanium alloy—processed under both standard and performance conditions. While numerous studies have examined individual materials, the novelty of this work lies in demonstrating, within a unified methodological framework, that identical process trends variation in VED and VR lead to distinct and alloy-specific responses arising from their different thermal conductivities, solidification paths, and phase-transformation mechanisms. By systematically correlating microstructural and mechanical outcomes with measurable process characteristics this study provides quantitative evidence for the material-dependent nature of LPBF optimization and its implications for industrial and biomedical applications.
The results reveal that trade-offs between productivity and defect formation are intrinsic to LPBF, and their manifestation differs among alloys. For 316L stainless steel, performance parameters enhanced grain refinement and crystallographic orientation along the build direction but slightly increased porosity due to localized overheating and keyhole instability. From a practical standpoint, these materials are very similar to each other, and noticeable differences would likely emerge only when applying these parameters to thin-walled or high-precision components. However, in the case of 3D printing of solid parts with high density, differences in product quality are not apparent. In contrast, the AlSi10Mg alloy showed a clear technological benefit of the performance mode, achieving simultaneous porosity reduction and hardness increase. The finer, bimodal grain structure and decreased gas porosity demonstrate that optimized energy input can improve both density and strength without inducing detrimental anisotropy. This alloy, therefore, emerges as the most promising candidate for high-throughput LPBF manufacturing of lightweight engineering components. For Ti6Al4V, the performance mode led to a more pronounced columnar texture of β grains and consequently higher anisotropy of mechanical properties. Although porosity was reduced, the stronger texture may limit the applicability of this variant without additionally heat treatment in cases requiring isotropic mechanical behavior, such as biomedical implants subjected to multiaxial stresses. These findings highlight the fundamental balance between densification and anisotropy in LPBF titanium alloys—a trade-off often overlooked in purely mechanical analyses.
Surface roughness analysis further exposed the complexity of parameter optimization. While a performance mode reduced side-wall roughness, they simultaneously degraded the top-surface quality due to the balling phenomenon. The obtained Ra values exceeded 0.8 µm for all materials, emphasizing that as-built LPBF surfaces do not satisfy smoothness requirements and confirming the necessity of post-processing in most applications. In contrast, for industrial uses where machining is standard practice, as-built roughness can be considered a secondary factor relative to porosity and strength.From a practical standpoint, the study demonstrates that there is no universal parameter set guaranteeing optimal quality across different alloys.
Overall, the study highlights that LPBF parameters must reconcile three interdependent objectives—microstructural control, defect minimization, and process efficiency. The presented comparative framework demonstrates practical guidelines for aligning these objectives with alloy-specific behaviors and end-use requirements. Future work should aim to integrate the obtained empirical relationships to explore hybrid parameter strategies and graded energy input profiles to combine the benefits of performance and standard regimes within a single build.
Author Contributions
Conceptualization, P.L., H.P., D.S., K.C., M.J., M.L. and M.P.; methodology, P.L., H.P., D.S., M.P., K.C., M.J. and M.L.; software, D.S., P.L., H.P., K.C., M.J., M.L. and M.P.; validation, P.L., H.P., D.S., K.C., M.J., M.L. and M.P.; formal analysis, P.L., H.P., D.S., K.C., M.J., M.L. and M.P. investigation, P.L., H.P.; K.C., D.S., M.J., M.L. and M.P. writing—original draft preparation, P.L.,D.S.,K.C.,M.J.,M.P. and H.P.; writing—review and editing, P.L., H.P., D.S., K.C., M.J., M.L. and M.P.; visualization, P.L., H.P., D.S., K.C., M.J., M.L. and M.P.; supervision, D.S.; project administration, D.S. and M.P.; funding acquisition, D.S. and M.P. All authors have read and agreed to the published version of the manuscript.
Funding
This research was funded by the Ministry of Science and Higher Education, Poland [grant AGH-UST no. 16.16.160.557] and research project supported by program “Excellence Initiative—Research University” for the AGH University of Krakow.
Institutional Review Board Statement
Not applicable.
Data Availability Statement
The data presented in this study are available at the Corresponding authors.
Conflicts of Interest
The authors declare no conflicts of interest.
References
- Caravella, I.; Cortis, D.; Angelo, L.; Orlandi, D. Experimental Data Collection of Surface Quality Analysis of CuCrZr Specimens Manufactured with SLM Technology: Analysis of the Effects of Process Parameters. Materials 2023, 16, 98. [Google Scholar] [CrossRef]
- Cobbinah, P.V.; Nzeukou, R.A.; Onawle, O.T.; Matizamhuka, W.R. Laser Powder Bed Fusion of Potential Superalloys: A Review. Metals 2021, 11, 58. [Google Scholar] [CrossRef]
- Gupta, A.; Bennett, C.H.J.; Sun, W. High cycle fatigue performance evaluation of a laser powder bed fusion manufactured Ti-6Al-4V bracket for aero-engine applications. Eng. Fail. Anal. 2022, 140, 106494. [Google Scholar] [CrossRef]
- Griffiths, V.; Scanlan, J.P.; Eres, M.H.; Martinez-Sykora, A.; Chinchapatnam, P. Cost-driven build orientation and bin packing of parts in Selective Laser Melting (SLM). Eur. J. Operat. Res. 2019, 273, 334–352. [Google Scholar] [CrossRef]
- NugrahA, A.D.; Supriyanto, E.; Prawara, B.; Martides, E.; Junianto, E.; Wibowo, A.; Sentanuhady, J.; Muflikhun, A.M. First-rate manufacturing process of primary air fan (PAF) coal power plant in Indonesia using laser powder bed fusion (LPBF) technology. J. Mater. Process. Technol. 2022, 18, 4075–4088. [Google Scholar] [CrossRef]
- Fernandes, R.F.; Jesus, J.; Borrego, L.; Ferreira, J.M.; Costa, J.D. Effect of heat treatment on fatigue crack growth performance of AlSi10Mg aluminum alloy submitted to LPBF. Procedia Struct. Integr. 2022, 42, 1054–1060. [Google Scholar] [CrossRef]
- Piller, F.; Poprawe, R.; Schleifenbaum, H.; Schuh, G.; Barg, S.; Dölle, C.; Hinke, C.; Jank, M.-H.; van Bracht, R.; Meiners, W.; et al. Introducing a Holistic Profitability Model for Additive Manufacturing: An Analysis of Laser-powder Bed Fusion. In Proceedings of the 2018 IEEE International Conference on Industrial Engineering and Engineering Management (IEEM), Bangkok, Thailand, 16–19 December 2018; pp. 1730–1735. [Google Scholar] [CrossRef]
- Tenbrock, C.; Fischer, F.; Wissenbach, K.; Schleifenbaum, J.; Wagenblast, P.; Meiners, W.; Wagner, J. Influence of Keyhole and Conduction Mode Melting for Top-Hat Shaped Beam Profiles in Laser Powder Bed Fusion. J. Mater. Process. Technol. 2019, 278, 116514. [Google Scholar] [CrossRef]
- Chowdhury, S.; Yadaiah, N.; Prakash, C.; Ramakrishna, S.; Dixit, S.; Gupta, L.R.; Buddhi, D. Laser powder bed fusion: A state-of-the-art review of the technology, materials, properties & defects, and numerical modelling. J. Mater. Res. Technol. 2022, 20, 2109–2172. [Google Scholar]
- Ghasemi, A.; Fereiduni, E.; Balbaa, M.; Elbestawi, M.; Habibi, S. Unraveling the low thermal conductivity of the LPBF fabricated pure Al, AlSi12, and AlSi10Mg alloys through substrate preheating. Addit. Manuf. 2022, 59, 103148. [Google Scholar] [CrossRef]
- Vaudreuil, S.; Bencaid, S.E.; Vanaei, H.R.; Magri, A.E. Effects of Power and Laser Speed on the Mechanical Properties of AlSi7Mg0.6 Manufactured by Laser Powder Bed Fusion. Materials 2022, 15, 8640. [Google Scholar] [CrossRef]
- Cabrini, M.; Carrozza, A.; Lorenzi, S.; Pastore, T.; Testa, C.; Manfredi, D.; Fino, P.; Scenini, F. Influence of surface finishing and heat treatments on the corrosion resistance of LPBF-produced Ti-6Al-4V alloy for biomedical applications. J. Mater. Process. Technol. 2022, 308, 117730. [Google Scholar] [CrossRef]
- Ghosh, A.; Biswas, S.; Turner, T.; Kietzig, A.M.; Brochu, M. Surface, microstructure, and tensile deformation characterization of LPBF SS316L microstruts micromachined with femtosecond laser. Mater. Des. 2021, 210, 110045. [Google Scholar] [CrossRef]
- Chen, H.; Sun, Y.; Yuan, W.; Pang, S.; Yan, W.; Shi, Y. A Review on Discrete Element Method Simulation in Laser Powder Bed Fusion Additive Manufacturing. Chin. J. Mech. Eng. Addit. Manuf. Front. 2022, 1, 100017. [Google Scholar] [CrossRef]
- Zhao, R.; Shmatok, A.; Fischer, R.; Deng, P.; Belhadi, M.A.; Hamasha, S.; Prorok, B.C. Employing spatial and amplitude discriminators to partition and analyze LPBF surface features. Precis. Eng. 2022, 78, 90–101. [Google Scholar] [CrossRef]
- Polyanska, A.; Savchuk, S.; Dudek, M.; Sala, D.; Pazynich, Y.; Cicho, D. Impact of digital maturity on sustainable development effects in energy sector in the condition of Industry 4.0. Nauk. Visnyk Natsionalnoho Hirnychoho Universytetu 2022, 6, 97–103. [Google Scholar] [CrossRef]
- Riener, K.; Albrecht, N.; Ziegelmeier, S.; Ramakrishnan, R.; Haferkamp, L.; Spierings, A.D.; Leichtfried, G.J. Influence of particle size distribution and morphology on the properties of the powder feedstock as well as of AlSi10Mg parts produced by laser powder bed fusion (LPBF). Addit. Manuf. 2020, 34, 101286. [Google Scholar] [CrossRef]
- Ponticelli, G.S.; Panciroli, R.; Venettacci, S.; Tagliaferri, F.; Guarino, S. Experimental investigation on the fatigue behavior of laser powder bed fused 316L stainless steel. CIRP J. Manuf. Sci. Technol. 2022, 38, 787–800. [Google Scholar] [CrossRef]
- Cacace, S.; Demir, A.G.; Sala, G.; Grande, A.M. Influence of production batch related parameters on static and fatigue resistance of LPBF produced AlSi7Mg0.6. Int. J. Fatigue 2022, 165, 107227. [Google Scholar] [CrossRef]
- Kan, W.H.; Chiu, L.N.S.; Lim, C.V.S.; Zhu, Y.; Tian, Y.; Jiang, D.; Huang, A. A critical review on the effects of process-induced porosity on the mechanical properties of alloys fabricated by laser powder bed fusion. J. Mater. Sci. 2022, 57, 9818–9865. [Google Scholar] [CrossRef]
- Du Plessis, A.; Beretta, S. Killer notches: The effect of as-built surface roughness on fatigue failure in AlSi10Mg produced by laser powder bed fusion. Addit. Manuf. 2020, 35, 101424. [Google Scholar] [CrossRef]
- Dong, Z.; Jia, S.; Shao, C. Filtered kriging for improved interpolation of periodic manufacturing surfaces. J. Manuf. Process. 2024, 131, 1–12. [Google Scholar] [CrossRef]
- Nikolsky, V.; Kuzyayev Tikhaya, L.; Howaniec, N.; Bak, A.; Siudyga, T.; Jura, B.; Cabana, E.; Szymanek, A.; Smoliński, A. A Study of Heat Exchange Processes within the Channels of Disk Pulse Devices. Energies 2020, 13, 3492. [Google Scholar] [CrossRef]
- Weiss, C.H.; Heslenfeld, J.; Saewe, J.K.; Bremen, S.; Häfner, C.L. Investigation on the influence of powder humidity in Laser Powder Bed Fusion (LPBF). Procedia CIRP 2022, 111, 115–120. [Google Scholar] [CrossRef]
- Yeganeh, M.; Shahryari, Z.; Talib Khanjar, A.; Hajizadeh, Z.; Shabani, F. Inclusions and Segregations in the Selective Laser-Melted Alloys: A Review. Coatings 2023, 13, 1295. [Google Scholar] [CrossRef]
- Khaimovich, A.; Erisov, Y.; Smelov, V.; Agapovichev, A.; Petrov, I.; Razhivin, V.; Bobrovskij, I.; Kokareva, V.; Kuzin, A. Interface Quality Indices of Al–10Si–Mg Aluminum Alloy and Cr18–Ni10–Ti Stainless-Steel Bimetal Fabricated via Selective Laser Melting. Metals 2021, 11, 172. [Google Scholar] [CrossRef]
- Calderón, L.A.Á.; Rehmer, B.; Schriever, S.; Ulbricht, A.; Jácome, L.A.; Sommer, K.; Mohr, G.; Skrotzki, B.; Evans, A. Creep and creep damage behavior of stainless steel 316L manufactured by laser powder bed fusion. Mater. Sci. Eng. A 2022, 830, 142223. [Google Scholar] [CrossRef]
- Vaglio, E.; Monte, T.; Lanzutti, A.; Totis, G.; Sortino, M.; Fedrizzi, L. Single tracks data obtained by selective laser melting of Ti6Al4V with a small laser spot diameter. Date Brief 2020, 33, 106443. [Google Scholar] [CrossRef]
- CadExpert AlSi10Mg Data Sheet. EOS GmbH—Electro Optical Systems. Available online: https://cadxpert.pl/wp-content/uploads/2022/02/DMLS-Aluminium-AlSi10Mg.pdf (accessed on 19 March 2023).
- CadExpert 316L Data Sheet. EOS GmbH—Electro Optical Systems. Available online: https://cadxpert.pl/wp-content/uploads/2022/02/DMLS-StainlessSteel-316L.pdf (accessed on 19 March 2023).
- CadExpert Ti64 Data Sheet. EOS GmbH—Electro Optical Systems. Available online: https://cadxpert.pl/wp-content/uploads/2022/02/DMLS-Tytan-Ti64.pdf (accessed on 19 March 2023).
- Bachmann, F.; Hielscher, R.; Schaeben, H. Texture Analysis with MTEX—Free and Open Source Software Toolbox. Solid State Phenom. 2010, 160, 63–68. [Google Scholar] [CrossRef]
- Wang, J.; Zhu, R.; Liu, Y.; Zhang, L. Understanding melt pool characteristics in laser powder bed fusion: An overview of single- and multi-track melt pools for process optimization. Adv. Powder Mater. 2023, 2, 100137. [Google Scholar] [CrossRef]
- Khairallah, S.A.; Anderson, A.T.; Rubenchik, A.; King, W.E. Laser powder-bed fusion additive manufacturing: Physics of complex melt flow and formation mechanisms of pores, spatter, and denudation zones. Acta Mater. 2016, 108, 36–45. [Google Scholar] [CrossRef]
- La Fé-Perdomo, I.; Ramos-Grez, J.; Mujica, R.; Rivas, M. Surface roughness a prediction in Selective Laser Melting of 316L stainless steel by means of artificial intelligence inference. J. King Saud Univ.—Eng. Sci. 2023, 35, 148–156. [Google Scholar] [CrossRef]
- Teich, H.; Maucher, C.; Möhring, H.-C. Influence of LPBF Parameters and Strategies on Fine Machining of Pre-Built Bores. J. Mach. Eng. 2021, 21, 91–101. [Google Scholar] [CrossRef]
- Deng, P.; Karadge, M.; Rebak, R.B.; Gupta, V.K.; Prorok, B.C.; Lou, X. The origin and formation of oxygen inclusions in austenitic stainless steels manufactured by laser powder bed fusion. Addit. Manuf. 2020, 35, 101334. [Google Scholar] [CrossRef]
- Liu, L.; Ding, Q.; Zhong, Y.; Zou, J.; Wu, J.; Chiu, Y.-L.; Li, J.; Zhang, Z.; Yu, Q.; Shen, Z. Dislocation network in additive manufactured steel breaks strength–ductility trade-off. Mater. Today 2018, 21, 354–361. [Google Scholar] [CrossRef]
- Wu, J.; Wang, X.Q.; Wang, W.; Attallah, M.M.; Loretto, M.H. Microstructure and strength of selectively laser melted AlSi10Mg. Acta Mater. 2016, 117, 311–320. [Google Scholar] [CrossRef]
- Trevisan, F.; Calignano, F.; Lorusso, M.; Pakkanen, J.; Aversa, A.; Ambrosio, E.P.; Lombardi, M.; Fino, P.; Manfredi, D. On the Selective Laser Melting (SLM) of the AlSi10Mg Alloy: Process, Microstructure, and Mechanical Properties. Materials 2017, 10, 76. [Google Scholar] [CrossRef]
- Rani, S.U.; Kesavan, D.; Kamaraj, M. Evaluation of influence of microstructural features of LPBF Ti-6Al-4 V on mechanical properties for an optimal strength and ductility. J. Alloys Compd. 2023, 960, 170575. [Google Scholar] [CrossRef]
- Xie, Z.; Dai, Y.; Ou, X.; Ni, S.; Song, M. Effects of selective laser melting build orientations on the microstructure and tensile performance of Ti–6Al–4V alloy. Mater. Sci. Eng. A 2020, 776, 139001. [Google Scholar] [CrossRef]
- Murr, L.E.; Quinones, S.A.; Gaytan, S.M.; Lopez, M.I.; Rodela, A.; Martinez, E.Y.; Hernandez, D.H.; Martinez, E.; Medina, F.; Wicker, R.B. Microstructure and mechanical behavior of Ti–6Al–4V produced by rapid-layer manufacturing, for biomedical applications. J. Mech. Behav. Biomed. Mater. 2009, 2, 20–32. [Google Scholar] [CrossRef]
- Huang, G.; Wei, K.; Deng, J.; Liu, M.; Zeng, X. High-power laser powder bed fusion of 316L stainless steel: Defects, microstructure, and mechanical properties. J. Manuf. Process. 2022, 83, 235–245. [Google Scholar] [CrossRef]
- Dinda, G.P.; Dasgupta, A.K.; Mazumder, J. Texture control during laser deposition of nickel-based superalloy. Scr. Mater. 2012, 67, 503–506. [Google Scholar] [CrossRef]
- Sofinowski, K.A.; Raman, S.; Wang, X.; Gaskey, B.; Seita, M. Layer-wise engineering of grain orientation (LEGO) in laser powder bed fusion of stainless steel 316L. Addit. Manuf. 2021, 38, 101809. [Google Scholar] [CrossRef]
- Liu, M.; Wei, K.; Zeng, X. High power laser powder bed fusion of AlSi10Mg alloy: Effect of layer thickness on defect, microstructure and mechanical property. Mater. Sci. Eng. A 2022, 842, 143107. [Google Scholar] [CrossRef]
- Ma, R.; Peng, C.; Cai, Z.; Wang, R.; Zhou, Z.; Li, X.; Cao, X. Effect of bimodal microstructure on the tensile properties of selective laser melt Al-Mg-Sc-Zr alloy. J. Alloys Compd. 2020, 815, 152422. [Google Scholar] [CrossRef]
- Li, C.-L.; Woo, S.C.; Oh, J.M.; Hong, J.; Yeom, J.-T.; Kang, J.-H.; Mei, Q.-S.; Park, C.H. Bimodal grain structures and tensile properties of a biomedical Co–20Cr–15W–10Ni alloy with different pre-strains. Rare Met. 2021, 40, 20–30. [Google Scholar] [CrossRef]
- Flipon, B.; Keller, C.; Garcia de la Cruz, L.; Hug, E.; Barbe, F. Tensile properties of spark plasma sintered AISI 316L stainless steel with unimodal and bimodal grain size distributions. Mater. Sci. Eng. A 2018, 729, 249–256. [Google Scholar] [CrossRef]
- Cepeda-Jiménez, C.M.; Potenza, F.; Magalini, E.; Luchin, V.; Molinari, A. Pérez-Prado M.T., Effect of energy density on the microstructure and texture evolution of Ti-6Al-4V manufactured by laser powder bed fusion. Mater. Charact. 2020, 163, 110238. [Google Scholar] [CrossRef]
- Zhang, D.; Wang, L.; Zhang, H.; Maldar, A.; Zhu, G.; Chen, W.; Park, J.-S.; Wang, J.; Zeng, X. Effect of heat treatment on the tensile behavior of selective laser melted Ti-6Al-4V by in situ X-ray characterization. Acta Mater. 2020, 189, 93–104. [Google Scholar] [CrossRef]
- Cao, S.; Zou, T.; Lim, C.V.S.; Wu, X. Review of laser powder bed fusion (LPBF) fabricated Ti-6Al-4V: Process, post-process treatment, microstructure, and property. Adv. Manuf. 2021, 20, 313–332. [Google Scholar] [CrossRef]
- Smith, T.R.; Sugar, J.D.; Marchi, C.S.; Schoenung, J.M. Strengthening mechanisms in directed energy deposited austenitic stainless steel. Acta Mater. 2019, 164, 728–740. [Google Scholar] [CrossRef]
- Cheng, H.; Lin, Y.C.; He, D.-G.; Qiu, D.-G.; Zhu, J.C.; Chen, M.-S. Influences of stress-aging on the precipitation behavior of δ phase (Ni3Nb) in a nickel-based superalloy. Mater. Des. 2021, 197, 109256. [Google Scholar] [CrossRef]
- Pyzalski, M.; Bialoskórski, J.; Walasek, E. Reaction between Carbon Fibres and Molten Silicon: Heat Determination Using DTA. J. Therm. Anal. 1986, 31, 1247–1254. [Google Scholar] [CrossRef]
- Tucho, W.M.; Lysne, V.H.; Austbø, H.; Sjolyst-Kverneland, A.; Hansen, V. Investigation of effects of process parameters on microstructure and hardness of SLM manufactured SS316L. J. Alloys Compd. 2018, 740, 910–925. [Google Scholar] [CrossRef]
- Serjouei, A.; Libura, T.; Brodecki, A.; Radziejewska, J.; Broniszewska, P.; Pawłowski, P.; Szymczak, T.; Bodaghi, M.; Kowalewski, Z.L. Strength-hardness relationship for AlSi10Mg alloy produced by laser powder bed fusion: An experimental study. Mater. Sci. Eng. A 2022, 861, 144345. [Google Scholar] [CrossRef]
- Ferraris, S. Porous Titanium by Additive Manufacturing: A Focus on Surface Modification for Bone-Contact Applications. Metals 2021, 11, 1343. [Google Scholar] [CrossRef]
- Seex, K.A.; Finlayson, K.; Davies, R.; Mobbs, R.J. Clinical Outcomes of 3D-Printed Titanium Patient-Specific Interbody Cages: A Prospective Case Series of 30 Patients. J. Pers. Med. 2025, 15, 320. [Google Scholar] [CrossRef]
- Hijazi, K.M.; Alnaser, A.A.; Rasheed, R.A. Titanium Alloy Implants with Lattice Structures for Mandibular Reconstruction: A Review. Materials 2023, 17, 140. [Google Scholar] [CrossRef]
- Hudák, R.; Živčák, J.; Rendošová, J.; Harničárová, M.; Dovica, M.; Varga, J.; Kováčiková, L. Additive Manufacturing of Porous Ti6Al4V Alloy for Biomedical Applications. Appl. Sci. 2021, 11, 2611. [Google Scholar] [CrossRef]
- Koju, N.; Niraula, S. Additively Manufactured Porous Ti6Al4V for Bone Implants: A Review. Metals 2022, 12, 687. [Google Scholar] [CrossRef]
- Olmos, L.; González-Pedraza, A.S.; Vergara-Hernández, H.J.; Bouvard, D.; López-Cornejo, M.S.; Servín-Castañeda, R. Development of Tailored Porous Ti6Al4V Materials by Extrusion 3D Printing. Materials 2025, 18, 389. [Google Scholar] [CrossRef]
- Joshua, R.J.N.; Vignesh, V.; Sundar, R.S.; Suresh, S.; Narmatha, M.; Arunkumar, S. Powder Bed Fusion 3D Printing in Precision Manufacturing: A Comprehensive Review. Materials 2024, 17, 769. [Google Scholar] [CrossRef]
- Wehmöller, M.; Weihe, S.; Rasche, C.; Scherer, P.; Eufinger, H. CAD/CAM-Prefabricated Titanium Implants for Large Skull Defects—Clinical Experience with 166 Patients from 1994 to 2000. Int. Congr. Ser. 2004, 1268, 667–672. [Google Scholar] [CrossRef]
- Li, J.; Chen, M.; Fan, X.; Zhou, H. Porous Titanium Scaffolds Fabricated by Additive Manufacturing: A Review. Mater. Sci. Eng. C 2015, 48, 592–605. [Google Scholar] [CrossRef]
- Zadpoor, A.A. Mechanical Performance of Additively Manufactured Meta-Biomaterials. Acta Biomater. 2019, 85, 41–59. [Google Scholar] [CrossRef] [PubMed]
- Herzog, D.; Seyda, V.; Wycisk, E.; Emmelmann, C. Additive Manufacturing of Metals. Prog. Mater. Sci. 2016, 92, 112–224. [Google Scholar] [CrossRef]
- Li, P.; Lu, L.; Meng, Q.; Wang, L.; Ma, Q.; Yang, L. Comparison of Lattice Structures Fabricated by L-PBF and E-PBF for Cranial Implant Applications. Mater. Des. 2022, 217, 110653. [Google Scholar] [CrossRef]
- US Food and Drug Administration. Technical Considerations for Additive Manufactured Medical Devices. In Guidance for Industry and Food and Drug Administration Staff; FDA: Silver Spring, MD, USA, 2017. Available online: https://www.fda.gov/media/97633/download (accessed on 8 September 2025).
- Bobyn, J.D.; Pilliar, R.M.; Cameron, H.U.; Weatherly, G.C. The Optimum Pore Size for the Fixation of Porous-Surfaced Metal Implants by the Ingrowth of Bone. Clin. Orthop. Relat. Res. 1980, 150, 263–270. [Google Scholar] [CrossRef]


Disclaimer/Publisher’s Note: The statements, opinions and data contained in all publications are solely those of the individual author(s) and contributor(s) and not of MDPI and/or the editor(s). MDPI and/or the editor(s) disclaim responsibility for any injury to people or property resulting from any ideas, methods, instructions or products referred to in the content. |
© 2025 by the authors. Licensee MDPI, Basel, Switzerland. This article is an open access article distributed under the terms and conditions of the Creative Commons Attribution (CC BY) license (https://creativecommons.org/licenses/by/4.0/).