Abstract
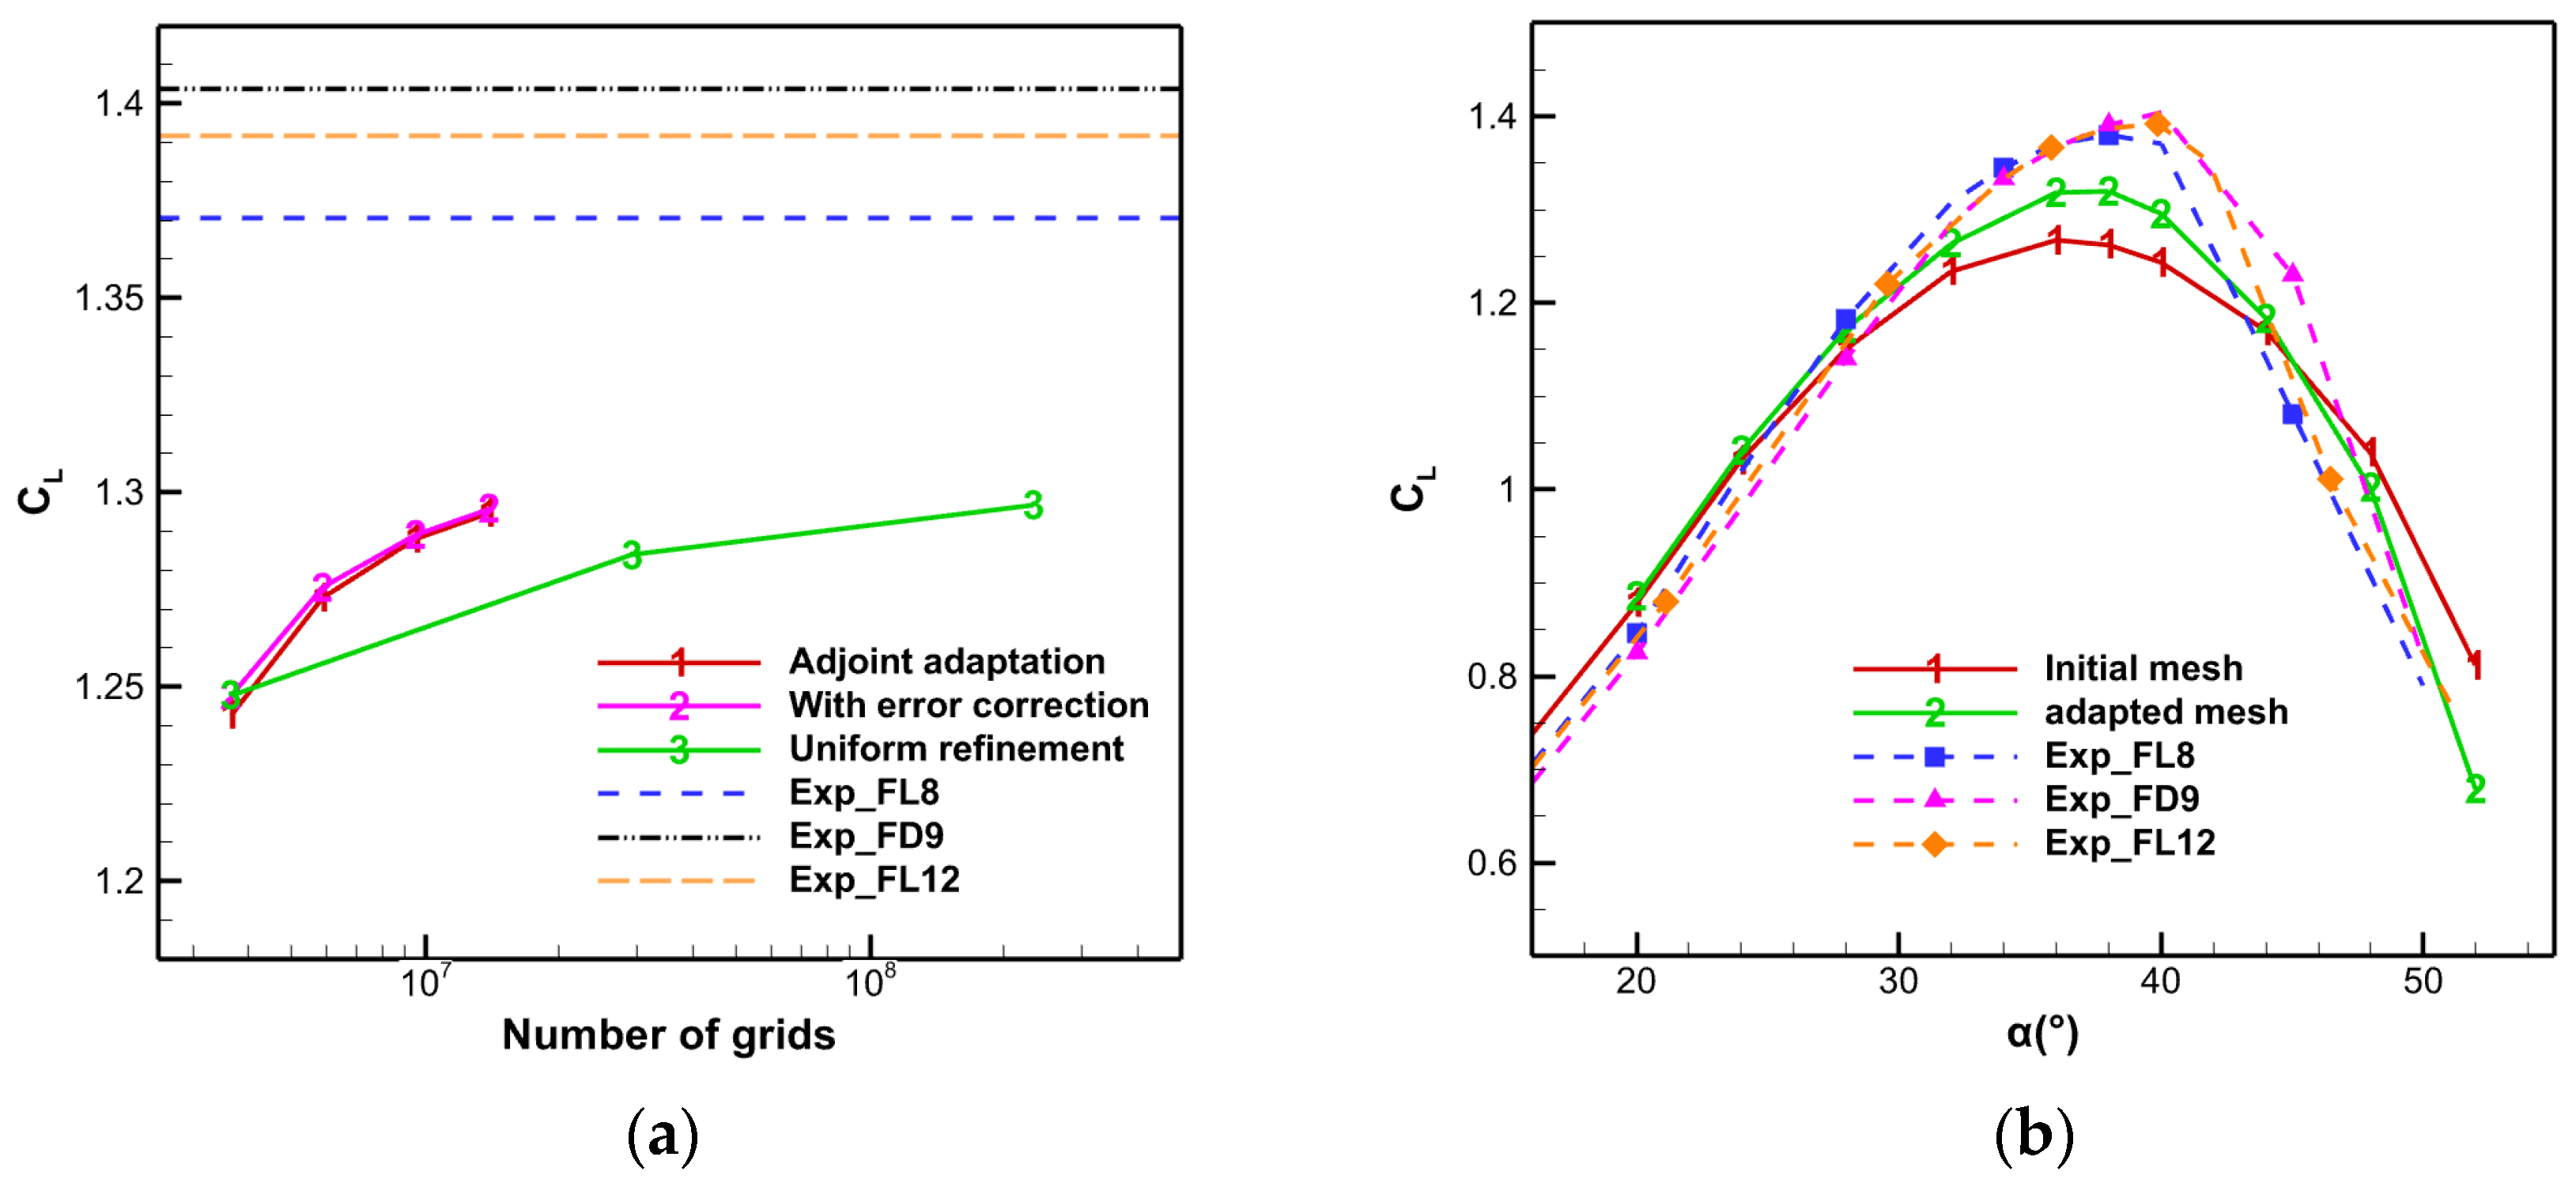
Adjoint-based mesh adaptation method serves as an effective approach to improve the predictive accuracy of aerodynamic characteristics. However, viscous boundary layer grids often encounter issues such as hanging nodes, negative volumes, and directional constraints during adaptation, significantly limiting their practical application. To address these challenges, this study proposes an innovative polyhedral conversion strategy. Cells containing hanging nodes resulting from refinement are converted into polyhedra, effectively eliminating topological constraints between adjacent mesh elements. This approach is combined with surface-conforming projection and distance function-based mesh deformation techniques to ensure precise geometric representation and high mesh quality after adaptation. Numerical experiments demonstrate that the proposed viscous boundary layer mesh adaptation strategy successfully handles both refinement and coarsening of boundary layer grids. In a typical high-angle-of-attack case for the NACA0012 airfoil, the adjoint-based mesh adaptation method reduced lift coefficient error from 4.21% to 0.30% after four adaptation cycles. For the CHN-F1 low-aspect-ratio flying wing configuration, the method reduced the lift discrepancy from 10.05% to 6.65% at 40° angle of attack. The polyhedral conversion approach effectively resolves common challenges in viscous boundary layer mesh adaptation, providing a robust solution for high-fidelity prediction of aerodynamic characteristics with significantly improved accuracy.
1. Introduction
Computational grids serve as the foundation of Computational Fluid Dynamics (CFD), and their quality directly influences the discretization accuracy of numerical simulations. This is particularly critical in turbulent flow simulations around complex geometries, where high-quality meshes must be concentrated in regions significantly affecting flow solutions [1,2]. In modern CFD workflows, generating high-quality meshes for complex configurations remains a major challenge [3,4], due primarily to two reasons: (1) Mesh generation is a laborious and time-consuming process, which still accounts for much human time spent in the entire CFD workflow [5]. For complex geometries or flow phenomena, poorly constructed meshes often lead to convergence difficulties and inaccurate results, requiring repeated modifications to improve accuracy and robustness. (2) Despite rapid advances in computing hardware, the scale of computational grids remains severely constrained. Under limited grid sizes, mesh density distribution must be optimized. However, this distribution relies heavily on users’ prior knowledge, while different configurations and flow conditions correspond to distinct flow-field characteristics. Practical engineering problems involve numerous flow states, making it impractical to generate tailored meshes for all possible conditions. Consequently, mesh adaptation techniques, which integrate flow solution and automated, dynamic adjustment of cell distribution, have attracted extensive research interest globally [6,7]. Notably, NASA’s CFD Vision 2030 study identifies mesh adaptation as one of seven critical technologies urgently requiring advancement [8].
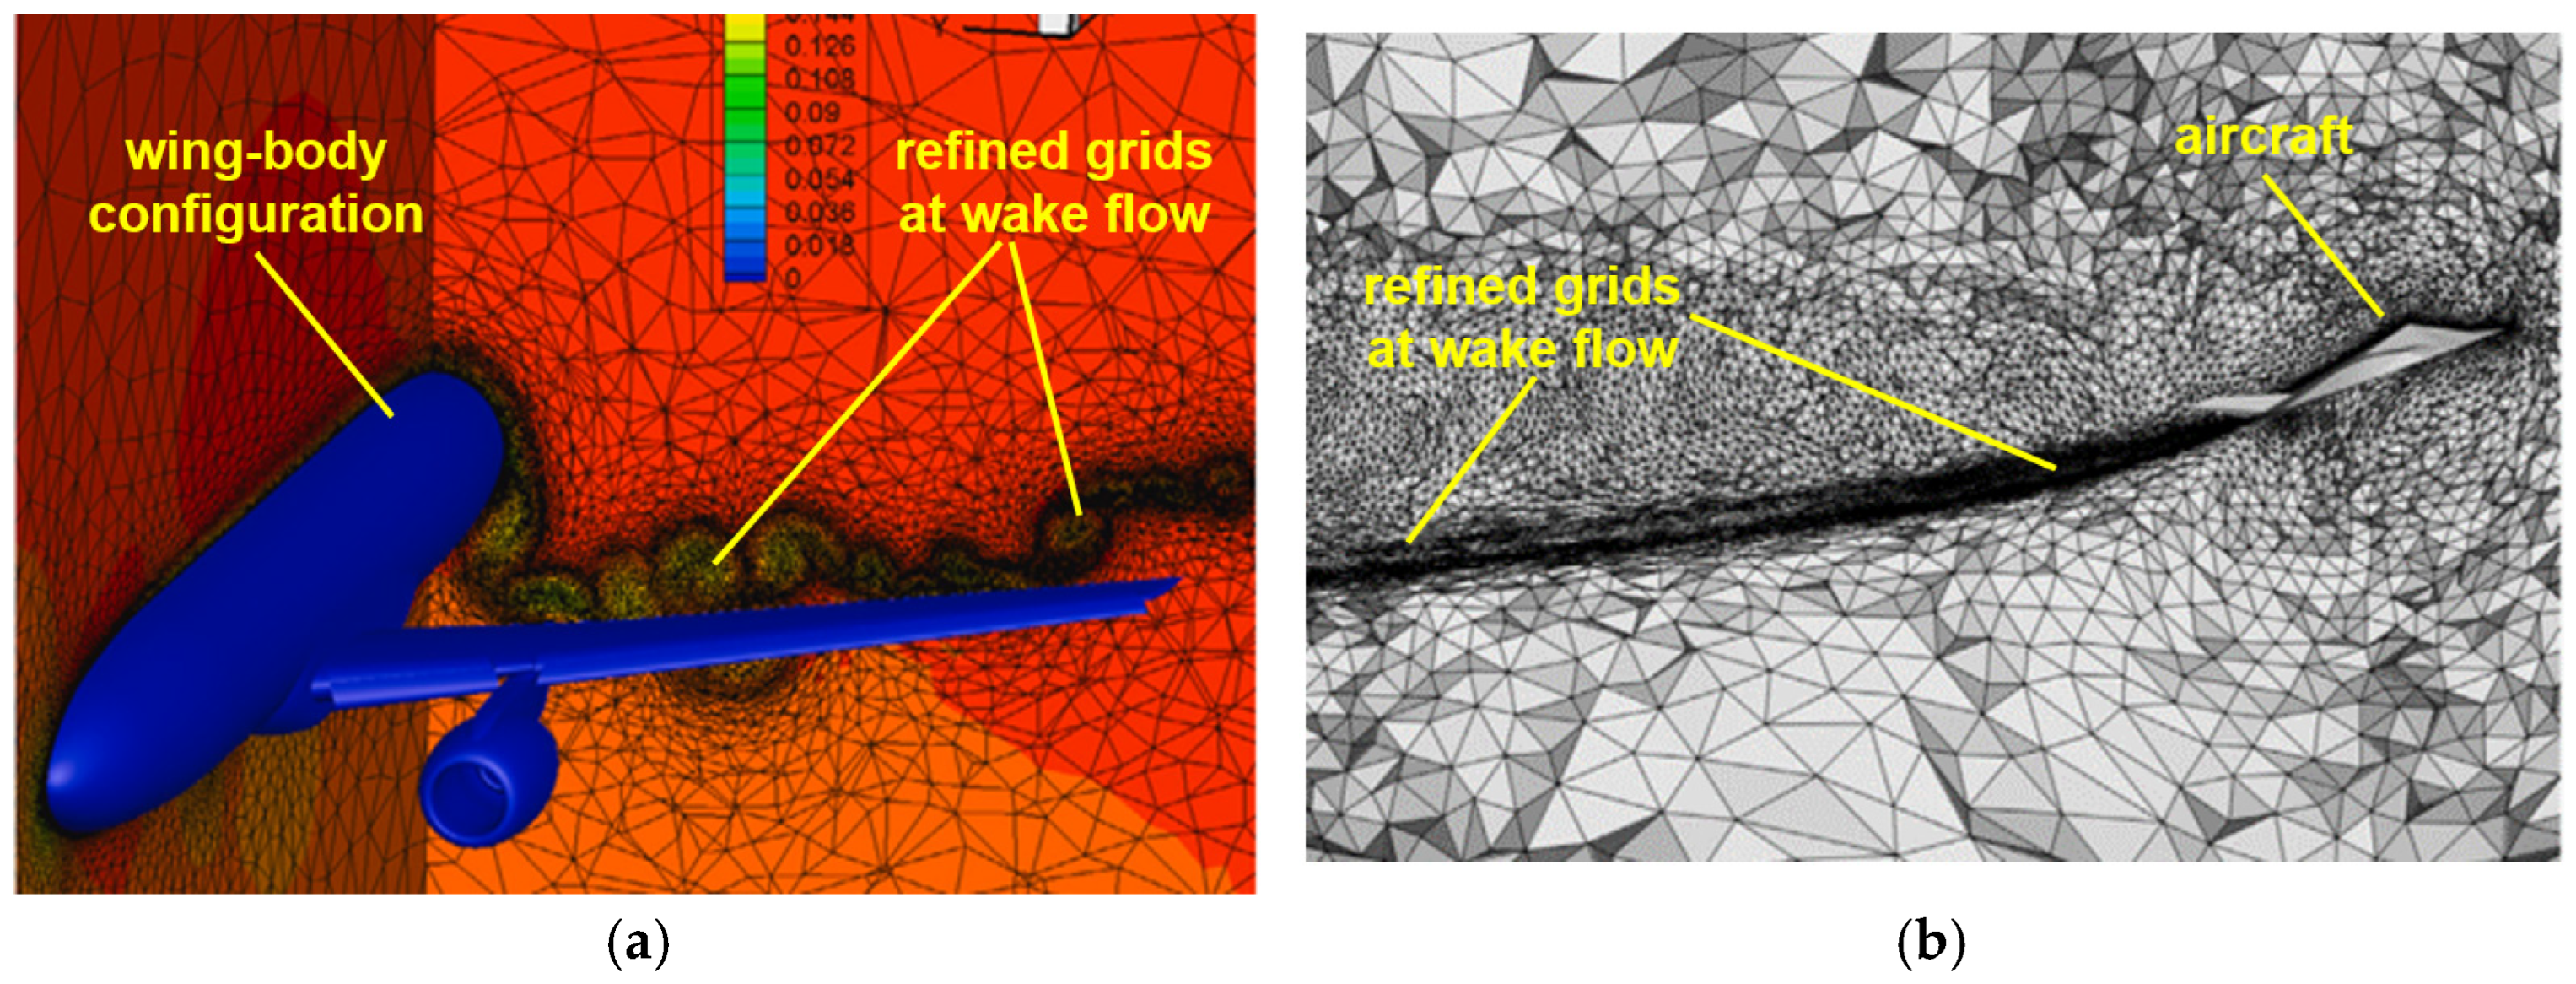
Traditional mesh adaptation methods primarily focus on enhancing the discernibility of flow features such as shock waves and vortices, known as flow feature-based mesh adaptation. These methods adaptively optimize mesh distribution in regions with strong flow gradients (e.g., shock waves, boundary layers) or vortical structures, significantly improving the resolution of flow field features [9,10]. Although flow feature-based mesh adaptation has been developed for many years and has been successfully applied to benchmark configurations from the 6th AIAA Drag Prediction Workshop, numerical results reveal critical limitations. While such methods enhance the resolution of shocks and wake structures (Figure 1), refining grids near flow features does not necessarily reduce discretization errors in target outputs such as lift and drag. Some flow features have negligible influence on key aerodynamic properties such as lift and drag. For example, as shown in Figure 1b, refining the wake region has minimal impact on lift/drag accuracy. Consequently, to achieve comparable precision levels, adaptive methods often require even more mesh elements than fixed-grid approaches, contradicting the original goal of improving computational efficiency.
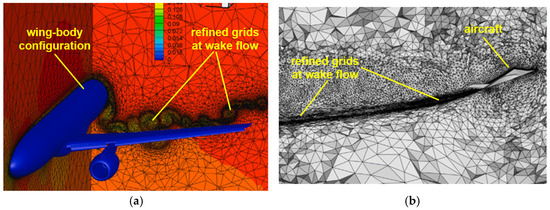
Figure 1.
Application of flow feature-based mesh adaptation to complex configurations: (a) wing-body configuration [11]; Figure adapted with permission from Comput. Fluids 2022, 234, 105259. Copyright 2021 Elsevier Inc. (b) aircraft wake flow characterization [12]; Figure adapted with permission from J. Comput. Phys. 2018, 373, 28–63. Copyright 2018 Elsevier Inc.
Adjoint equations establish a mathematical relationship between target outputs (e.g., aerodynamic forces) and flow field variables or local residuals. Through adjoint theory, the contribution of local discretization errors to global output errors can be quantitatively estimated, thereby identifying critical regions where mesh adaptation most significantly impacts functional accuracy [12]. This adjoint-based error estimation and mesh adaptation approach is particularly well-suited for optimizing aerodynamic predictions of full aircraft configurations. Michal et al. highlighted in the DPW6 workshop that such methods are expected to bring substantial advantages to numerical simulations [11]. Furthermore, NASA’s CFD Vision 2030 study explicitly outlines error estimation and mesh adaptation as key priorities for future development [8].
Baker’s comparative analysis of various mesh types concluded that unstructured hybrid grids offer an optimal balance between usability and numerical accuracy [13]. However, Balan and Park et al. systematically analyzed key components of adjoint-based error estimation and mesh adaptation workflows [14], revealing a critical deficiency in current viscous flow simulations: the lack of robust boundary layer mesh processing techniques. When hybrid meshes are used for viscous flow simulations, the boundary layer is typically discretized using prismatic/hexahedral elements with a layered structure. This semi-structured arrangement introduces significant challenges during adaptive refinement: selective cell refinement creates hanging nodes that most solvers cannot resolve; connectivity requirements force entire layers to be split along streamwise or surface-normal directions, generating excessive grid redundancy; and the extreme thinness of boundary layer cells often leads to negative volumes during layer-wise splitting, fundamentally compromising the robustness of the adaptation process.
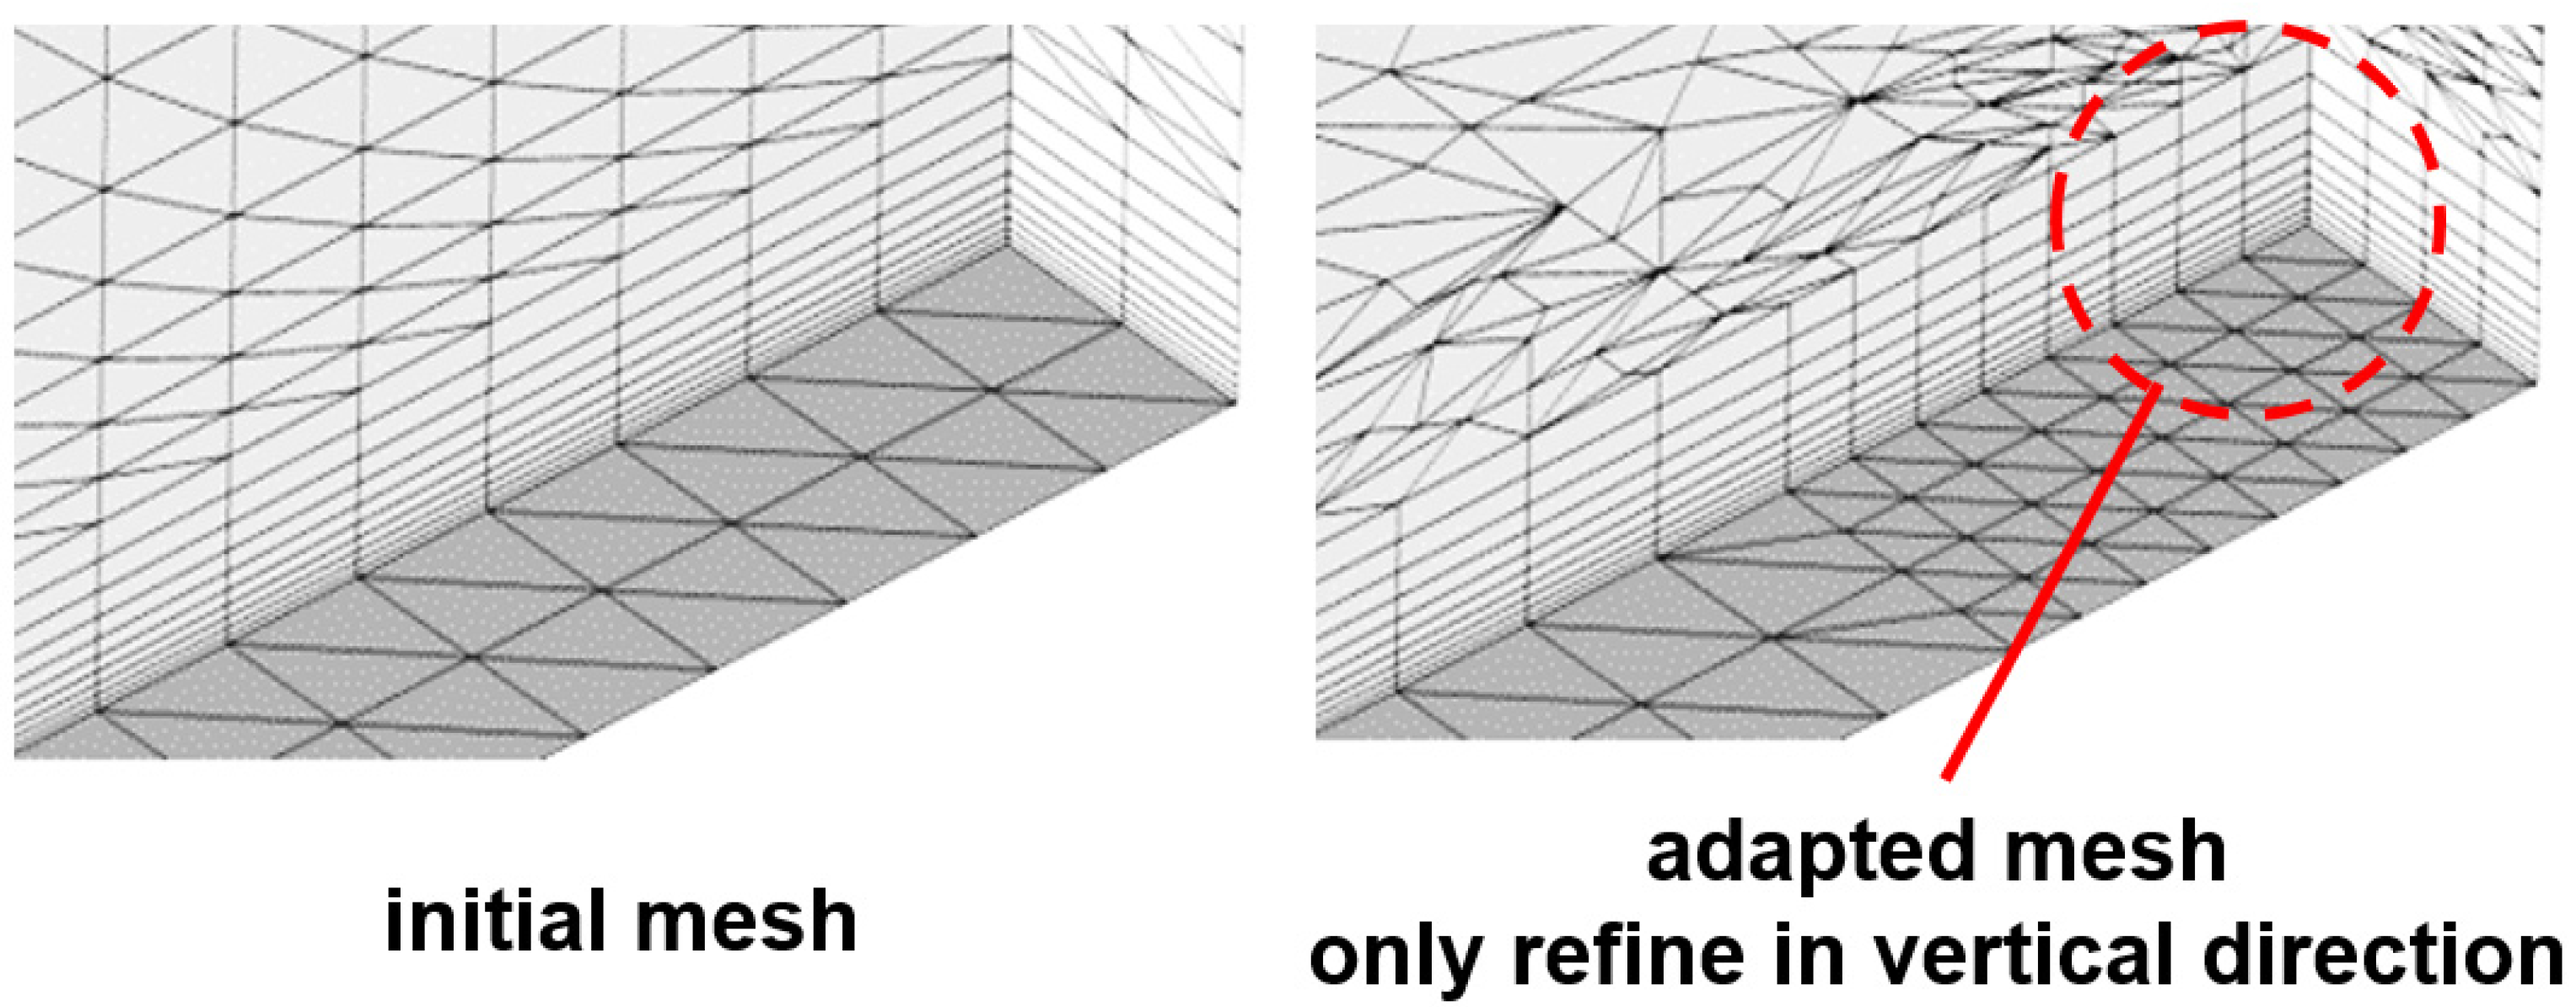
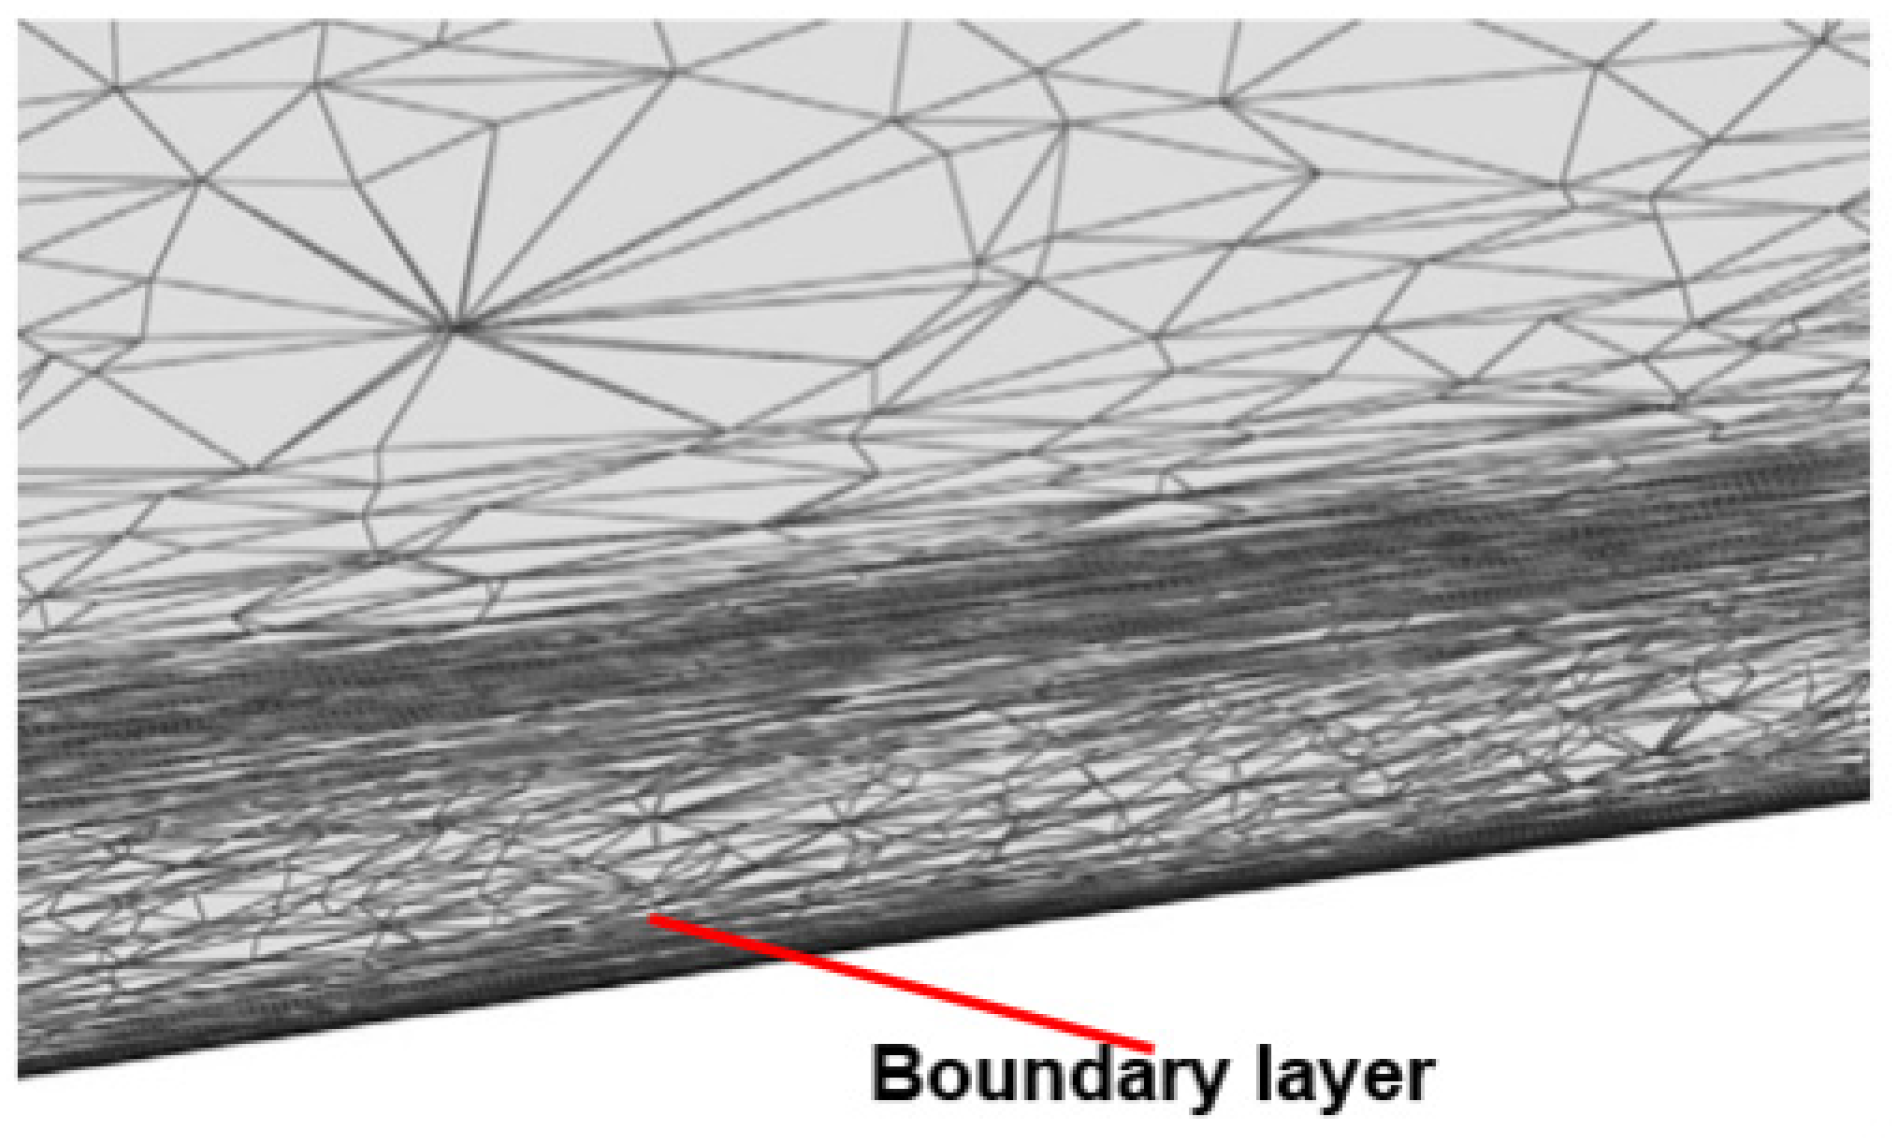
Three primary strategies are currently employed to address boundary layer mesh adaptation challenges. Solution 1: Freezing boundary layer elements during adaptation [15]. Some researchers avoid complex processing of prismatic/hexahedral elements by simply freezing them, adapting only the external tetrahedral regions [16]. Solution 2: Longitudinal-only splitting of prismatic/hexahedral elements [17]. To prevent negative volumes near walls, scholars restrict refinement to the longitudinal direction (Figure 2). Solution 3: Anisotropic tetrahedral filling of the boundary layer. This approach replaces semi-structured elements with highly anisotropic tetrahedra (Figure 3), simplifying mesh processing but introducing severe solver robustness challenges due to extreme element stretching. Critically, all three methods compromise the resolution of wall-normal gradients, either by freezing grids, restricting refinement directions, or introducing pathological element geometries, thereby fundamentally limiting their ability to accurately capture viscous boundary layer physics.
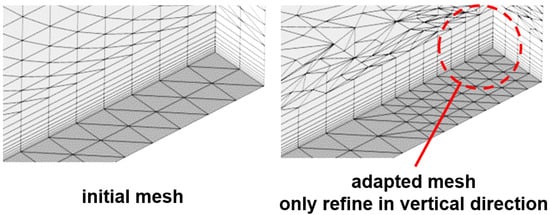
Figure 2.
Longitudinal-only splitting of prismatic elements during mesh adaptation.
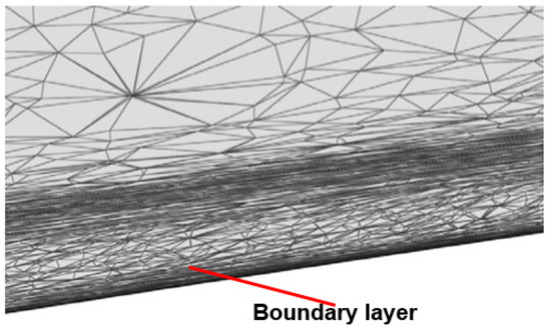
Figure 3.
Boundary layer filled with anisotropic tetrahedral elements.
In contrast to existing approaches, this study proposes an innovative polyhedral mesh conversion method to address hanging node issues in viscous boundary layer adaptation. By transforming locally refined elements with hanging nodes into polyhedra, the method eliminates topological conflicts without requiring modifications to adjacent elements. This is integrated with a surface-conforming projection method for precisely projecting newly generated surface nodes onto the geometry, and a distance function-based mesh deformation approach to dynamically adjust wall-normal spacing while maintaining boundary layer compatibility. Numerical experiments demonstrate that this strategy effectively handles boundary layer refinement/coarsening, removes inter-element constraints and directional limitations in mesh optimization, and proves robust for hybrid-mesh viscous flow simulations with strong engineering applicability.
The paper is organized as follows: Section 2 introduces the numerical methodology and adjoint-based mesh adaptation framework; Section 3 details the proposed viscous boundary layer mesh adaptation strategy; Section 4 presents numerical experiments validating the approach; and Section 5 summarizes key findings and research contributions.
2. Numerical Simulation and Adjoint-Based Mesh Adaptation
2.1. Flow Solver and Governing Equations
The flow solver employed in this study is the in-house developed NNW-FlowStar software, a large-scale general-purpose CFD analysis tool designed for aerodynamic simulations of aerospace vehicles [18]. The solver utilizes an unstructured finite-volume method and incorporates large-scale parallel computing technologies [19]. It implements mesh adaptation techniques based on both flow feature detection [20] and adjoint error estimation [21], enabling high-fidelity resolution of flow structures and aerodynamic characteristics. The numerical experiments in Section 4 are all based on NNW-FlowStar (V50) software.
This study employs the integral form of the Reynolds-Averaged Navier–Stokes (RANS) equations as the governing equations. For three-dimensional steady compressible flows, the conservation form of the Navier–Stokes equations can be expressed as:
where V denotes the volume of the control cell, Ω represents the closed surface area of the control cell, τ is the pseudo-time variable, W is the vector of conserved variables, FC and FV are the inviscid and viscous flux vectors, respectively, defined as:
where p and ρ denote pressure and density, respectively; n is the outward unit normal vector on the control cell boundary; (u, v, w) are the velocity components in the three coordinate directions; E is the total energy; V is the contravariant velocity; and H represents the total enthalpy.
2.2. Adjoint-Based Error Estimation and Mesh Adaptation Methodology
Figure 4 illustrates a typical workflow for adjoint-based error estimation and mesh adaptation. The process begins with an initial coarse mesh as input. First, the primal flow solution and adjoint solution are computed on this initial mesh. Subsequently, the error in target outputs (e.g., lift and drag) is estimated based on the primal and adjoint solutions. If the estimated error meets the prescribed accuracy tolerance, the flow solution and error-corrected outputs are finalized. If the error remains unacceptable, the error estimates guide mesh adaptation: regions with high contributions to output errors are refined, while regions with negligible impacts are coarsened. The primal and adjoint solutions are then interpolated onto the adapted mesh to accelerate convergence in the subsequent adaptation cycle. This iterative process continues until the output error converges within the target accuracy threshold.

Figure 4.
Workflow of adjoint-based error estimation and mesh adaptation.
After obtaining the discrete solution of the flow equations, the target functional f (e.g., lift, drag, or moment) can be expressed as a function of the discrete flow solution W, denoted as f = f(W). The derivative of the target functional with respect to the flow variables, via the chain rule, yields:
where R represents the residual of the discretized flow equations. The adjoint variable is defined as the sensitivity of the target functional to the discrete residual [19]:
Combining (4) and (5), the adjoint equation is derived:
Consider two distinct meshes: a coarse mesh and a fine mesh , with the target functionals computed on them denoted as and , respectively. The coarse mesh requires fewer computational resources but yields lower accuracy, while the fine mesh provides high accuracy at substantial computational cost. It is feasible to correct to approximate . This study employs the adjoint-based correction method from Ref. [18], where the error estimate on the coarse mesh is expressed as:
In the error estimate term , denotes the adjoint reconstruction on a fine mesh, and is the residual computed on the fine mesh using the reconstructed flow solution . This approach is termed the adjoint-weighted residual method [22]. It enables evaluation of the discretization error on the current mesh without solving the flow or adjoint equations on the fine mesh [23,24]. This error estimation method has a rigorous mathematical foundation specifically for flow solutions with second-order spatial accuracy [15].
3. Viscous Boundary Layer Mesh Adaptation Method
Upon identifying elements requiring refinement or coarsening based on mesh adaptation criteria, the current mesh undergoes adaptive optimization. This work implements refinement through element subdivision, where targeted elements are split into multiple smaller elements while maintaining mesh quality. Coarsening operates as the reverse process, merging adjacent elements into larger units. A persistent challenge in viscous flow simulations involves handling the thin semi-structured “layer-type” elements (e.g., prisms/hexahedra) within boundary layers. To address this, we propose a polyhedral conversion method that transforms these problematic elements into polyhedra, effectively resolving topological constraints inherent in hybrid boundary layer meshes.
In practical applications, initial surface meshes often lack sufficient resolution to capture high-curvature geometric features accurately. Consequently, new nodes generated during surface refinement frequently deviate from the actual geometry and require projection onto the true surface. Furthermore, boundary layer elements exhibit extreme aspect ratios, with wall-normal dimensions significantly smaller than tangential dimensions. This anisotropy makes them prone to distortion, element overlap, or negative volumes after surface projection, necessitating complementary mesh quality optimization near wall boundaries to ensure numerical stability and solution accuracy.
3.1. Mesh Refinement and Coarsening Methods
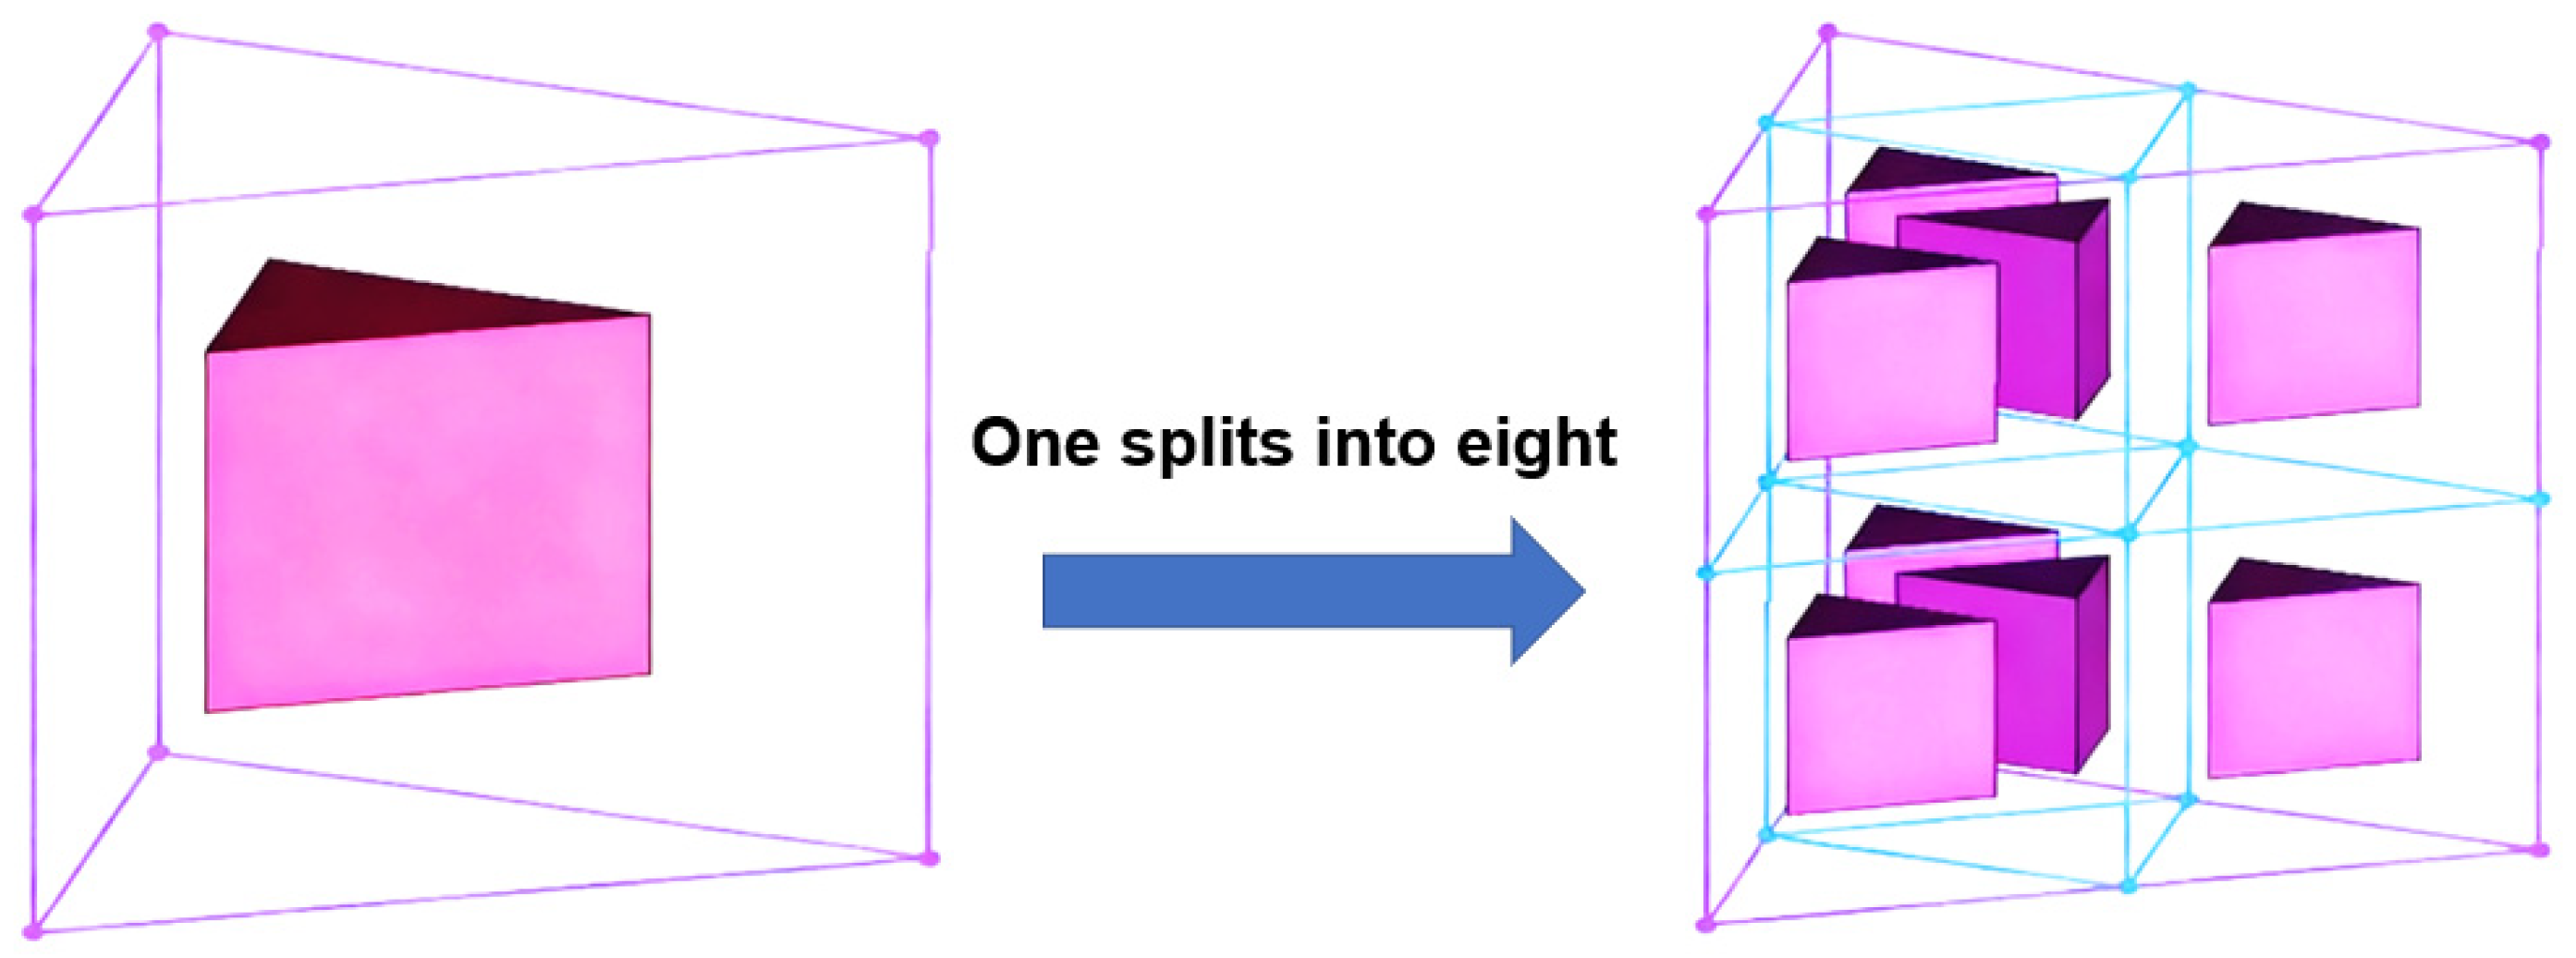
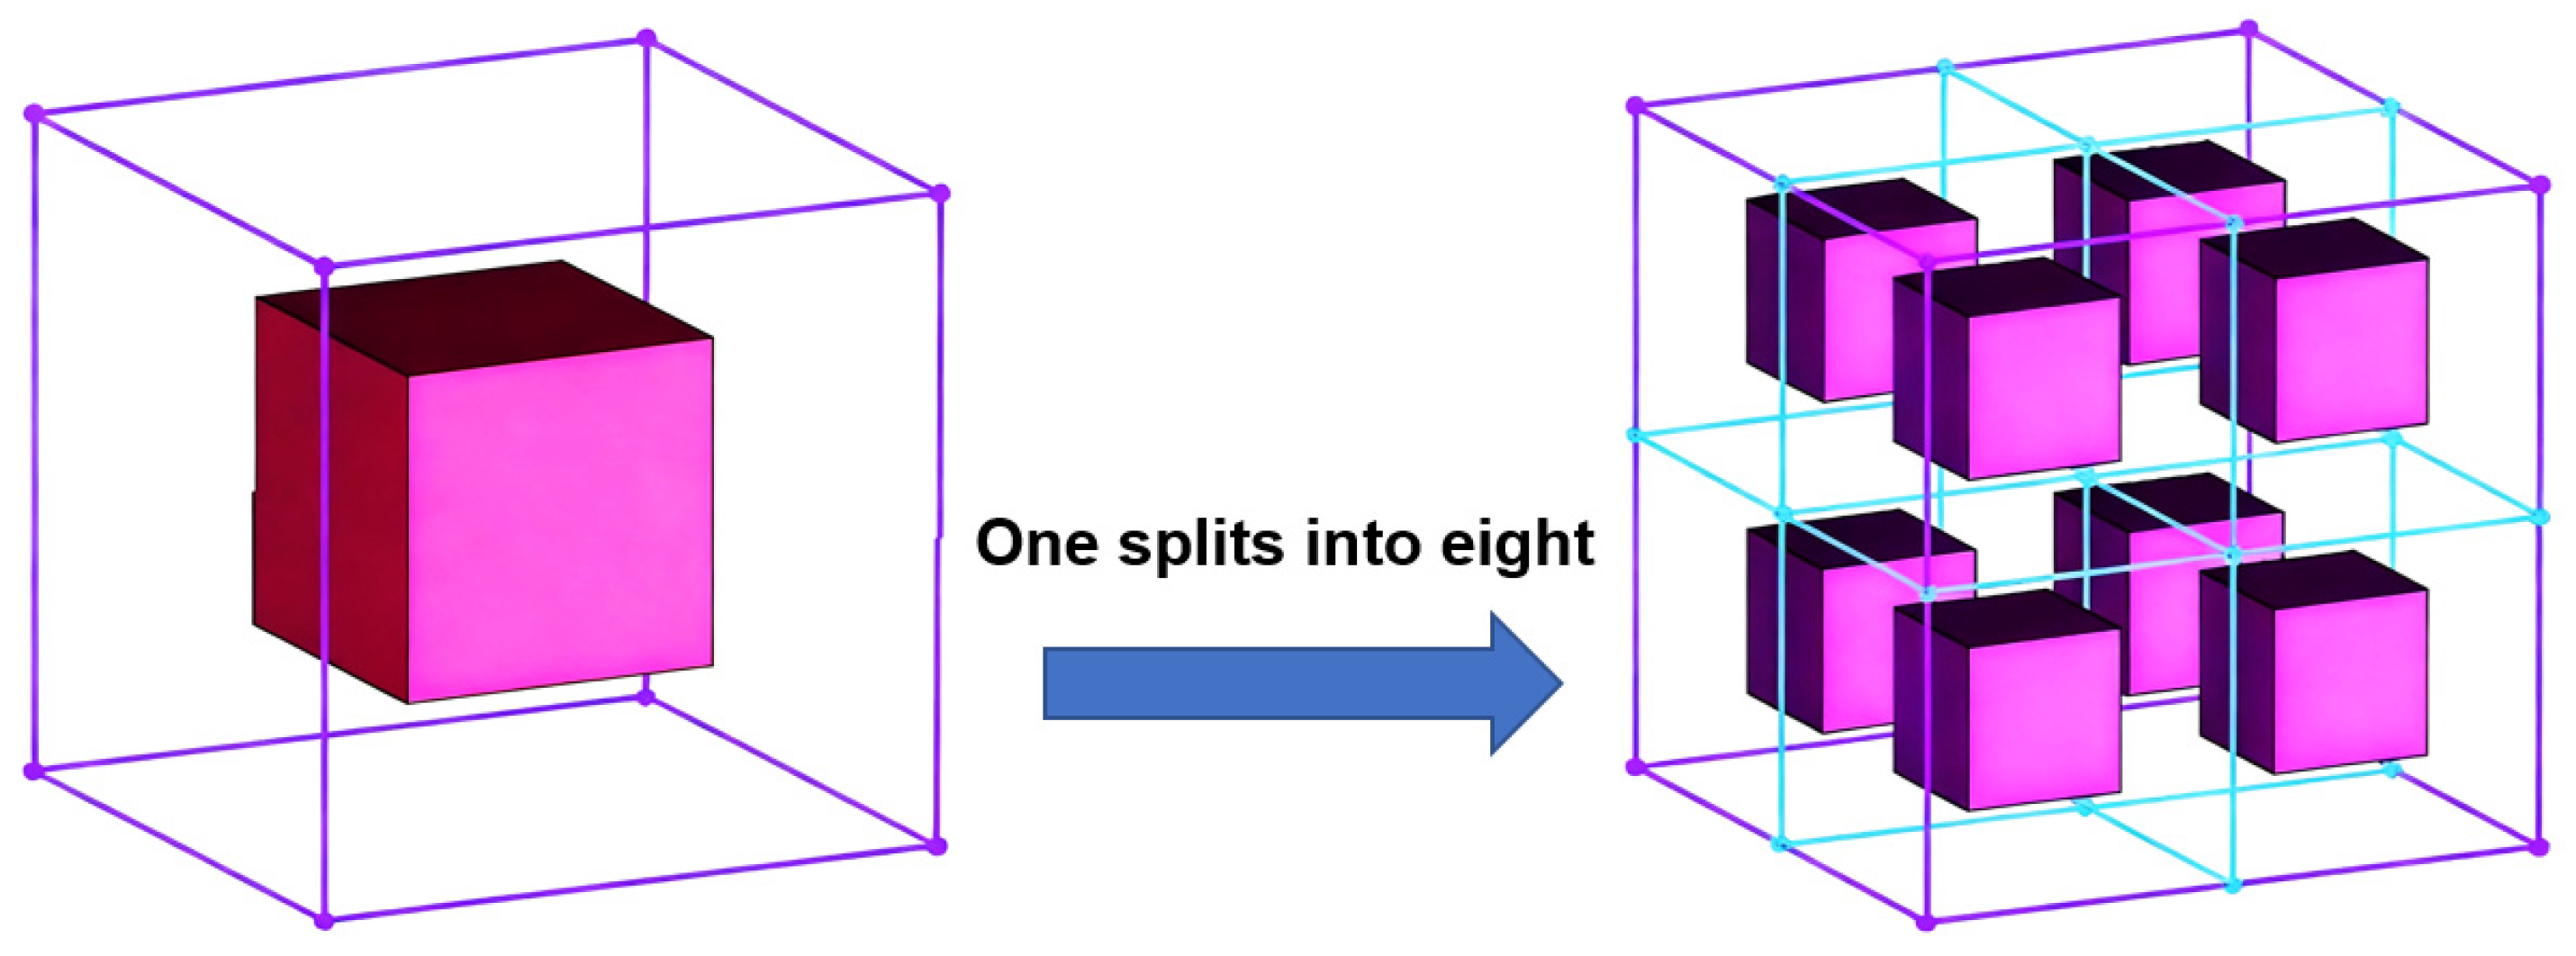
This study focuses on the refinement/coarsening methodology and hanging node treatment for layered semi-structural elements (specifically prisms and hexahedra) within the boundary layer. Figure 5 and Figure 6 illustrate the isotropic refinement patterns for prismatic and hexahedral elements, respectively: a single prism is subdivided into eight smaller, similar prisms, while a single hexahedron is subdivided into eight smaller, similar hexahedra. This approach preserves geometric similarity between the original coarse elements and their refined counterparts, maintains the layered structure of boundary layer elements, and provides superior resolution of boundary layer flows. The coarsening process is implemented as the exact reverse of the refinement operation.
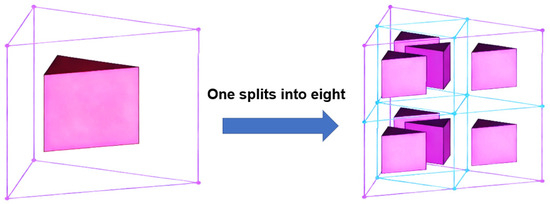
Figure 5.
Refinement method for boundary layer prismatic elements.
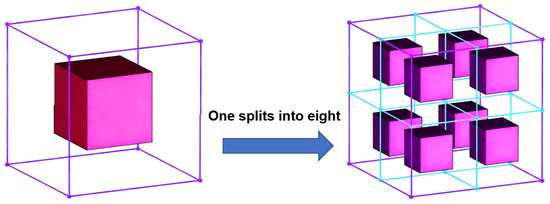
Figure 6.
Refinement method for boundary layer hexahedral elements.
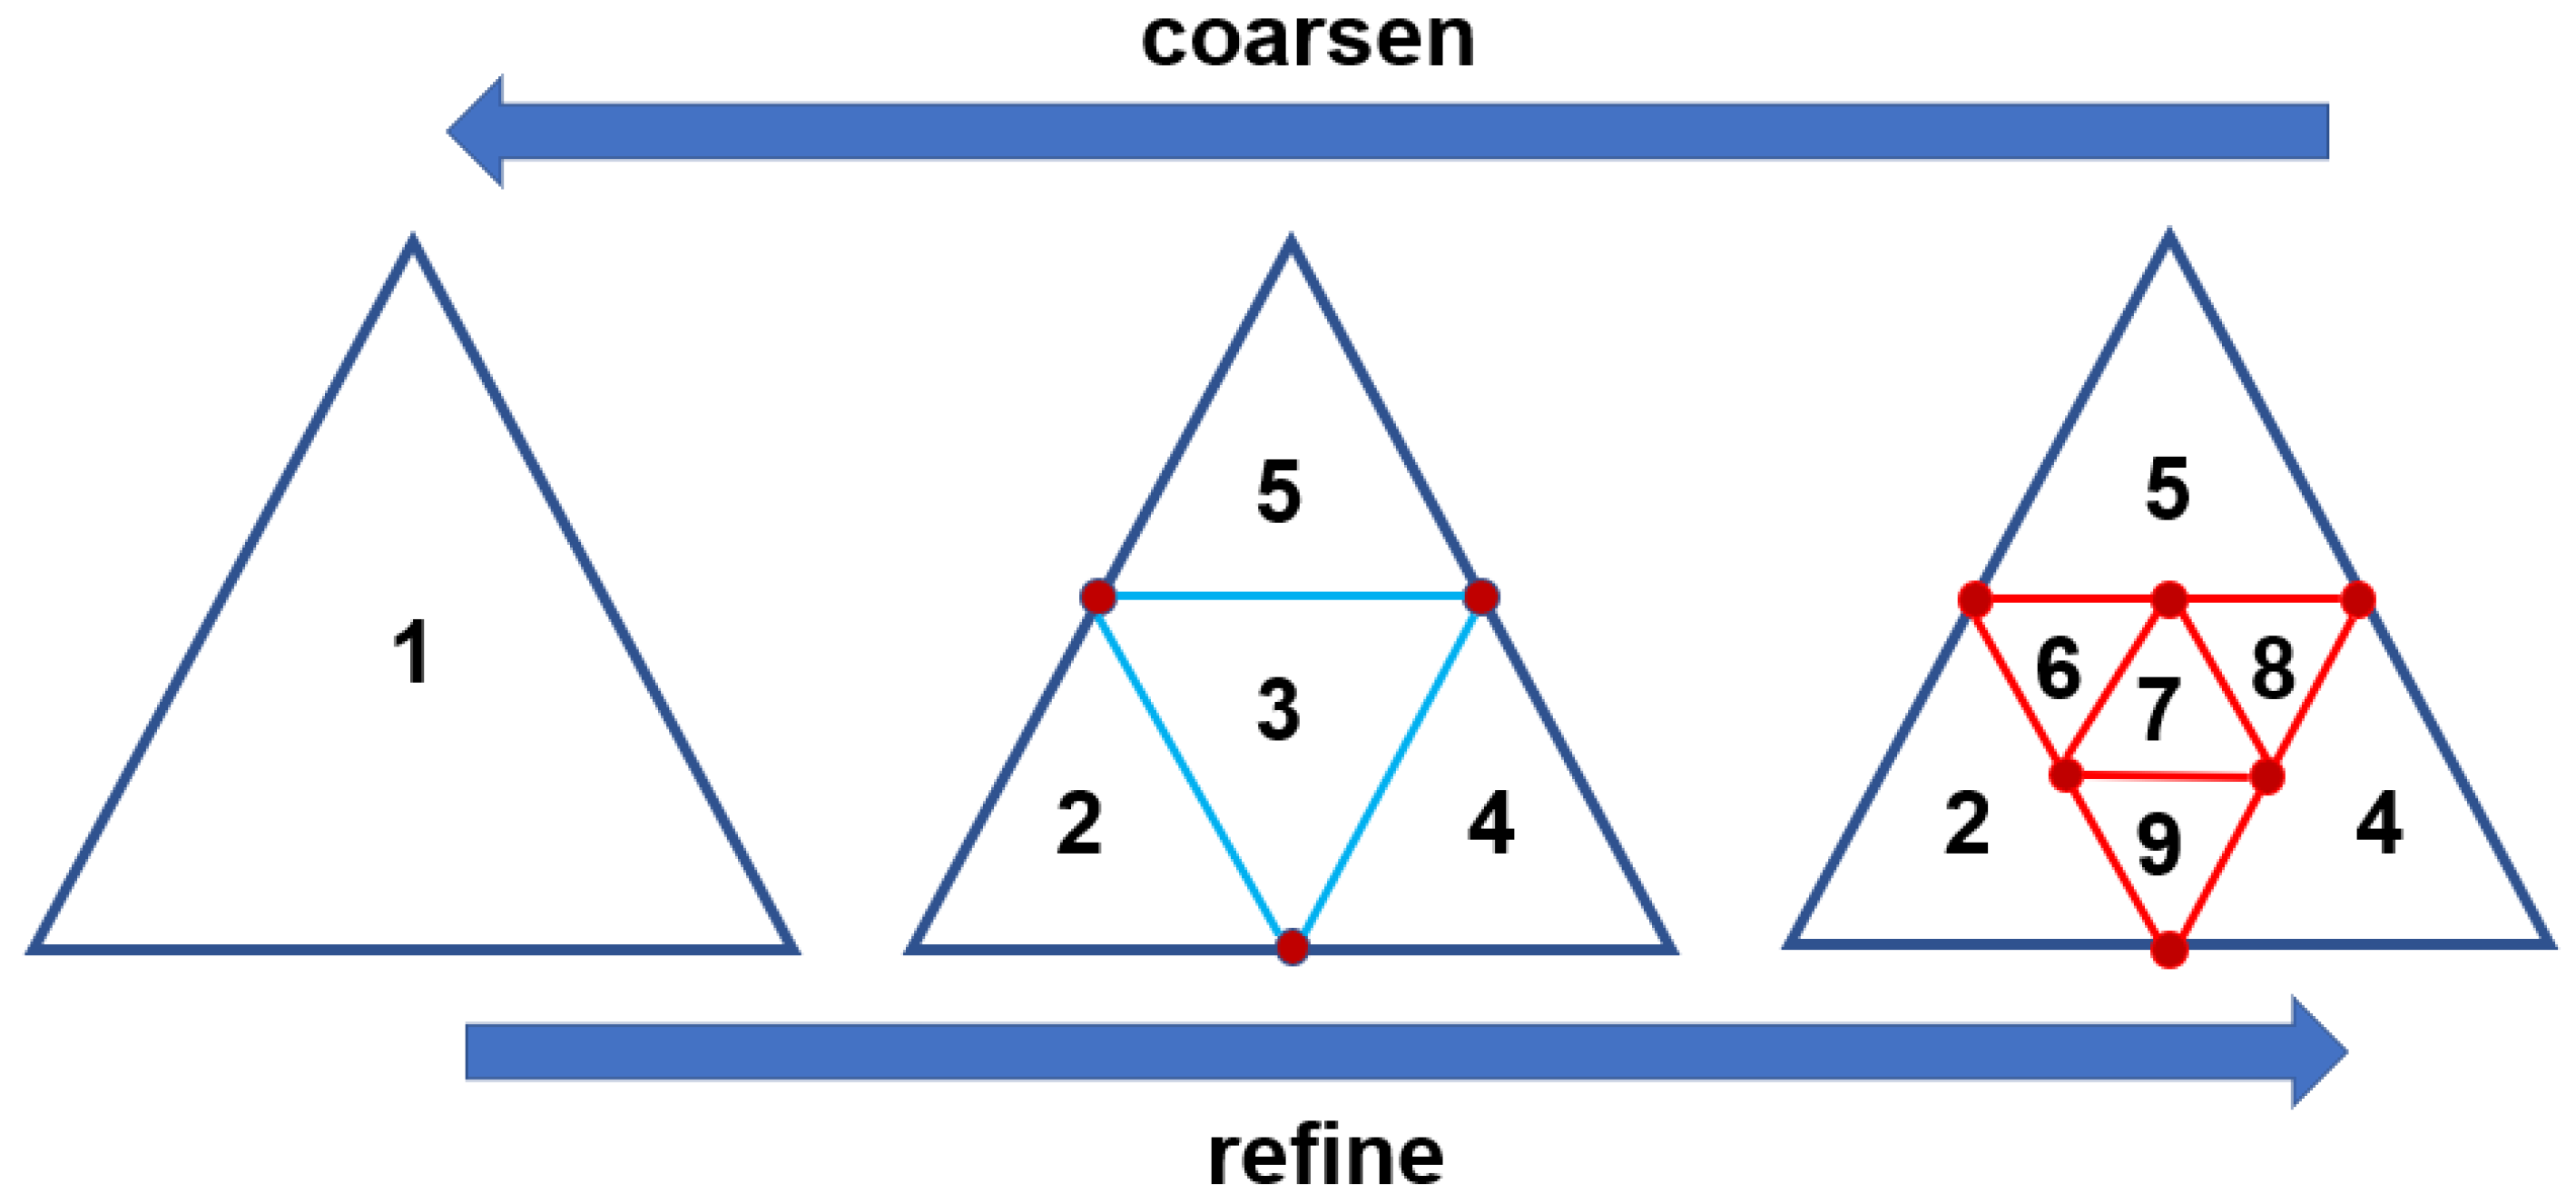
The coarsening process of cells in this study is defined as the inverse operation of refinement. As illustrated in Figure 7, when an element is identified for coarsening, adjacent elements are merged to form a coarser element. For example, during refinement, element {1} is subdivided into elements {2, 3, 4, 5}, and element {3} is further subdivided into {6, 7, 8, 9}. When element {6} is flagged for coarsening, it is merged with its adjacent elements {7, 8, 9} to reconstruct the coarse element {3}. Note that the proposed coarsening method cannot be applied to initial mesh elements (e.g., element {1} in Figure 7).
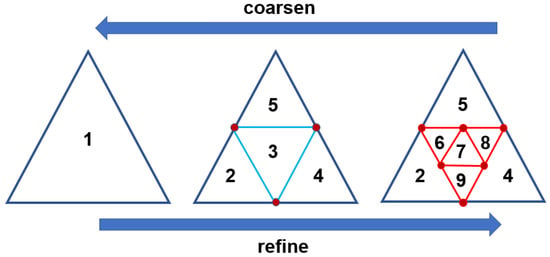
Figure 7.
Schematic of mesh coarsening.
The level of mesh adaptation is defined as the number of refinements applied to a cell from the initial mesh. For example, in Figure 7, the level of element {1} is 0, the level of elements {2, 3, 4, 5} is 1, and the level of elements {6, 7, 8, 9} is 2. During mesh optimization, the following criteria must be satisfied:
- (1)
- To prevent excessive volume ratios between adjacent cells, the level difference between co-faced mesh elements is limited to no more than 1.
- (2)
- When co-faced elements are assigned conflicting adaptation operations (e.g., refinement vs. coarsening) that would result in a level difference exceeding 1, refinement takes precedence. For instance, if element {2} is marked for coarsening and element {3} for refinement in Figure 7, the refinement of element {3} is prioritized.
3.2. Adjoint-Based Mesh Adaptation Criterion
The objective of mesh adaptation using adjoint error estimation is to minimize the global discretization error of the computational mesh. Let k denote a cell in the current mesh. The estimated error for each cell can be computed using the adjoint-based method. The total residual error ε across the entire mesh is then defined as the sum of the residual errors over all mesh cells:
During mesh adaptation, users must specify an error tolerance for the target functional, for instance, a drag coefficient tolerance of 0.0001 (1 count). Denoting the user-defined error tolerance as e, the average error threshold per cell is given by:
where N represents the total number of cells in the mesh.
This study develops a mesh adaptation criterion that integrates global and local error indicators. Upon completion of the error estimation, the global adaptation criterion is first applied to determine whether the overall error of the mesh exceeds the user-defined tolerance. Mesh adaptation is performed only if the condition is satisfied, i.e., only when the total residual error is greater than the prescribed threshold. If the global residual error is lower than the tolerance, the current mesh is deemed sufficient to meet the required accuracy, and no further adaptation is necessary.
Once the need for adaptation is confirmed, the local adaptation criterion is subsequently applied to evaluate each individual mesh cell k. A cell is marked for refinement only if its residual error exceeds the average error threshold . Conversely, if a cell’s error is lower than the average error threshold, it is considered sufficiently accurate and is not refined.
Finally, to determine whether a cell should be coarsened, its error is compared against a coarsening threshold . Coarsening is performed when , indicating that the cell’s error is negligible. In this study, the coarsening threshold is set to 1% of the average error threshold per cell, defined as .
During adjoint-based mesh adaptation, it is essential to consider not only which cells require optimization due to high errors, but also to control the rate of mesh growth throughout the adaptive process. If an overly stringent error tolerance is set by the user, a large number of cells may be flagged for refinement, leading to a substantial increase in total mesh size. Rapid mesh expansion not only slows the reduction in global error throughout the adaptive iterations but also consumes considerable computational resources in early stages, thereby reducing the overall efficiency of mesh adaptation [9]. Therefore, building upon the global and local mesh adaptation criteria, this study further introduces control over the mesh growth ratio ΔN during the adaptive iteration process:
where N denotes the current number of grid cells and Na represents the number of cells after adaptation. In this work, the mesh growth ratio ΔN constrained within the range of 0.2 to 0.5 during the adaptive process. Specifically, all cells are ranked according to their adaptation indicators, and only the top-ranked cells, those with the largest errors, are selected for refinement under this growth ratio constraint.
3.3. Polyhedral Grid Conversion Method for Boundary Layers
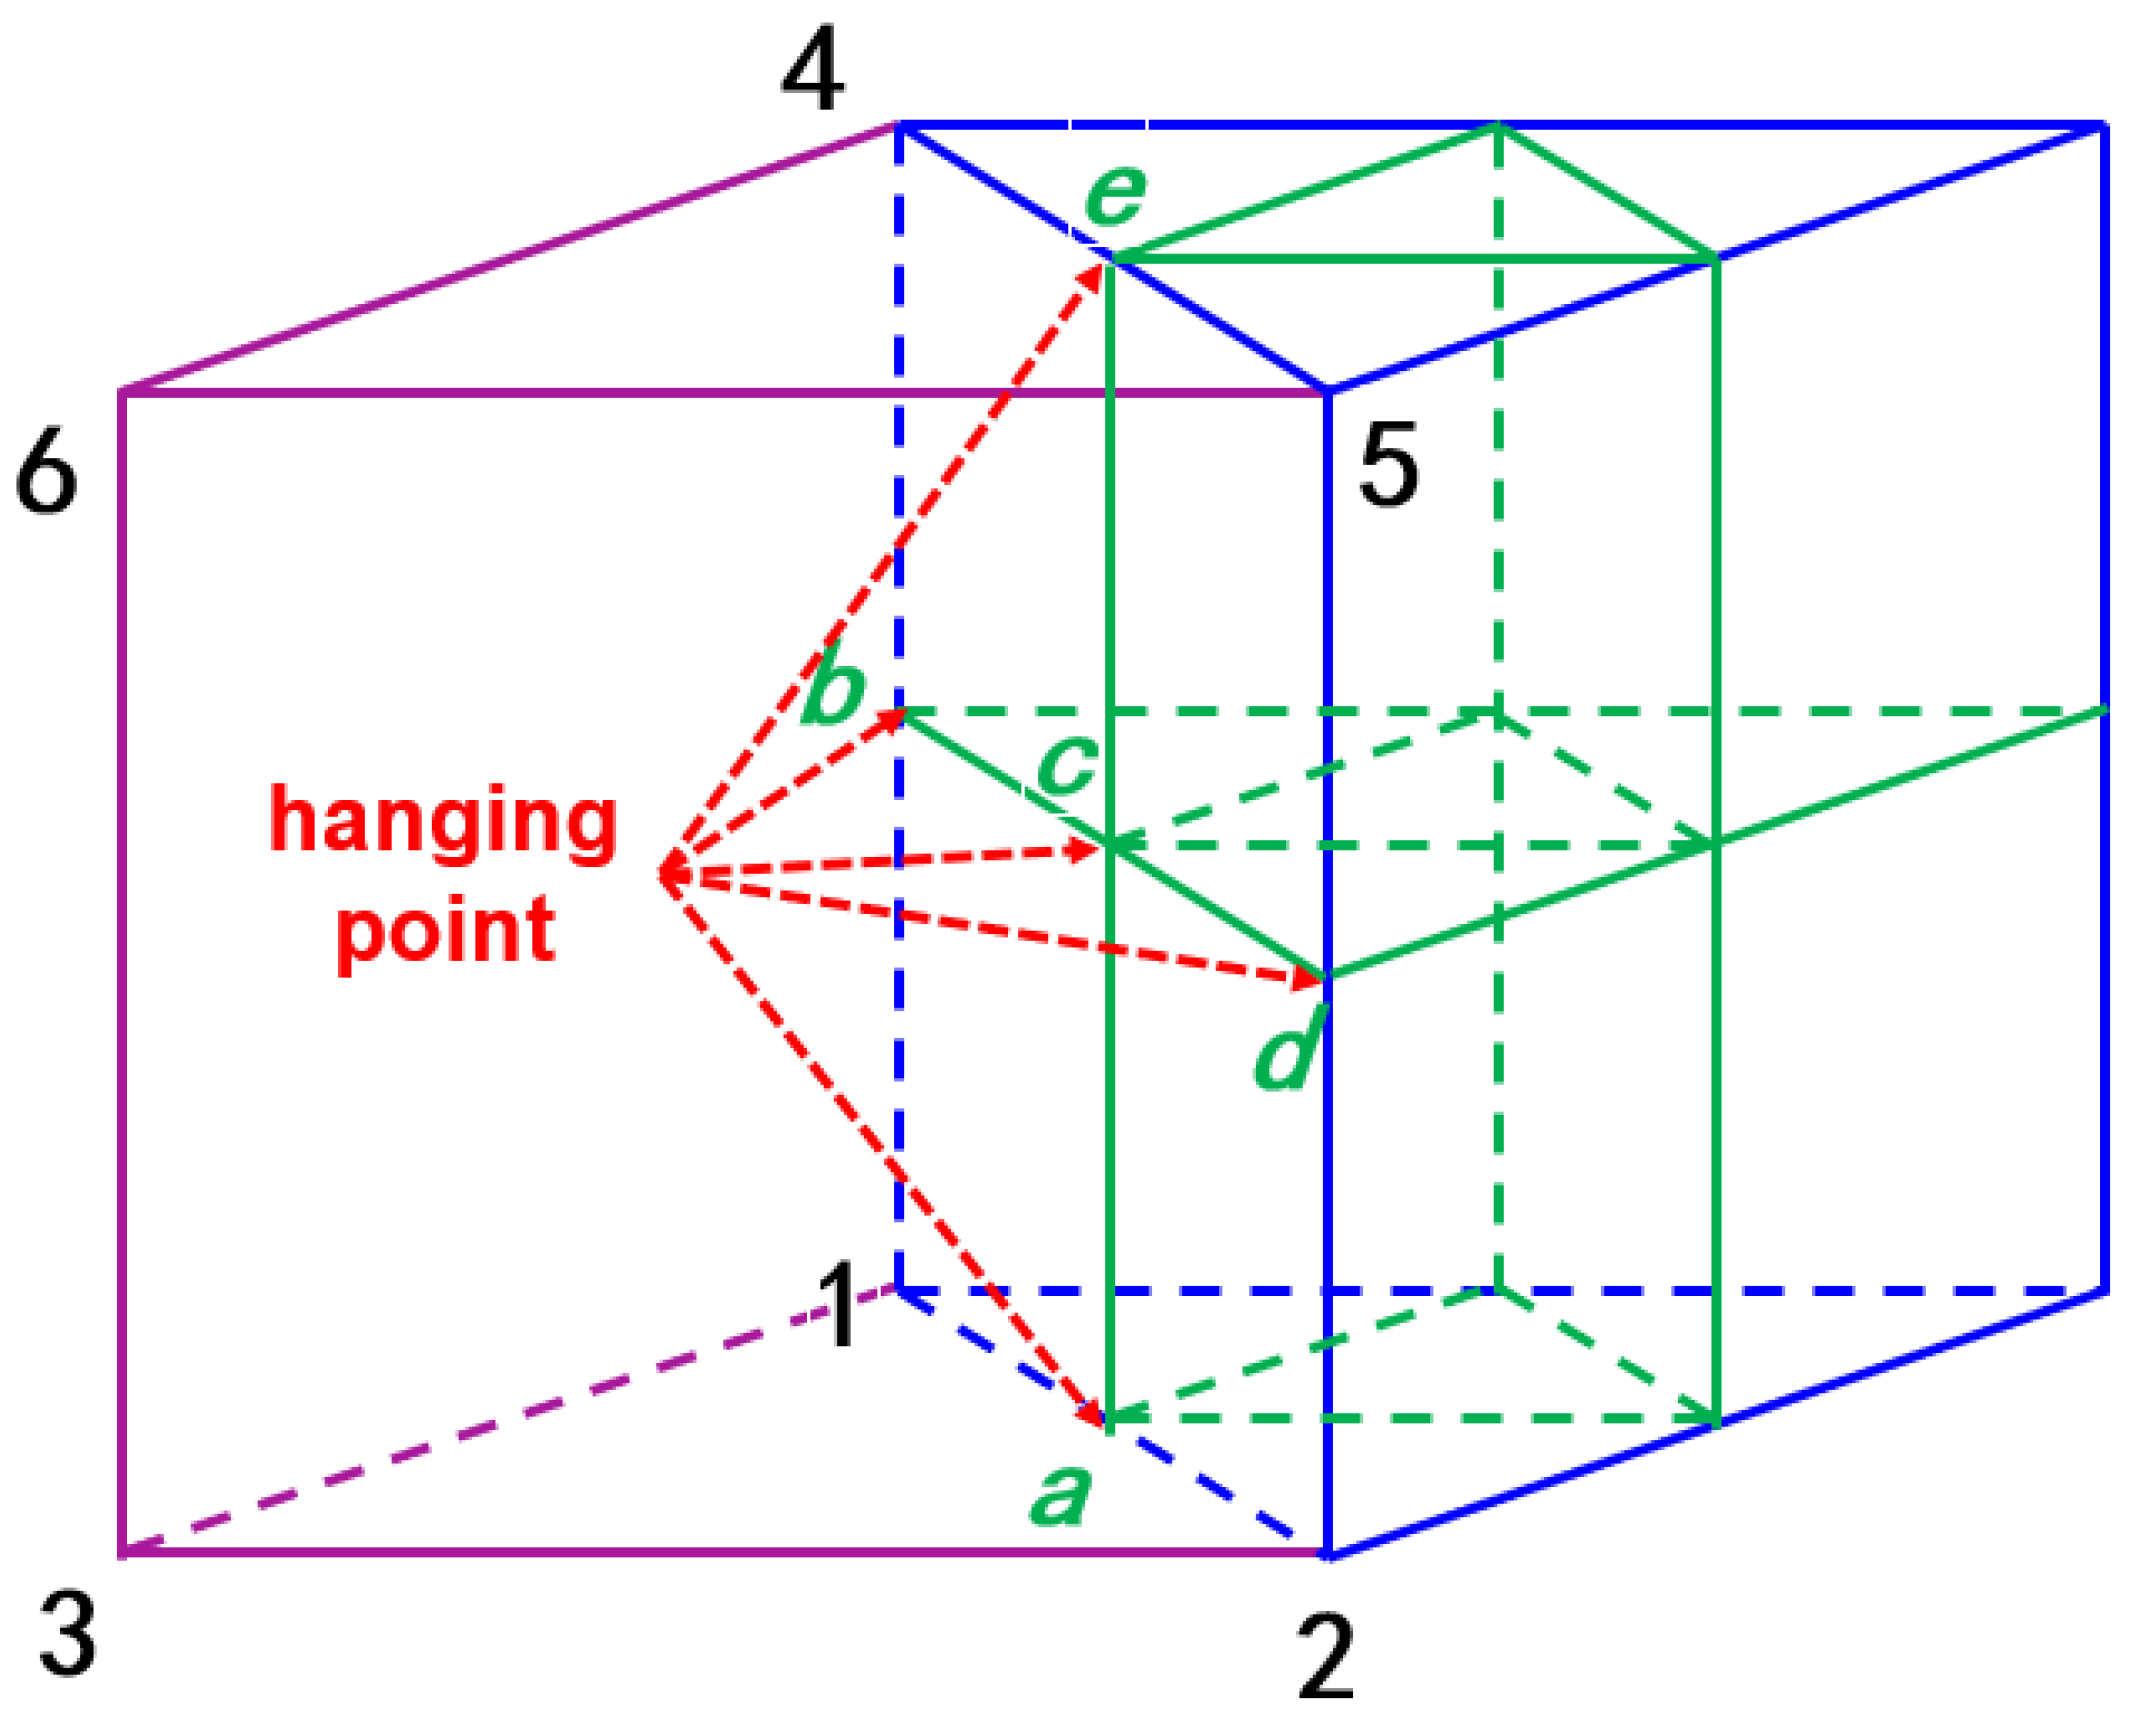
Unstructured hybrid meshes face significant challenges during adaptive refinement of boundary layer elements. Refining only selected cells generates hanging nodes (Figure 8), which most flow solvers cannot handle. Due to mesh connectivity constraints, prismatic/hexahedral elements often require full-layer splitting along streamwise or wall-normal directions during refinement, leading to excessive grid redundancy and reduced adaptation robustness. To avoid hanging nodes, current academic solutions typically adopt one of three strategies: (a) freezing the boundary layer mesh; (b) restricting refinement to longitudinal splitting; (c) replacing prismatic/hexahedral elements with highly anisotropic tetrahedra. However, viscous boundary layer flows are most sensitive to wall-normal gradients, and none of these methods fundamentally improve accuracy in capturing these critical physics. Thus, boundary layer mesh processing remains a major obstacle limiting the application of adaptation techniques to viscous flows.
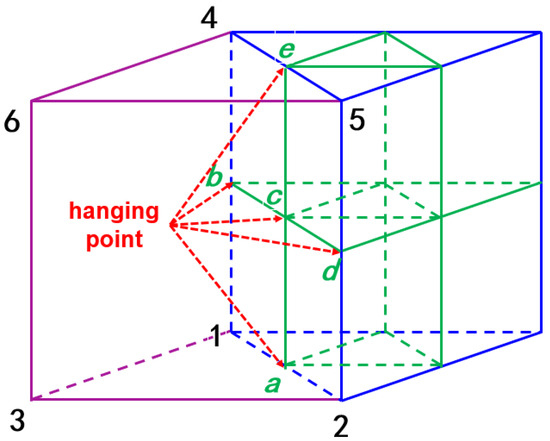
Figure 8.
Hanging nodes in the boundary layer mesh.
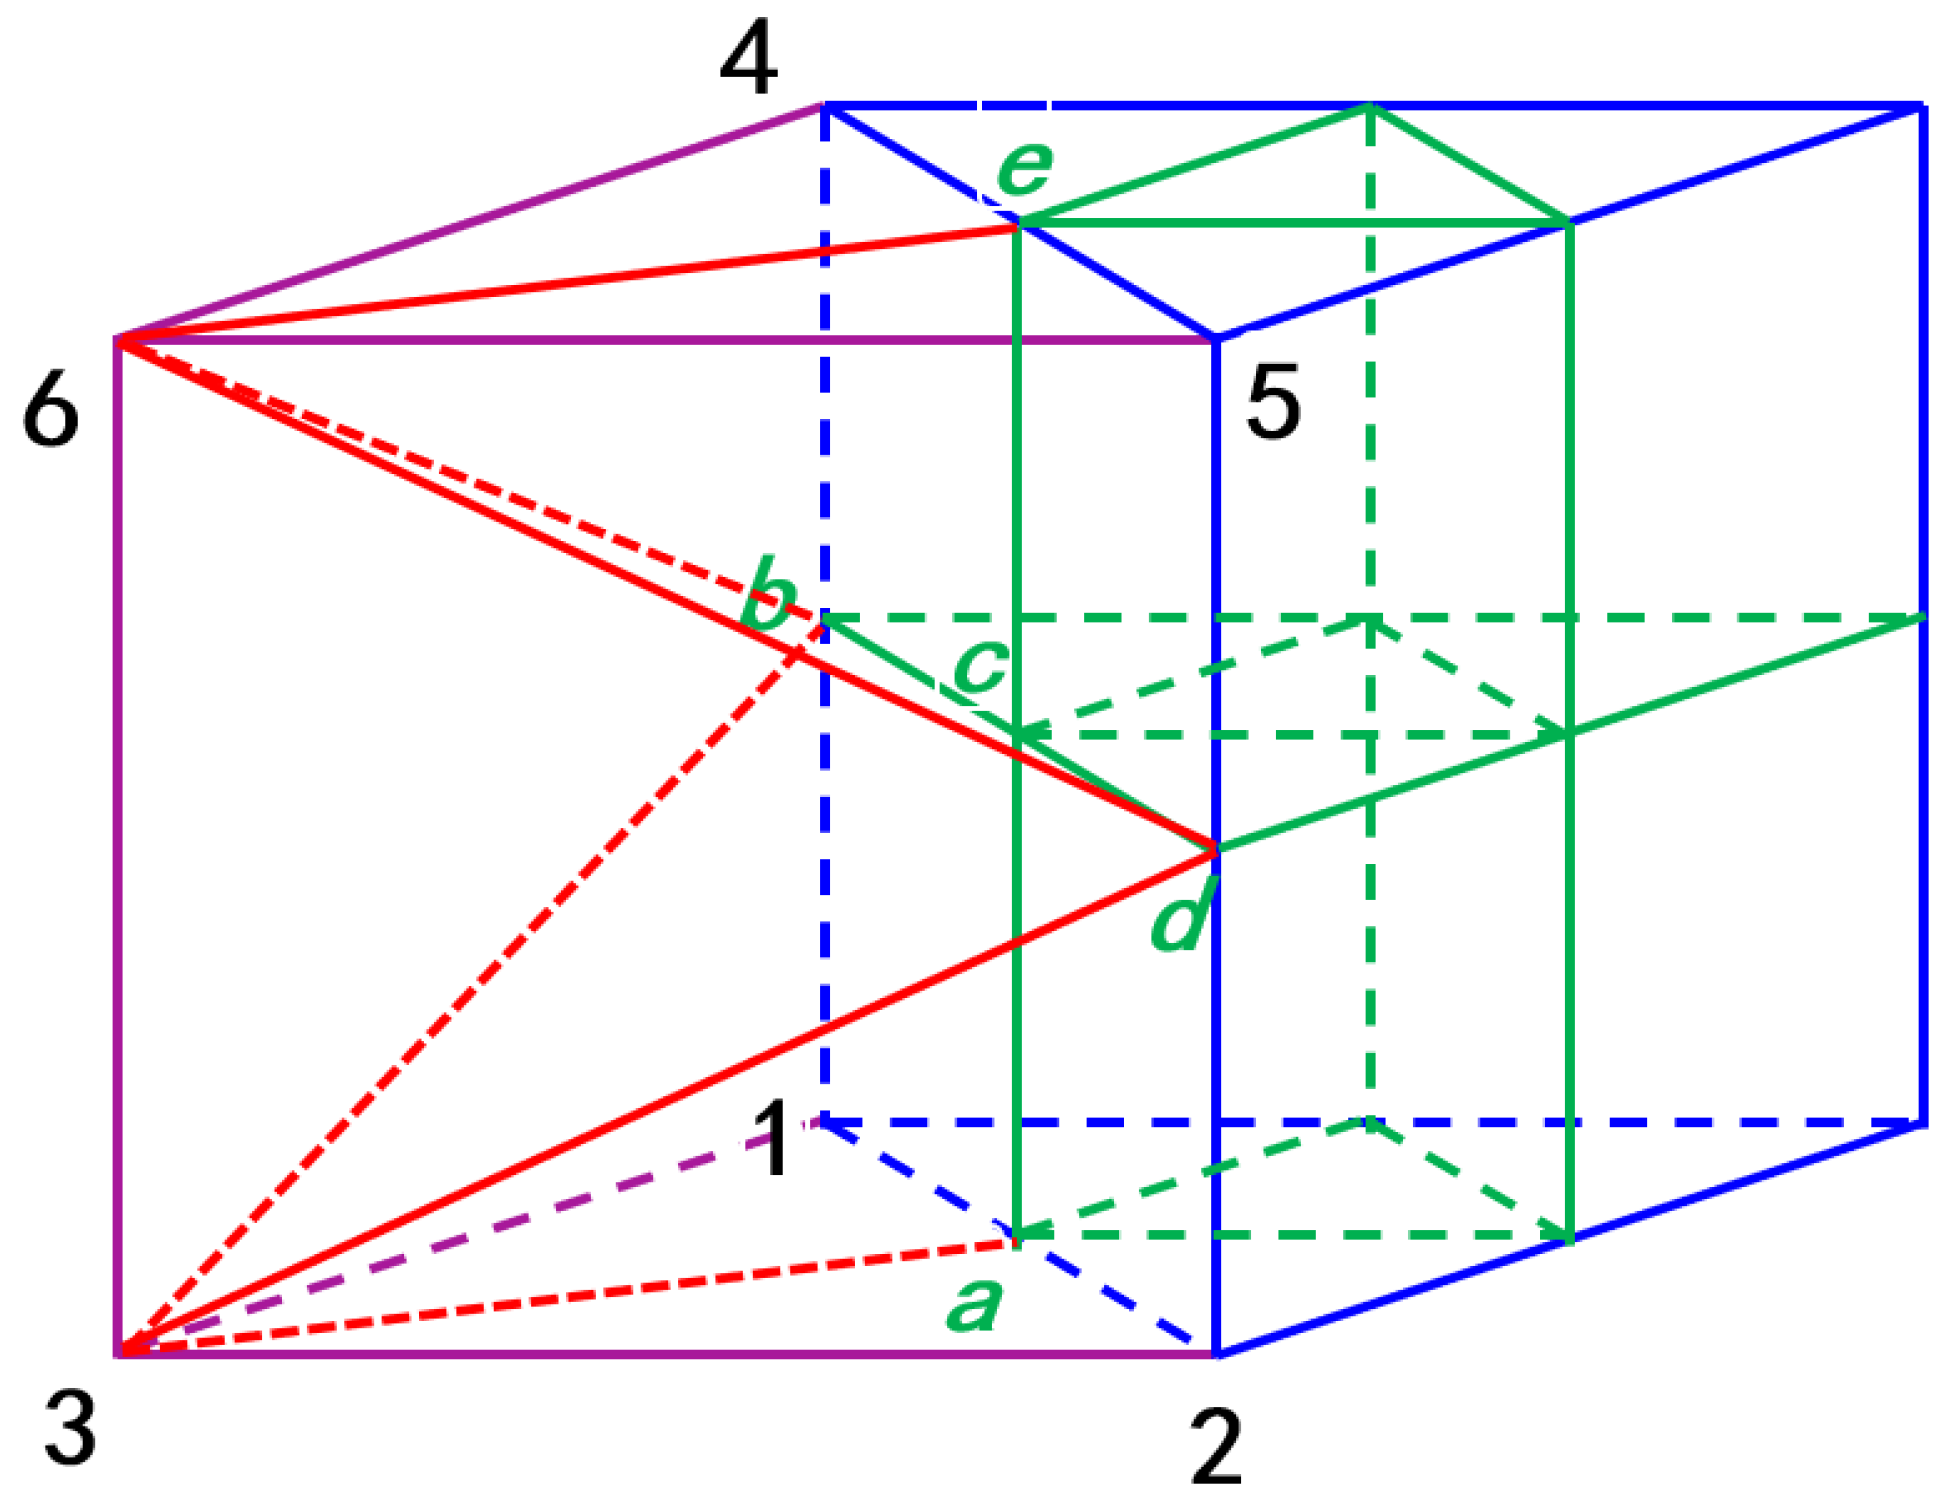
This study develops a mesh adaptation optimization method based on the NNW-FlowStar. A key advantage of NNW-FlowStar is its capability to handle not only standard grid elements (tetrahedra, triangular prisms, pyramids, hexahedra) but also non-standard elements, including arbitrary polyhedral elements. Therefore, when hanging nodes appear during the refinement of adjacent elements, the cells containing these hanging nodes can be converted into polyhedral elements. This study addresses the challenges of boundary layer mesh refinement/coarsening through a polyhedral conversion approach. The cell-centered finite volume method typically establishes connectivity through mesh faces and their adjacent cells, including the definition of mesh edges and cell neighborhood relationships. Since the flow solution requires only the biggest-level grid elements, hanging nodes can be eliminated by converting smaller-level elements adjacent to the biggest-level cells into a polyhedron after completing refinement/coarsening and geometric projection. For example, in Figure 8, when the right cell requires refinement, five hanging nodes (a, b, c, d, e) appear on the face adjacent to the left cell after splitting. We convert the left cell into a polyhedral element consisting of 8 faces (6 quadrilaterals and 2 pentagons):
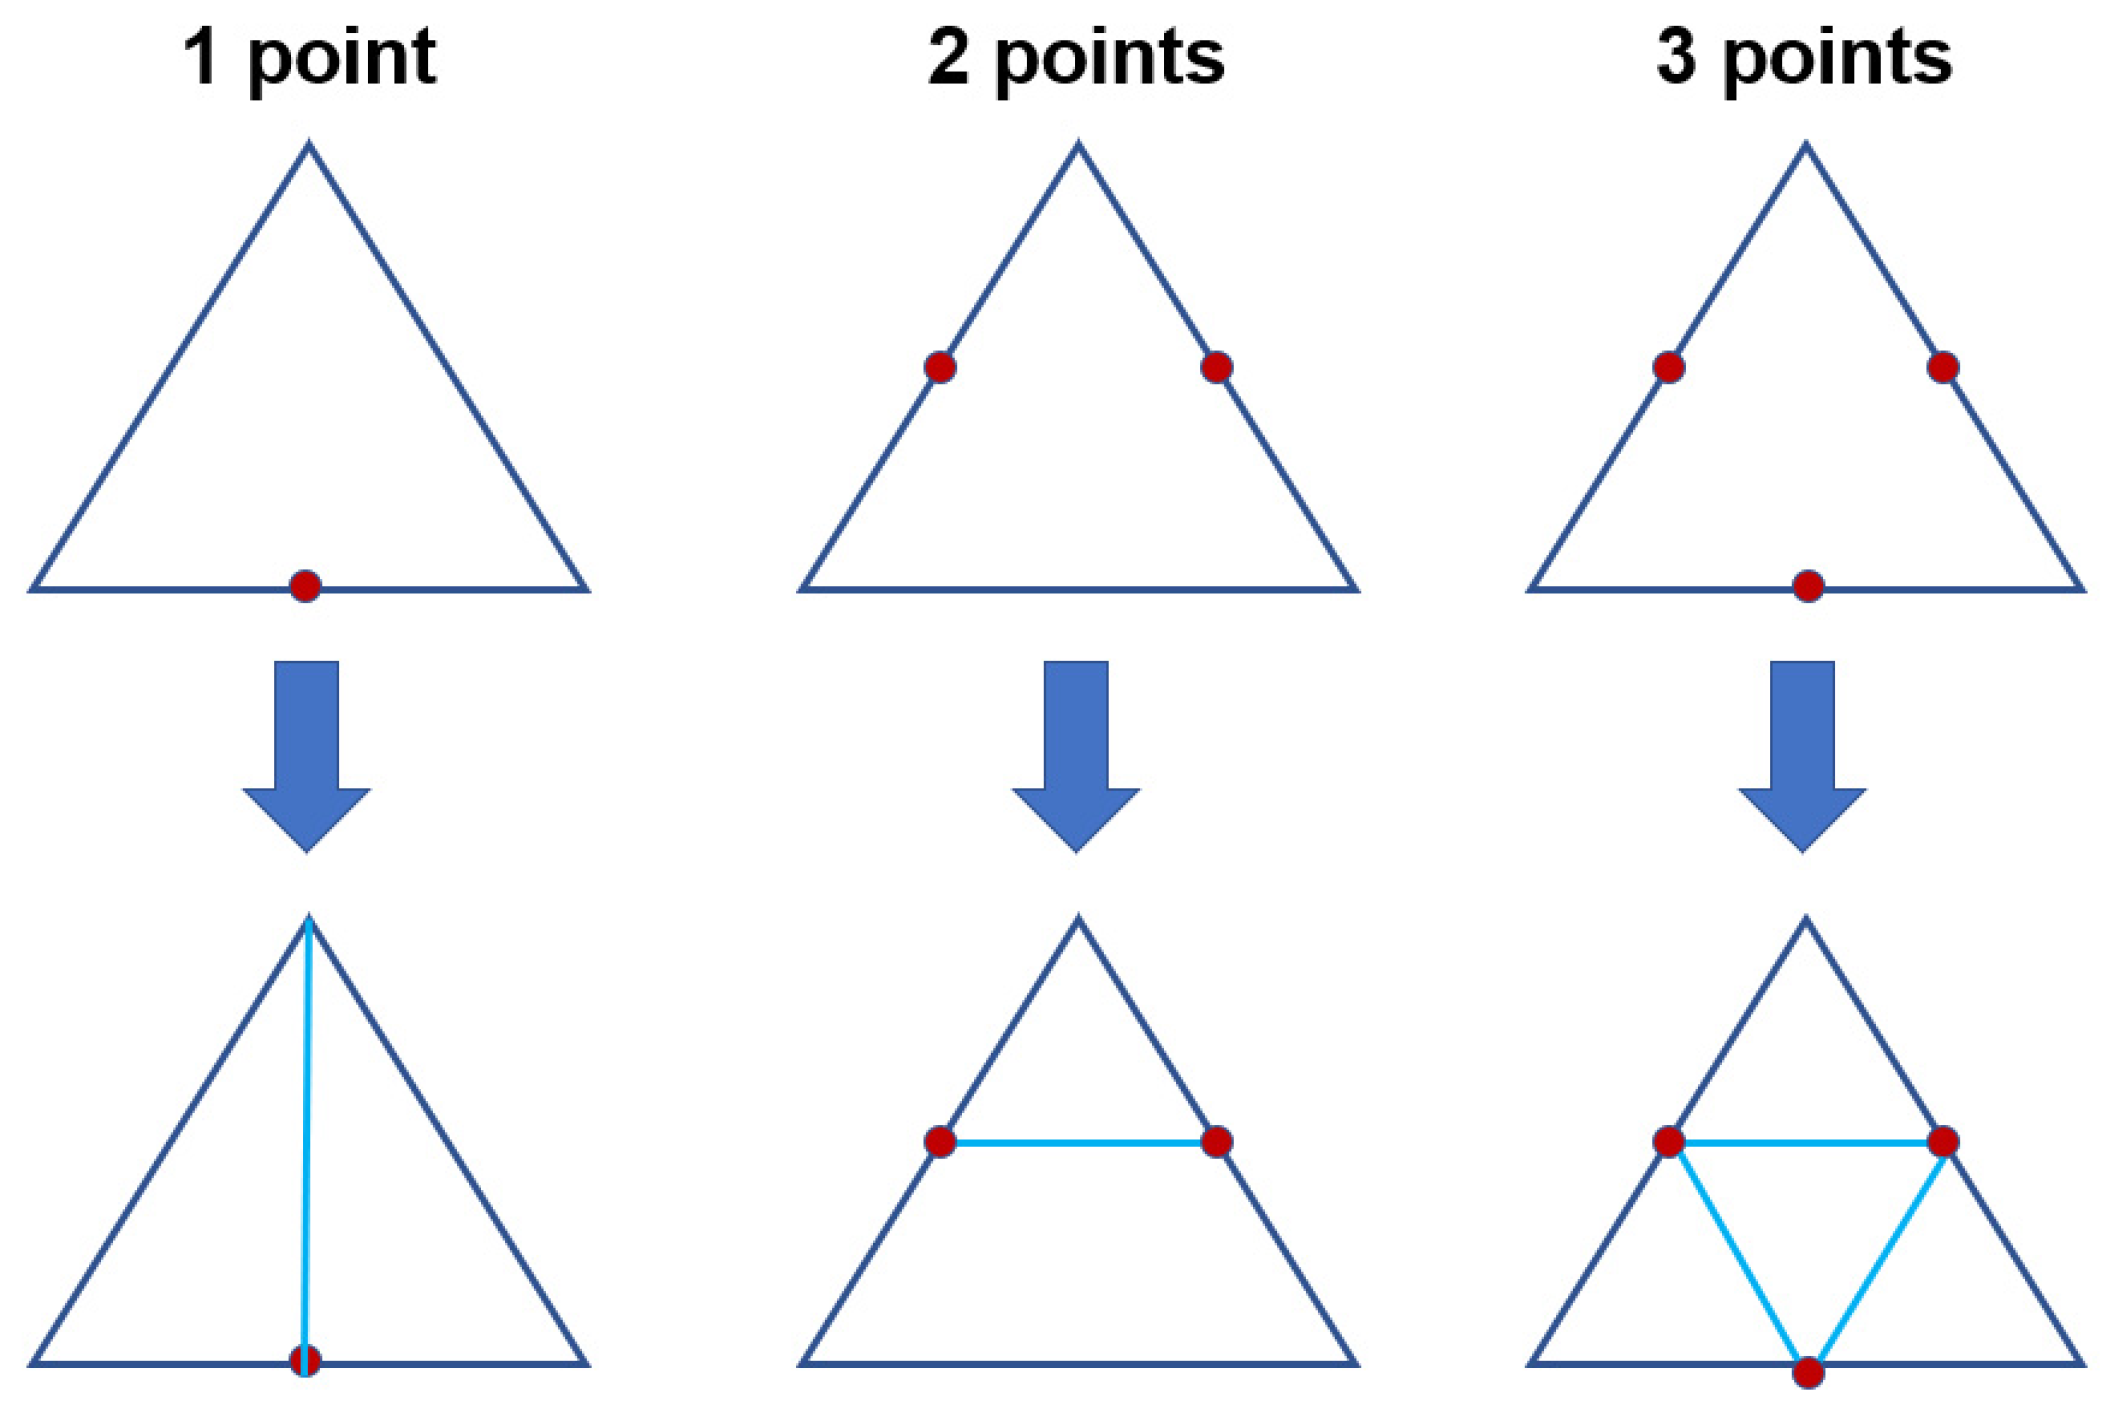
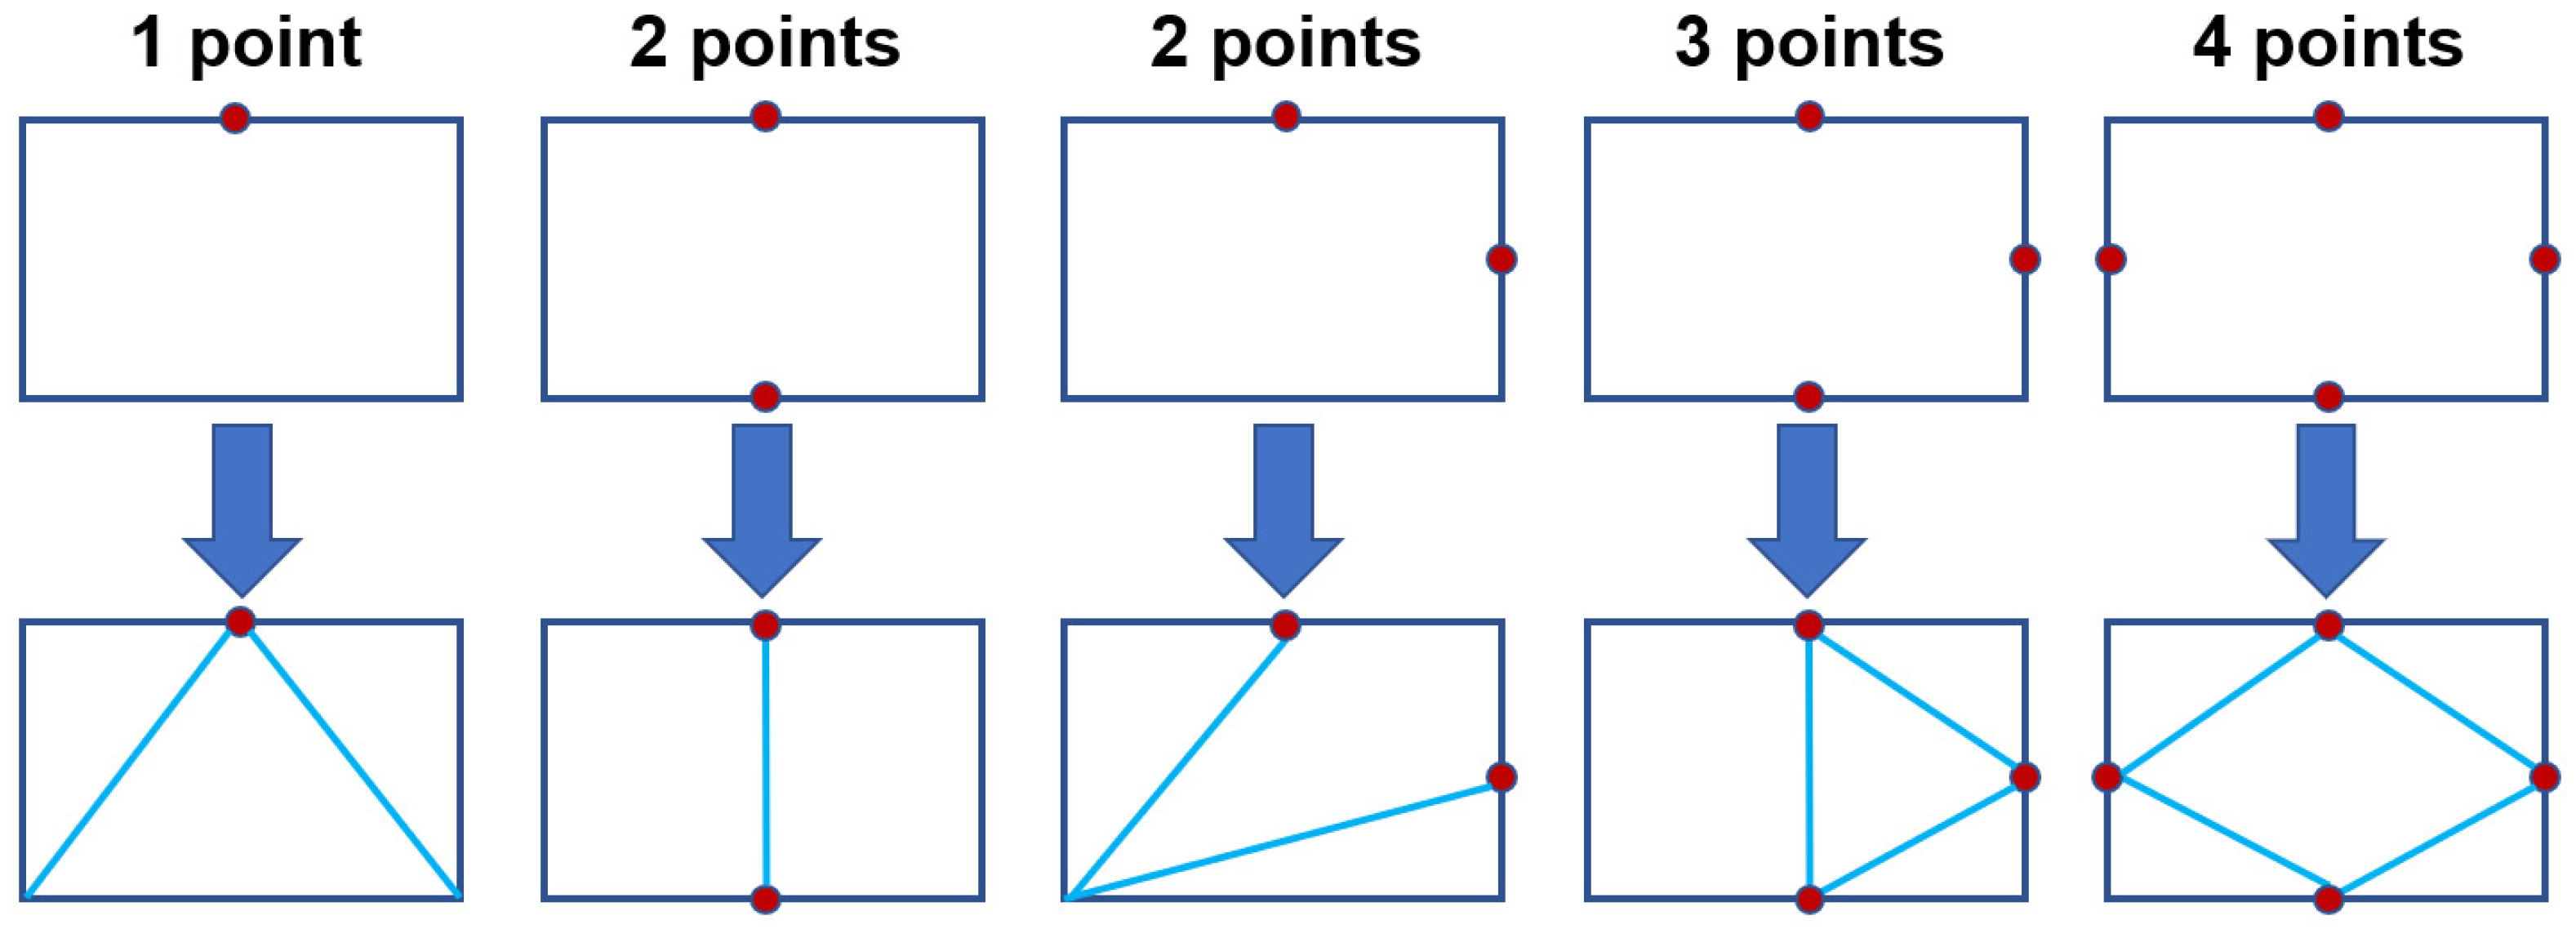
For surface mesh elements, the NNW-FlowStar software currently only supports standard triangular and quadrilateral elements. When encountering non-standard polygonal faces, they need to be further converted into standard triangular or quadrilateral elements. Generally, for triangular faces, there are three topological patterns for converting non-standard mesh faces into standard ones, as shown in Figure 9; for quadrilateral mesh faces, there are five topological patterns, as shown in Figure 10.
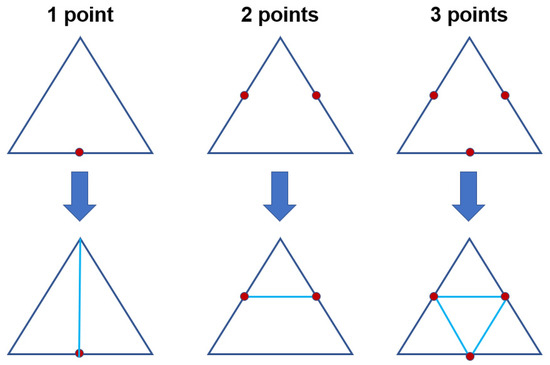
Figure 9.
Conversion cases for non-standard triangular mesh faces.
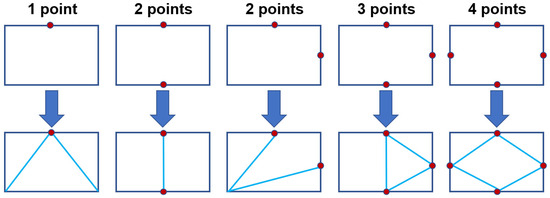
Figure 10.
Conversion cases for non-standard quadrilateral mesh faces.
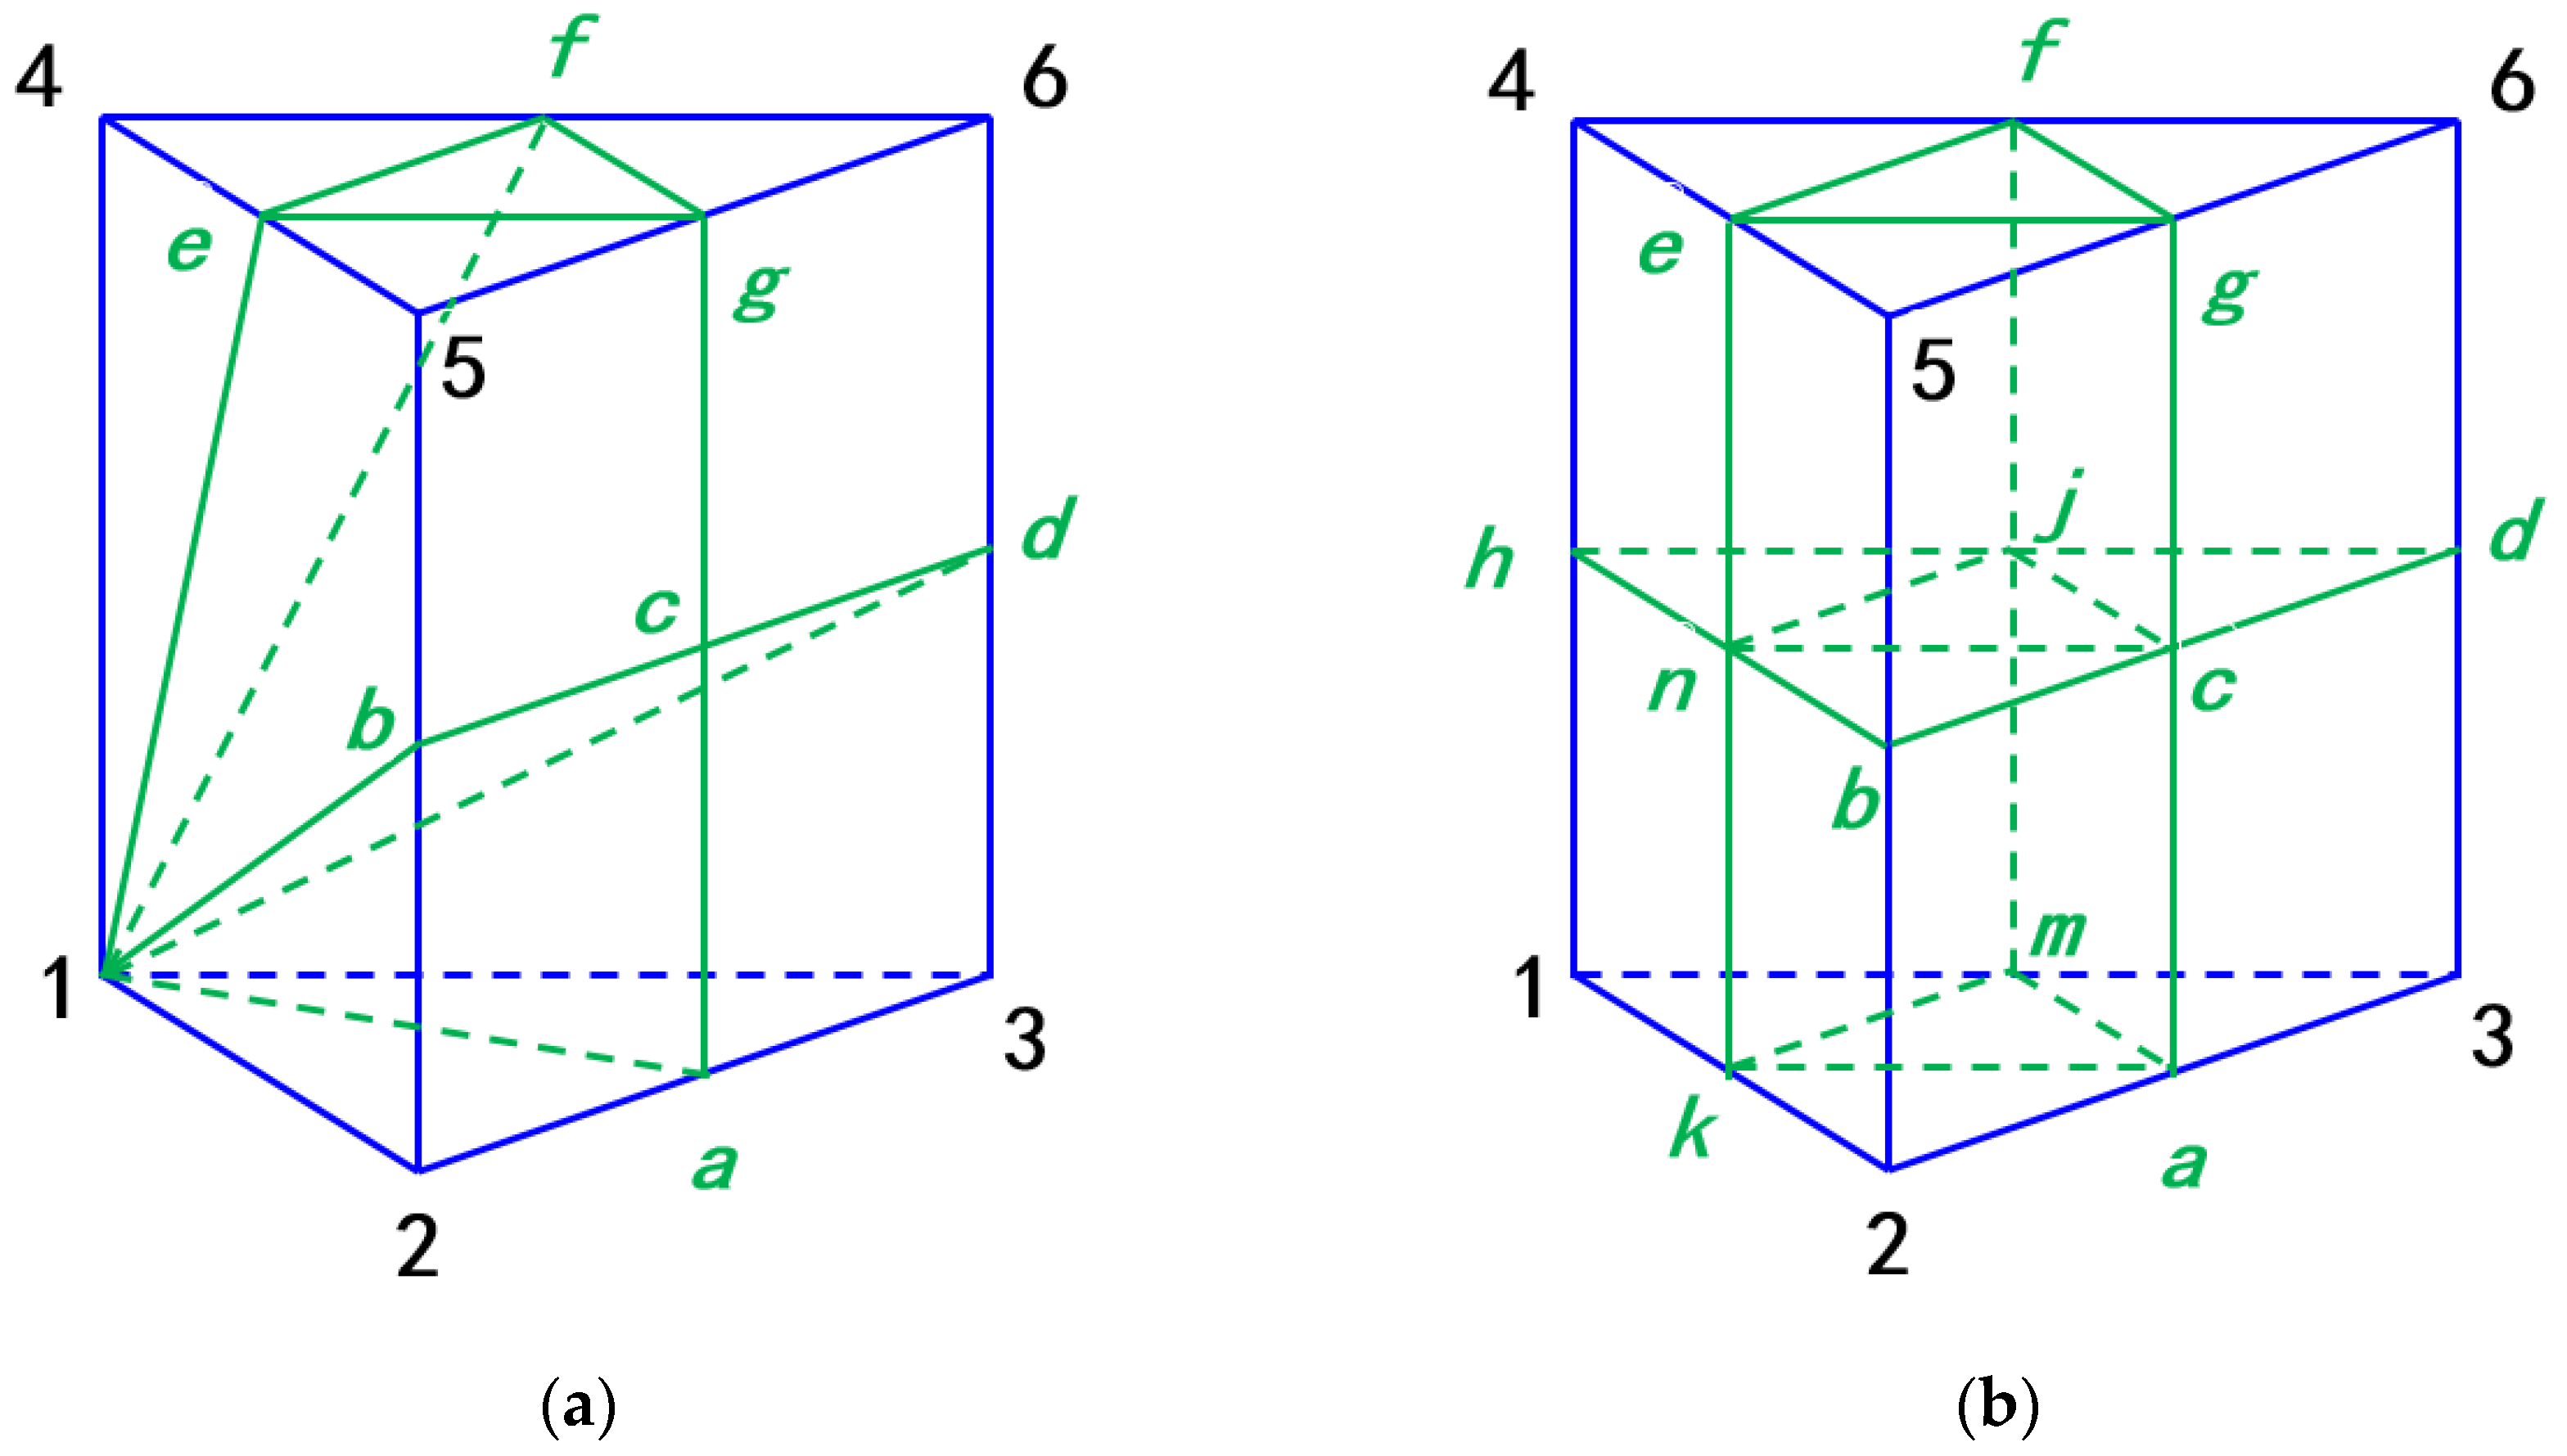
Compared to subdividing adjacent elements to eliminate hanging nodes, the standardization of two-dimensional mesh faces is much simpler. For example, the left element in Figure 8 is originally an 8-hedron, containing two pentagonal faces and two non-standard quadrilateral faces. After further conversion, it becomes a 14-hedron as shown in Figure 11, with its face elements specifically including:
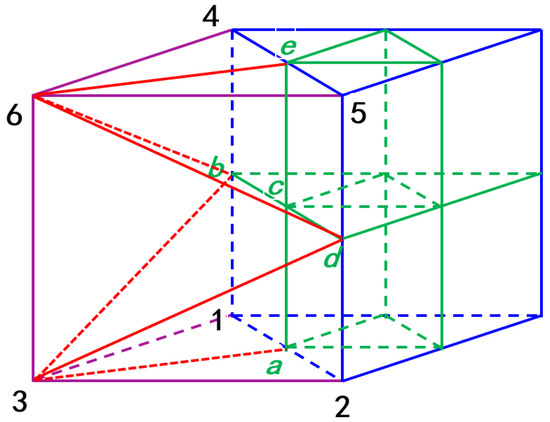
Figure 11.
Schematic of the polyhedral mesh conversion method.
It is evident that the polyhedral conversion method preserves the fundamental geometric structure of the original mesh. For example, the 14-hedron on the left in Figure 11 retains the intrinsic shape of a triangular prism, only its data structure is represented as a general polyhedron.
Although the initial development of the polyhedral conversion method aimed to address challenges in handling prismatic and hexahedral elements within the layered structure of viscous boundary layers, the approach is not limited by element type and can be applied to arbitrary mesh configurations. Therefore, this study uniformly adopts the polyhedral conversion method to manage the refinement of adjacent mesh elements.
In addition, commercial software such as Fluent is capable of generating polyhedral meshes. The main innovation of our method, however, lies not in the initial generation of a polyhedral mesh, but in the dynamic conversion of standard grid elements into arbitrary polyhedra during the adaptive iteration process to resolve hanging nodes. This strategy effectively addresses the topological constraints encountered during boundary layer mesh refinement and coarsening. It is fundamentally a dynamic adaptation technique, which differs in essence from initial mesh generation methodologies. We have clarified this distinction in the revised manuscript.
3.4. Refinement and Coarsening Methods for Polyhedral Grids in Adaptive Iteration
Such polyhedral mesh elements also face the challenge of further processing during iterative adaptation. Common mesh generation software (e.g., Pointwise, Icem, and NNW-GridStar [25,26]) typically outputs standard element types (tetrahedra, prisms, pyramids, hexahedra) in three-dimensional configurations by default. Therefore, the initial mesh adaptation step does not involve a non-standard, arbitrary polyhedron. However, after the first cycle of adaptation, polyhedral elements emerge in subsequent adaptation steps, raising the issue of how to refine or coarsen them. While there are four types of standard 3D elements (tetrahedra, prisms, pyramids, hexahedra), the non-standard polyhedral elements constructed in this study exhibit extensive variety, making it impractical to define unique splitting patterns for each type. Thus, this study continues to employ the polyhedral conversion method to transform polyhedral elements back into standard elements for processing.
For example, the polyhedron in Figure 12a has 16 faces, representing a typical non-standard polyhedron. Originally a prismatic element, it was converted into a hexadecahedron via polyhedral conversion due to the refinement of adjacent elements on its top and right faces. The fundamental geometric structure of this hexadecahedron remains consistent with its original prismatic form. To handle such a non-standard polyhedron, this study retains both their inherent standard element information and their polyhedral mesh data. When refinement or coarsening is required, the native standard element information is extracted, and the element is processed as a standard mesh element. As shown in Figure 12b, when this hexadecahedron requires refinement, it is treated as a prism and subdivided into eight geometrically similar smaller prisms.
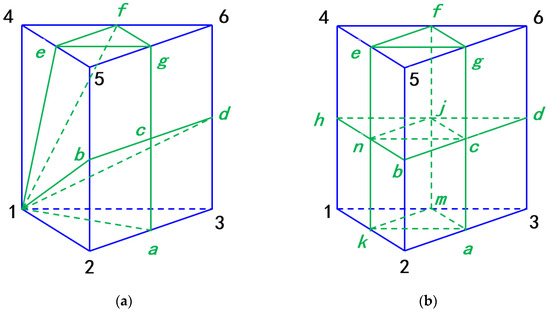
Figure 12.
Schematic of polyhedral mesh processing during adaptive iteration: (a) Polyhedral mesh element; (b) Polyhedral refinement illustration.
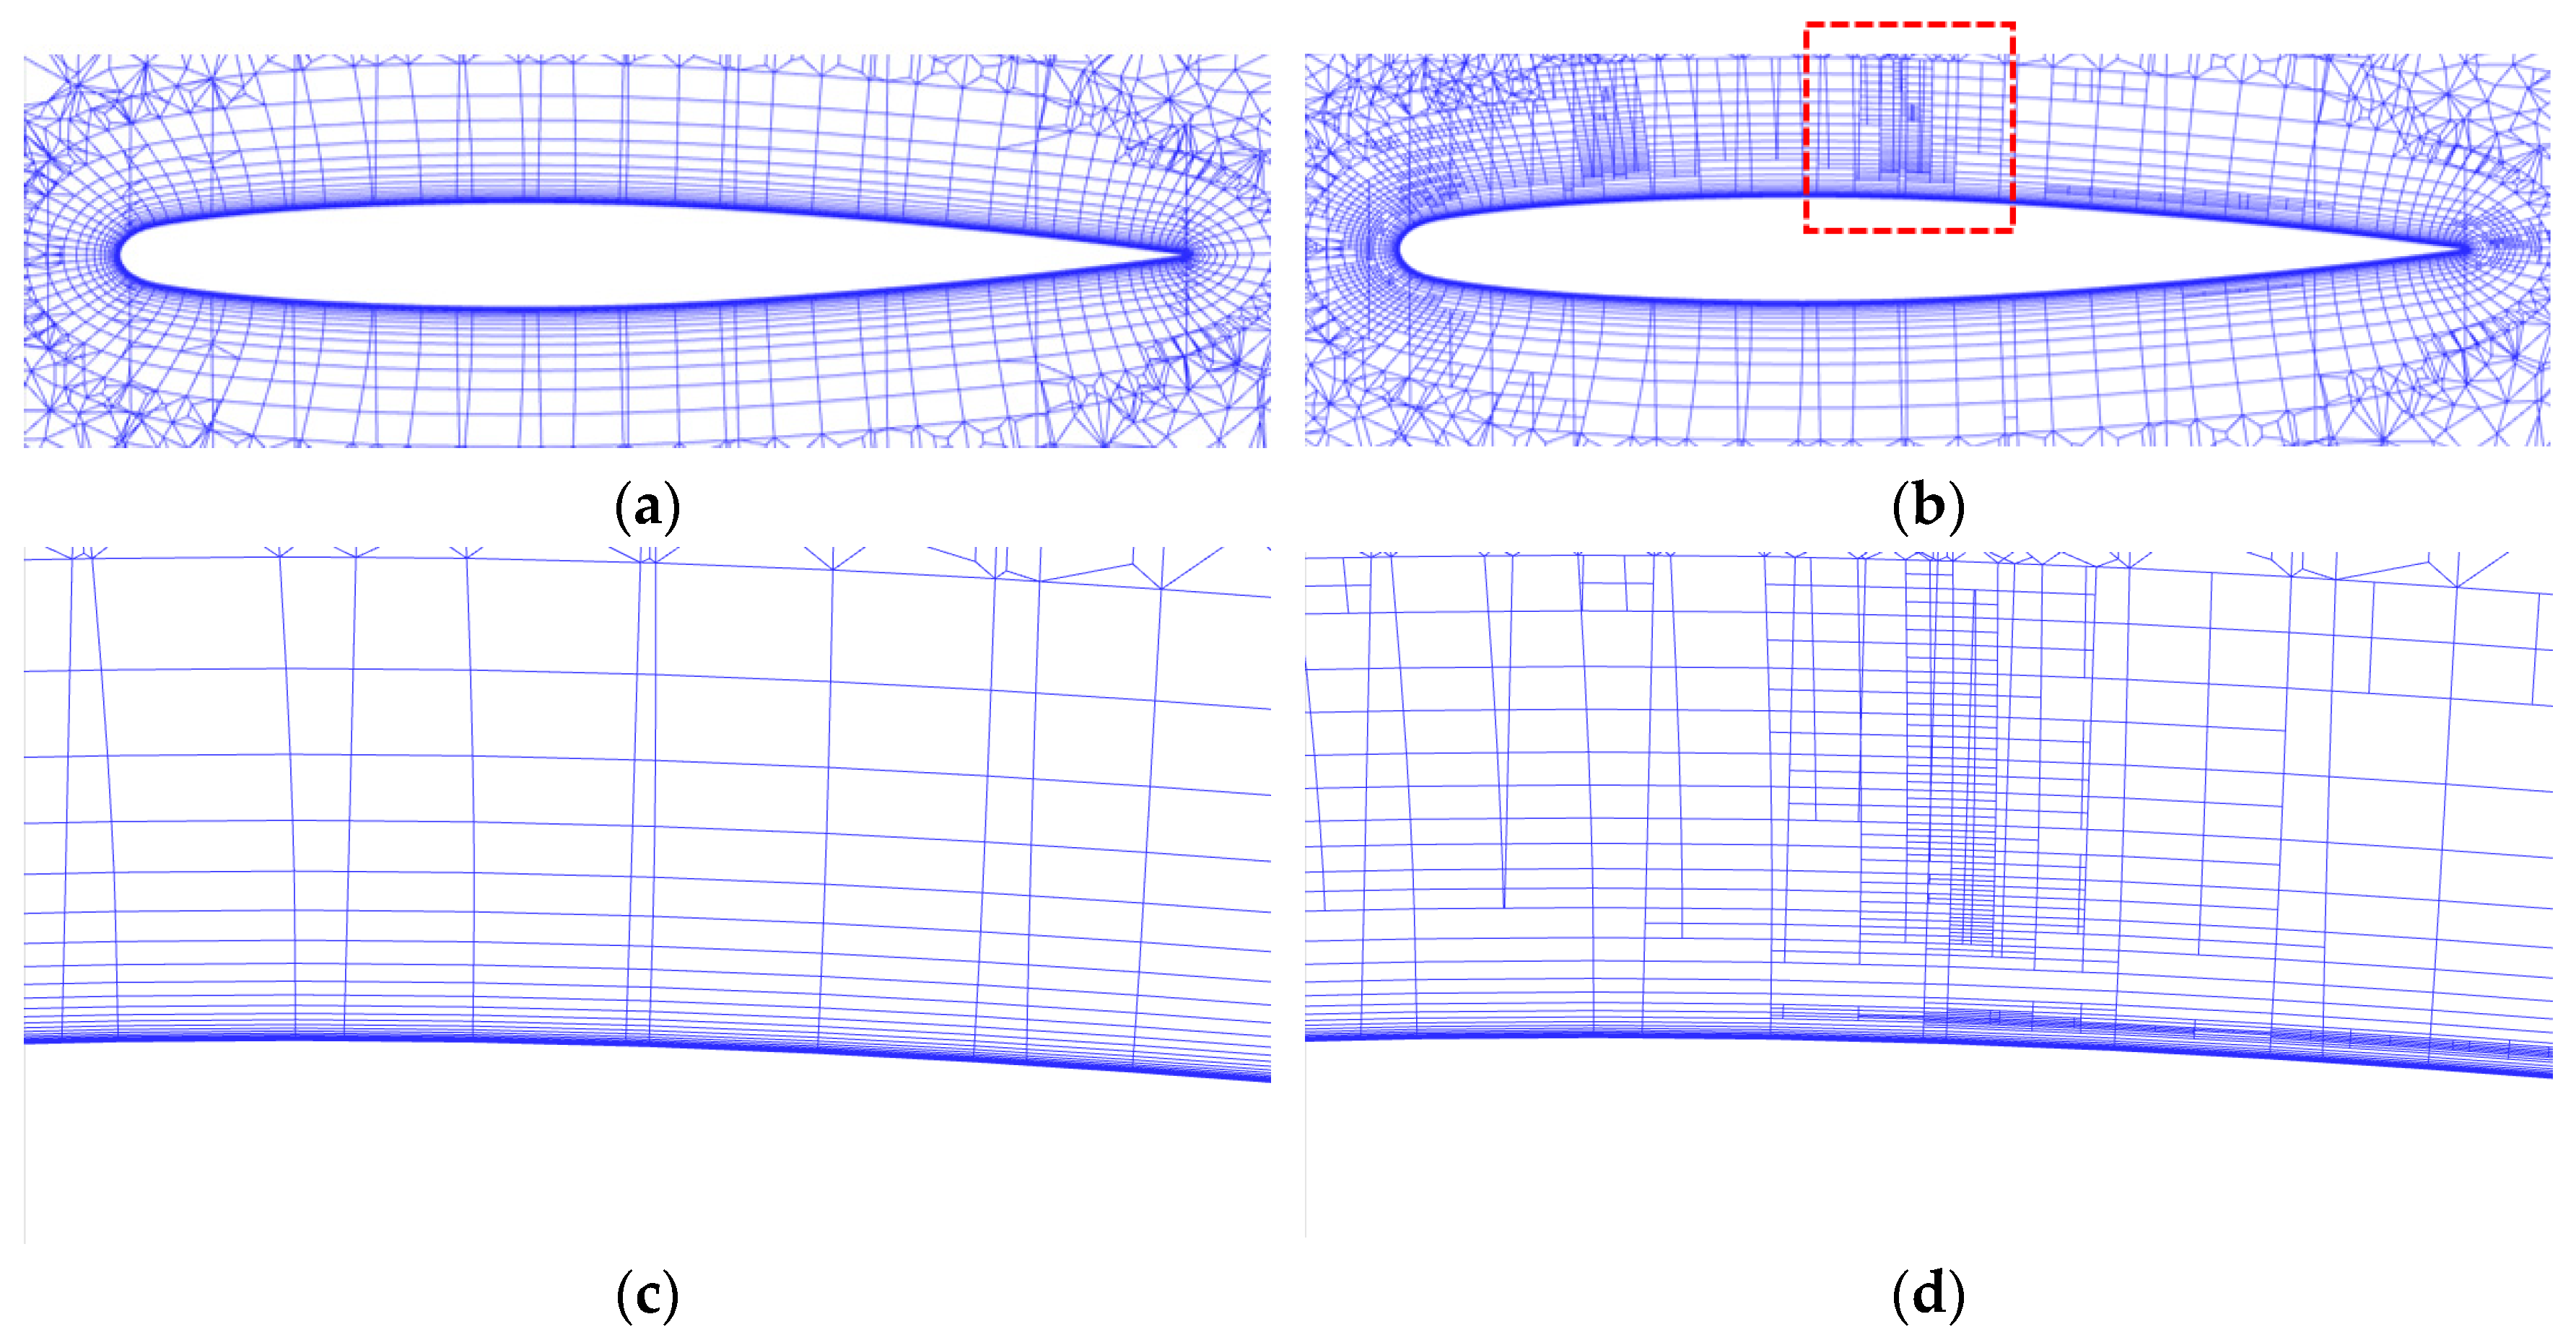
This study develops a polyhedral mesh conversion method to address the refinement of boundary layer mesh elements. The proposed mesh optimization approach is validated using a transonic flow case over the ONERA M6 wing (Figure 13).
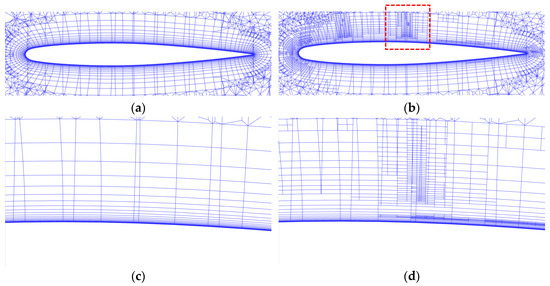
Figure 13.
Schematic of boundary layer mesh optimization for transonic flow: (a) Initial “layered” boundary layer mesh; (b) Adaptively optimized boundary layer mesh; (c) Local enlargement of original mesh; (d) Local enlargement of optimized mesh.
Figure 13a shows the boundary layer mesh distribution around the wing. To better resolve viscous flows, the mesh near the wing surface predominantly consists of prismatic/hexahedral elements with a distinct layered structure. Figure 13b presents the boundary layer mesh after adaptive optimization, demonstrating significant refinement at the wing leading edge, trailing edge, and upper-surface shock region, while the lower surface retains the original layered structure. Figure 13d provides a zoomed-in view of the shock region (red box in Figure 13b), where the polyhedral conversion method is clearly illustrated: cells near the shock are aggressively refined, and adjacent elements are converted into a polyhedron to maintain connectivity, whereas regions away from the shock preserve the initial layered topology. Tests confirm that the polyhedral conversion method successfully handles layered boundary layer elements, eliminating inter-element dependencies and directional constraints in optimization, thereby resolving long-standing challenges in viscous boundary layer mesh processing.
3.5. Surface Mesh Projection and Spatial Compatibility Method
After surface mesh refinement, newly introduced grid points often deviate from the physical surface, particularly in high-curvature regions. Projecting these points onto the surface is essential to maintain mesh-geometry compatibility. While surface information can be derived from CAD models, most flow solvers lack integrated CAD processing capabilities. Surface fitting methods, which reconstruct the surface directly from existing mesh data, offer a practical alternative. This work adopts the Coons surface fitting technique, utilizing grid points and their normal vectors to construct boundary curves along mesh edges. These curves are then blended to generate the spatial surface.
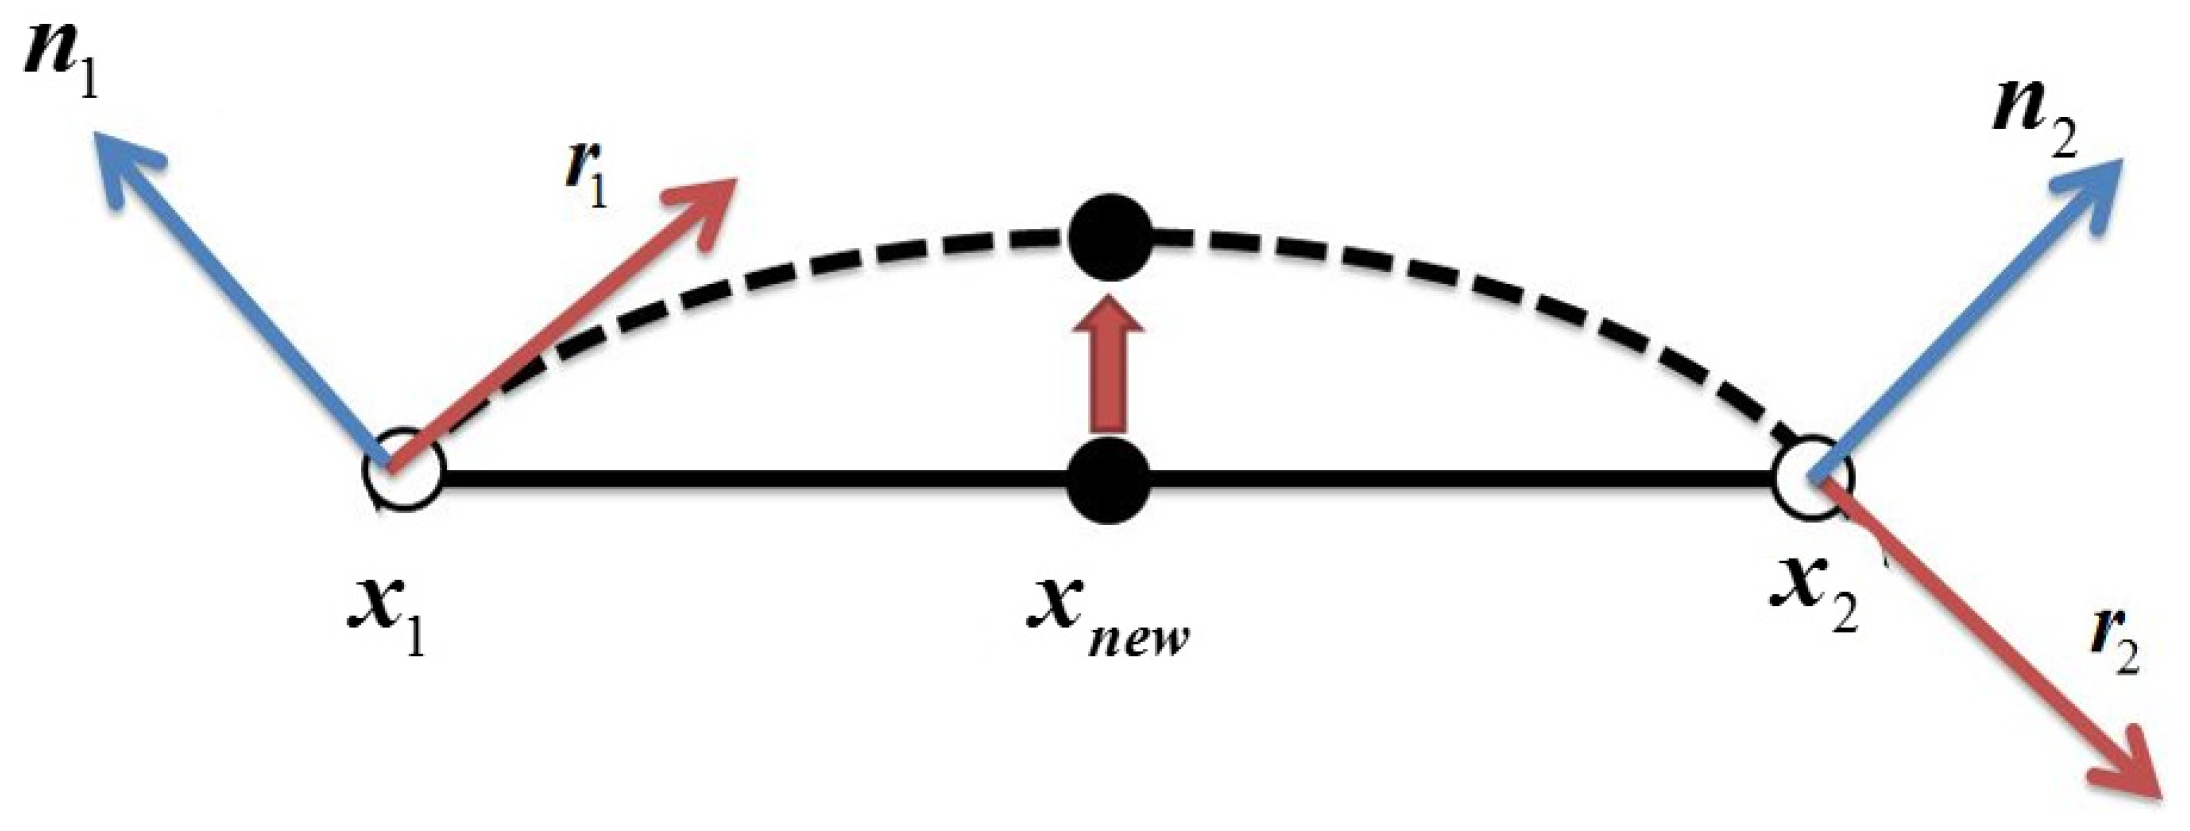
As shown in Figure 14, let x1 and x2 be the nodal coordinates of the mesh edge, and n1 and n2 be the corresponding unit normal vectors. Hermite interpolation is used to define the curve:
where c(t) represents the parametric curve, τ1 and τ2 are nodal tangential correction terms, and f, g are weighting functions. For surface reconstruction, mesh face data is first mapped to a parametric domain before being fitted into a spatial surface.
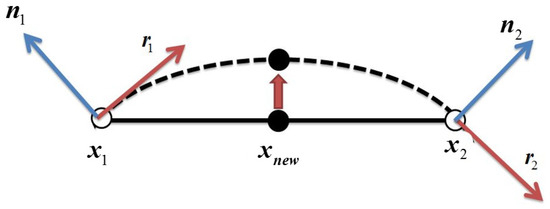
Figure 14.
Schematic of the boundary curve fitting method.
Mesh deformation methods offer the advantage of preserving both the number of grid points and the topological relationships between elements. Among these, distance function-based mesh deformation techniques are computationally efficient. Tang et al. enhanced this approach by introducing a variable influence radius concept and a region-decomposition bounding box acceleration method. This study employs the improved distance function-based mesh deformation method to ensure compatibility of volume mesh elements near the wall surface. The method incorporates a self-adjusting influence radius, which enhances the deformation capability of layered structural elements (e.g., prisms and hexahedra) within the boundary layer. Given the displacement during the projection of the wall surface grid points, the corresponding coordinate displacement of a volume element point is expressed as:
where N is the total number of grid points, Ns is the total number of wall surface grid points, wi is the weight of the i-th wall surface grid point, and η is a decay function.
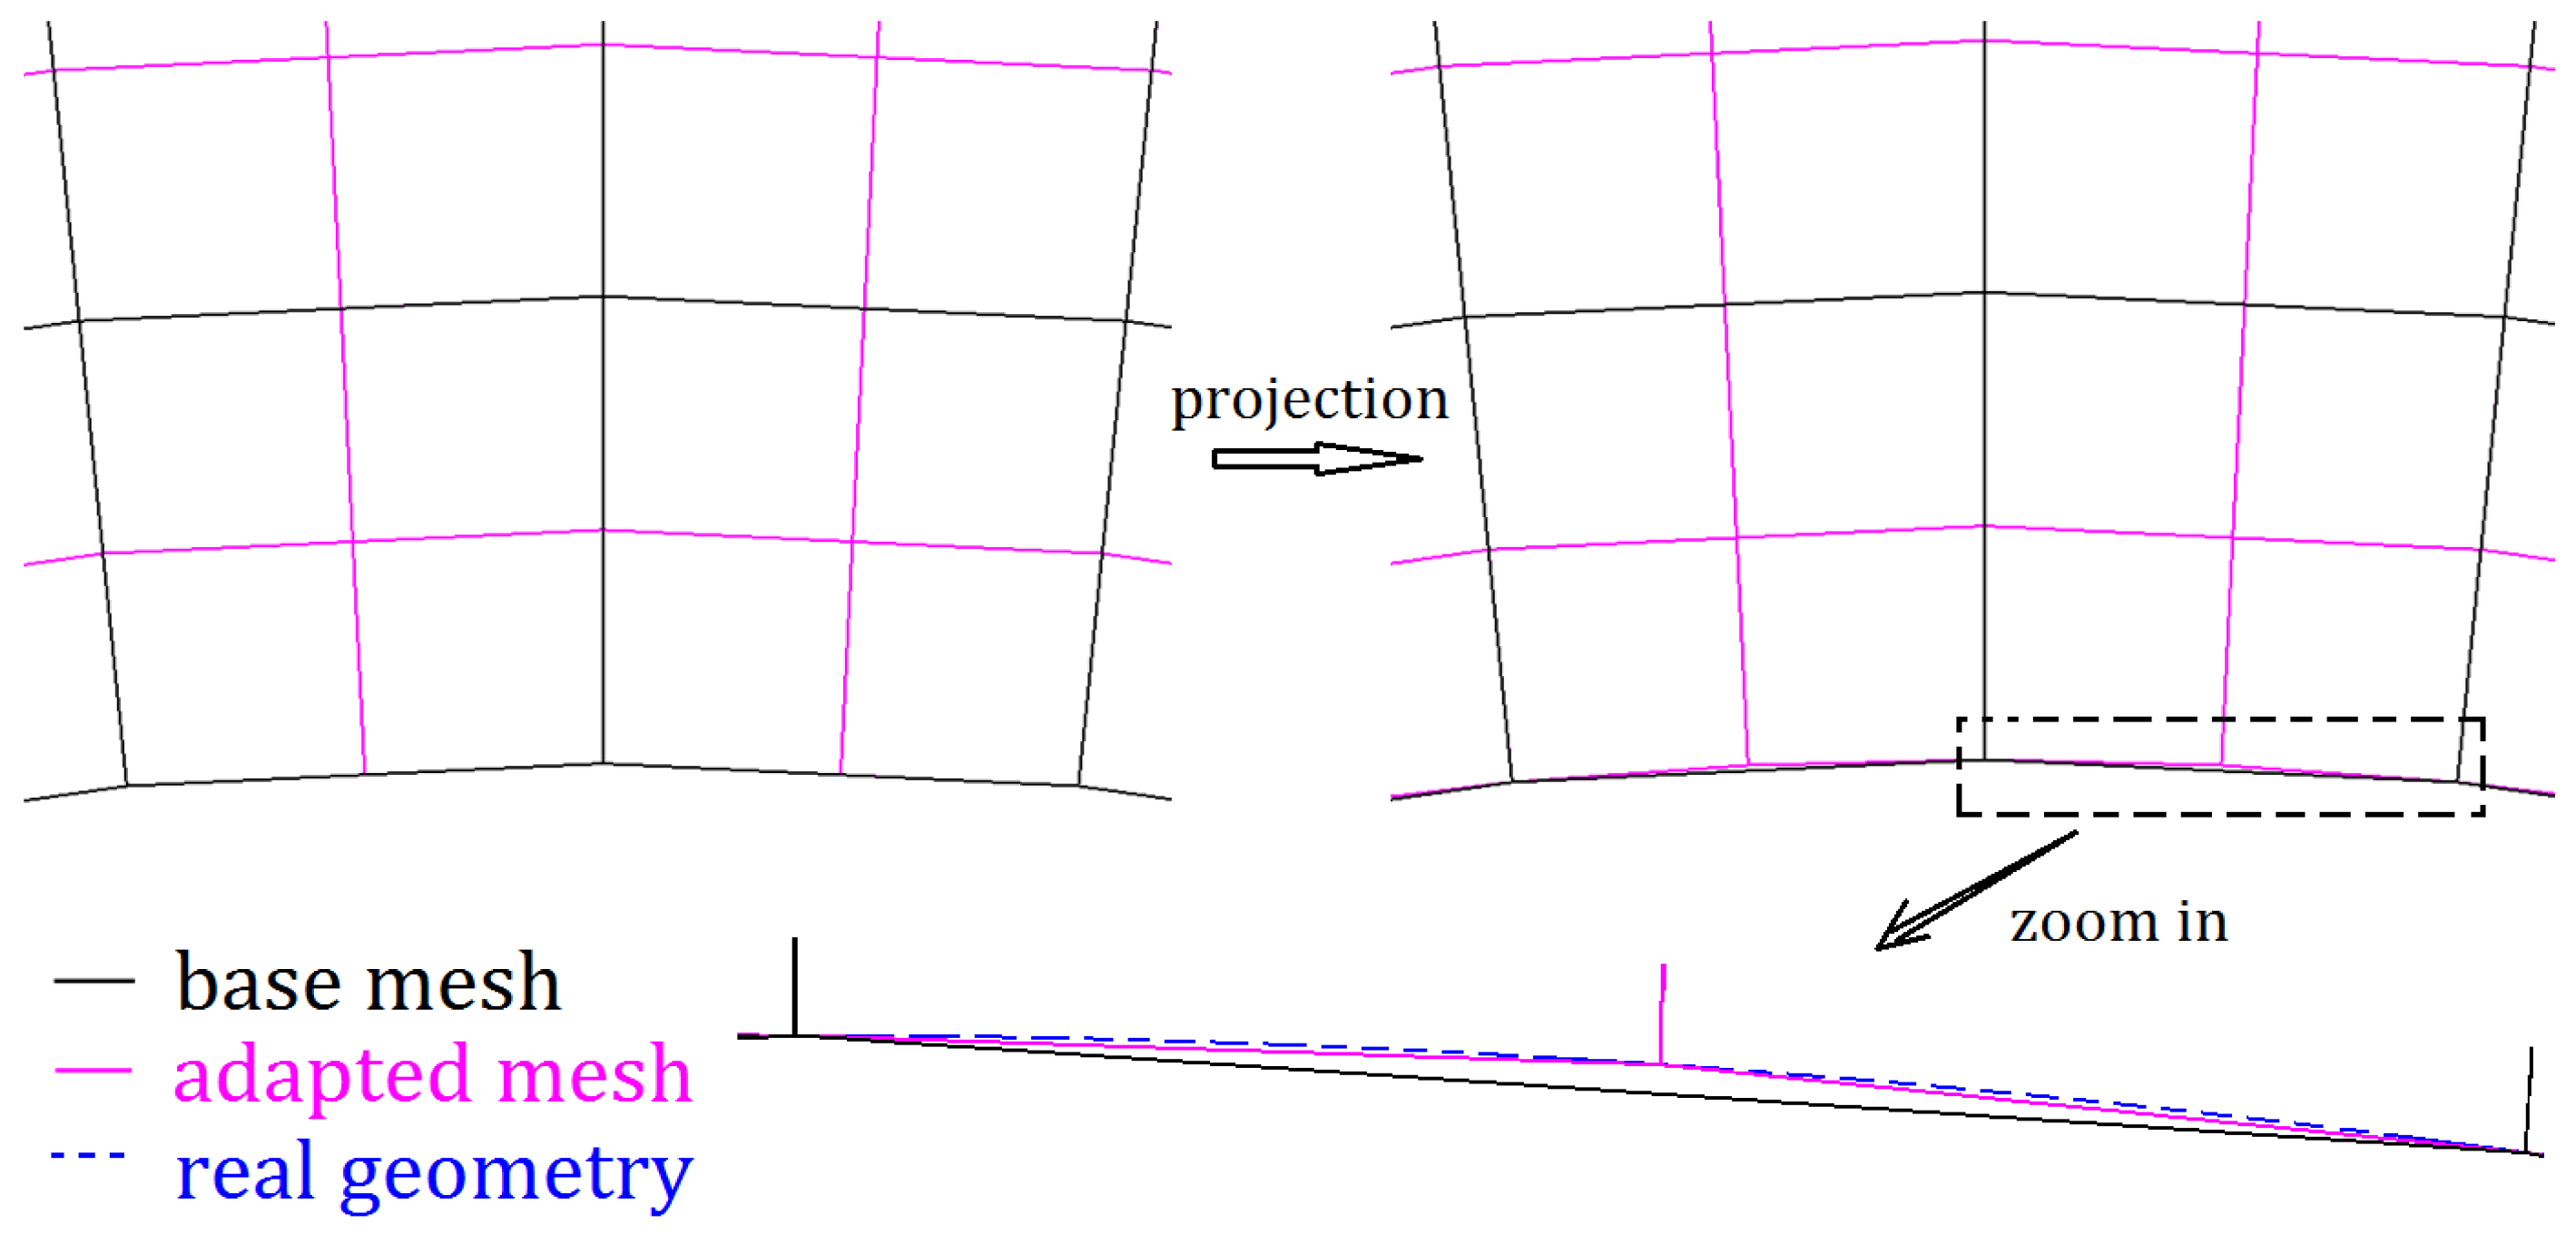
The surface mesh projection method is tested using a supersonic flow over a cylinder at Mach number 2.0. The cylindrical surface exhibits high curvature, causing newly added mesh points to initially deviate from the actual geometry. Figure 15 compares the projection of newly added surface points before and after adaptation. Initially, these points deviate from the cylindrical surface but are accurately projected onto the exact geometry after processing. The results confirm that the surface-fitting-based projection method effectively ensures precise projection of newly generated surface points onto curved geometries.
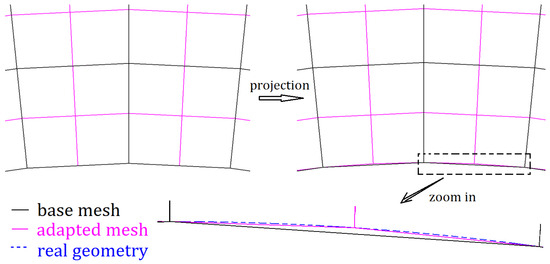
Figure 15.
Schematic of the boundary curve fitting method.
In general, for complex geometric configurations, the primary computational overhead in mesh processing lies in surface projection and spatial mesh deformation. For the projection of newly inserted grid points, this study employs Coons surface fitting based on the existing mesh to avoid direct calls to the CAD model, resulting in negligible time consumption. Regarding mesh deformation, our current method demonstrates high efficiency. For instance, in the case of a wing configuration with 1,546,458 volume cells and 55,613 surface cells, the deformation process requires approximately 6.85 s using 32 CPU cores and 3.99 s using 64 CPU cores. This cost is substantially lower than that of the flow field calculation, demonstrating the high efficiency and scalability of our approach.
4. Numerical Experiments
4.1. Low-Speed High-Angle-of-Attack Simulation of NACA0012 Airfoil
4.1.1. Model and Mesh Configuration
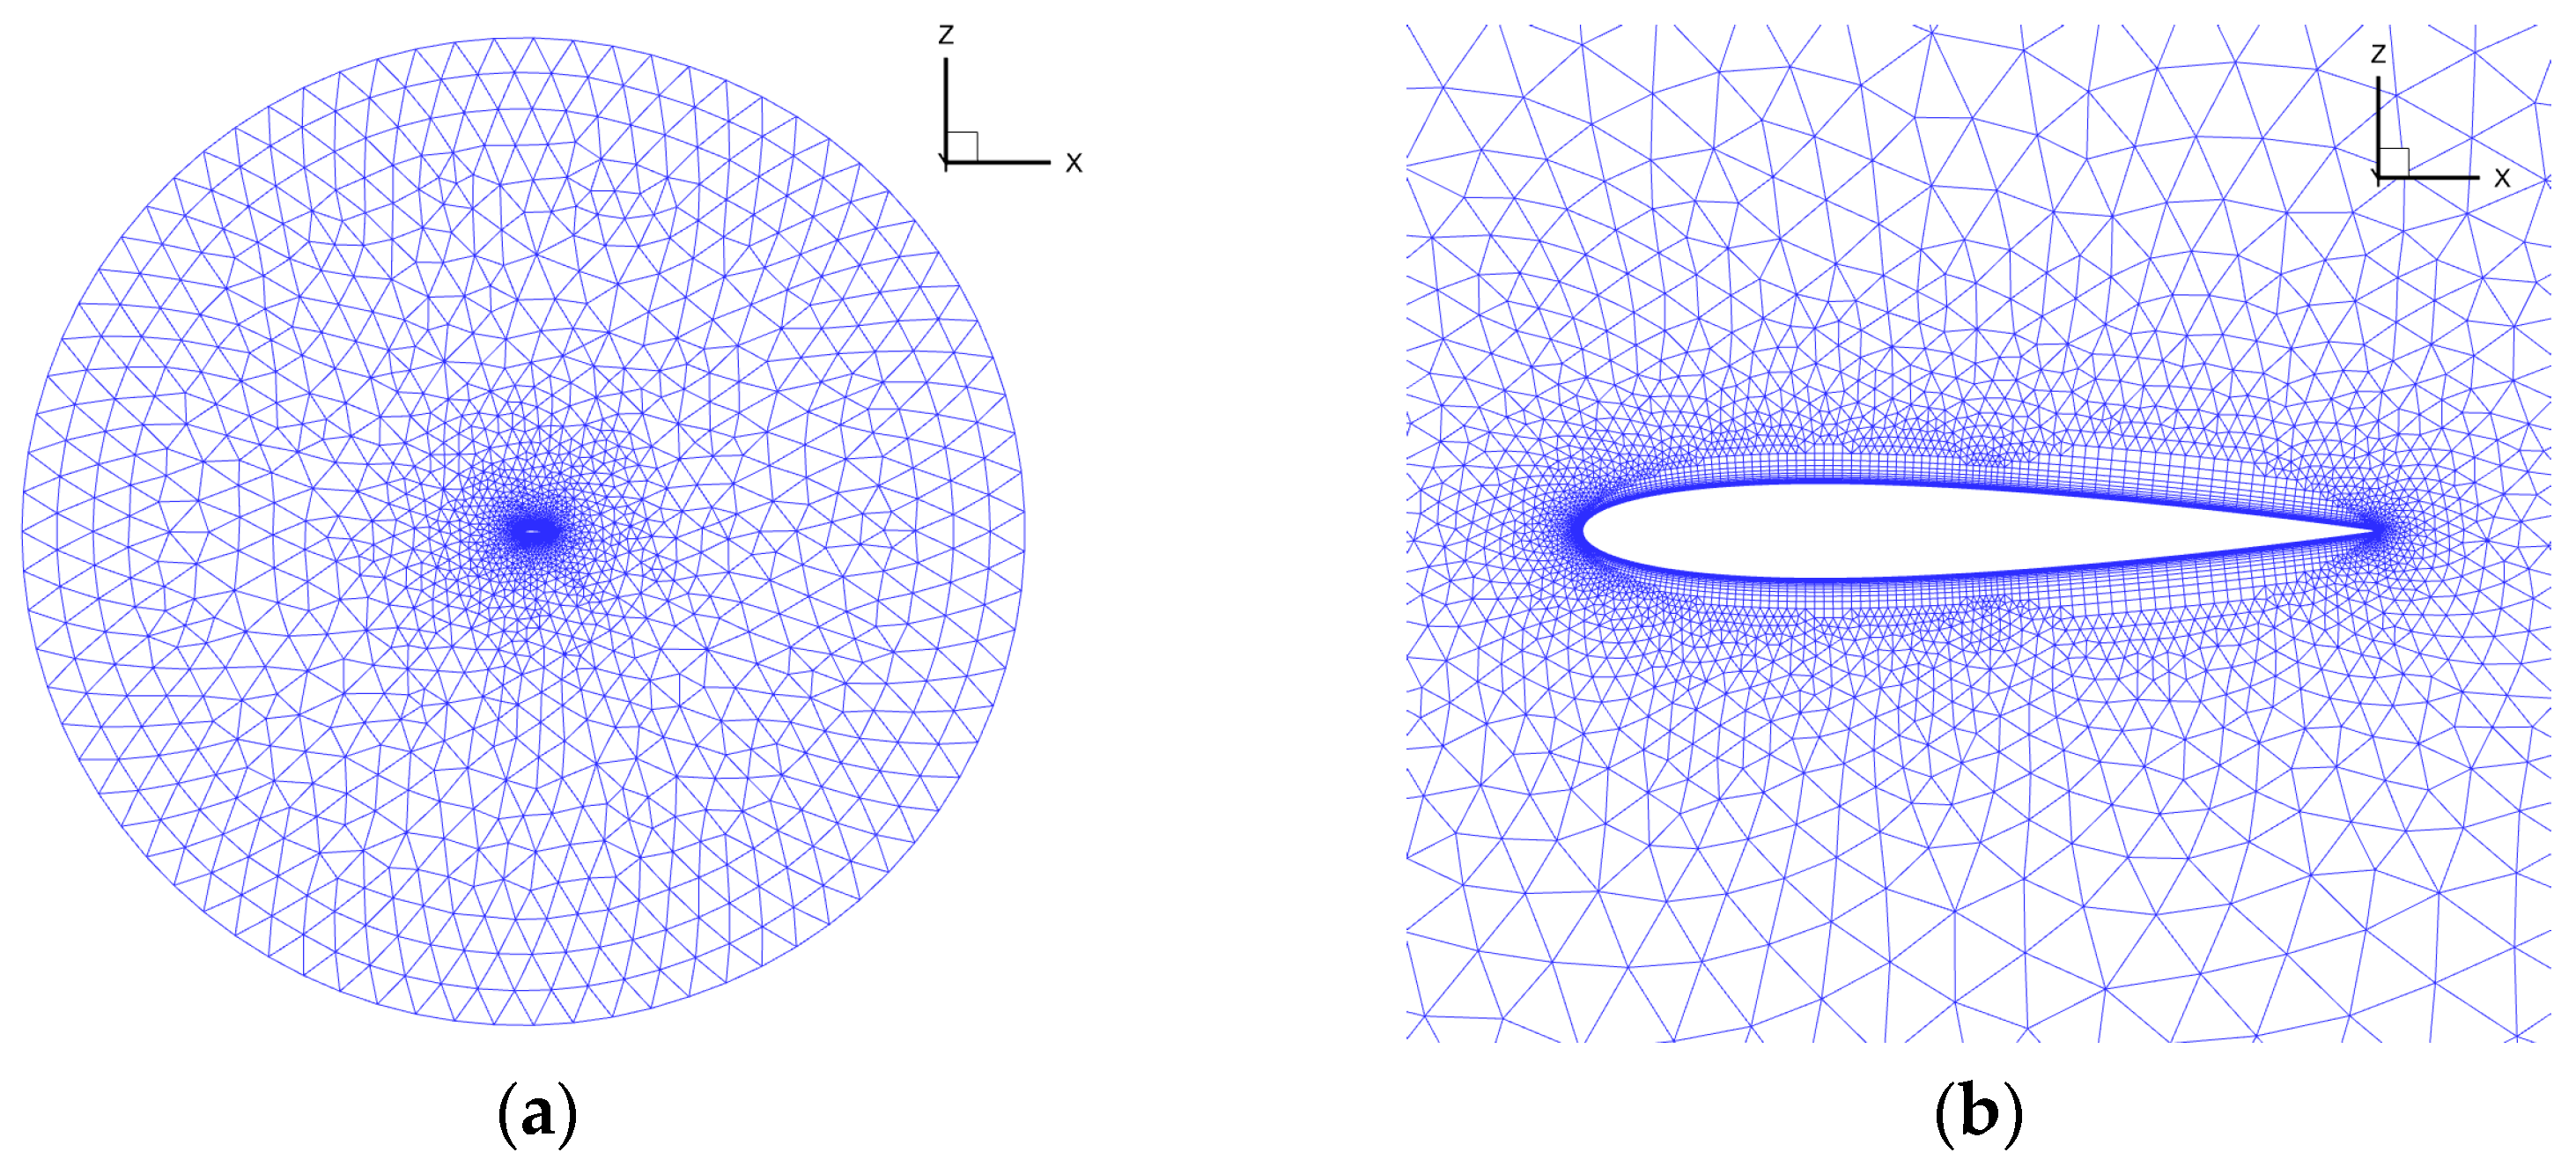
The NACA0012 airfoil, a classical symmetric profile with its maximum thickness of 12% chord located at the 30% chord position, has long been established as a standard model for validating CFD methodologies and wind tunnel techniques. Abundant experimental data are available for this airfoil [27]. This study conducts numerical simulations at low-speed, high-angle-of-attack conditions. Key computational parameters are summarized in Table 1, utilizing second-order spatial discretization, Spalart–Allmaras (SA) turbulence model and the Harten-Lax-van-Leer-Einfeldt plus plus (HLLE++) numerical scheme [28], with a primary focus on high-angle-of-attack aerodynamic characteristics. The initial mesh is an unstructured hybrid grid, as shown in Figure 16, employing quadrilateral elements near the wall and triangular elements in the far-field regions. The total mesh size is 16,913 elements, comprising 8682 quadrilaterals and 8231 triangles. The computational domain extends approximately 50 chord lengths from the airfoil surface. The airfoil circumference is discretized with 290 points, and the spanwise direction contains 2 points. The first layer grid height is set to 0.002 mm (y+ ≈ 0.45), with a boundary layer grid growth ratio of 1.3.

Table 1.
Computational Parameters for NACA0012 Airfoil.
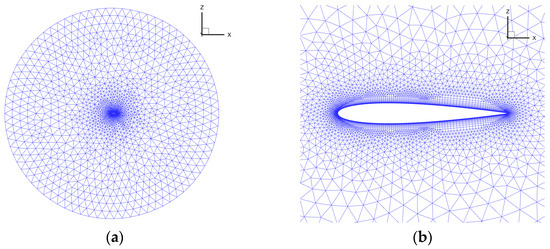
Figure 16.
Initial mesh for NACA0012 airfoil: (a) Computational domain of NACA0012 mesh; (b) Hybrid mesh near the airfoil surface.
4.1.2. Results from Initial Mesh Computation
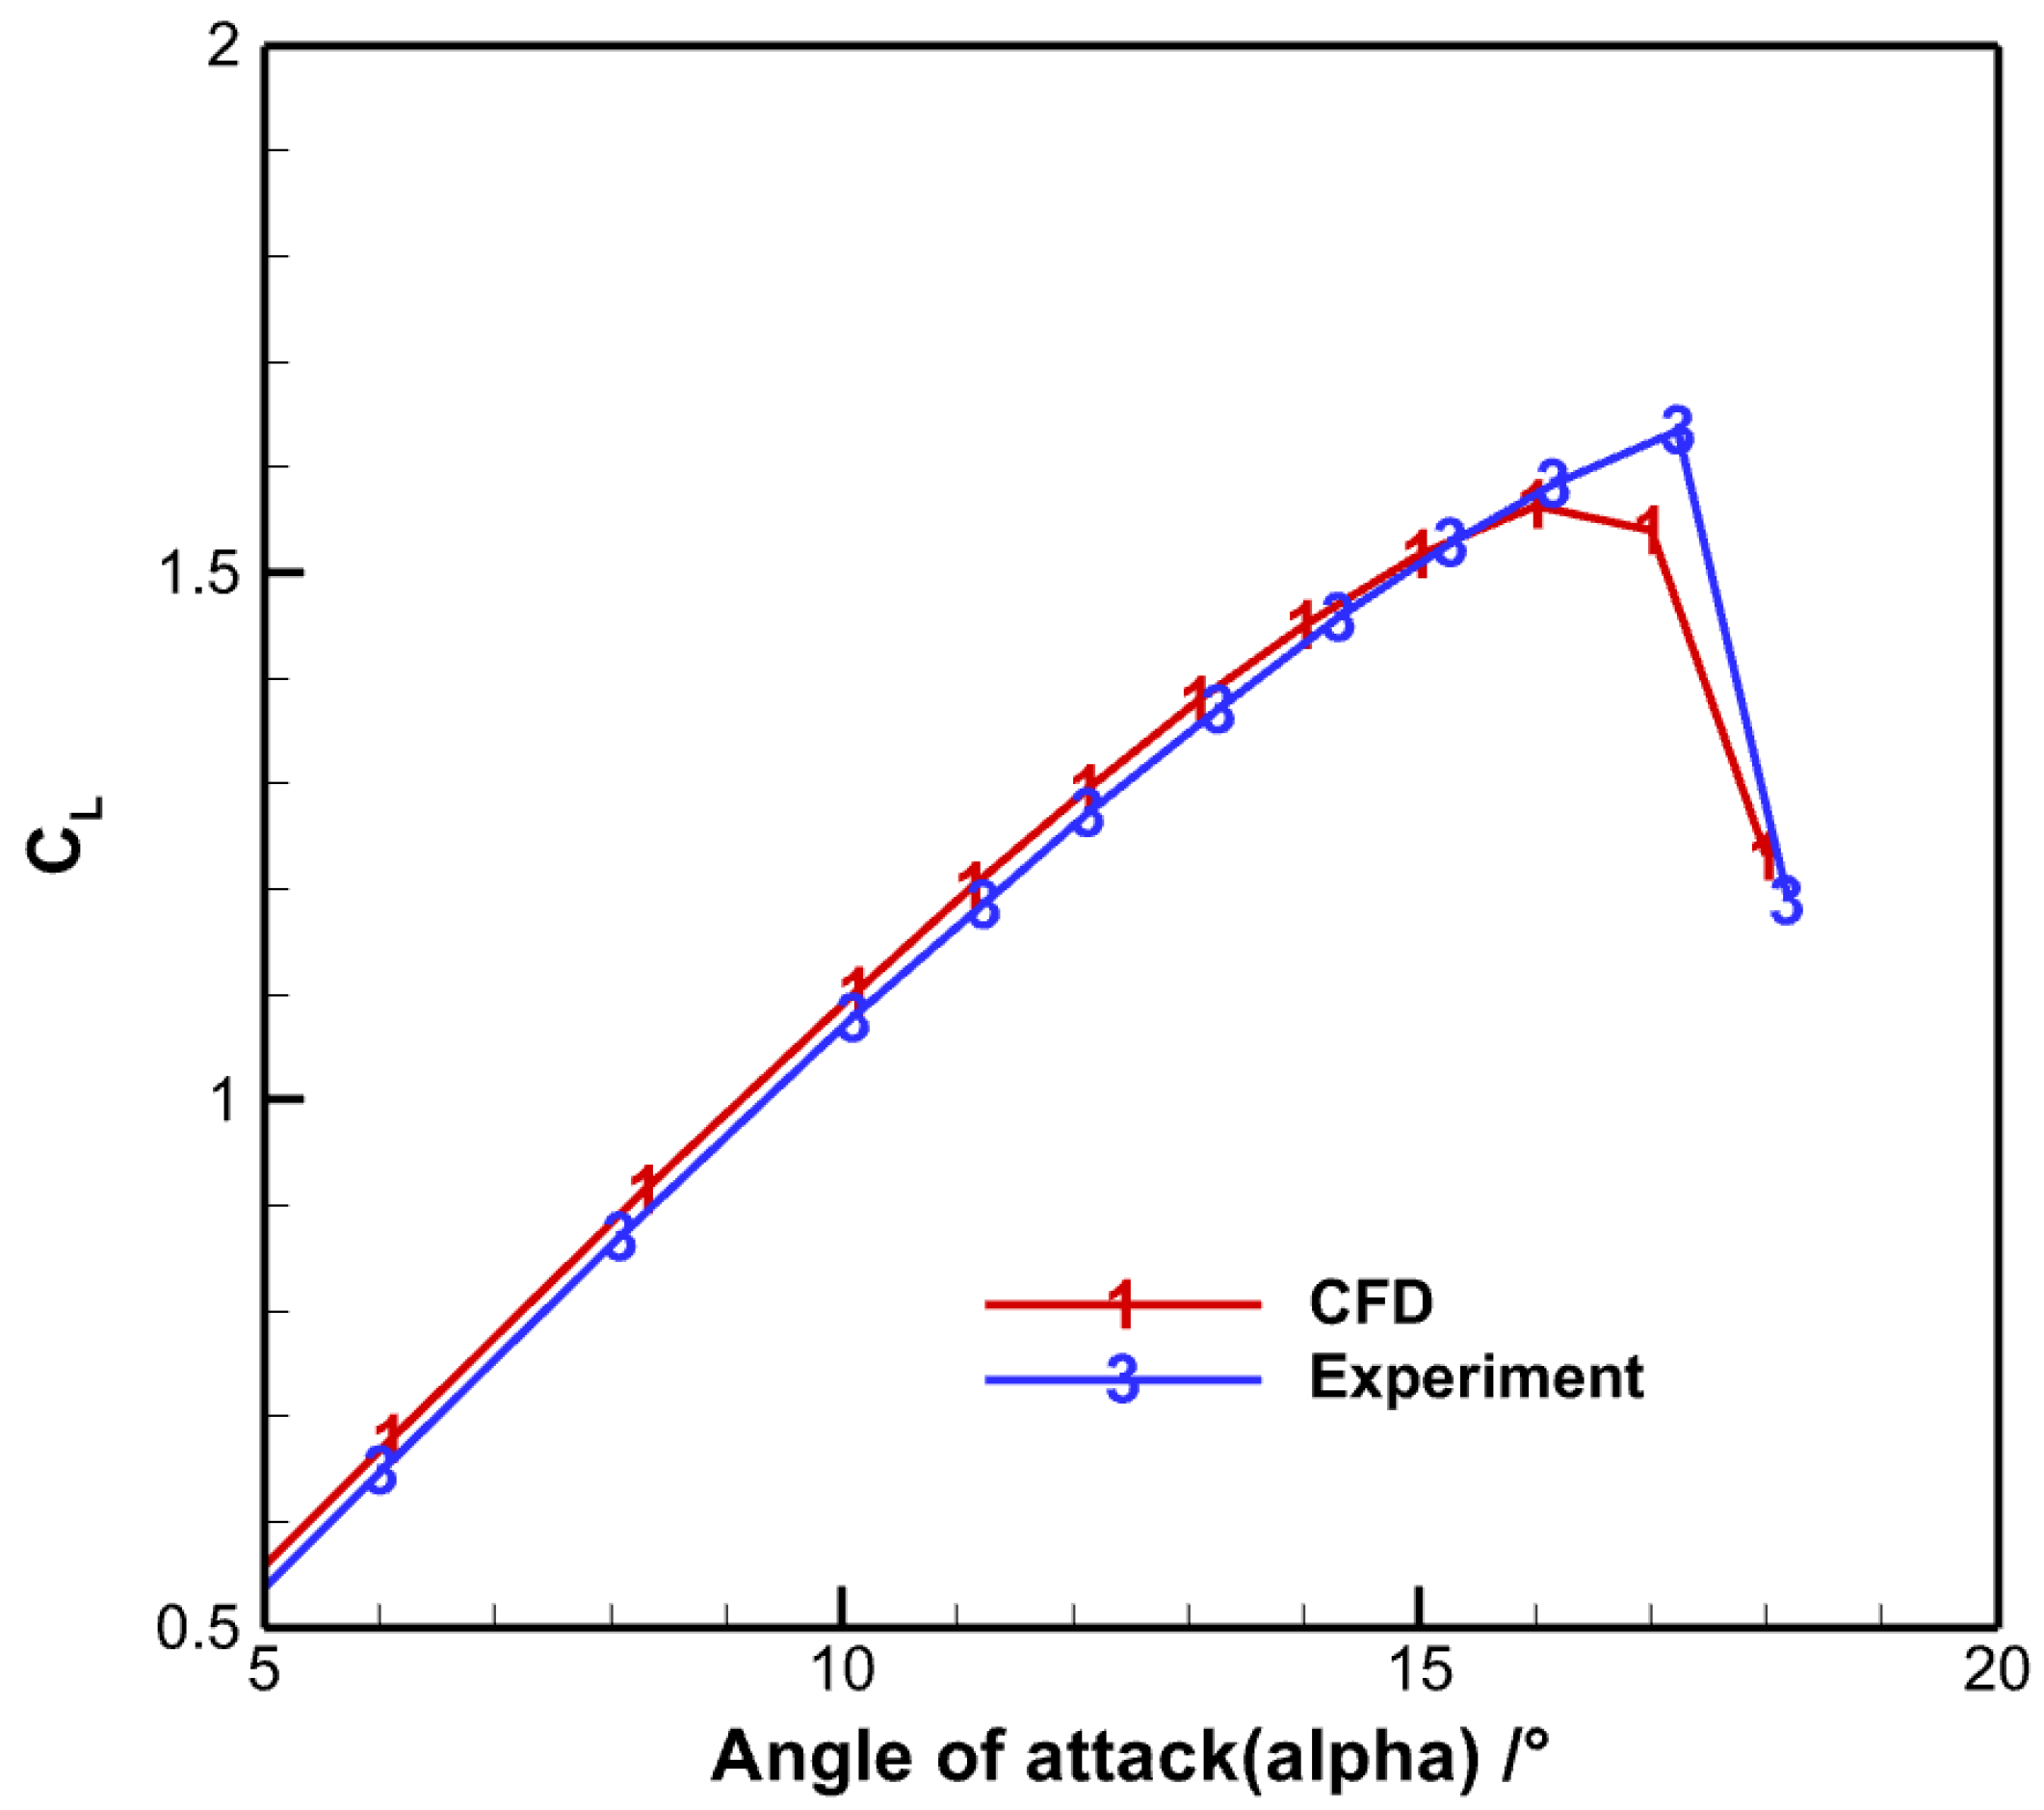
Figure 17 shows the lift characteristic curve calculated using the initial coarse mesh. In the linear lift region, the numerical results align well with experimental wind tunnel data. However, near the stall angle of attack, significant discrepancies emerge. While wind tunnel tests indicate a stall angle of 17.2°, the initial coarse mesh computation predicts stall at 16°, demonstrating an early stall phenomenon. At 17° angle of attack, the lift coefficient deviation between the initial mesh results and experimental data reaches 4.21%.
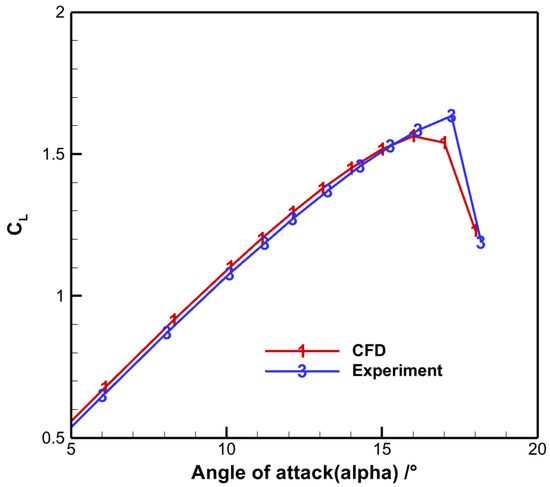
Figure 17.
Lift characteristics computed with the initial coarse mesh for NACA0012 airfoil.
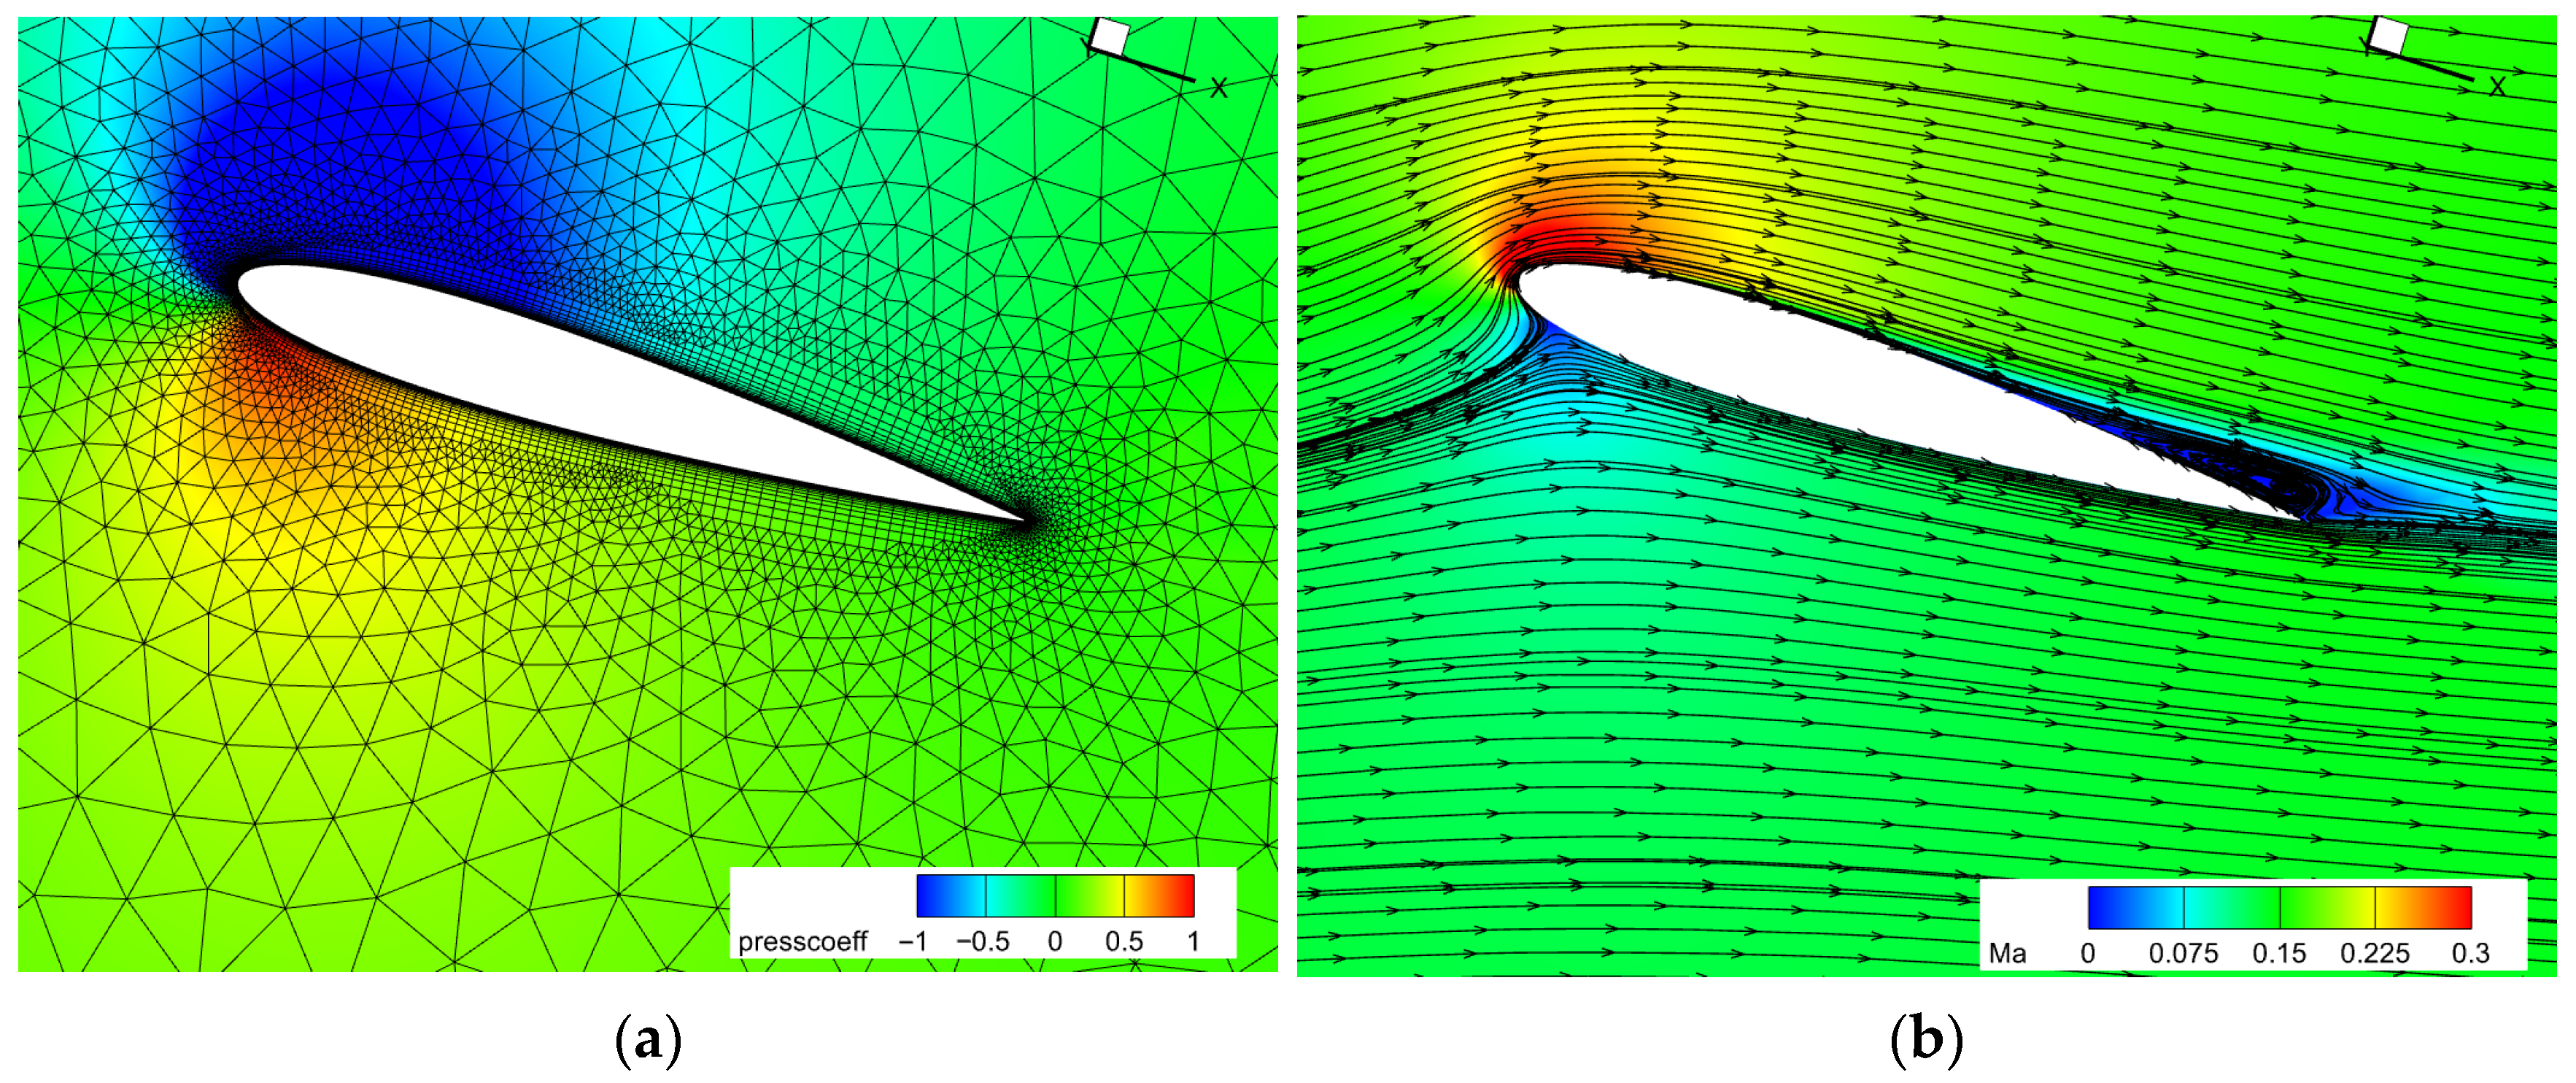
Figure 18 presents the pressure distribution and spatial streamlines at 17° angle of attack computed with the initial mesh. Flow separation occurs on the leeward side near the trailing edge, accompanied by clear separation vortices. Examination of the spatial mesh distribution confirms insufficient refinement in the separation zone on the leeward side, where lift calculations show heightened sensitivity to mesh resolution.
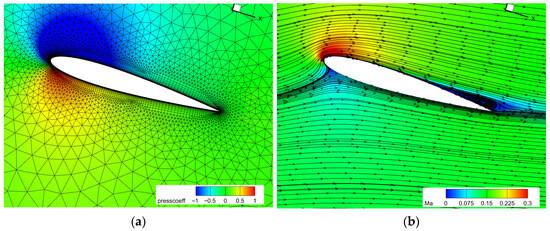
Figure 18.
Flow field characteristics at 17° angle of attack from initial mesh computation: (a) Pressure distribution and spatial mesh; (b) Mach number and spatial streamlines.
4.1.3. Adjoint-Based Mesh Adaptation Optimization
The lift characteristics of the NACA0012 airfoil at 17° angle of attack were computed using mesh adaptation, with the error estimation target set to lift and the number of adaptation cycles set to four.
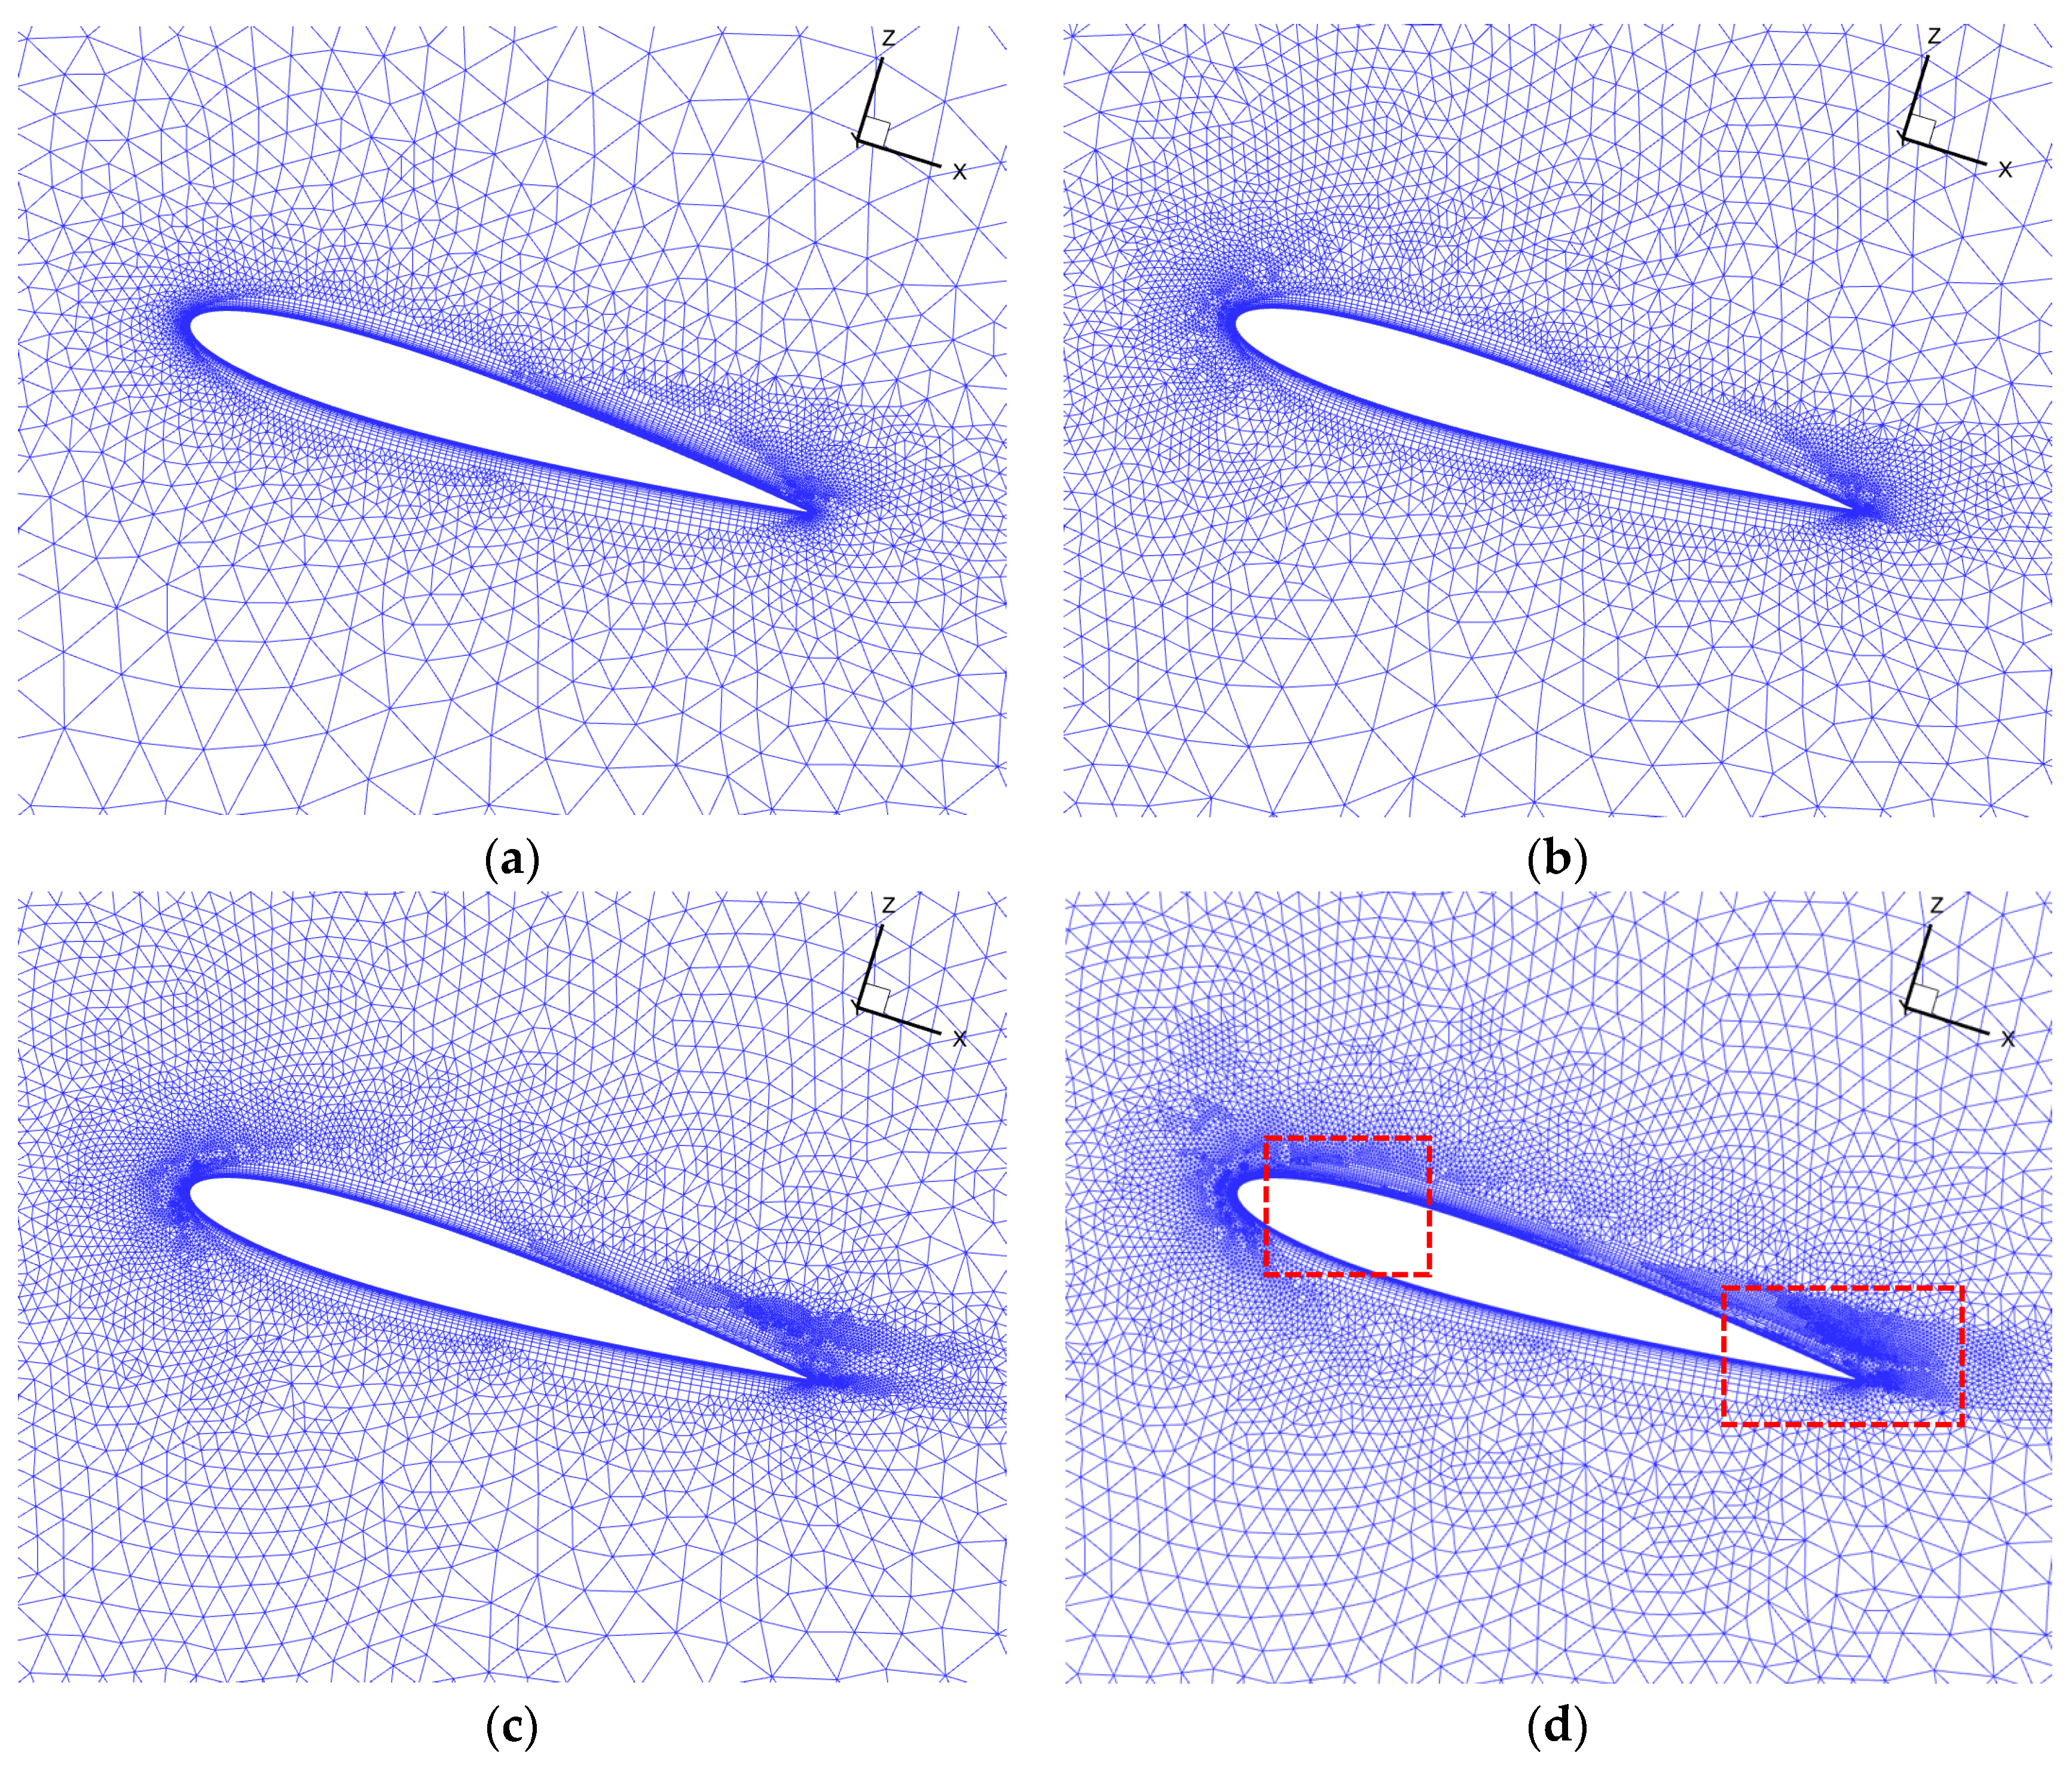
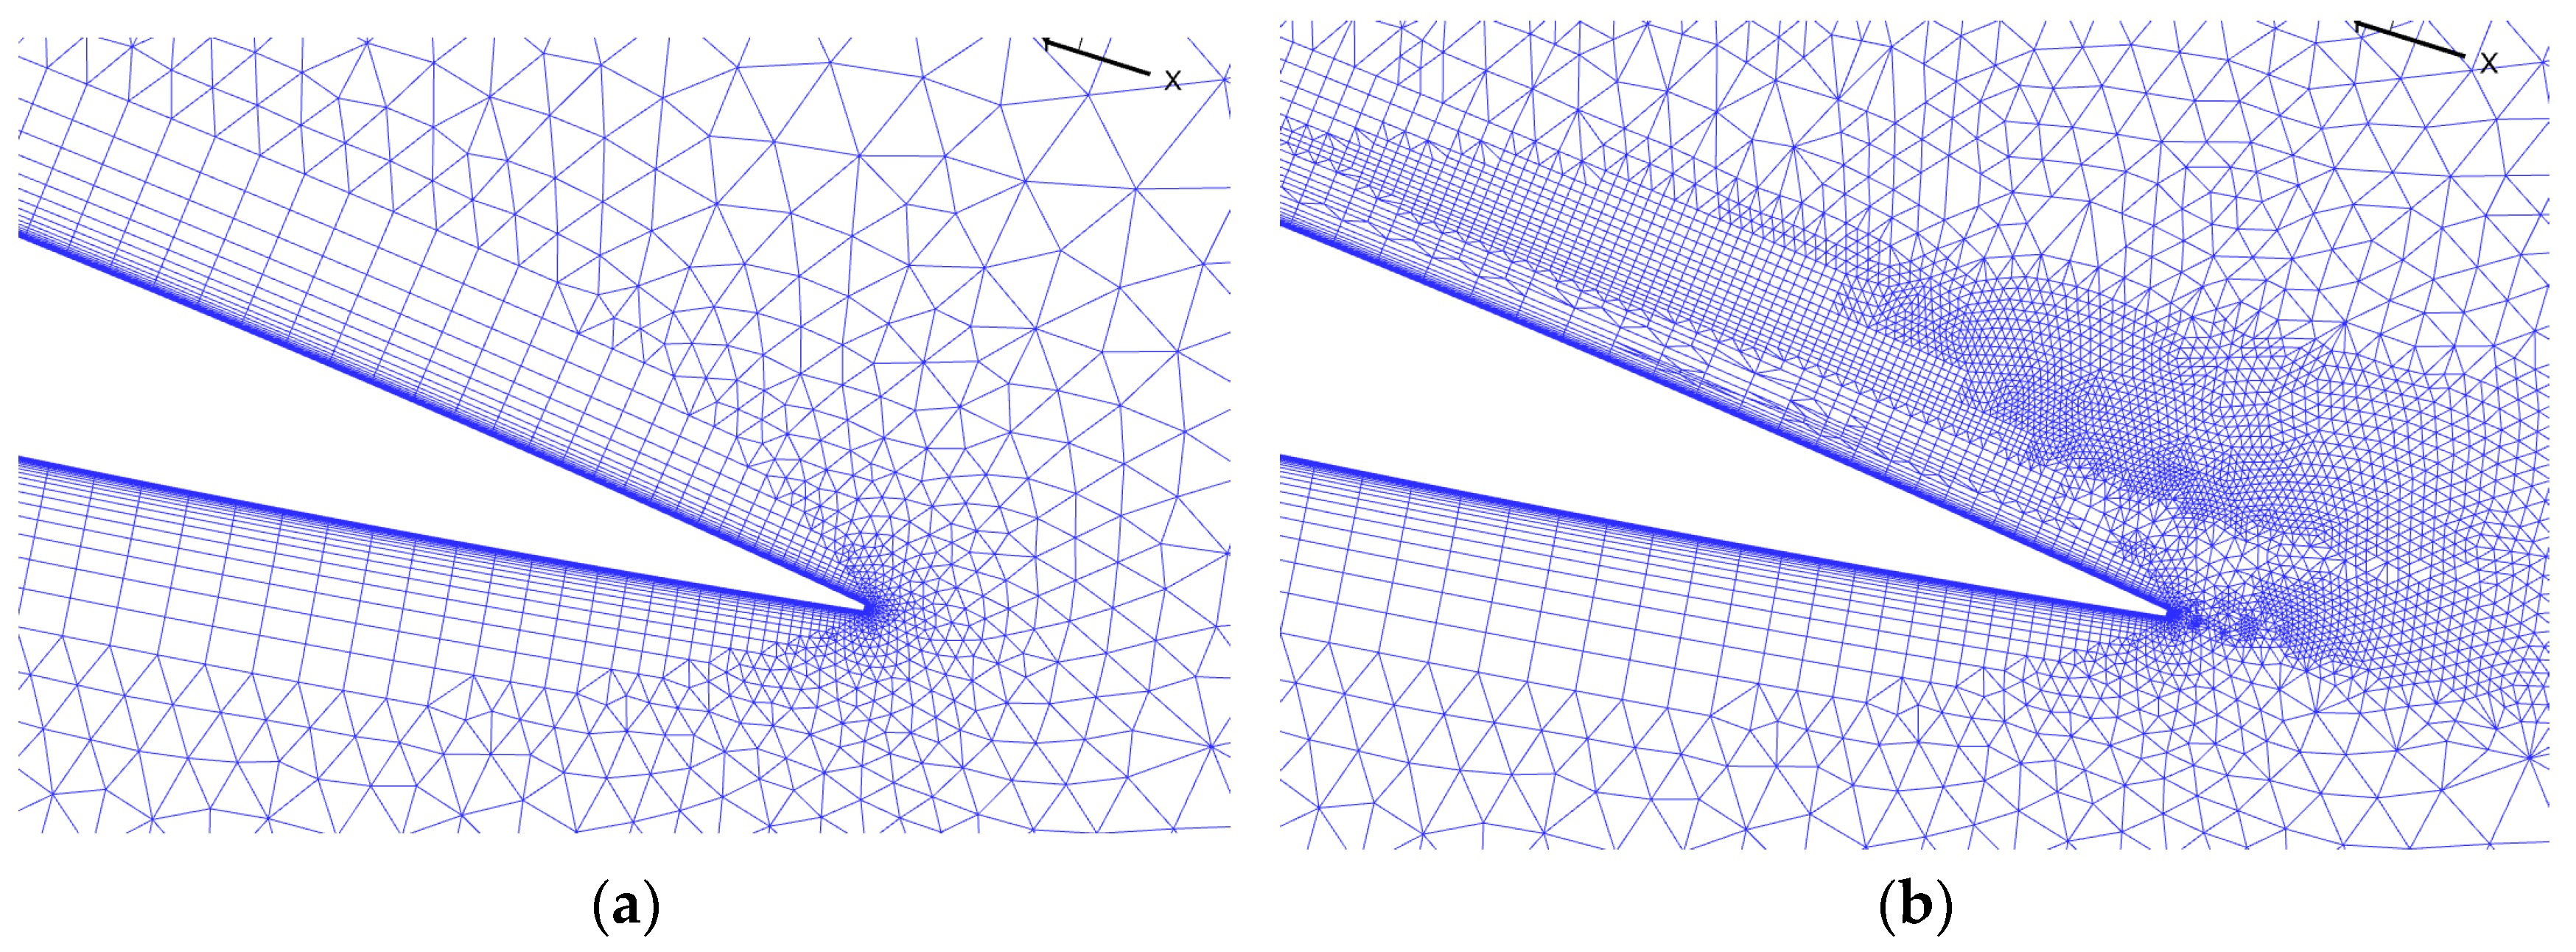
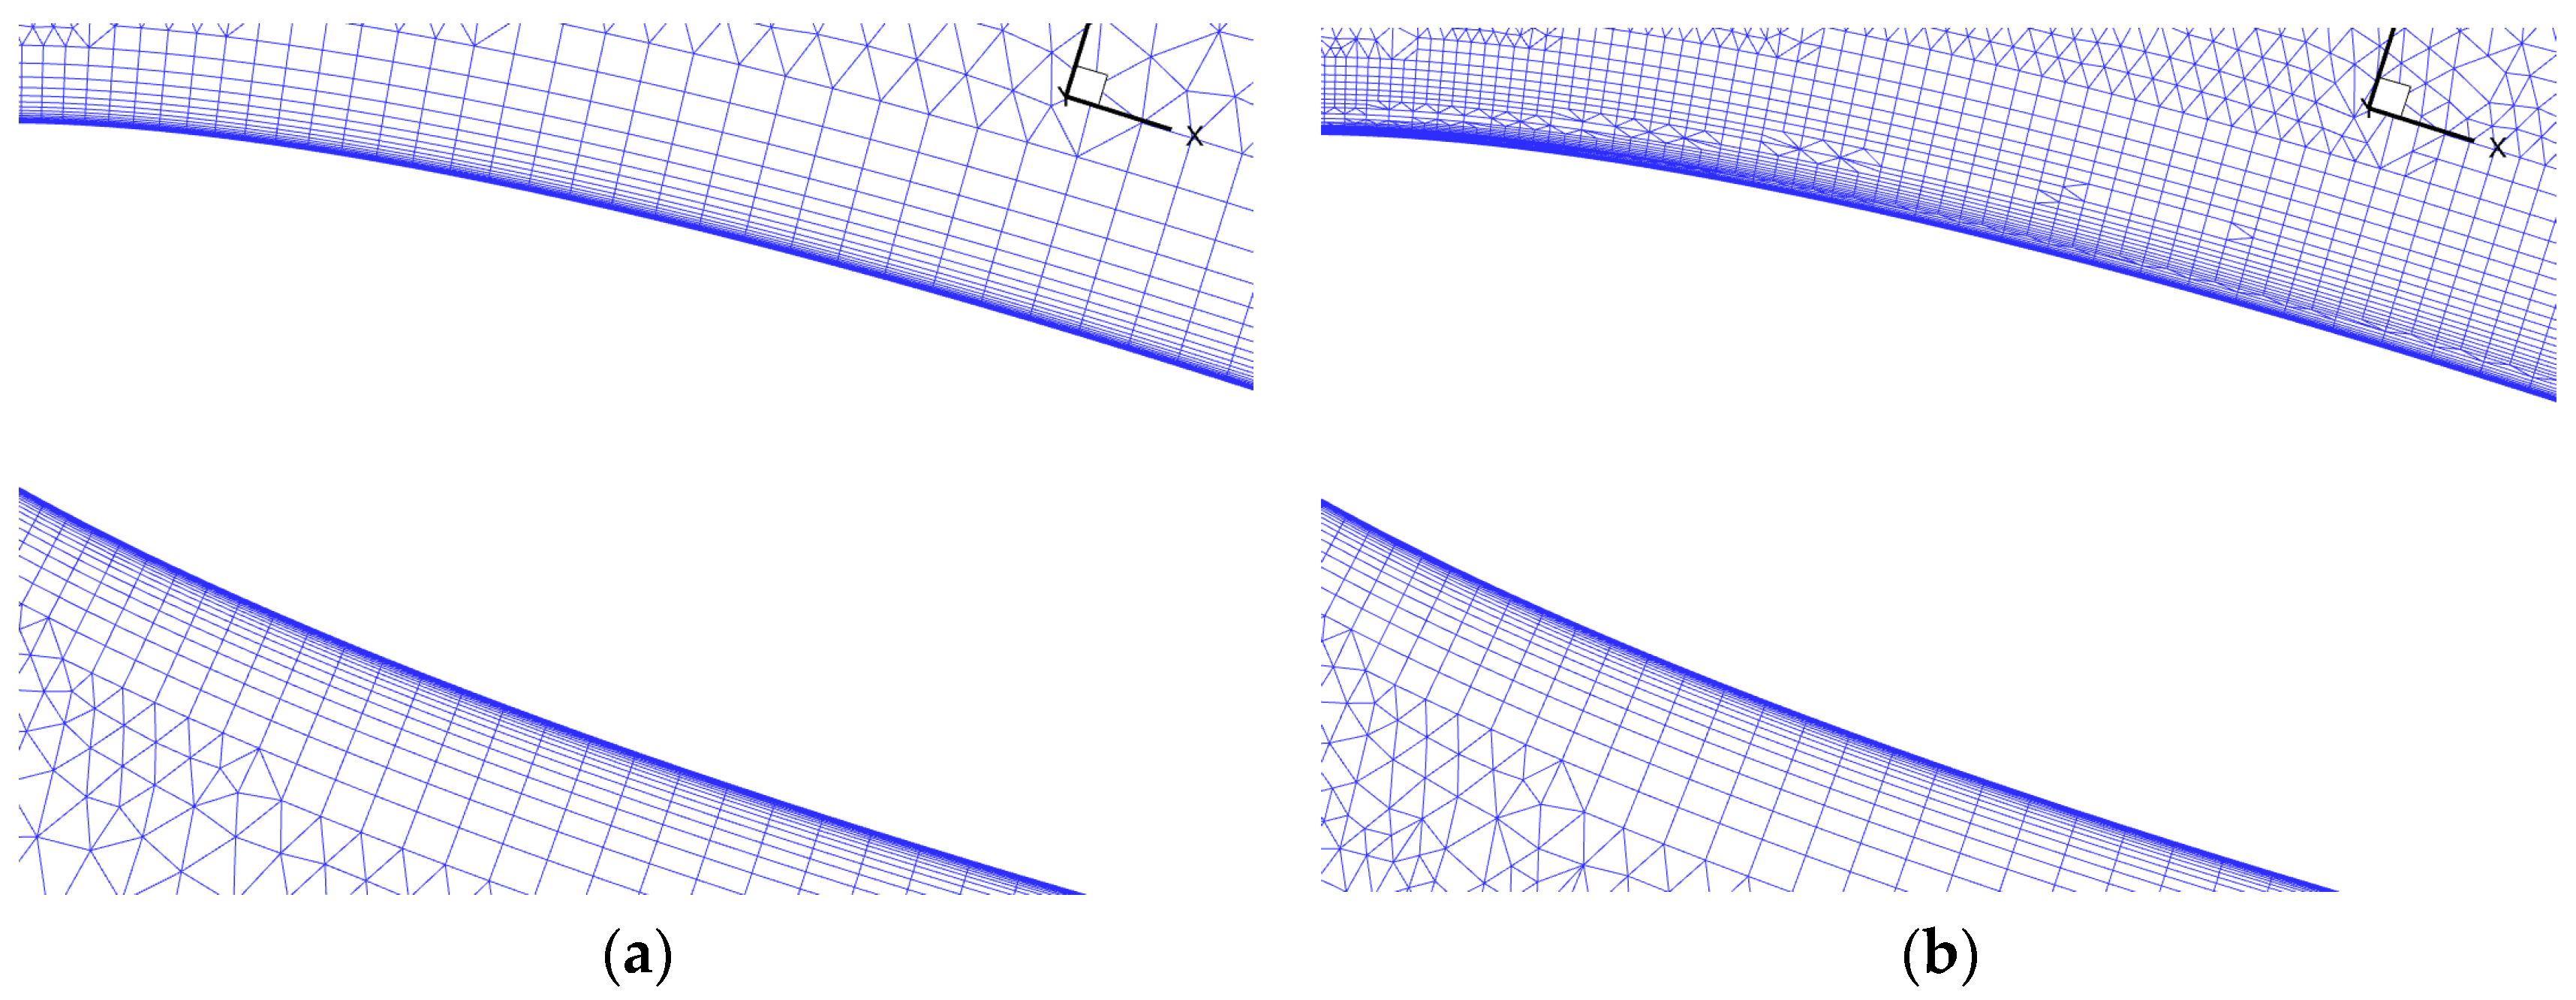
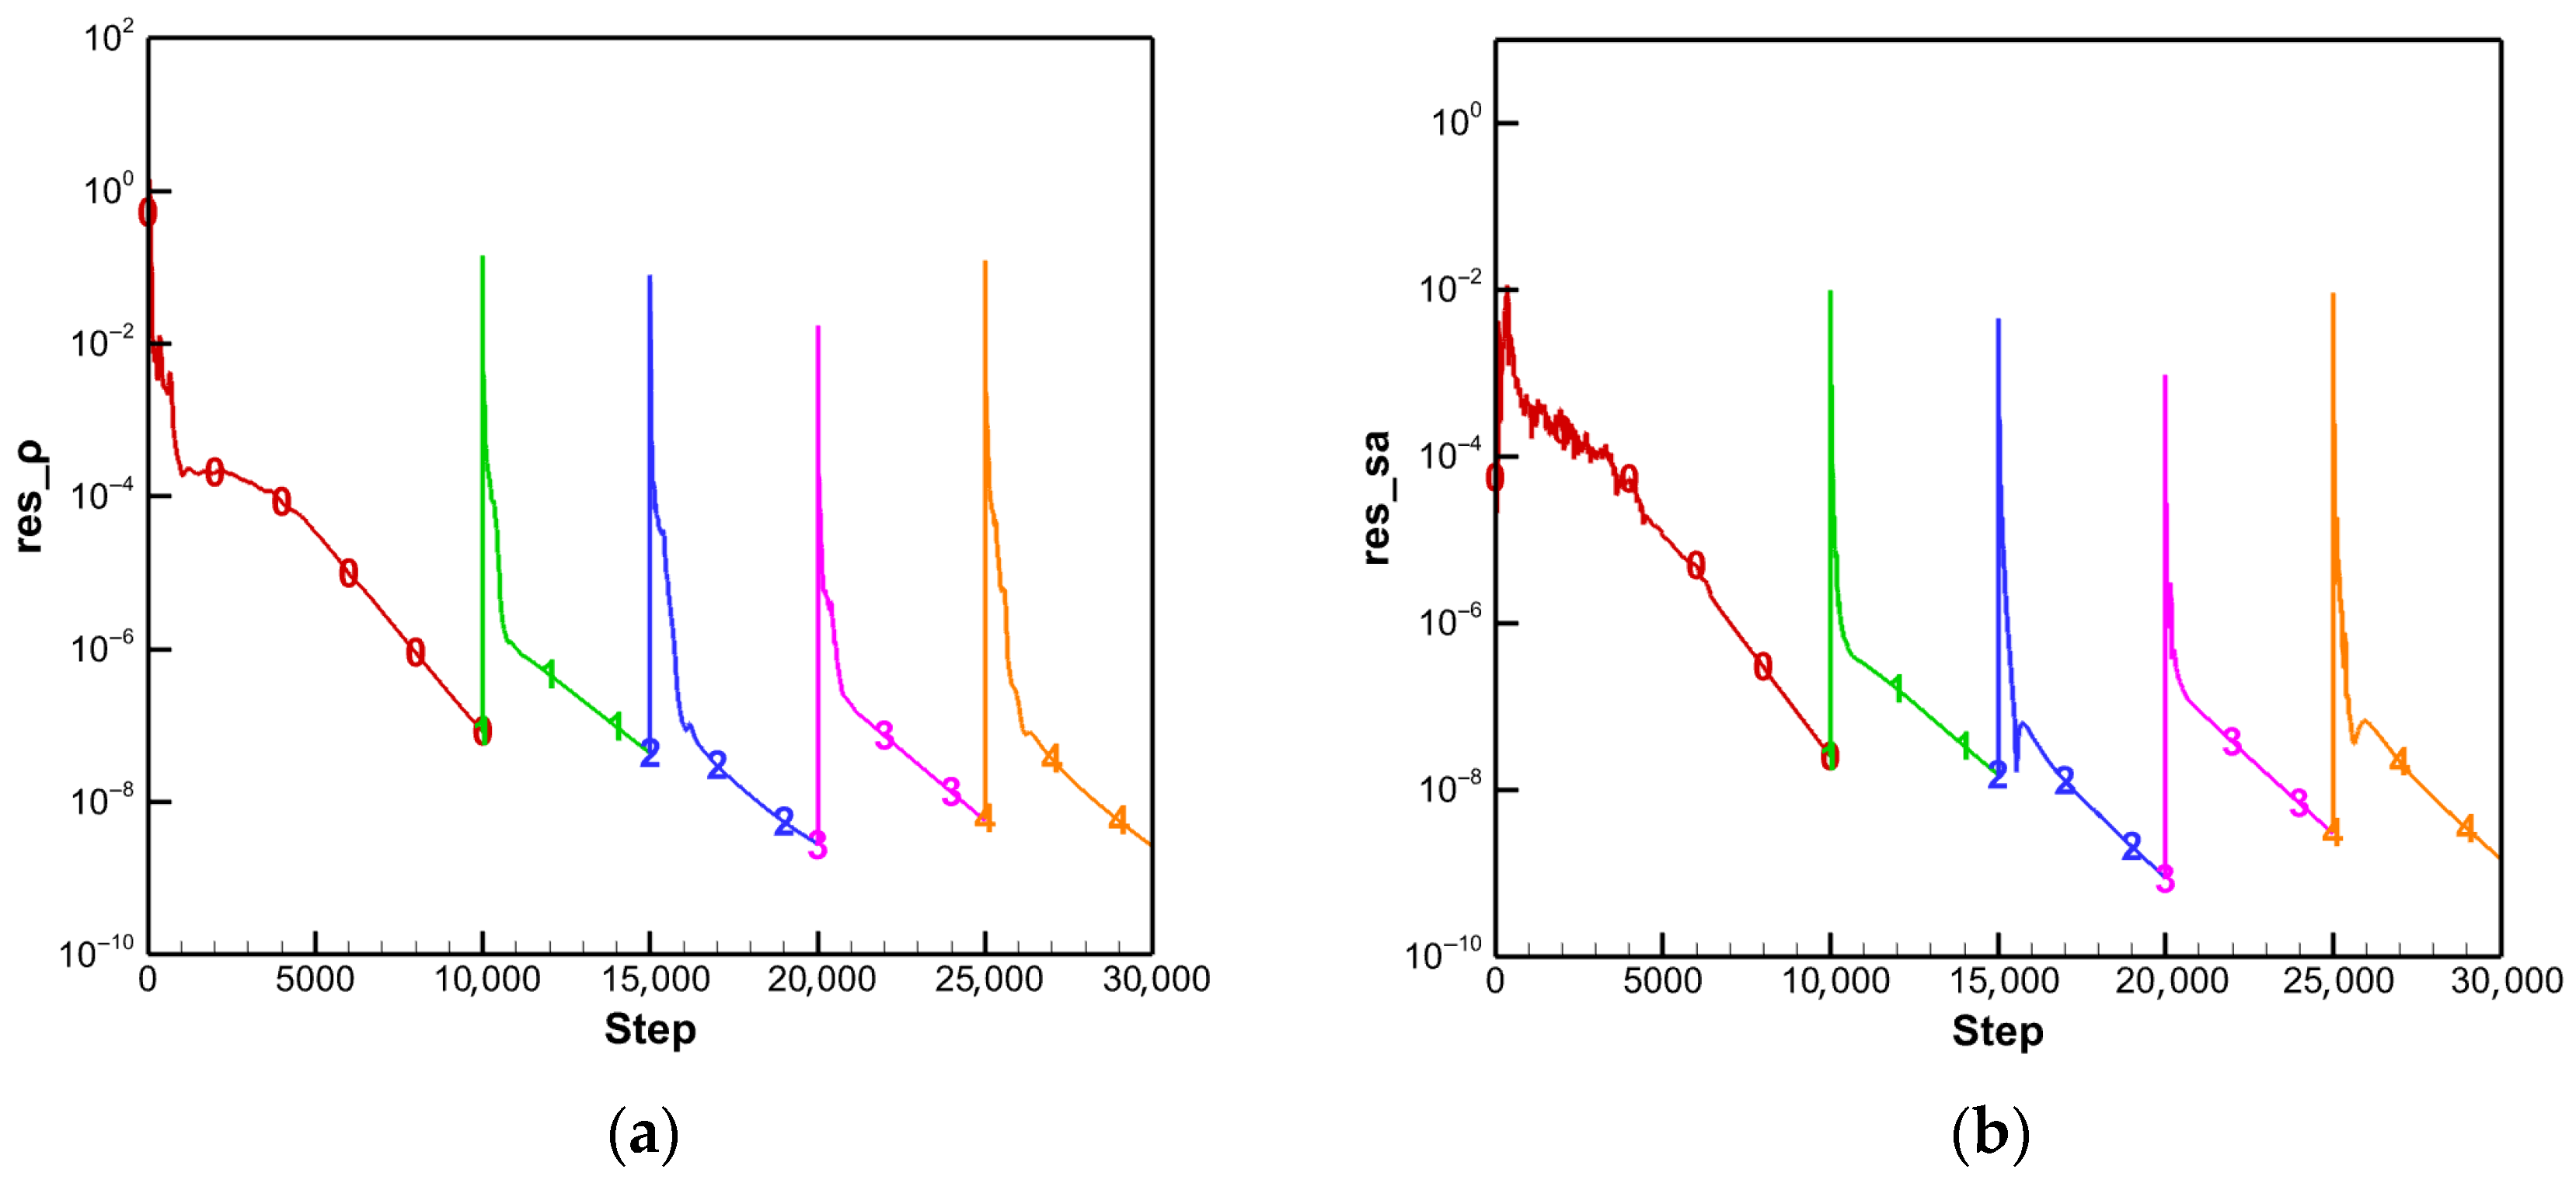
Figure 19 shows the spatial mesh distribution during the adaptive iteration process. Compared to the initial mesh in Figure 16, the adapted mesh primarily optimizes the distribution in the leeward flow separation region, boundary layer region, and leading edge of the airfoil, areas identified by error estimation as highly sensitive to lift. After the fourth adaptation, the mesh size reached 58,115 elements. Figure 20 and Figure 21 provide zoomed-in views of the red dashed regions in Figure 19d, comparing local mesh distributions before and after adaptation. Significant refinement is observed in the trailing-edge separation region on the leeward side and the boundary layer near the leading edge, while the windward side undergoes minimal refinement. Figure 22 presents the density residual convergence curve and SA turbulence residual convergence curve during the adaptive iteration process. The residuals of the adapted mesh decrease by over three orders of magnitude.
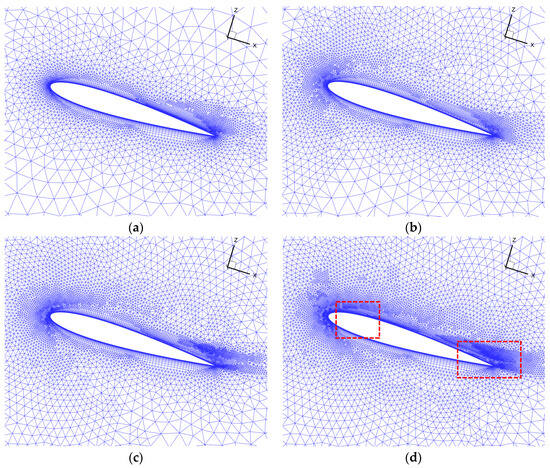
Figure 19.
Mesh distribution during adaptive iteration for NACA0012 airfoil: (a) 1st adaptation; (b) 2nd adaptation; (c) 3rd adaptation; (d) 4th adaptation.
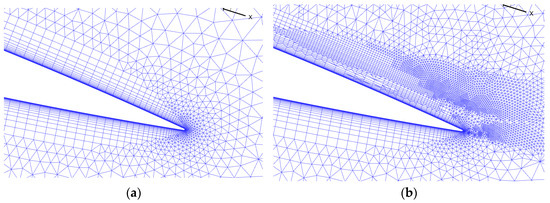
Figure 20.
Comparison of meshes in the trailing-edge separation region on the leeward side of the NACA0012 airfoil before and after adaptation: (a) Initial mesh; (b) Adapted mesh.
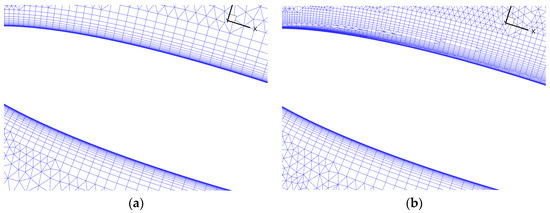
Figure 21.
Comparison of boundary layer meshes near the leeward leading edge of the NACA0012 airfoil before and after adaptation: (a) Initial mesh; (b) Adapted mesh.
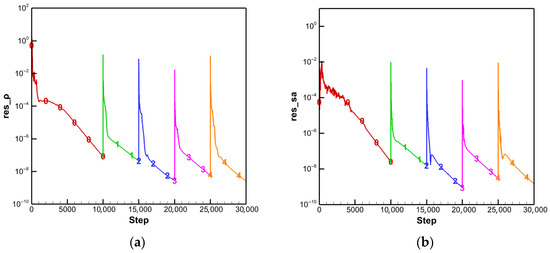
Figure 22.
Residual curves during adaptive iteration: (a) Density residual; (b) Turbulence residual.
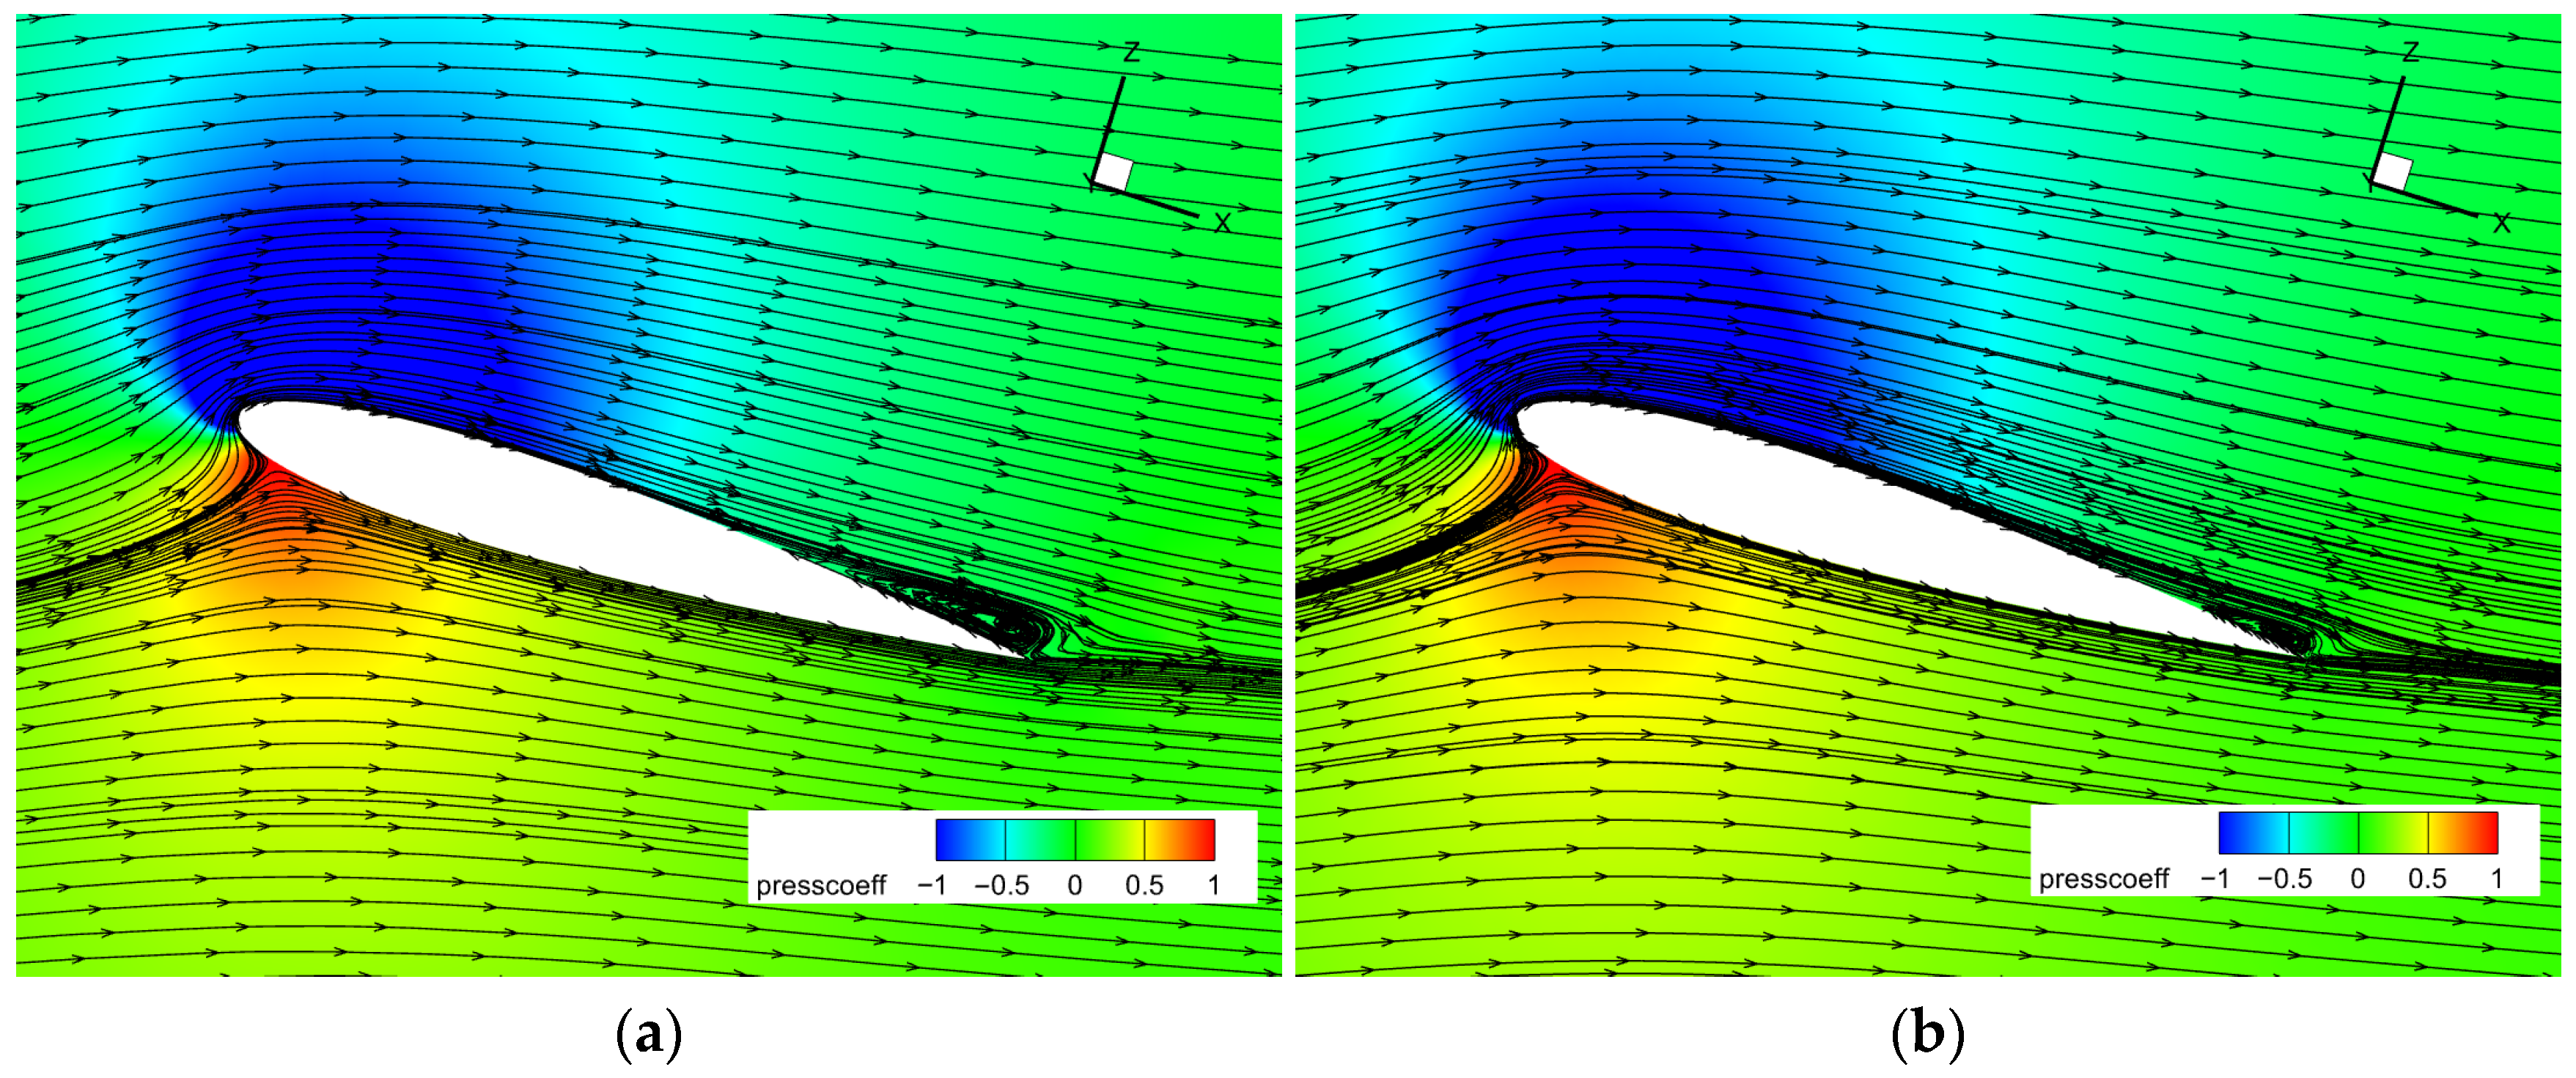
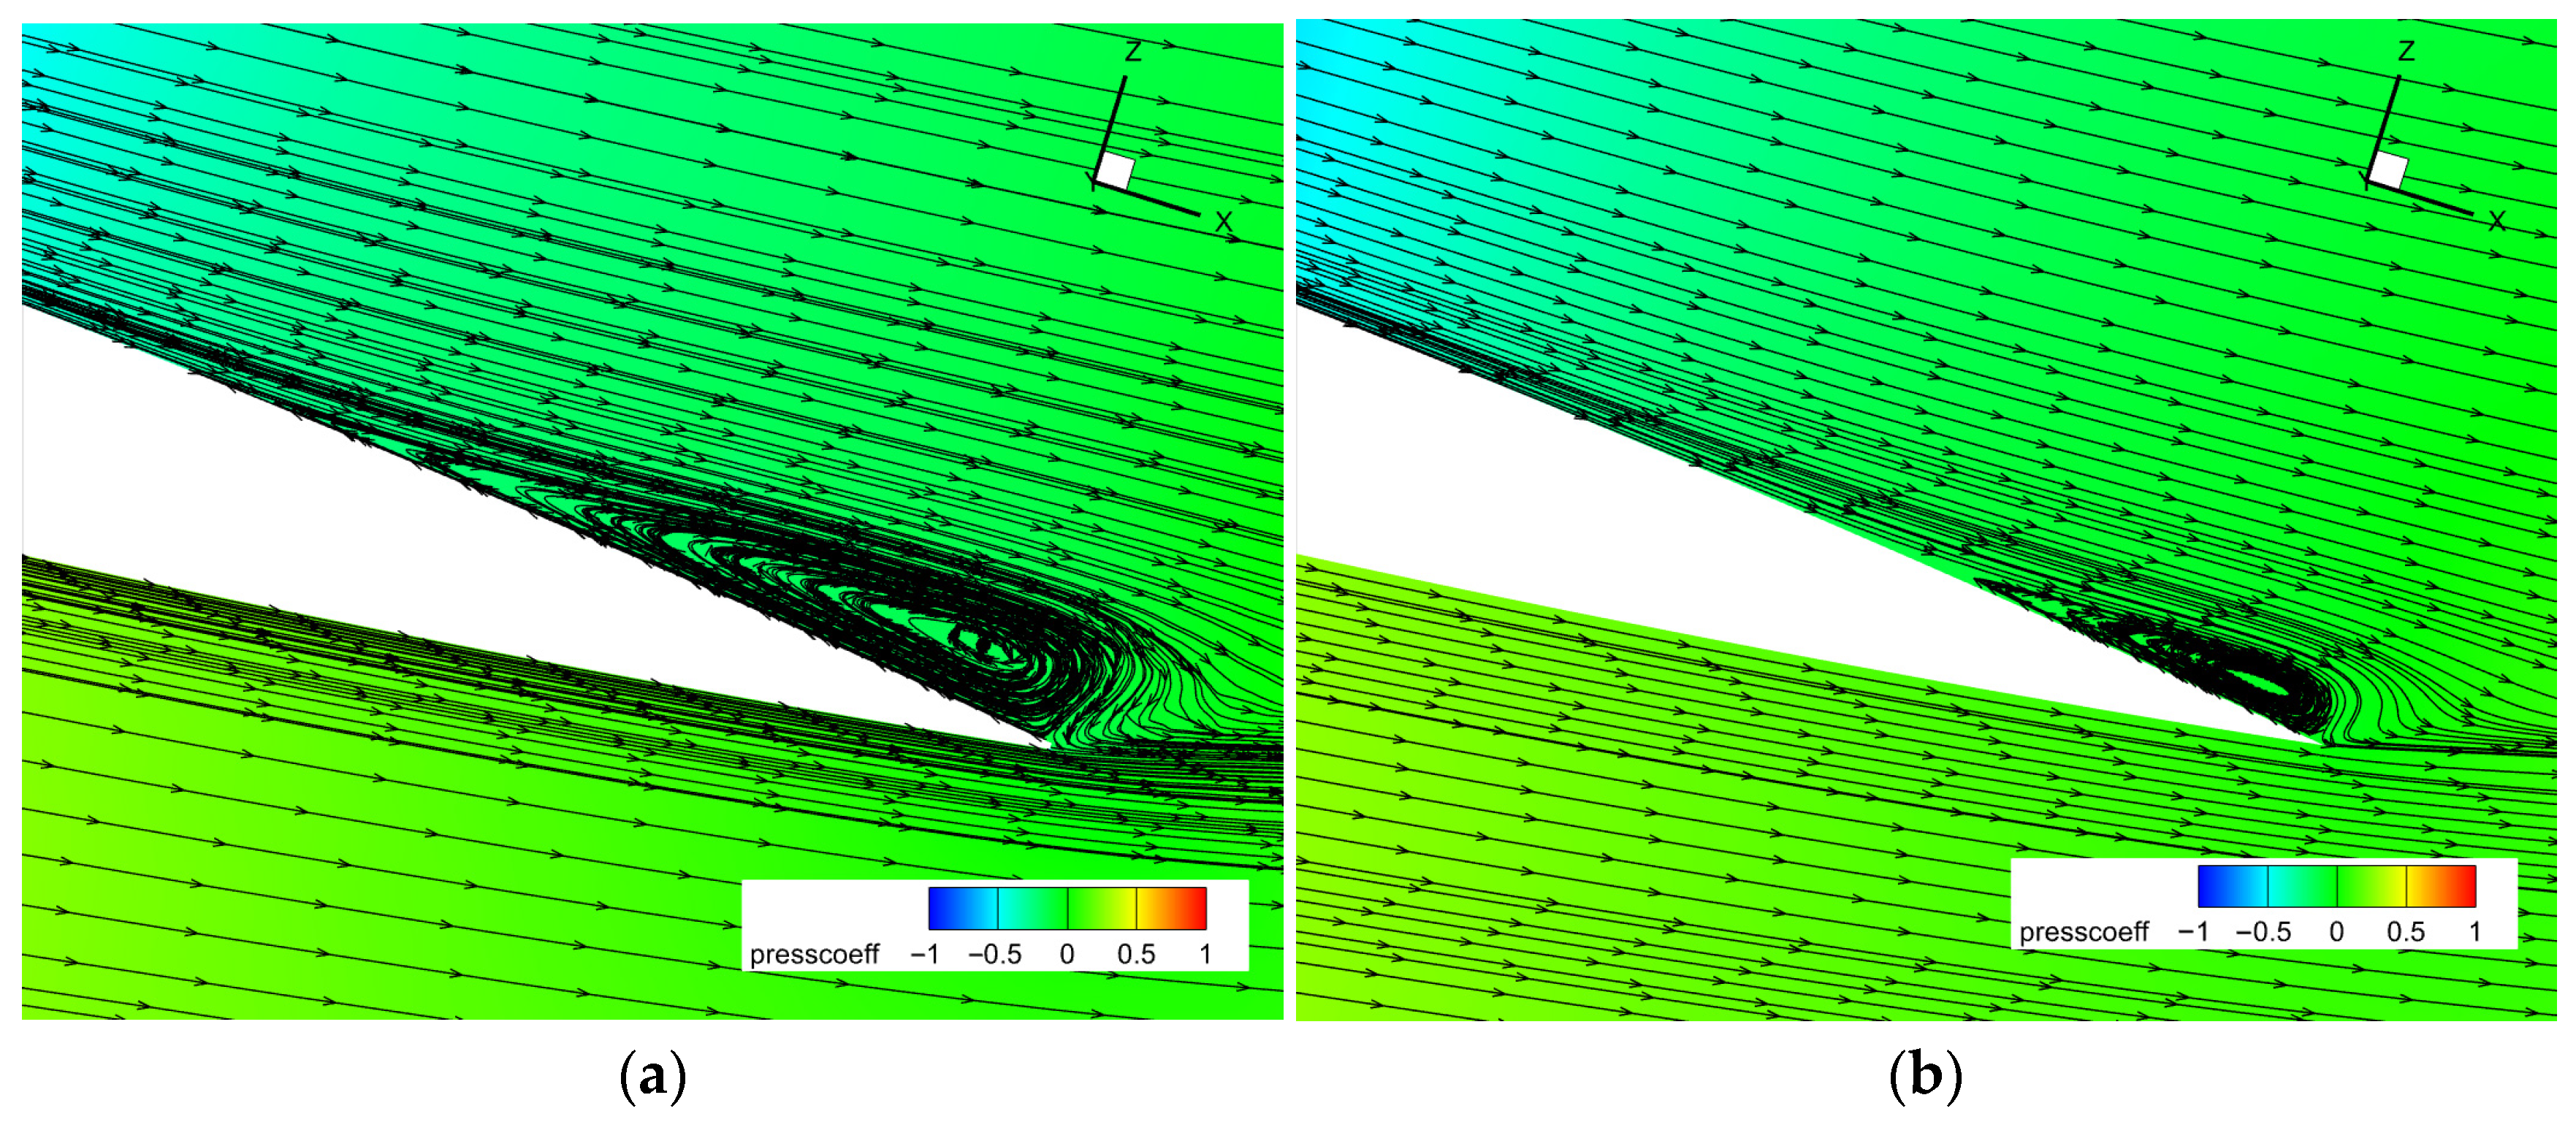
Figure 23 compares the flow fields before and after adaptation, revealing a distinct separation bubble at the trailing edge on the leeward side. This results from the small leading-edge radius of NACA0012, which generates a high suction peak at high angles of attack, followed by a strong adverse pressure gradient causing boundary layer separation and reattachment. Figure 24 shows that the separation bubble computed with the adapted mesh is significantly smaller than with the initial mesh. The initial mesh’s insufficient resolution in the separation region led to overpredicted separation extent, causing premature stall and reduced lift.
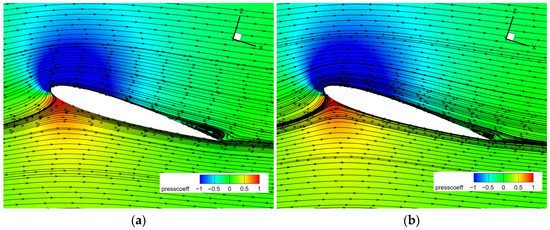
Figure 23.
Flow field comparison before/after adaptation: (a) Initial mesh; (b) Adapted mesh.
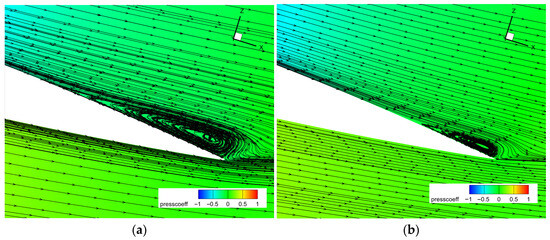
Figure 24.
Comparison of leeward separation bubbles: (a) Initial mesh; (b) Adapted mesh.
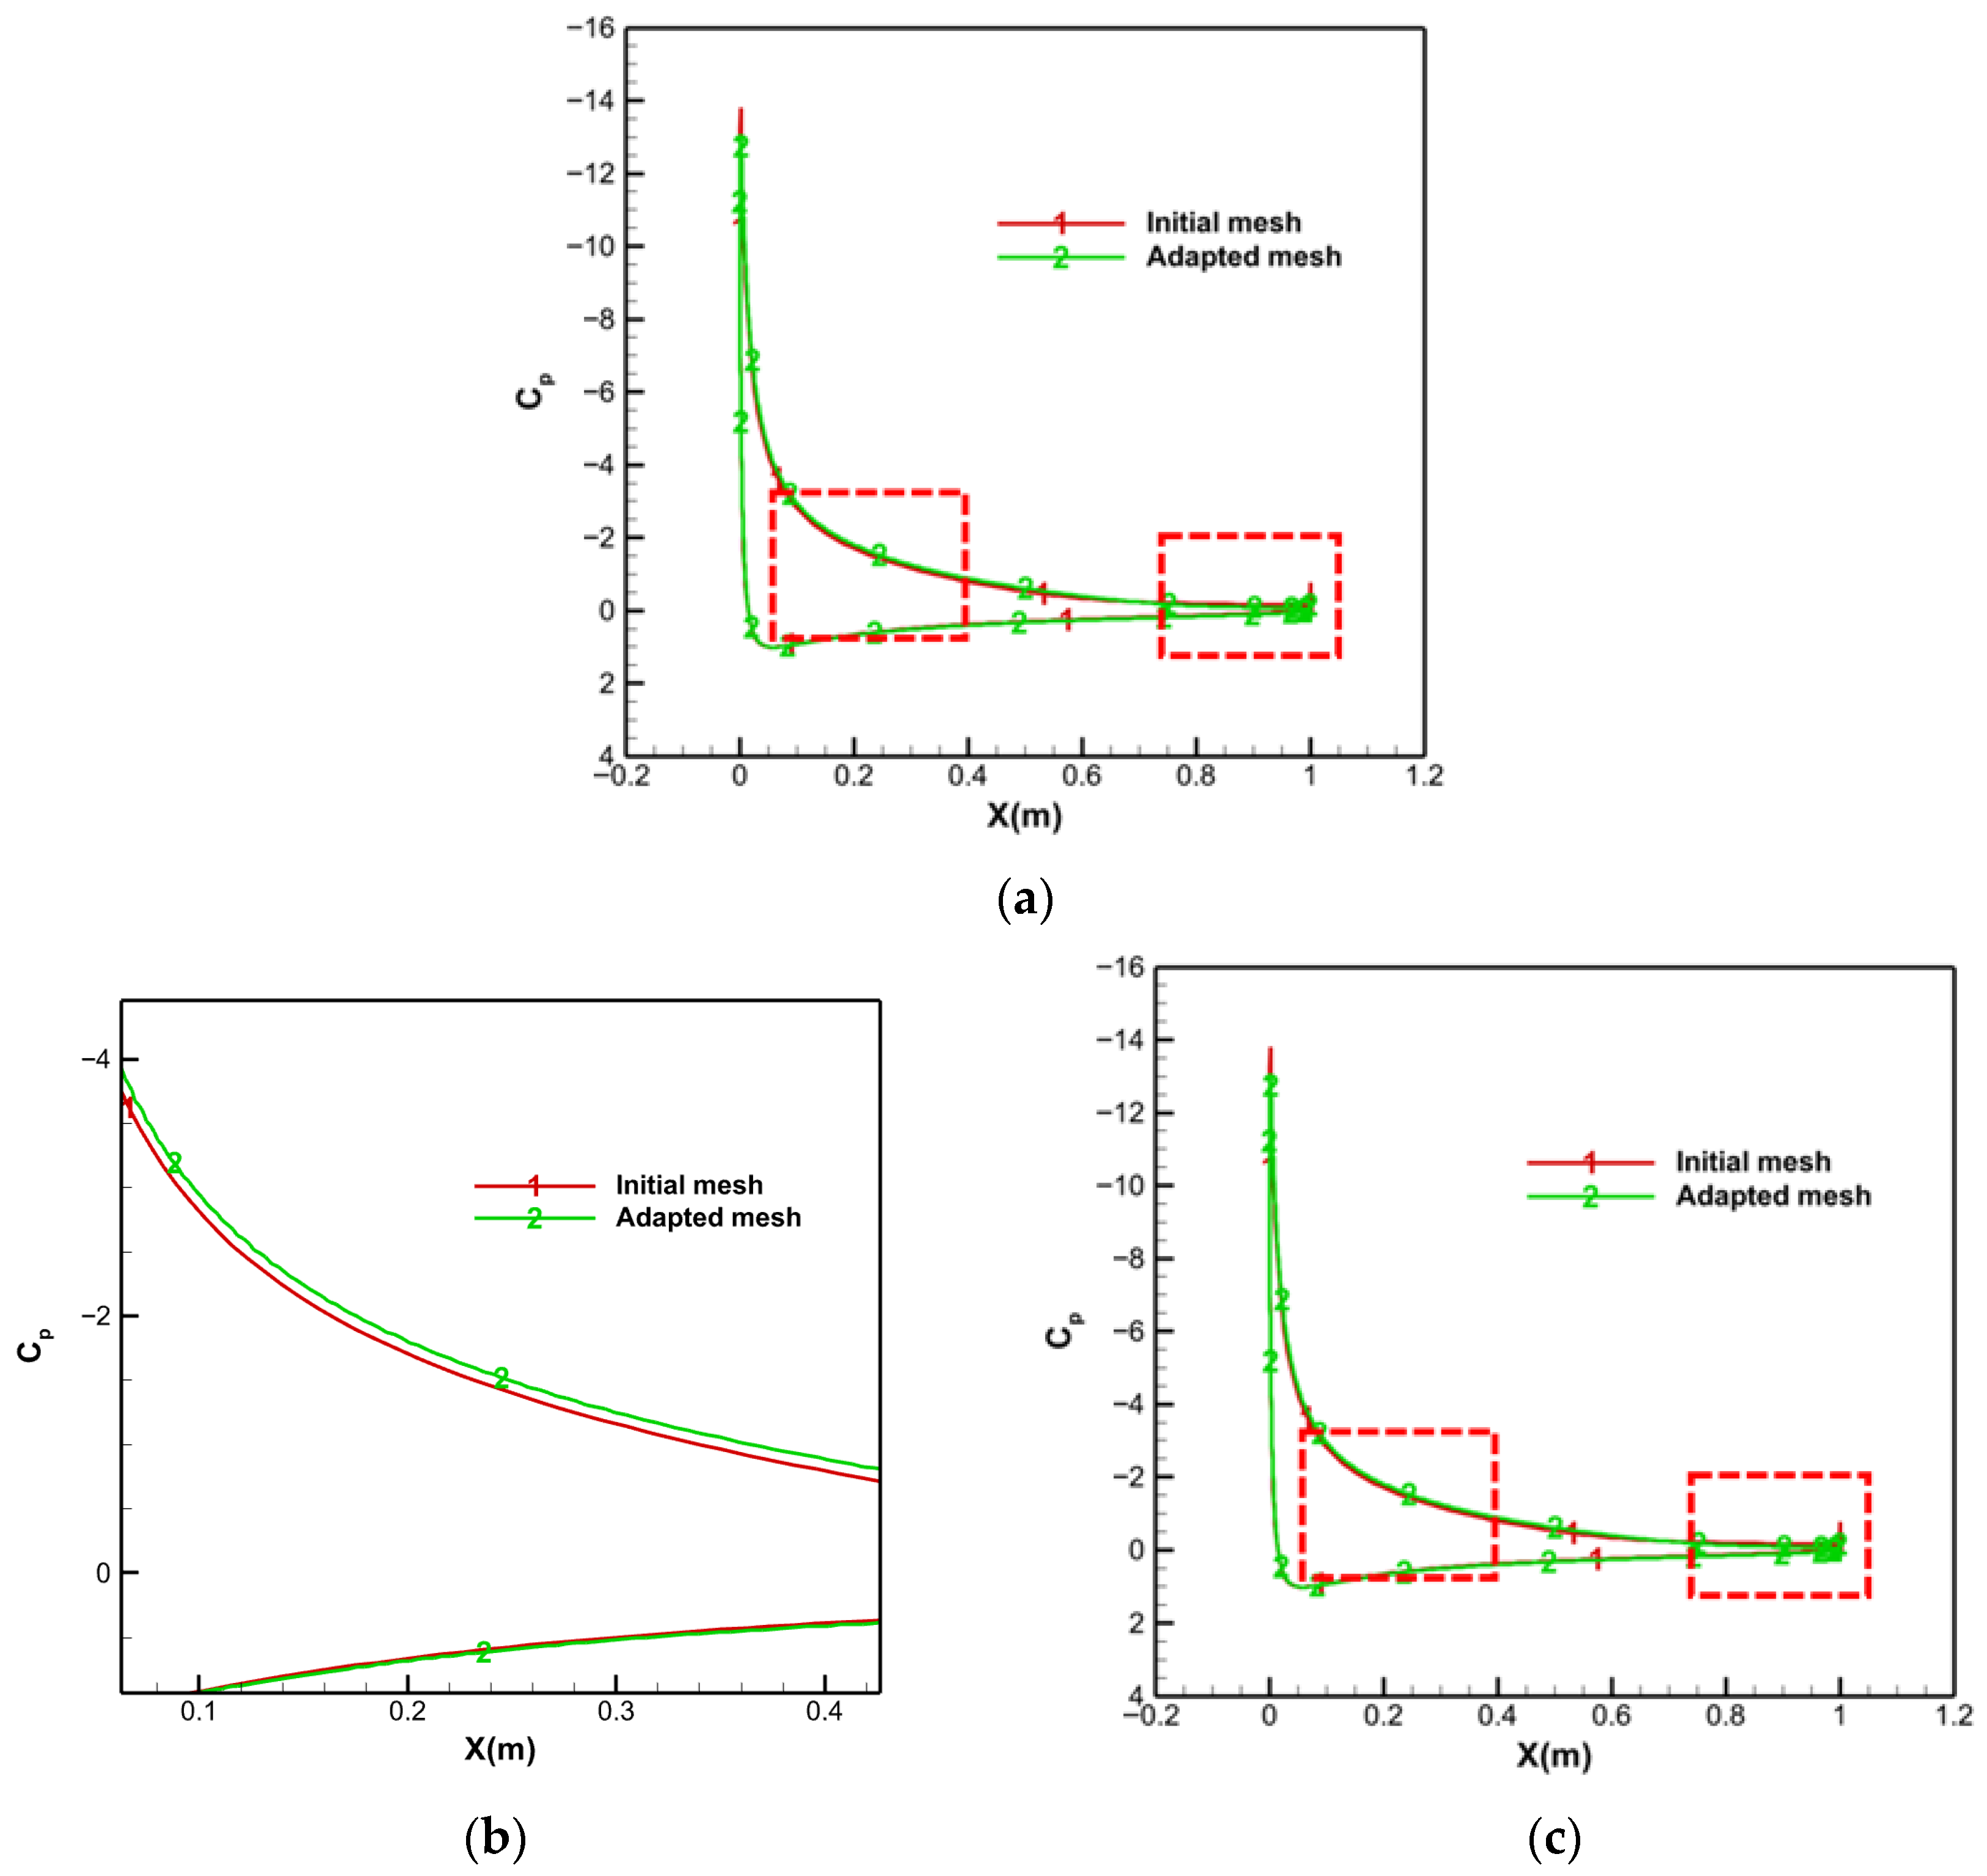
Figure 25 compares pressure distributions before and after adaptation. Figure 25b shows the pressure near the leeward leading edge, and Figure 25c shows the trailing-edge pressure. The adapted mesh significantly improves resolution in the separation region and leading-edge boundary layer, resulting in a smaller separation bubble and a lower suction peak pressure. In contrast, the pressure distribution on the windward side remains largely unchanged.
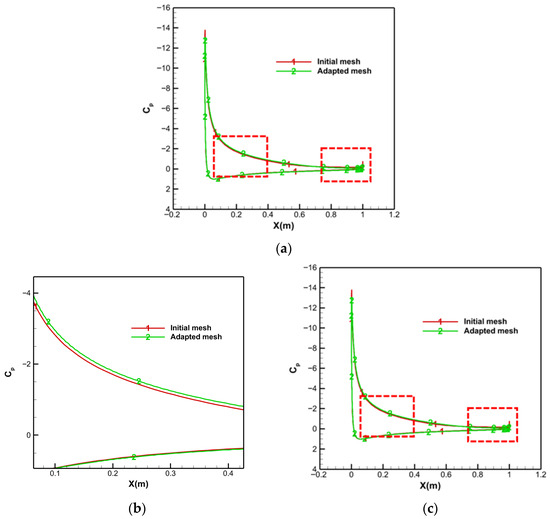
Figure 25.
Pressure distribution comparison: (a) Global comparison; (b) Near leeward leading edge; (c) Trailing edge region.
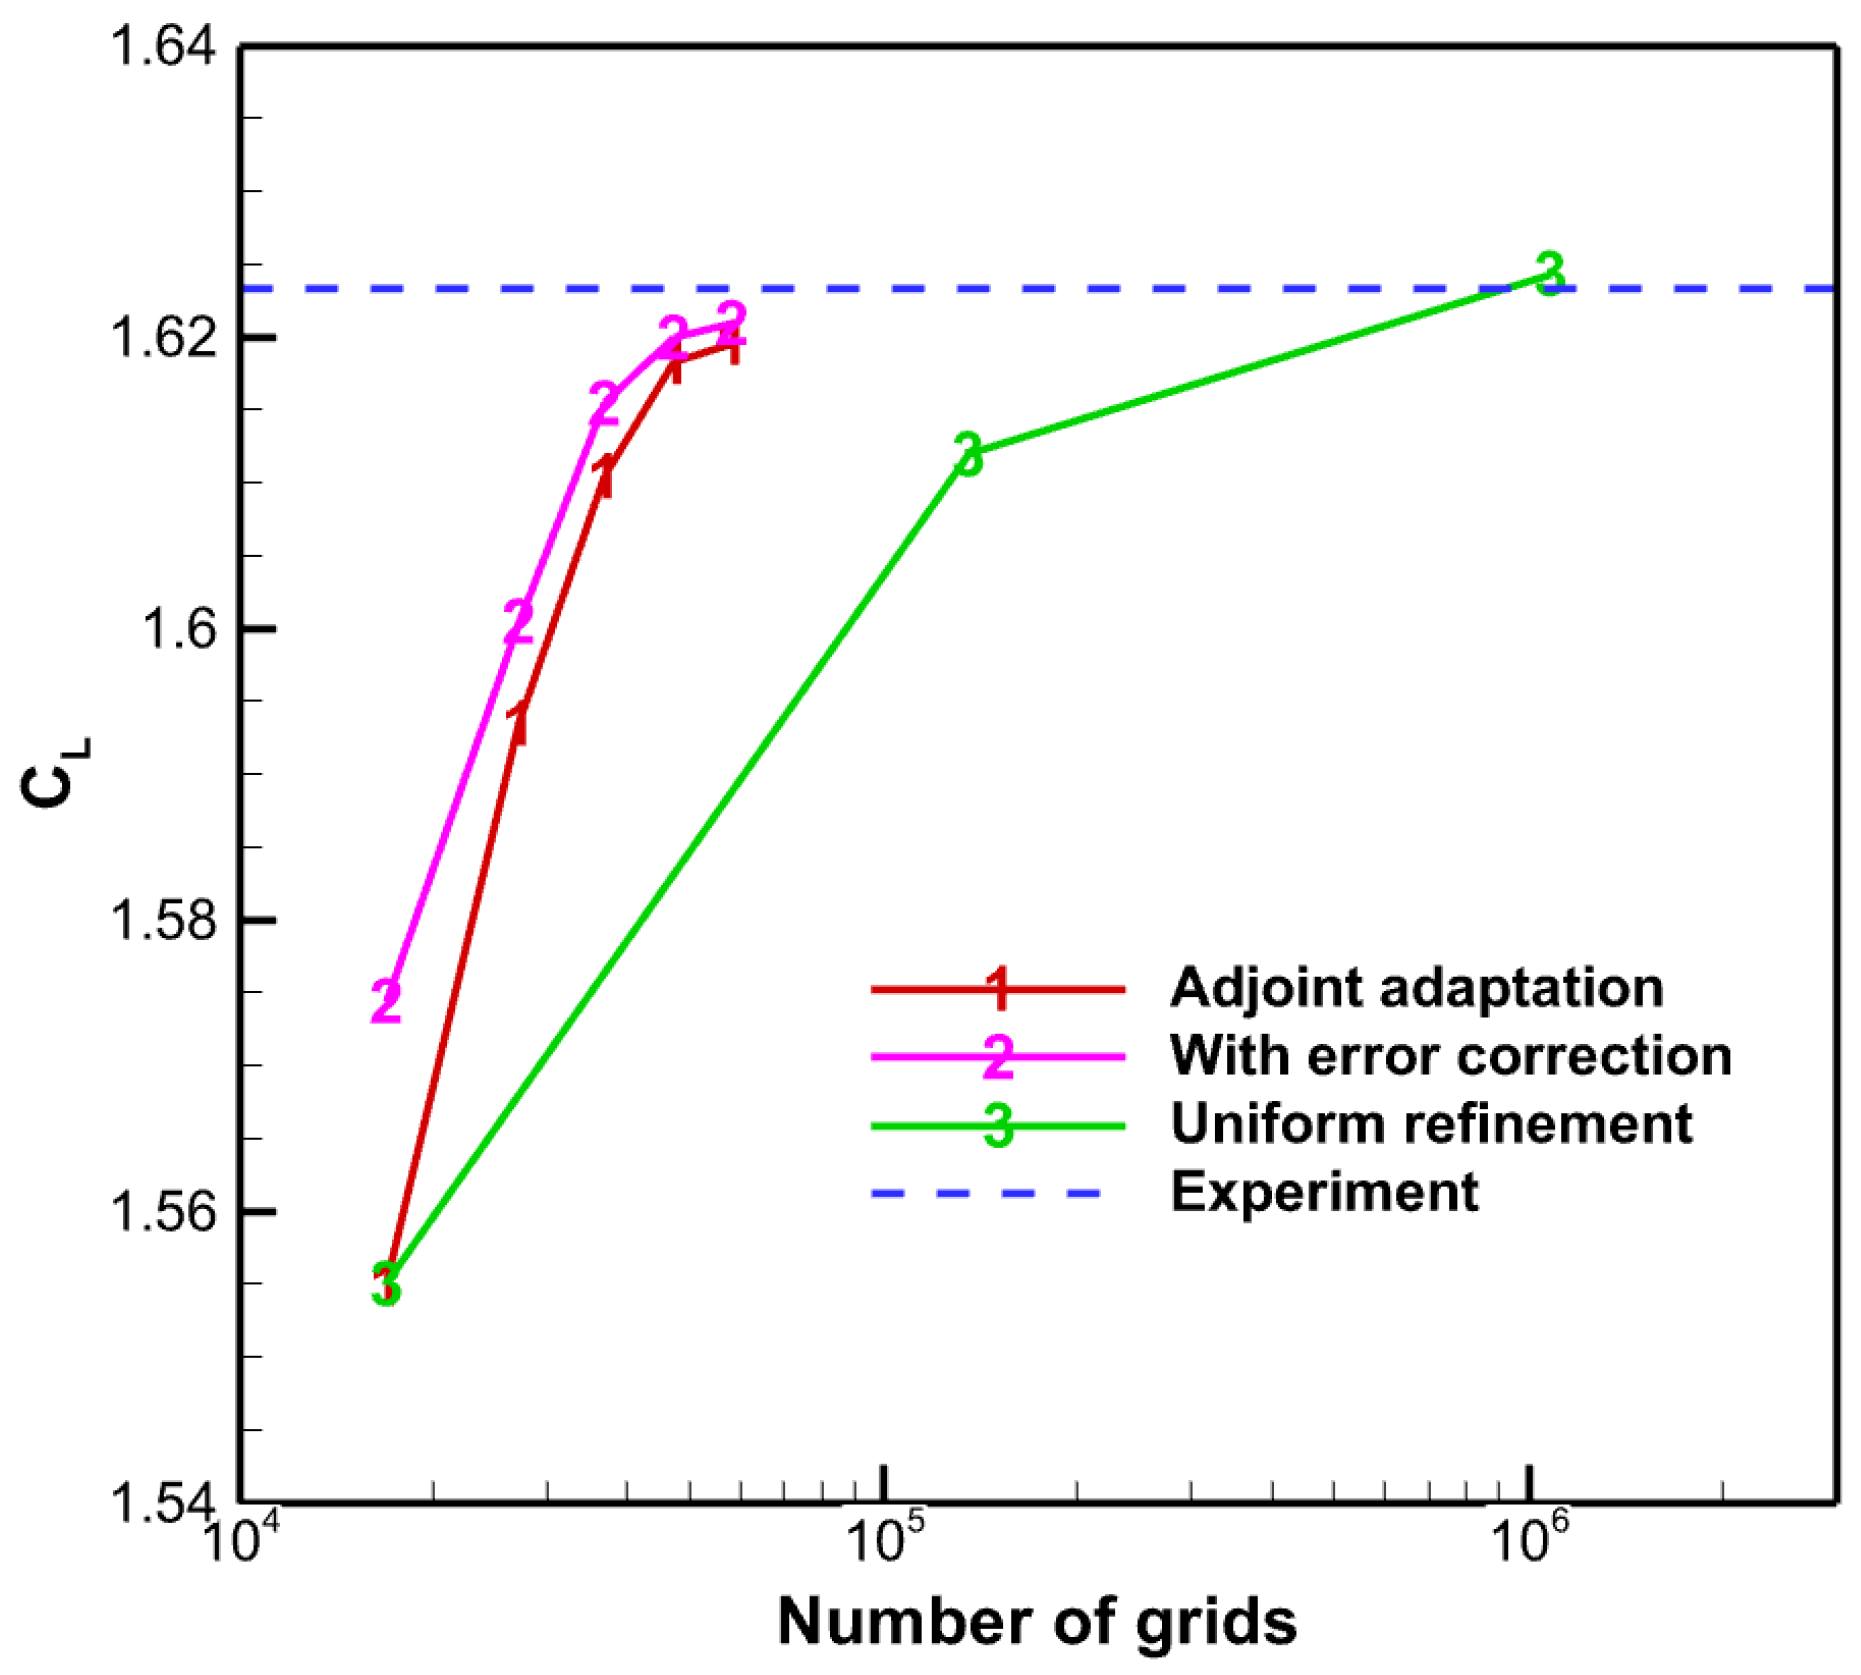
Figure 26 shows the evolution of lift during the adaptive iteration process. The initial mesh results deviated significantly from experimental data (4.21% error). After four adaptations, the lift values closely matched experiments (0.30% error). Error correction further reduced discrepancies: the initial mesh showed the highest correction effectiveness (error reduced by 1.19%), while the final adaptation showed minimal correction (drag error reduced by 0.08%). The global refinement method (refining all elements) increased mesh size by 8 times compared to the initial mesh. As shown in Figure 26, the adapted mesh achieved comparable accuracy with approximately an order of magnitude fewer elements (10.81% reduction) than global refinement.
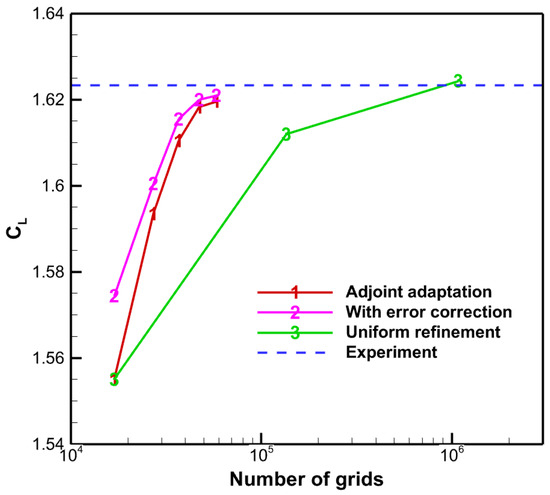
Figure 26.
Lift characteristics from initial mesh computation. (1: Adapted mesh values, red curve; 2: Error-corrected values, pink curve; 3: Globally refined mesh values, green curve).
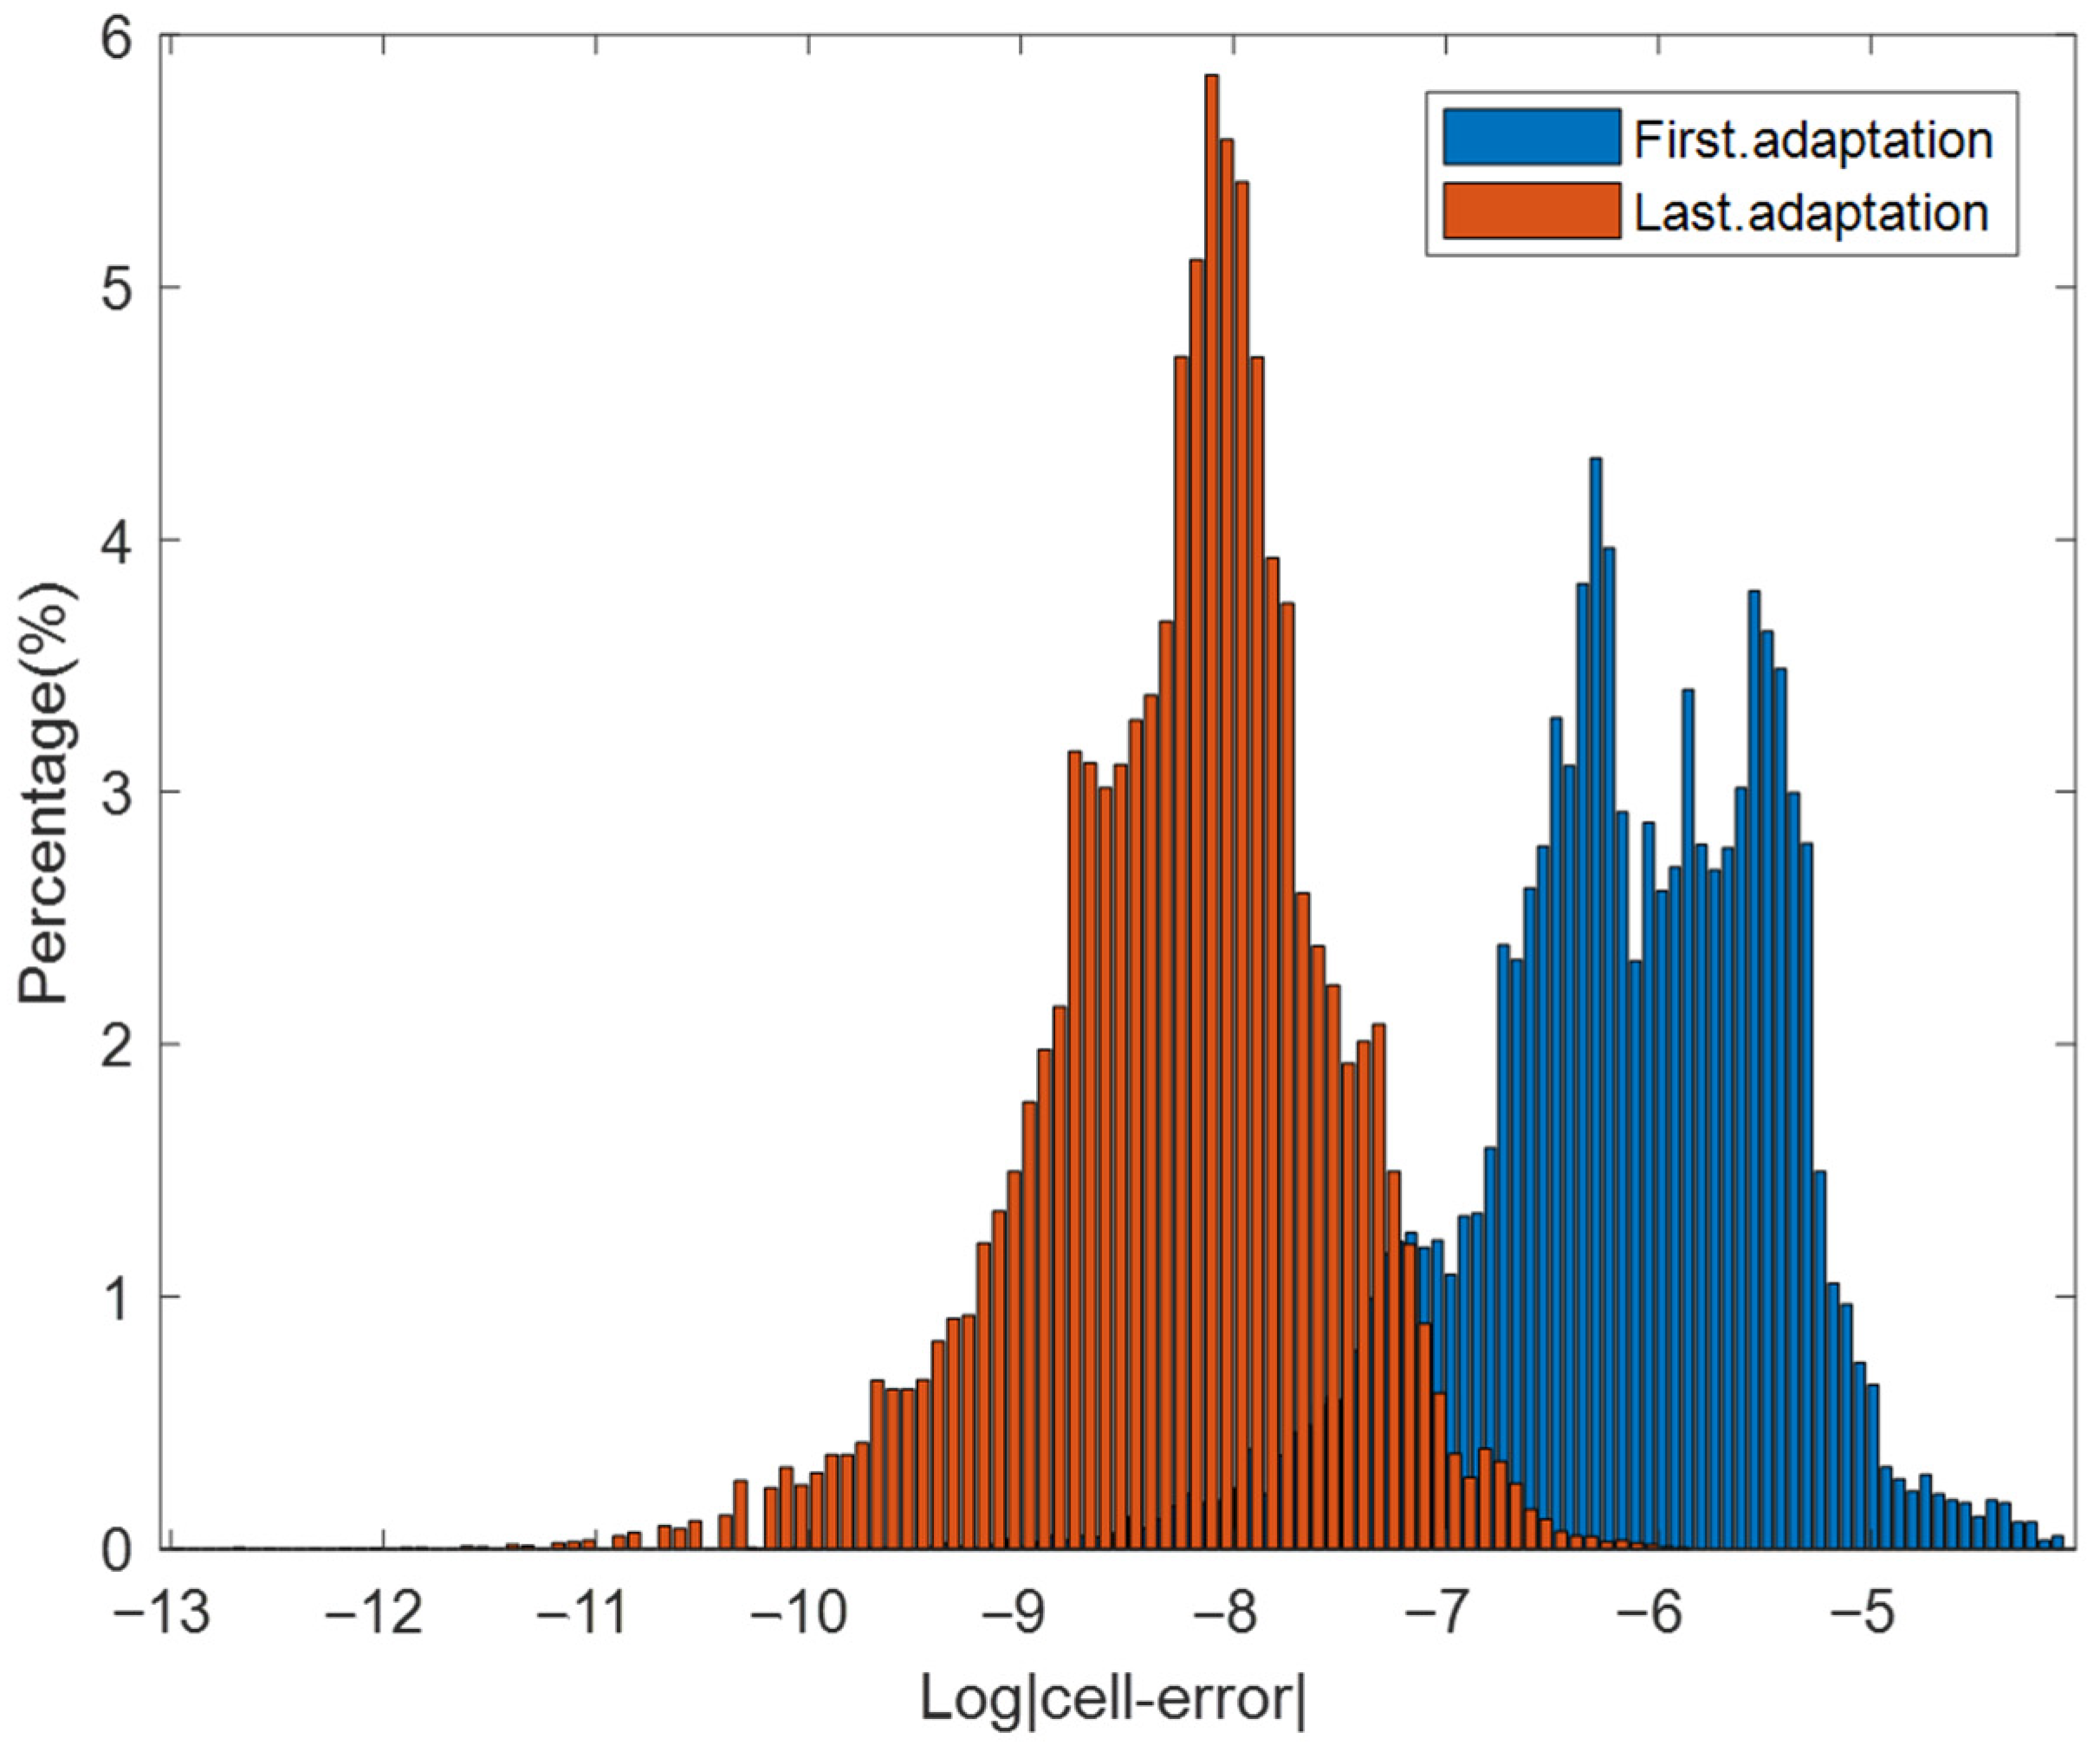
Figure 27 shows the error frequency histogram before and after adaptation, with the horizontal axis representing the logarithm of element error estimates and the vertical axis representing frequency. The histogram shifts left after adaptation, indicating significantly reduced discretization errors. Additionally, the error distribution becomes more concentrated, demonstrating the effectiveness of the adaptation strategy.
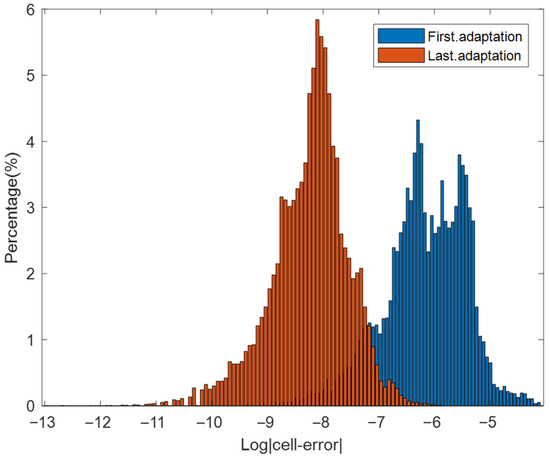
Figure 27.
Error frequency histogram before/after adaptation for NACA0012 airfoil.
4.2. High-Angle-of-Attack Simulation of the CHN-F1 Low-Aspect-Ratio Flying Wing
4.2.1. Model and Mesh Configuration
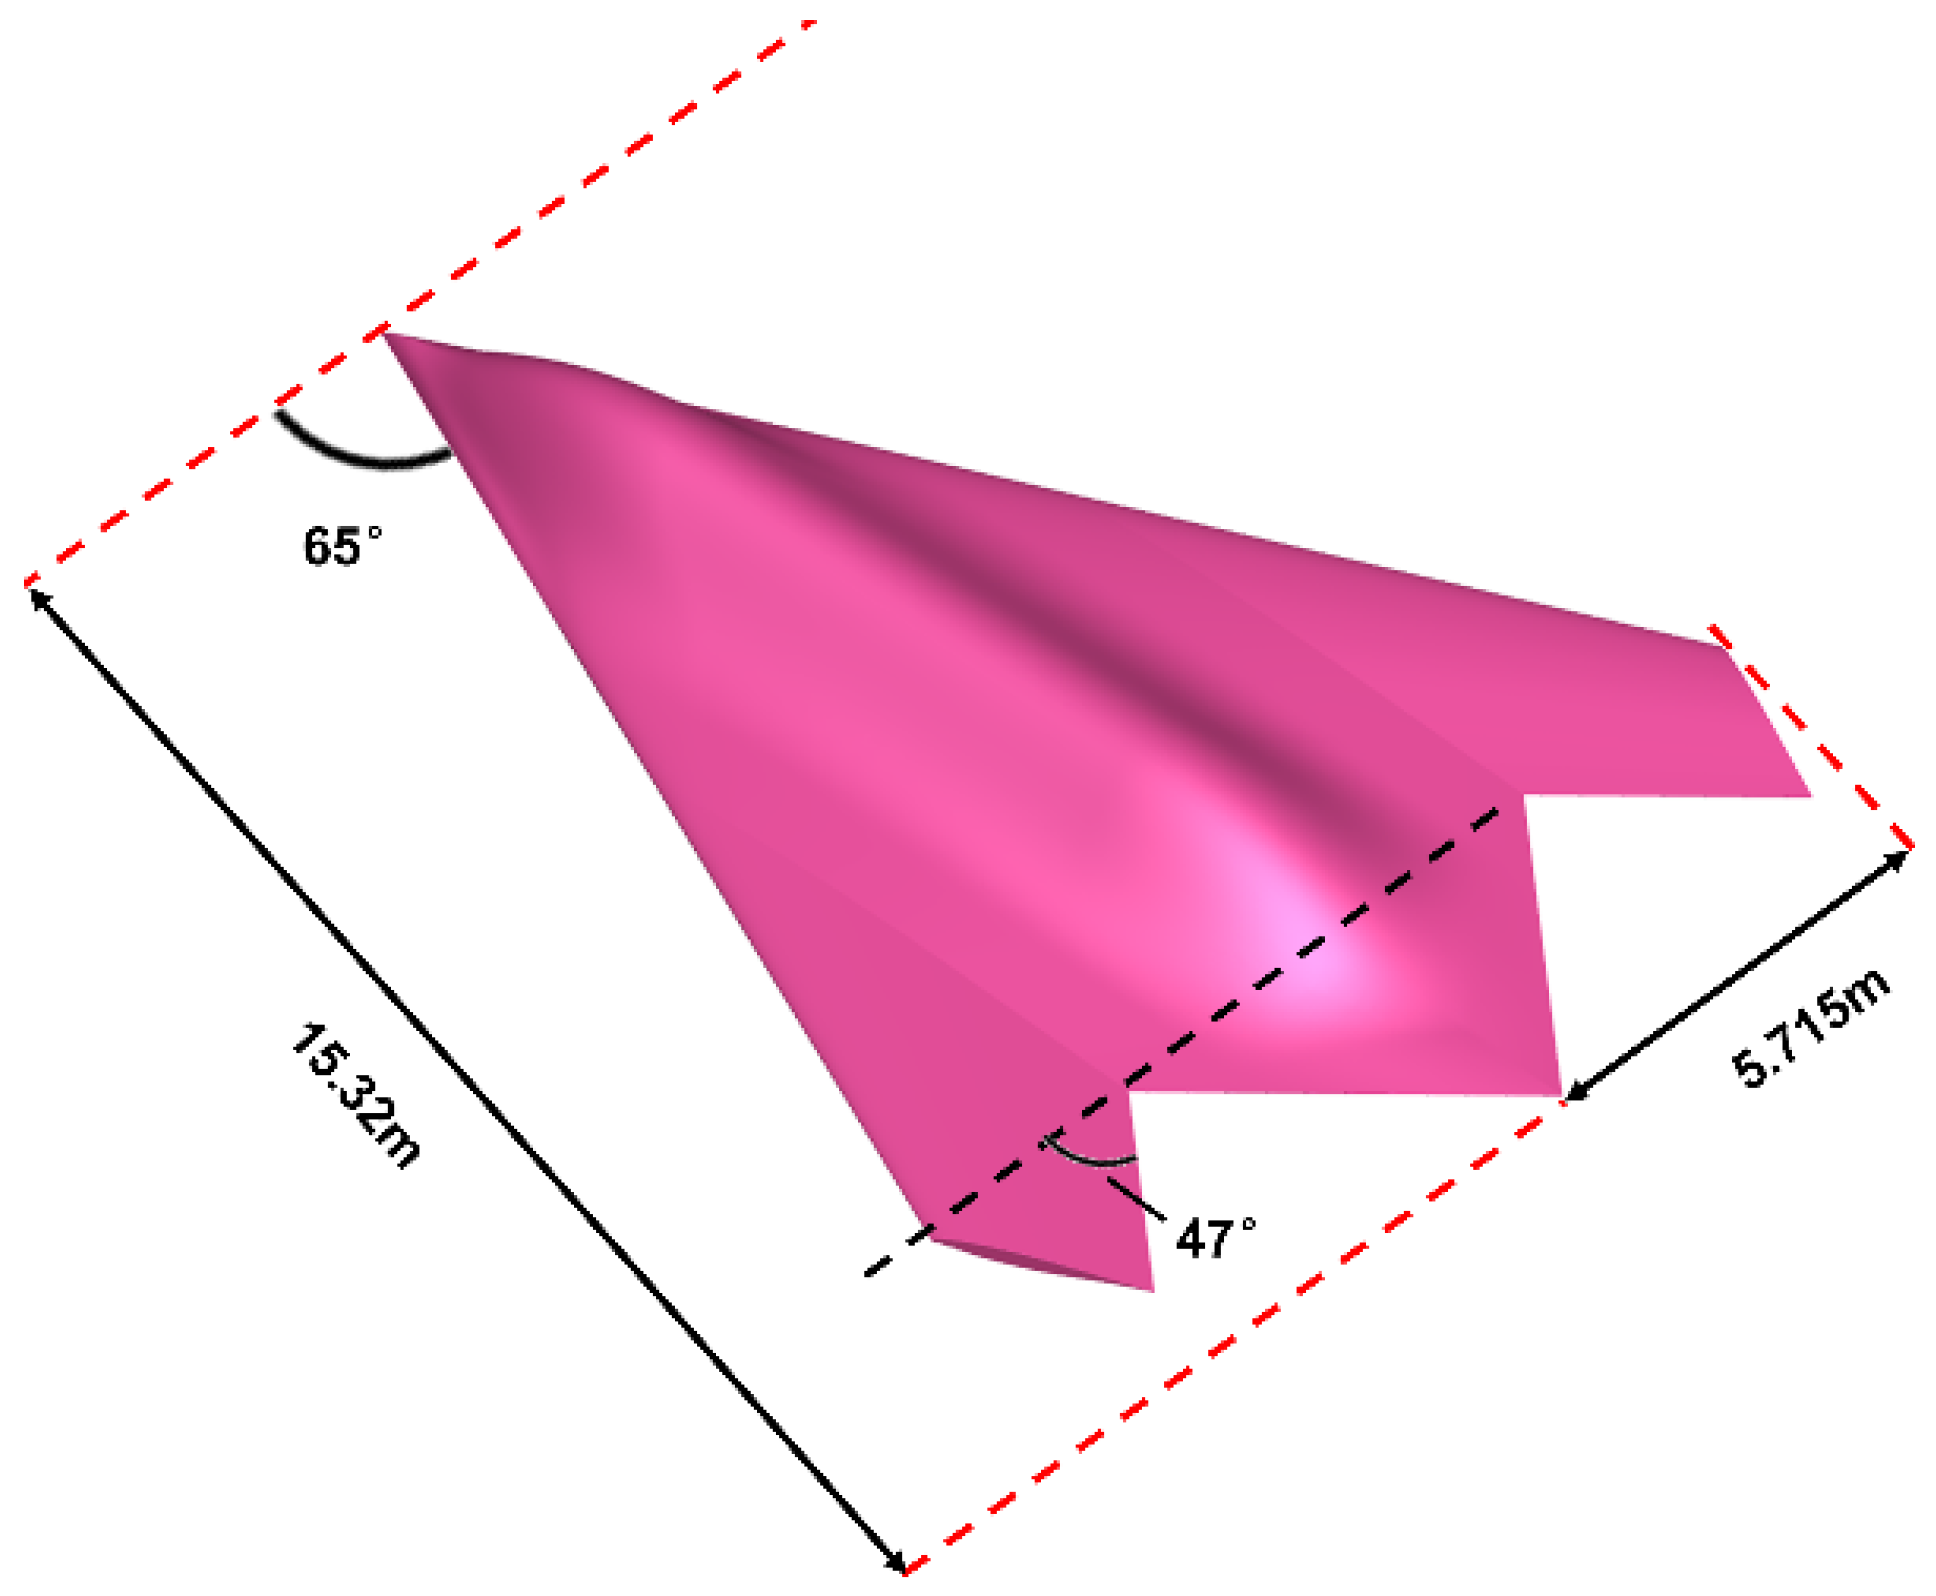
The low-aspect-ratio flying wing configuration integrates the fuselage and wings into a blended body, offering advantages such as excellent stealth characteristics, high lift-to-drag ratio, and superior aerodynamic efficiency. This design exhibits promising transonic and supersonic performance, making it a critical development direction for advanced high-speed aircraft. The China Aerodynamics Research and Development Center designed the CHN-F1 low-aspect-ratio flying wing model as a universal research platform for this configuration [29,30]. Its geometric layout is shown in Figure 28, with detailed parameters provided in Table 2. The CHN-F1 configuration possesses extensive wind tunnel experimental data and numerical simulation results. This section employs an adjoint-error-estimation-based mesh adaptation method to investigate its deep stall characteristics at high angles of attack.
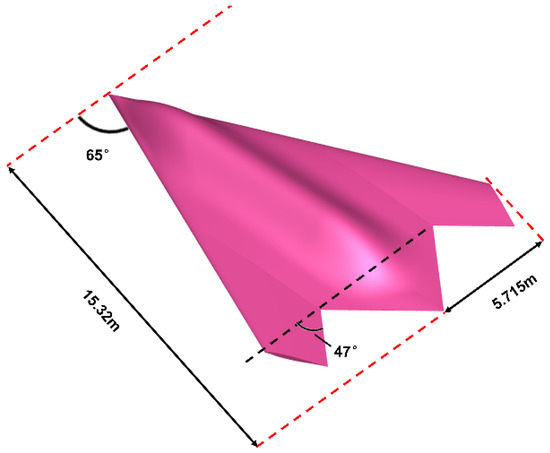
Figure 28.
Geometric configuration of the CHN-F1 low-aspect-ratio flying wing [18]. Reproduced with permission from Cui et al., Aerospace 2022, 9, 526. Licensee MDPI, Basel, Switzerland.

Table 2.
Main Geometric Parameters of the CHN-F1 Low-Aspect-Ratio Flying Wing.
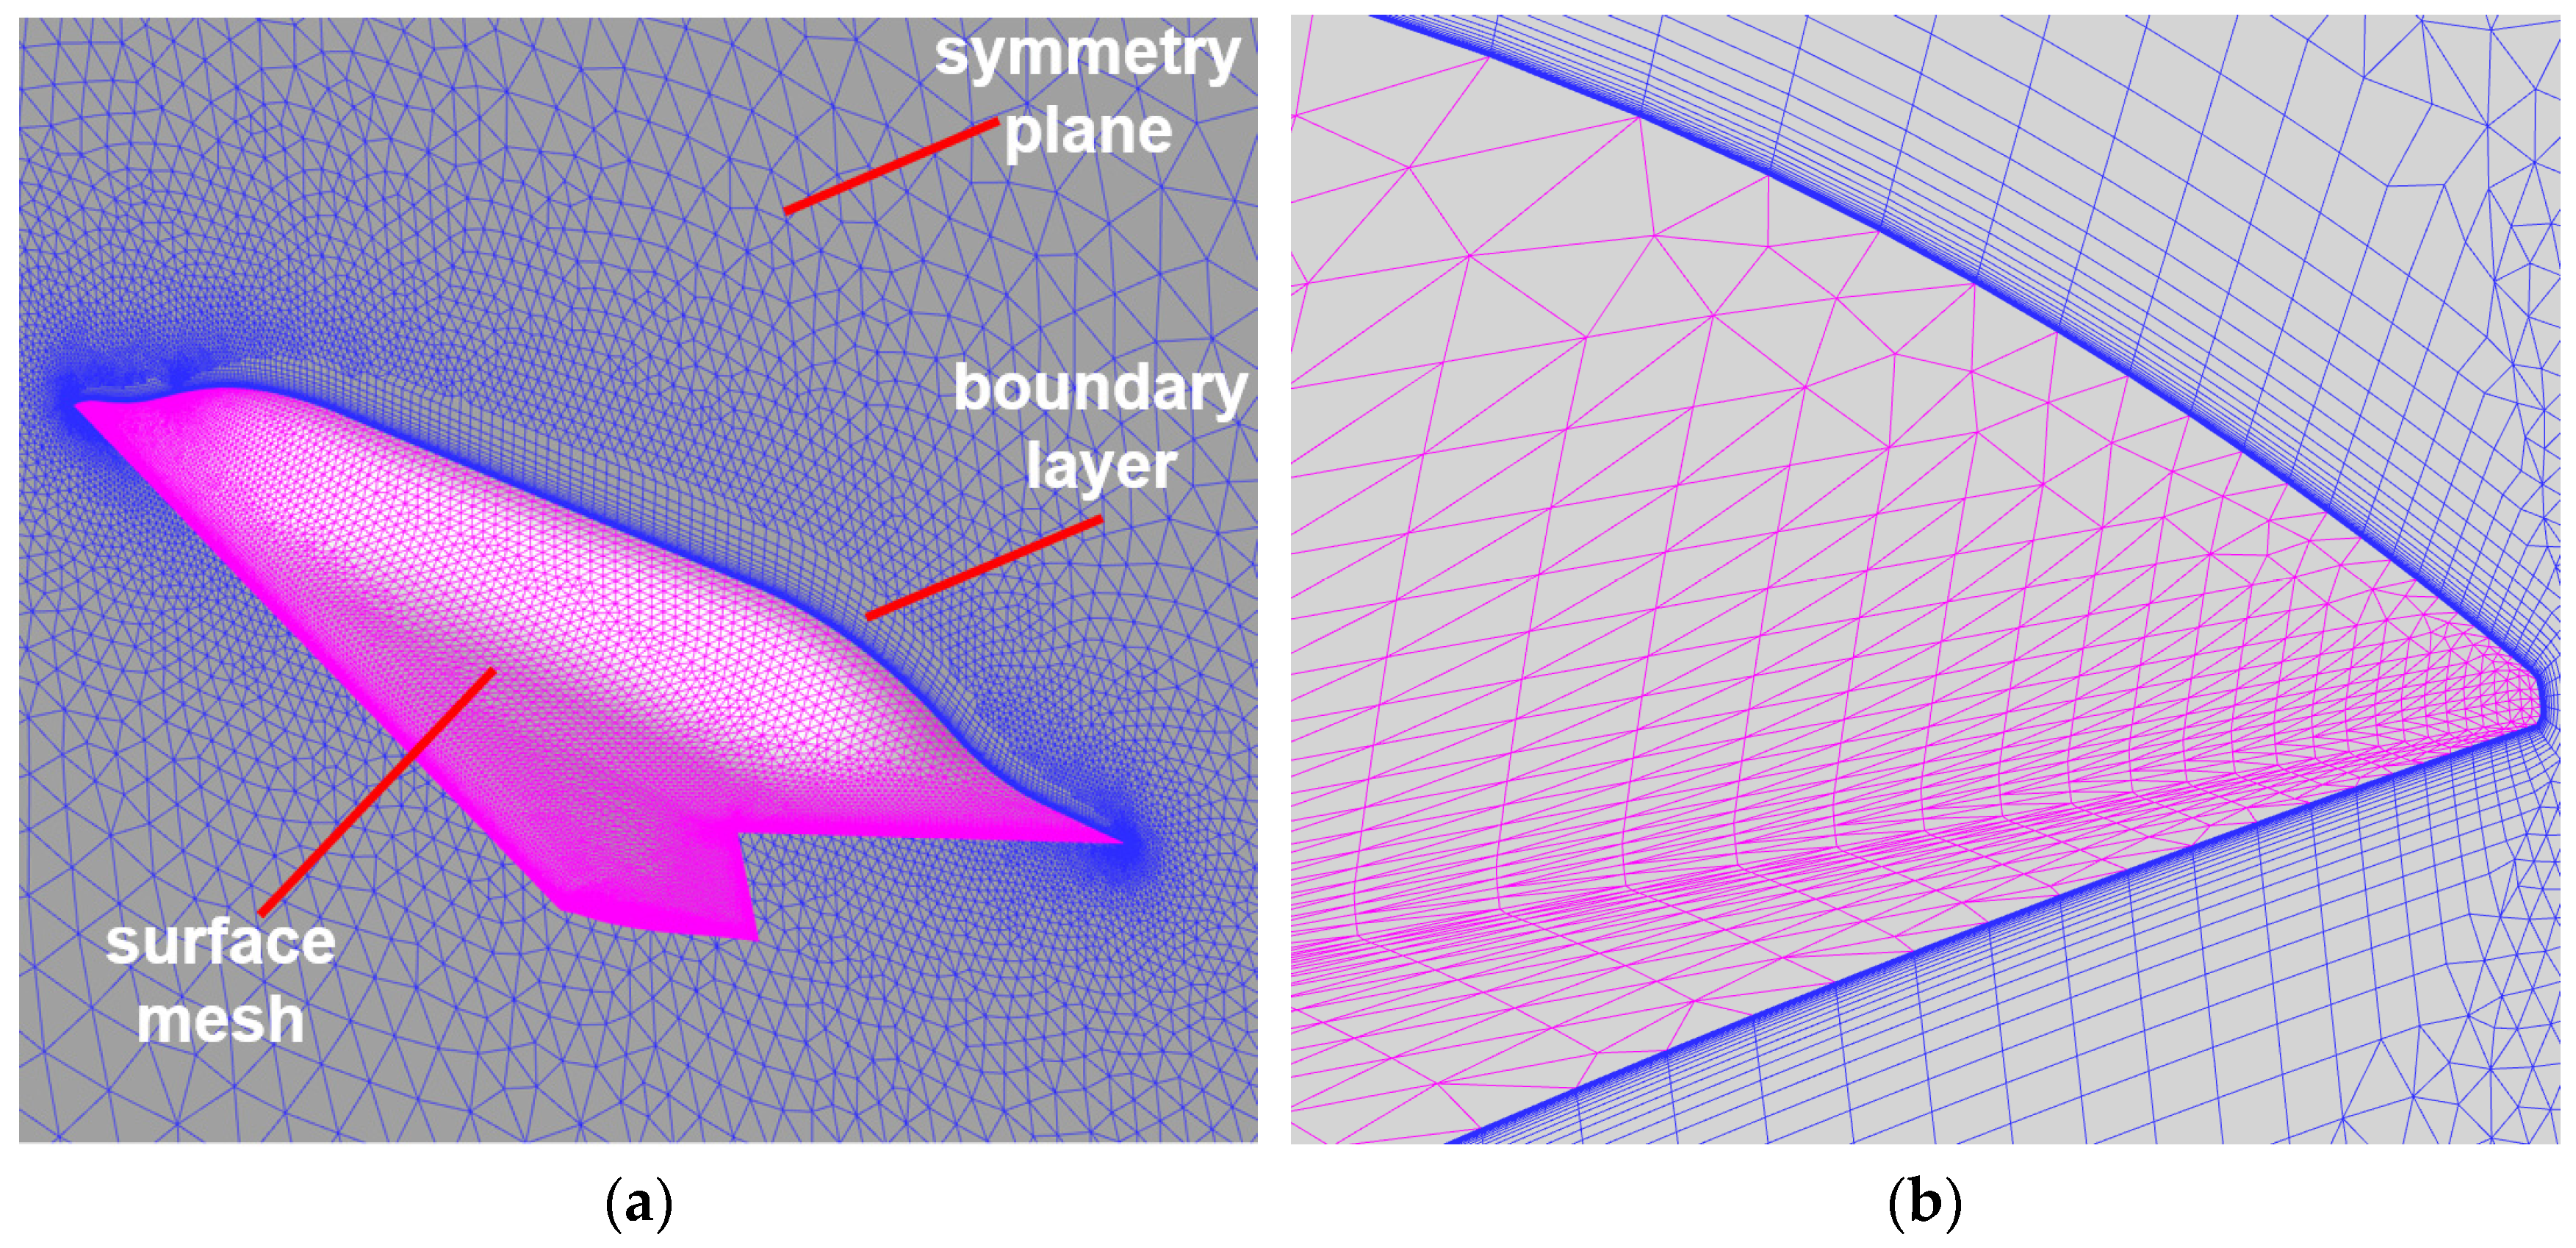
The initial mesh is a half-model unstructured hybrid grid (Figure 29), featuring anisotropic elements at the wing leading and trailing edges, layered structured elements (hexahedra/prisms) near the wall surfaces, and pyramidal/tetrahedral elements elsewhere. The total mesh size is approximately 3.65 million elements, with 24,923 elements on the upper wing surface. The first-layer grid height is 0.02 mm (y+ ≈ 3.5), with a boundary layer growth ratio of 1.25. Simulations cover an angle of attack (AOA) range of 0°~52° using the Shear Stress Transport (SST) turbulence model. Other parameters are summarized in Table 3.
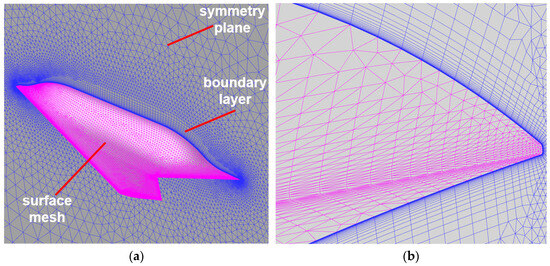
Figure 29.
Initial mesh for CHN-F1 flying wing: (a) Surface and symmetry plane mesh; (b) Anisotropic mesh at wing leading edge.

Table 3.
Computational Parameters for CHN-F1 Flying Wing.
4.2.2. Results of Initial Mesh
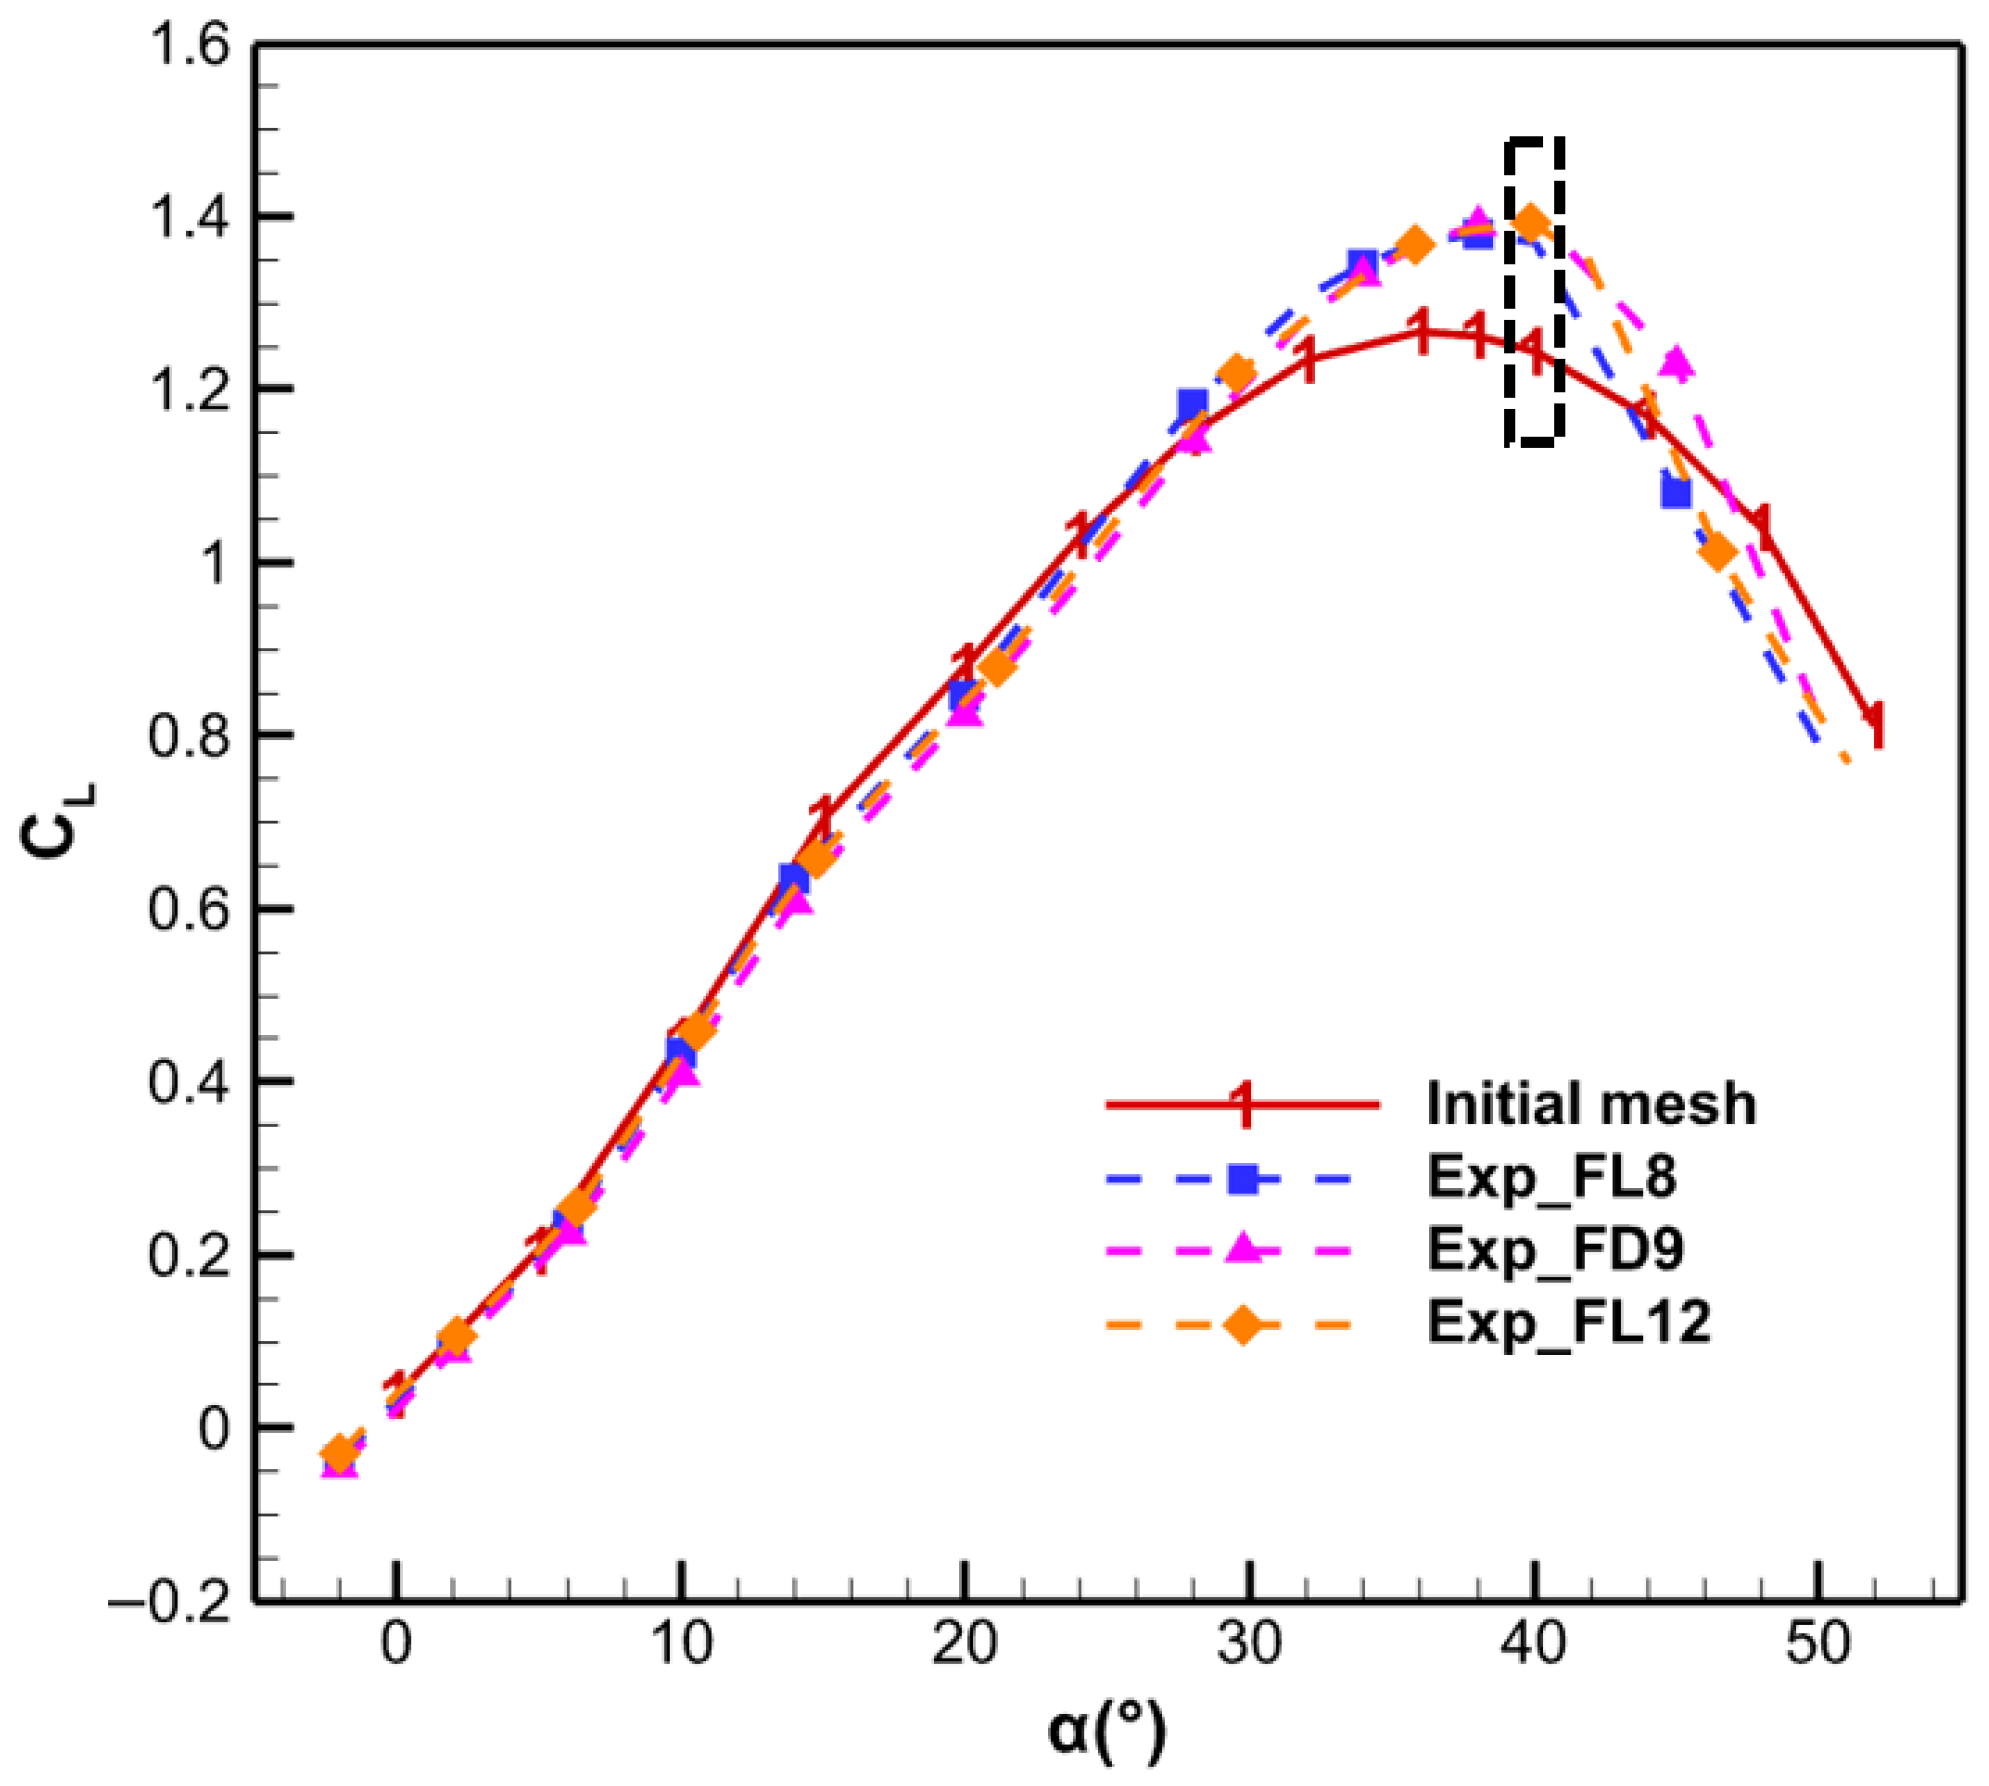
Figure 30 shows the lift characteristics curve of the CHN-F1 configuration obtained from the initial mesh computation, with experimental data derived from three different wind tunnel facilities: FL8, FD9, and FL12. In the linear lift region, numerical results demonstrate good agreement with experimental measurements. However, significant discrepancies emerge near the stall angle: while wind tunnel tests indicate a stall angle of approximately 40°, the initial mesh computation predicts premature stall at about 36°. At a 40° angle of attack, the maximum discrepancy in lift coefficient reaches 10.05% compared to the average experimental values from the three wind tunnels.
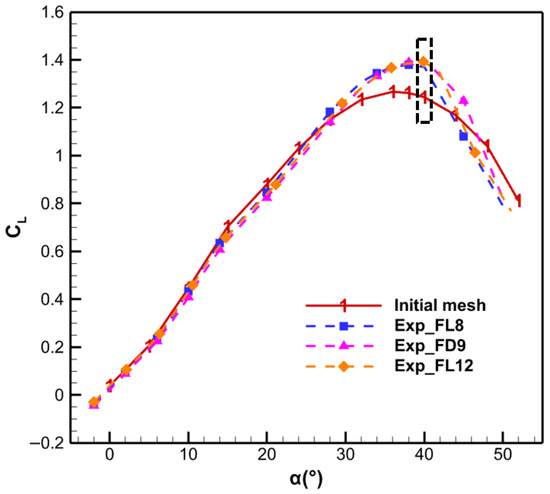
Figure 30.
Lift characteristics curve computed using the initial mesh for CHN-F1.
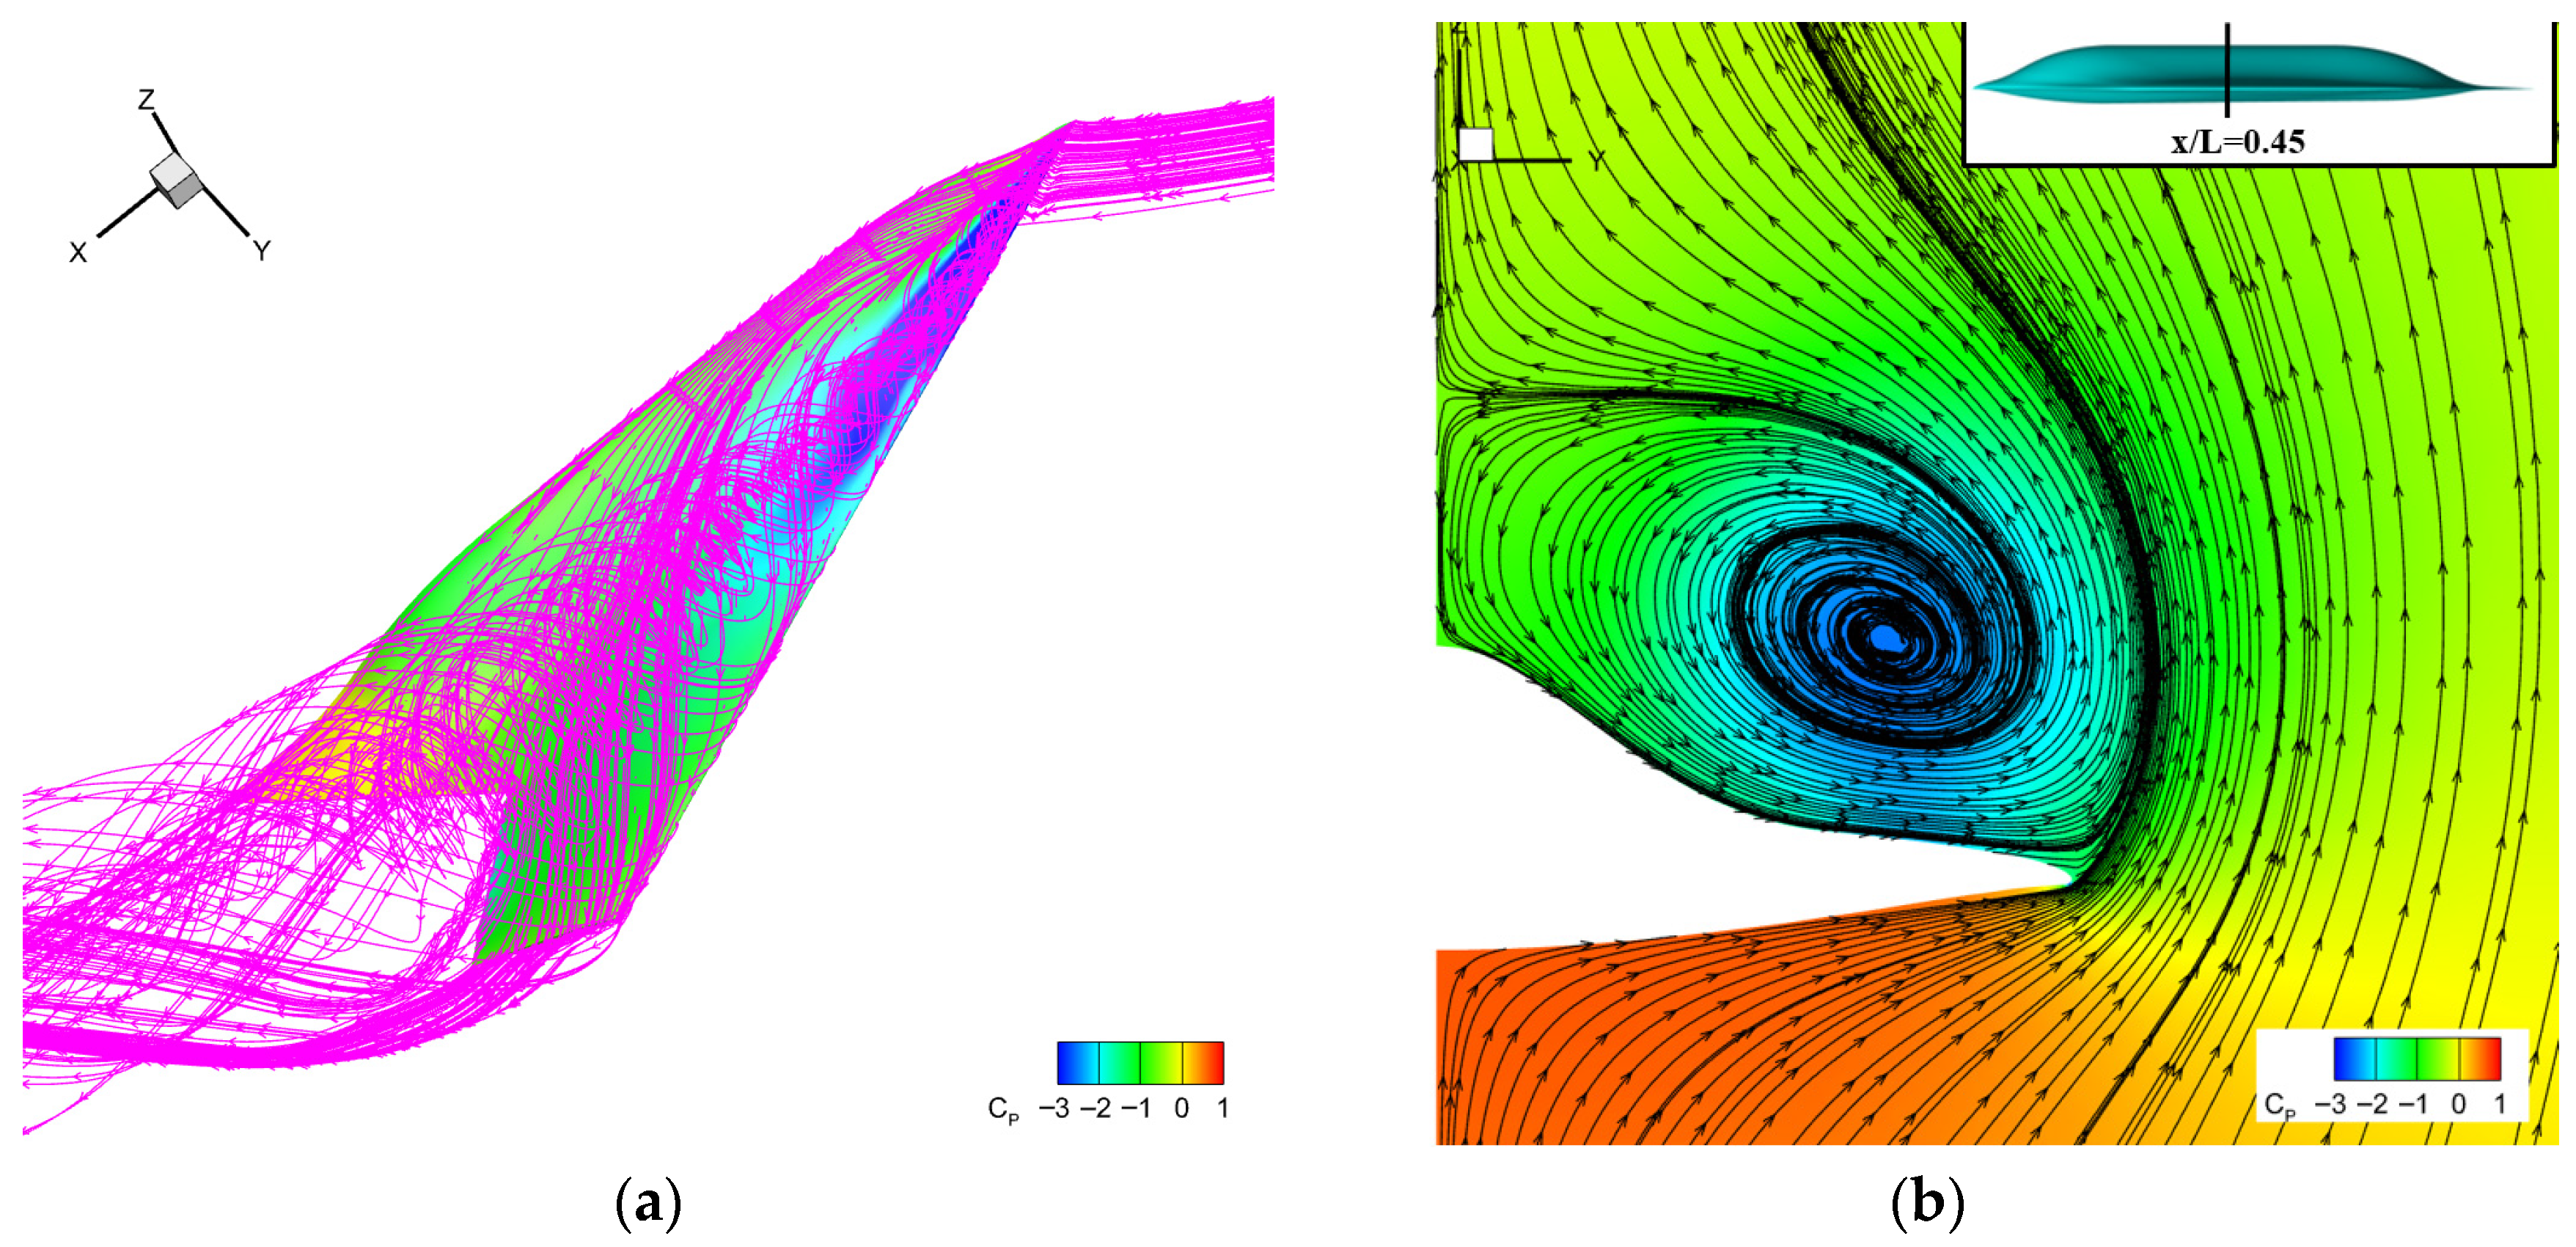
Figure 31 presents the flow field characteristics of the CHN-F1 low-aspect-ratio flying wing at 40° angle of attack computed with the initial mesh. Under high-angle conditions, strong three-dimensional wingtip vortex structures develop, creating low-pressure regions near the vortex cores on the upper wing surface that enhance lift generation. The side view of spatial streamlines reveals that the wingtip vortex remains attached to the upper fuselage surface near the nose region, forming an extensive low-pressure zone. As the vortex develops downstream, its core gradually separates from the fuselage, resulting in relatively higher-pressure regions near the tail section.
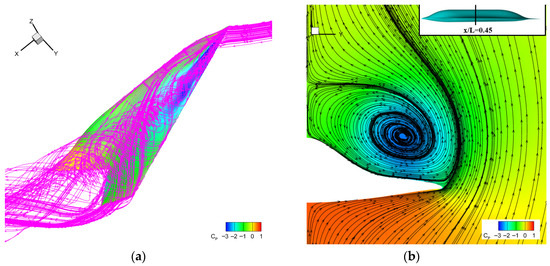
Figure 31.
Flow field characteristics of CHN-F1 low-aspect-ratio flying wing at 40° angle of attack: (a) Surface pressure distribution and spatial streamlines; (b) Streamline distribution at x/L = 0.45 cross-section.
4.2.3. Error Estimation Based on Adjoint Theory
Figure 30 reveals significant discrepancies between the lift coefficients computed from the initial mesh and wind tunnel experiments for the CHN-F1 configuration at high angles of attack. Therefore, this study conducts adjoint-based error estimation and mesh adaptation for the 20°~52° high-AOA range, with lift set as the objective function. The 40° angle of attack case is detailed as an example.
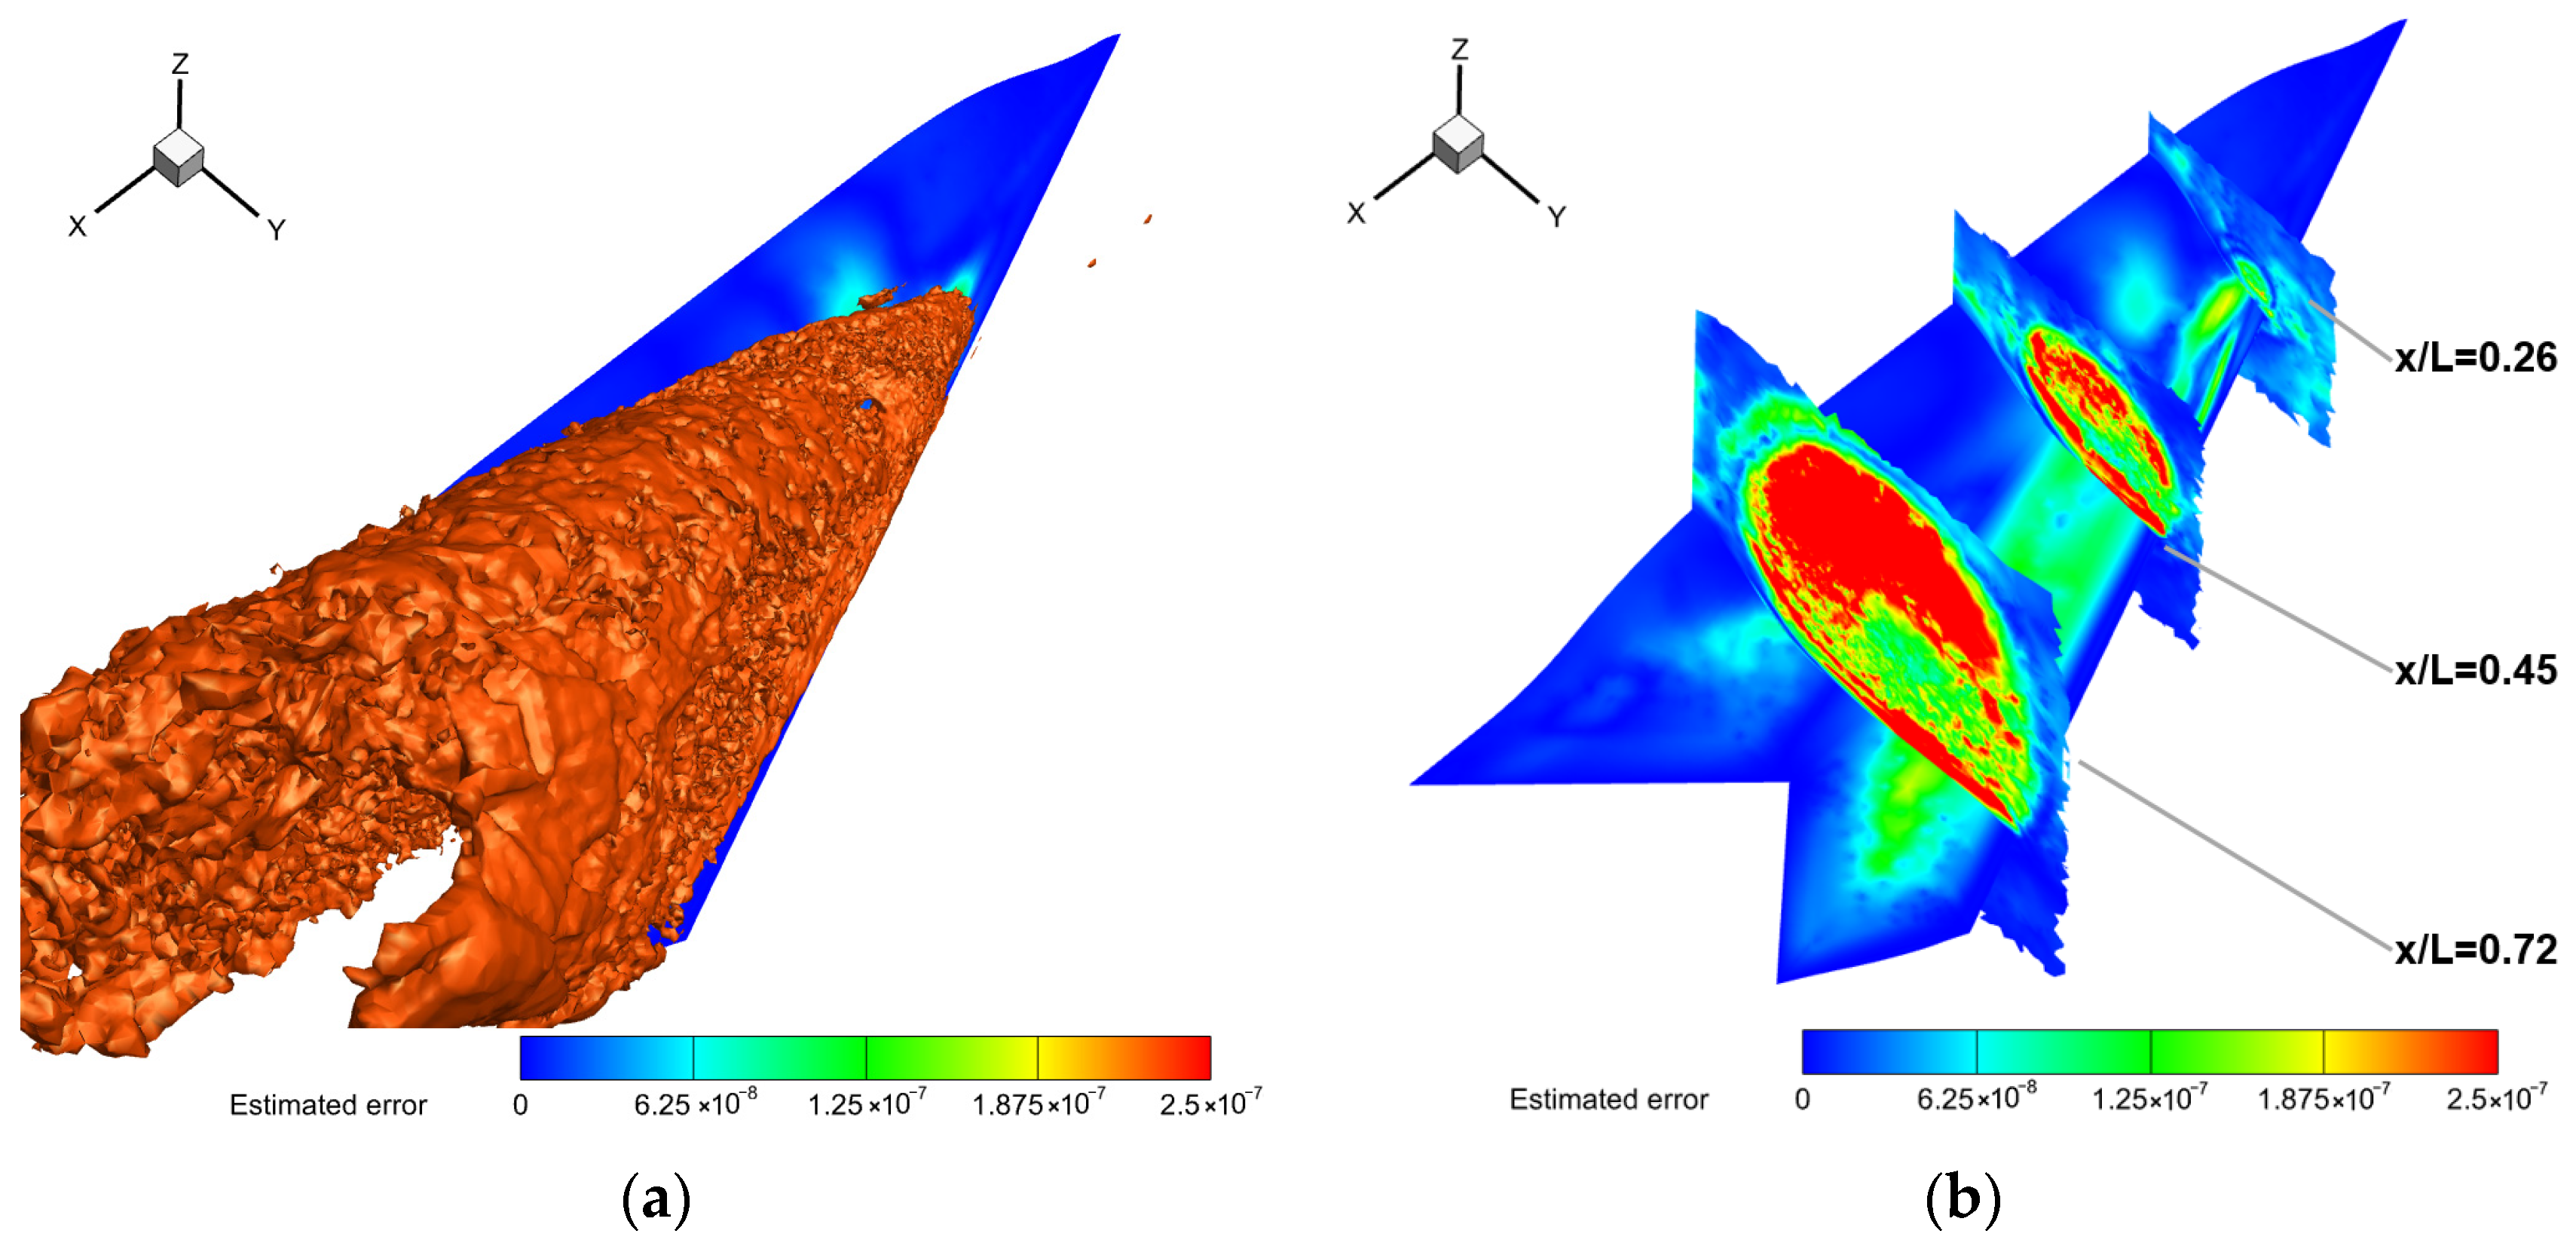
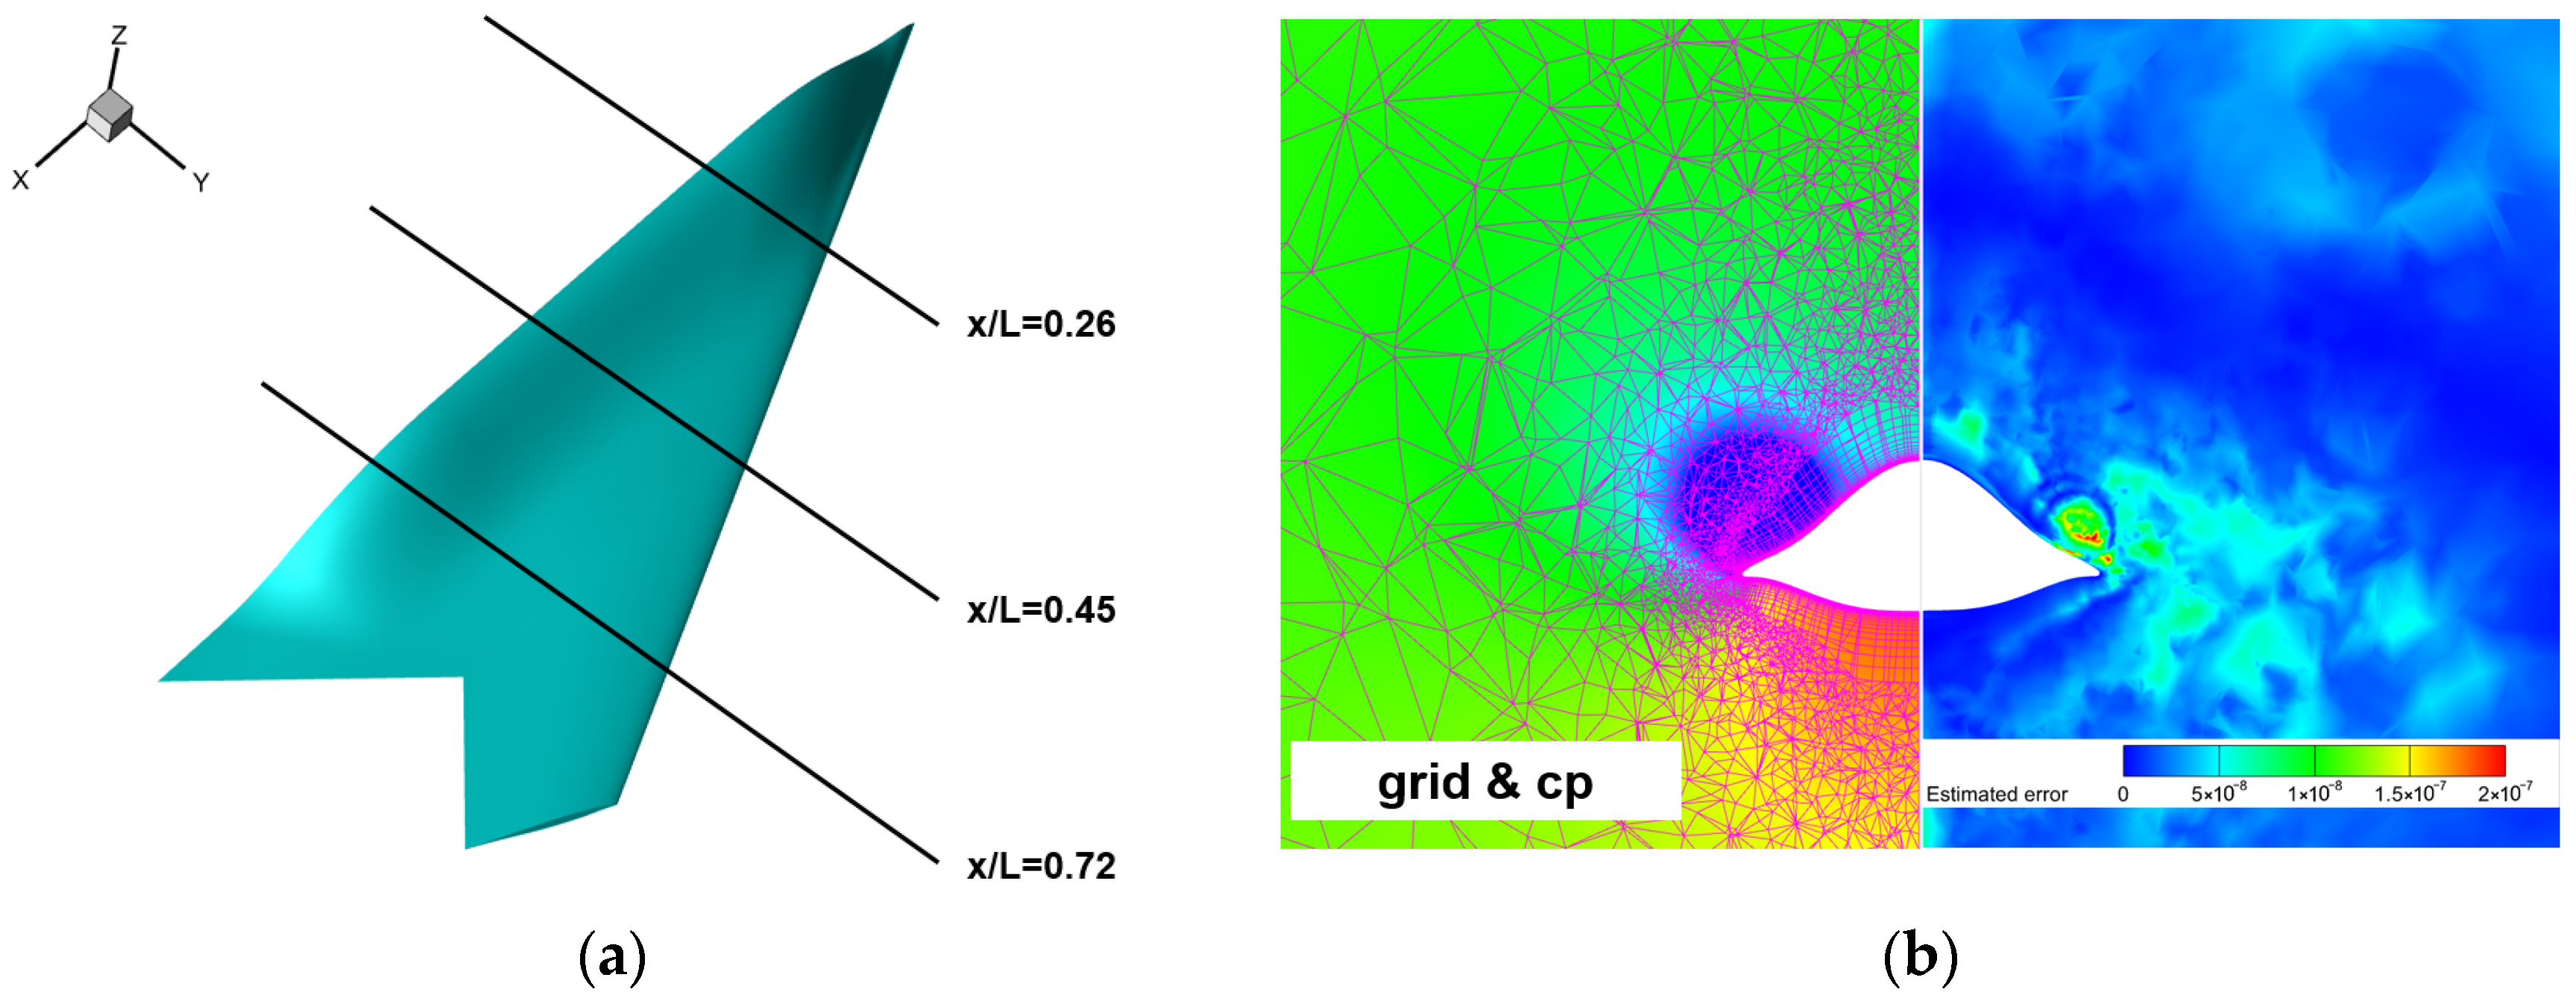
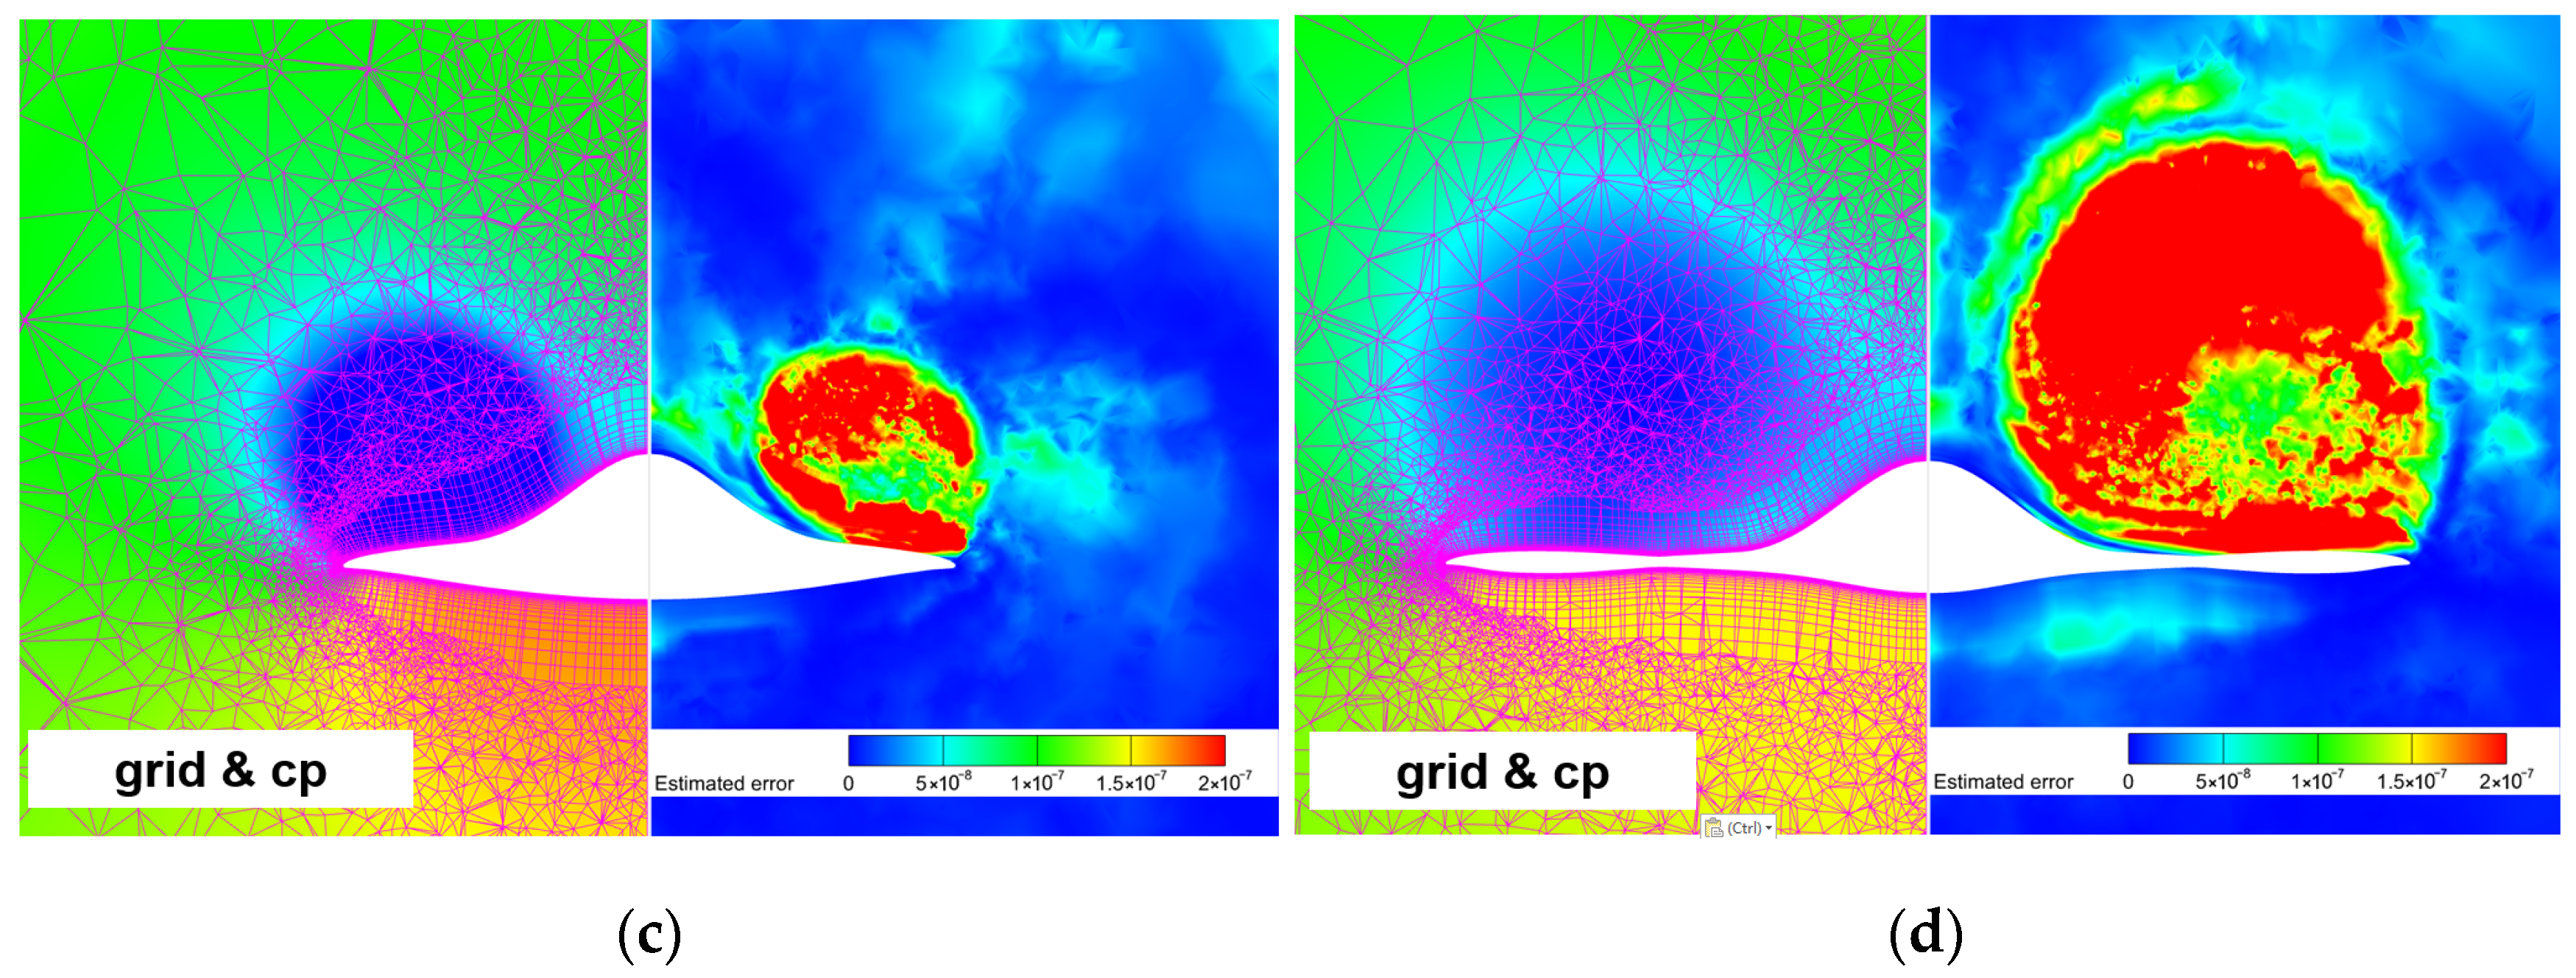
Figure 32 presents the spatial discretization error distribution at a 40° angle of attack for the initial mesh, including error iso-surfaces and typical cross-sectional error profiles. Figure 33 shows the pressure and mesh distribution for representative cross-sections. Comparative analysis with the flow field in Figure 31 indicates that regions with high discretization errors primarily coincide with wingtip vortices and their surrounding areas, including local boundary layer zones on the fuselage leeward side. Examination of spatial mesh distributions in typical sections (Figure 33) confirms insufficient resolution in wingtip vortex regions. Additionally, the relatively high first-layer mesh height (y+ ≈ 3.5) results in substantial discretization errors in leeward-side boundary layer regions, inadequate for accurately capturing wingtip vortex separation dynamics.
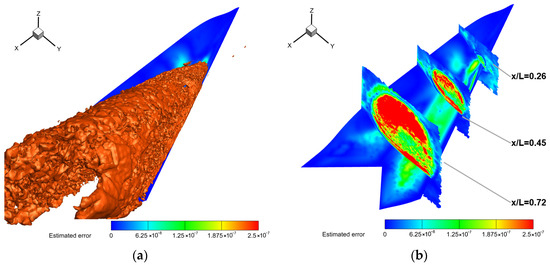
Figure 32.
Spatial discretization error estimation for CHN-F1 low-aspect-ratio flying wing at 40° angle of attack using initial mesh: (a) Iso-surface distribution of spatial error (iso-value = 2.3 × 10⁻⁷); (b) Error distribution in typical cross-sections.
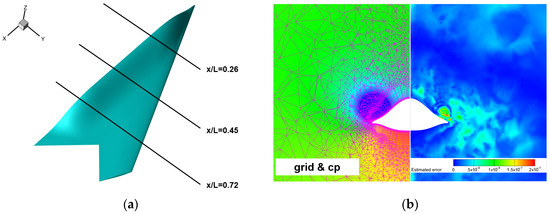
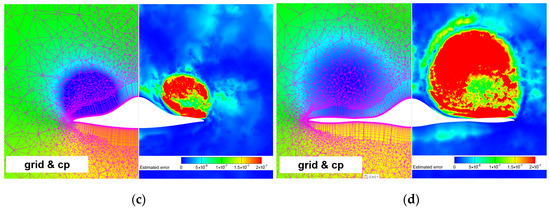
Figure 33.
Error and mesh distribution in typical cross-sections of CHN-F1 low-aspect-ratio flying wing (left: spatial mesh and pressure distribution; right: corresponding spatial discretization error): (a) Schematic of section locations; (b) Mesh and error distribution at x/L = 0.26; (c) Mesh and error distribution at x/L = 0.45; (d) Mesh and error distribution at x/L = 0.72.
4.2.4. Mesh Adaptation Based on Adjoint Error Estimation
The aerodynamic characteristics of the CHN-F1 configuration at high angles of attack were computed using mesh adaptation with lift as the target function, setting the number of adaptation cycles to three.
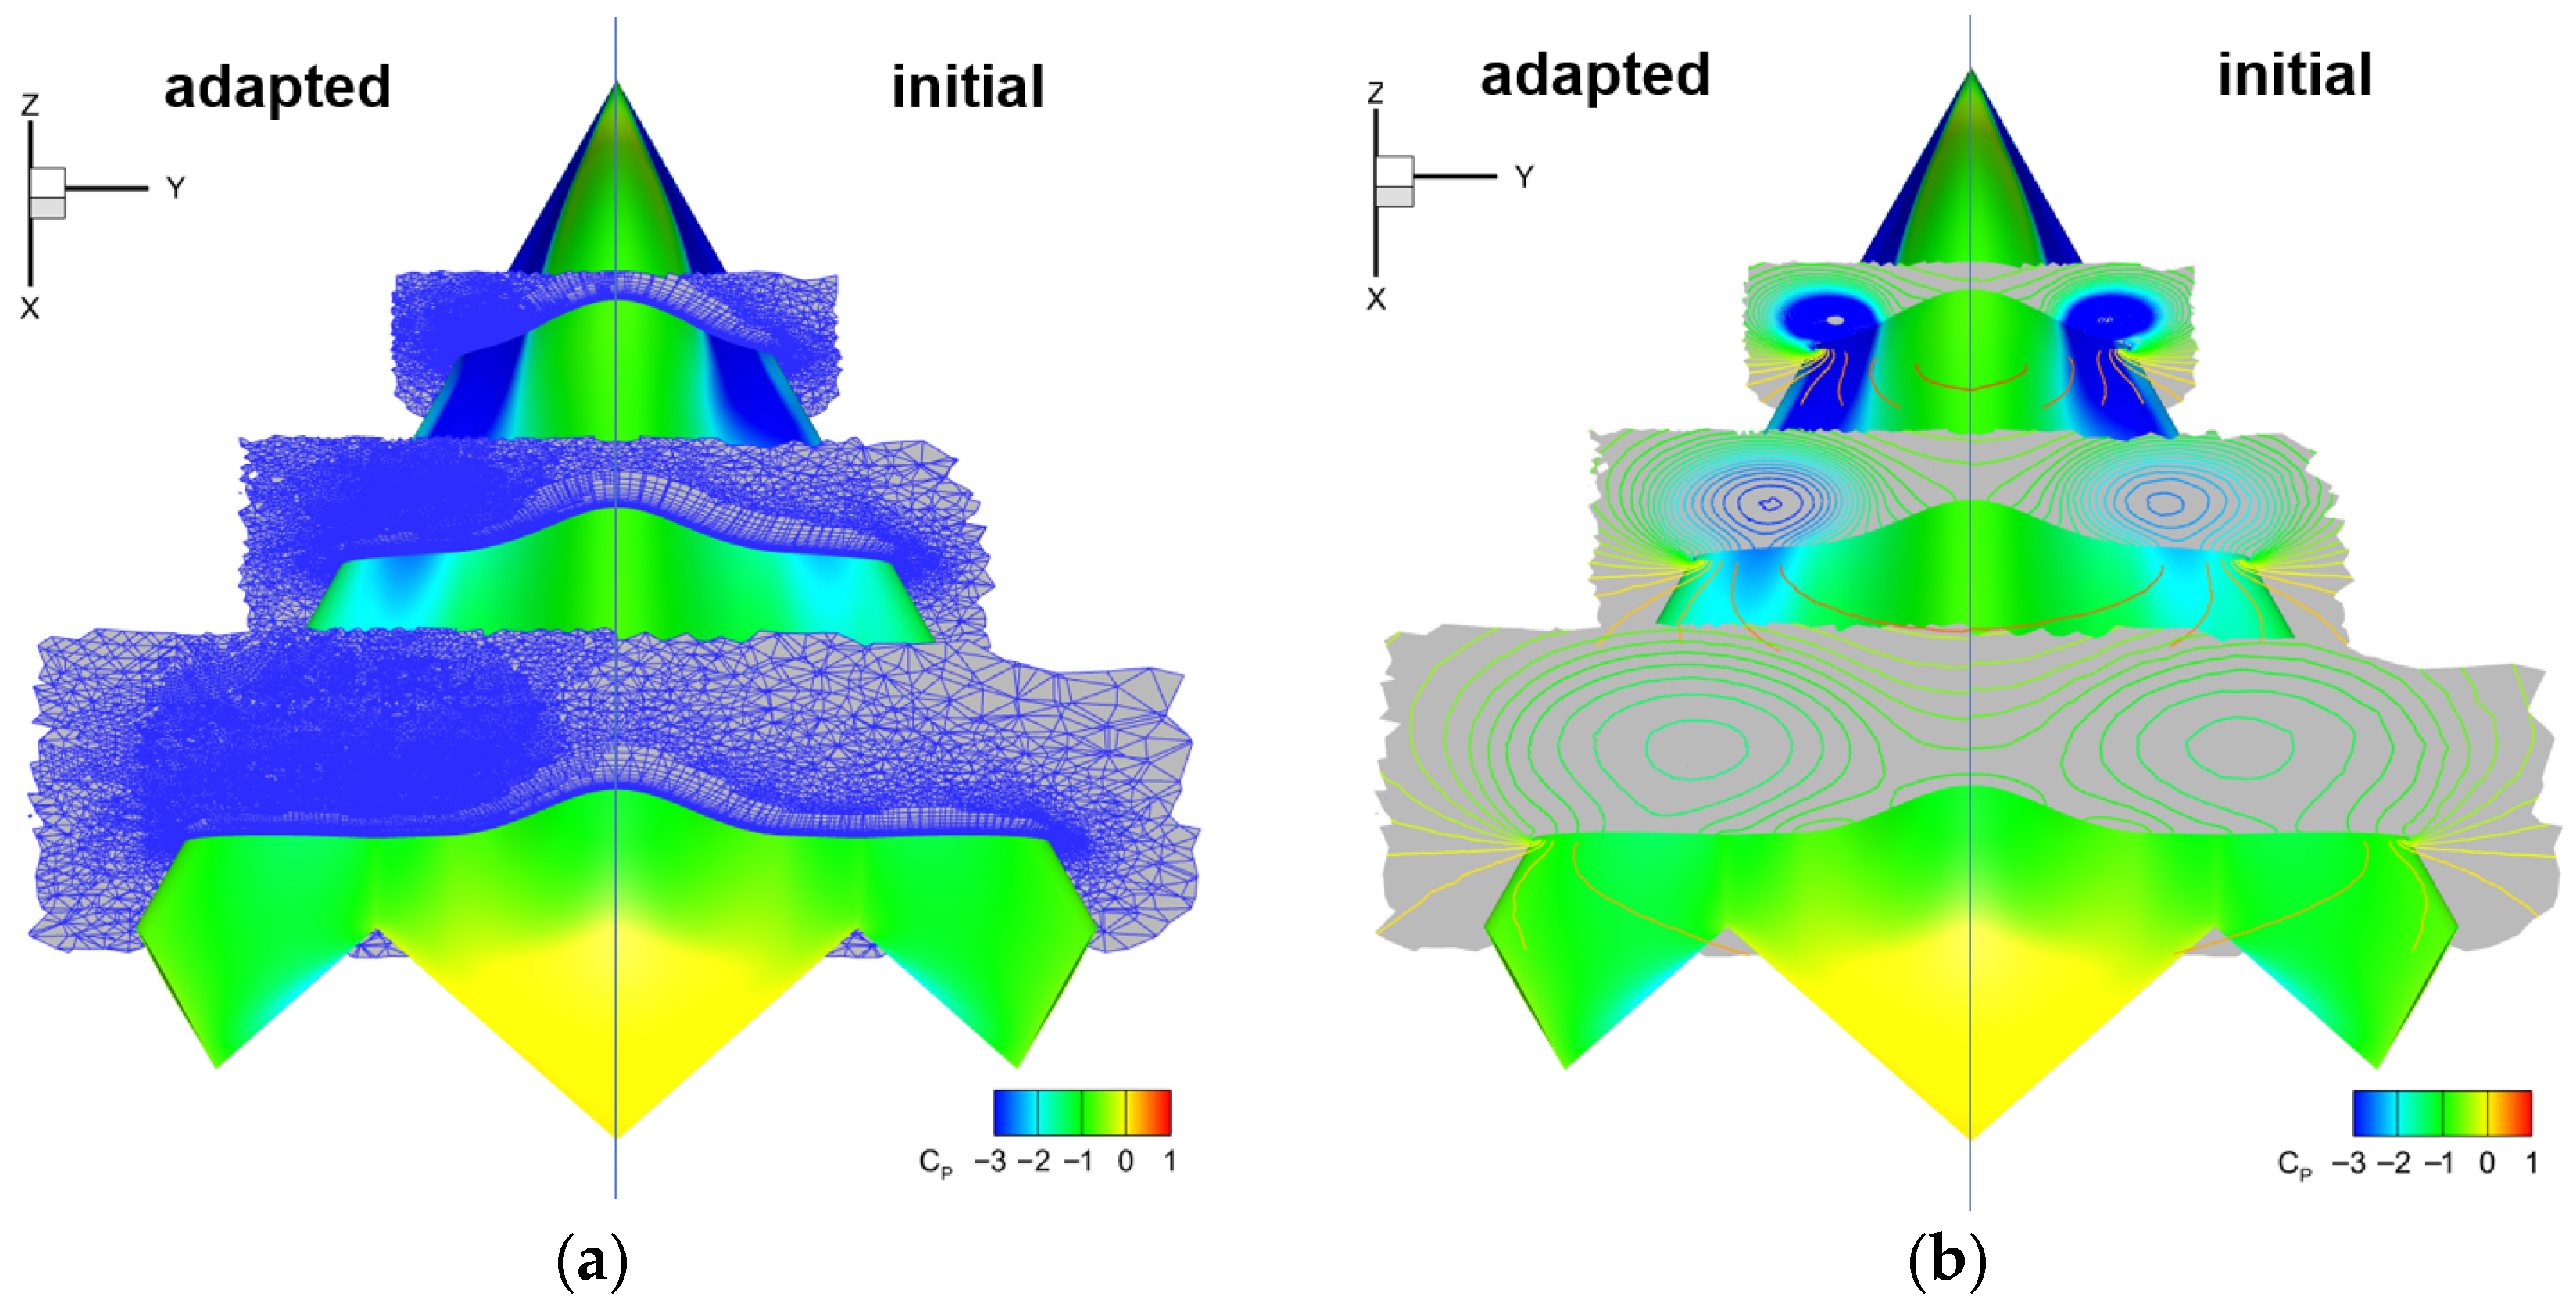
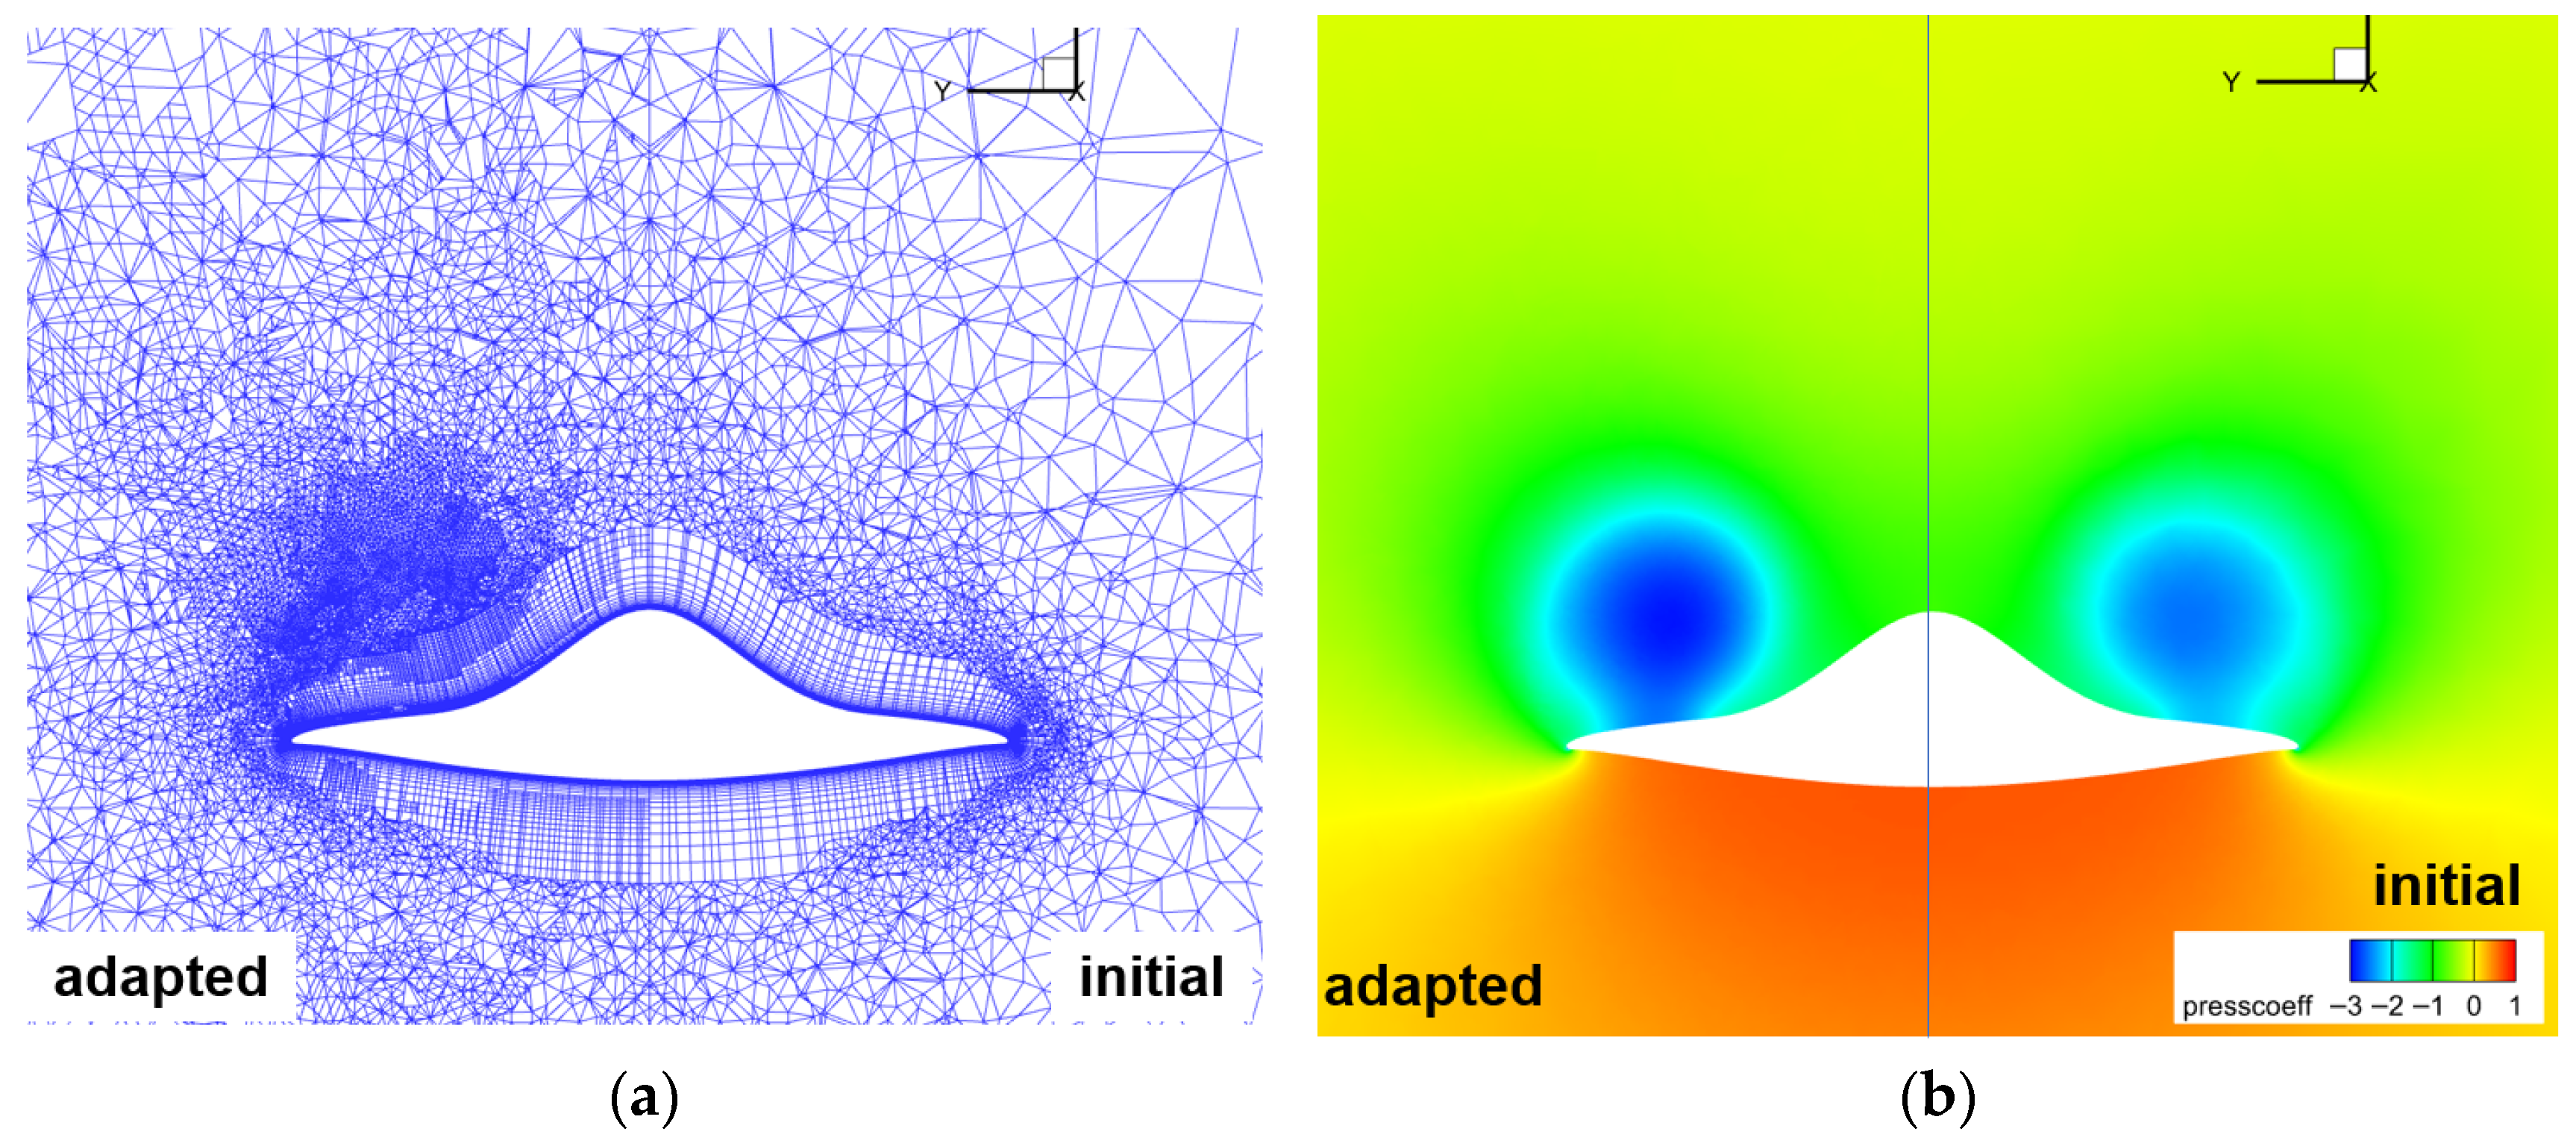
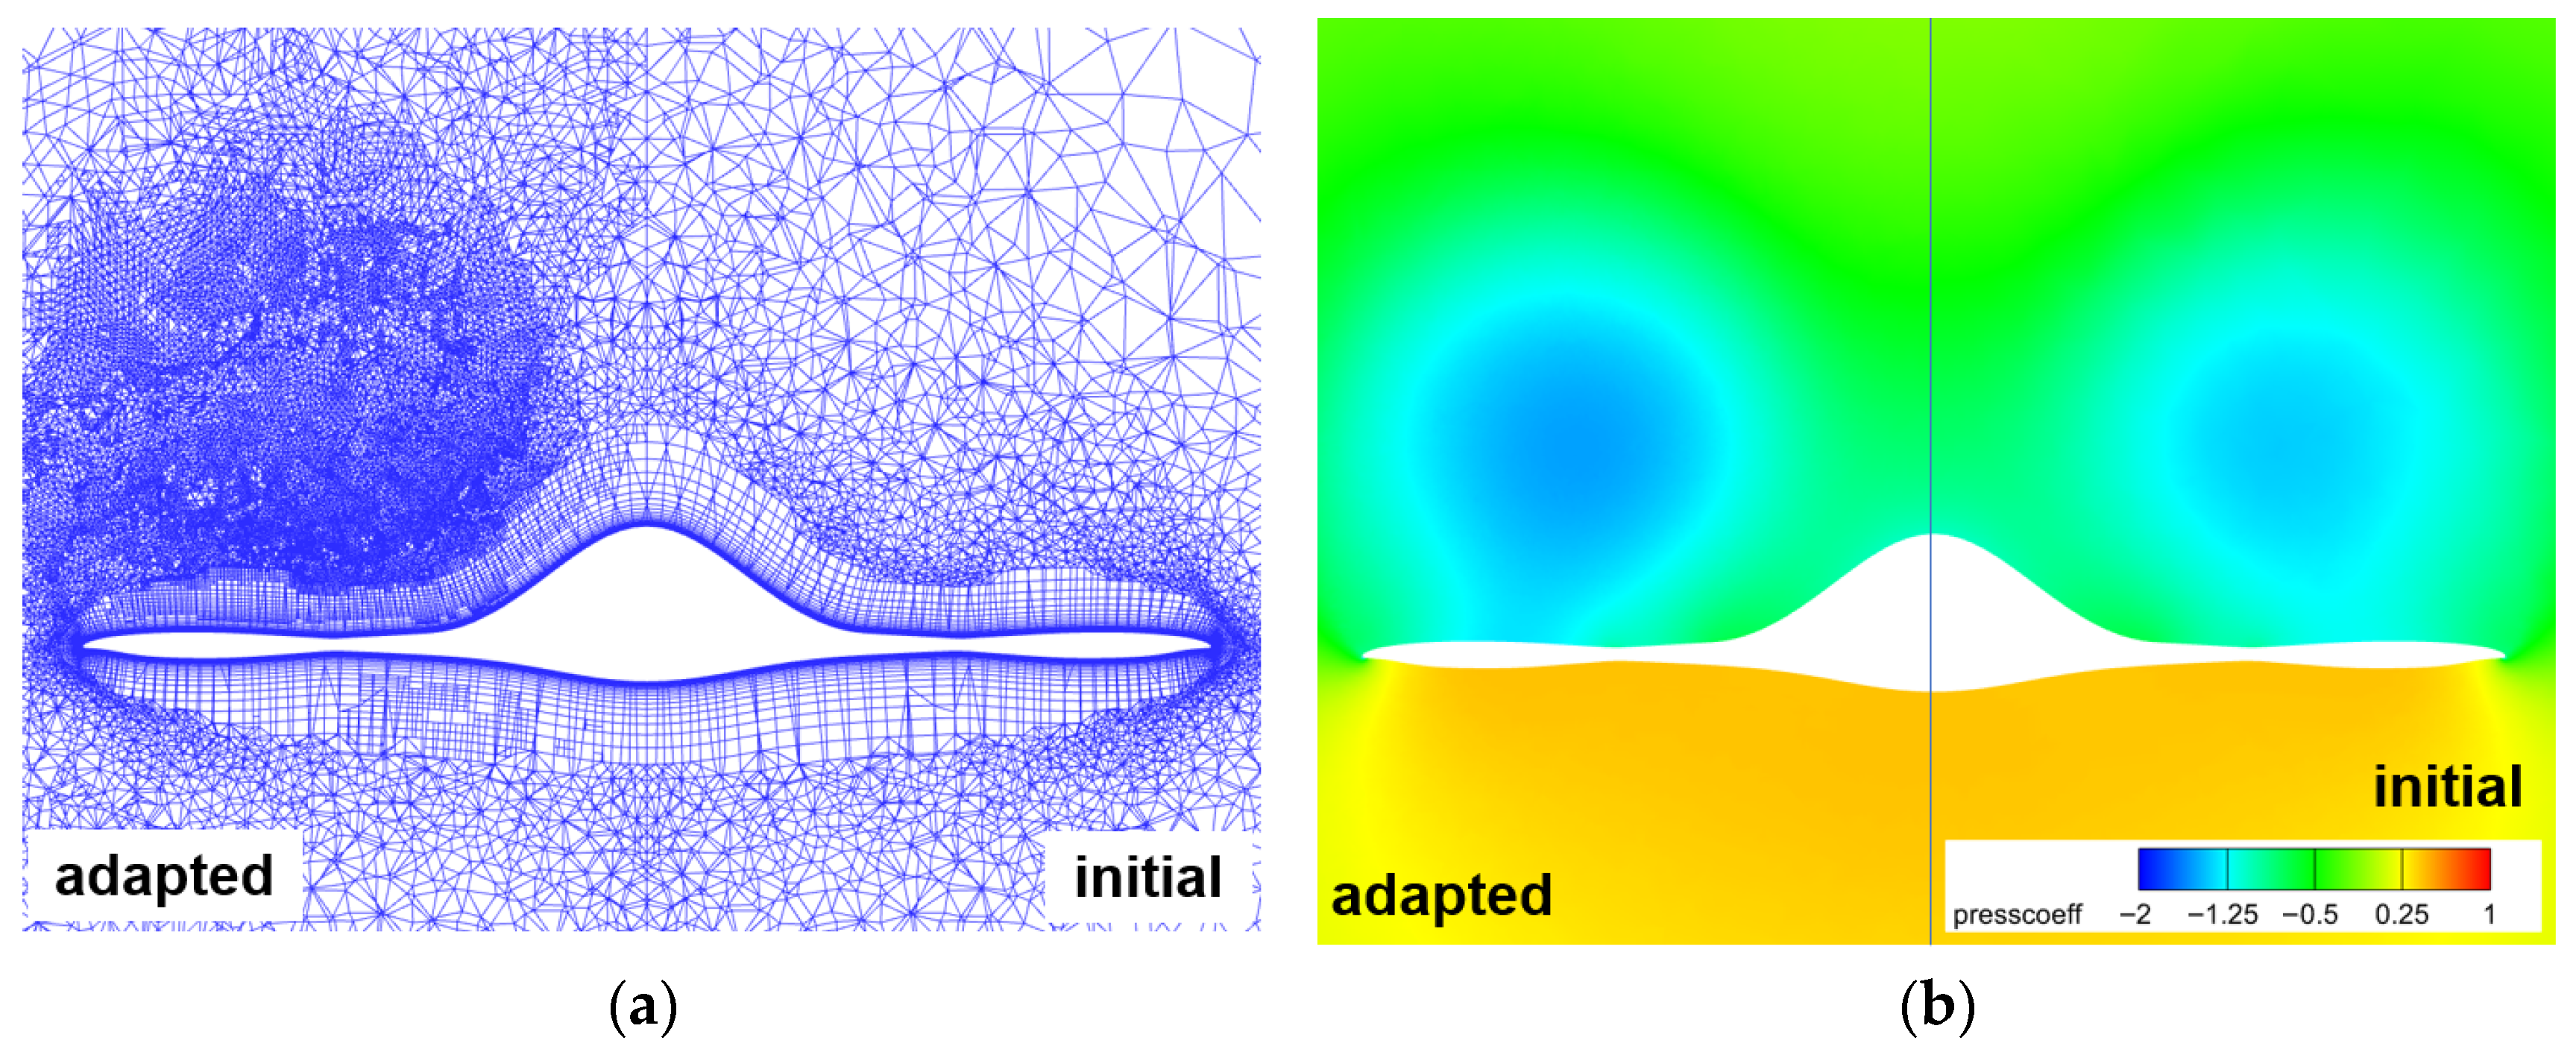
Figure 34 compares the spatial mesh and pressure distribution before and after adaptation for CHN-F1 at a 40° angle of attack. Figure 35 and Figure 36 show the mesh and flow field comparisons for typical cross-sections. The adapted mesh primarily refines the wingtip vortex and its surrounding regions, including extensive leeward boundary layer areas and limited windward boundary layer zones. Error estimation identified these regions as highly sensitive to lift calculations. After the third adaptation, the mesh size reached approximately 13.9 million elements. Compared to the initial mesh, the adapted mesh computed a lower pressure in the wingtip vortex region.
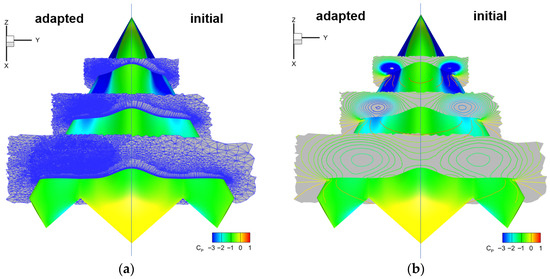
Figure 34.
Comparison of spatial mesh and pressure distribution for CHN-F1 at 40° angle of attack before/after adaptation: (a) Spatial mesh comparison; (b) Spatial pressure distribution comparison.
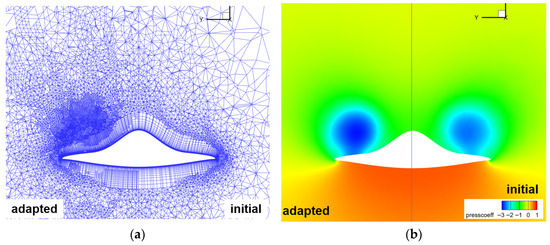
Figure 35.
Comparison of mesh and flow field at x/L = 0.45 cross-section for CHN-F1 at 40° angle of attack before/after adaptation: (a) Mesh distribution; (b) Pressure distribution.
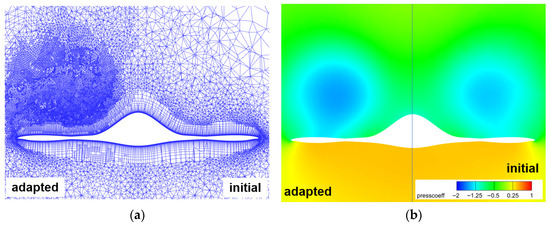
Figure 36.
Comparison of mesh and flow field at x/L = 0.72 cross-section for CHN-F1 at 40° angle of attack before/after adaptation: (a) Mesh distribution; (b) Pressure distribution.
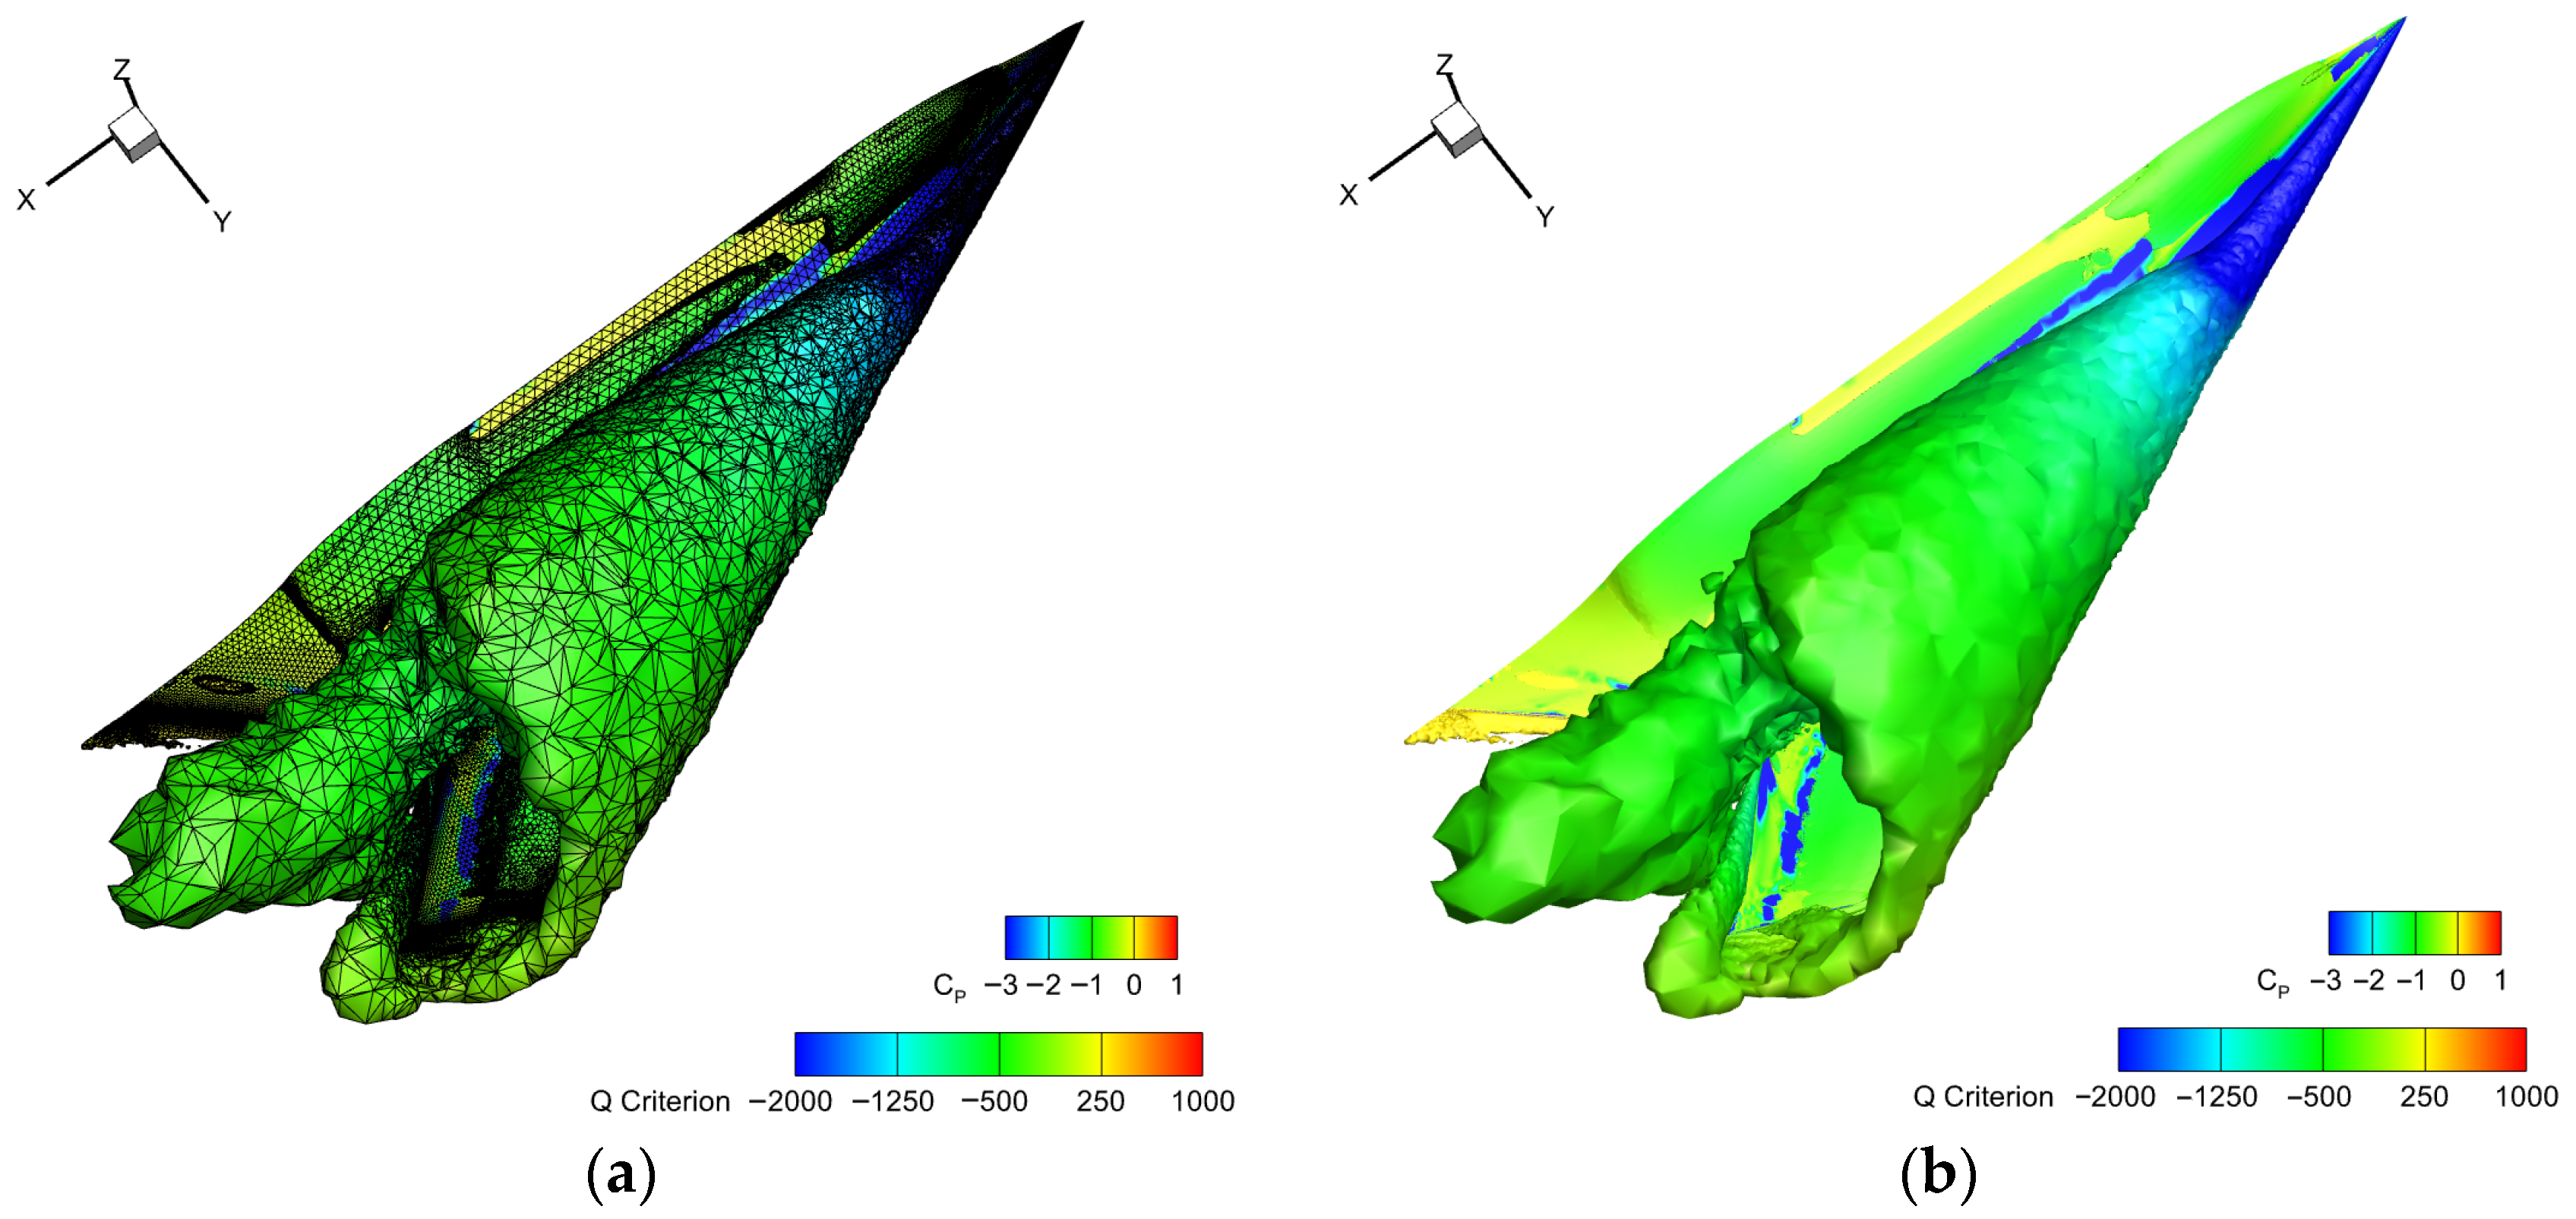
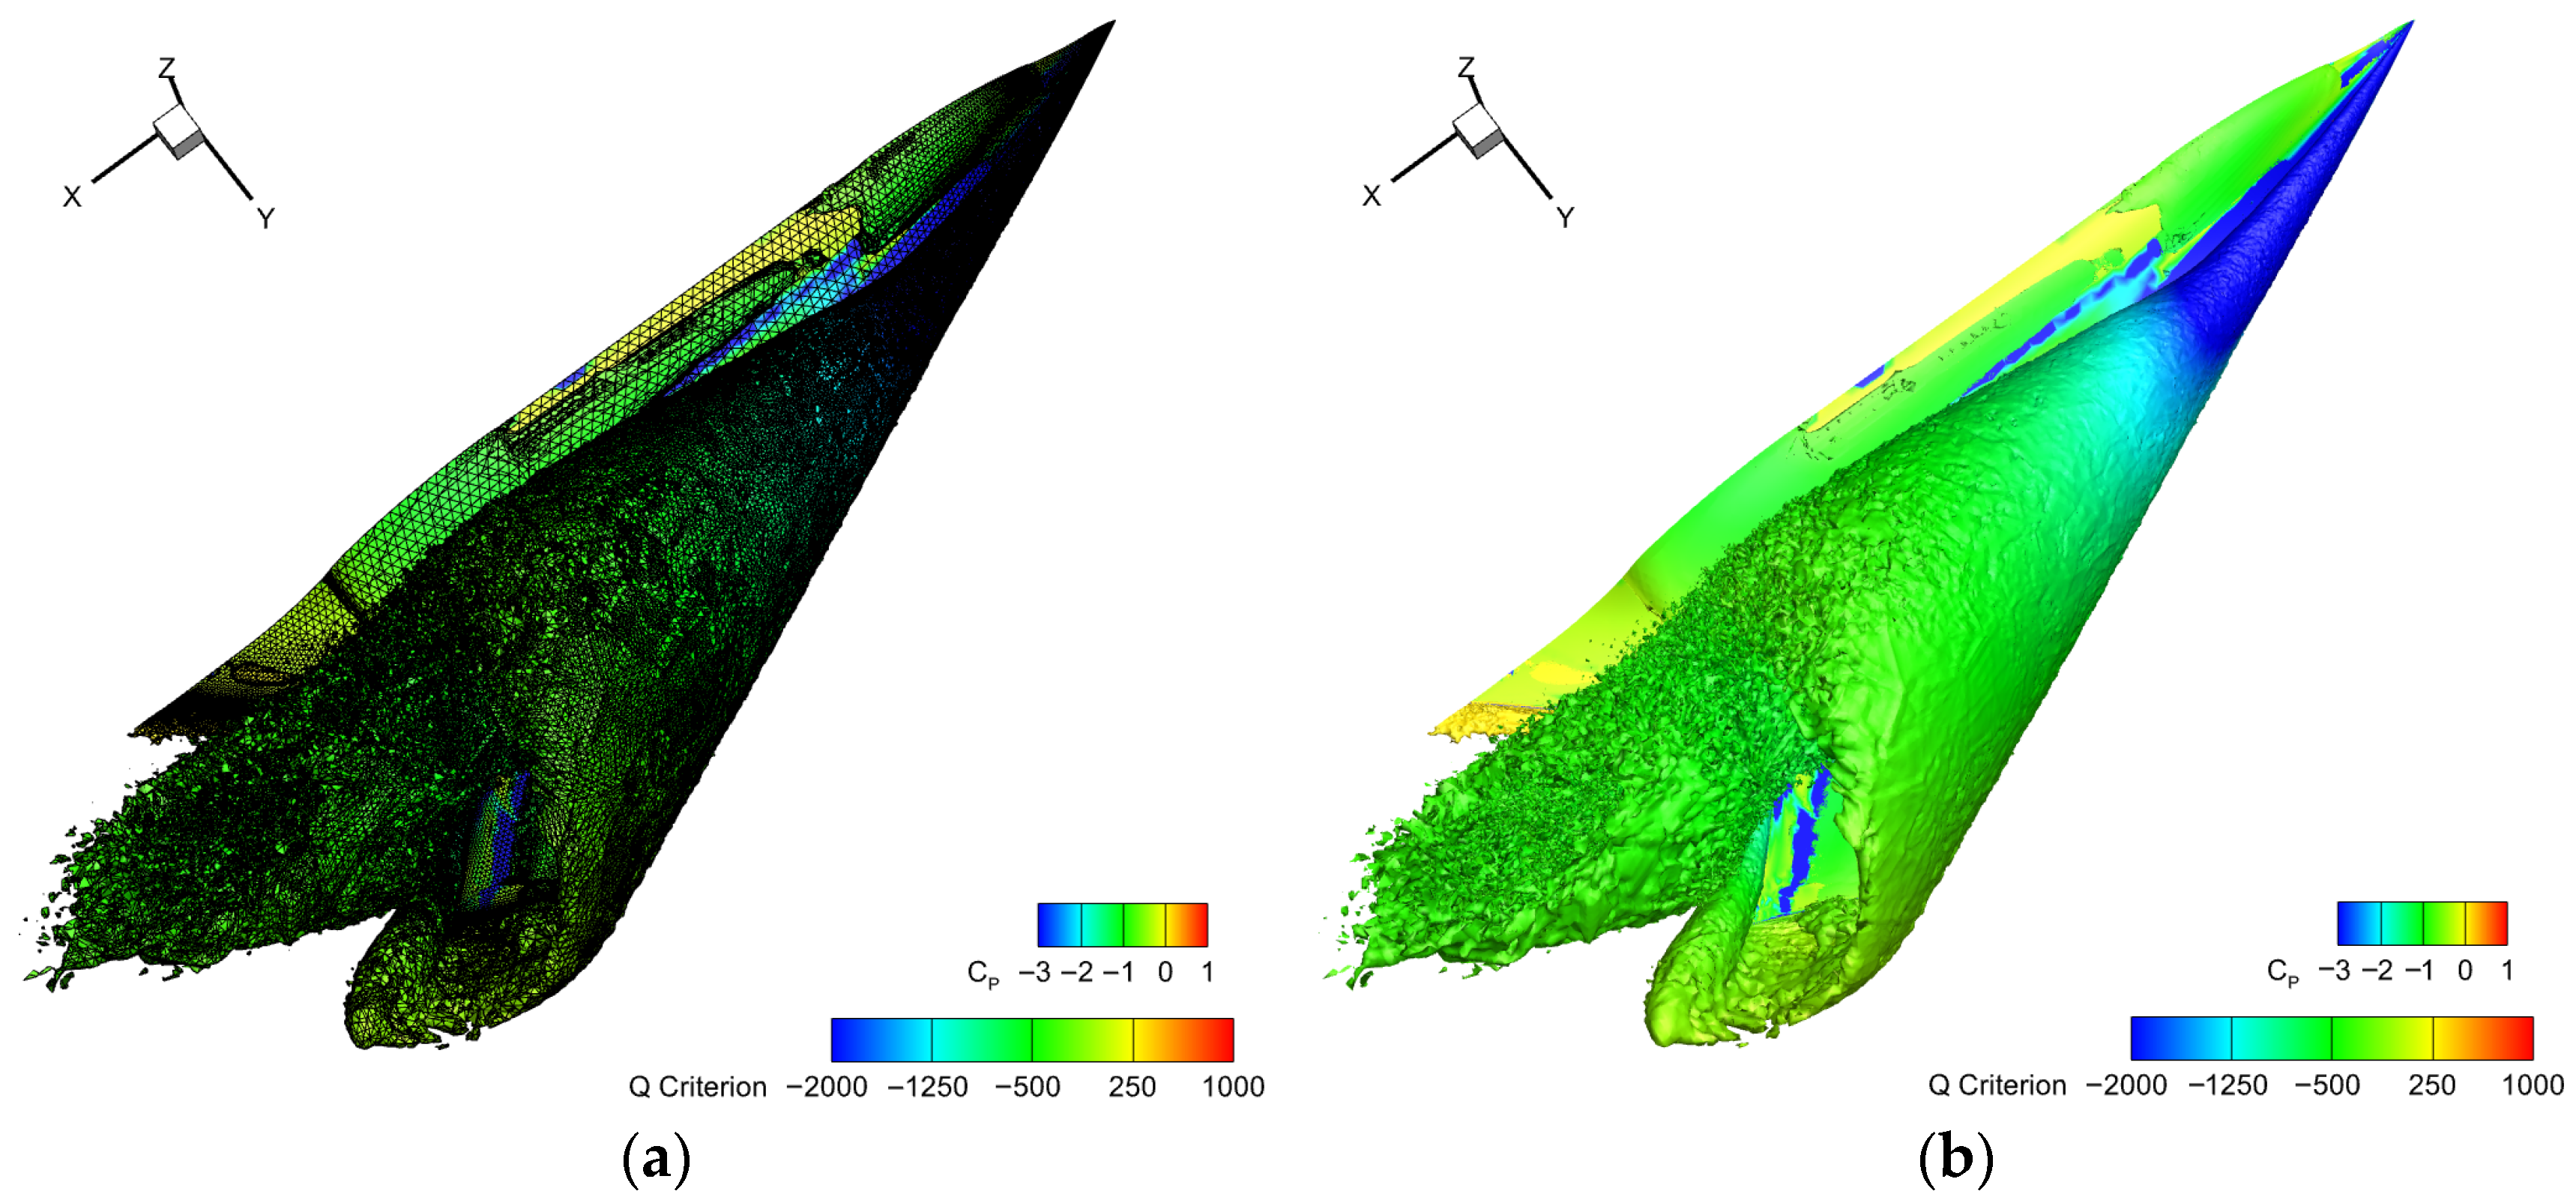
The Q-criterion effectively captures the spatial vortex structures. Figure 37 and Figure 38 compare the wingtip vortex structures and spatial mesh distributions before and after adaptation. The initial mesh yields low-resolution vortex structures with only vague outlines, while the adapted mesh captures detailed vortex separation through substantial refinement in wingtip regions. Near the tail, the wingtip vortex exhibits fully separated flow patterns.
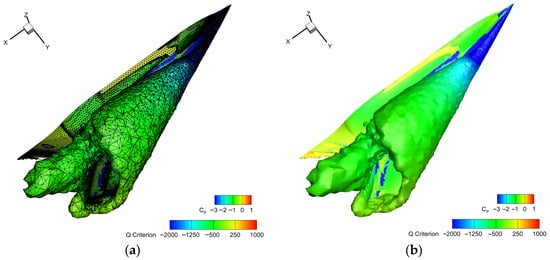
Figure 37.
Wingtip vortex spatial mesh and flow field for initial mesh at 40° angle of attack: (a) Wingtip vortex spatial mesh; (b) Q-criterion iso-surface of wingtip vortex.
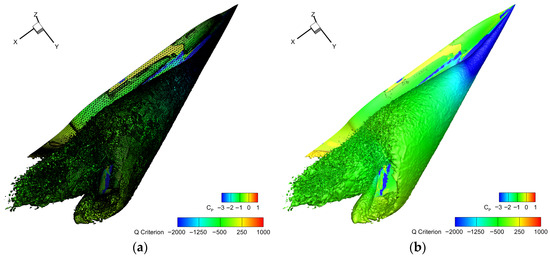
Figure 38.
Wingtip vortex spatial mesh and flow field for adapted mesh at 40° angle of attack: (a) Wingtip vortex spatial mesh; (b) Q-criterion iso-surface of wingtip vortex.
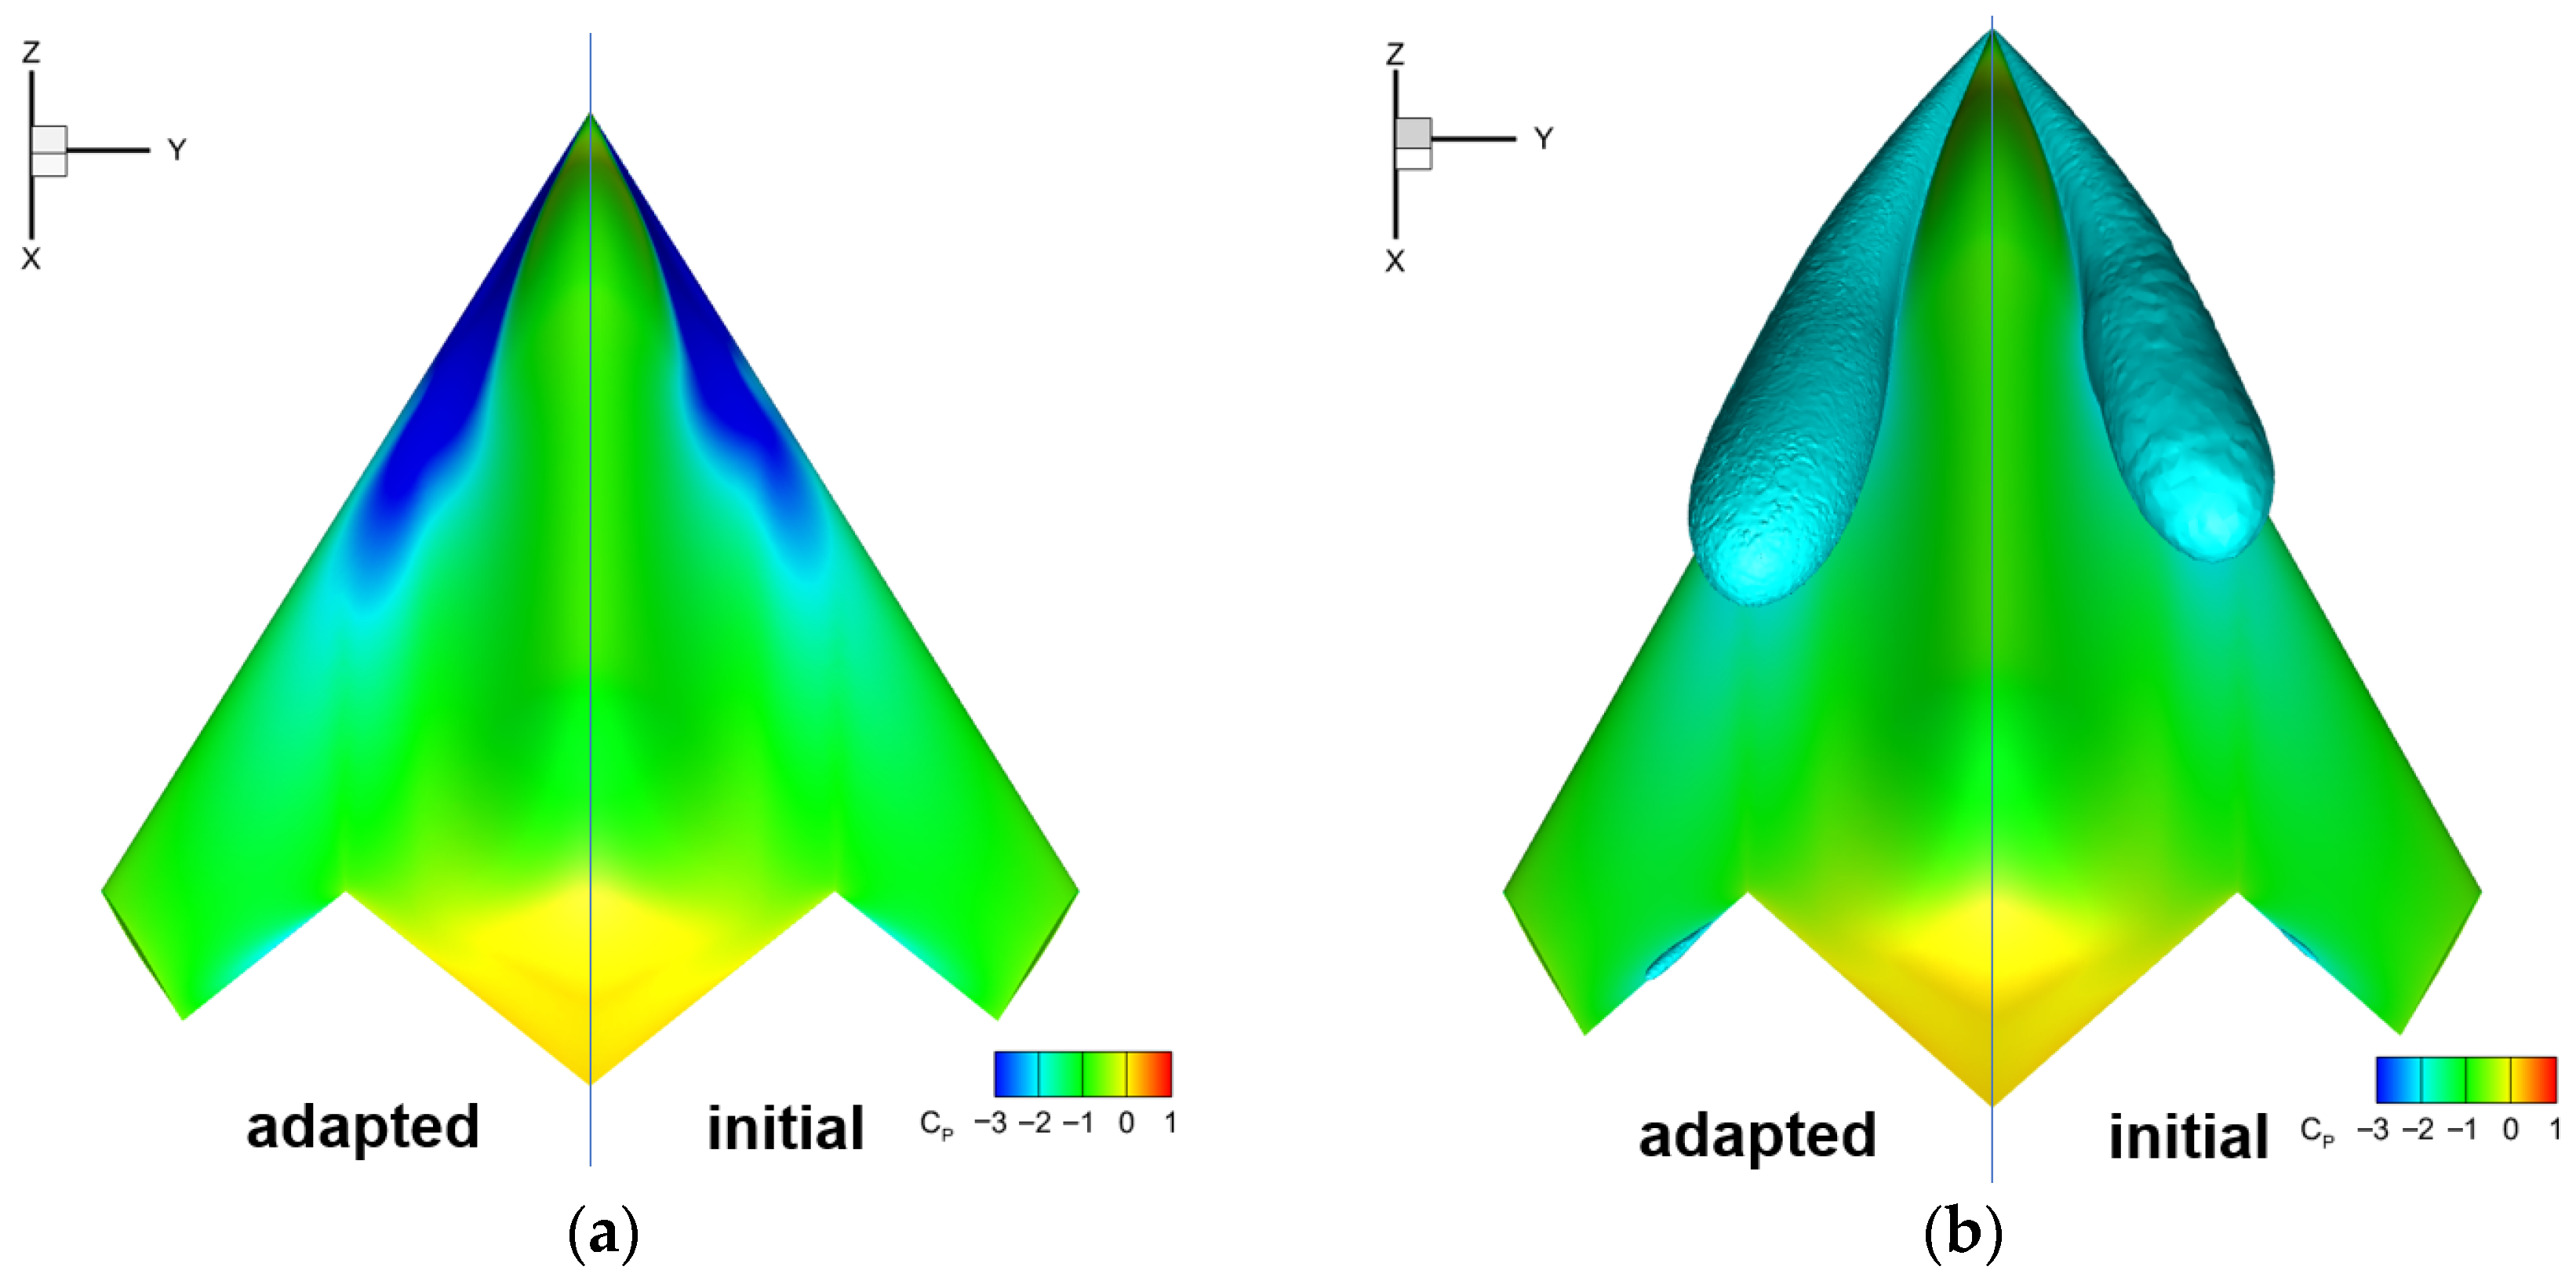
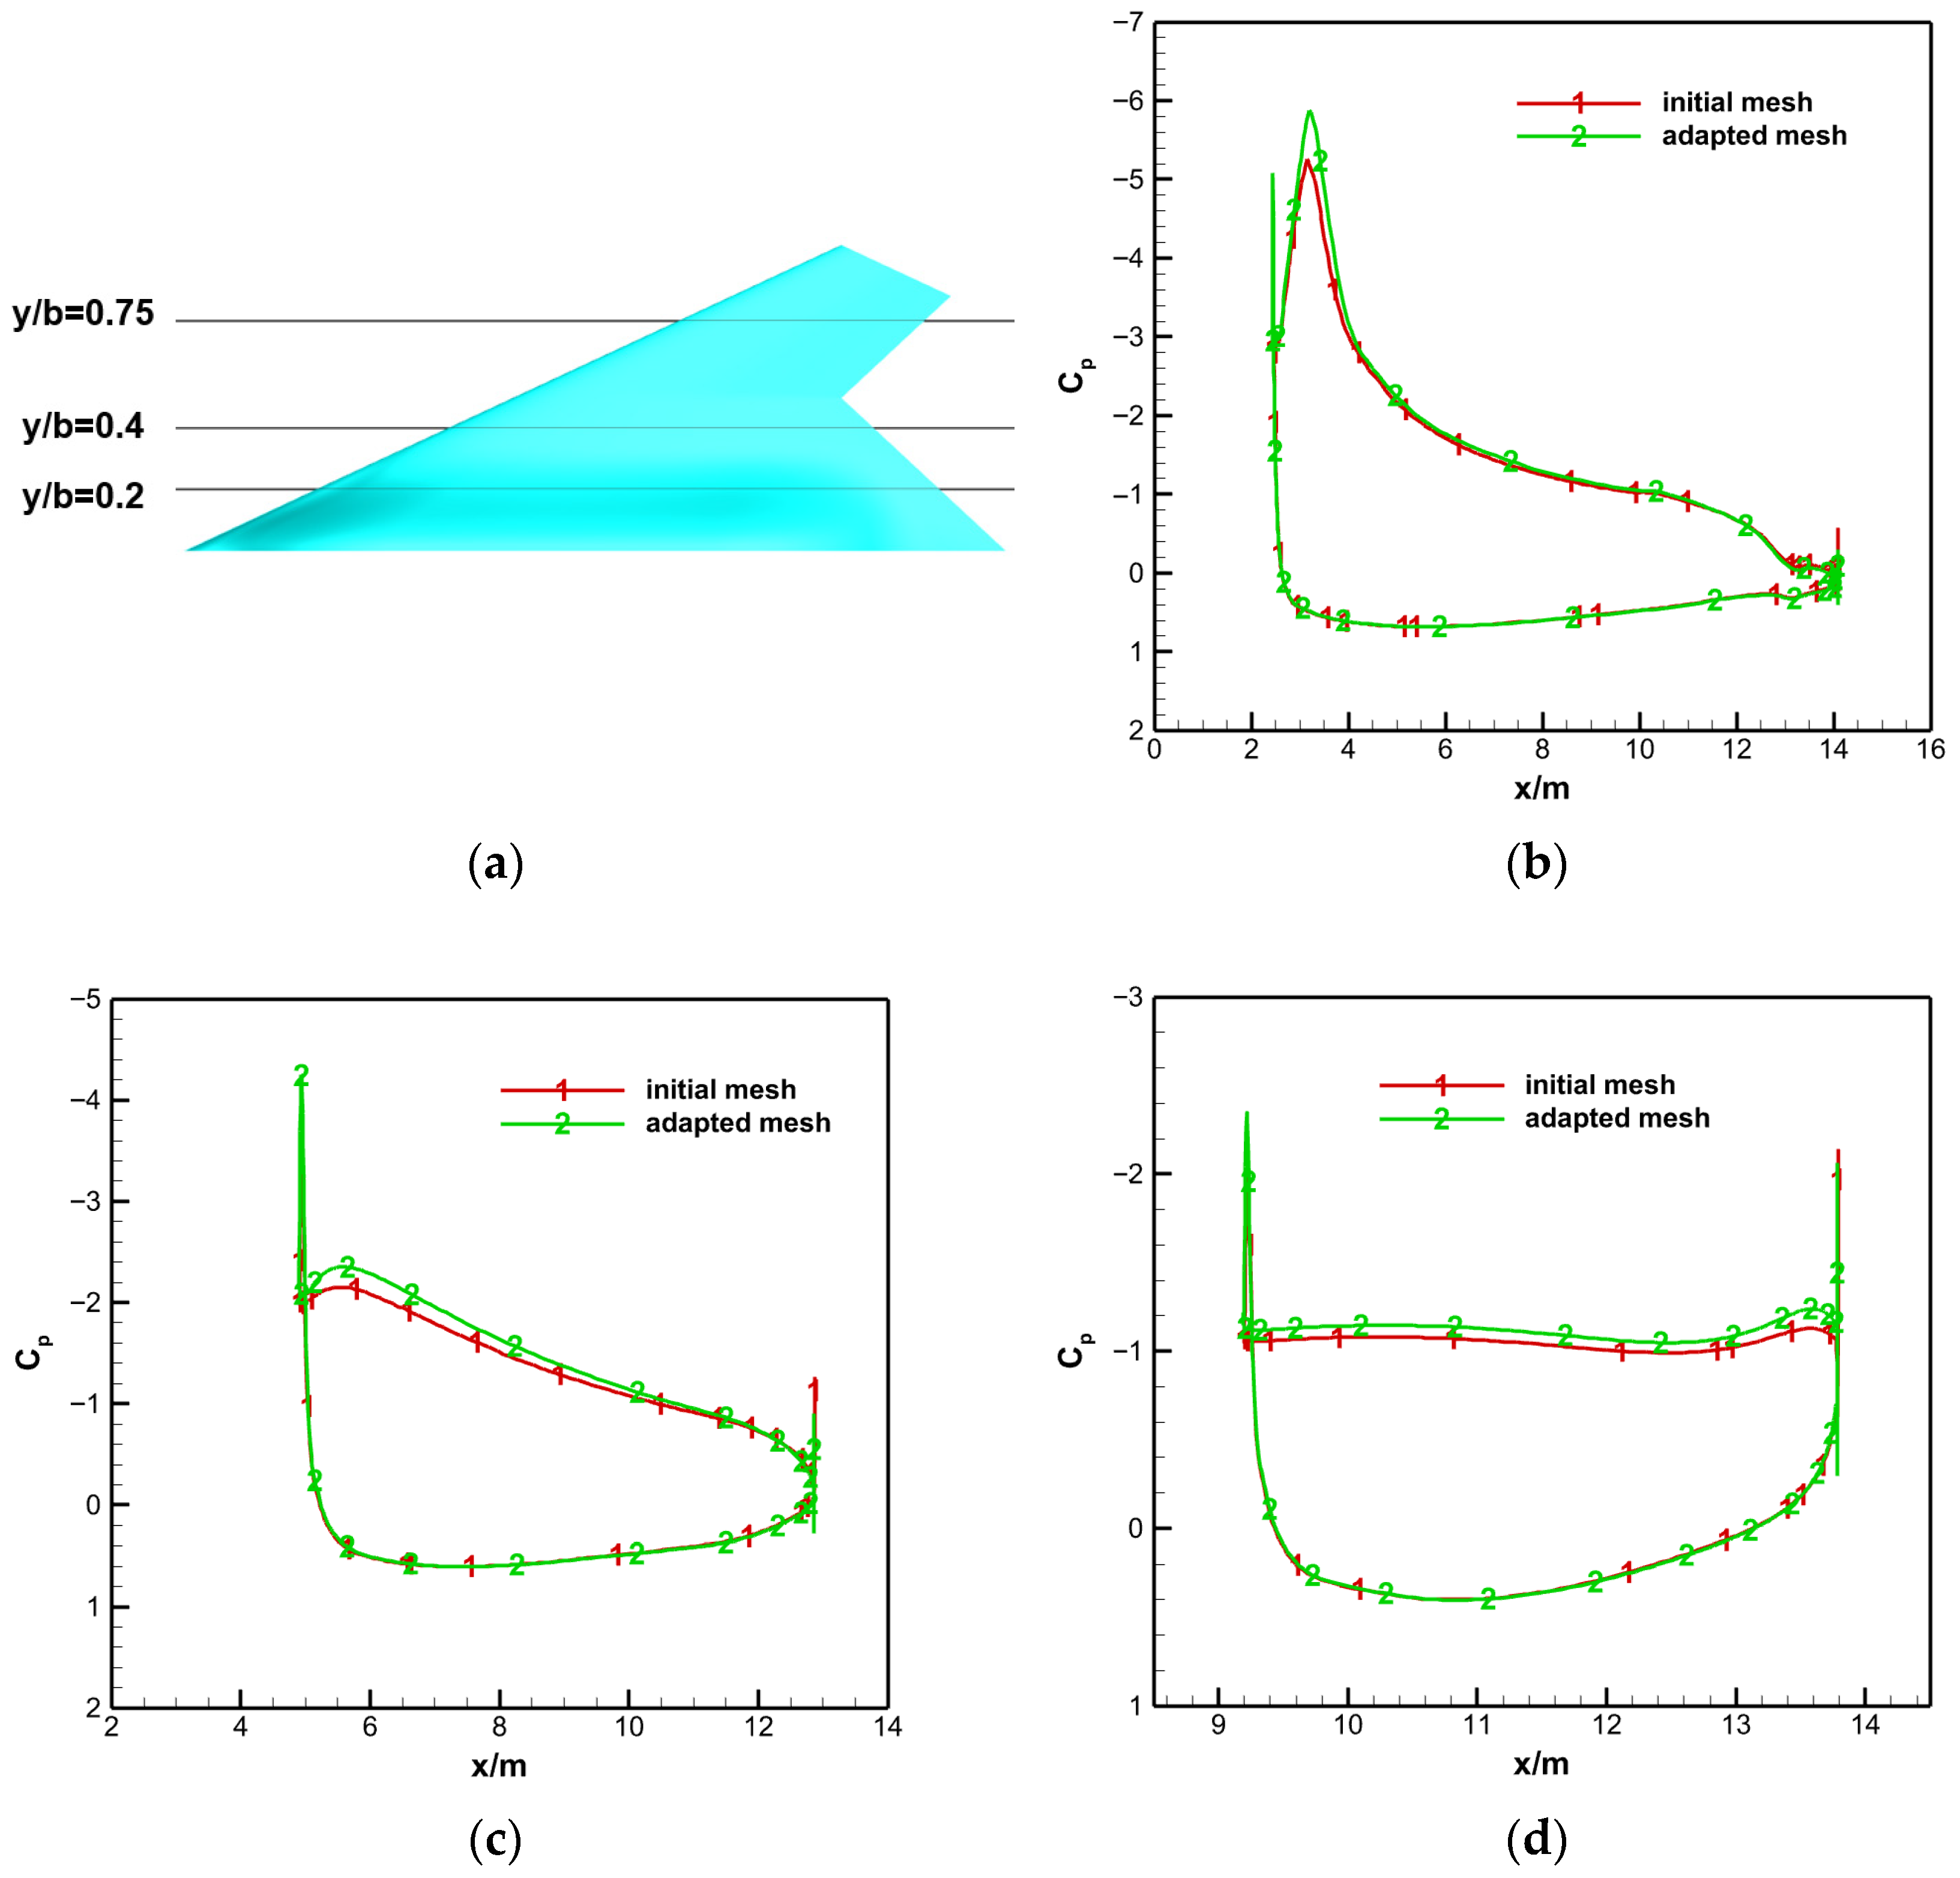
Figure 39 presents the surface and spatial pressure distributions before and after adaptation. The adapted mesh results in a more extensive low-pressure region. Figure 40 provides a comparison of pressure coefficients at various spanwise sections of the fuselage before and after adaptation. The mesh adaptation captures more refined wingtip vortex separation patterns, significantly reducing the pressure on the leeward side, particularly in the vicinity of the wingtip vortex. The pressure distribution on the windward side remains largely unchanged after mesh adaptation, as this region is dominated by attached flow, which contributes minimally to discretization errors in aerodynamic characteristics.
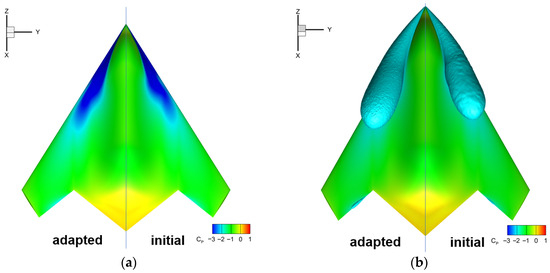
Figure 39.
Comparison of surface and spatial pressure distribution before/after adaptation at 40° angle of attack: (a) Upper surface pressure distribution; (b) Spatial pressure isosurfaces.
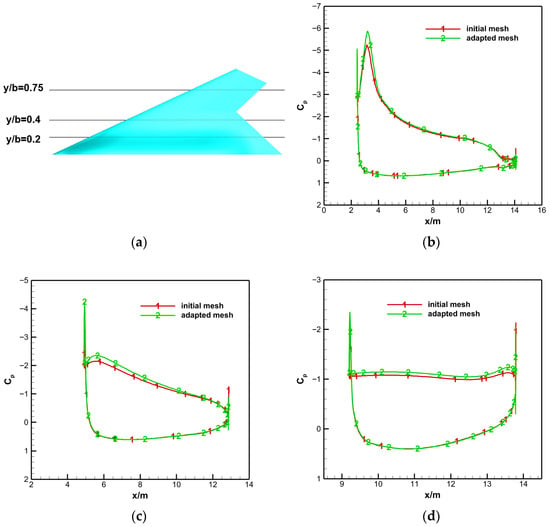
Figure 40.
Comparison of spanwise pressure coefficient distributions before/after adaptation at 40° angle of attack: (a) Section location schematic; (b) section y/b = 0.2; (c) section y/b = 0.4; (d) section y/b = 0.75.
Figure 41 presents the lift characteristic curves of the CHN-F1 configuration obtained through mesh adaptation. Figure 41a shows the evolution of the lift coefficient during the adaptation process at 40° angle of attack, where the dashed line represents the lift coefficients obtained from three wind tunnels. After three mesh adaptation cycles, the computed lift coefficient shows significantly closer agreement with experimental values. Compared to global mesh refinement, the adaptation approach demonstrates clear advantages: it achieves comparable accuracy while using approximately an order of magnitude fewer grid elements. The discrepancy between the computed lift coefficient and the average wind tunnel results is reduced from 10.05% to 6.65% after adaptation. Figure 41b displays the lift characteristic curve of CHN-F1 after mesh adaptation. Compared to the initial mesh, the adapted results show improved agreement with experimental data, particularly near the stall angle and at higher post-stall angles. At high angles of attack, the leeward side of the fuselage exhibits intense and complex separated flows, demanding high mesh quality. The mesh adaptation method effectively optimizes spatial grid distribution in a targeted manner, thereby enhancing the computational accuracy of aerodynamic characteristics at high angles of attack.
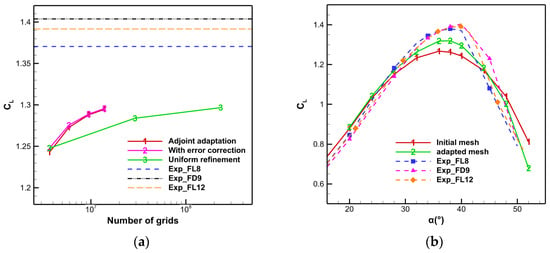
Figure 41.
Lift characteristics of CHN-F1 using adapted mesh: (a) Lift coefficient during adaptation; (b) Lift characteristics of adapted mesh.
5. Conclusions
This study addresses the critical challenge of adaptive boundary layer mesh processing for viscous flow simulations by proposing an integrated solution combining polyhedral mesh conversion, precise surface projection, and mesh deformation techniques. Systematic numerical experiments on representative cases, including the NACA0012 airfoil and CHN-F1 low-aspect-ratio flying wing configuration validate the method’s effectiveness, robustness, and engineering practicality. The main contributions are summarized as follows:
- (1)
- An innovative polyhedral mesh conversion method effectively resolves topological constraints in boundary layer adaptation. This approach enables local, anisotropic refinement/coarsening of layered elements (prisms/hexahedra) by converting hanging-node cells into polyhedra, eliminating the “through-cut” partitioning and directional limitations inherent in traditional methods, thereby achieving precise resolution of critical boundary layer flow features.
- (2)
- A robust processing framework for viscous boundary layer adaptation is established, integrating adjoint-based error estimation, polyhedral conversion, Coons surface-based projection, and distance-function mesh deformation. This ensures accurate geometric preservation and mesh quality compatibility during adaptation, significantly enhancing the applicability of mesh adaptation techniques for complex viscous flow simulations.
- (3)
- Numerical experiments demonstrate substantial improvements in aerodynamic prediction accuracy, particularly in complex scenarios like high-angle-of-attack separated flows. For the NACA0012 case, adjoint-based adaptation reduced lift coefficient error near stall from 4.21% to 0.30% by optimizing mesh distribution around leading-edge pressure peaks and trailing-edge separation zones. For the CHN-F1 flying wing, the method automatically identified and refined lift-error-sensitive regions like wingtip vortex cores, clearly resolving vortex formation, development, and breakdown processes, significantly improving stall characteristic predictions.
The proposed viscous boundary layer mesh adaptation strategy provides an effective solution to long-standing bottlenecks in applying adaptive techniques to viscous flows, offering both theoretical significance and engineering value for high-fidelity aerodynamic simulations in advanced aircraft design. Despite the promising results, this study has several limitations. First, the current framework is developed for steady-state RANS simulations. Its extension to unsteady flows would require developing time-accurate adjoint solvers and dynamic adaptation strategies, which entail significantly higher computational costs and algorithmic complexity. Second, the method’s performance for massively separated flows at very high angles of attack (e.g., deep stall) relies on the accuracy of the underlying turbulence model. The mesh adaptation can resolve structures permitted by the model but cannot overcome inherent limitations of the RANS approach for such highly unsteady, three-dimensional flows. Future work will focus on intelligent refinement/coarsening strategies for enhanced adaptive efficiency and integration with high-order numerical schemes to achieve extreme accuracy on coarser grids.
Author Contributions
Conceptualization, P.C. and J.T.; methodology, P.C.; software, X.W.; validation, P.C. and J.C.; formal analysis, P.C.; investigation, J.C.; resources, H.J.; writing—original draft preparation, P.C.; writing—review and editing, F.Q.; visualization, J.Z.; supervision, Y.Z.; project administration, G.Z.; funding acquisition, P.C. All authors have read and agreed to the published version of the manuscript.
Funding
This research was funded by the National Natural Science Foundation of China (No. 12102453), the National Numerical Wind Tunnel Project, and the Pre-study Project (No. 403020204403020204).
Data Availability Statement
The original contributions presented in this study are included in the article. Further inquiries can be directed to the corresponding authors.
Conflicts of Interest
The authors declare no conflicts of interest.
References
- Morgado, F.; Garbacz, C.; Fossati, M. Impact of anisotropic mesh adaptation on the aerothermodynamics of atmospheric reentry. AIAA J. 2022, 60, 3973–3989. [Google Scholar] [CrossRef]
- Colombo, S.; Re, B. An ALE residual distribution scheme for the unsteady Euler equations over triangular grids with local mesh adaptation. Comput. Fluids 2022, 239, 105414. [Google Scholar] [CrossRef]
- Chawner, J.R.; Taylor, N.J. Progress in Geometry Modeling and Mesh Generation Toward the CFD Vision 2030. In Proceedings of the AIAA Aviation 2019 Forum, Dallas, TX, USA, 17–21 June 2019. AIAA-2019-2945. [Google Scholar]
- Galindo, J.; Serrano, J.R.; Dolz, V.; Iljaszewicz, P. Impact of Mesh Resolution and Temperature Effects in Jet Ejector CFD Calculations. Appl. Sci. 2025, 15, 3880. [Google Scholar] [CrossRef]
- Cottrell, J.A.; Hughes, T.J.R.; Bazilevs, Y. Isogeometric Analysis: Toward Integration of CAD and FEA; John Wiley & Sons, Ltd.: Hoboken, NJ, USA, 2009. [Google Scholar]
- Luo, C.; Zhou, D.; Meng, S.; Bi, L.; Wang, W.; Yuan, X.; Tang, Z. A Novel Cell-Based Adaptive Cartesian Grid Approach for Complex Flow Simulations. Appl. Sci. 2024, 14, 3692. [Google Scholar] [CrossRef]
- Clerici, F.; Spalart, P.R.; Alauzet, F. Turbulence driven goal-oriented anisotropic mesh adaptation for RANS simulations in aerodynamics. J. Comput. Phys. 2024, 514, 113191. [Google Scholar] [CrossRef]
- Slotnick, J.P.; Khodadoust, A.; Alonso, J.; Darmofal, D.; Gropp, W.; Lurie, E.; Mavriplis, D.J. CFD Vision 2030 Study: A Path to Revolutionary Computational Aerosciences; NASA/CR-2014-218178; NASA: Pasadena, CA, USA, 2014. [Google Scholar]
- Michal, T.; Babcock, D.; Kamenetskiy, D.; Krakos, J.; Mani, M.; Glasby, R.; Erwin, E.; Stefanski, D.L. Comparison of Fixed and Adaptive Unstructured Grid Results for Drag Prediction Workshop 6. J. Aircr. 2018, 55, 1420–1432. [Google Scholar] [CrossRef]
- Tinoco, E.N.; Brodersen, O.P.; Keye, S.; Laflin, K.R.; Feltrop, E.; Vassberg, J.C.; Mani, M.; Rider, B.; Wahls, M.A.; Morrison, J.H.; et al. Summary Data from the Sixth AIAA CFD Drag Prediction Workshop: CRM Cases. J. Aircr. 2018, 55, 1352–1379. [Google Scholar] [CrossRef]
- Balan, A.; Park, M.A.; Wood, S.L.; Anderson, W.K.; Rangarajan, A.; Sanjaya, D.P.; May, G. A review and comparison of error estimators for anisotropic mesh adaptation for flow simulations. Comput. Fluids 2022, 234, 105259. [Google Scholar] [CrossRef]
- Alauzet, F.; Loseille, A.; Olivier, G. Time-accurate multi-scale anisotropic mesh adaptation for unsteady flows in CFD. J. Comput. Phys. 2018, 373, 28–63. [Google Scholar] [CrossRef]
- Baker, T.J. Mesh Generation: Art or Science? Prog. Aerosp. Sci. 2005, 41, 29–63. [Google Scholar] [CrossRef]
- Balan, A.; Park, M.A.; Wood, S.; Anderson, W.K. Verification of Anisotropic Mesh Adaptation for Complex Aerospace Applications. In Proceedings of the AIAA Scitech 2020 Forum, Orlando, FL, USA, 6–10 January 2020. AIAA-2020-0675. [Google Scholar]
- Park, M.A.; Carlson, J. Turbulent Output-Based Anisotropic Adaptation. In Proceedings of the 48th AIAA Aerospace Sciences Meeting Including the New Horizons Forum and Aerospace Exposition, Orlando, FL, USA, 4–7 January 2010. AIAA-2010-168. [Google Scholar]
- Park, M.A.; Lee-Rausch, B.; Rumsey, C. FUN3D and CFL3D Computations for the First High Lift Prediction Workshop. In Proceedings of the 49th AIAA Aerospace Sciences Meeting Including the New Horizons Forum and Aerospace Exposition, Orlando, FL, USA, 4–7 January 2011. AIAA-2011-936. [Google Scholar]
- Chitale, K.C.; Sahni, O.; Shephard, M.S.; Tendulkar, S.; Jansen, K.E. Anisotropic Adaptation for Transonic Flows with Turbulent Boundary Layers. AIAA J. 2015, 53, 367–378. [Google Scholar] [CrossRef][Green Version]
- Cui, P.; Zhou, G.; Zhang, Y.; Jia, H.; Wu, X.; Ma, M.; Li, H.; Chen, B. Improved delayed detached-eddy investigations on the flow control of the leading-edge flat spoiler of the cavity in the low-aspect-ratio aircraft. Aerospace 2022, 9, 526. [Google Scholar] [CrossRef]
- Zhang, J.; Dai, Z.; Li, R.; Deng, L.; Liu, J.; Zhou, N. Acceleration of a Production-Level Unstructured Grid Finite Volume CFD Code on GPU. Appl. Sci. 2023, 13, 6193. [Google Scholar] [CrossRef]
- Tang, J.; Zhang, J.; Li, B.; Cui, P.; Zhou, N. Parallel algorithms for unstructured hybrid mesh adaptation. Acta Aeronaut. Astronaut. Sin. 2020, 41, 91–100. [Google Scholar]
- Cui, P.; Li, B.; Tang, J.; Chen, J.; Deng, Y. A modified adjoint-based grid adaptation and error correction method for unstructured grid. Mod. Phys. Lett. B 2018, 32, 1840020. [Google Scholar] [CrossRef]
- Dolejsi, V.; Roskovec, F. Goal-oriented anisotropic hp-adaptive discontinuous Galerkin method for the Euler equations. Commun. Appl. Math. Comput. 2022, 4, 143–179. [Google Scholar] [CrossRef]
- Vivarelli, G.; Qin, N.; Shahpar, S.; Radford, D. Sequential feature-based mesh movement and adjoint error-based mesh refinement. Int. J. Numer. Methods Fluids 2021, 93, 249–272. [Google Scholar] [CrossRef]
- Vivarelli, G.; Qin, N.; Shahpar, S. A review of mesh adaptation technology applied to computational fluid dynamics. Fluids 2025, 10, 129. [Google Scholar] [CrossRef]
- Lu, F.; Qi, L.; Jiang, X.; Liu, G.; Liu, Y.; Chen, B.; Pang, Y.; Hu, X. NNW-GridStar: Interactive structured mesh generation software for aircrafts. Adv. Eng. Softw. 2020, 145, 102803. [Google Scholar] [CrossRef]
- Liu, Y.; Hu, Y.; Xie, D.; Zhang, Y.; Chen, J. A lightweight interactive approach for unstructured surface mesh generation. Eng. Comput. 2025, 42, 1942–1961. [Google Scholar] [CrossRef]
- McCroskey, W.J. A Critical Assessment of Wind Tunel Results for the NACA0012 Airfoil; NASA-TM-100019; NASA: Pasadena, CA, USA, 1987. [Google Scholar]
- Cui, P.; Li, H.; Jia, H.; Li, L.; Qin, F.; Wu, X.; Zhang, Y. An improved Harten-Lax-Leer-Einfeldt plus plus scheme for unstructured grid and cell-centred finite-volume method. Phys. Fluids 2025, 37, 076130. [Google Scholar] [CrossRef]
- Su, J.; Huang, Y.; Zhong, Y.; Li, Y. Research on flow characteristics of low-aspect-ratio flying-wing at transonic speed. Acta Aerodyn. Sin. 2015, 33, 307–312. [Google Scholar]
- Li, Y.; Liu, H.; Huang, Y.; Zhong, S.; Su, J. Investigation on the correlation of high-speed force test results of flying-wing calibration model with low-aspect ratio. Acta Aerodyn. Sin. 2016, 34, 107–112. [Google Scholar]
Disclaimer/Publisher’s Note: The statements, opinions and data contained in all publications are solely those of the individual author(s) and contributor(s) and not of MDPI and/or the editor(s). MDPI and/or the editor(s) disclaim responsibility for any injury to people or property resulting from any ideas, methods, instructions or products referred to in the content. |
© 2025 by the authors. Licensee MDPI, Basel, Switzerland. This article is an open access article distributed under the terms and conditions of the Creative Commons Attribution (CC BY) license (https://creativecommons.org/licenses/by/4.0/).

