1. Introduction
The occurrence of oceanic rogue waves, characterized by sudden and massive waves with extreme amplitudes or steepness, has garnered significant research interest due to their potentially catastrophic effects on marine vessels and offshore structures [
1,
2]. These investigations on rogue waves have been conducted extensively in controlled water-tank environments, and have also been expanded recently to various disciplines, which also exhibit similar characteristics of dispersion, nonlinearity, and system complexity [
3]. These fields of physical science include fluid dynamics, nonlinear optics, plasma physics, and Bose–Einstein condensation [
2,
4,
5]. While the quest for a comprehensive understanding of rogue wave formation continues, ongoing debate encourages the comparison of predictions and observations across various fields such as hydrodynamics and nonlinear optics. Analogous dynamics can be identified using a shared equation model [
6,
7]. The nonlinear Schrödinger equation (NLSE) has played this pivotal role in the past thirty years.
Mathematically, rogue waves can typically be described as deterministic rational solutions of integrable nonlinear partial differential equations. These solutions can be obtained using elegant analytical techniques like inverse scattering transform, the Hirota method, and the Darboux transformation [
8,
9,
10,
11,
12]. The well-known Peregrine soliton serves as a simple example of such a deterministic rational solution for the NLSE [
6]. The spectral analysis of rogue waves may provide valuable information that can be used in their detection [
13]. The spectra can be readily measured using experiments, and this information is crucial for comprehensive investigations of rogue wave properties [
14]. Spectral analysis is an important tool in the signal processing of rapid events in optics, although a similar analysis method is less developed for oceanic waves. Analytical calculations on the exact spectra of the NLSE have been performed for rogue waves [
13]. While measuring exact wave profiles in the time domain can be challenging, determining their spectra is a well-established technique supported by a multiplicity of devices used in experimental optics and fluids.
Many works in the literature have confirmed that rogue waves can arise in both oceans and optical fibers due to modulation instability (MI). Weak perturbations imposed on a continuous wave are amplified due to MI [
15,
16]. Such a linearized instability mechanism cannot sustain indefinitely, and nonlinear effects must eventually be incorporated. More precisely, under periodic boundary conditions, higher harmonics that are initially exponentially small may be amplified at a faster rate. Subsequently, all modes attain roughly the same magnitude at one instant in time or spatial location, leading to the formation of a breather. The breather may then decay, but MI may resume in a small-enough amplitude. This whole cycle will be repeated as a manifestation of the classical problem of Fermi–Pasta–Ulam recurrence (FPUT) in physics [
17,
18]. This growth and decay process is also associated with the term ‘cascading mechanism’ [
19]. This analytical framework can provide a prediction of the first occurrence of breathers, which is significant for experimental works in the fields of optics and fluids [
20]. If we consider the nonlinear dynamics in an infinite domain with decaying conditions in the far field, the analog of breathers (under periodic boundary conditions) will then be a rogue wave. The displacements will then be negligible everywhere in space and time, except for the localized interval of time during the occurrence of the rogue wave.
As examples of applications in fluid mechanics, resonant wave interactions have been studied extensively for surface, interfacial, and internal waves in two-layer, as well as continuously stratified, fluids [
21,
22,
23]. Significant energy transfers among normal modes under such circumstances have been elucidated theoretically and demonstrated experimentally. Triadic resonance instability, also known as three-wave resonance, arises from the strong interactions among three waves. When the fast oscillations of three-wave packets satisfy the resonance conditions (the sum of wavenumbers and frequencies of two waves equal to those of the third wave), second-order nonlinear evolution equations can be derived using multiple-scale asymptotic expansions. Such model equations possess rogue wave and breather solutions [
8,
9,
10,
11,
12,
24,
25,
26]. A regime of three-wave resonance with identical group velocities for internal waves was established [
26]. The dispersion relation for wavy oscillations in a stratified fluid of constant buoyancy frequency is given by a rational expression. The condition of identical group velocity for a triad can then be readily identified by solving algebraic equations. However, perspectives on the nonlinear dynamics of the rogue wave solutions have not been fully examined. Our objective is to investigate the connection between the physical aspects of three-wave resonance and the exact solutions from mathematical physics. In particular, we examine a special case of identical group velocity for two out of the three modes.
The crucial issues can now be explained. A ‘degenerate’ case will occur if two out of the three group velocities involved in this triad resonance are identical. Here, the dynamics of localized modes of the degenerate case of three-wave resonant interaction equations will be studied. We begin by introducing the
Nth-order rogue wave modes of this model (
Section 2). The effects of group velocities on the widths and structural profiles of the rogue waves will be investigated. MI can provide insights into the variations in the widths of the rogue waves by clarifying the properties of breathers in FPUT (
Section 3). We shall examine the spectra of higher-order rogue waves. Furthermore, the deep learning technique is utilized to predict new rogue waves (
Section 4). Finally, conclusions are drawn (
Section 5).
2. General Rogue Wave Solutions
In this section, we present the rogue waves for the degenerate three-wave resonant interaction equations:
where
u1,
u2, and
u3 are complex-valued, slowly varying wave envelopes. The phase factors of the three wave trains satisfy the resonance condition, i.e., the sum of frequencies and wavenumbers being zero. For the degenerate case,
is common group velocity of the first two waves. In an inertial frame moving with the group velocity of third wave train, that group velocity is taken as zero. The real-valued, nonlinear interaction coefficients (
ε1,
ε2,
ε3) can be computed using standard perturbation expansions. We assume that the normalization procedure has been taken and that all interaction coefficients have magnitude unity. Equation (1) is termed the soliton-exchange (SE) case when (
ε1,
ε2,
ε3) = (1, −1, 1) and the stimulated backscatter (SB) case when (
ε1,
ε2,
ε3) = (1, −1, −1) [
9,
27]. In contrast, the rogue wave solutions for the non-degenerate triad case presented earlier (Reference [
9]) are classified based on a parameter ‘
p’ determined using a quartic equation. In the SB case, the value of ‘
p’ cannot be obtained from the quartic equation in Reference [
9]. As a result, the rogue wave solutions for our degenerate model cannot be derived from Reference [
9]. The rogue wave solutions for our degenerate model both in the SE and the SB cases will be provided. Here, no such quartic equation is invoked.
Equation (1) displays the background plane wave solution:
where
and
are the wavenumbers and angular frequencies of the first two envelope components of the triad and
are the respective background heights of the three waves. Parameters of these plane waves satisfy the relation
We shall study the nonlinear dynamics of rogue waves in the SE and SB cases by analytically employing the Kadomtsev–Petviashvili (KP) hierarchy reduction method and numerically employing the split-step Fourier method. On further analysis, we found that k1 had no impact on the amplitudes and widths of the rogue waves. Moreover, k1 did not affect the growth rate of modulation instability either. Hence, we set k1 = 0 in the subsequent discussion to simplify the analysis.
We present the rogue wave solution of Equation (1) using the Schur polynomials,
, which are defined by
where
x =
. The first few members of these polynomials are
Theorem 1. The rogue wave solution for Equation (1) in the SE case is given bywhere the expressions of k2,
ω1,
and ω2 are given in Equation (3), and The matrix elements in
are defined as
with the vectors
being obtained from
and for all
,
Here,
,
and the coefficients
can be derived from
the vector
is defined by
and
are free but otherwise arbitrary complex constants.
Theorem 2. The rogue wave solution for Equation (1) SB case iswith The matrix elements of
can be computed from
where the vectors
are defined by
and for all
Here, the coefficients and can be obtained from Equations (6) and (7); and are identical to those in Theorem 1.
Proposition 1. When for all r ≥ 1, the rogue waves in Theorems 1 and 2 are parity-time-symmetric, i.e., Indeed, on setting
in Theorems 1 and 2, we have
On applying a procedure similar to that of the derivative NLSE [
28], one can conclude that
, and the proposition is thus established. Based on this result, the maximum amplitude of the parity–time–symmetric solution of each order is attained at the center of the
x-
t plane, i.e., at (
x,
t) = (0, 0). This maximum amplitude of the parity–time–symmetric solution can now be readily determined by setting
. By employing this approach, we can implement direct calculations for the low-order cases:
which lead to the maximum amplitude of the
N-th order rogue waves:
The proofs of Theorems 1 and 2 are presented in
Appendix A.
3. Directions of Fundamental Rogue Waves
The dynamics and properties of rogue waves will now be studied. On setting
N = 1 in Theorems 1 and 2, we obtain the first-order rogue wave as
where
Here, corresponds to SE case and is SB case. The structure of the fundamental rogue wave is determined by the background parameters and the common group velocity of the first two wave packets.
The geometric profile of the rogue wave may be closely associated with modulation instability. Equation (1) admits the plane wave solutions seen in Equations (2) and (3). Small-amplitude disturbances are introduced on the plane wave:
where
A11,
A12,
A21,
A22,
A31, and
A32 are (numerically small) constants and
κ and Ω represent the wavenumber and angular frequency of the disturbance, respectively. For strong interactions and energy exchange among modes, the phase factors of the three wave trains should satisfy the triad resonance condition, i.e., the sums of wavenumbers and frequencies of modes 1 and 2 should be equal to the wave number and frequency, respectively, of mode 3. Mode 3 is called the ‘parent’ wave and modes 1 and 2 are termed the ‘daughter’ waves. The criterion for instability is the vanishing of the determinant of the coefficient matrix of the linearized stability equations:
Modulation instability occurs when the imaginary part of perturbation angular frequency is nonzero. For a fixed group velocity
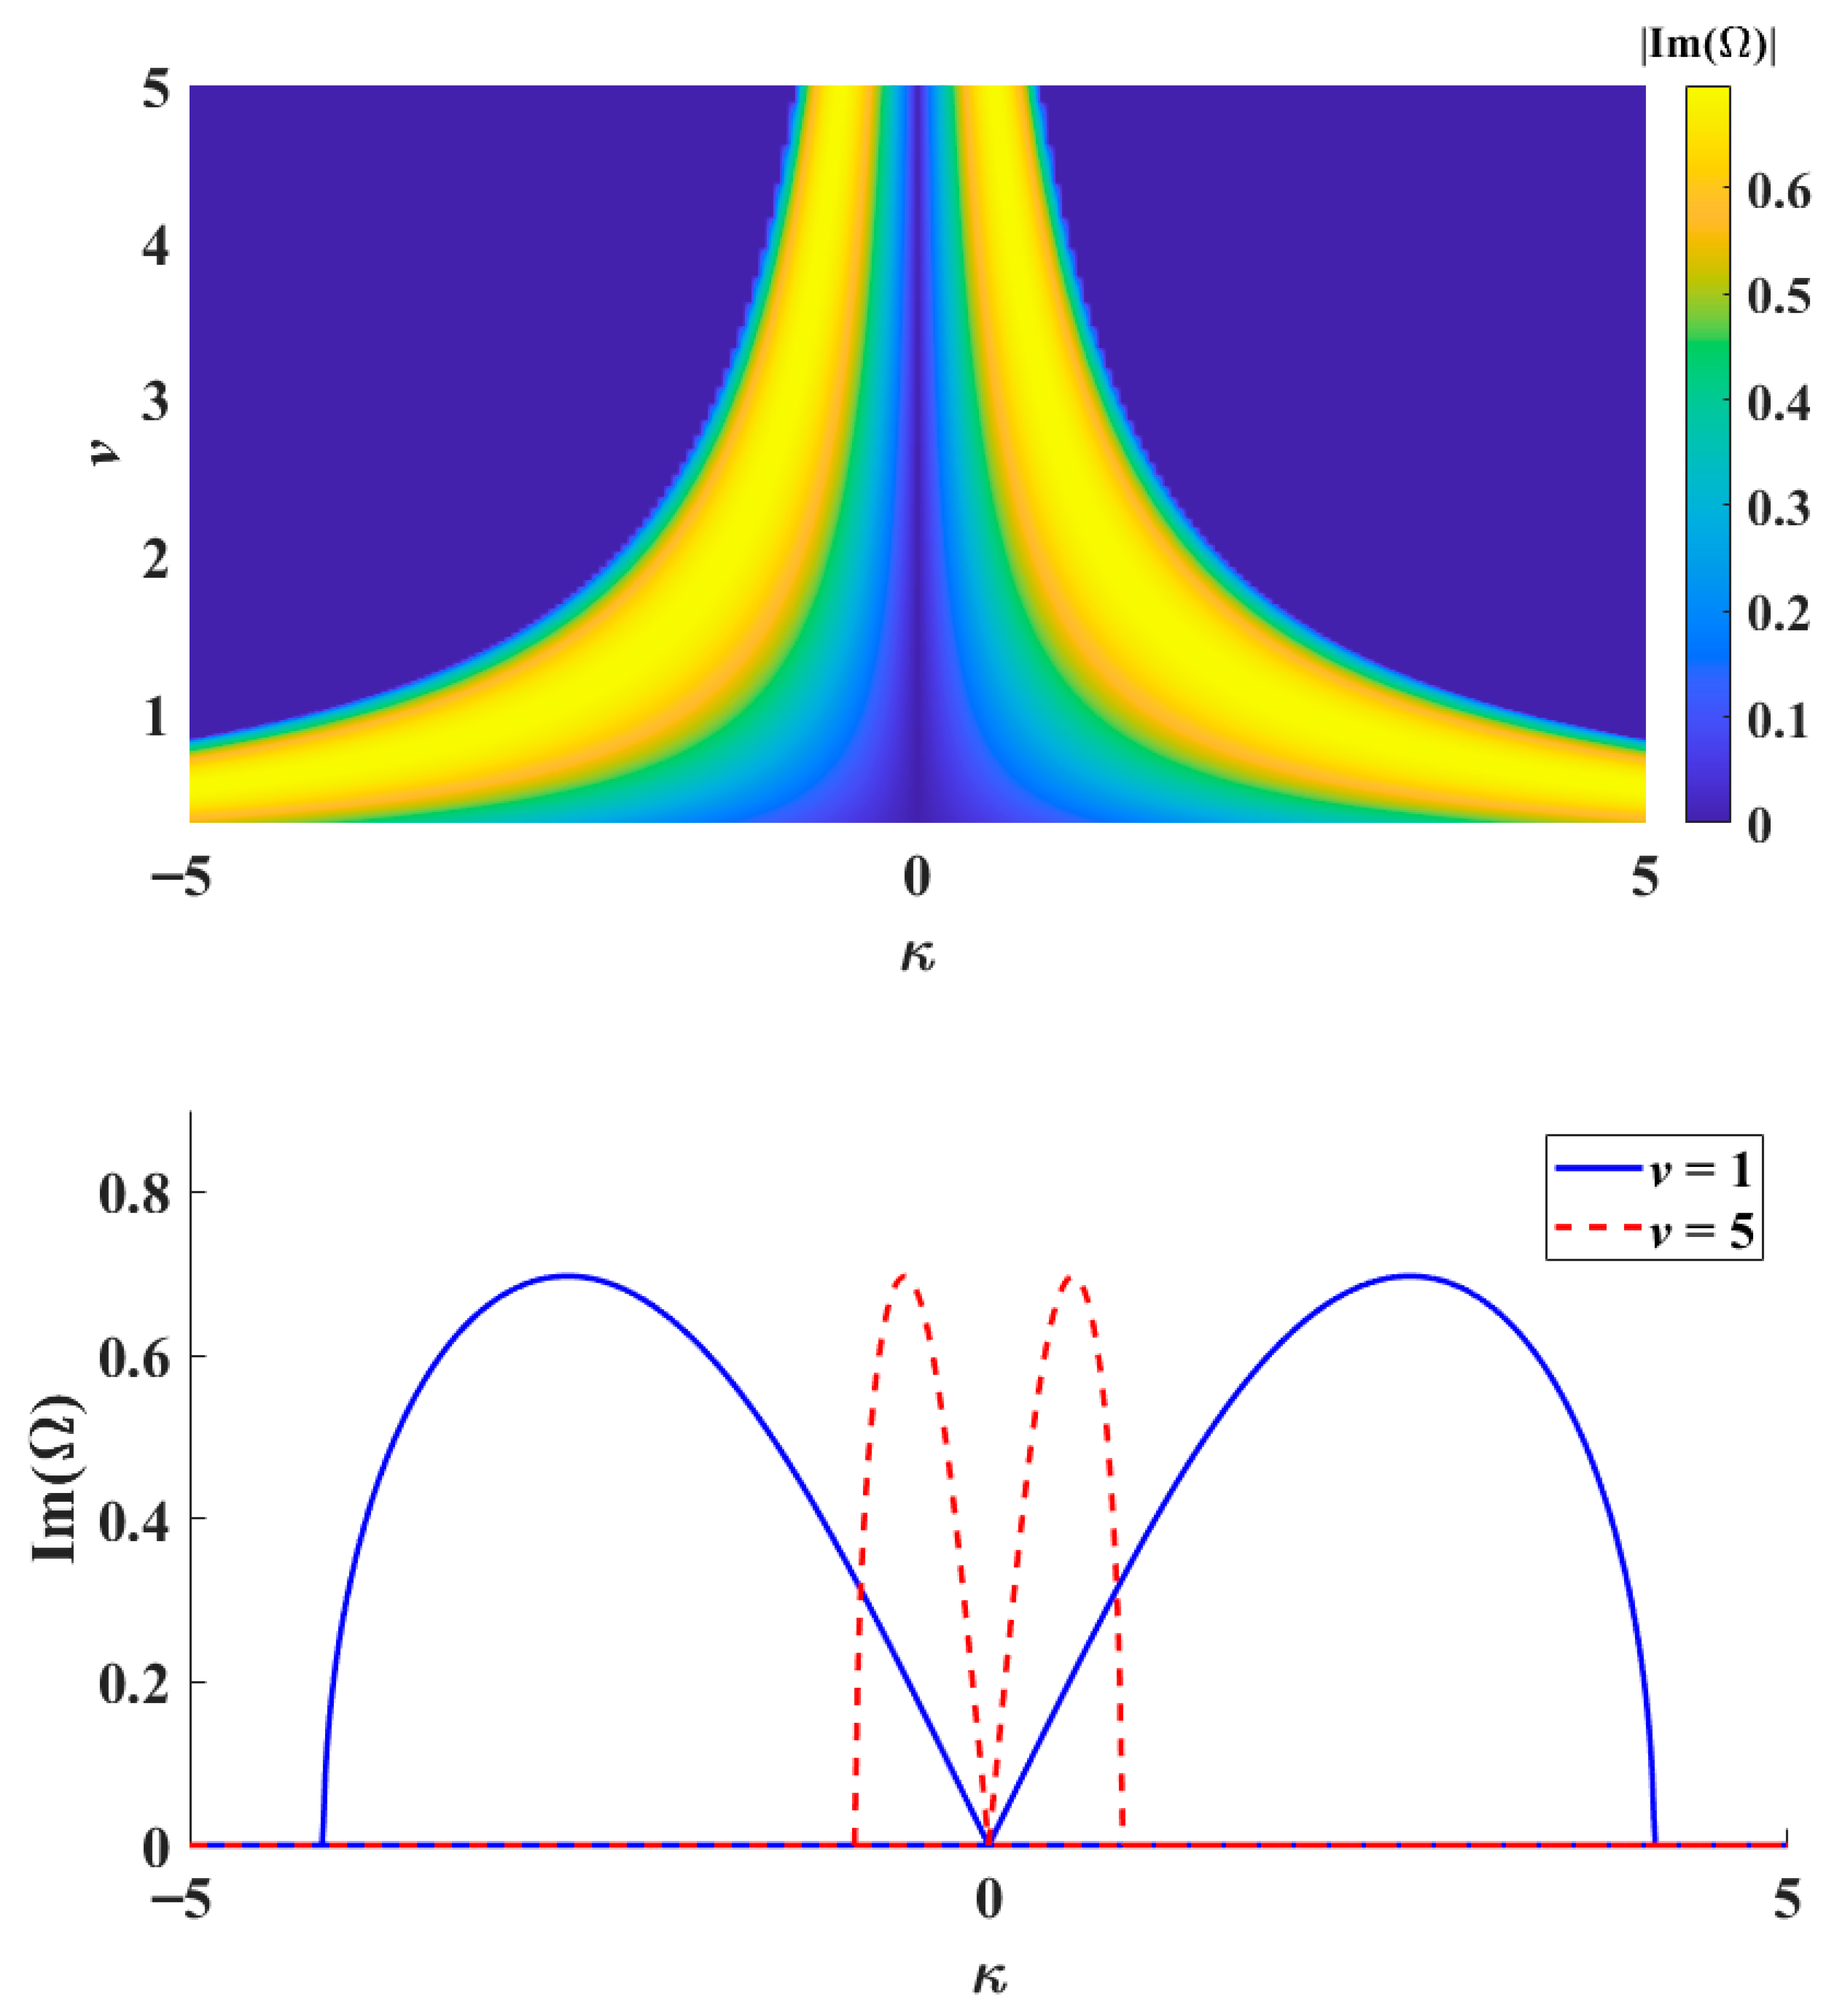
v, similar to the classical nonlinear Schrödinger equation, the maximum amplification due to modulation instability occurs at a finite perturbation wavenumber, κ. This optimal wavenumber will move toward the origin for increasing
v (top panel,
Figure 1), and the interval of unstable κ actually shrinks. However, the actual maximum amplification rate does stay nearly constant, as we vary
v (bottom panel,
Figure 1). Hence, the group velocity
v will affect the period of the breathers along the
x direction in FPUT phenomenon. The variation in the amplification rate of modulation instability, as shown in the top panel of
Figure 1, differs from that in our earlier work [
29], as the growth rate of modulation instability varies with the group velocity in the non-degenerate case.
The growth rates of modulation instability for the SE and SB cases as a function of κ and
a2 are shown in
Figure 2. The growth rates of modulation instability for the SE and SB cases are the same if we have identical plane-wave backgrounds for the three components, such as
a1 =
a2 =
a3 = 1. Otherwise, the growth rates for the SE and SB cases will differ. We illustrate these features with numerical examples. In the SE case, the optimal growth rate increases with an increase in the second background component,
a2. The interval of unstable wavenumber κ broadens quickly. For the SB case, the unstable interval of κ exceeds [−5, 5] as
a2 varies from approximately 0.2–0.45. With larger
a2, the unstable interval shrinks and remains unchanged at [−4, 4]. The maximum growth rate decreases as
a2 increases.
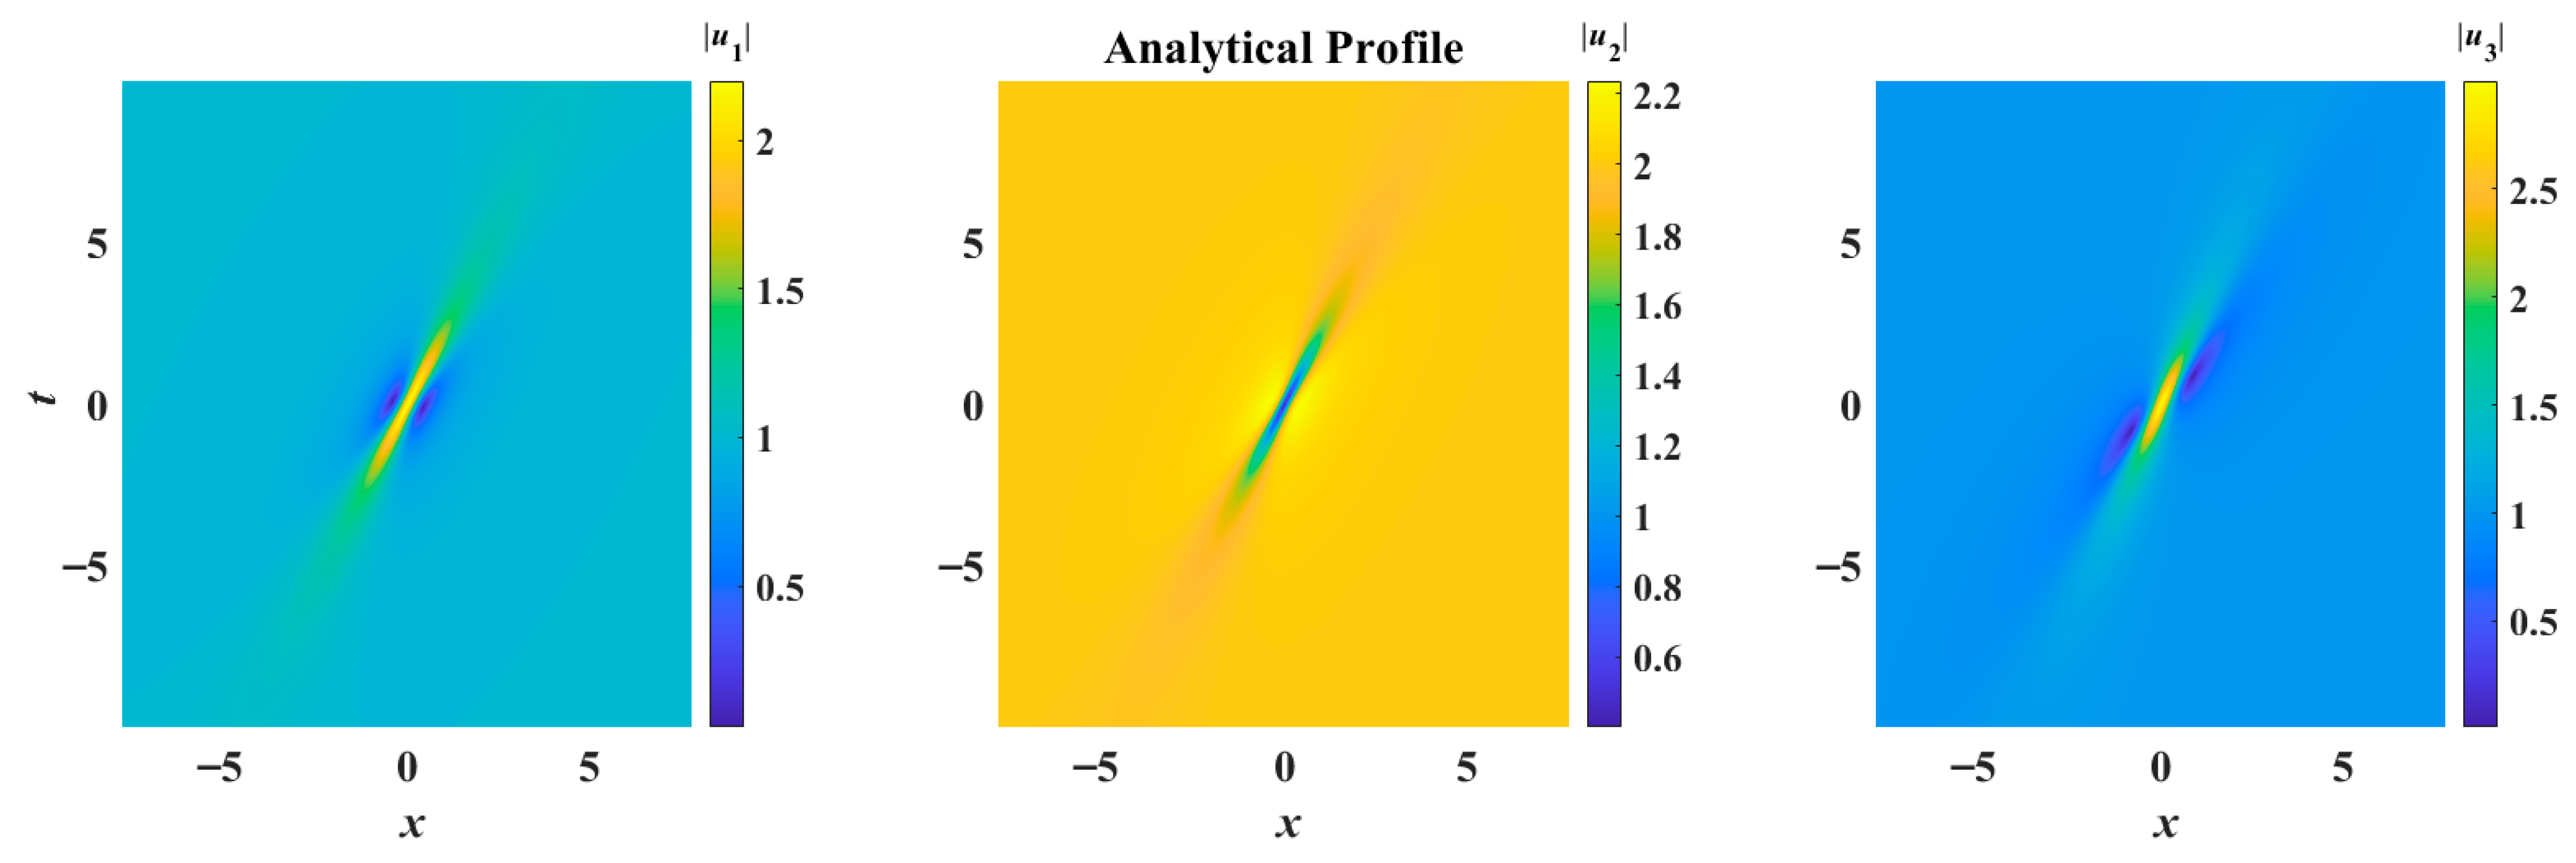
Examining the profiles of the lowest-order or fundamental rogue wave is instructive (
Figure 3). When the background state is
a1 =
a3 = 1,
a2 = 2, the three components display bright, dark, and bright rogue wave patterns for both the SE and SB cases. However, from
Figure 2, we observe that the growth rate of modulation instability in the SE case is larger than that in the SB case for this specific background. Consequently, the numerical simulation of the rogue wave in the SE case exhibits a higher degree of instability than that in the SB case.
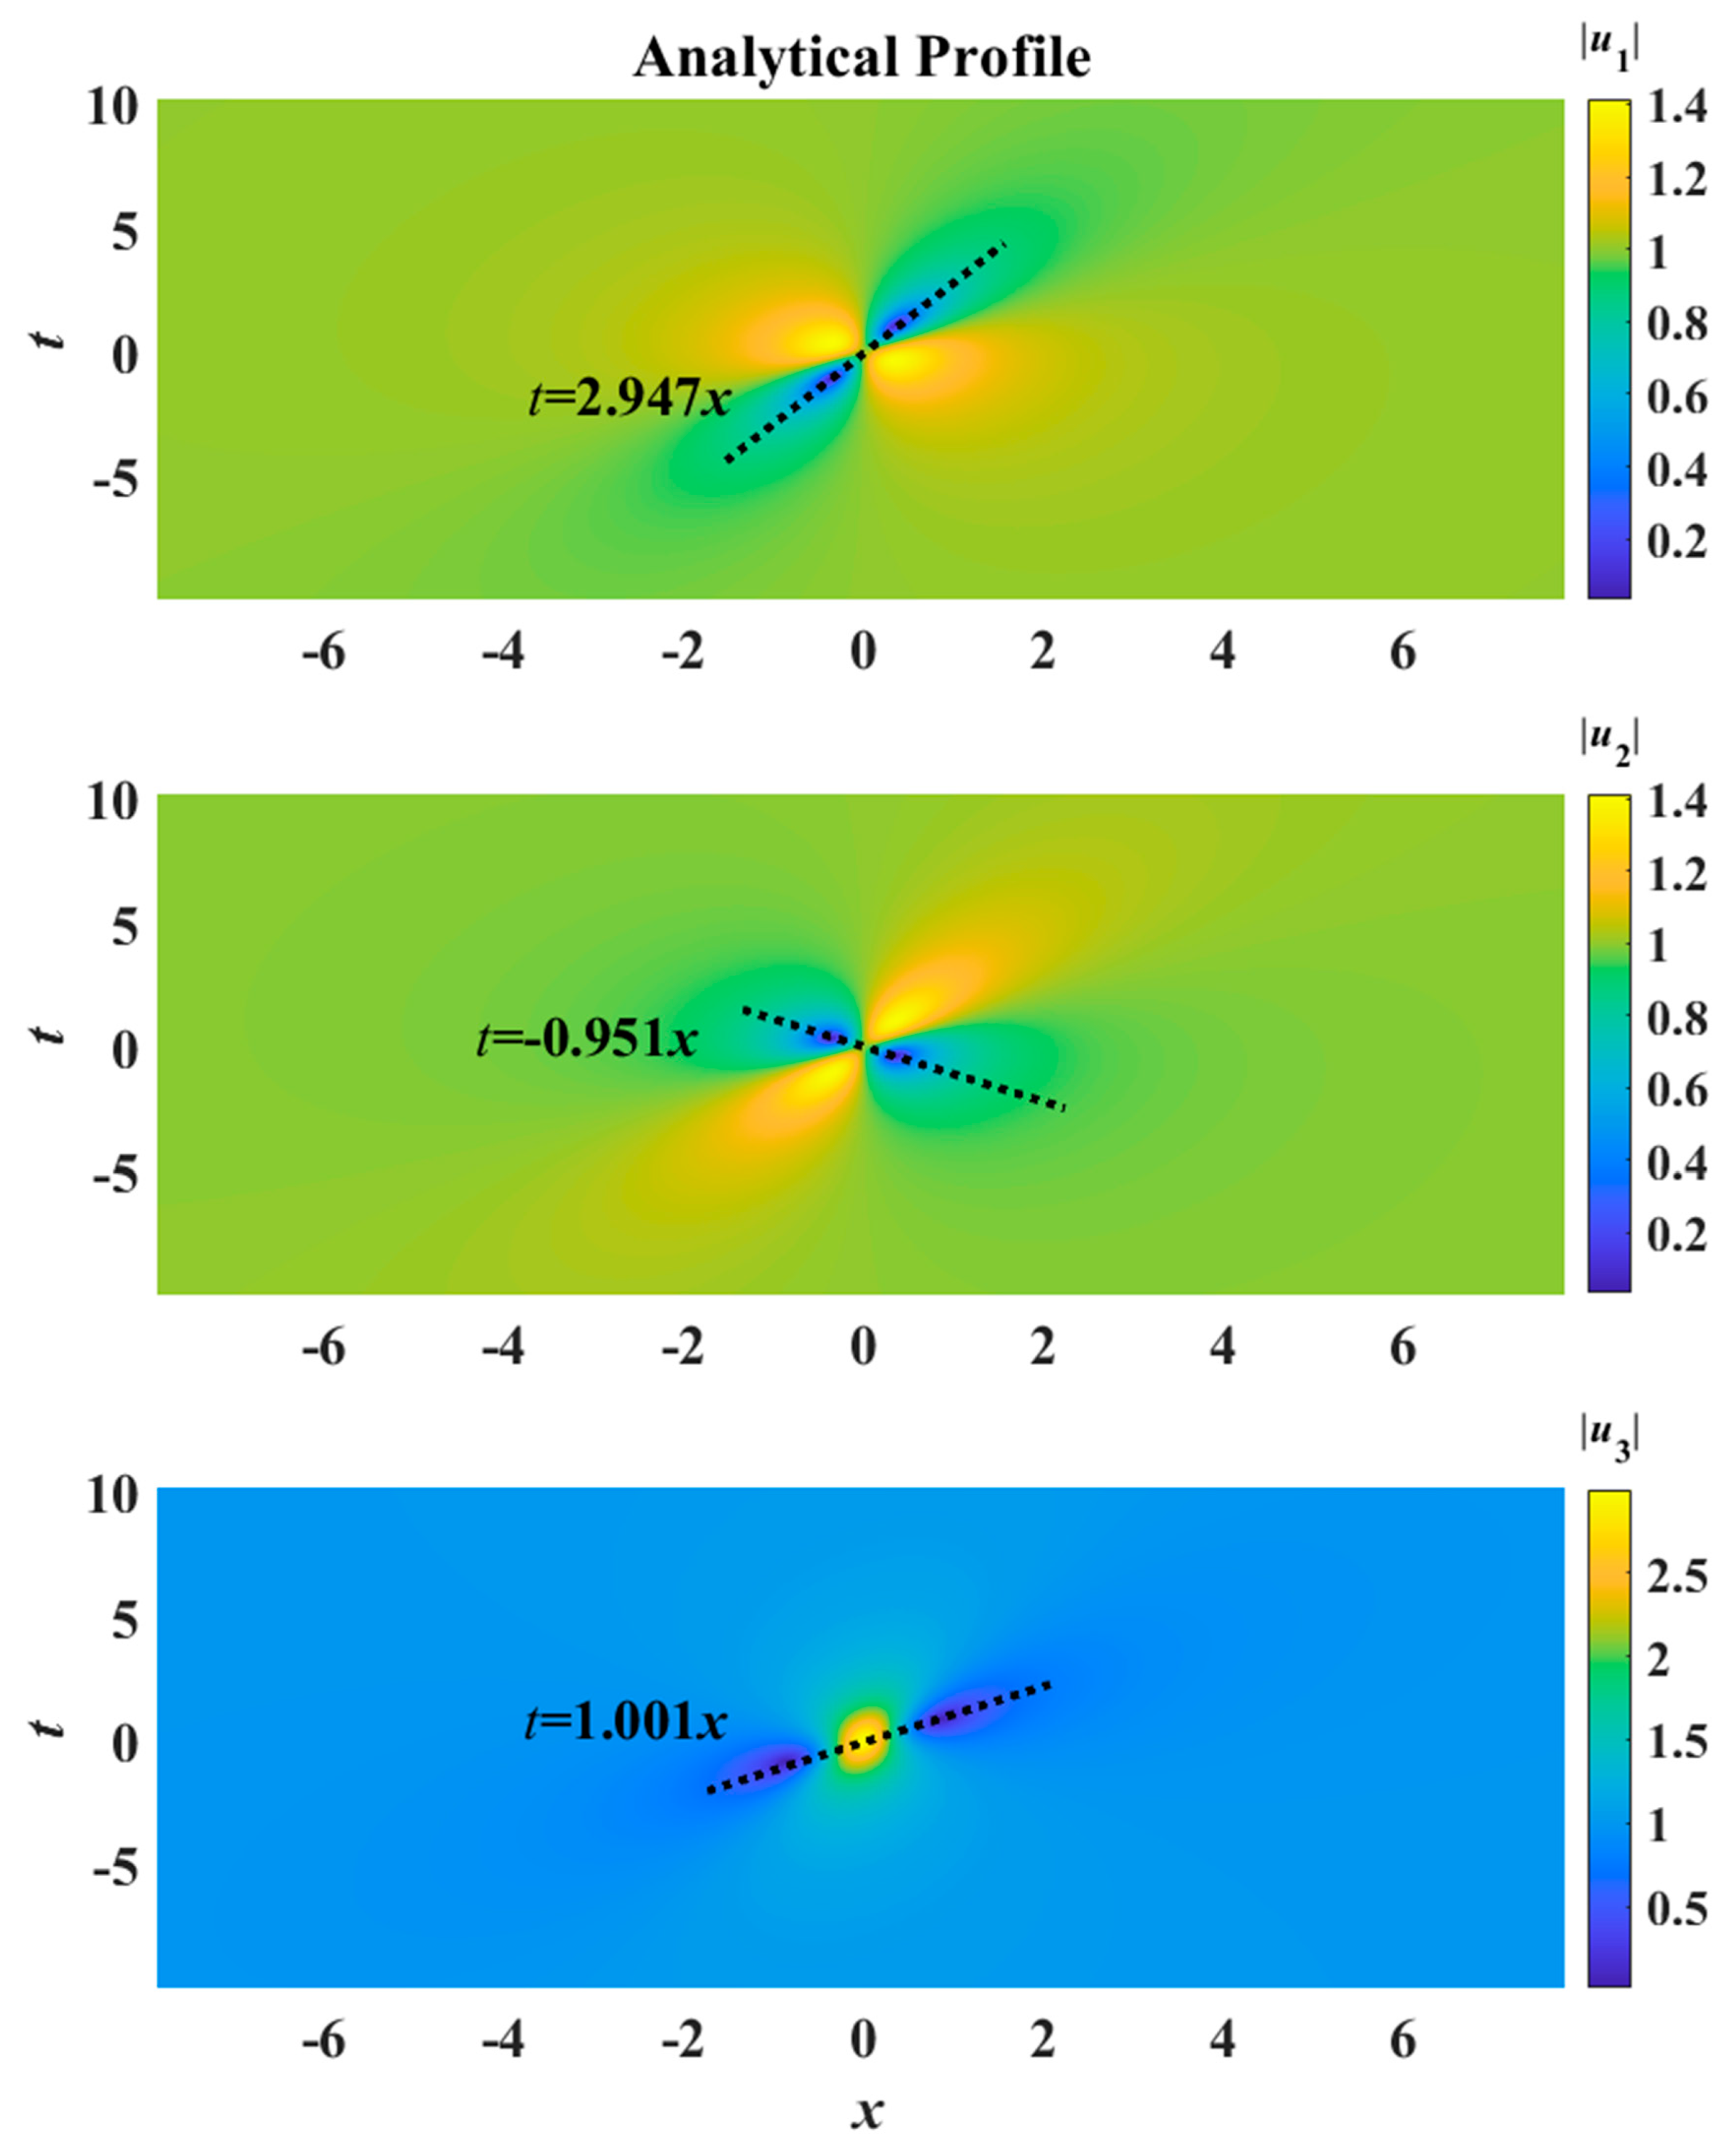
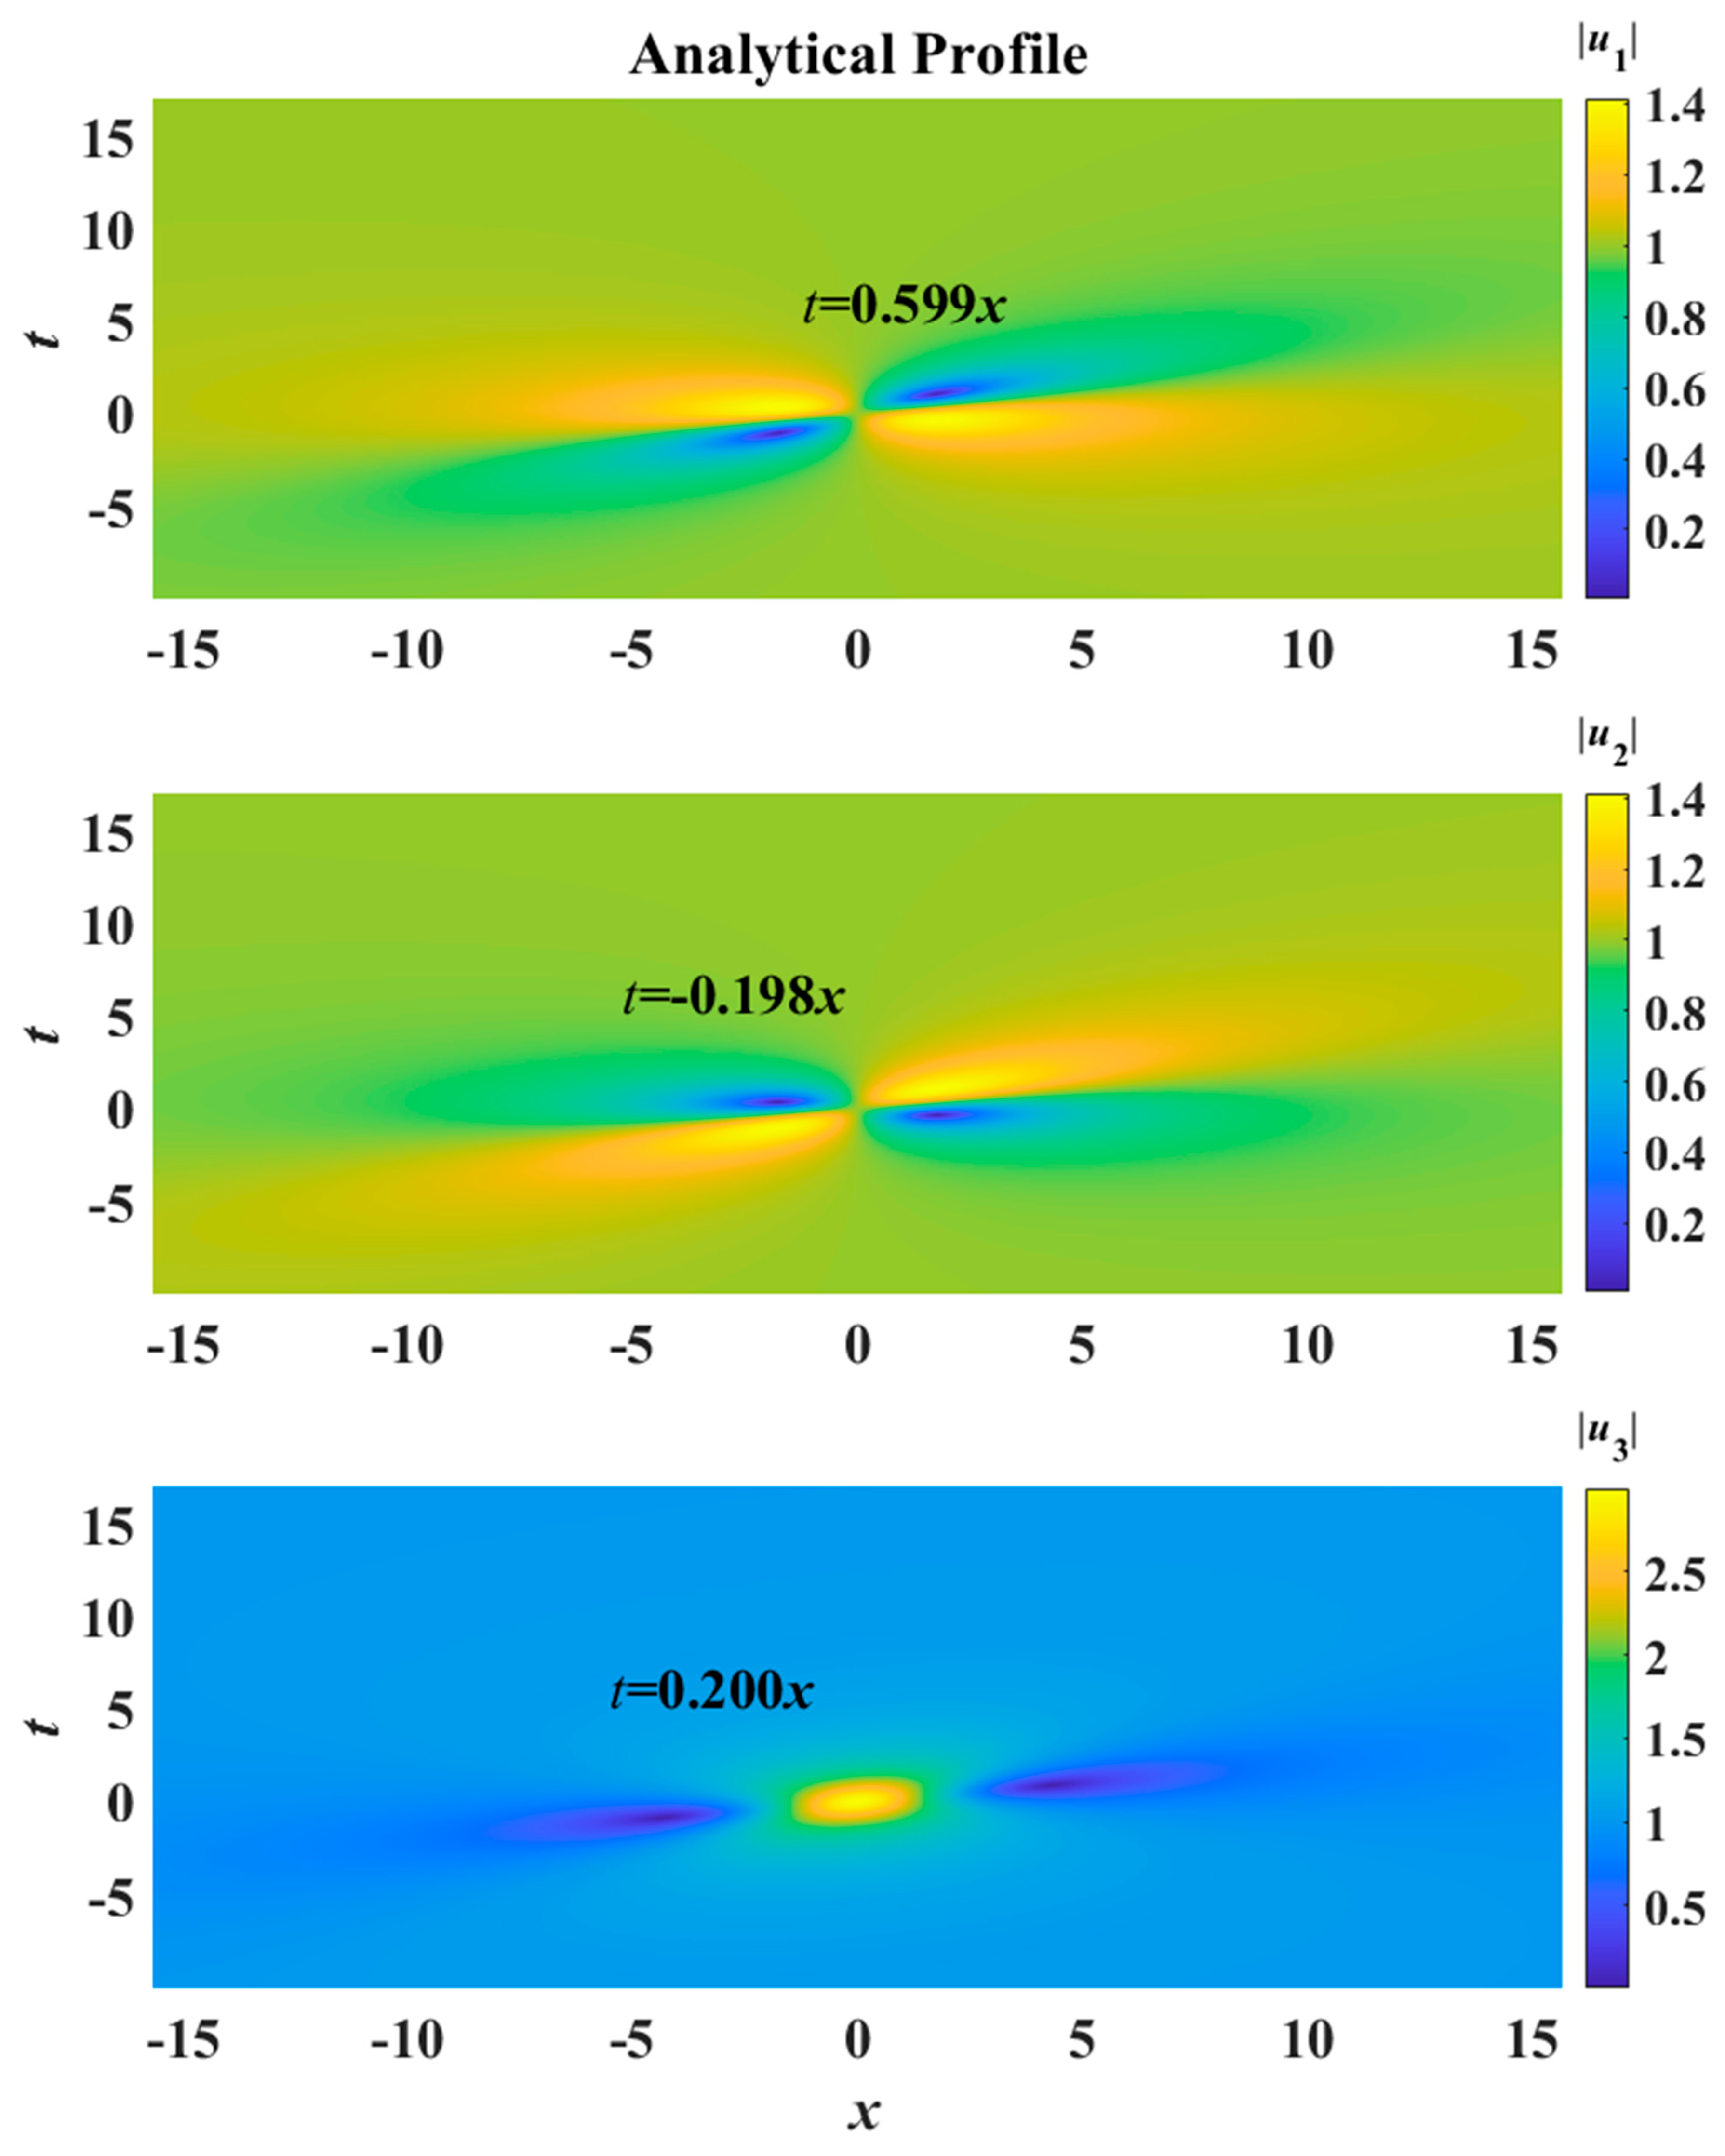
Figure 4 shows the rogue wave for the SE case with identical background, i.e.,
a1 =
a2 =
a3 = 1. The
u1 and
u2 components display a four-petal pattern (two peaks and two valleys), while the
u3 component takes on an eye-shaped form (one peak in the center with two valleys in a collinear manner). Mathematically, we draw dotted lines passing through the two valleys for each of the
u1 and
u2 components. We also draw a dotted line passing through the two valleys and the peak for the
u3 component. We call the direction of such lines the ‘
slope direction’. All three dotted lines pass through the point
x = 0,
t = 0. For all three components, we can determine the expressions for these three dotted lines in the
x-
t plane numerically (
Figure 4). As the displacements along these ‘slope directions’ attain maximum values in the
x-
t plane, they are important in terms of physical considerations like safety concerns for marine vessels and offshore structures. The profiles of the rogue wave in the
u1,
u2, and
u3 components are depicted (top panel in
Figure 5). The plots of the
u1 and
u2 components coincide due to the special choice of the parameters
a1,
a2, and
a3, as mathematically determined by the expressions of the rogue wave solutions (Equation (11)). The
u3 component, being the ‘parent wave’, is distinct from
u1 and
u2 (the ‘daughter waves’).
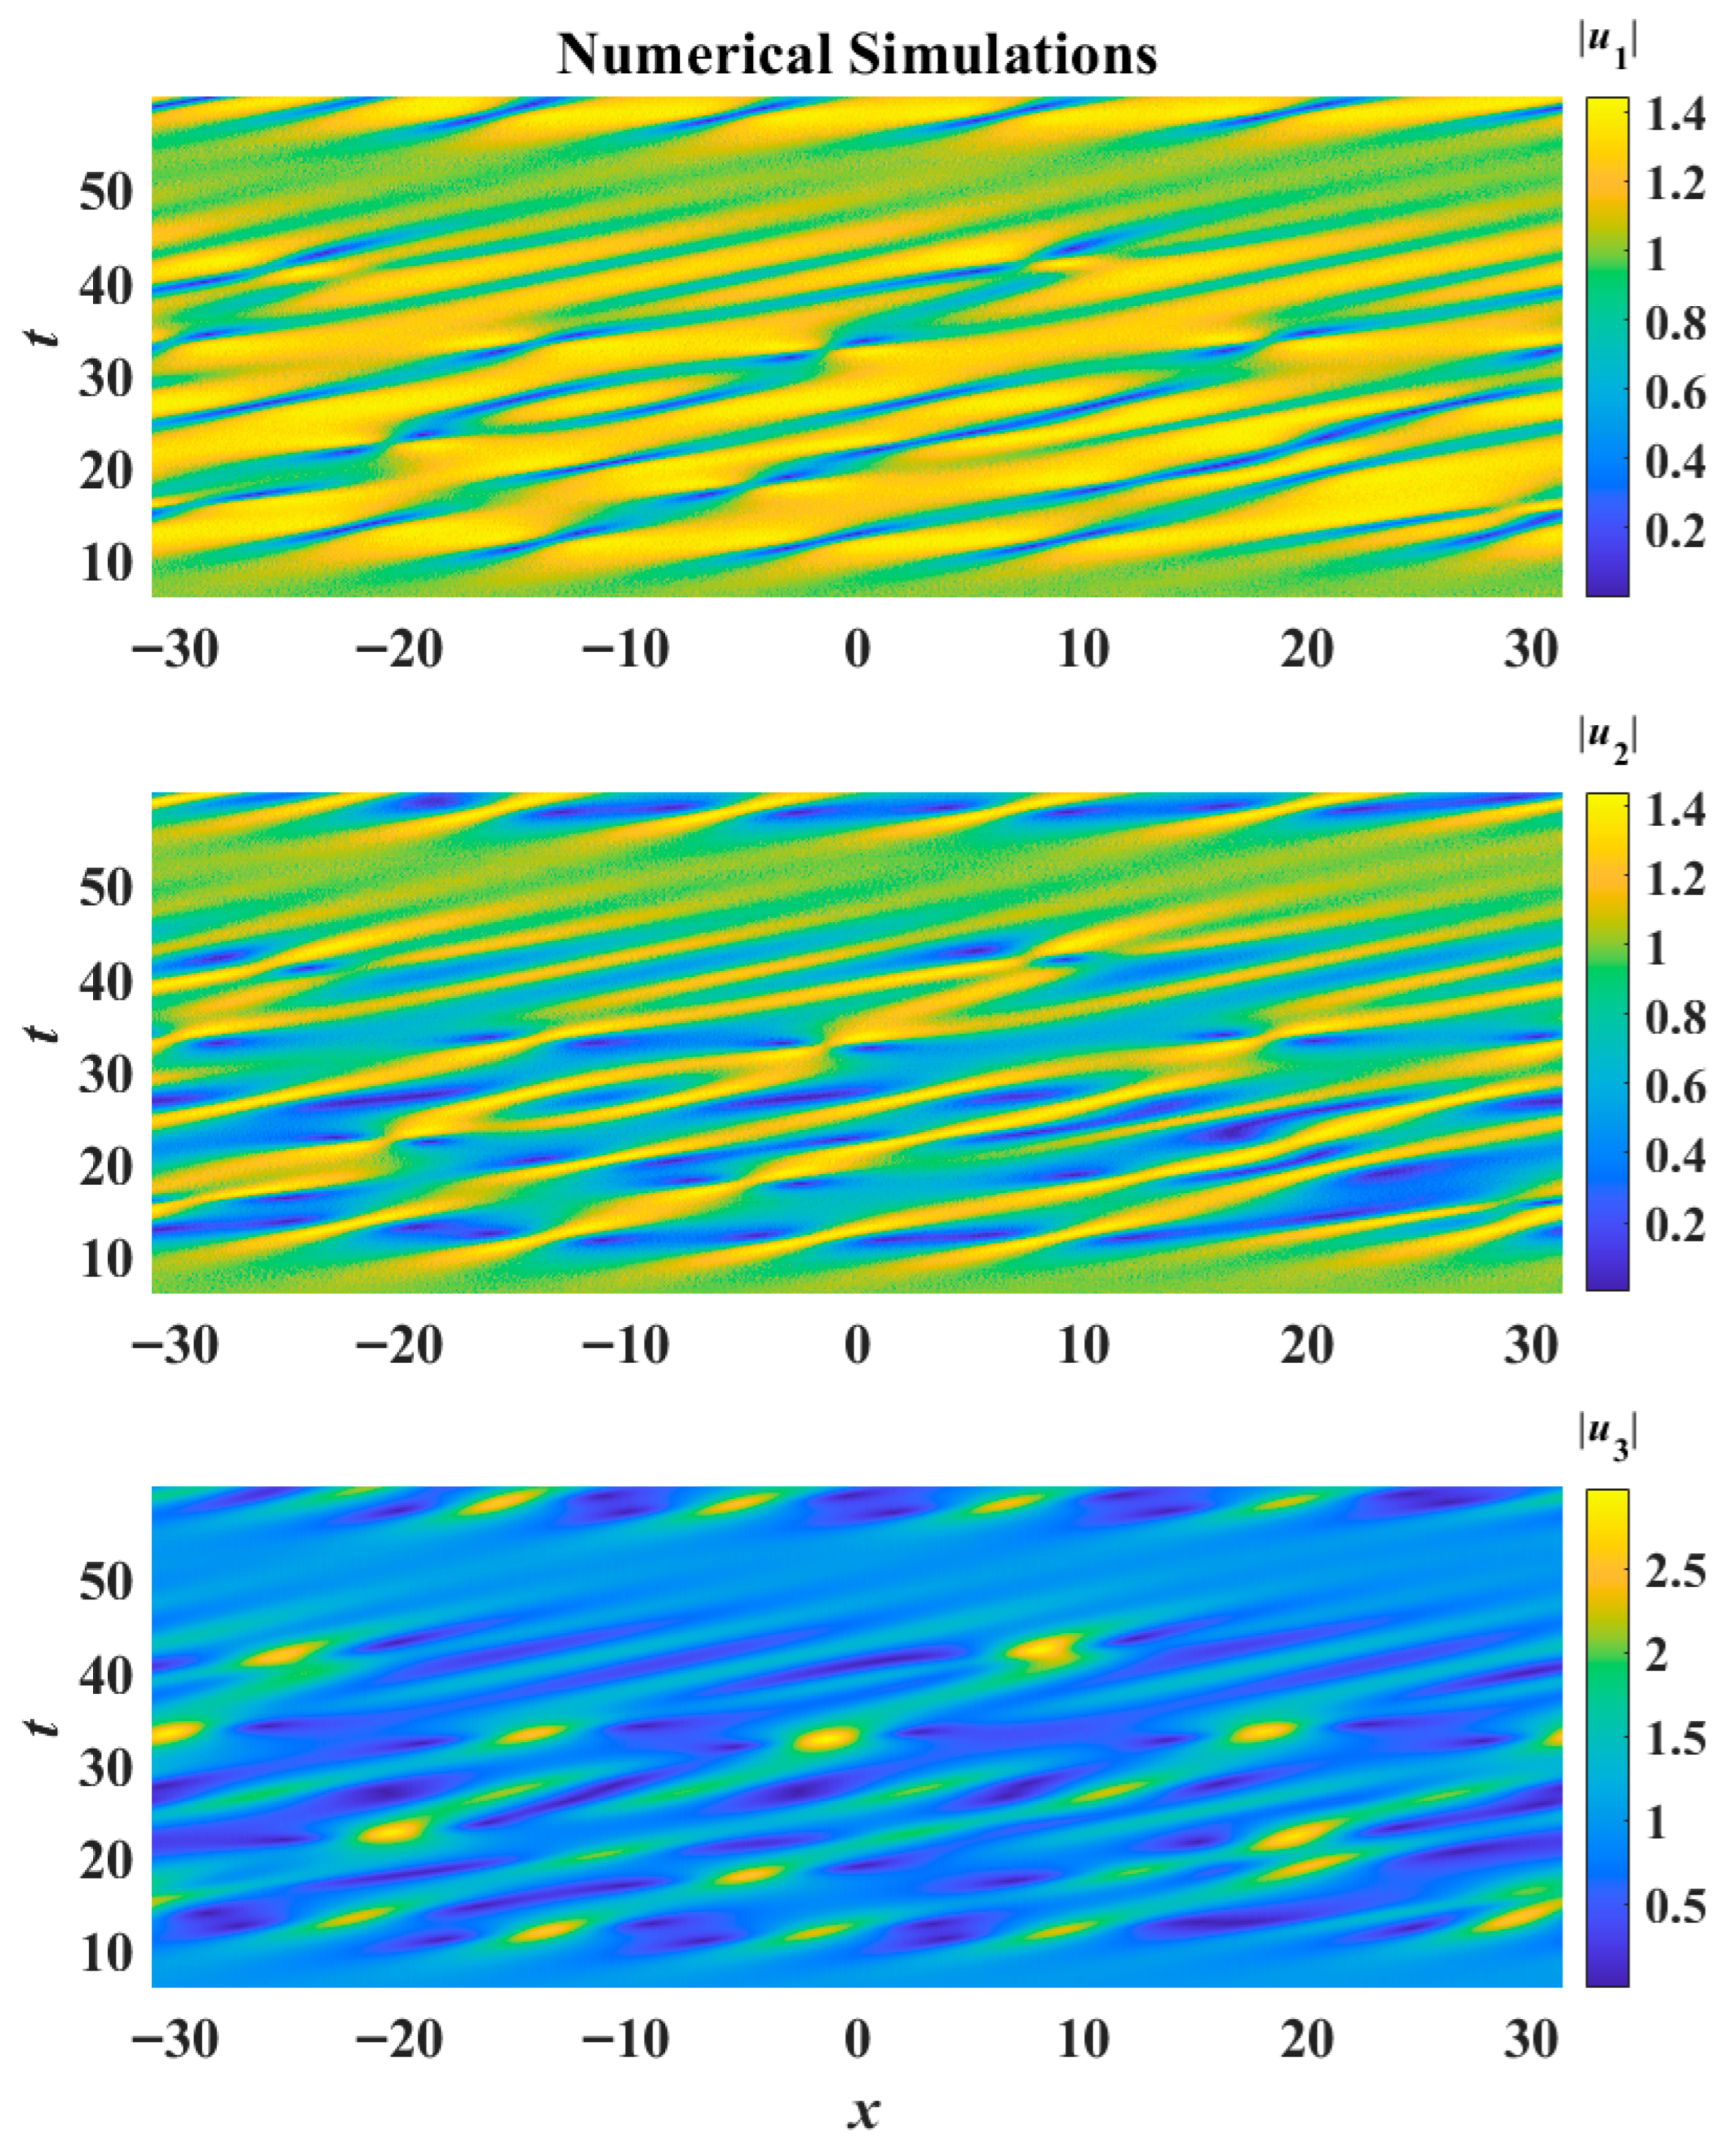
To highlight the importance of these slope directions, we perform numerical simulations using a split-step Fourier method with random noise as disturbance. The initial condition is selected as
where
μ is the perturbation intensity and
rj (
j = 1, 2, 3) is the white Gaussian noise generated from the widely used software package MATLAB R2022a. We progress forward in time (
t) in Equation (1) to obtain a chaotic wave field (
Figure 6). We can observe localized modes in this chaotic wave field in the
u1,
u2, and
u3 components, with slope directions very similar to the analytical rogue waves depicted in
Figure 4. This suggests that the slope directions can serve as useful predictors of the orientation of possible rogue modes in chaotic wave fields. To observe the wave profiles of these rogue modes in a chaotic wave field more clearly, we utilize a second example by observing the lowest-order rogue wave for another value of group velocity (
v = 5,
Figure 7). We also include the slope directions of the rogue waves in the three components. The cross-sectional profiles of the rogue waves are included for comparison (the middle panel in
Figure 5). Comparing these scenarios (
Figure 4 and
Figure 7), we conclude that the amplitudes remain unchanged, while the widths of the rogue waves become larger as the group velocity
v increases. Furthermore, the slope directions also change. Numerically, the chaotic wave fields for the
u1,
u2, and
u3 components generated from initial random noise conditions are also included as a reference (
Figure 8). It is evident that the orientation of the localized building blocks in the chaotic wave field aligns well with the slope direction of the fundamental rogue wave for each component. By analyzing these data obtained from the simulations, we can construct an empirical chart of ‘likelihood of occurrence’, which will be loosely termed ‘probability density function’ in the present context. The results for the amplitudes of the
u3 component are illustrated in the bottom panel in
Figure 5. The probability density functions for the cases of
v = 1 and
v = 5 are represented by the blue and red-dashed curves, respectively. Roughly speaking, the probability of the rogue wave occurrence for
v = 1 is higher than that for
v = 5. Hence, this group velocity of the degenerate triad resonance case,
v, has significant effects on the occurrence of rogue waves. We shall also address the impact of
v on the width, amplitude and slope direction of rogue wave in
x-
t plane (
Figure 9). The widths of rogue waves in the
u1,
u2 and
u3 components generally increase with
v, while the amplitudes remain unchanged. These properties may also be explained by the features of modulation instability (
Figure 1). The amplitude keeps unchanged as the growth rate of the modulation instability remains constant with
v varying. On the other hand, the range of unstable wavenumbers decreases with
v, leading to an increase in the period of breather in FPUT (only modes of long wavelength can amplify). As a result, fewer peaks of the breather are observed within a given time interval. This may explain the increase in the width with
v. The slopes of the
u1 and
u3 components decrease with
v increasing, whereas the slope of the
u2 component increases with
v. Finally, all the three slope directions eventually tend to align parallel to the
x direction.
4. Spectra of Higher-Order Rogue Waves
Higher-order rogue waves constitute a valuable route of investigation, as their maximum displacements can be larger than those of fundamental rogue waves [
30,
31]. To obtain the second-order rogue waves of Equation (1), we set
in Theorems 1 and 2. In this case, we have
where the elements of the matrices are given by
and
with
corresponding to the SE case and
representing the SB case. From these explicit expressions, the functions
are polynomials of six degrees with respect to variables
and
.
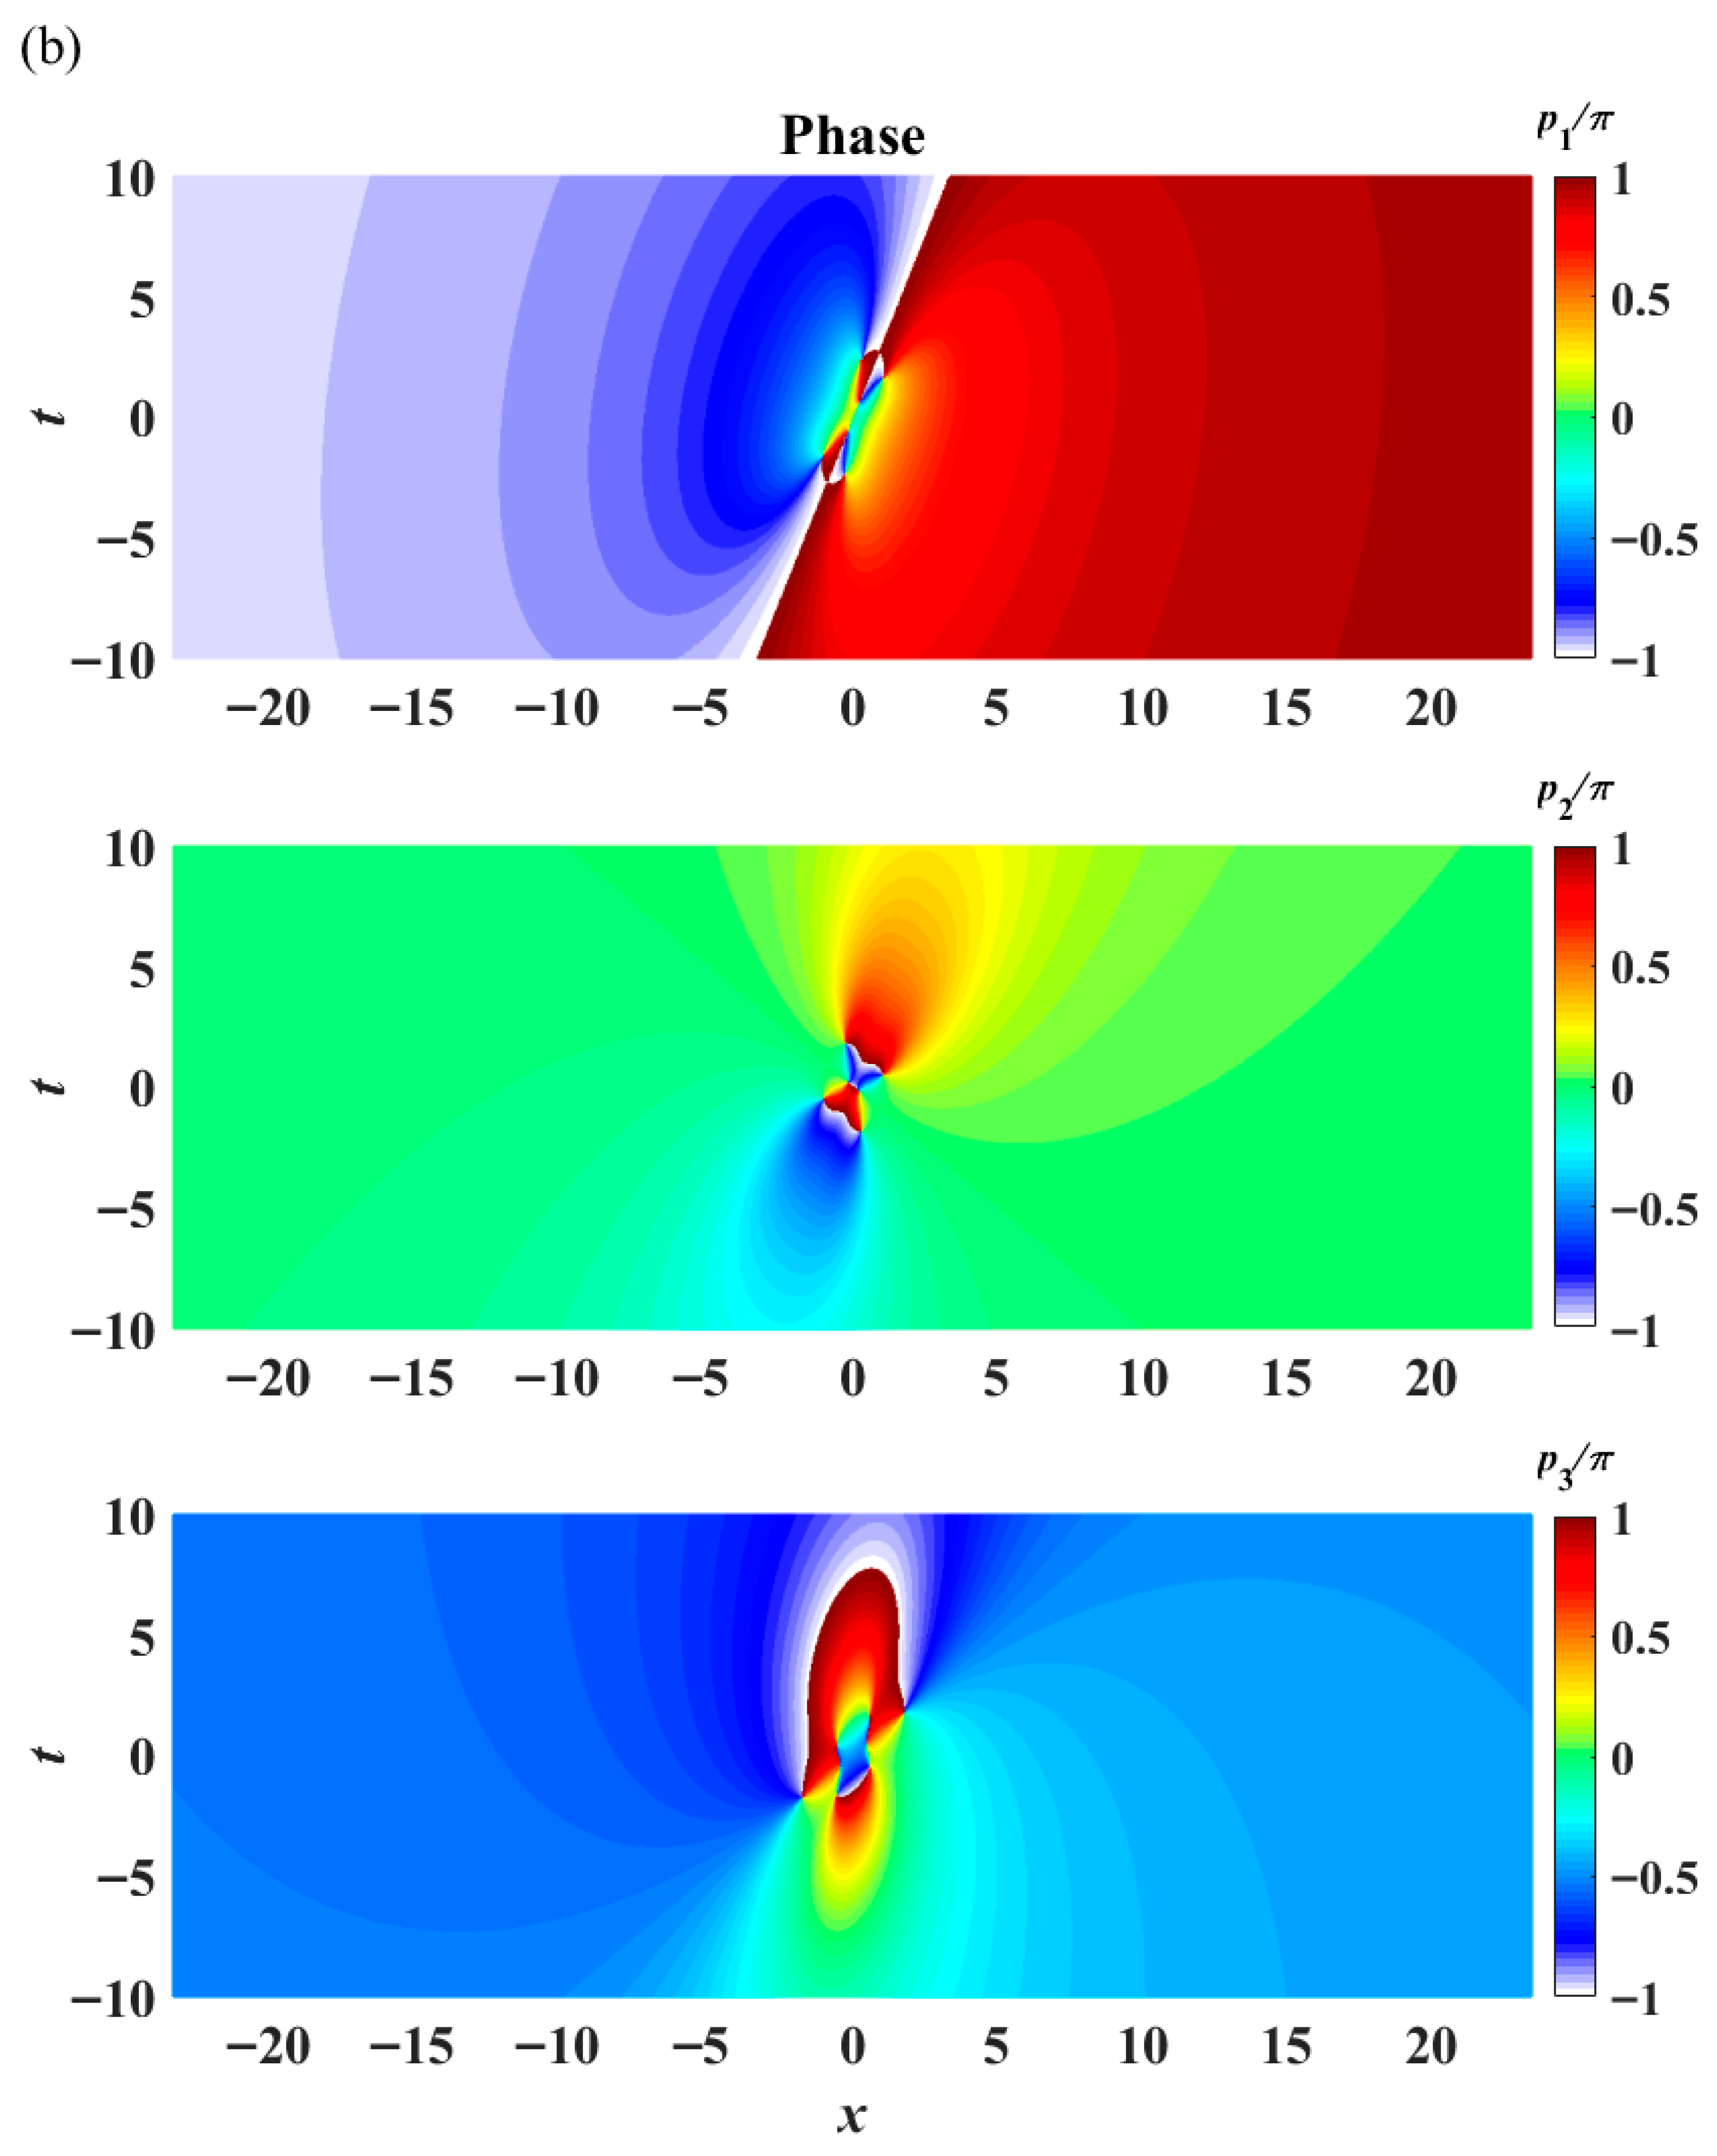
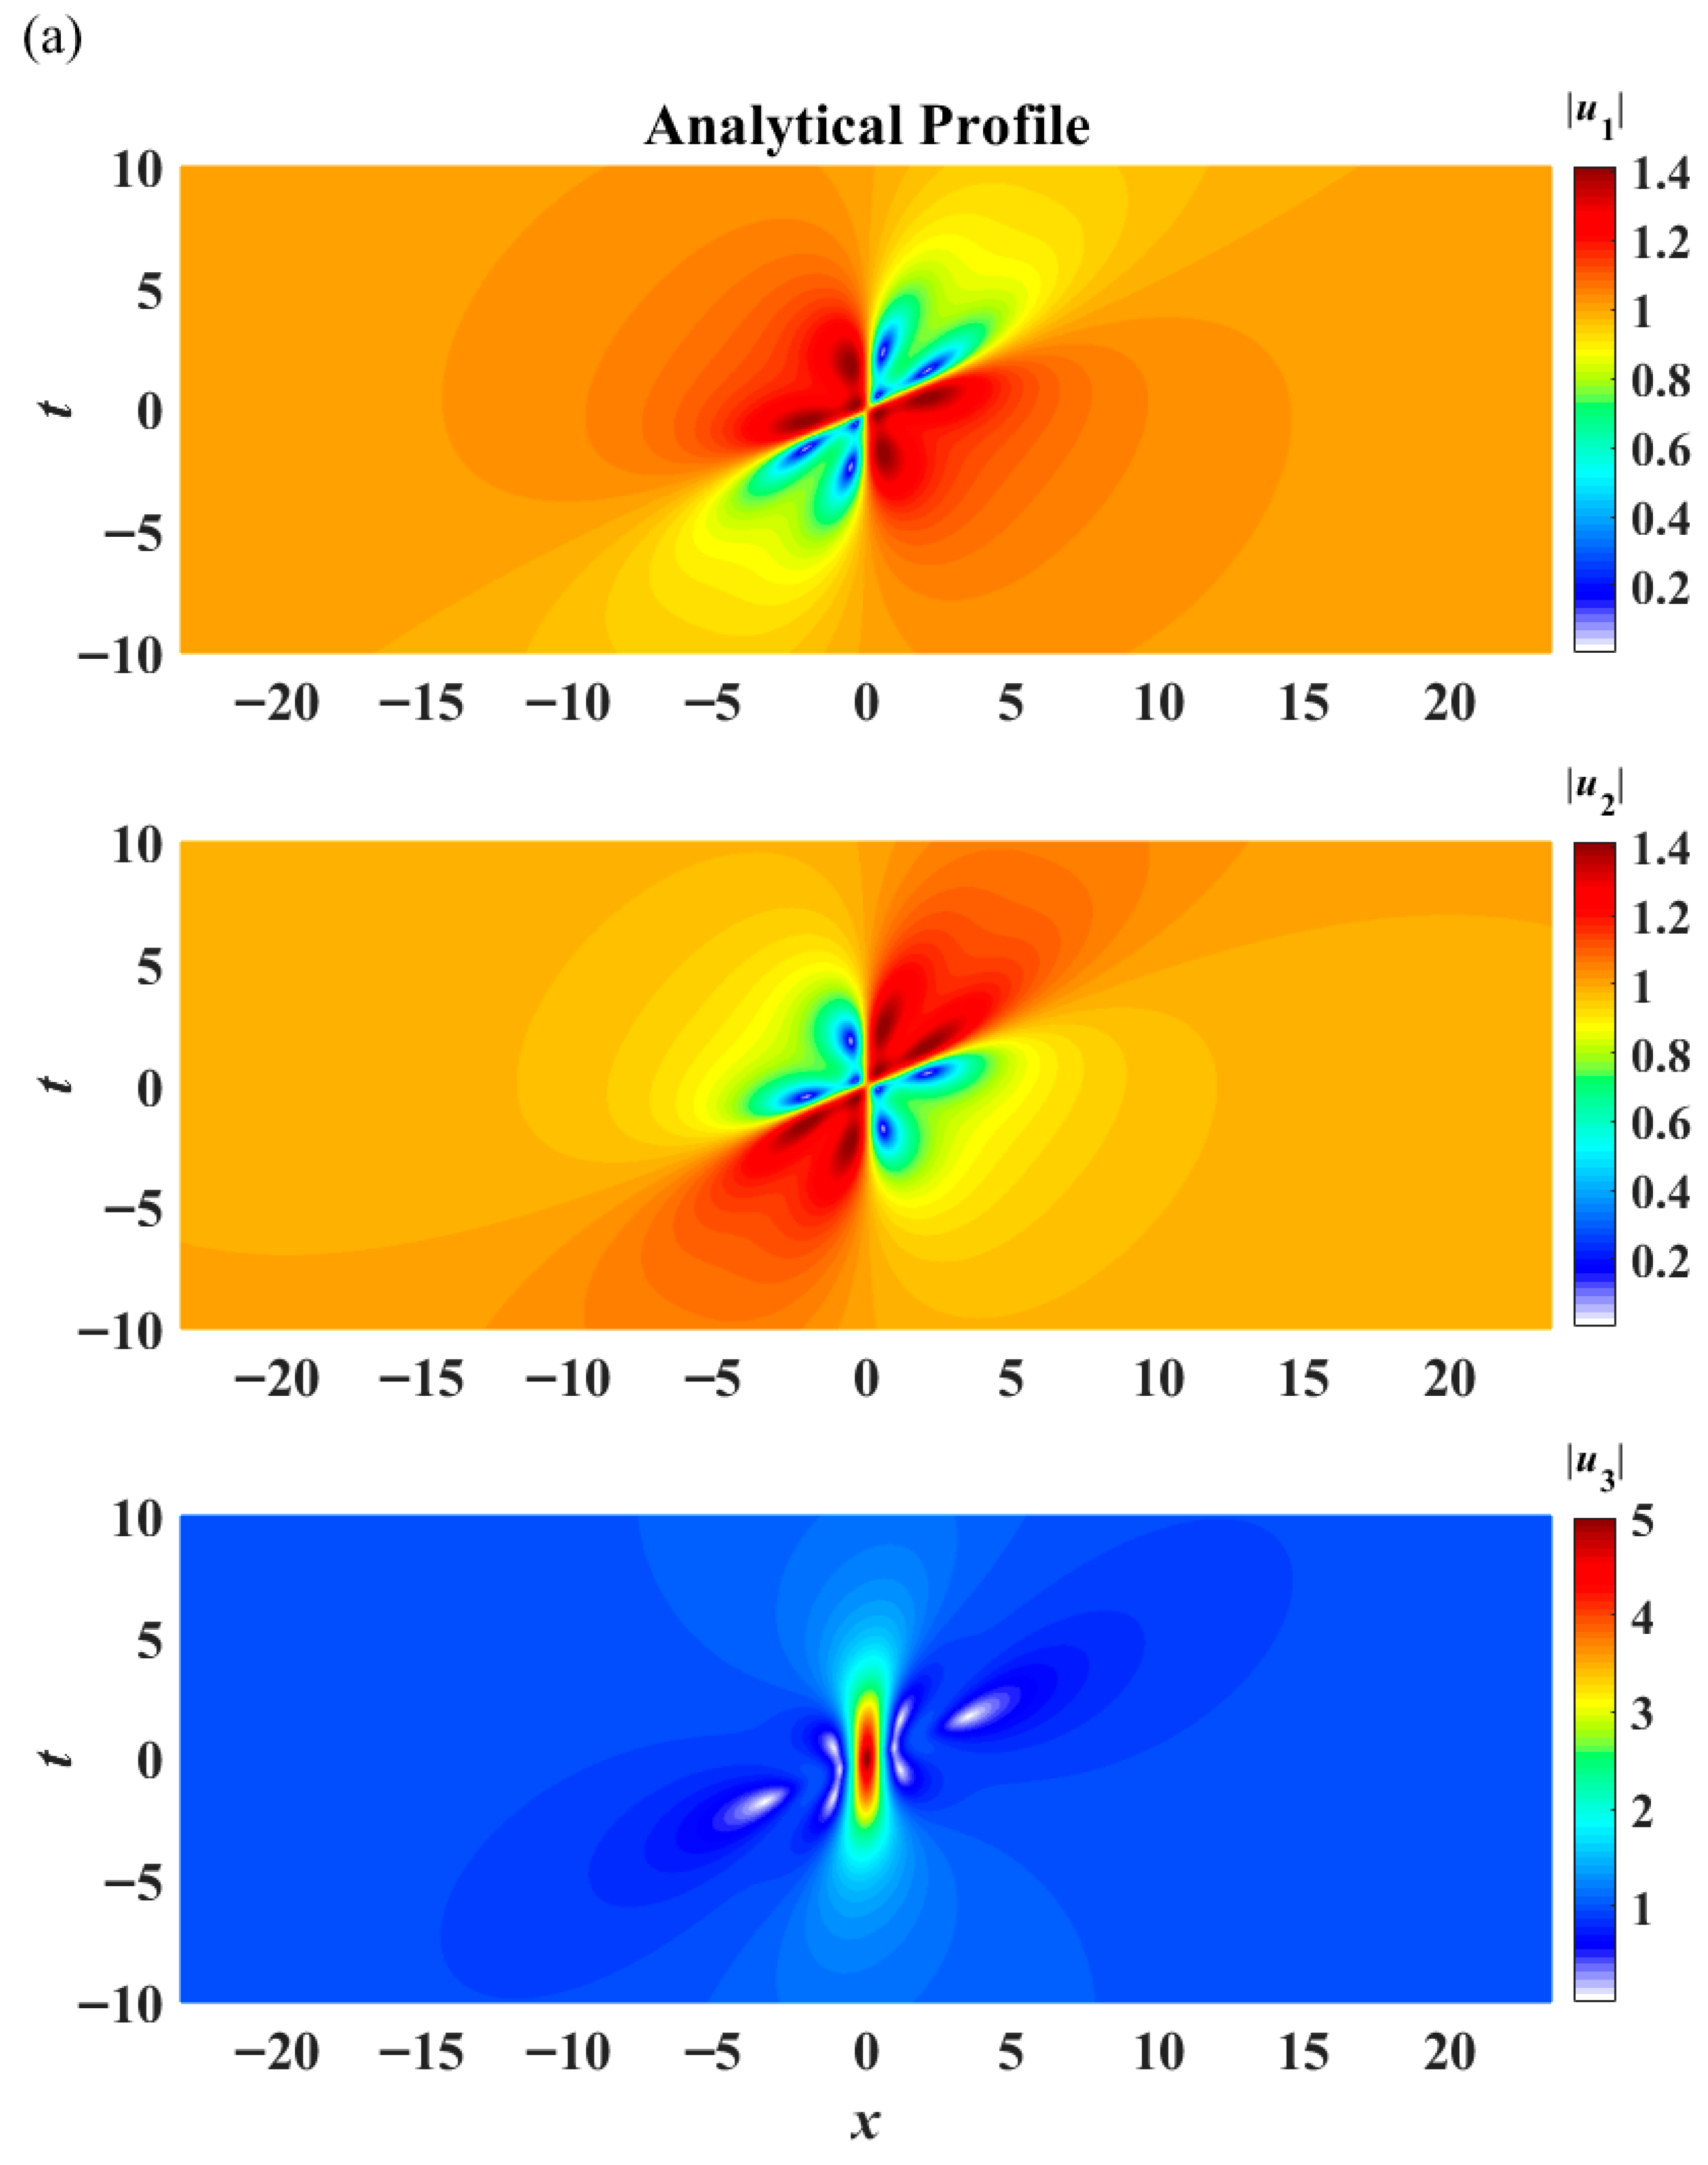
Naturally, a second-order rogue wave displays more intriguing profiles (
Figure 10a, Equation (15)). The
u1 and
u2 components exhibit ‘butterfly structures’ (similar to the four-petal case of the fundamental rogue wave, but there are multiple peaks or valleys within each sector). The
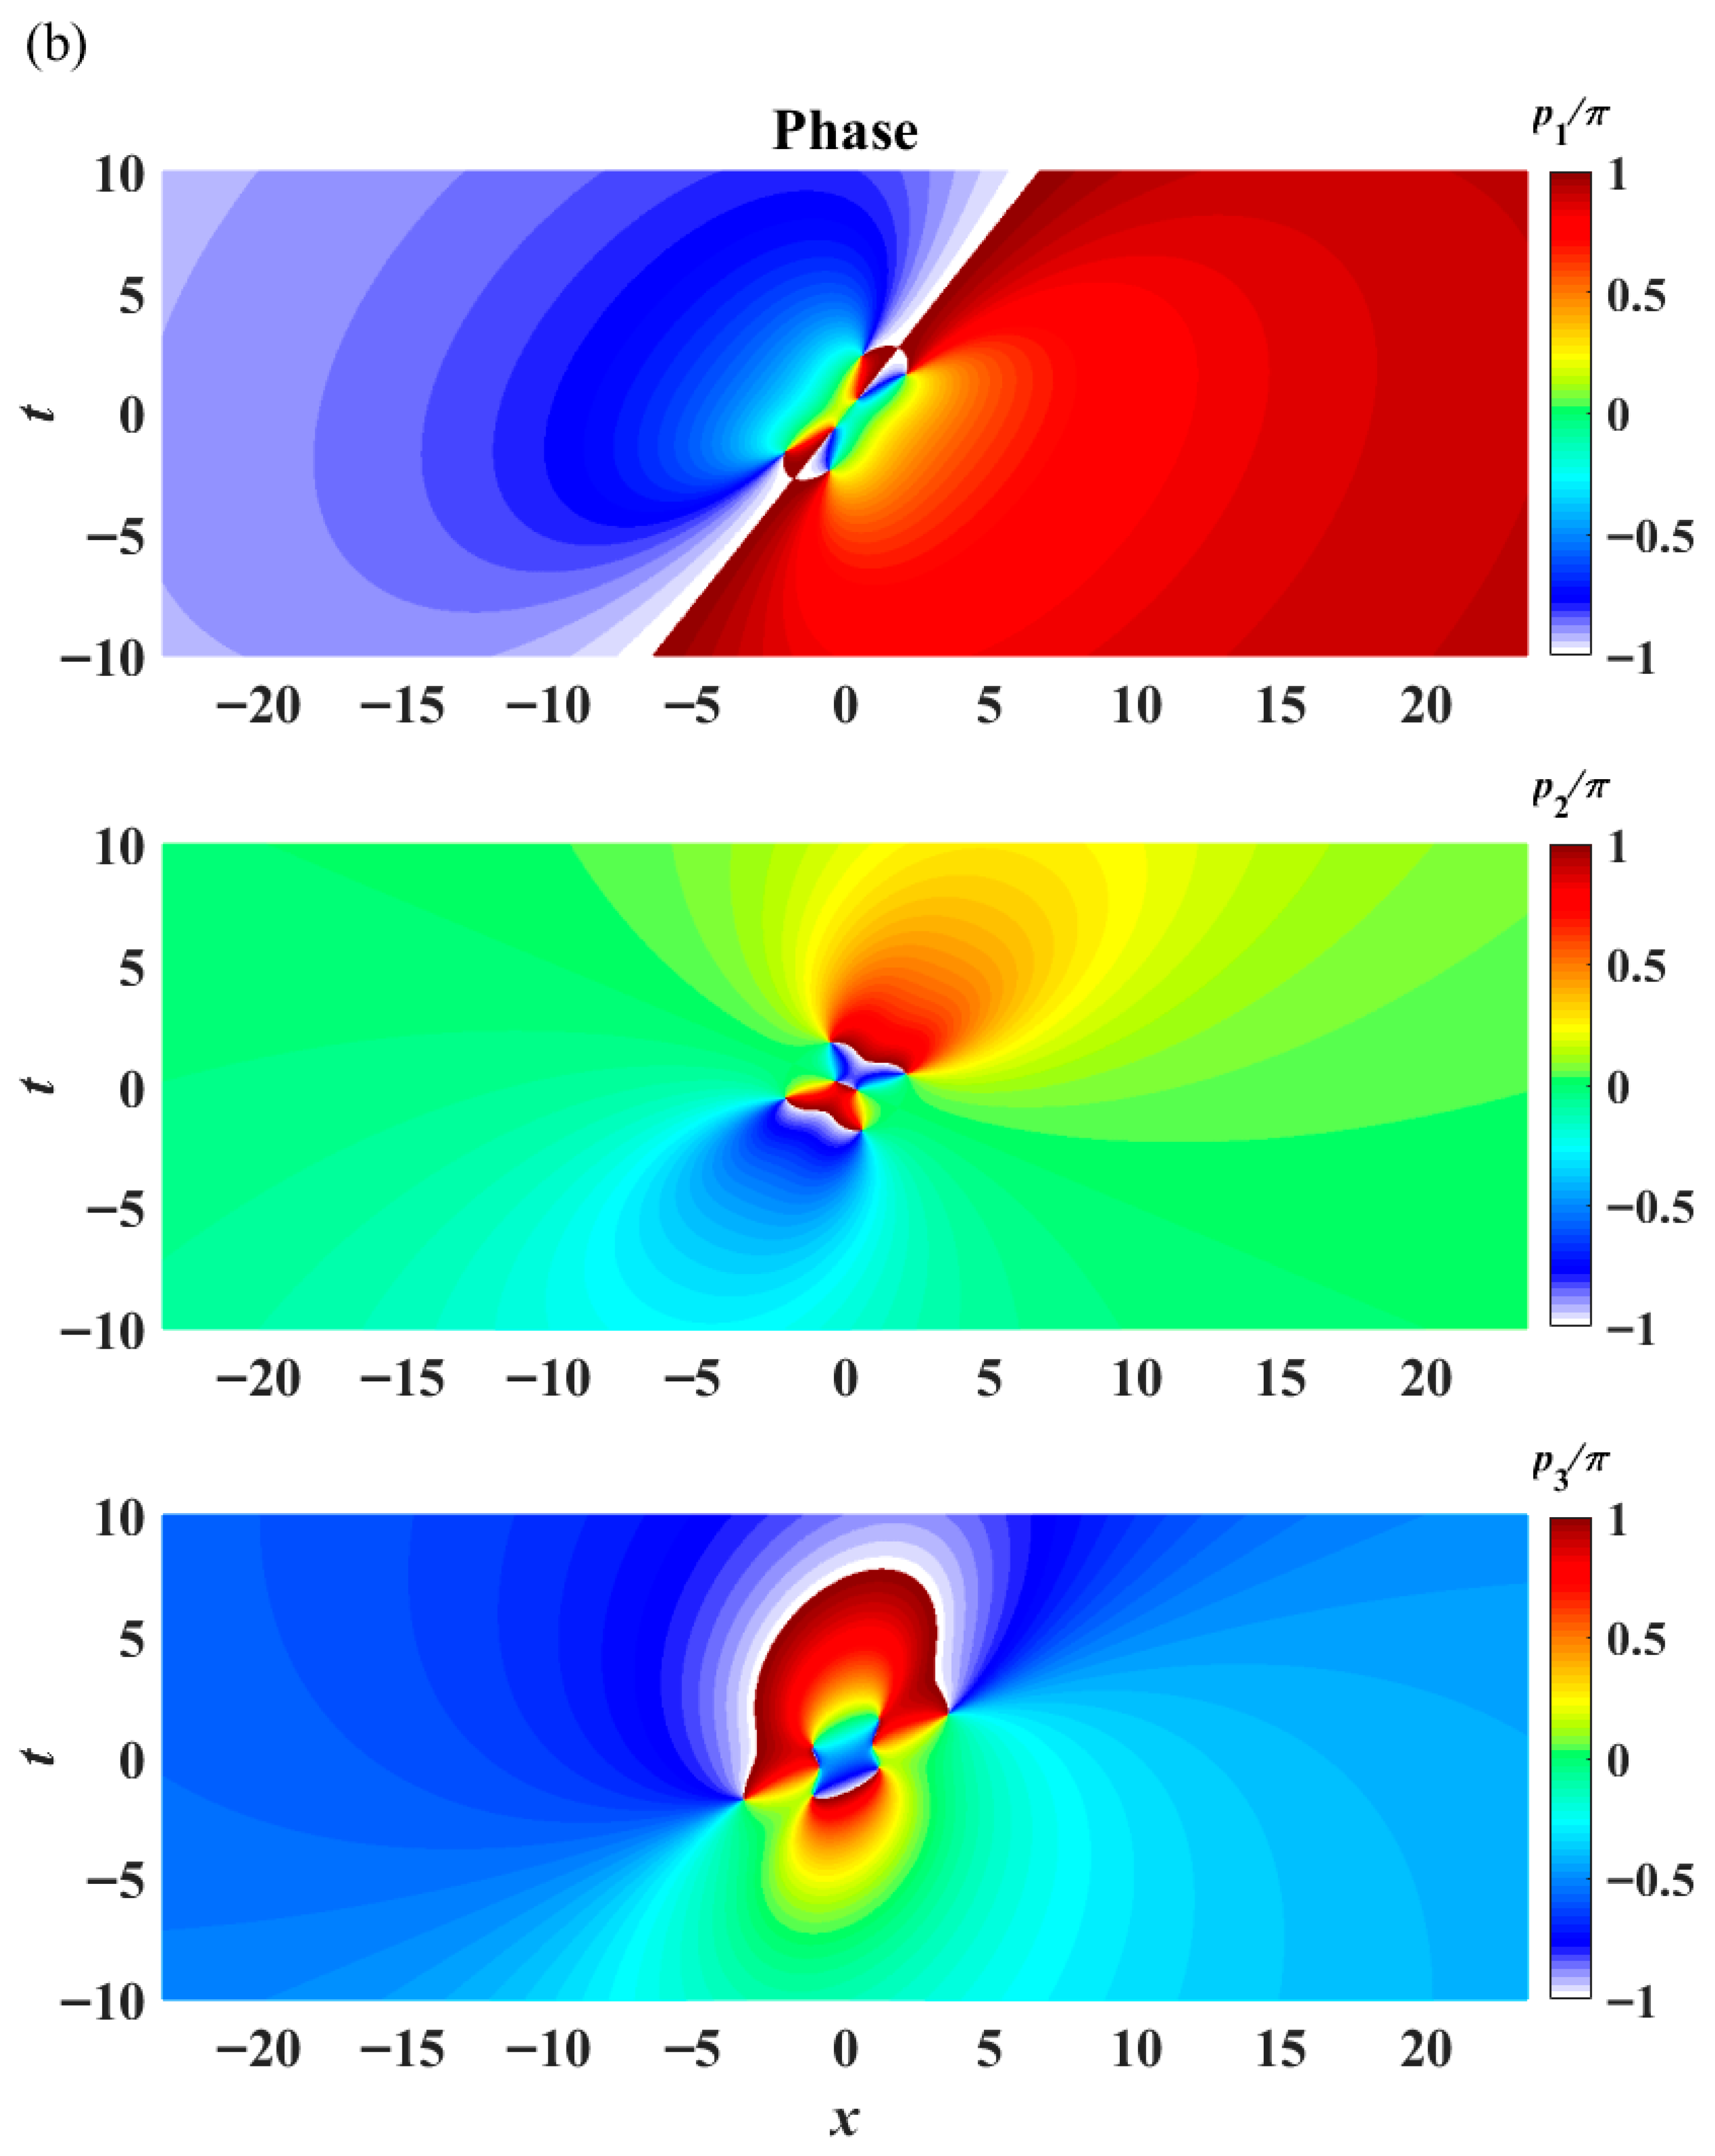
u3 component displays an eye-shaped pattern (one peak in the center, but multiple valleys on each side). The phase factors of the three components, represented by the symbols
pj (
j = 1, 2, 3), show drastic jumps (
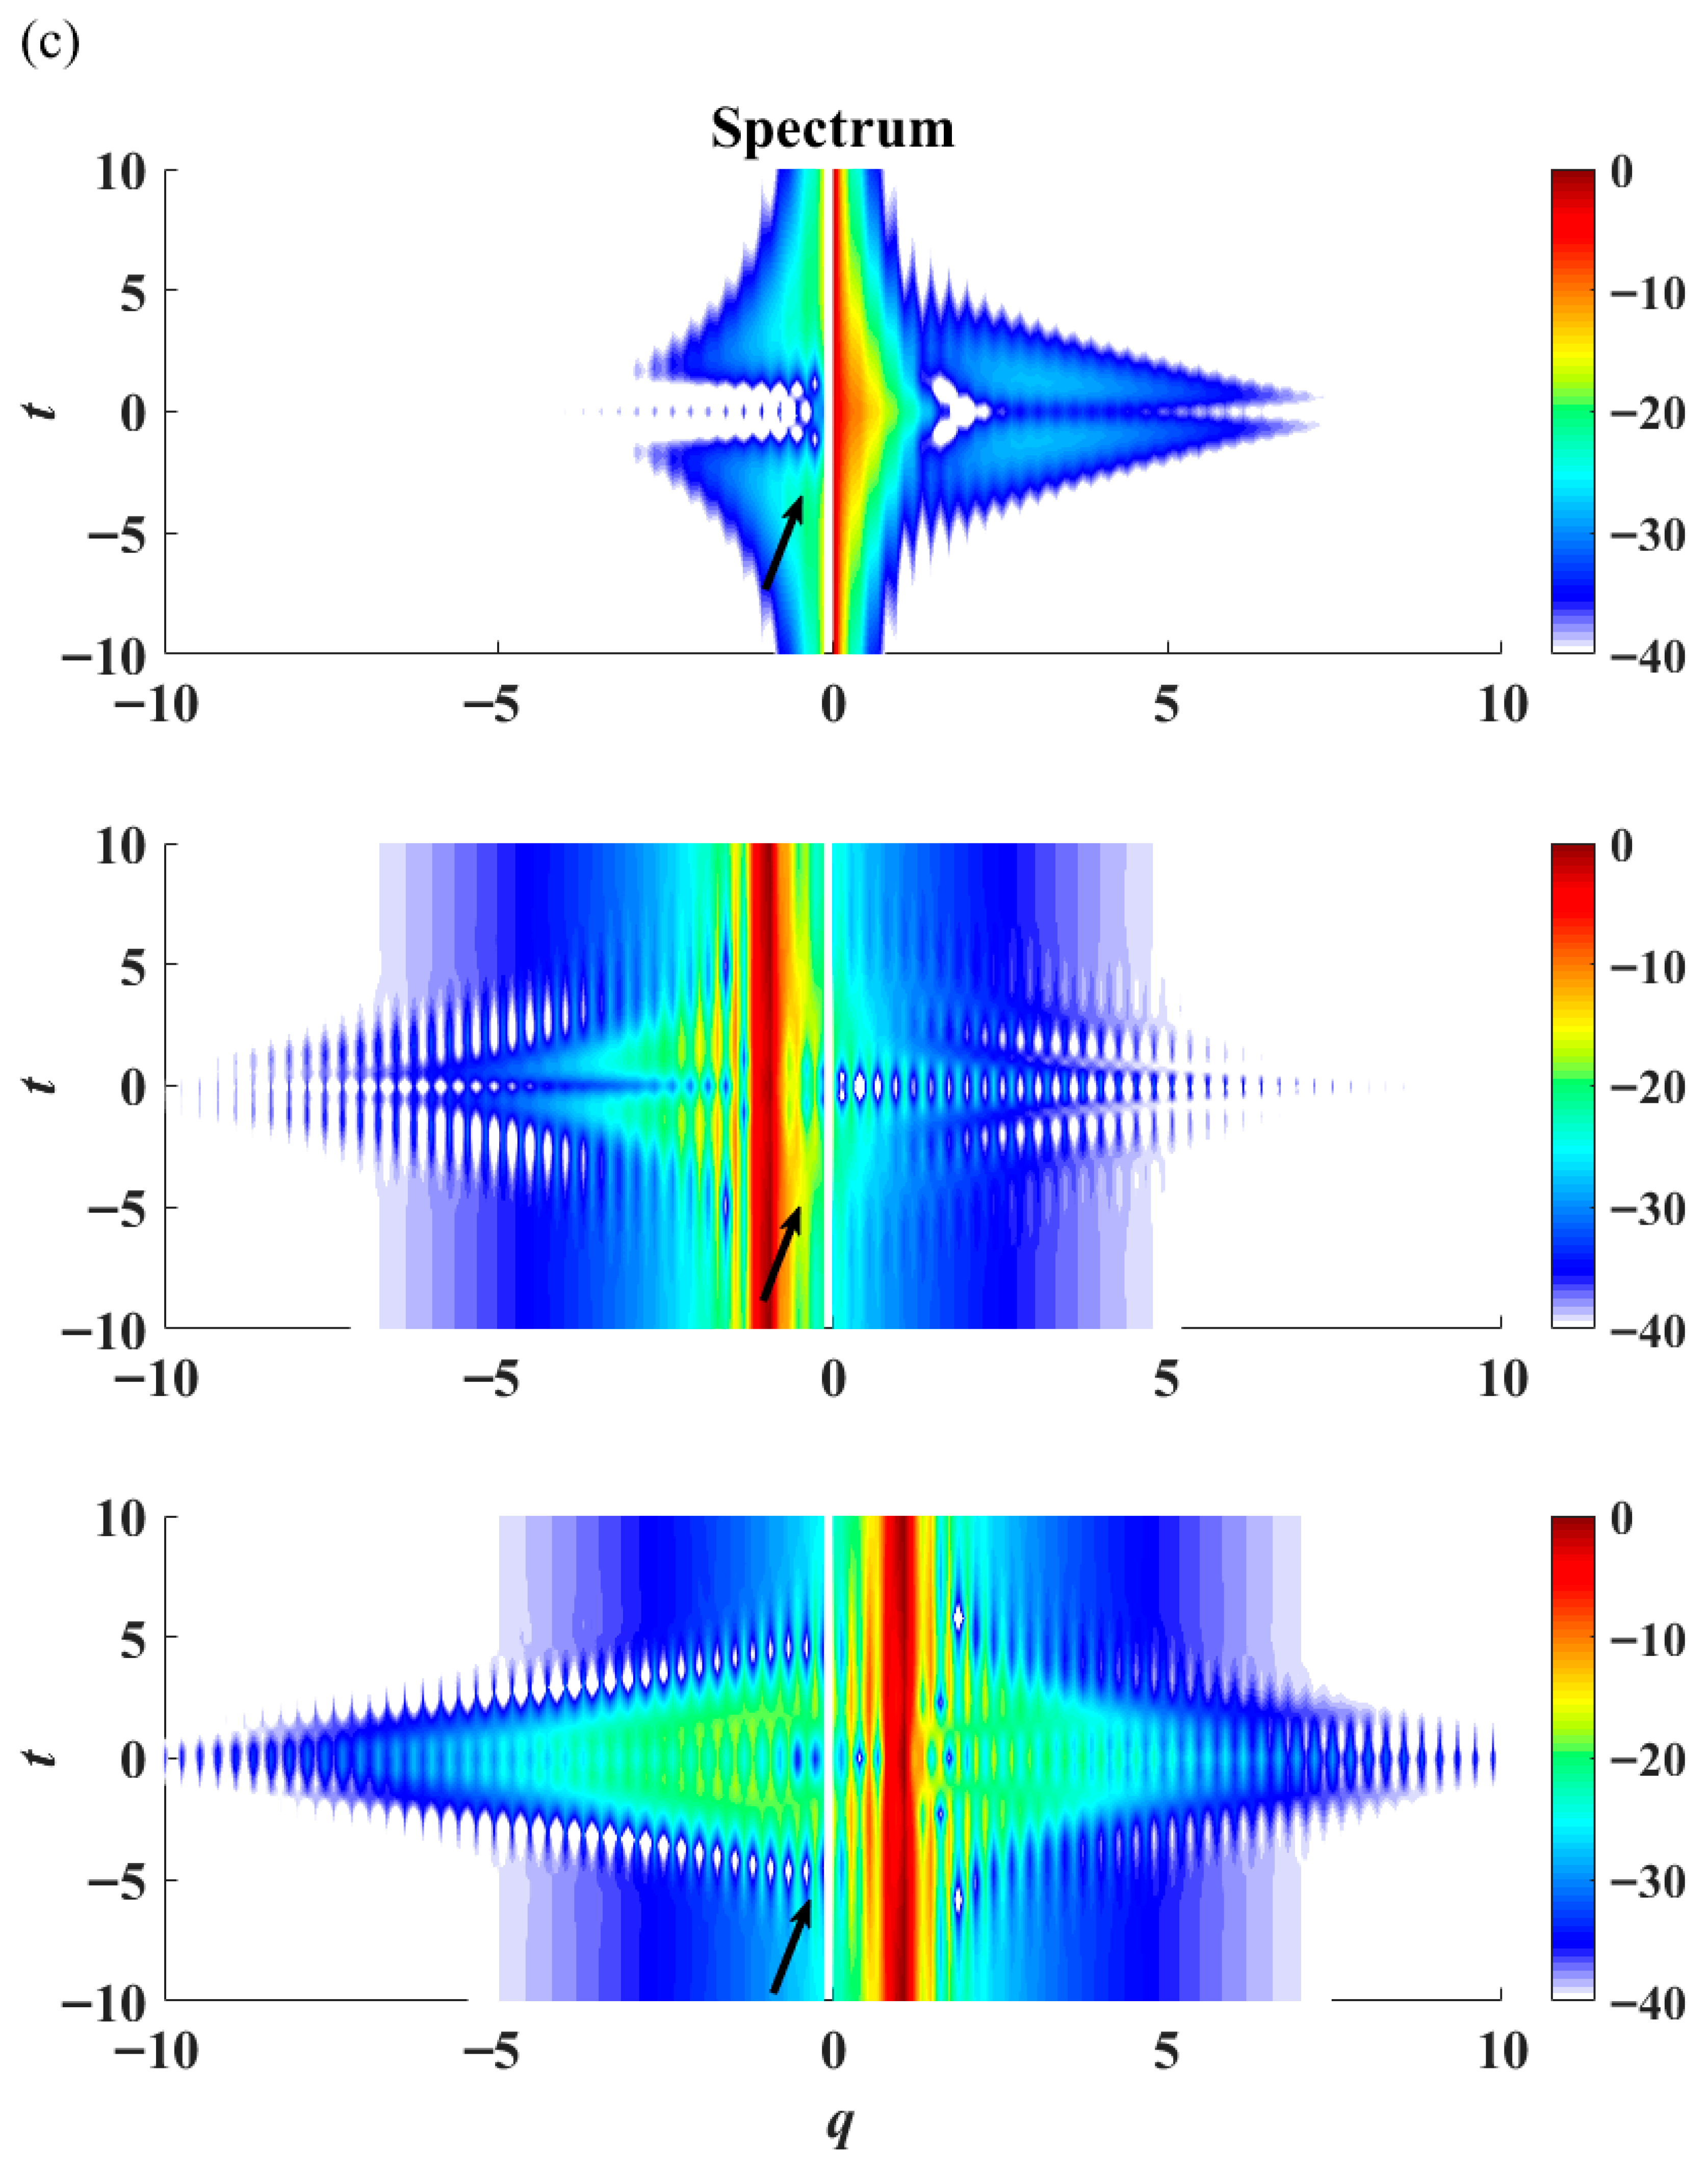
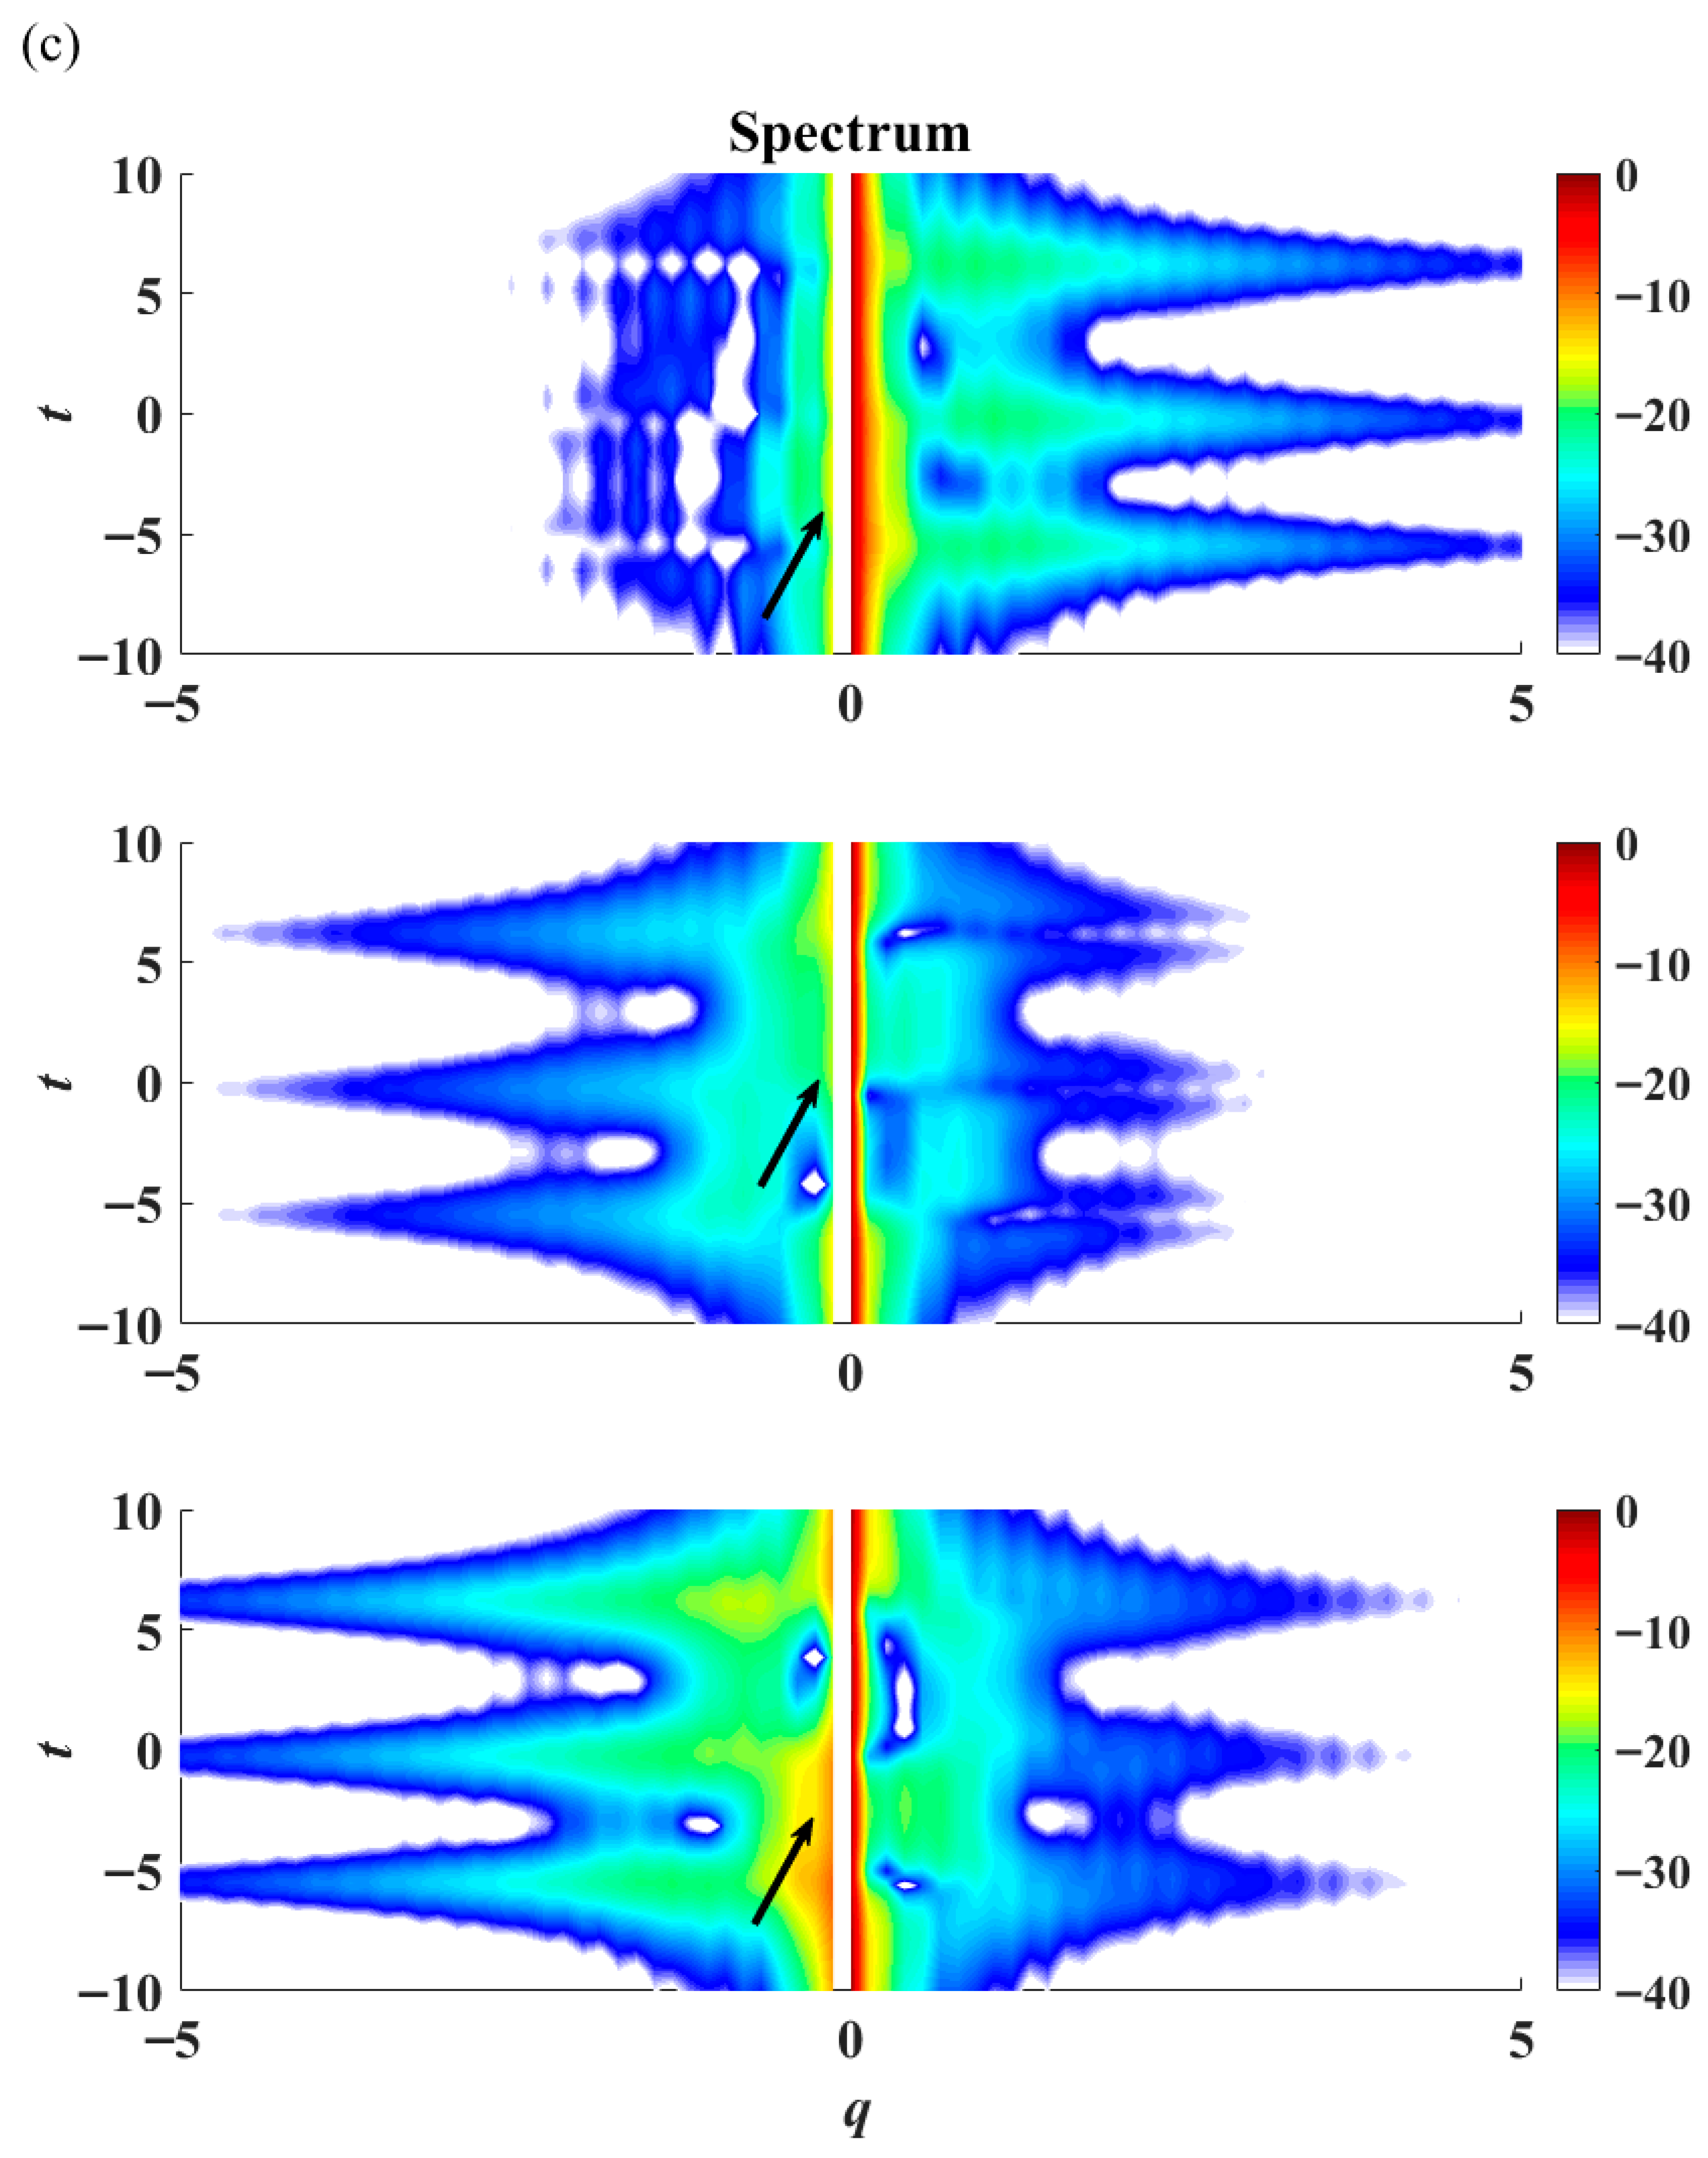
Figure 10b). A phase jump from −π to π can be observed in all three components, indicating the presence of a rogue wave. The temporal spectrum of the rogue wave possesses extraordinary features in a contour plot of intensity versus time (
Figure 10c). The spectrum broadens upon the appearance of the rogue wave, with spectral jumps in the
u1,
u2, and
u3 components, marked by black arrows in
Figure 10c. The spectral jump in the
u1 component is the largest when compared to the jumps in the
u2 and
u3 components. All three spectral jumps occur at a wavenumber
q numerically close to zero. This is consistent with earlier studies, where the occurrence of rogue waves closely correlates with modulation instability of long-wave disturbance.
As we have previously established, the group velocity
v affects the width of the rogue wave (top panel of
Figure 9). By comparing the situations for
v = 1 and
v = 2 in the second-order rogue wave case (
Figure 10a and
Figure 11a, respectively), larger values of
v also result in the increased width of the second-order rogue wave. The phase shift remains unchanged for the case of
v = 2 (
Figure 11b), while the spectrum narrows (
Figure 11c). Furthermore, spectral jumps are observed in all three components at a wavenumber
q close to zero.
In addition to the butterfly patterns in the
u1 and
u2 components and eye-shaped structure in the
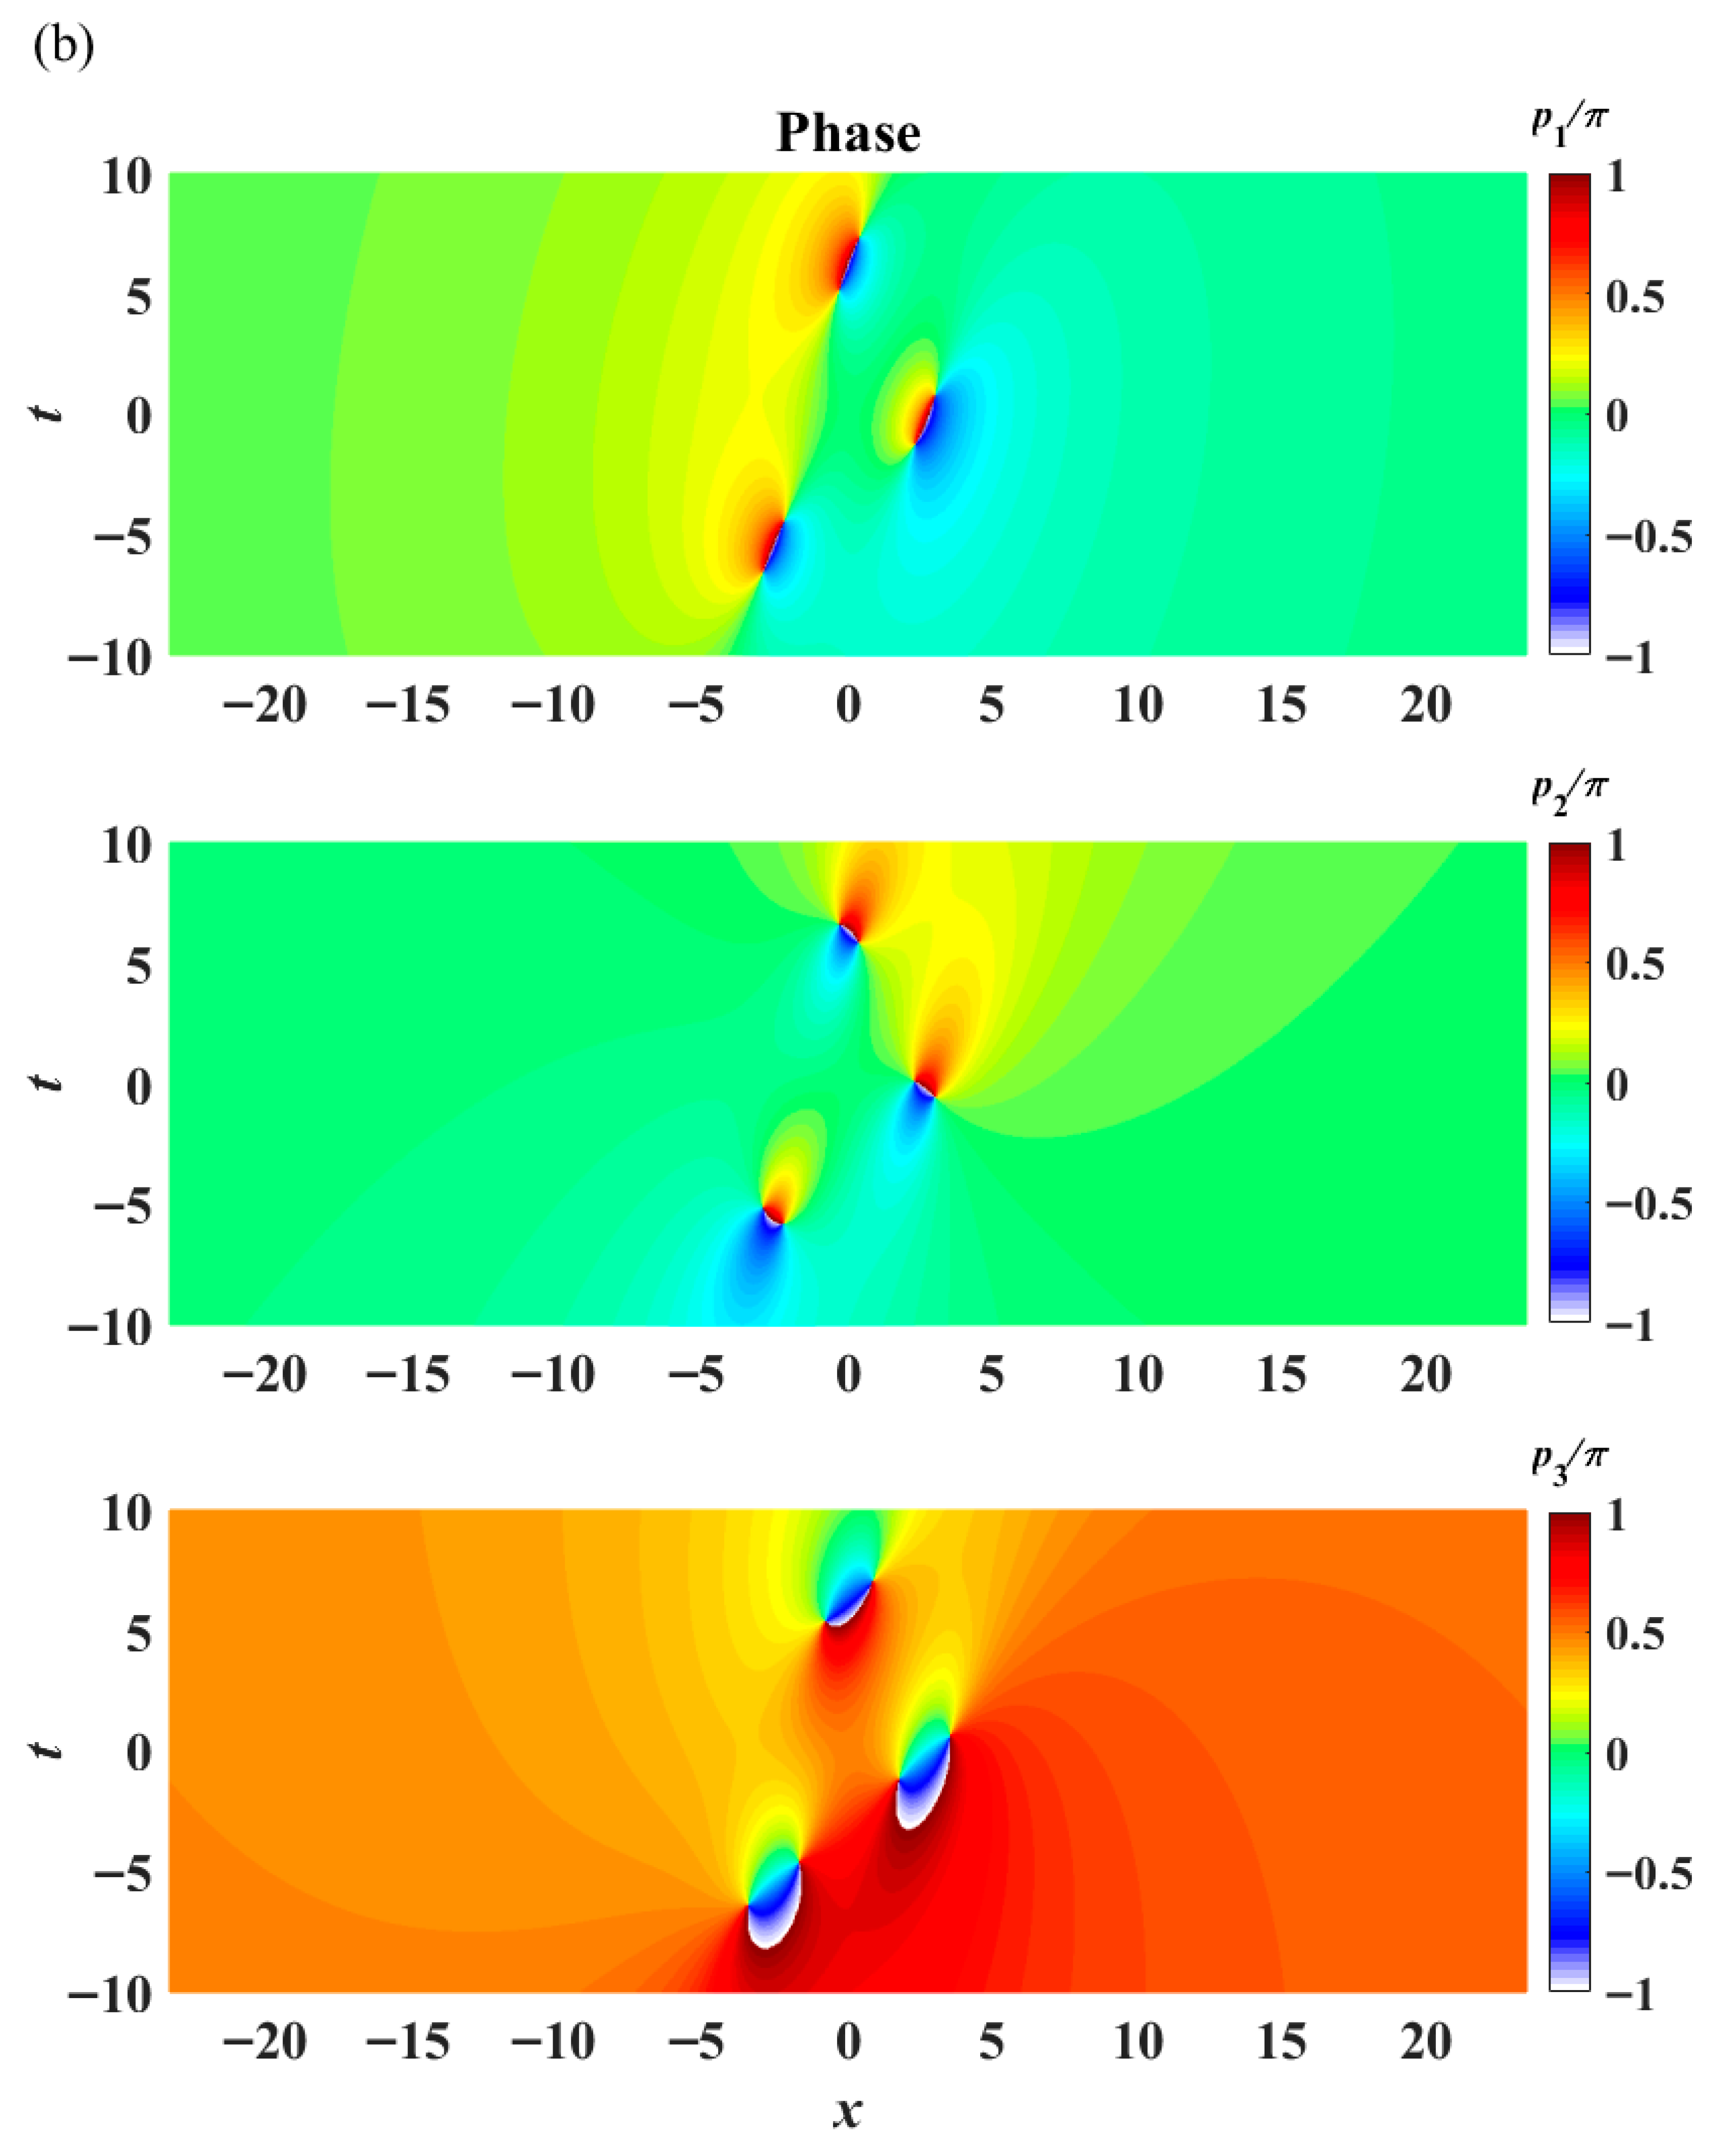
u3 component, rogue wave ‘triplets’ are also possible for all three components (
Figure 12a). The components of
u1 and
u2 display four-petal patterns in each of the three building blocks of the triplet. On the other hand, the
u3 component maintains an eye-shaped structure in each of three building blocks of the triplet. This configuration differs from the patterns presented in earlier works [
32,
33] where all three components display eye-shaped structures. In terms of the spatial-temporal phase dynamics, the occurrence of rogue waves takes place at different instants in time (
Figure 12b). The dynamics of each component is qualitatively less complex than that observed in the butterfly patterns highlighted in
Figure 10b and
Figure 11b. The spectra of the rogue wave triplets also show a broadening of the spectrum upon the occurrence of the rogue wave (
Figure 12c). These spectral jumps again appear at wavenumber
q close to zero, with the
u1 and
u2 components displaying larger jumps relative to the
u3 component. Comparing the spectra of the butterfly patterns displayed in
Figure 10c and
Figure 11c, the maxima of the spectra of rogue wave triplets in the three components also appear at a wavenumber
q close to zero. The discontinuous region along the
q direction, in the case of rogue wave triplets, is larger than that in the butterfly case.
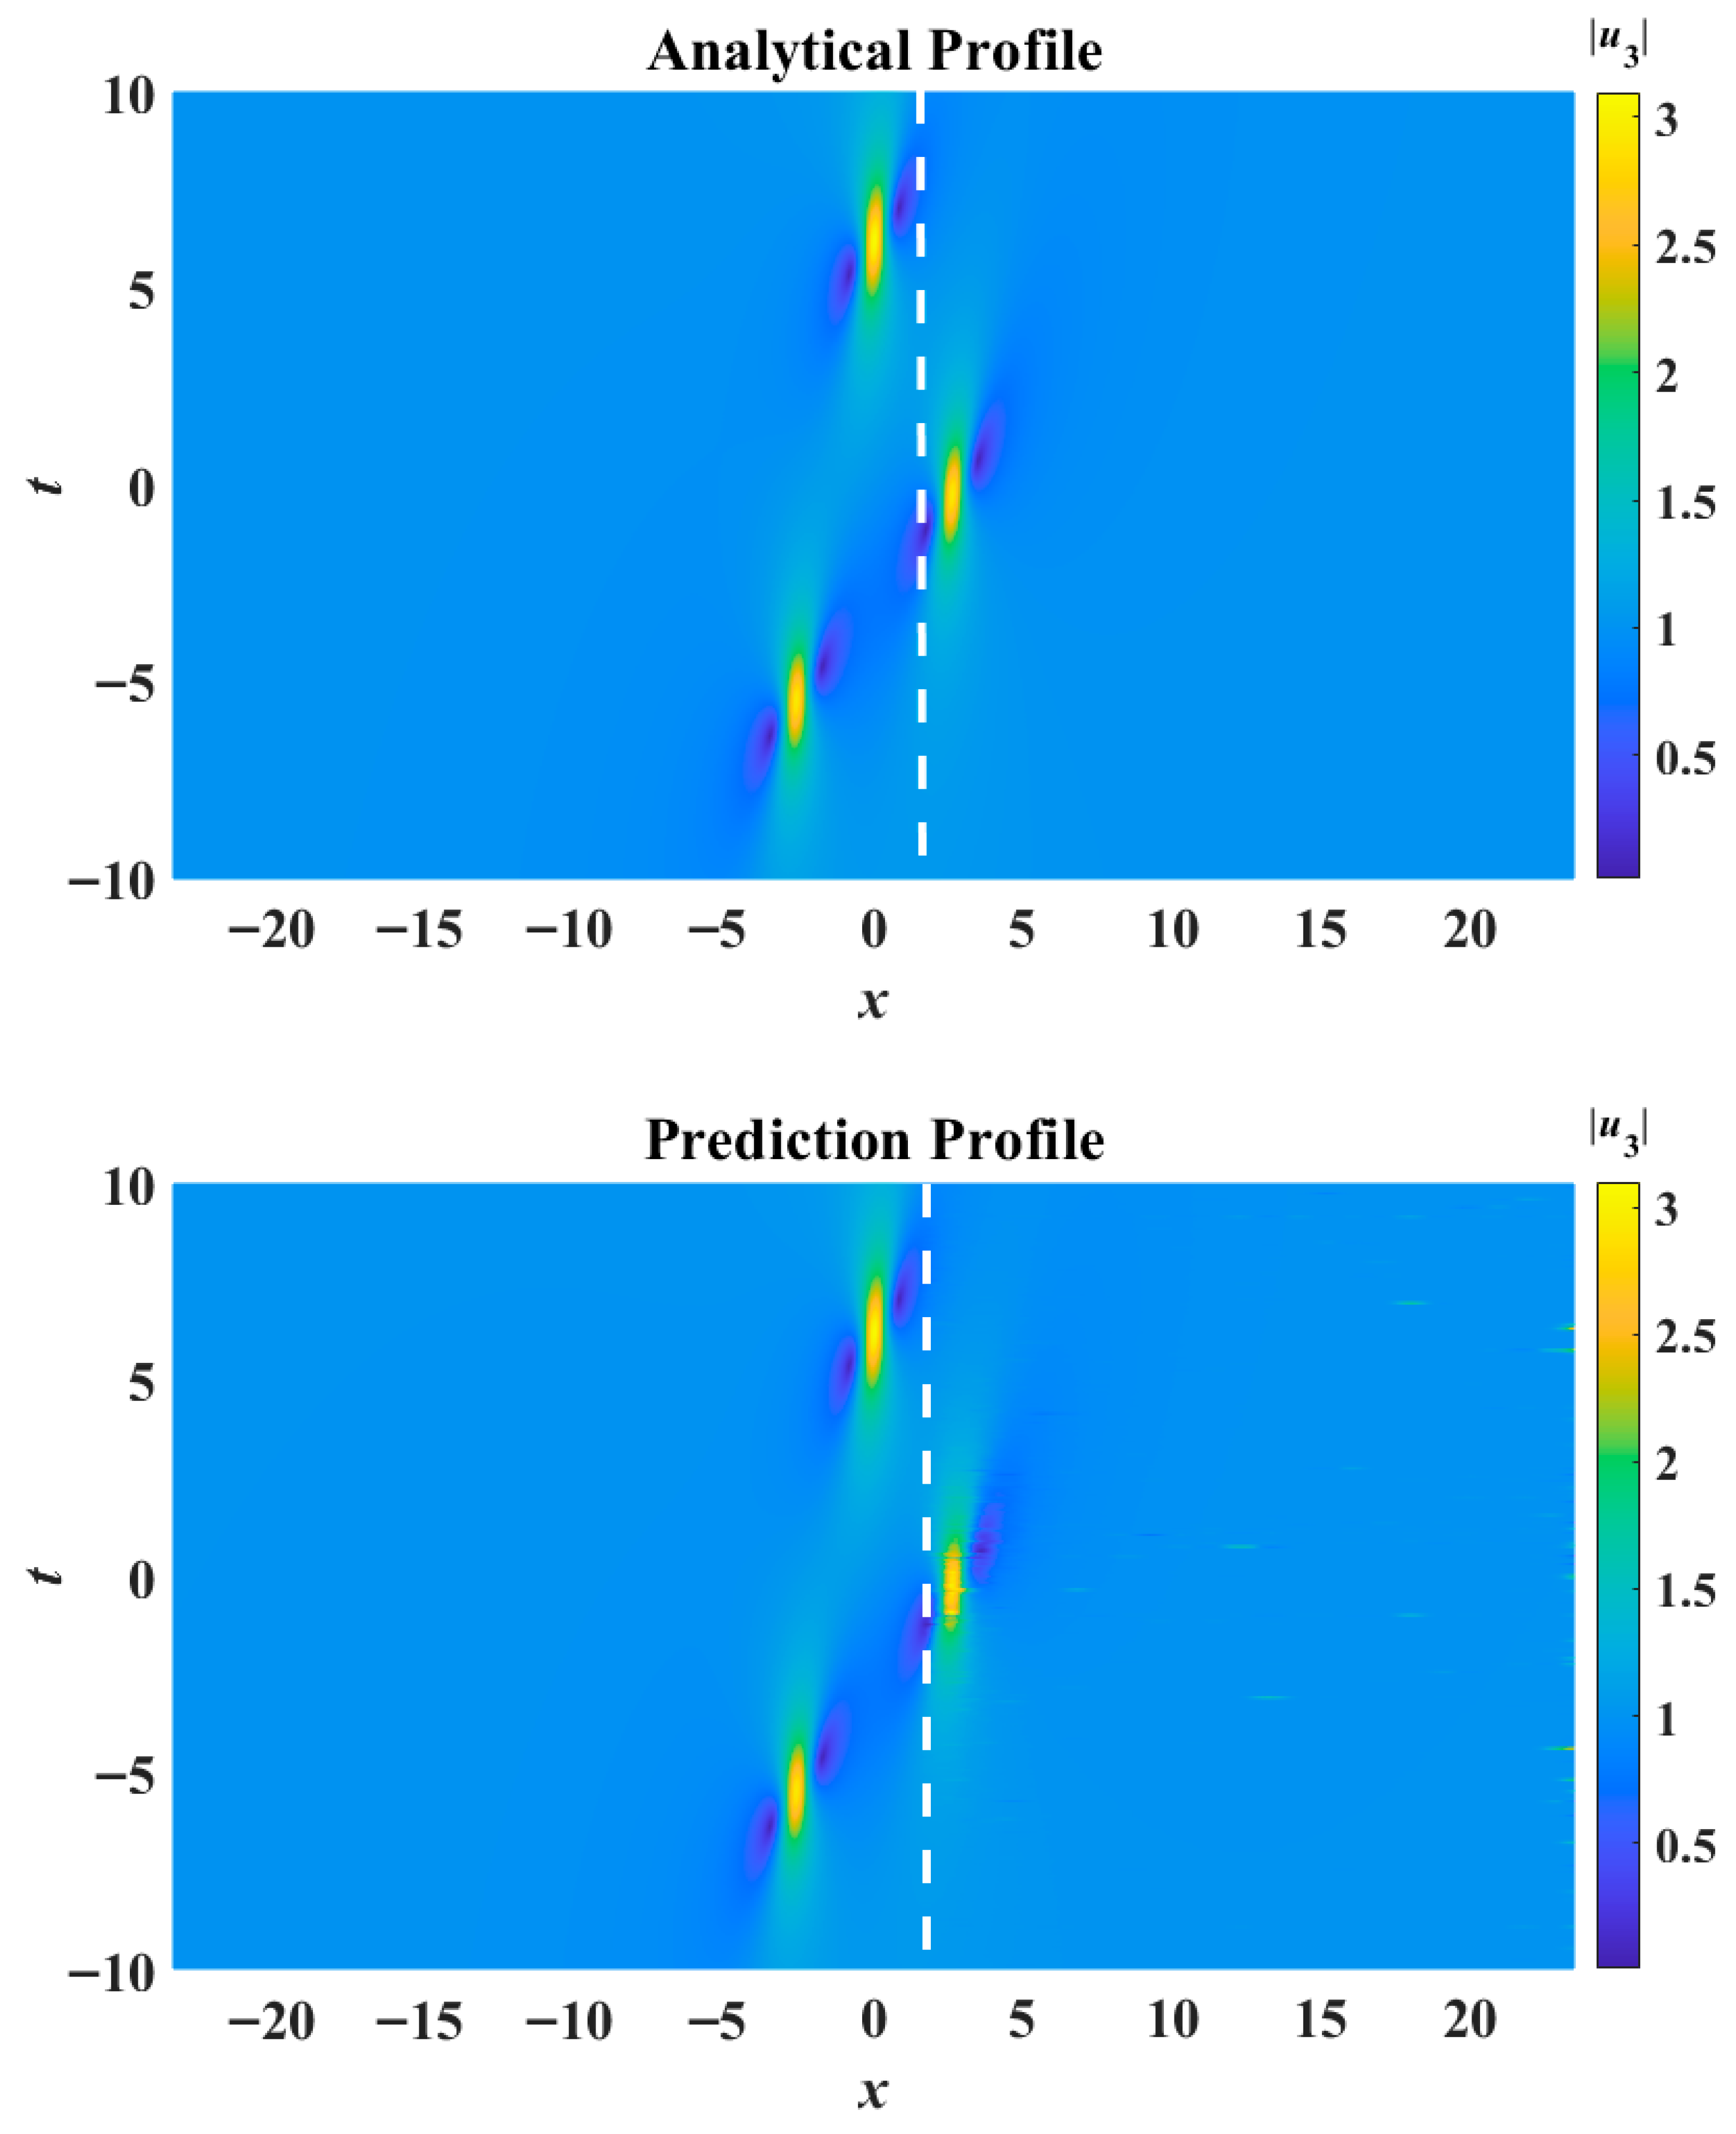
In the context of the rogue wave ‘triplet’, we can implement the deep learning technique to predict these occurrences. By employing the back propagation (BP) neural network approach, we aim to understand the characteristics of analytical rogue wave solutions. Roughly speaking, we construct a neural network based on a dataset from the analytical rogue wave solutions. The dataset comprises 1024 × 401 data points, with the intervals along the x and t axes spanning from [−7.5π, 7.5π] and [−10, 10], respectively. For the purposes of prediction, we utilize a subset of the data, specifically 606 × 401 data points, which accounts for 59.18% of the total dataset, to construct the neural network model. Out of these, 70% (424 × 401 samples) are allocated for training, while 15% (91 × 401 samples) are used for validation and the remaining 15% (91 × 401 samples) are used for testing.
Our model employs a 50-layer neural network with hidden layers as its core structure. We utilize the Levenberg–Marquardt algorithm for training and the mean square error as the loss function. With this model, we can predict the dynamics of rogue waves.
Figure 13 illustrates the analytical profile and prediction profile generated by this model for the
u3 component. The white dashed line at
x = 1.519 separates the following:
- (a)
The subset used for constructing the neural network model on the left;
- (b)
The prediction region on the right.
Figure 13.
(
Top) Analytical solution for the
u3 component. (
Bottom) Prediction obtained using the neural network approach. The white dashed line denotes the position
x = 1.519. Parameters selected are
ε1 =
ε3 = 1,
ε2 = −1,
a1 =
a2 =
a3 = 1,
v = 1 (same as those in
Figure 10).
Figure 13.
(
Top) Analytical solution for the
u3 component. (
Bottom) Prediction obtained using the neural network approach. The white dashed line denotes the position
x = 1.519. Parameters selected are
ε1 =
ε3 = 1,
ε2 = −1,
a1 =
a2 =
a3 = 1,
v = 1 (same as those in
Figure 10).
Similarly, with the BP neural network approach, we also can predict the appearance of rogue wave after
t = 3.95, as depicted in
Figure 14. This feature indicates our ability to predict the third crest based on information from the first two ones. This predictive model holds promising potential for applications to ocean engineering in the future. In future works, we can examine alternative models, such as the Long Short-Term Memory (LSTM) networks or Random Forests, for this time series prediction task.
5. Discussion and Conclusions
The dynamics and properties of rogue waves in the ‘degenerate’ case of three-wave resonant interaction equations are studied. Such ‘degenerate’ case occurs when two out of the three group velocities of the wave packets are identical. In terms of physical applications, such scenarios will typically arise for dispersion relations consisting of many branches, e.g., internal waves in oceans.
Nth-order rogue wave solutions have been presented here. The lowest-order and the second-order rogue waves are computed explicitly. For the second-order rogue waves, both the ‘butterfly patterns’ and ‘rogue wave triplets’ are revealed. ‘Butterfly patterns’ refer to ‘four petal’ type configurations, but with multiple peaks and valleys within each individual sector. ‘Triplets’ refer to three identical clusters of transient peaks and valleys. A remark on the contrast between the present work and those in the literature is in order. In comparison to the ‘non-degenerate’ case, the rogue wave solutions of the present degenerate case have fewer constraints on the wave profile parameters. The actual physical occurrence of the degenerate case is more demanding due to the identical group velocity requirement. In comparison to previous works that also cover the degenerate case [
8], our present formulation treats both the soliton-exchange and stimulated-backscatter cases. Although the Hirota bilinear technique and the Kadomtsev–Petviashvili reduction scheme have also been used for the non-degenerate case in the literature [
9], our present formulations are different and lead to new solutions for the SE and SB cases. A crucial feature in the classification of the solutions for the non-degenerate case is its invocation of a fourth-order polynomial [
9]. The quartic polynomial will cease to be fourth-order for the degenerate case where the two group velocities become identical. The value of
p determined by this polynomial for the SB case of a degenerate triad [
9] will be a purely imaginary number, which will cause the rogue wave solutions derived in the literature [
9] to become singular. On the other hand, the rogue wave modes of the degenerate triads for the SB case have been obtained in this paper. An alternative scale transformation and a new solution for the SE case are described in
Appendix B.
For the fundamental rogue wave, we examined the effects of wave group velocity on its dynamics, including the width and structural profile. The width of a rogue wave becomes larger as the group velocity increases, and this can be correlated with the modulation instability of plane waves. As the group velocity increases, the structural profile of a rogue wave aligns more closely with the propagation variable in the evolution equation.
