1. Introduction
Tropical cyclones (TCs) are among the most hazardous meteorological phenomena worldwide, producing destructive winds, torrential rainfall, and coastal storm surges that trigger cascading disasters such as floods, landslides, and infrastructure failures [
1,
2,
3,
4]. Their destructive capacity is amplified in tropical and subtropical regions, where population density, socioeconomic vulnerability, and repeated exposure converge to heighten disaster risk [
5,
6,
7,
8]. Beyond immediate damage, TC-induced rainfall events disrupt supply chains, aggravate urban flooding, and accelerate environmental degradation, producing long-lasting socioeconomic impacts. While the intensification of hydrometeorological extremes under climate change scenarios [
9] increases the urgency for accurate typhoon-induced accumulated rainfall (TAR) forecasting, it also raises important questions about the temporal stability of historical relationships that underpin statistical prediction methods.
Despite significant progress in numerical weather prediction (NWP) and dynamic downscaling, reliable TAR forecasting remains elusive. Dynamical models, while physically grounded, often exhibit large uncertainties in predicting rainfall distribution due to errors in initial conditions, cumulus parameterization, and interaction with mesoscale processes [
10,
11]. Statistical and data-driven methods, although computationally efficient, may inadequately capture nonlinearities in typhoon–topography–rainfall interactions. This gap is particularly problematic in complex terrains of East Asia, where orographic forcing can amplify or suppress rainfall far beyond the expectations of conventional models [
12]. Crucially, TAR forecasting has traditionally emphasized meteorological parameters (e.g., wind shear, storm intensity, or moisture flux convergence) while underutilizing the empirical knowledge embedded in historical typhoon trajectories. However, empirical evidence shows that typhoons with similar tracks often generate analogous rainfall patterns due to consistent atmospheric circulation regimes and topographic influences [
2]. The effectiveness of trajectory-based similarity modeling in East Asia is particularly enhanced by the region’s complex topography and its well-established influence on rainfall patterns. The mountainous terrain of Taiwan, the Philippines, Japan, and the coastal regions of China creates consistent orographic enhancement effects when typhoons approach from specific directions. This results in characteristic rainfall distributions that remain relatively stable for typhoons with similar tracks, as they interact with the same topographic features in consistent ways. For example, typhoons approaching from the southeast typically produce heavy rainfall on the windward slopes of central mountain ranges, while northward-moving systems generate different precipitation patterns along coastal regions. These persistent typhoon–topography–rainfall relationships form the physical basis for our similarity-based forecasting approach, as tracks with similar geometries will likely produce comparable rainfall distributions due to consistent orographic forcing mechanisms. This motivates a paradigm shift toward trajectory-based similarity modeling as a complementary pathway to enhance TAR prediction skill.
Efforts to quantify track similarity have expanded in recent years. The Track Similarity Area Index (TSAI) [
13] introduced a spatial discretization framework, while clustering techniques such as fuzzy c-means (FCM) have been used to classify storm tracks into representative groups [
14]. Later refinements, such as the Convex Hull Area Index (CHAI) and Triangle Mesh Area Index (TMAI), improved the geometric representation of track similarity [
15]. Nevertheless, these methods suffer from inherent limitations: FCM is inconsistent across nonlinear trajectories, CHAI over-simplifies curvature, and TMAI tends to misclassify short or intersecting tracks as highly similar. As a result, predictive accuracy remains constrained. At the same time, advances in machine learning and hybrid modeling demonstrate the potential of alternative frameworks. Neural-network-based rainfall prediction models [
16], genetic algorithm–support vector machine hybrids [
12], and satellite-based rainfall potential products such as TRaP [
17] illustrate the growing diversification of predictive approaches. Yet, these models often overlook trajectory-specific analogs, thereby failing to leverage the empirically observed recurrence of rainfall patterns among similarly tracked storms. Bridging this methodological divide—between physical/statistical models and trajectory-based empirical analogs—represents a key opportunity for advancing TAR forecasting.
This study addresses these gaps by proposing two new indices tailored to quantify TC trajectory similarity: The Kernel Density Similarity Index (KDSI) and the Comprehensive Index (CI). Unlike geometric indices, KDSI applies kernel density estimation (KDE) to represent track probability distributions in both longitude and latitude, thereby capturing spatial likelihood rather than only path geometry. To overcome residual limitations, particularly KDSI’s occasional selection of centro-symmetric tracks and TMAI’s bias toward short tracks, we develop the Comprehensive Index (CI) as a hybrid measure integrating probabilistic and geometric attributes. To evaluate predictive skill, we utilize high-resolution precipitation data from the Climate Prediction Center (CPC) and best-track data from the Regional Specialized Meteorological Center (RSMC) for 1122 typhoons over East Asia between 1979 and 2022. TAR is quantified using a 500 km spatial buffer and a ±1-day temporal window, consistent with prior empirical studies [
18,
19,
20]. The proposed similarity indices are tested alongside FCM, CHAI, and TMAI, and their predictive capacity is benchmarked using root-mean-square error (RMSE). An ensemble prediction strategy is further employed, whereby the TAR of a given typhoon is forecasted as the mean TAR of the most similar historical events. The optimal ensemble number (OEN) is determined through systematic minimization of RMSE, highlighting the balance between predictive robustness and overfitting.
The contributions of this study are threefold. First, it introduces a probabilistic framework (KDSI) that represents a conceptual advancement over purely geometric similarity measures. Second, it proposes the integrated CI, which mitigates systematic errors inherent to both KDSI and TMAI, thereby achieving improved accuracy. Third, by validating the methodology with a large multi-decadal dataset of East Asian typhoons, the study demonstrates the operational feasibility of trajectory-based ensemble TAR forecasting. Therefore, this work not only strengthens the theoretical understanding of TC similarity but also provides a practical tool to support early warning systems, disaster preparedness, and hydrological planning. Given the projected intensification of extreme rainfall under climate change, the findings hold particular relevance for climate adaptation and resilience planning in vulnerable coastal regions. The remainder of this paper is organized as follows:
Section 2 describes the datasets, TAR calculation procedures, and similarity indices.
Section 3 presents the results of similarity analysis, ensemble optimization, and predictive performance evaluation.
Section 4 concludes with a discussion of methodological implications, limitations, and future research directions.
2. Data and Methods
2.1. Data Source
Establishing a TAR prediction model necessitates daily rainfall data and TC track data. The daily rainfall data derives from the National Oceanic and Atmospheric Administration’s (NOAA) Climate Prediction Center (CPC), specifically using the CPC 0.5° × 0.5° gridded data from 1979 to 2022 (
https://psl.noaa.gov/data/gridded/data.cpc.globalprecip.html (accessed on 12 September 2023). TC data comes from the Regional Specialized Meteorology Center (RSMC), Tokyo, comprising the best TC data with 1880 TC tracks from 1951 to 2022, documenting the time, longitude, and latitude at six-hour intervals. Due to the unavailability of precipitation data before 1979, only 1122 TC tracks from 1979 to 2022 are utilized in this study. Additionally, the TC data includes several other factors, such as wind speed and central pressure, critical for the correction of predictive TAR. The composites of meridional wind anomalies from the NCEP/NCAR reanalysis, provided by the National Oceanic and Atmospheric Administration, also contribute to this study.
2.2. Calculation of Typhoon-Induced Accumulated Rainfall (TAR)
Given that a TC triggers extensive rainfall over a broad area for a prolonged period, it is necessary to factor in the TC’s scope and duration. A typhoon’s impact on rainfall can be confirmed when the distance between the TC center and the target location is within a specified range, and the occurrence times of the typhoon and rainfall coincide. Since a TC continually affects its surrounding area during landfall, it is important to determine which day’s rainfall is impacted. As per Ref. [
12], the overall duration of rainfall induced by a typhoon at a specific site is denoted by the typhoon’s entrance and exit from a 500 km radius of the area within a landfall time window. Guided by prior research, a range threshold of 500 km is set [
18,
19,
20], with a time window of ±1 day [
8,
21]. The 500 km radius was selected as it comprehensively captures the spatial extent of typhoon-induced precipitation, including outer rainbands that significantly contribute to accumulated rainfall, while excluding precipitation systems unrelated to the typhoon circulation. The ±1-day temporal window accounts for both the preconditioning of the atmosphere prior to typhoon arrival and the lingering rainfall effects after the typhoon’s core has passed, which is particularly relevant for rainfall persistence in regions with complex topography. These parameters have been validated in previous studies across East Asia and are well-suited for capturing the full spatiotemporal footprint of typhoon-related precipitation in our research domain.
The haversine equation [
22] is employed to calculate the distance between the TC center and the target location. The Euclidean centroid of the TC data points over a single day is defined as the TC center according to Ref. [
15], and these are totaled to yield each TC’s TAR. This can be expressed as Equation (1) below:
where
denotes the
-th TC,
denotes the rainfall value of
-th data point,
denotes the distance between the TC center and the target area, and
denotes the difference between the occurrence time of the rainfall and the target TC.
2.3. TC Similarity Analysis
This section outlines five indices employed in the study to assess the similarity between TCs. These indices include FCM, Convex Hull Area Index (CHAI), Triangle Mesh Area Index (TMAI), Kernel Density Similarity Index (KDSI), and Comprehensive Index (CI). To evaluate the predictive performance of our model, we utilized the root-mean-square error (RMSE), interquartile range (IQR), and coefficient of variation (CV). These metrics were selected for their specific relevance to our forecasting framework: RMSE quantifies the average magnitude of prediction errors in TAR, providing a direct measure of accuracy for continuous rainfall accumulation forecasts. IQR describes the spread of errors around the median, offering robustness against extreme outliers. CV standardizes the variability relative to the mean, enabling comparison across typhoons with different rainfall totals. While probabilistic verification metrics (e.g., Brier Score, ROC-AUC) offer valuable insights for categorical forecasts of exceedance thresholds, our ensemble-mean approach for predicting continuous TAR values makes RMSE, IQR, and CV particularly appropriate and interpretable for the comparative evaluation of track similarity methods presented in this study.
2.3.1. FCM Clustering
The FCM clustering method, proposed by Ref. [
23], has been applied in several studies for TC similarity analysis and proven effective. This method extends the traditional k-means clustering algorithm, introduced by Ref. [
24], which assigns each data point to a single cluster based on proximity to the nearest centroid. In FCM clustering,
n vectors
are divided into
c groups, and the membership degree is defined by Equation (2) to represent the probability that the dataset belongs to a particular cluster.
where
is the degree of membership of data point
in cluster
,
is the Euclidean distance between data point
and the center of cluster
,
is the Euclidean distance between data point
and the center of cluster
, and
is a weighting exponent that determines the degree of fuzziness in the clustering.
From the definition of the membership degree, the following becomes evident:
A matrix is constructed by listing all the membership degrees, thereby forming the membership matrix. The sum of all values in the membership matrix equates to .
The objective function of FCM clustering is defined as Equation (4):
where the
is the Euclidean distance between data point
and the center of cluster
,
is the membership degree between data point
and the cluster
, and
is a weighting exponent that determines the degree of fuzziness in the clustering. Minimizing the objective function
is achieved through updating the cluster center and membership degree, as described in Equations (2) and (5).
Drawing on the findings of a prior study [
25], the parameter
is set to 2, and the optimal cluster number
is set to 3. The center of the cluster is initialized using the
k-means method, and the loop commences until
. This process ultimately results in the output of similarity analysis by FCM clustering.
2.3.2. Kernel Density Similarity Index (KDSI)
TC tracks are represented by multiple data points. The probability density function of these data points provides a way to depict the spatial distribution of TC tracks, which in turn allows for a determination of similarity between different TCs. In this study, we utilized kernel density estimation (KDE) to derive the probability density functions of each TC in both the longitude dimension and the latitude dimension. This marks the first application of KDE in TC-related studies.
KDE is a non-parametric technique used for estimating the probability density function of a random variable. Frequently employed in data analysis and machine learning, KDE helps in approximating the underlying probability distribution of a dataset [
26]. KDE works by positioning a kernel function around each data point and then aggregating the contributions from all these kernels. This kernel function is a probability density function determining the shape and bandwidth of the kernel.
As detailed by Ref. [
27], consider the longitude dimension of a TC track as an example
. Given a longitude sequence from an unknown distribution
with a density function
, KDE can be formulated as shown in Equation (6):
where
is a smooth function, specifically the kernel function,
denotes the length of the sequence,
is the smoothing bandwidth, which determines the degree of smoothing. Several kernel functions are available, including the Gaussian, Spherical, Epanechnikov, and Triangular kernels. For this study, we used the Gaussian kernel function as depicted in Equation (7):
This study chose the smoothing bandwidth
using the method proposed by Ref. [
28], as presented in Equation (8):
where
represents the standard deviation of the dataset, and
is its length. Among various bandwidth selection methods, Silverman’s rule of thumb was selected for several reasons. First, as a widely established reference method in kernel density estimation, it provides a reliable baseline for comparative studies. Second, its computational efficiency makes it particularly suitable for our large dataset of 1122 typhoon tracks, where more complex methods like cross-validation would be computationally prohibitive. Third, the method demonstrates reasonable performance for approximately normal distributions, which align well with the spatial distribution characteristics of typhoon track positions. While we acknowledge that alternative methods such as least-squares cross-validation or plug-in selectors may offer theoretical advantages in specific scenarios, Silverman’s method [
28] provides an optimal balance between computational practicality and estimation accuracy for our large-scale typhoon track analysis.
For each TC, we performed KDE using Equations (10)–(12) to determine the probability density function of the longitude sequence,
. Subsequently, we superimposed the function graphs of two TC tracks on a single figure and calculated their overlapping area as presented in Equation (9):
where
represents the shared area of the two probability density functions, defined as
, and
is the probability density function of the
-th TC. For the latitude dimension, substitute the sequence with the latitude sequence,
, and follow the aforementioned steps to obtain
. The comprehensive
is defined as presented in Equation (10):
For each TC pair, we computed their
, resulting in a
matrix,
, that represents the similarity of each TC pair. Here,
denotes the number of TCs, with
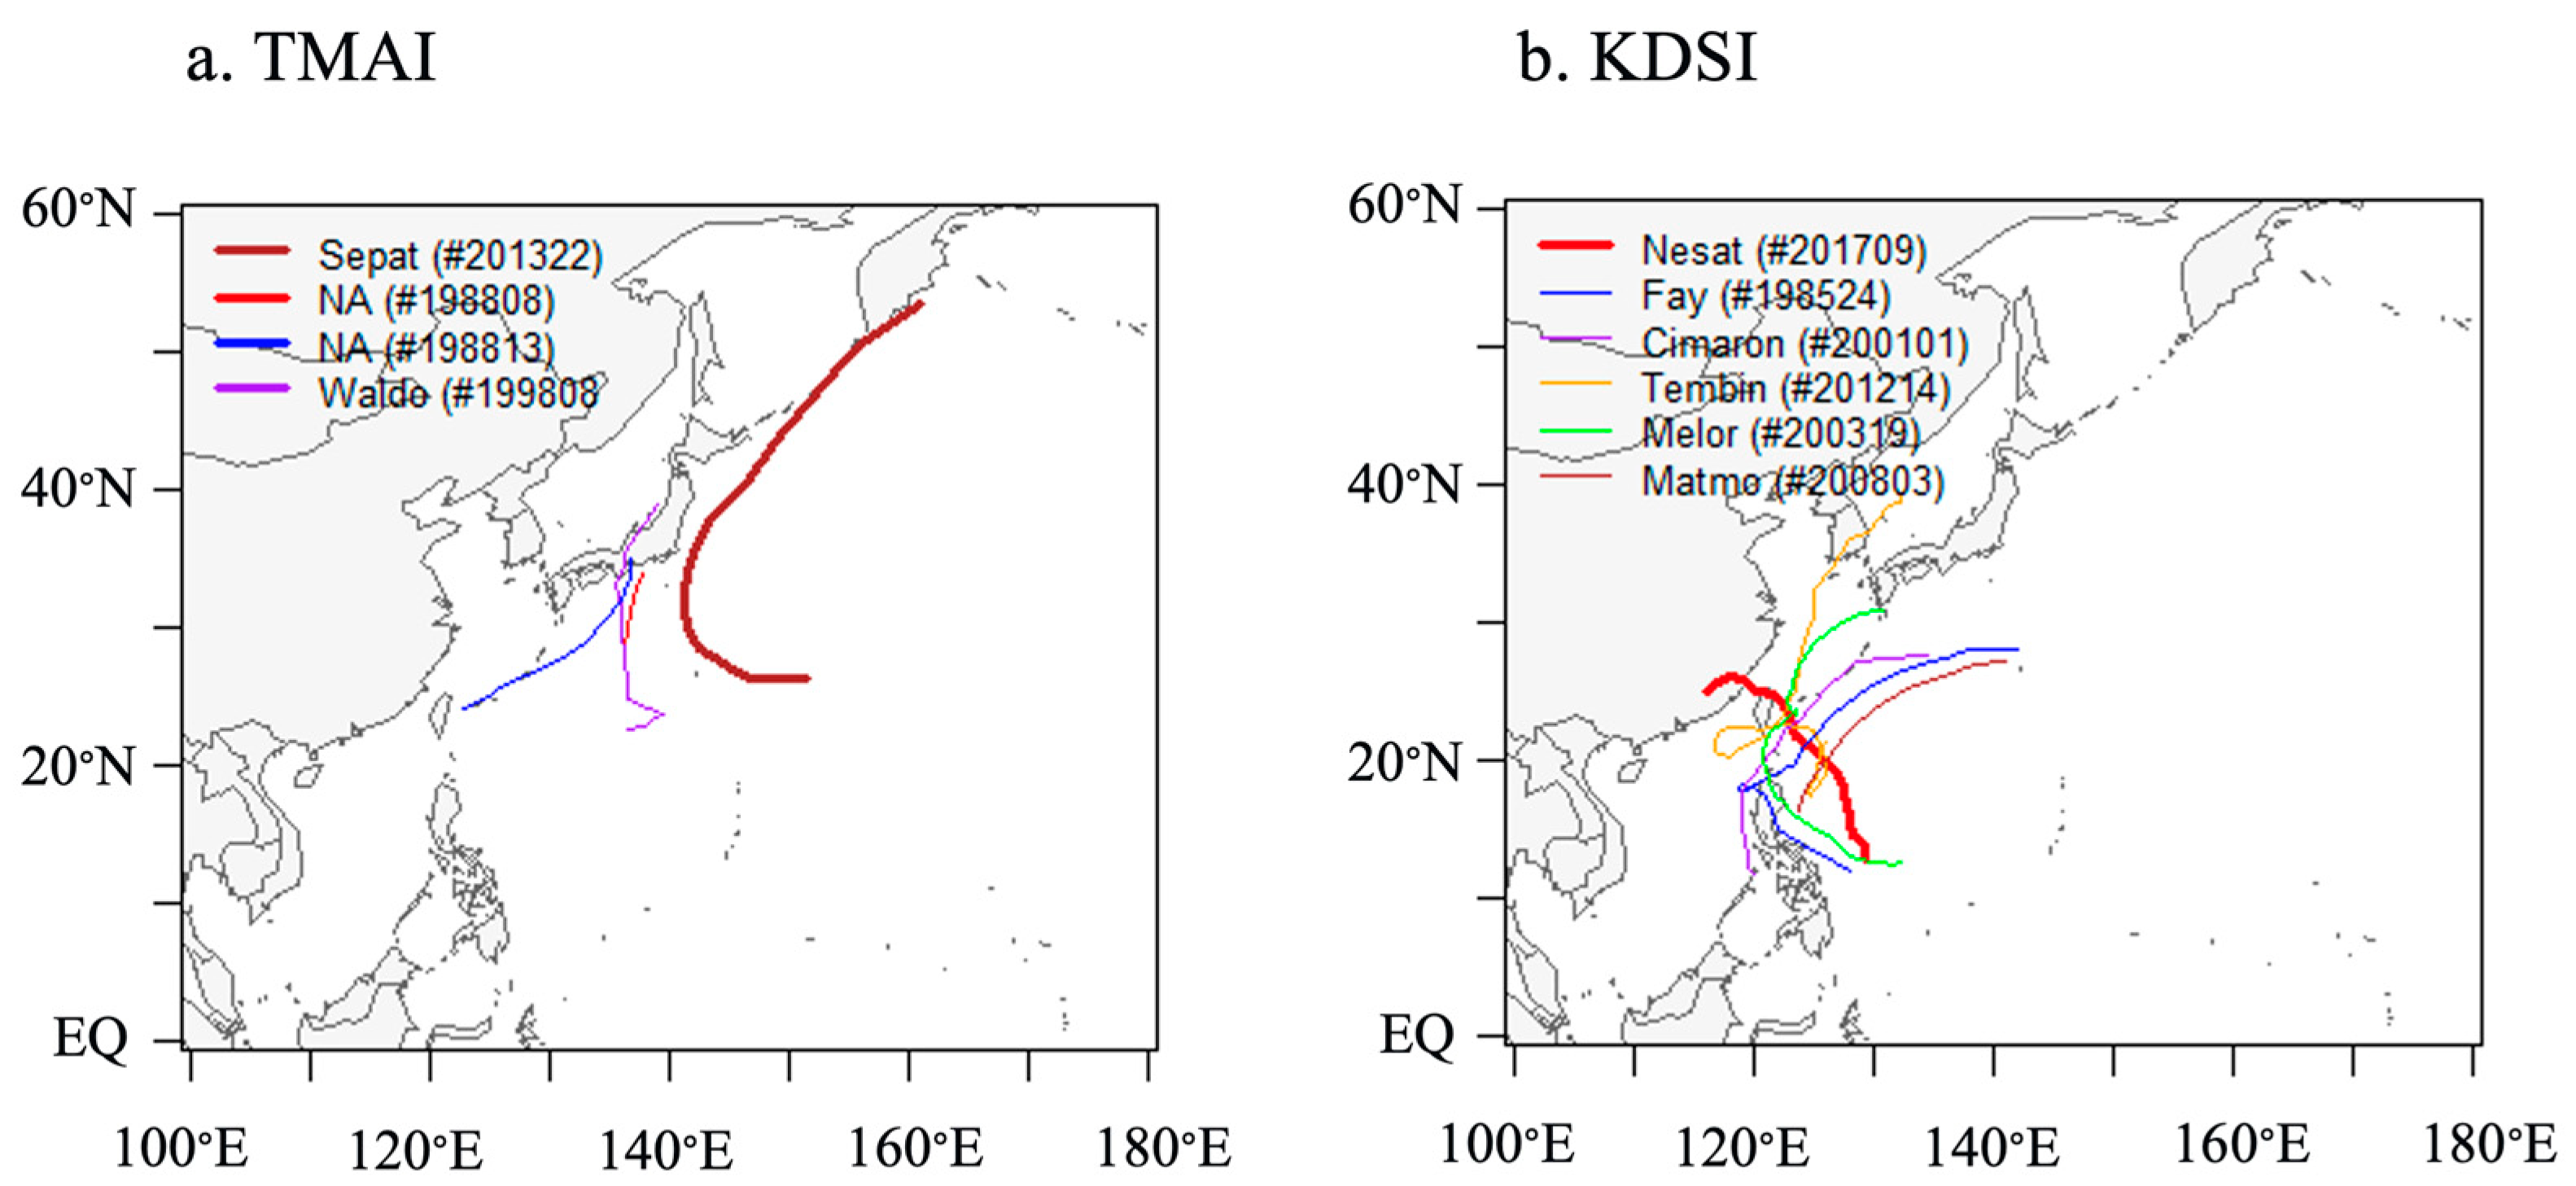
being the specific count in this study. The similarity between two TCs is assessed by comparing their
values (
Figure 1). A higher
value indicates greater similarity between the two TCs.
2.3.3. Comprehensive Index (CI)
While both TMAI and KDSI have their respective limitations, we sought to integrate these two methods to reduce the RMSE. Given the differing magnitudes of TMAI and KDSI, it is more effective to combine them through division. Thus, we introduce the comprehensive index (CI) as presented in Equation (11):
To determine the optimal values for
and
, we conducted various tests with different
ratios, aiming to find the most effective
ratio that minimizes RMSE during the OEN selection process. Based on the resultant RMSE, its minimum value occurs at
. Hence, with our training dataset in consideration, we finally express CI in Equation (12):
The number of chosen TC tracks greatly influences the performance of our model. To ensure optimal performance, it is crucial to determine the optimal ensemble number (OEN). We applied the prediction model to the 1122 TCs at our disposal, incrementally adding the number of similar TCs selected, and subsequently calculated the root-mean square error (RMSE) between the observed and the predicted values for all 1122 TCs. The ensemble number that results in the minimum RMSE is defined as the OEN.
2.4. Selection of Test Typhoons
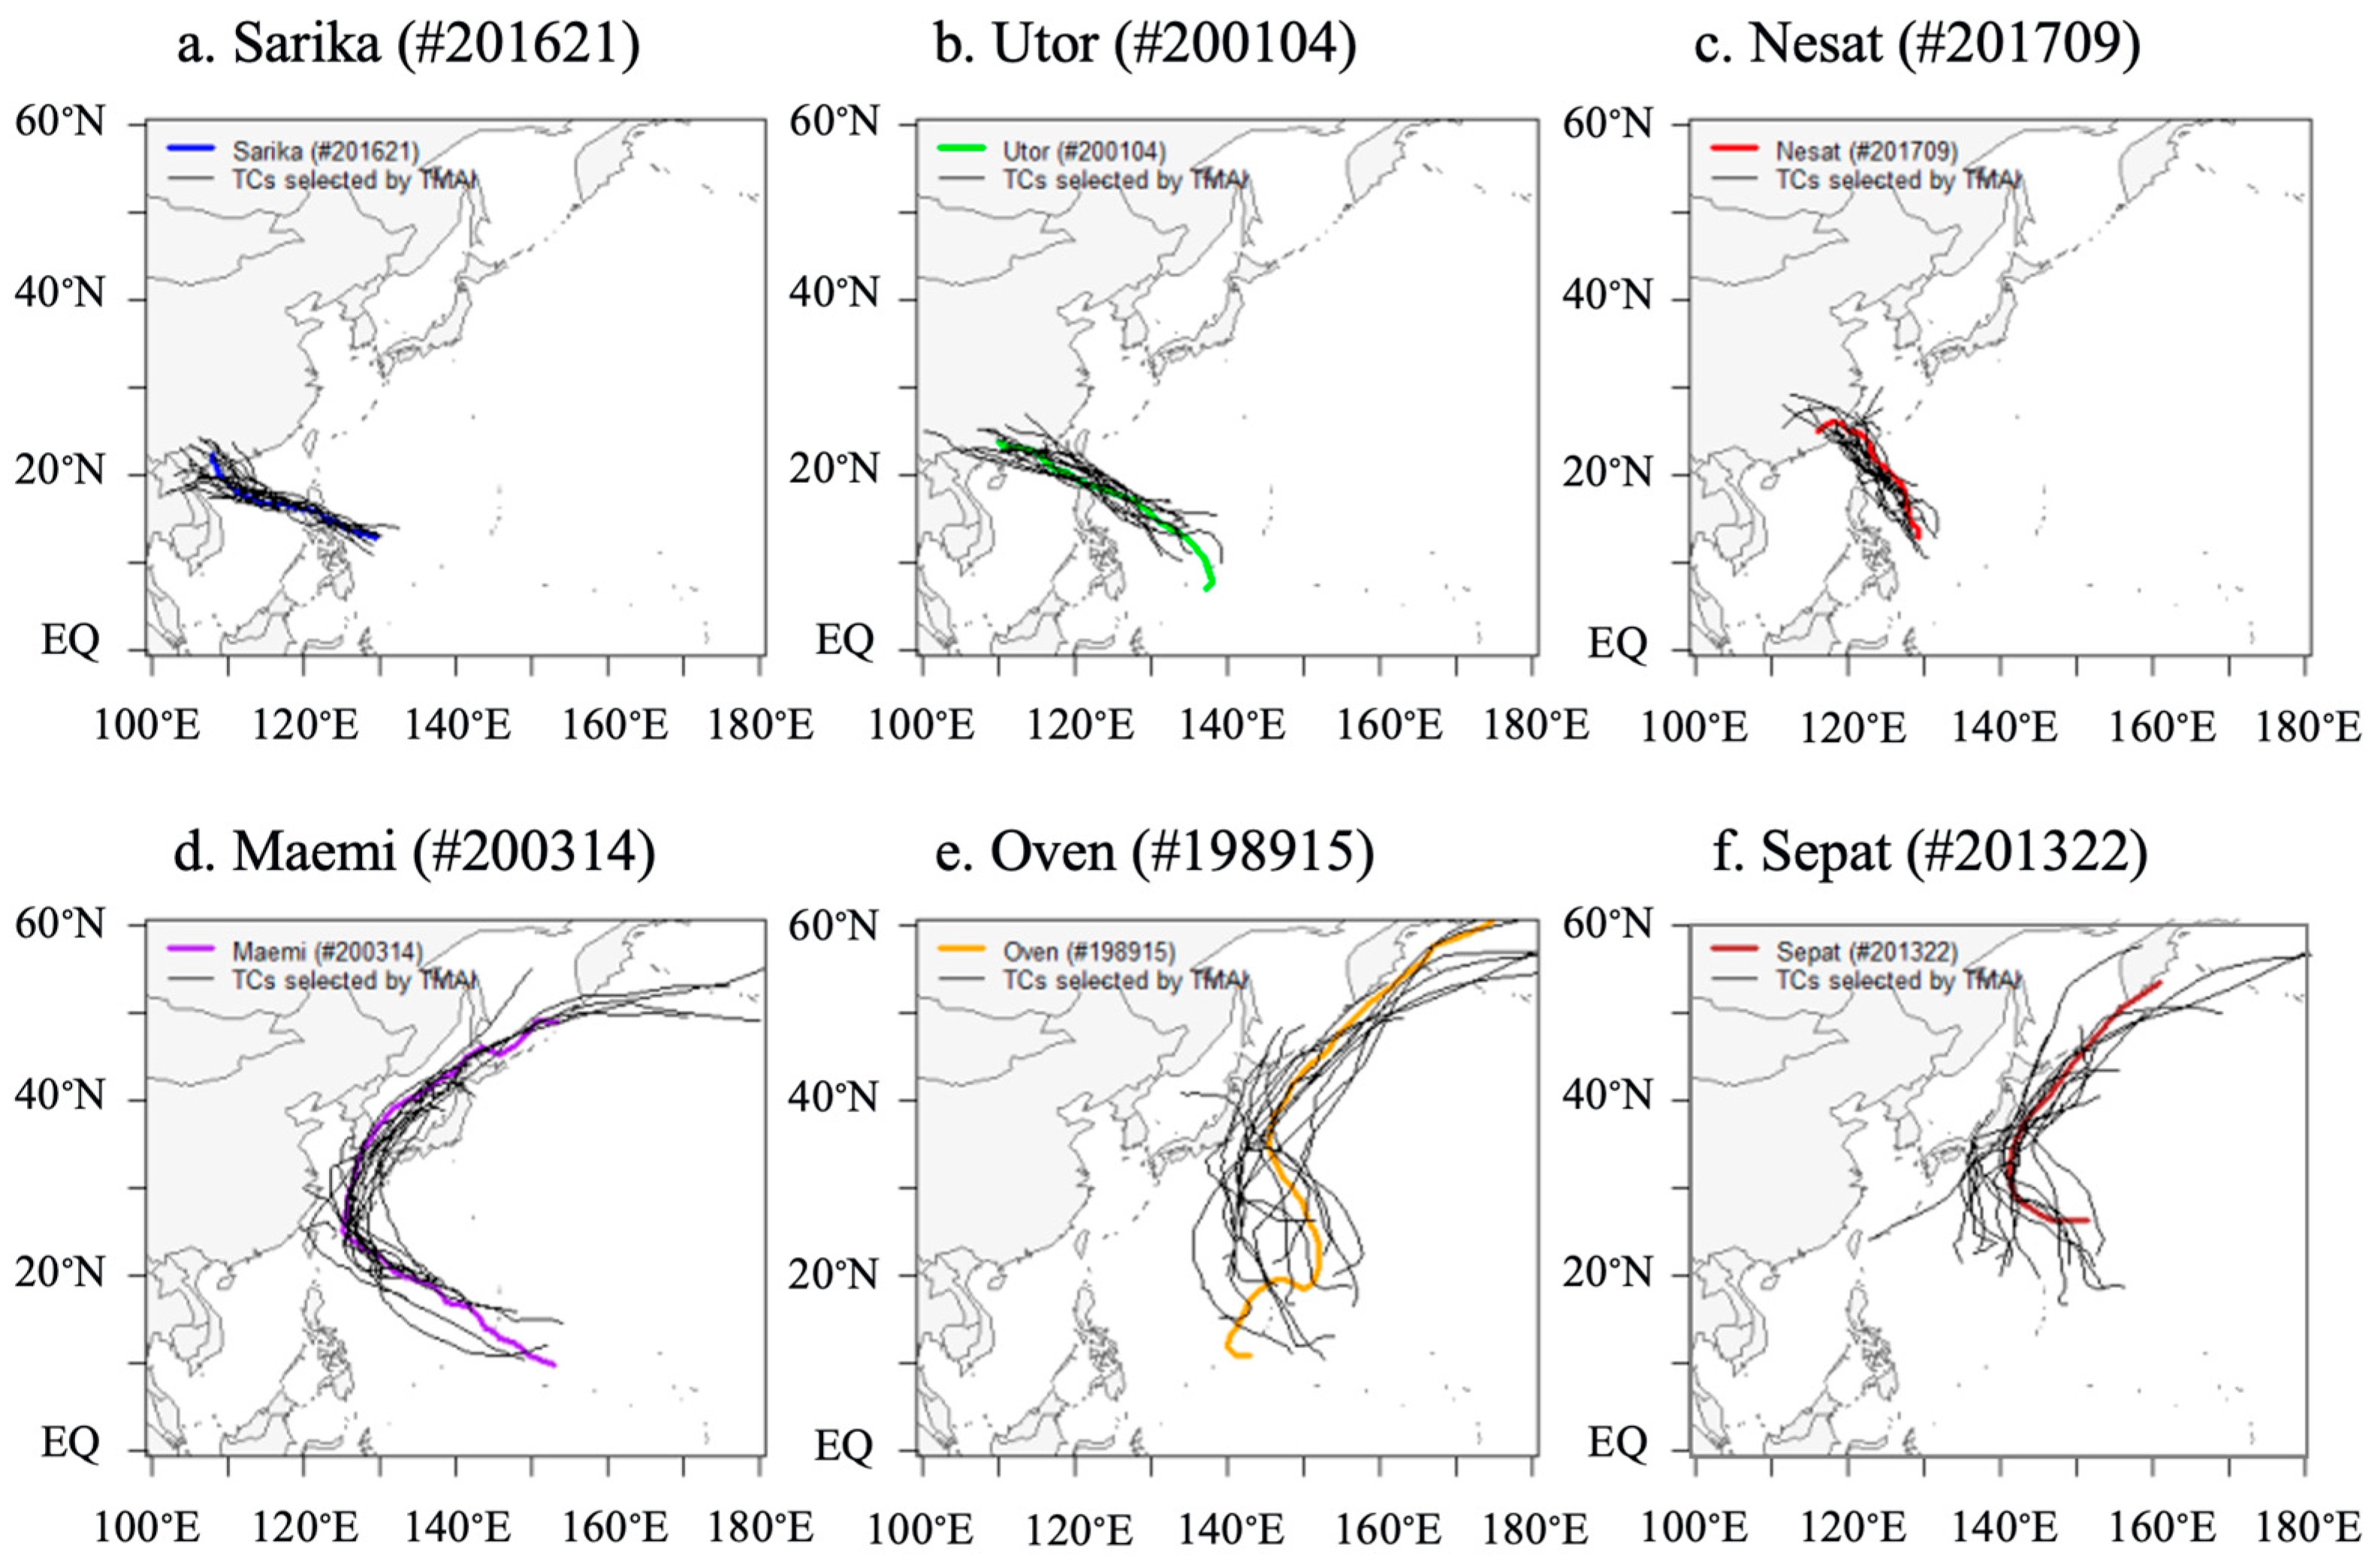
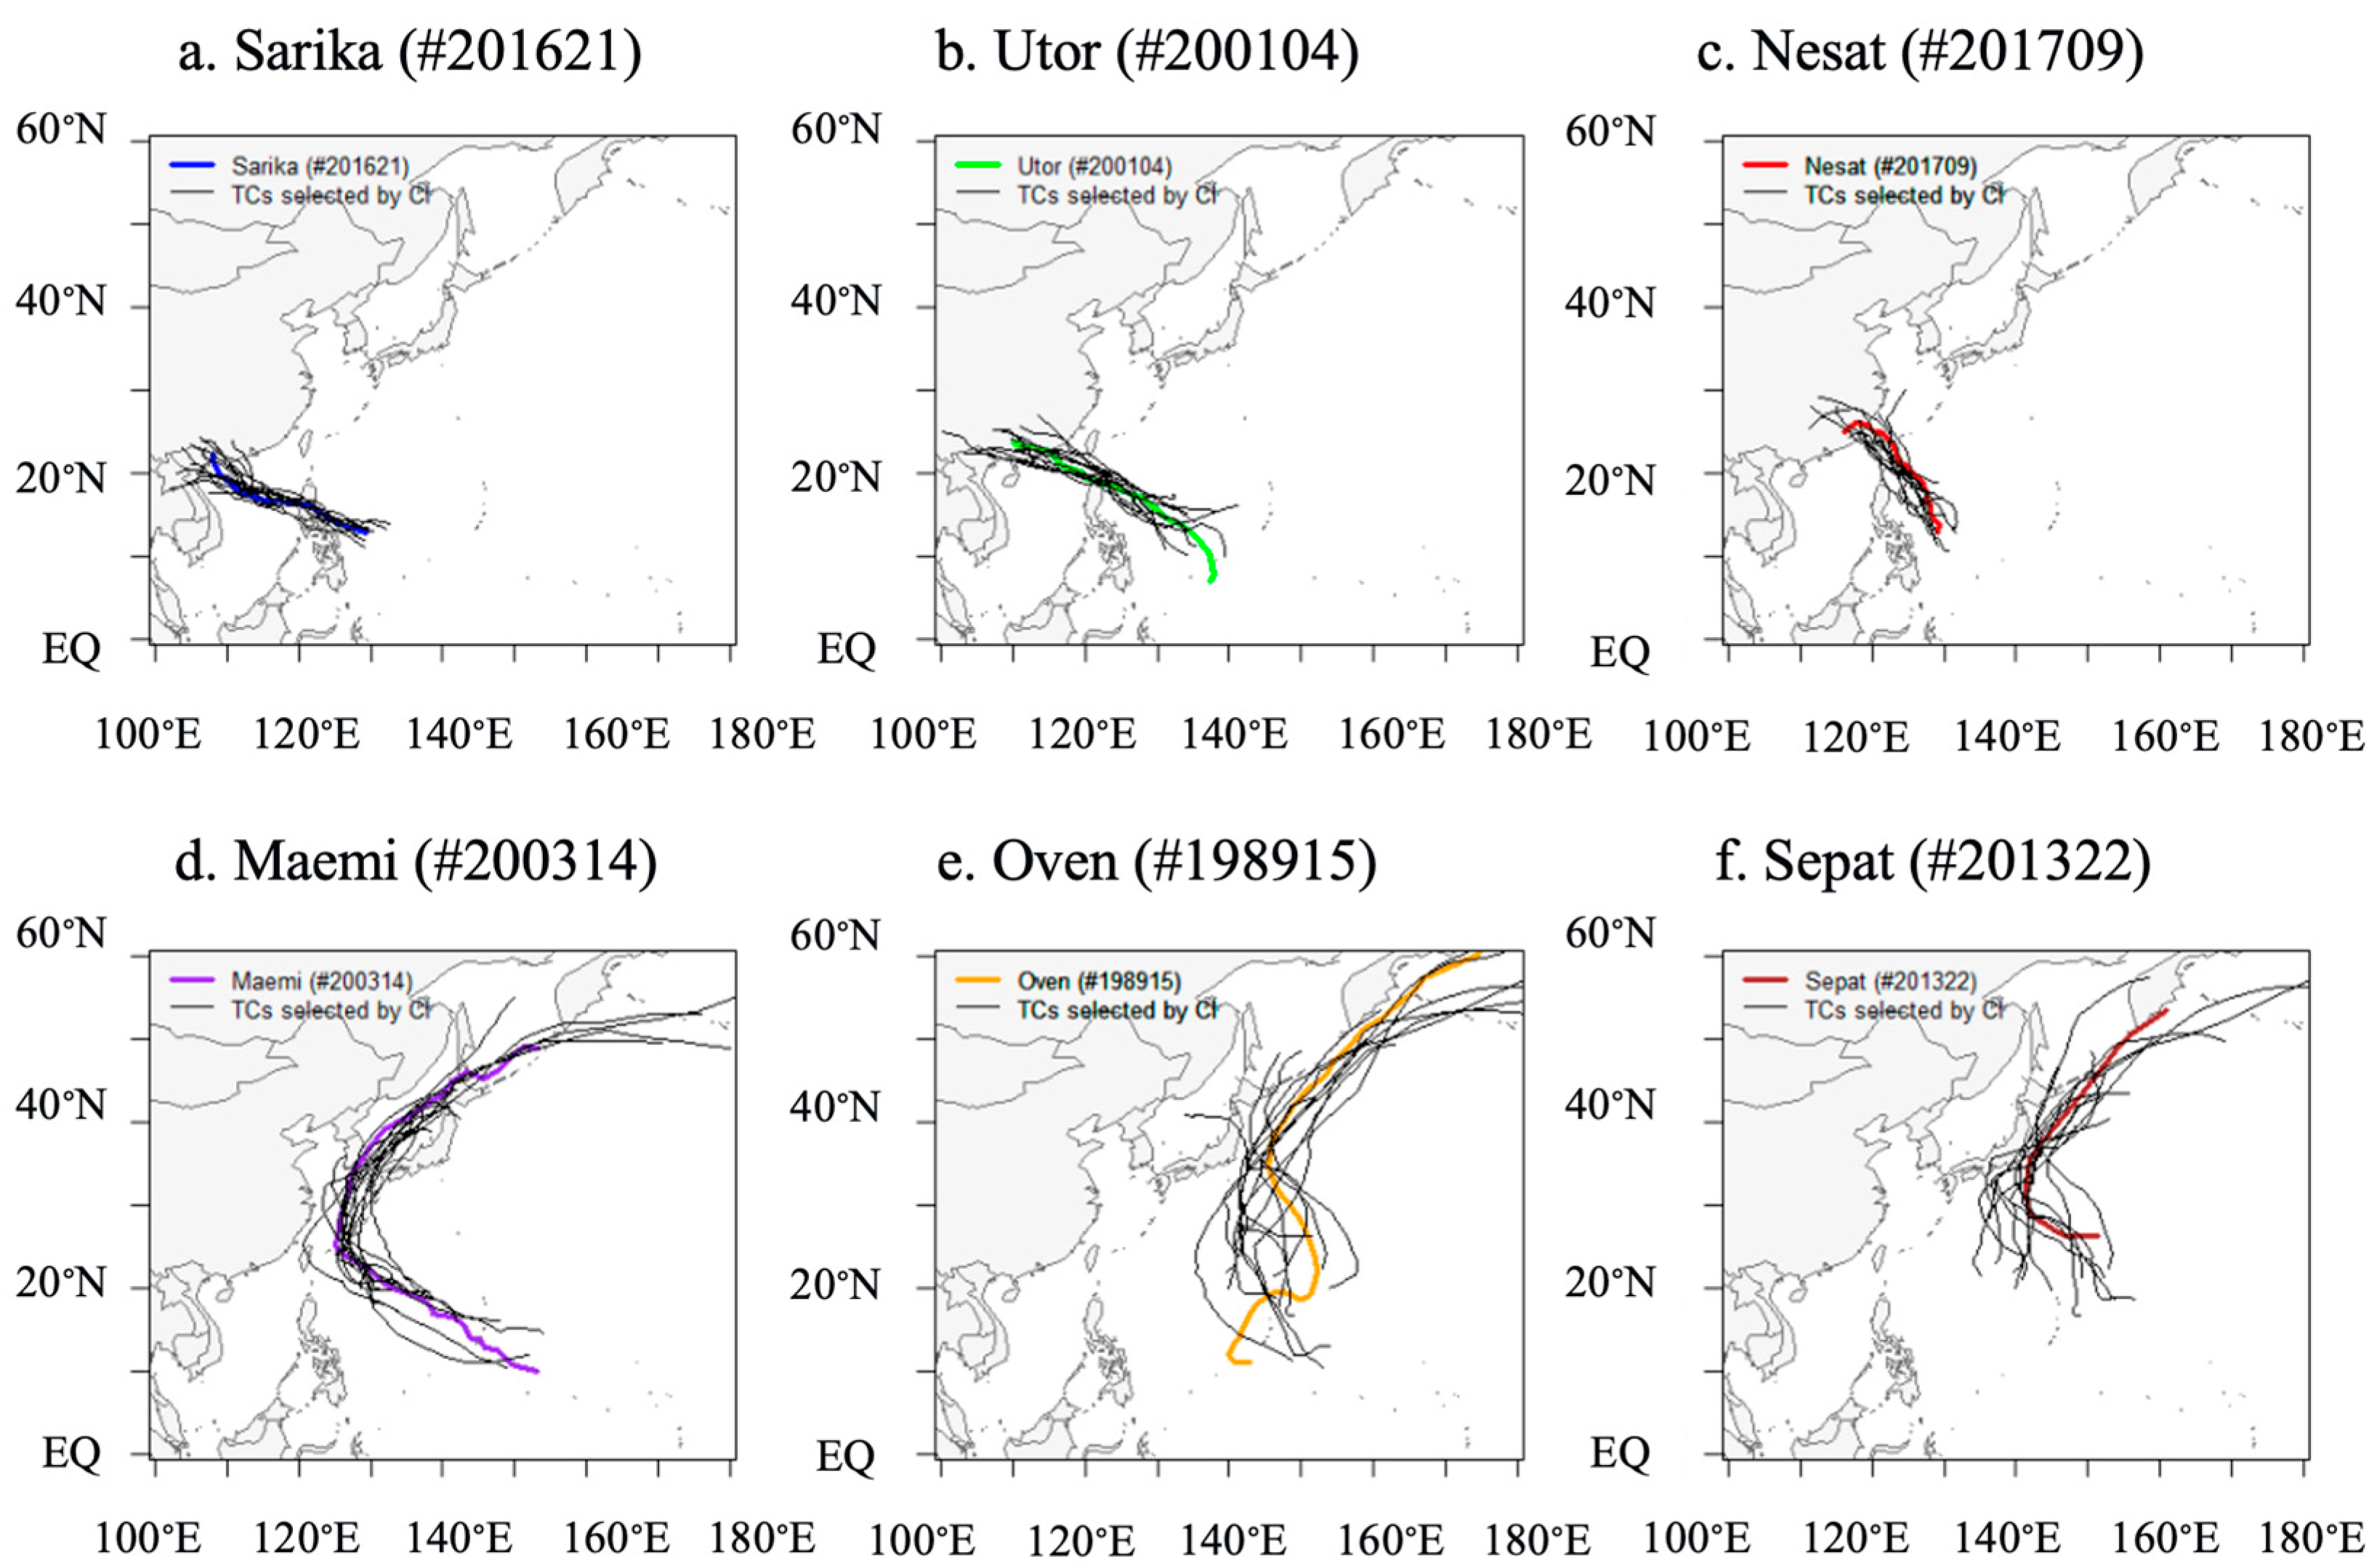
To comprehensively evaluate the predictive performance of our model, we selected six test typhoons that represent the spectrum of typhoon characteristics encountered in the Western North Pacific region in terms of track geometry, intensity variation, geographical distribution, temporal distribution, and rainfall patterns. The selected typhoons are Sarika (#201621), Utor (#200104), Nesat (#201709), Maemi (#200314), Owen (#198915), and Sepat (#201322). This diverse selection ensures that our model validation covers a wide range of typhoon behaviors and environmental conditions, providing a robust assessment of the proposed methodology’s generalizability. A visual representation of their respective tracks is provided in
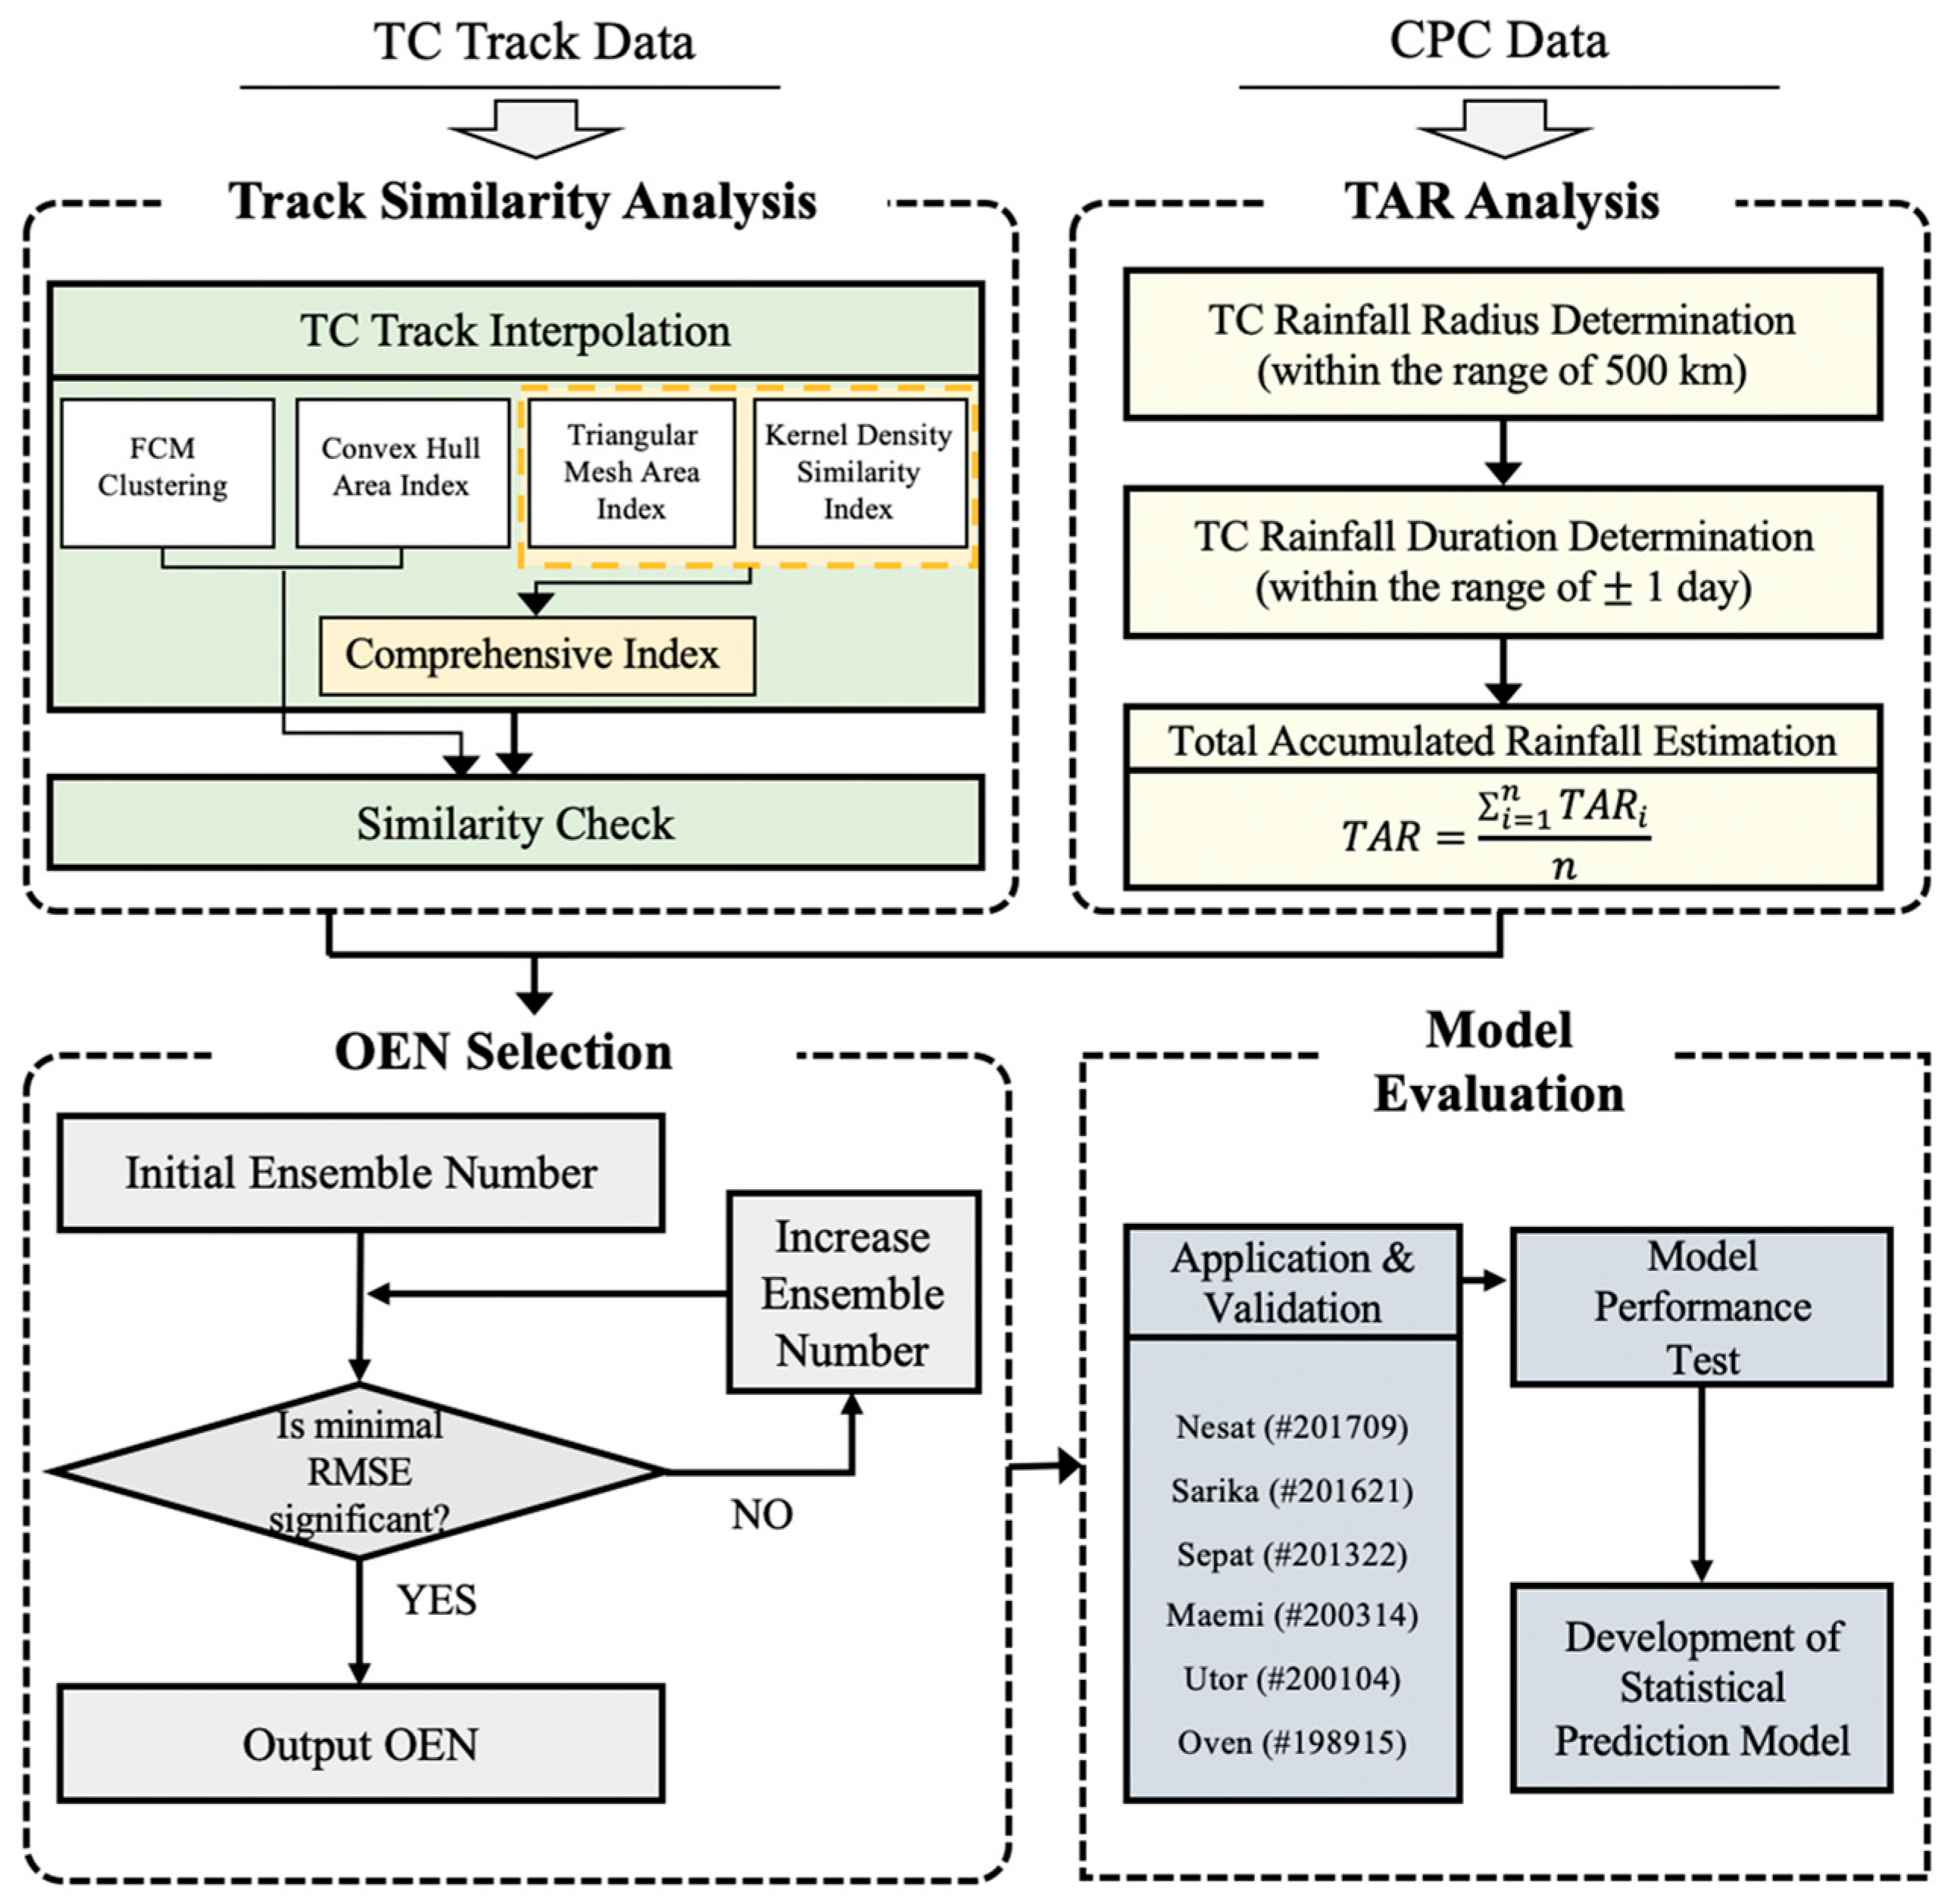
Figure 2, whereas the methodology flowchart can be accessed in
Figure 3.
Sarika (#201621) emerged in October 2016, leaving its mark on both the Philippines and China. Recognized as the twenty-first typhoon and the tenth super typhoon of the 2016 Pacific typhoon season, it developed east of the Philippines on 13 October. The storm rapidly reached typhoon status by 14 October. As it approached the northern Philippines, its intensity surged, culminating in its landfall on Luzon as a Category 4 super typhoon on 15 October with winds reaching 150 mph (240 km/h). The onslaught of Sarika brought heavy rainfall, powerful winds, and storm surges, wreaking havoc on infrastructure, causing significant crop losses, and resulting in at least four fatalities. Although its strength diminished after crossing the northern Philippines, it rebounded before impacting China’s southern coast. It made a Category 2 landfall in Hainan Province on 18 October, bringing winds of 105 mph (165 km/h) and causing widespread damage and power disruptions [
29,
30].
Utor (#200104) carved its path in July and August of 2001, affecting the Philippines, Taiwan, and China. Marking its presence as the ninth named storm and the fourth typhoon of the 2001 Pacific typhoon season, it originated near the Federated States of Micronesia on 25 July. Its transformation into a tropical storm occurred swiftly, and as it neared the northern Philippines by 27 July, it intensified into a typhoon. By the time it made landfall on Luzon on 30 July, it was accompanied by winds of 140 km/h and gusts of up to 180 km/h [
31]. Nesat (#201709) was noteworthy for its comparatively slow pace, with an average speed of around 10 km/h (6.2 mph). Its journey began east of the Philippines, trailing northwest through the Luzon Strait, before impacting Taiwan and eventually steering towards the East China Sea. The typhoon was the harbinger of severe flooding, landslides, and extensive damage in the Philippines, Taiwan, and southern China, causing the loss of hundreds of lives and considerable economic setbacks [
32].
In September 2003, Typhoon Maemi (#200314) unleashed its wrath upon South Korea and Japan. Notably, Maemi was the most intense typhoon to hit South Korea in over a century and is also among the top four most potent typhoons documented in the western Pacific. Its origin traces back to Guam on 5 September 2003, and it intensified rapidly, moving northwest. By the time it hit South Korea’s southern coast on 12 September, it was a Category 4 typhoon with winds of 230 km/h (145 mph). South Korea bore the brunt of its might, witnessing power outages, landslides, and floods. The calamity resulted in the death of over 100 individuals and displaced thousands [
33,
34].
August 1989 witnessed the rise of Owen (#198915) as a tropical depression to the east of the Northern Mariana Islands. Its intensification into a typhoon was rapid, and it charted a west-northwest course, narrowly missing Guam on 9 August. At its peak on 12 August, Owen showcased winds of 185 km/h (115 mph). However, it began weakening as it shifted to the north-northwest, making landfall on the Japanese island of Honshu by 14 August. Its aftermath in Japan was devastating, with intense winds, heavy rainfall, landslides, and floods. The disaster resulted in the demise of at least 10 people, injuring over 100. Owen’s remnants continued north, eventually dissipating by 18 August [
35].
Finally, in August 2013, Sepat (#201322) made its presence felt as a formidable force across Taiwan, China, and Japan. As the 22nd named storm and seventh typhoon of the 2013 Pacific typhoon season, Sepat originated on 14 August in the western Pacific Ocean. Its rapid intensification led it to achieve Category 4 super typhoon status by 18 August, with winds reaching 215 km/h (135 mph). Japan faced the initial brunt, with floods and landslides leading to six fatalities and forcing thousands to evacuate. The storm’s path then shifted northward, causing extensive damage to infrastructure and agricultural landscapes.
4. Discussion
4.1. Main Findings and Implications
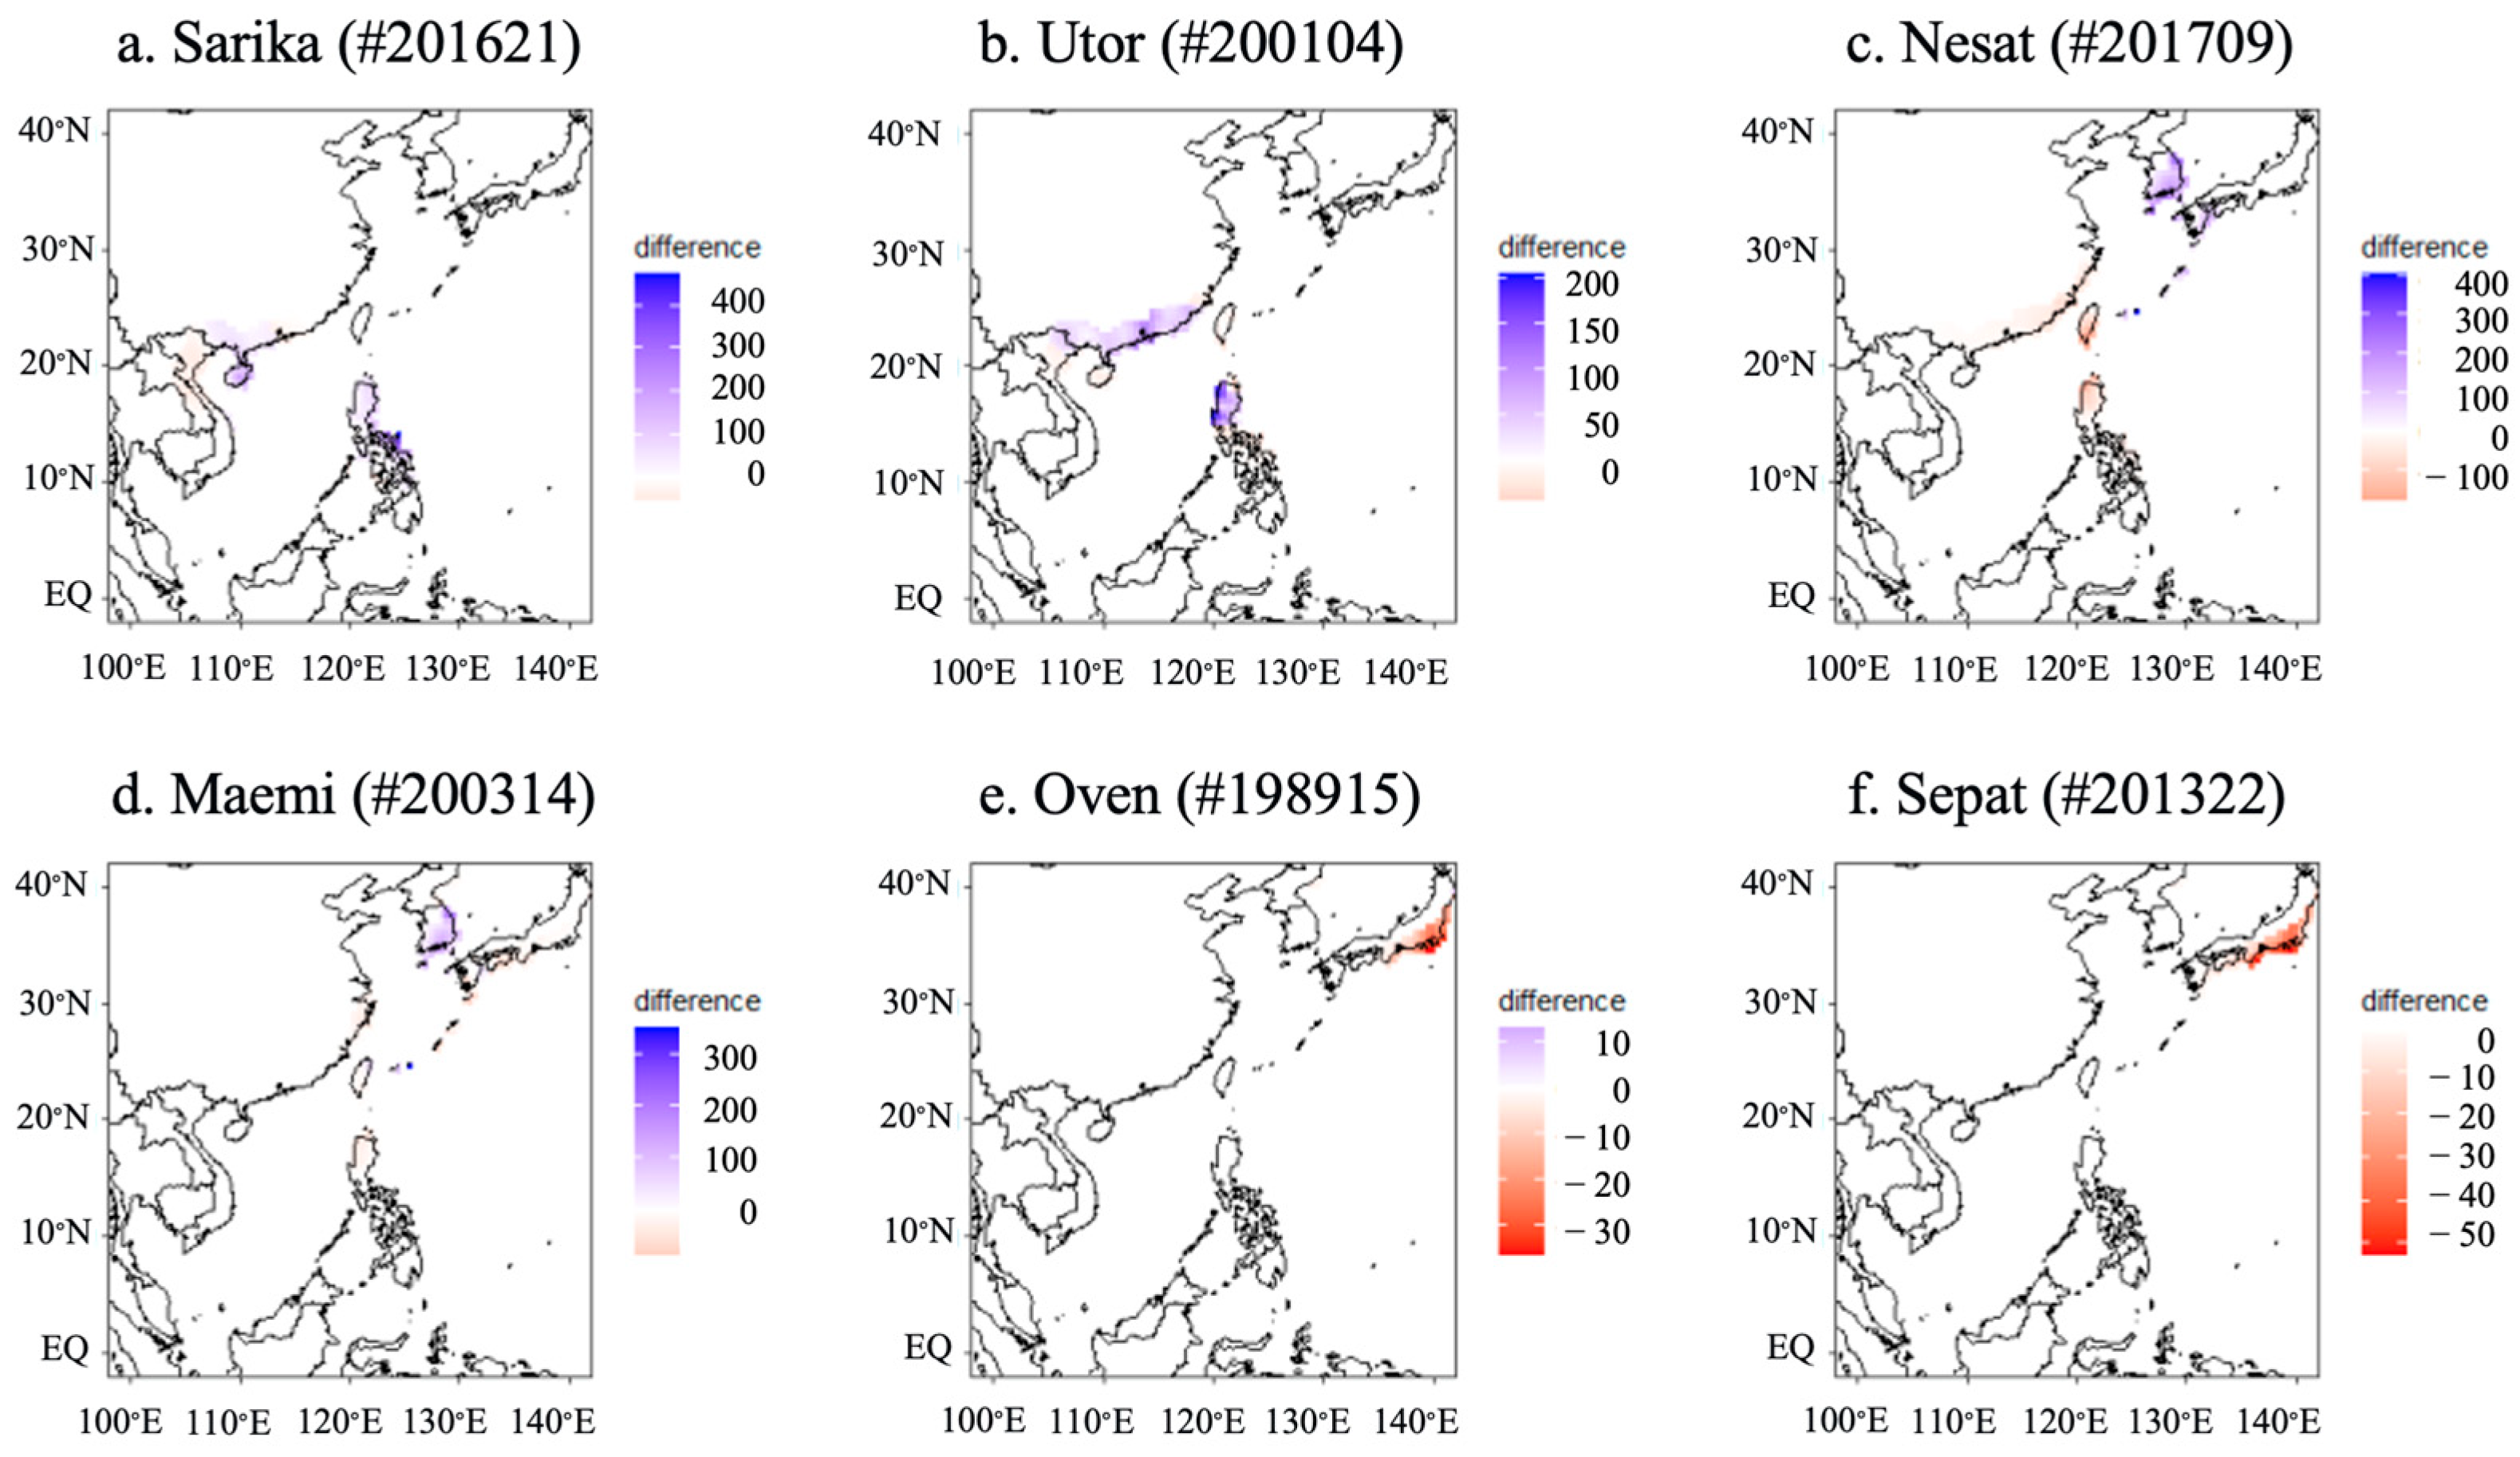
This study demonstrates that trajectory-based similarity modeling provides an effective framework for TAR prediction in East Asia. The development of the Kernel Density Similarity Index (KDSI) represents a conceptual advancement by incorporating probabilistic density estimation into track similarity assessment, while the Comprehensive Index (CI) successfully integrates geometric and probabilistic approaches to overcome individual limitations. The consistent outperformance of CI across diverse typhoon cases (
Figure 8,
Table 1) underscores the value of hybrid similarity metrics that leverage complementary strengths of different approaches. Through systematic sensitivity analysis, we identified optimal ensemble sizes for each method, with the CI method achieving the best performance using 13 analogous typhoons. This underscores the advantage of referencing multiple similar events rather than relying on a single historical analog.
The practical implications of our research are significant for disaster risk management. By providing more accurate TAR forecasts, our method can enhance early warning systems and support hydrological planning in typhoon-prone regions. The ensemble approach offers a balanced solution that captures rainfall pattern variability while maintaining prediction stability. From an academic perspective, this research advances the methodology of typhoon track comparison by incorporating kernel density estimation into statistical similarity analysis for the first time and demonstrates that a combined index can effectively overcome the shortcomings of individual methods.
4.2. Limitations and Generalizability
Several limitations should be acknowledged when interpreting our results. First, the methodology’s performance is inherently tied to the comprehensiveness of the historical database. Regions with sparse historical typhoon records may show reduced prediction skill due to limited analogous cases. Second, our approach assumes a degree of stationarity in typhoon–rainfall relationships, which may be affected by climate change-induced nonstationarity over the long term.
Regarding generalizability, our methodology demonstrates strong potential for application to other basins with appropriate calibration. The kernel density and geometric similarity principles are fundamentally transferable, though optimal parameters (e.g., ensemble size, spatial buffers) will likely require region-specific adjustment. The data requirements are explicitly defined: six-hourly track data and daily precipitation fields at resolutions comparable to the CPC and RSMC datasets used in this study. For regions with different data characteristics or topographic settings, preprocessing and parameter recalibration would be necessary, but the core algorithmic framework remains applicable. The geographic specificity of our findings, particularly the role of East Asia’s complex topography, underscores that successful application elsewhere depends on understanding the local physical drivers of typhoon rainfall.
4.3. Future Research Directions
Future work will focus on several key directions to build upon this research. A primary goal is the integration of our similarity indices with ensemble numerical weather prediction (NWP) track forecasts to establish skill curves across different lead times and quantify the added value of trajectory-based analog methods in an operational context. Furthermore, a commitment to pioneering advanced techniques tailored to account for variables like translation speed, cyclonic intensity, and environmental factors is paramount for augmenting the overarching efficacy of the model.
To address potential nonstationarity, future research should explicitly test the temporal stability of these similarity relationships by conducting temporal blocking cross-validation and sub-period analyses. Investigating whether incorporating climate indices could enhance the method’s resilience to changing climate conditions is another critical avenue. Furthermore, refining the similarity index through the incorporation of more intricate physical parameters—such as translation speed, cyclonic intensity, and environmental factors—presents a pathway to establishing even more precise and robust methodologies for TAR prediction. These efforts will help establish trajectory-based analog methods as valuable complementary tools in operational forecasting systems while advancing our fundamental understanding of typhoon–rainfall relationships.
5. Conclusions
This study sets out to address a critical gap in typhoon-induced rainfall forecasting: the underutilization of empirical knowledge embedded in historical typhoon trajectories. While traditional approaches have emphasized meteorological parameters and dynamical models, we demonstrated that the geometry of a typhoon’s path holds powerful predictive information for rainfall estimation.
Our key finding is that integrating probabilistic and geometric perspectives through the Comprehensive Index (CI) creates a more robust foundation for rainfall prediction than either approach alone. The success of this hybrid method reveals that typhoon rainfall patterns are not merely products of atmospheric physics but also of consistent topographic interactions that repeat across similarly tracked storms. This insight fundamentally changes how we might approach empirical rainfall forecasting—not as a search for identical meteorological conditions, but as identification of analogous topographic forcing scenarios.
The practical significance of our findings lies in their operational flexibility. By demonstrating that track similarity alone can yield accurate rainfall estimates, we provide a complementary pathway that can enhance existing dynamical forecasts. This approach becomes particularly valuable when physical models diverge in their predictions, offering an empirically grounded alternative based on historical precedents.
Most importantly, our work establishes trajectory-based analog forecasting as a scientifically rigorous methodology rather than merely a heuristic technique. By developing quantitative similarity indices and systematic ensemble selection, we have created a framework that can be adapted across regions and evolving climate conditions. As typhoon behavior continues to change, this historical analog approach may prove increasingly vital for understanding new rainfall patterns through the lens of past experiences.


