Article

Optical Vortex-Enhanced LIBS: Signal Improvement and Precise Classification of Coal Properties with Machine Learning

1
School of Chemistry and Chemical Engineering, Xinjiang Normal University, Urumqi 830054, China
2
Xinjiang Key Laboratory for Luminescence Minerals and Optical Functional Materials, School of Physics and Electronic Engineering, Xinjiang Normal University, Urumqi 830054, China
*
Authors to whom correspondence should be addressed.
Appl. Sci. 2025, 15(21), 11590; https://doi.org/10.3390/app152111590
Submission received: 14 September 2025 / Revised: 17 October 2025 / Accepted: 20 October 2025 / Published: 30 October 2025

Abstract

Laser-induced breakdown spectroscopy (LIBS), limited by matrix effects, self-absorption in complex samples, and ambient atmospheric influences, still requires further improvement in detection sensitivity and signal stability. In this work, the excitation beam of LIBS is modulated into an optical vortex by an optical phase element, and optical vortex-induced LIBS is used to detect and analyze coal samples. Building on the uniform annular intensity distribution and orbital angular momentum (OAM) carried by the optical vortex, it is anticipated that spectral signal intensity can be enhanced by improving plasma ablation efficiency, reducing shielding effects, and increasing electron collision frequency, thereby reducing signal uncertainty and enhancing LIBS analytical performance. For the first time, a classification model combining principal component analysis (PCA) and support vector machine (SVM) is developed, integrating optical vortex-induced LIBS technology with machine learning. Using the PCA-SVM model, optical vortex-based LIBS attained a coal classification accuracy of 95%, significantly higher than the 88% achieved with Gaussian beams, thereby markedly improving classification performance for complex matrix samples. These results demonstrate that optical vortex-induced LIBS possesses strong potential for efficient detection of samples with complex matrices.

1. Introduction

Laser-induced breakdown spectroscopy (LIBS), as an atomic emission spectroscopy technique, has garnered significant attention across various fields, including fuel mineral analysis (matrix composition) [1,2,3], environmental monitoring (soil and atmospheric pollutant detection) [4,5], and biomedicine (disease diagnosis and biological tissue imaging) [6,7]. Valued for its minimal sample preparation, rapid analysis, and multi-element detection capabilities [8,9], LIBS is a promising technique for analyzing complex samples such as coal. Although LIBS offers advantages such as in situ and rapid detection, its efficacy is limited by complex laser–matter interactions, insufficient ablation volume, interference from the sample’s complex matrix, environmental gases, rapid plasma cooling, and uneven spatial distribution of the plasma. These factors lead to deviations from ideal plasma behavior, including local thermal equilibrium disruption, non-optical thinning, and non-stoichiometric ablation. This significantly weakens plasma radiation intensity and compromises the accuracy of spectral analysis within the spatio-temporal detection window, impairing detection stability and the reliability of quantitative models [10,11]. Therefore, there is an urgent need to develop more reliable methods to enhance the detection accuracy and sensitivity of LIBS for complex matrix samples.
Currently, various methods are used to improve the signal quality and stability of LIBS, including dual-pulse-induced plasma [12], TEA CO2 laser [13], spatial confinement [14], discharge assistance [15], nanoparticle-enhancement [16], and magnetic confinement [17]. These methods increase the plasma electron density and temperature and prolong plasma lifetime by reducing energy loss and increasing energy deposition, thereby substantially enhancing the intensity of LIBS signals and the analytical accuracy and stability for samples with complex matrices. However, they also inevitably induce additional experimental costs and increase the complexity of the system, restricting the flexible application of LIBS technology in the industrial field. In recent years, improving LIBS spectral quality through beam shaping has attracted extensive research attention. It is well known that the intensity profile, phase distribution, and polarization state of the excitation source affect the dynamics of laser–matter interactions. Studies have shown that the beam profile of the excitation source influences the long-term repeatability of LIBS signals [18]. Numerous studies have investigated the impact of flat-top and annular beams on LIBS detection performance. They found that, compared with a Gaussian beam, a more uniform intensity distribution can effectively mitigate the plasma shielding effect [19,20,21,22]. Hai et al. reported a fourfold signal enhancement and a threefold improvement in the limit of detection (LOD) for aluminum alloys using an annular beam produced by an annular aperture [23]; Delaney et al. reported a lower LOD for copper alloys in an annular-beam LIBS experiment [24].
It should be noted that the above-mentioned annular beams are generated by an axicon combined with a focusing lens. They exhibit an annular intensity profile, do not possess a helical phase front, and thus carry zero orbital angular momentum (OAM). Optical vortex, which possesses an annular intensity form and carries definite photon orbital OAM of ℓℏ characterized by phase factor exp(iℓφ) (where refers to topological charge, and φ is the azimuthal angle) [25,26], has garnered substantial attention for applications, including quantum optics and communication [27], biomedicine [28], material processing [29,30] and spectral analysis [31,32]. Since 2022, researchers have, for the first time, converted a traditional Gaussian beam into vortex optics carrying OAM through a phase modulation element, and compared the effects of femtosecond vortex and Gaussian beams-induced LIBS on the spectral signals of Cu plasma. They found that the Cu plasma produced by vortex beams exhibited higher temperature and electron density than that produced by Gaussian-beam LIBS [33]. Subsequently, Bao et al. and Fu et al. independently confirmed that vortex beams improved plasma temperature, electron density, and signal stability (relative standard deviation) in single-pulse nanosecond and double-pulse LIBS experiments, respectively, when compared with Gaussian beams [34,35]. Recently, Li et al. used a spatial light modulator to generate two-dimensional structure beams with different cross sections (Gaussian, circular flat-top, annular, anti-cone, and arrow-target), and compared how focal spot shapes affect plasma characteristics in LIBS [11].
When an optical vortex interacts with plasma, the OAM it carries is transferred to electrons via the ponderomotive force, driving helical electron motion and generating a self-induced magnetic field. This accelerates the electron dynamics, increasing the electron collision frequency, and enhancing the plasma electron density and radiation signal intensity [36]. Meanwhile, the annular intensity distribution of an optical vortex can confine the transverse electron motion, improve ion-beam collimation, and yield a more uniform plasma [37,38]. The helical phase wavefront and spatially separated longitudinal electromagnetic field may fundamentally alter the dynamics of laser-plasma interaction [39].
Building on these findings, we used a spiral phase plate (SPP) to convert the LIBS excitation beam into a vortex beam. By optimizing the excitation energy and defocusing distance for each beam, we compared the LIBS spectra of coal obtained with Gaussian and vortex beams. While signal enhancement is crucial, accurately classifying complex matrices, such as coal, remains challenging due to spectral complexity and matrix effects. To address this, machine learning approaches, particularly principal component analysis (PCA) combined with support vector machine (SVM), offer powerful tools for handling high-dimensional LIBS data. These techniques extract salient features from complex spectra and build robust classification models that overcome the limitations of conventional analytical methods. We found that vortex beam-induced LIBS enhances spectral signal intensity, plasma temperature, and electron density owing to the annular energy distribution and inherent OAM. The PCA-SVM model applied to vortex-induced LIBS achieved 95% classification accuracy, significantly higher than that of Gaussian beam LIBS (88%), demonstrating that combining vortex beam-induced LIBS with machine learning improves classification performance for complex matrices.

2. Experimental Setup

2.1. Sample Preparation

In this study, four coal samples, including lignite, high-sulfur coal, anthracite, and long-flame coal, were investigated. Their key characteristics, including proximate analysis and calorific value, were determined on an as-received basis in accordance with Chinese National Standards GB/T 212-2008 [40], GB/T 213-2008 [41]. The results are summarized in Table 1. To overcome detection bottlenecks—including weak LIBS signals, insufficient elemental analysis due to complex matrix effects, and poor repeatability and stability—we performed a simple pretreatment on the samples before experimentation. The coal samples were ground to a powder using a mortar and pestle and then sieved through a 200 µm mesh. A manual tablet press (Huali, No. 24016859, Shijiazhuang, Hebei, China) and corresponding molds were used to compress the powdered samples into cylindrical tablets. Before compression, each sample was weighed to 3.5 g using an electronic balance. Tableting was conducted at 65 MPa with a holding time of 15 min, producing circular coal tablets approximately 25 mm in diameter and 3 mm in height with smooth surfaces (see Figure 1b).

2.2. Laser-Induced Breakdown Spectroscopy Experimental Model

The experimental setup for coal detection using vortex beam-induced LIBS is shown in Figure 1a. A high-energy Q-switched Nd: YAG pulsed laser (Q-smart 850, Quantel, Newbury, UK, wavelength: 1064 nm, pulse duration: 5 ns, PRF: 10 Hz, beam diameter: 9 mm, M2 < 2, maximum single pulse output energy of 850 mJ, and energy stability of 2%) was used as the LIBS excitation source, and its output was converted into a second-order optical vortex (topological charge = 2) using an SPP (azimuthally divided into 32 segments with an nπ/8 phase shift). A π/2 waveplate (HWP) was used to adjust the polarization to linear for optimal phase modulation. Each photon in the vortex beam carries OAM of 2ℏ during propagation.
As shown in Figure 2, a CCD (BGS-USB-SP620) (Ophir-Spiricon, North Logan, UT, USA) combined with an attenuator was used to measure near- and far-field intensity distributions. In the near field (Figure 2a,b), the intensity profile of both Gaussian and vortex beams is discontinuous. Because of the large output spot of the laser, using an SPP for mode conversion phase-modulates only the central portion of the field. To mitigate non-uniform mode conversion due to the large beam size, an adjustable diaphragm D was used to trim the peripheral intensity. In the far field (Figure 2a1,b1), the Gaussian beam exhibited a near-Gaussian profile with centrally concentrated energy that decreased toward the periphery and a measured beam diameter of 65 μm, whereas the vortex beam showed an annular profile with a center phase singularity and an expanded diameter of approximately 87 μm. There is a relationship between the vortex optics modulated by the phase element and the Gaussian beam waist: wv = w0(2p + || + 1)1/2, where wv and w0 are the waists of the vortex and Gaussian beams, respectively. As shown in Figure 2c, the spiral phase wavefront, in its interaction with the focusing lens, produced a large focal spot and stronger convergence; the effective focal length fv was smaller than that of the Gaussian beam (fG), leading to different optimal defocus positions and excitation energies for LIBS. A convex lens L1 with a focal length of 100 mm was used to focus the excitation beam onto the sample surface. To prevent excessive ablation, the sample was mounted on a three-dimensional electric displacement stage, and a preprogrammed routine controlled its motion and step size. The plasma signal was collected with a convex lens L2 with a focal length of 50 mm, a coupling fiber, and a high-resolution four-channel spectrometer (AvaSpec-ULS4096CL, Avantes, Apeldoorn, The Netherlands, 198 nm to 840 nm, 0.1 nm resolution); the lens axis was set at 45° to the sample surface. A digital delay generator (DG535, Stanford Research Systems (SRS), Sunnyvale, CA, USA, 5 ps delay resolution) controlled the delay between the spectrometer and the laser pulse.

3. Results

3.1. Experimental Parameters Optimization

Delay, excitation energy, and defocus distance were optimized by monitoring the signal-to-background ratio (SBR) and signal stability, quantified by the relative standard deviation (RSD), of characteristic emission lines representing metallic and non-metallic elements in coal—Mg II (279.61 nm), Si I (288.16 nm), and Ca II (393.37 nm).
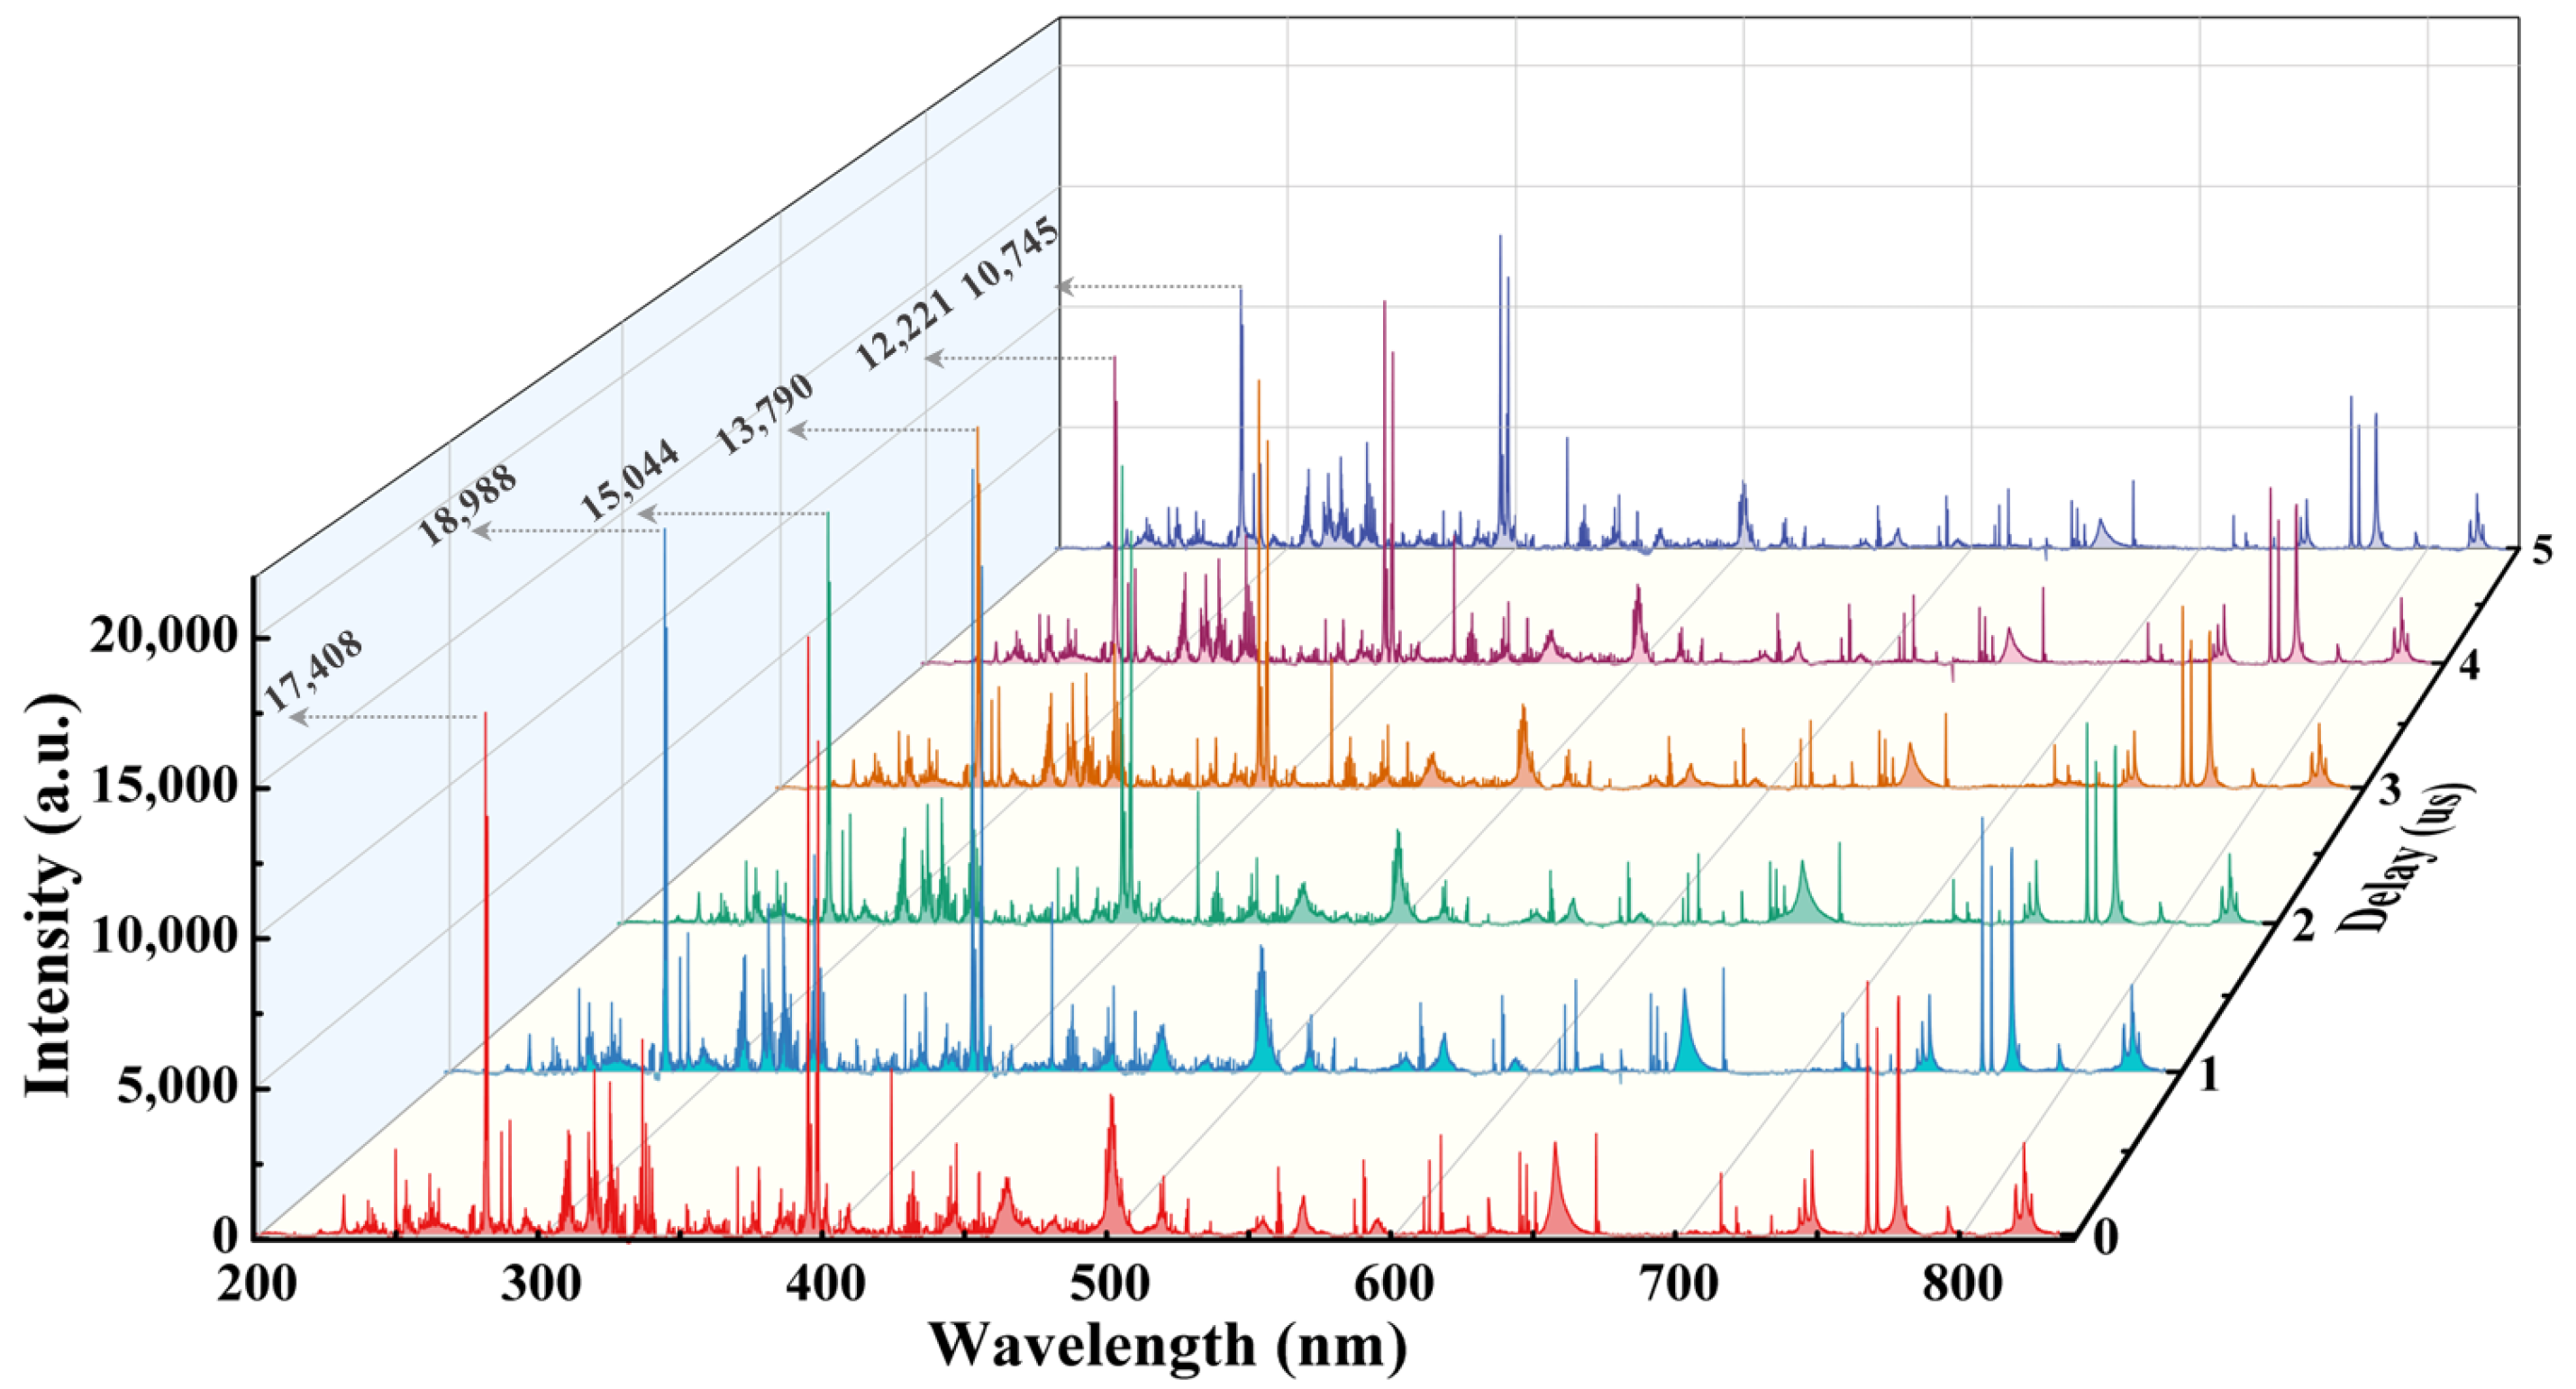
Because the mode profiles of vortex and Gaussian beams affect LIBS performance, lignite was selected as the test material, and the gate delay, excitation energy, and defocus distance relative to the sample surface were optimized. For this optimization, the Mg II 279.61 nm line was used as a representative of diagnostically rich ionic transitions in the coal matrix. To minimize sample heterogeneity, 100 LIBS spectra were collected at distinct locations using a motorized translation stage; each spectrum was an average of 200 laser pulses to reduce random noise. For each delay, the mean line intensity over the 100 spectra was computed to quantify its dependence on gate delay. Choosing the spectrometer gate delay is critical for suppressing continuum background. Figure 3 shows the time evolution of the vortex beam-induced LIBS signal within 5 µs after plasma generation. At early times, continuum emission (bremsstrahlung and recombination) dominated as the laser rapidly heated and ionized the material, creating a hot, dense, optically thick plasma in which self-absorption suppressed line emission. Around 1 µs, the line intensity reached a maximum as the continuum decayed and the optical thickness decreased. Beyond 1 µs, both temperature and electron density decreased with delay, and the plasma cooled and decayed, reducing line intensity. The trend for the Mg II 279.61 nm line is highlighted in Figure 3, illustrating the delay dependence of the characteristic line intensity. These results indicate that a gate delay of approximately 1 µs yielded the strongest signal. The corresponding behavior for the Gaussian beam is provided in Figure A1 (Appendix A).
With the gate delay fixed at 1 µs, characteristic emission lines of metallic and non-metallic elements in lignite—Mg II (279.61 nm), Si I (288.16 nm), and Ca II (393.37 nm)—were selected to evaluate the repeatability, stability, and sensitivity of coal-quality detection using Gaussian and vortex-beam-induced LIBS. The RSD is an effective indicator of plasma signal fluctuations in LIBS. As shown in Figure 4a, as the gate delay increased from 0 to 5 µs, the average RSD for Gaussian beam-induced LIBS was generally higher than for the vortex beam. This is attributed to the more localized energy deposition of the Gaussian beam, which increased shot-to-shot ablation variability and plume dynamics, yielding less stable plasma signals. These results indicate that, within an appropriate gate delay, vortex-beam-induced LIBS exhibited better repeatability and higher stability. Moreover, at a 1 µs gate delay, the average RSD across the three lines reached a minimum for both beams, while the RSD difference between them was at its maximum; system performance was therefore optimal at this delay. Figure 4b shows the average SBR of the three lines as a function of gate delay. Compared with the Gaussian beam, vortex-beam-induced LIBS yielded a higher SBR, indicating lower detection limits and improved sensitivity.
Optimization of laser energy and defocus distance is also crucial for LIBS spectral performance. Insufficient laser energy fails to generate plasma effectively, whereas excessive energy promotes plasma shielding and self-absorption, degrading line emission. Defocus distance controls the on-target spot size and fluence, thereby affecting the ablation area and efficiency. As shown in Figure 4c, with the sample at the focus of lens L1, increasing the laser energy from 30 to 80 mJ caused the intensities of Mg II (279.61 nm), Si I (288.16 nm), and Ca II (393.37 nm) to rise and then fall. The peak line intensity occurred at 60 mJ for the vortex beam and at 50 mJ for the Gaussian beam. This is because the Gaussian beam concentrated energy at its center, yielding higher on-axis fluence; plasma ignition thus occurred readily at the spot core, reaching the ablation threshold at a lower total pulse energy. At these optimal energies, the optimal defocus distance was then determined. As shown in Figure 4d, scanning the sample position from −5 to +3 mm relative to the focal plane (negative: before focus; positive: after focus) caused the line intensities for both beams to increase to a maximum and then decrease. The optimal defocus position for the Gaussian beam was +1 mm (after focus), whereas for the vortex beam it was −1 mm (before focus). These results are consistent with the focusing behavior illustrated in Figure 2c. Due to the spiral phase wavefront, the vortex beam formed a larger spot size while exhibiting stronger convergence, and its effective focal length fv was smaller than that of the Gaussian beam, leading to different optimal defocus positions and excitation energies for vortex and Gaussian beam-induced LIBS.

3.2. Signal Enhancement

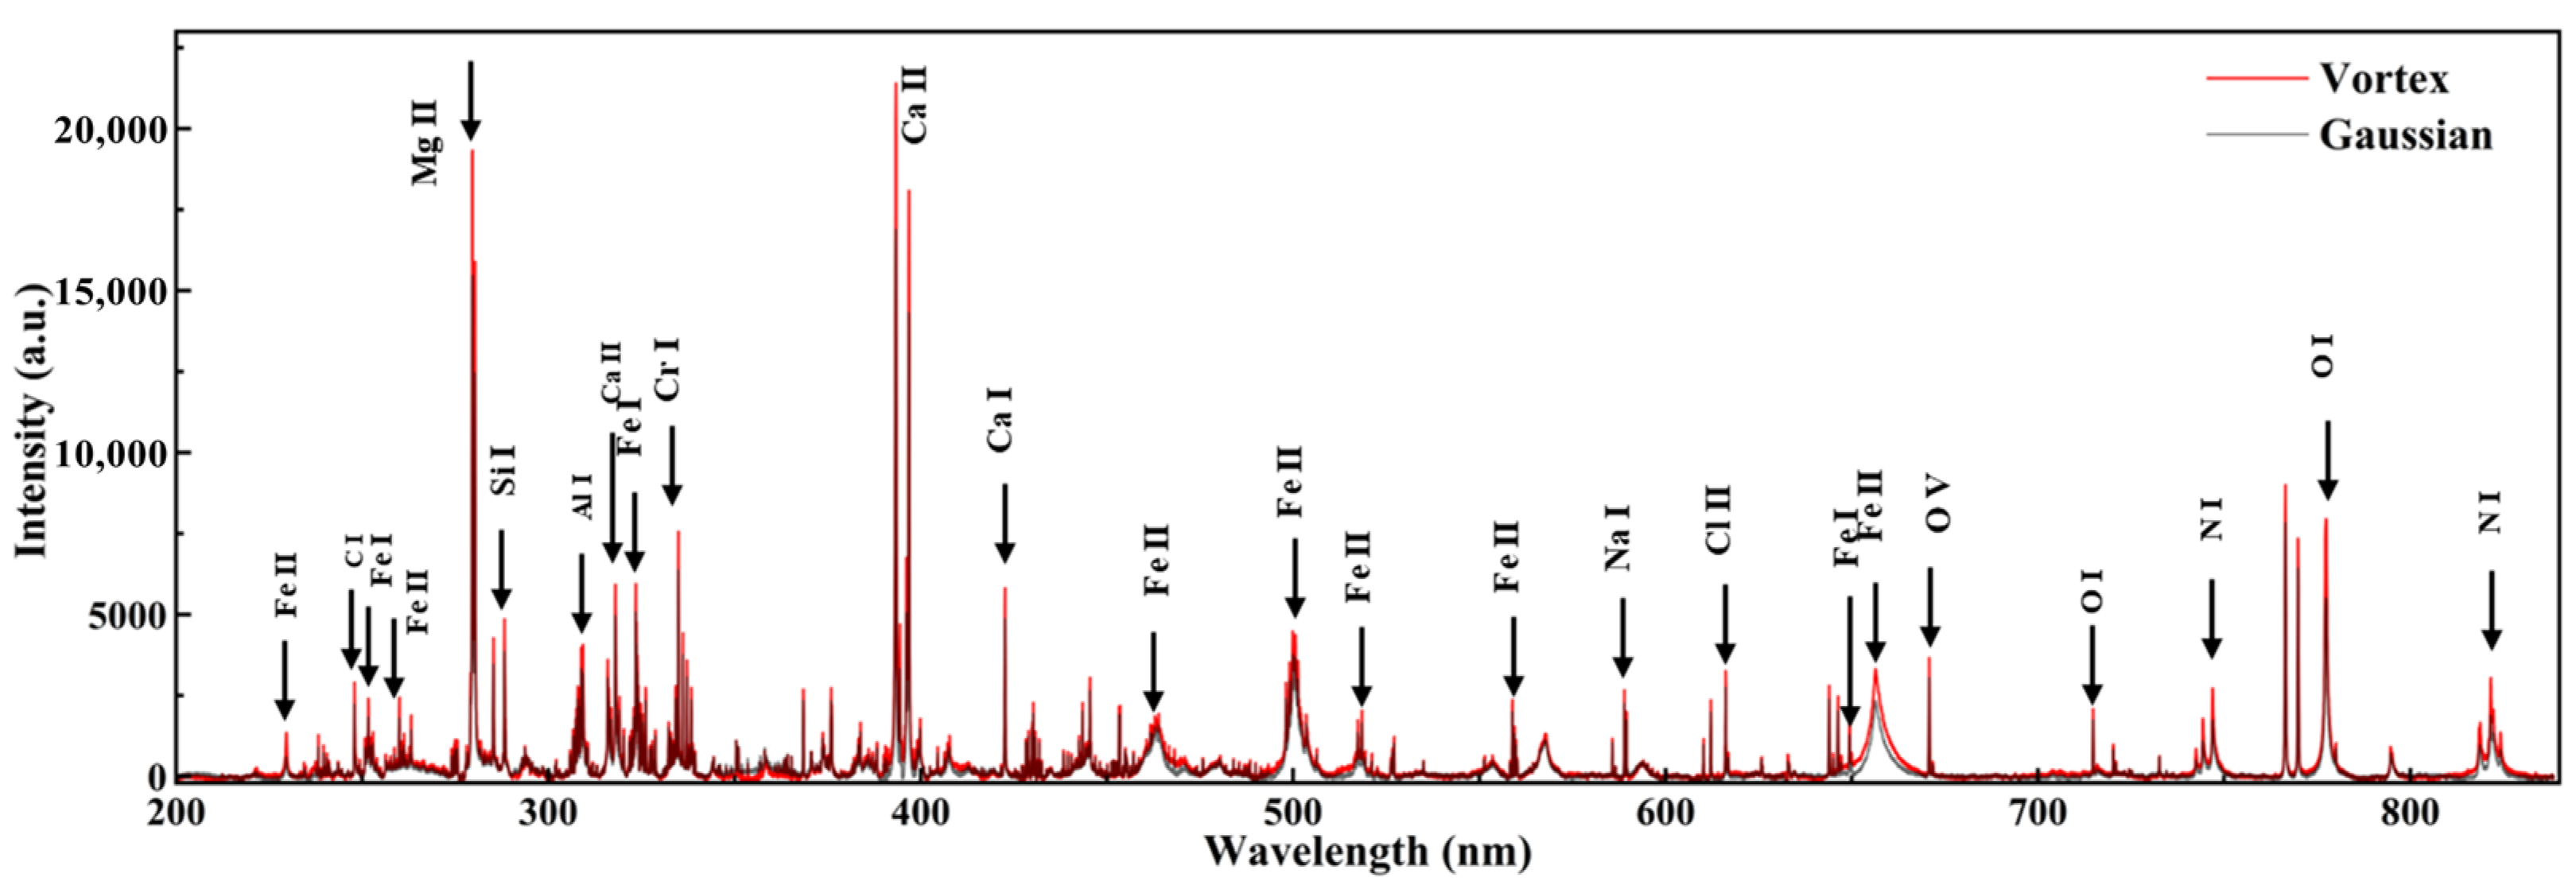
The LIBS spectra of lignite for both beam types were characterized under a 1 µs gate delay, optimal excitation energies (Gaussian: 50 mJ; vortex: 60 mJ), and optimal defocus positions (Gaussian: +1 mm after focus; vortex: −1 mm before focus). Spectral data were acquired using a two-step averaging procedure to ensure representative sampling and signal stability: at each of 100 distinct locations on the sample, 200 consecutive laser shots were averaged to suppress random fluctuations; each averaged spectrum was baseline-corrected, and the 100 spectra were then averaged. Figure 5 shows that, under these optimal conditions, vortex-beam-induced LIBS yielded higher line intensities than the Gaussian beam. We also measured spectra from three additional coal types; the results are consistent with those for lignite (Appendix A). The likely explanations are as follows:
(i) The doughnut-shaped (annular) intensity profile of the vortex beam forms an annular plasma channel. A central stagnation region can form as inward-propagating shocks converge on axis, increasing collisionality and thereby raising the local plasma temperature and electron density. The annular energy deposition promotes more uniform ablation over a larger area. The on-axis intensity null effectively suppresses excessive ablation at the focal center, which in turn reduces plasma shielding and self-absorption, thereby strengthening the intensity of the spectral emission lines [33,42]. (ii) When vortex optics generates laser plasma, the OAM exchanges energy with the plasma, regulating plasma motion, breaking through the limitations of rapid plasma diffusion and self-absorption in traditional LIBS, and improving the plasma detection limit.

3.3. Plasma Properties Comparison

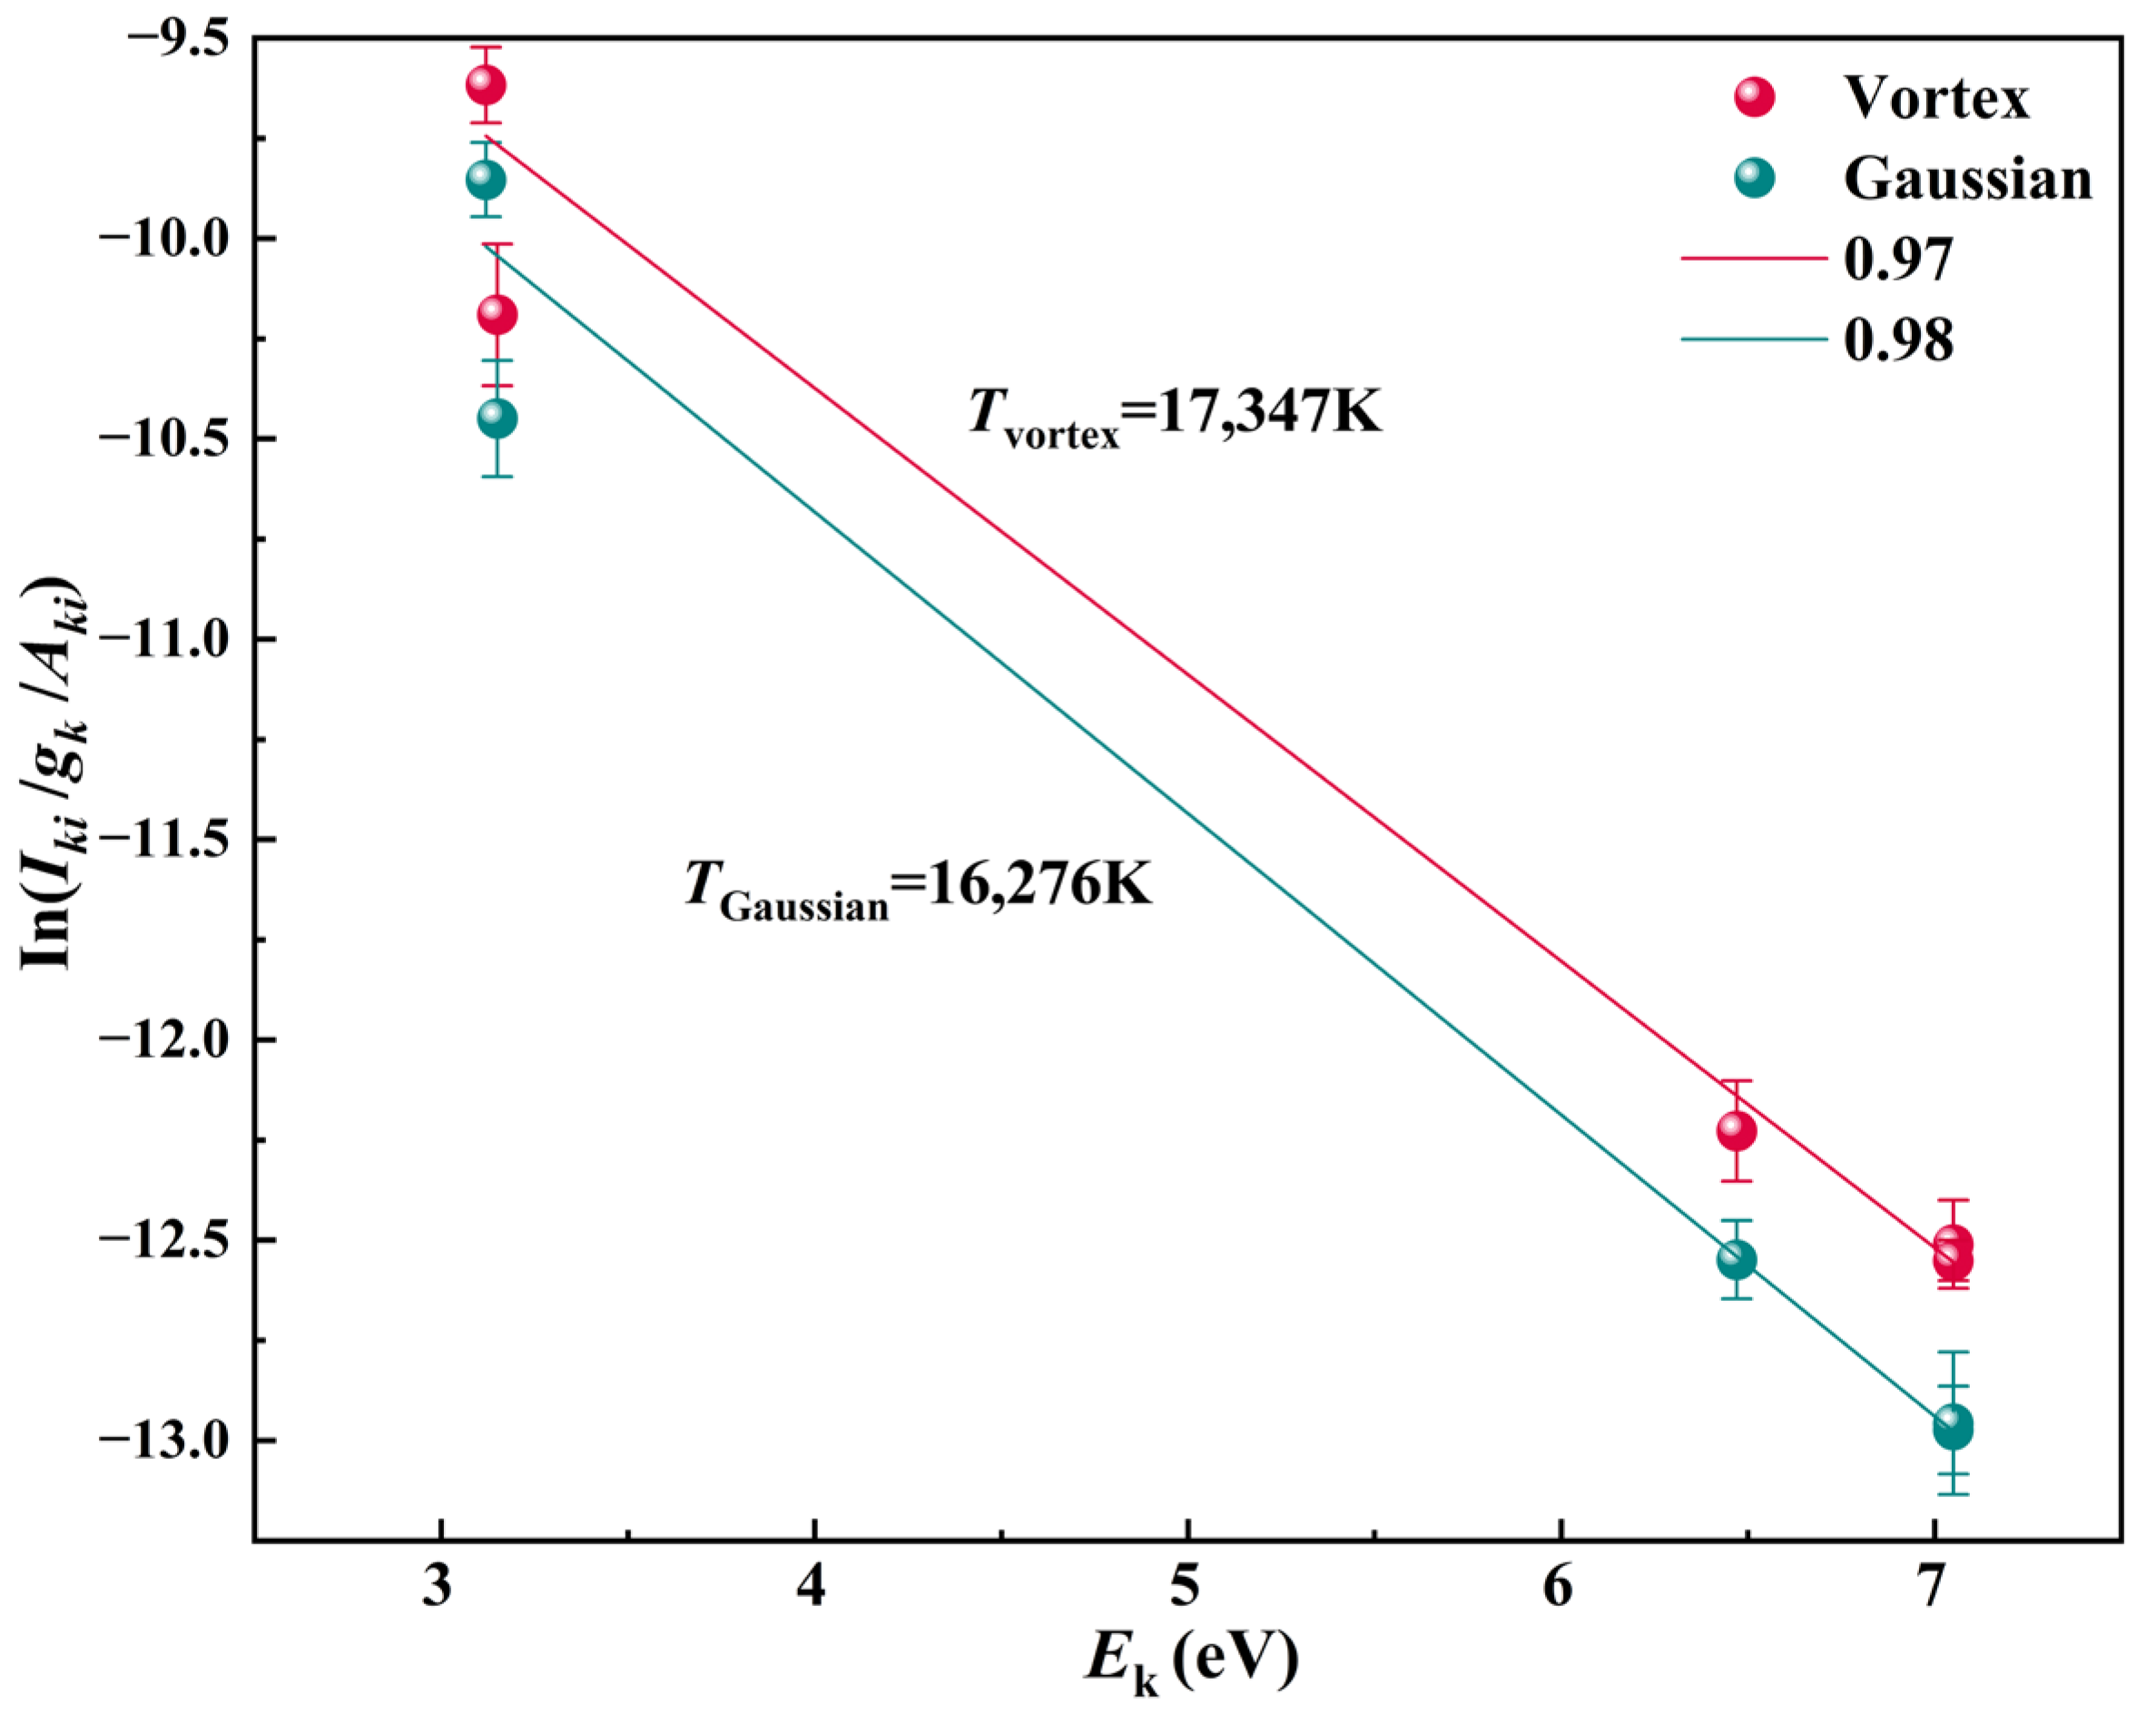
Plasma temperature and electron density are key parameters that directly influence LIBS detection performance. In this work, the average plasma temperature T and electron density Ne for vortex and Gaussian beam-induced LIBS were evaluated at a gate delay of 1 µs. Ionic Ca II lines at 316.89, 317.93, 373.69, 393.37, and 396.85 nm were used to determine T and Ne. Plasma temperature was obtained using the Boltzmann plot method, under the usual assumptions of local thermodynamic equilibrium and optically thin emission.
I n ( I k i λ k i g k A k i ) = E k K β T + I n N e ( T ) U ( T )
where Iki is the peak intensity, λki is the wavelength, Aki is the transition probability, gk is the statistical weight of level k, Ek is the energy of level k, Kβ is the Boltzmann constant, and T is the plasma temperature. Spectral parameters of gk, Aki, and Ek were obtained from the NIST database. Table 2 lists the selected Ca II lines and their parameters from the NIST ASD used to calculate the plasma temperature. Equation (1) can be written in linear form, y = mx + b, and the plasma temperature T is calculated from the slope of the line, with its expression as follows:
T = 1 K β m  
λ = 2 ω ( N e 10 16 )  
As shown in Figure 6, five spectral line values of Ca II ions in the same ionization state were calculated, and a straight line representing the relationship between the abscissa and ordinate was obtained through linear fitting. For vortex and Gaussian beam excitation, the coefficients of determination R2 were 0.97 and 0.98, corresponding to average plasma temperatures of 17,347 K and 16,276 K, respectively. The plasma electron density can be obtained from the Stark broadening of suitable spectral lines. According to Equation (3), the electron density Ne is proportional to the Stark width of the spectral line, where ∆λ is the full width at half-maximum of the spectral line. A Lorentz line-shape fitting was performed on the Ca II (396.85 nm) ion spectral line to extract its Stark broadening. Here, ω is the electron collision coefficient, which, for the Ca II (396.85 nm) ion spectral line, is 1.98 × 10⁻⁴ nm. The electron densities of Ca under the excitation of the two kinds of beams were calculated to be 7.53 × 1018 cm−3 and 7.48 × 1018 cm−3, respectively. Both the plasma temperature and electron density under vortex beam excitation were higher than those under the Gaussian beam. It should be noted that when calculating the plasma temperature and electron density, the plasma system needs to be in local thermodynamic equilibrium. The McWhorter criterion can prove that the plasma is in local thermal equilibrium [43], that is, Ne ≥ 1.6 × 10¹²T1/2(∆E)3, where ∆E is the maximum energy level difference. The critical electron density calculated by the McWhorter criterion is 6.42 × 10¹⁵, and the plasma electron density is 103 times the critical value in terms of magnitude, which meets the condition of local thermal equilibrium. These results suggest that vortex beam-induced LIBS couples energy more efficiently into the plasma, yielding stronger emission and offering advantages for complex matrix samples.

3.4. PCA-SVM Classification

To evaluate the impact of vortex and Gaussian beams on coal classification using LIBS, this study randomly selected 50 sets of spectral data (400 sets in total) from four coal samples under two excitation beams as the sample dataset. We trained classification models using Random Forest (RF) and PCA followed by an SVM (PCA-SVM). To ensure statistical reliability, stability, and reproducibility, we went beyond a single train–test split and adopted a multiple random experiment validation framework. Specifically, we conducted 20 independent trials. In each trial, (i) the dataset was split into training (70%) and test (30%) sets using a distinct random seed; (ii) 10-fold stratified cross-validation was performed on the training set to optimize model parameters and assess training stability; and (iii) final performance was evaluated on the held-out test set. This protocol demonstrates that any observed performance differences are not attributable to a single, fortuitous data split.
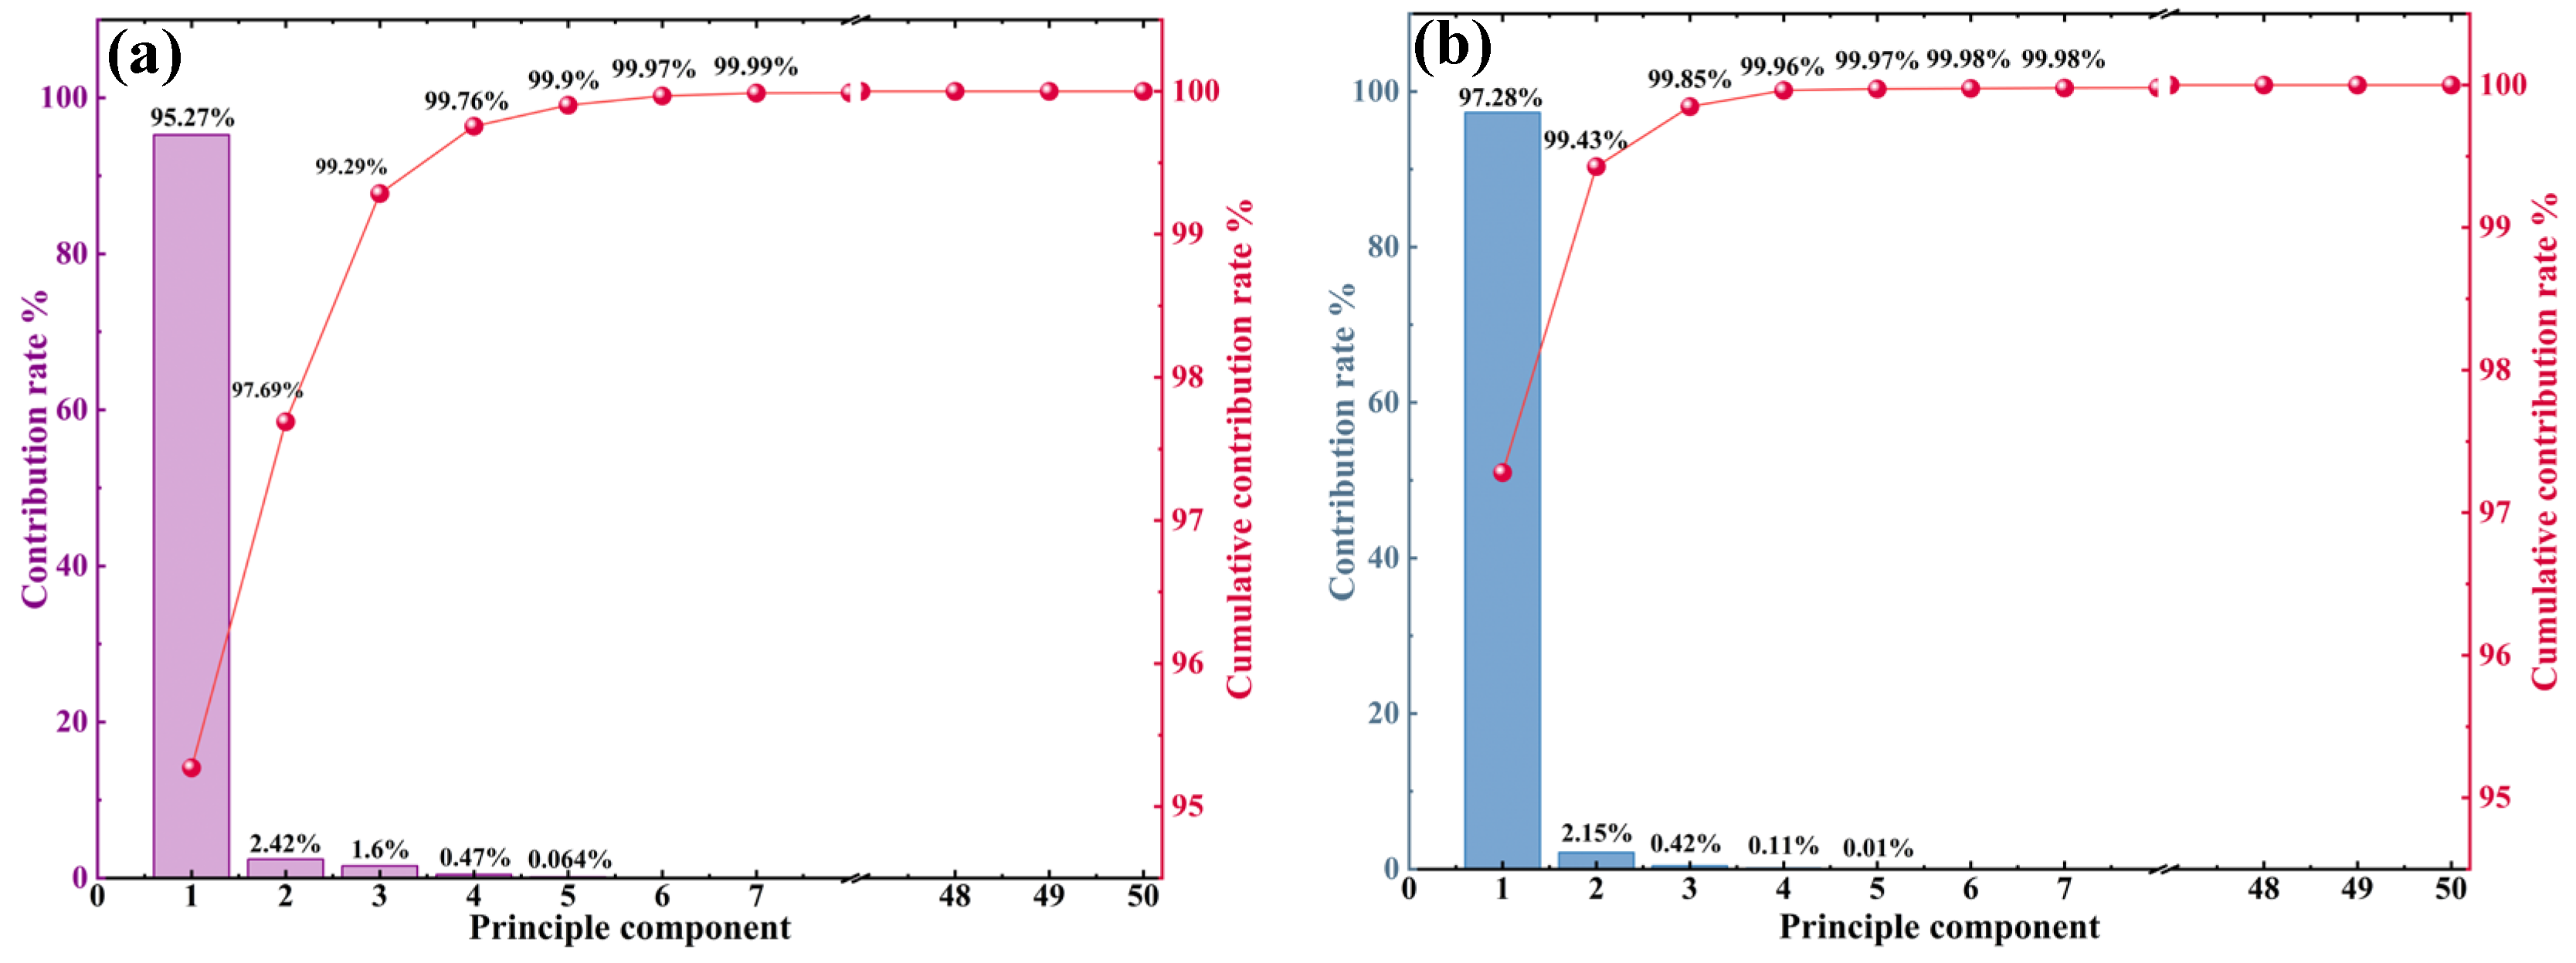
Figure 7 shows the explained variance ratio and cumulative explained variance across the first 50 principal components for the two excitation beams. For the vortex beam, the first three principal components explain 95.27%, 2.42%, and 1.60% of the variance (cumulative 99.26%); for the Gaussian beam, they explain 97.28%, 2.15%, and 0.42% (cumulative 99.85%). These results indicate that the first three PCs capture the vast majority of variance in the original spectra. Figure 8 shows a three-dimensional scatter plot of scores of the first three principal components, in which the four coal samples form clearly separated clusters. The vortex beam exhibited tighter clusters and better between-class separation, consistent with its stronger emission and more stable plasma observed earlier, which yielded more reproducible spectral fingerprints for PCA. These findings support that the 50 selected characteristic lines can effectively discriminate coal types.
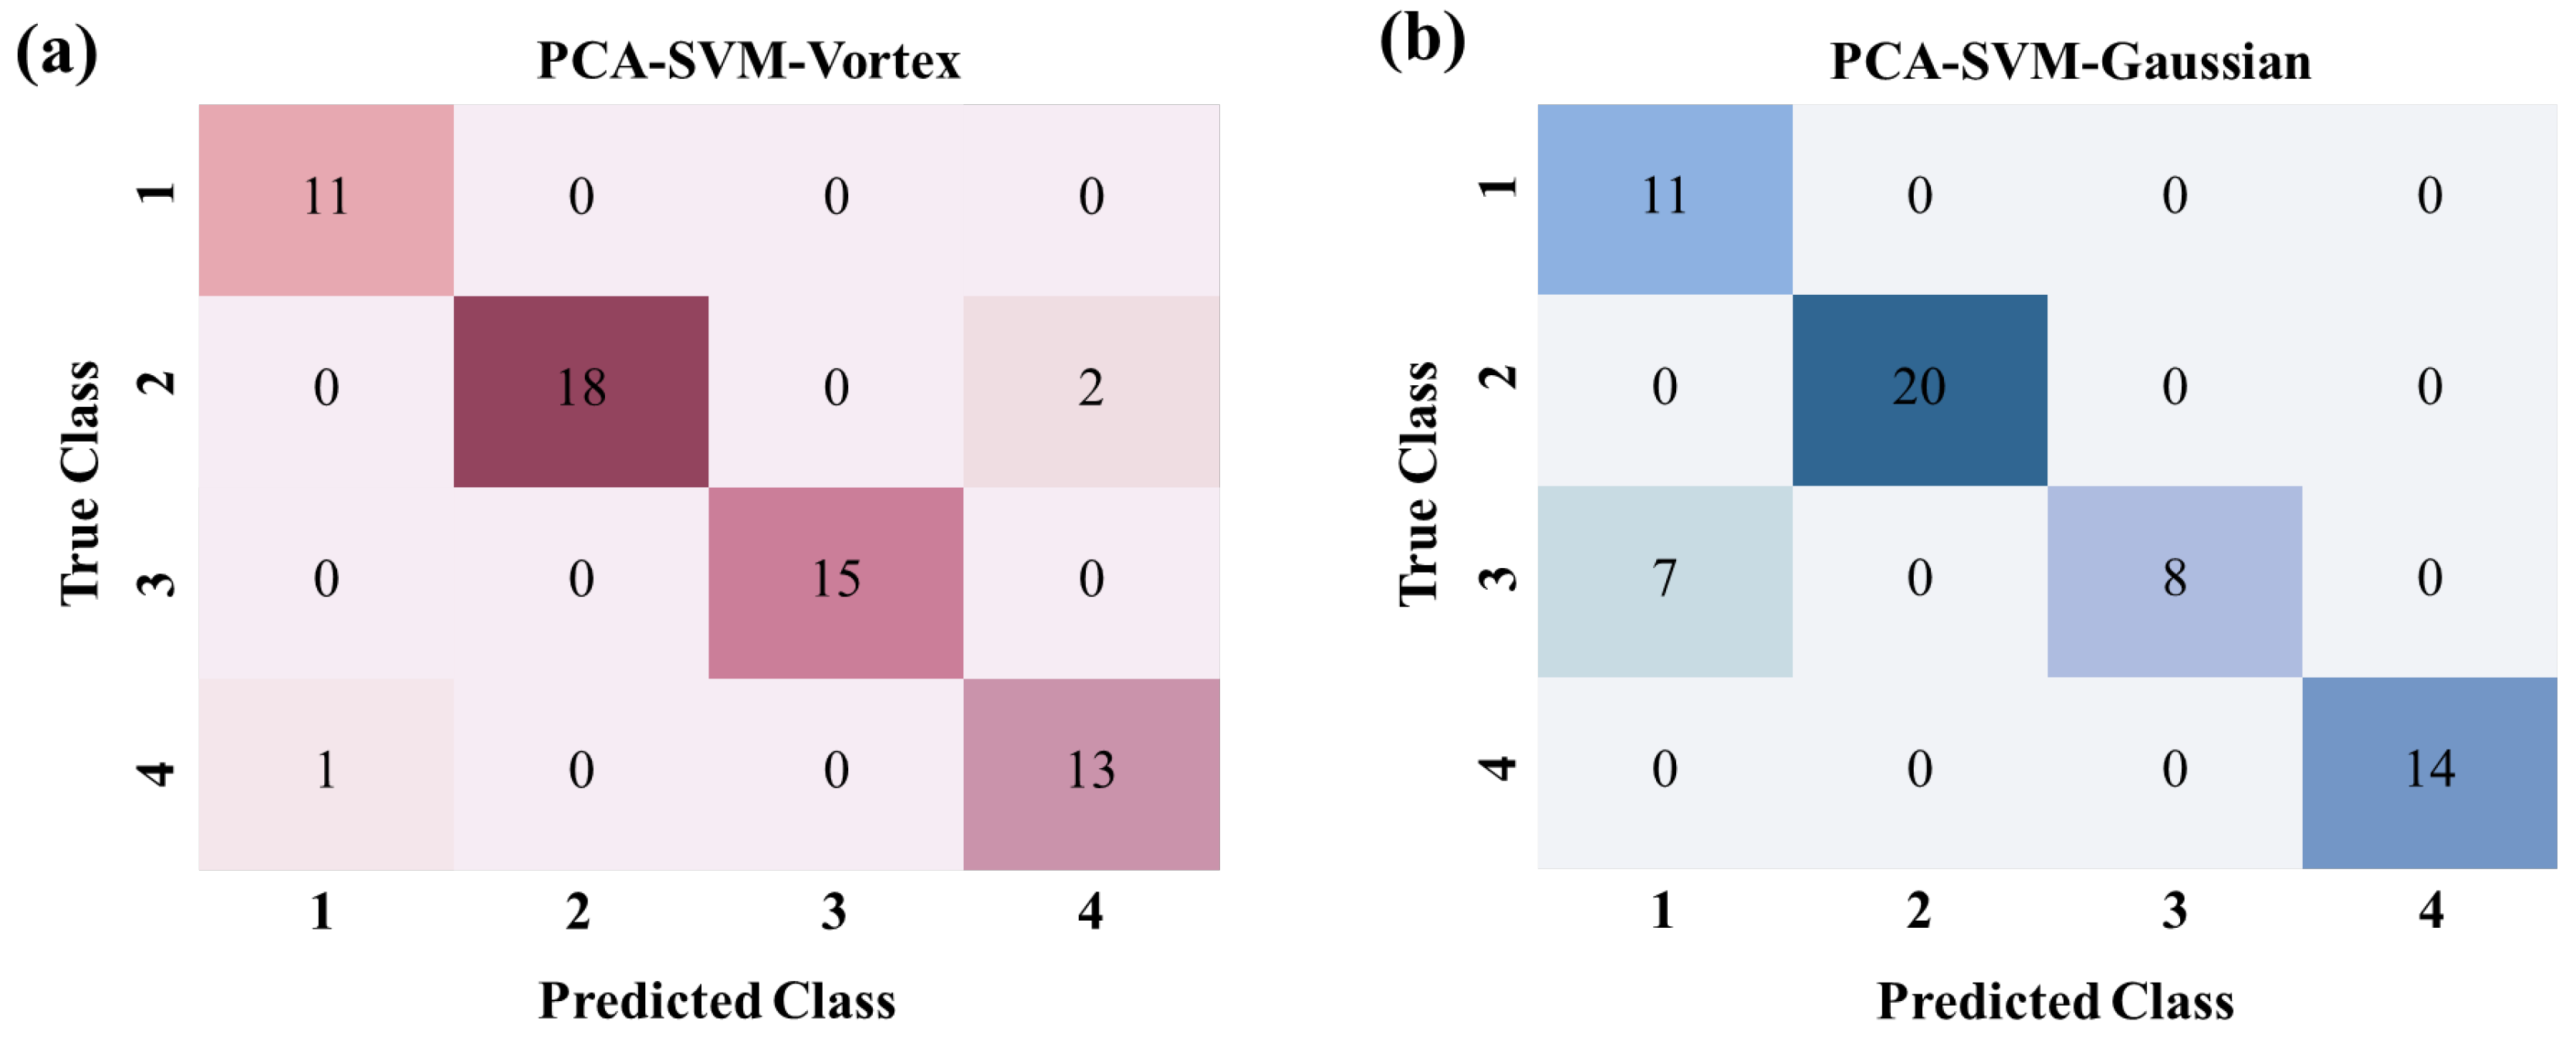
Using the 20-trial validation framework, both PCA-SVM and RF show a clear, consistent advantage under vortex beam excitation. Results are visualized in Figure 9 and Figure A3 (classification performance and confusion matrices), and class-wise metrics for the four coal types are reported in Table 3. Under the vortex beam, PCA-SVM achieved a mean test accuracy of 94.42% ± 2.82% across 20 trials (final independent test: 95.00%), and RF attained 94.00% ± 2.56% (final independent test: 98.00%). These accuracies are higher than those under the Gaussian beam (PCA-SVM: 86.67% ± 8.13%, final 88.00%; RF: 91.33% ± 3.65%, final 88.00%). The higher accuracy and lower variability (standard deviation) observed under vortex beam illumination support the robustness and generalizability of the enhancement.

4. Conclusions

In this work, an optical vortex-induced LIBS system was designed via phase modulation of the excitation laser. By optimizing the excitation energy and defocus distance, we systematically compared the plasma characteristics of LIBS induced by the two laser types. We found that the annular intensity profile and inherent OAM of the vortex beam enhanced ablation efficiency and increased electron impact collision rates while mitigating excessive energy concentration that leads to electron impact broadening and self-absorption. Consequently, the plasma temperature and electron density increased, improving LIBS detection and analysis for complex matrix samples. To our knowledge, RF and PCA-SVM classification models were implemented for the first time in vortex beam-induced LIBS, and this combination effectively improves classification accuracy for complex matrix samples. These results demonstrate that vortex beams have strong potential to enhance LIBS detection performance. Further studies employing time-resolved spectroscopic imaging will be valuable for directly elucidating OAM transfer mechanisms and plasma dynamics under vortex beam excitation.

Author Contributions

Conceptualization, B.A.; Software, Y.Z. and J.Y.; Validation, A.Y., J.Y. and P.A.; Investigation, Y.Z. and A.Y.; Writing—original draft, Y.Z.; Writing—review and editing, B.A. and M.X.; Funding acquisition, B.A. and M.X. All authors have read and agreed to the published version of the manuscript.

Funding

This research was funded by the Tianshan Talent Training Program of Xinjiang (Grant No. 2024TSYCCX0064), Xinjiang Autonomous Region Outstanding Youth Fund Project (Grant No. 2022D01E12), and the National Natural Science Foundation of China (Grant Nos. 12274418, 12264049).

Institutional Review Board Statement

Not applicable.

Informed Consent Statement

Not applicable.

Data Availability Statement

The raw data supporting the conclusions of this article will be made available by the authors upon request.

Conflicts of Interest

The authors declare no conflicts of interest.

Appendix A

For lignite under Gaussian beam-induced LIBS, Figure A1 shows the dependence of spectral emission intensity on the detector gate delay. As the delay increases from 0 to 5 µs, the emission intensity rises to a maximum and then decreases. The characteristic line intensity peaks at a delay of 1 µs, consistent with the vortex beam-induced LIBS results reported above. This indicates that, for lignite, Gaussian beam-induced LIBS achieves optimal emission at a gate delay of 1 µs relative to the laser pulse.
Figure A1. Dependence of spectral emission intensity on detector gate delay for lignite under Gaussian beam-induced LIBS.
Applsci 15 11590 g0a1
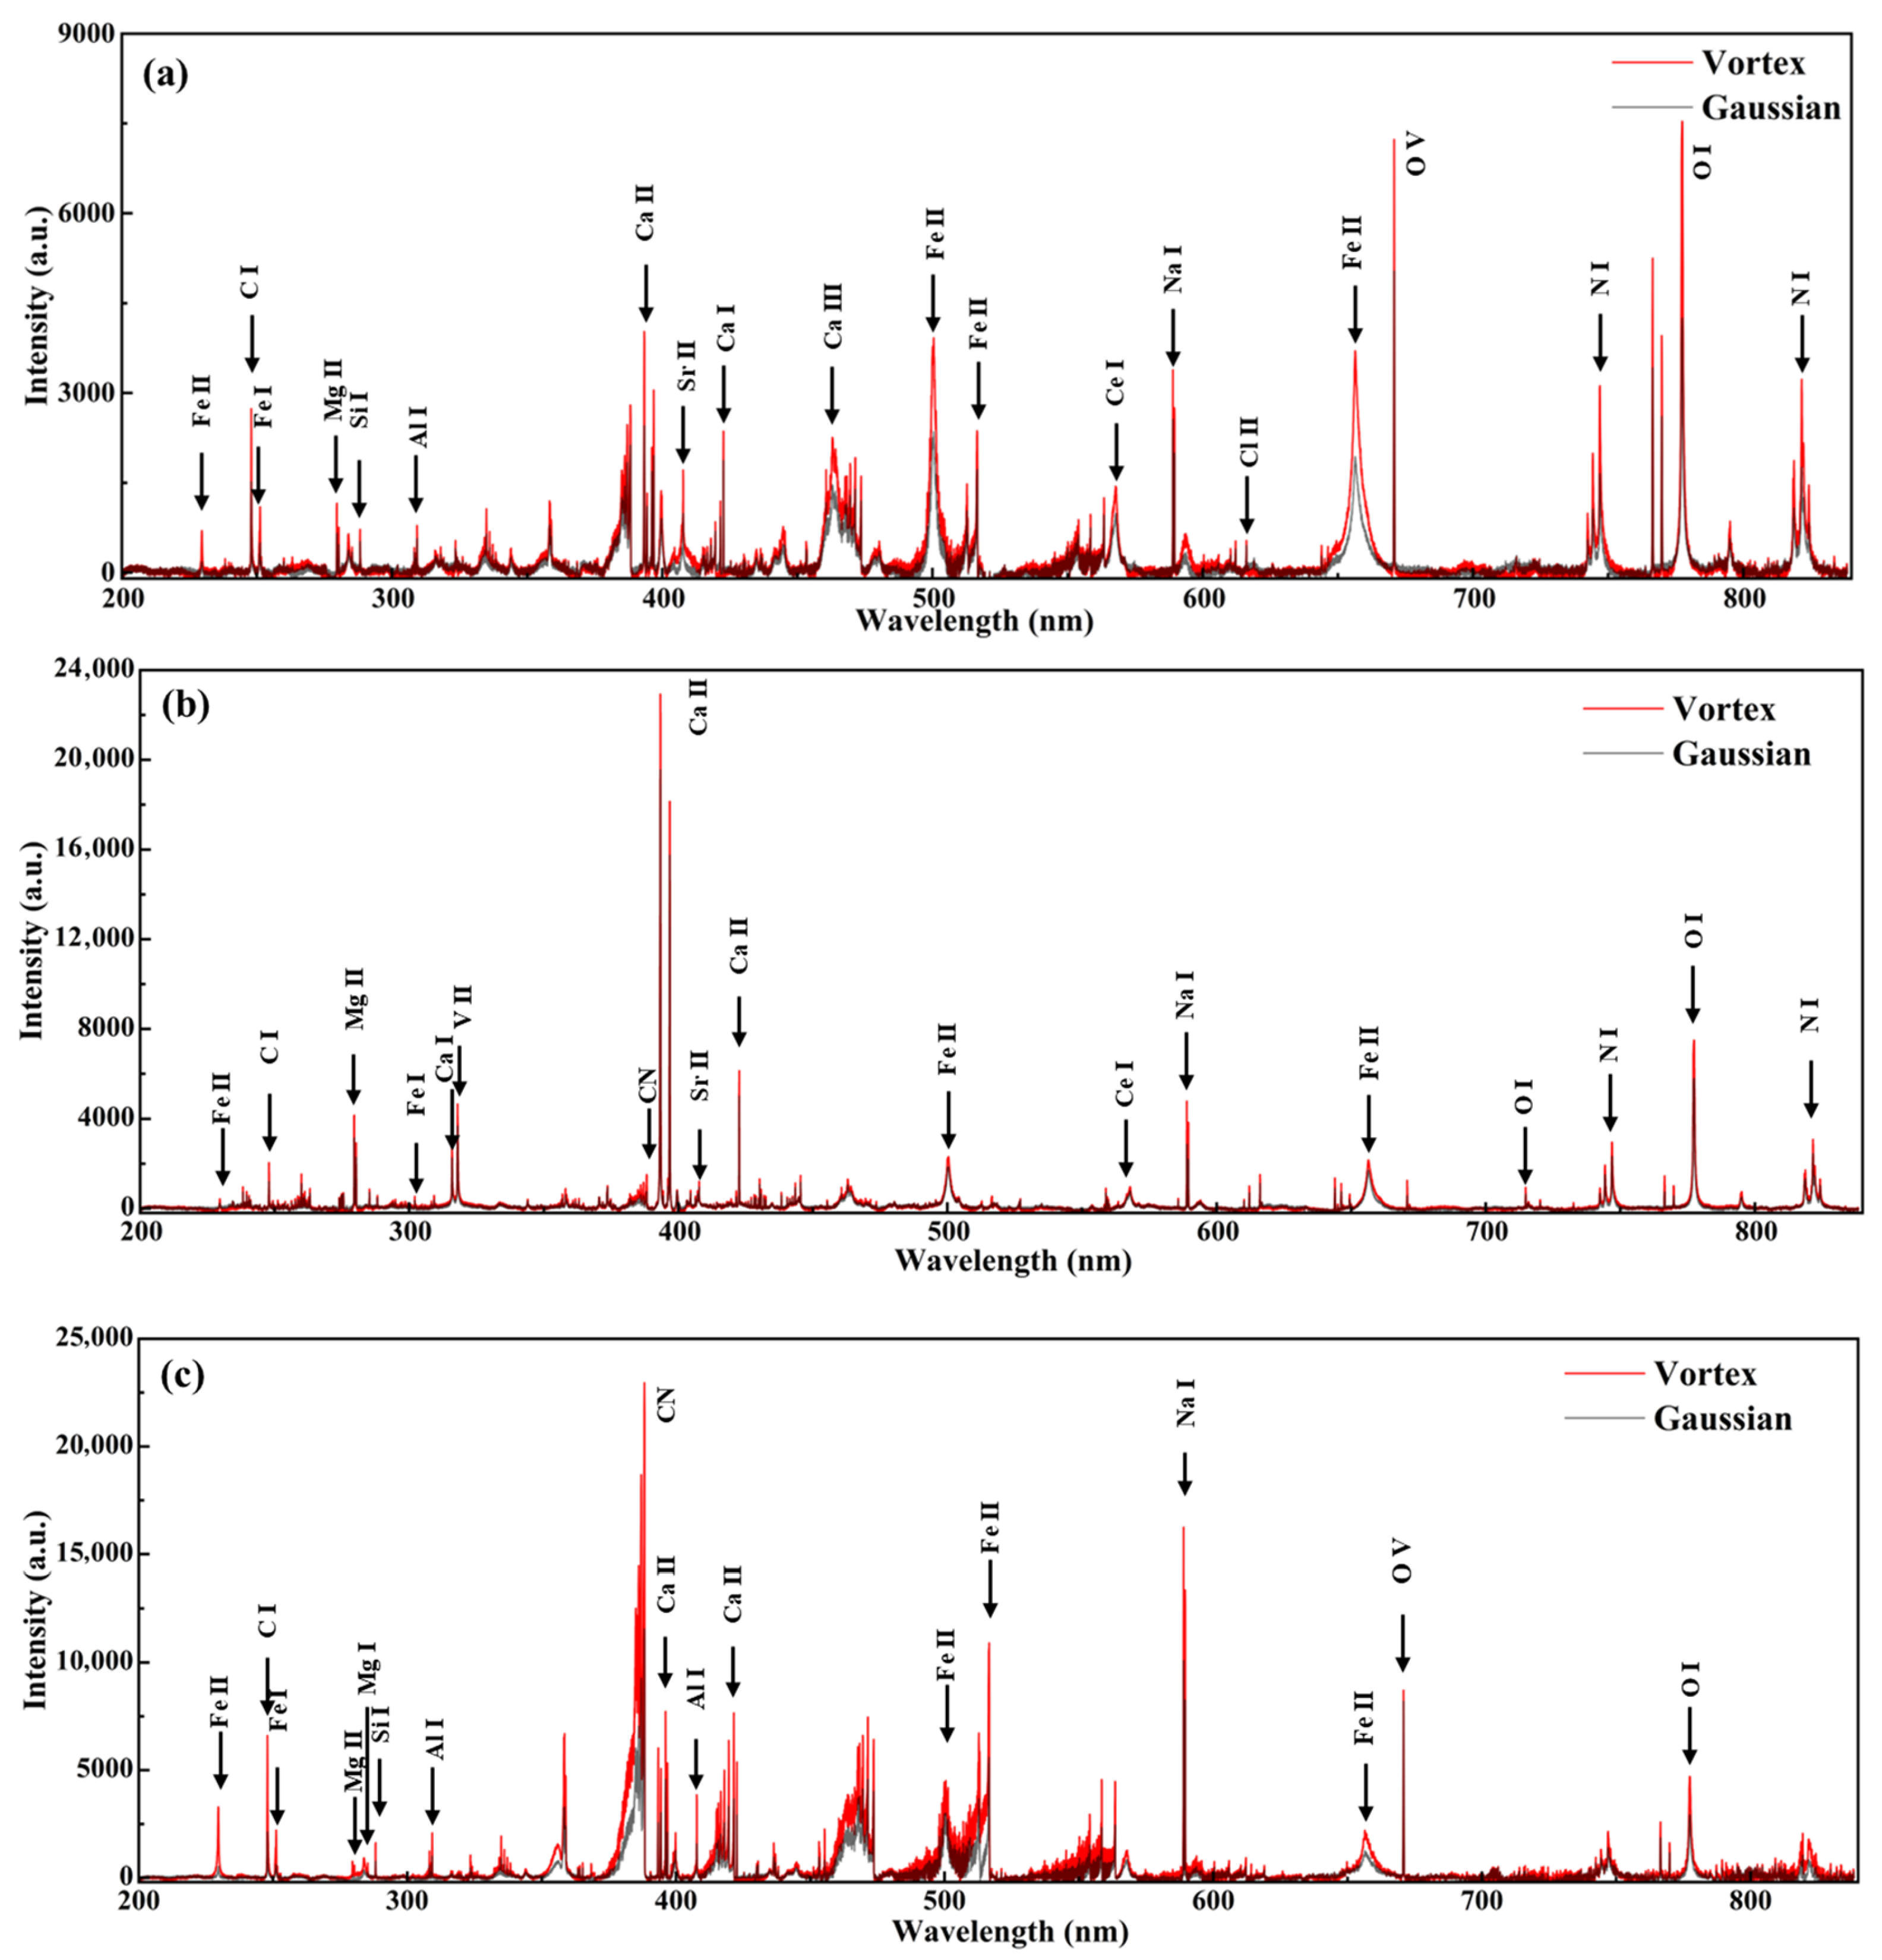
Figure A2a–c present characteristic spectra for three representative coal types under Gaussian and vortex beam-induced LIBS. As shown, the vortex beam yields higher spectral emission intensities than the Gaussian beam in each panel; this enhancement is consistent across all four coal types examined.
Figure A2. Plasma emission spectra of coal samples under Gaussian and vortex beam-induced LIBS: (a) high-sulfur coal; (b) long-flame coal; (c) anthracite.
Applsci 15 11590 g0a2
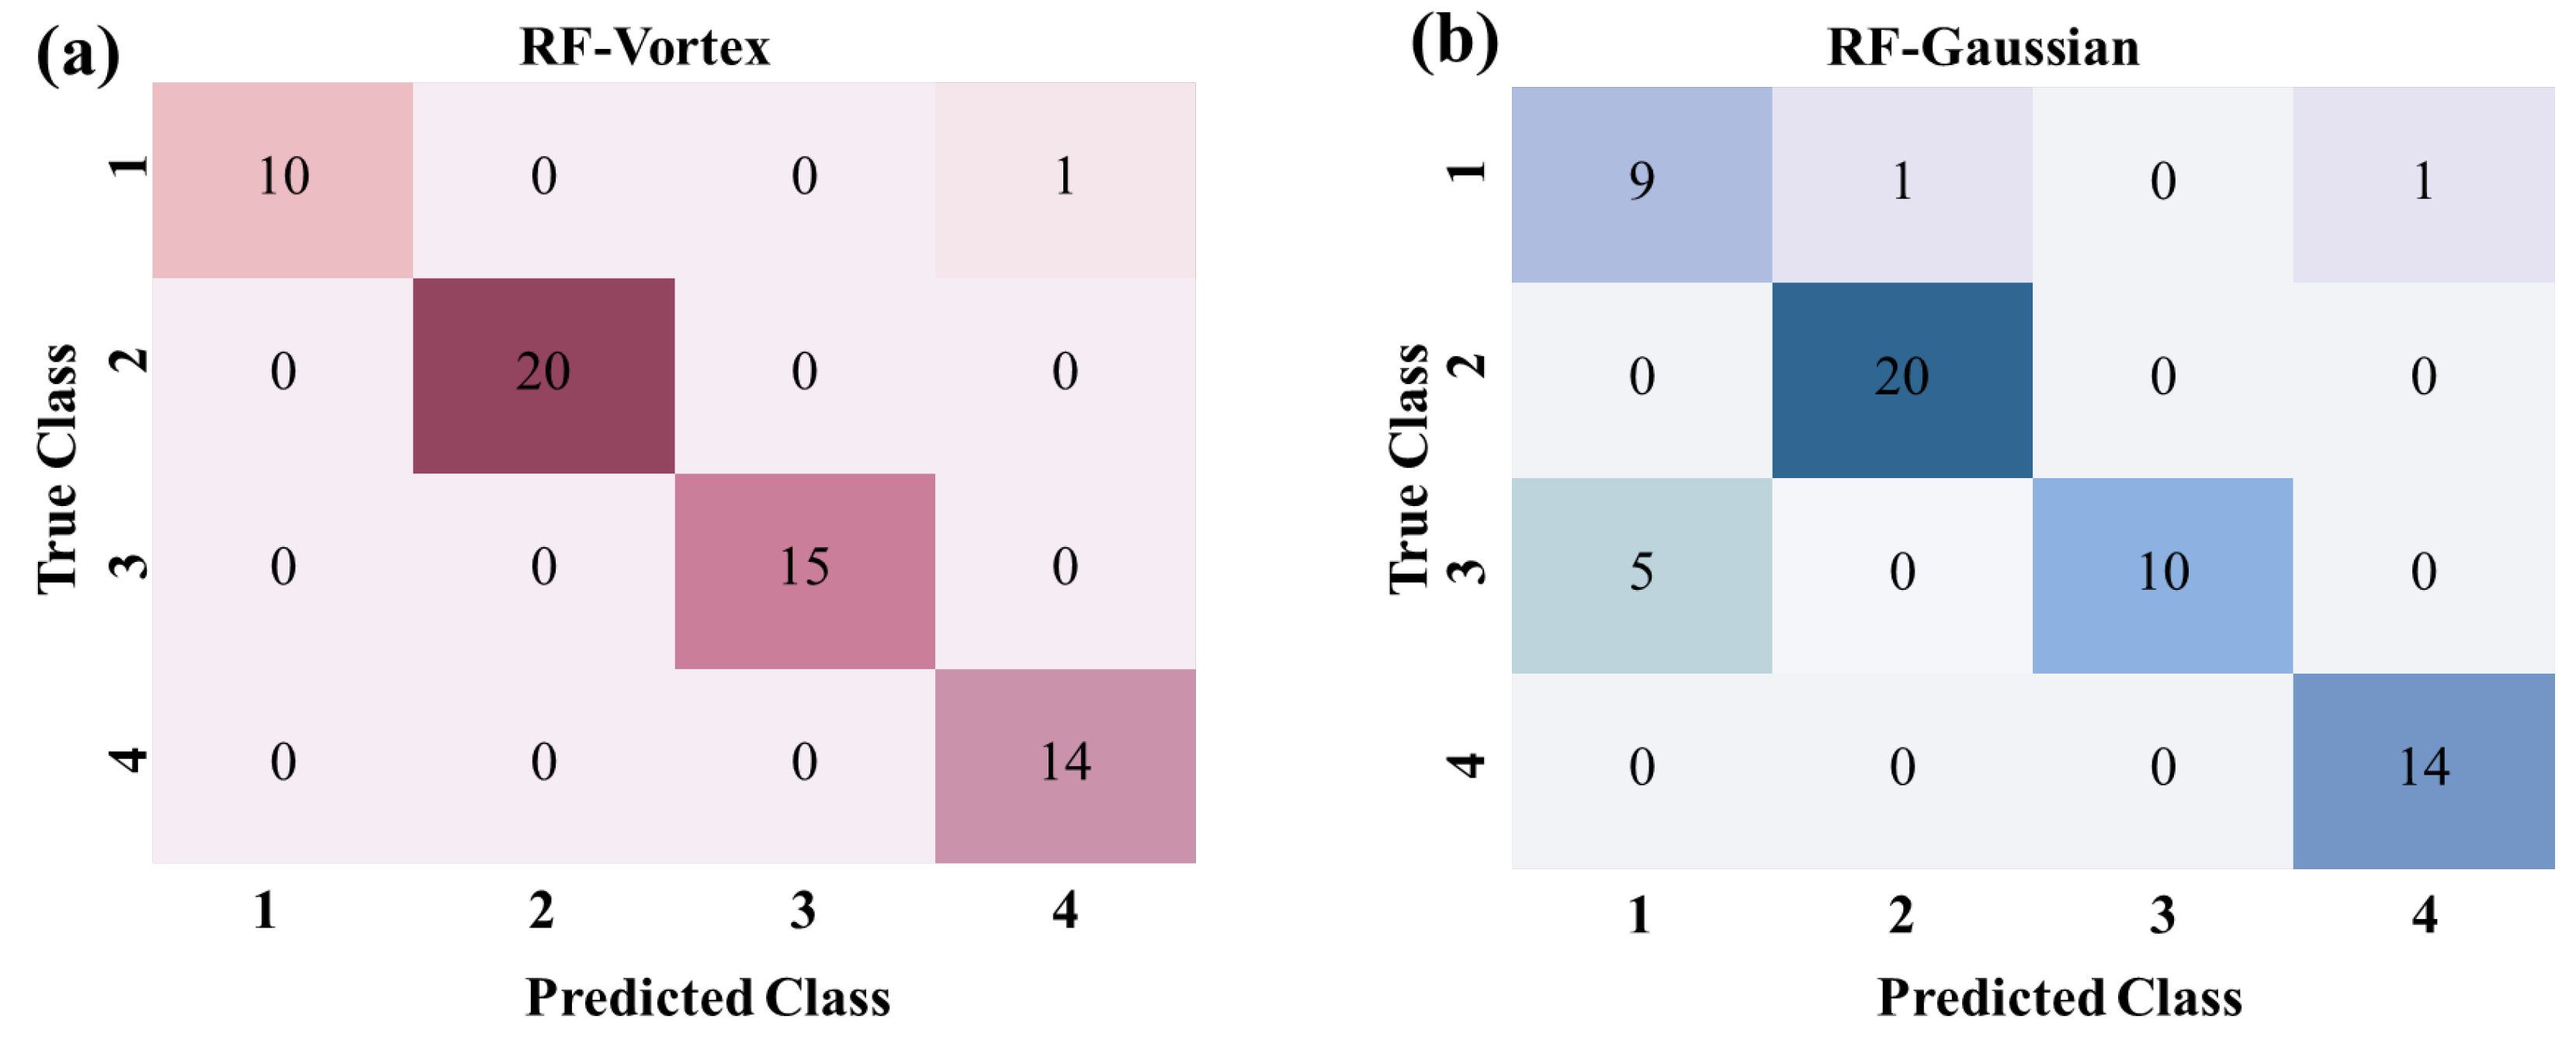
Figure A3 shows confusion matrices for the RF-based coal classification. The overall accuracies were 98% under vortex beam excitation and 88% under the Gaussian beam. Compared to the Gaussian beam, vortex beam-induced LIBS combined with the RF model achieved higher classification accuracy. Class-wise recall, precision, and F1-scores for the four coal types are reported in Table 3. A comparison of the results in Table 3 shows that the vortex beam excitation consistently yielded higher accuracy, recall, and F1-scores than the Gaussian beam, indicating that the vortex beam-induced LIBS coupled with RF enhances coal-type classification. These results further support the advantage of vortex beams in improving classification performance for complex samples (e.g., coal, soil).
Figure A3. Confusion matrix of the RF classification model combined with vortex (a) and Gaussian (b) beam-induced LIBS.
Applsci 15 11590 g0a3

References

  1. Song, W.; Hou, Z.; Gu, W.; Afgan, M.S.; Cui, J.; Wang, H.; Wang, Y.; Wang, Z. Incorporating Domain Knowledge into Machine Learning for Laser-Induced Breakdown Spectroscopy Quantification. Spectrochim. Acta Part B At. Spectrosc. 2022, 195, 106490. [Google Scholar] [CrossRef]
  2. Sun, L.; Yu, H.; Cong, Z.; Lu, H.; Cao, B.; Zeng, P.; Dong, W.; Li, Y. Applications of Laser-Induced Breakdown Spectroscopy in the Aluminum Electrolysis Industry. Spectrochim. Acta Part B At. Spectrosc. 2018, 142, 29–36. [Google Scholar] [CrossRef]
  3. Peter, L.; Sturm, V.; Noll, R. Liquid Steel Analysis with Laser-Induced Breakdown Spectrometry in the Vacuum Ultraviolet. Appl. Spectrosc. 2003, 57, 619–624. [Google Scholar] [CrossRef]
  4. Fiddler, M.N.; Begashaw, I.; Mickens, M.A.; Collingwood, M.S.; Assefa, Z.; Bililign, S. Laser Spectroscopy for Atmospheric and Environmental Sensing. Sensors 2009, 9, 10447–10512. [Google Scholar] [CrossRef]
  5. Chen, Z.; Li, H.; Zhao, F.; Li, R. Ultra-Sensitive Trace Metal Analysis of Water by Laser-Induced Breakdown Spectroscopy after Electrical-Deposition of the Analytes on an Aluminium Surface. J. Anal. At. Spectrom. 2008, 23, 871–875. [Google Scholar] [CrossRef]
  6. Chu, Y.; Chen, F.; Sheng, Z.; Zhang, D.; Zhang, S.; Wang, W.; Jin, H.; Qi, J.; Guo, L. Blood Cancer Diagnosis Using Ensemble Learning Based on a Random Subspace Method in Laser-Induced Breakdown Spectroscopy. Biomed. Opt. Express 2020, 11, 4191–4202. [Google Scholar] [CrossRef]
  7. Wei, H.; Zhao, Z.; Lin, Q.; Duan, Y. Study on the Molecular Mechanisms against Human Breast Cancer from Insight of Elemental Distribution in Tissue Based on Laser-Induced Breakdown Spectroscopy (LIBS). Biol. Trace Elem. Res. 2021, 199, 1686–1692. [Google Scholar] [CrossRef] [PubMed]
  8. Guo, L.; Zhang, D.; Sun, L.; Yao, S.; Zhang, L.; Wang, Z.; Ding, H.; Lu, Y.; Hou, Z.; Wang, Z. Development in the Application of Laser-Induced Breakdown Spectroscopy in Recent Years: A Review. Front. Phys. 2021, 16, 22500. [Google Scholar] [CrossRef]
  9. Feng, J.; Wang, Z.; Li, Z.; Ni, W. Study to Reduce Laser-Induced Breakdown Spectroscopy Measurement Uncertainty Using Plasma Characteristic Parameters. Spectrochim. Acta Part B At. Spectrosc. 2010, 65, 549–556. [Google Scholar] [CrossRef]
  10. Gu, W.; Hou, Z.; Song, W.; Li, L.; Yu, X.; Liu, J.; Song, Y.; Afgan, M.S.; Li, Z.; Liu, Z.; et al. Compensation for the Variation of Total Number Density to Improve Signal Repeatability for Laser-Induced Breakdown Spectroscopy. Anal. Chim. Acta 2022, 1205, 339752. [Google Scholar] [CrossRef]
  11. Li, A.; Chai, S.; Peng, H.; Zhao, Z.; Ren, J.; Wu, W. Laser-Induced Breakdown Spectroscopy Using 2D Structured Light: A Case of Spectral Signal Enhancement on Metal Samples. Anal. Chem. 2025, 97, 3253–3262. [Google Scholar] [CrossRef]
  12. De Giacomo, A.; Dell’Aglio, M.; Bruno, D.; Gaudiuso, R.; De Pascale, O. Experimental and Theoretical Comparison of Single-Pulse and Double Pulse Laser Induced Breakdown Spectroscopy on Metallic Samples. Spectrochim. Acta Part B At. Spectrosc. 2008, 63, 805–816. [Google Scholar] [CrossRef]
  13. Hedwig, R.; Lie, T.; Tjia, M.; Kagawa, K.; Kurniawan, H. Confinement effect in enhancing shock wave plasma generation at low pressure by TEA CO2 laser bombardment on quartz sample. Spectrochim. Acta B At. Spectrosc. 2003, 58, 531–542. [Google Scholar] [CrossRef]
  14. Popov, A.M.; Colao, F.; Fantoni, R. Enhancement of LIBS Signal by Spatially Confining the Laser-Induced Plasma. J. Anal. At. Spectrom. 2009, 24, 602–604. [Google Scholar] [CrossRef]
  15. Ye, Z.; Ke, W.; Wang, W.; Yuan, H.; Wang, X.; Wang, X.; Liu, D.; Yang, A.; Rong, M. Enhancement by Spark Discharge in LIBS Detection of Copper Particle Contamination in Oil-Immersed Transformer. IEEE Trans. Dielectr. Electr. Insul. 2022, 29, 2034–2041. [Google Scholar] [CrossRef]
  16. Khan, M.; Haq, S.; Abbas, Q.; Nadeem, A. Improvement in signal sensitivity and repeatability using copper nanoparticle-enhanced laser-induced breakdown spectroscopy. Spectrochim. Acta Part B At. Spectrosc. 2022, 195, 106507. [Google Scholar] [CrossRef]
  17. Wu, D.; Sun, L.; Hai, R.; Liu, J.; Hao, Y.; Yu, X.; Li, C.; Feng, C.; Liu, P.; Ding, H. Influence of Transverse Magnetic Field on Plume Dynamics and Optical Emission of Nanosecond Laser Produced Tungsten Plasma in Vacuum. Spectrochim. Acta Part B At. Spectrosc. 2020, 169, 105882. [Google Scholar] [CrossRef]
  18. Liu, J.; Song, W.; Gu, W.; Hou, Z.; Kou, K.; Wang, Z. Long-Term Repeatability Improvement Using Beam Intensity Distribution for Laser-Induced Breakdown Spectroscopy. Anal. Chim. Acta 2023, 1251, 341004. [Google Scholar] [CrossRef]
  19. Jia, J.; Fu, H.; Hou, Z.; Wang, H.; Wang, Z.; Dong, F.; Ni, Z.; Zhang, Z. Effect of Laser Beam Shaping on the Determination of Manganese and Chromium Elements in Steel Samples Using Laser-Induced Breakdown Spectroscopy. Spectrochim. Acta Part B At. Spectrosc. 2020, 163, 105747. [Google Scholar] [CrossRef]
  20. Ji, J.; Song, W.; Hou, Z.; Li, L.; Yu, X.; Wang, Z. Raw Signal Improvement Using Beam Shaping Plasma Modulation for Uranium Detection in Ore Using Laser-Induced Breakdown Spectroscopy. Anal. Chim. Acta. 2022, 1235, 340551. [Google Scholar] [CrossRef]
  21. Chen, G.; Zheng, P.; Wang, J.; Li, B.; Liu, X.; Yang, Z.; Sun, Z.; Tian, H.; Dong, D.; Guo, L. Quantitative Analysis Improvement of Laser-Induced Breakdown Spectroscopy Based a Newly Beam Shaping Method. Talanta 2025, 292, 127993. [Google Scholar] [CrossRef]
  22. Yan, W.; Lv, J.; Zhu, C.; Li, Q.; Chen, J.; Kang, L.; Lu, B.; Li, X. Classification of Uneven Steel Samples by Laser-Induced Breakdown Spectroscopy Based on a Bessel Beam. J. Anal. At. Spectrom. 2023, 38, 1232–1237. [Google Scholar] [CrossRef]
  23. Hai, R.; Sun, L.; Wu, D.; He, Z.; Sattar, H.; Liu, J.; Tong, W.; Li, C.; Feng, C.; Ding, H. Enhanced Laser-Induced Breakdown Spectroscopy Using the Combination of Circular and Annular Laser Pulses. J. Anal. At. Spectrom. 2019, 34, 1982–1987. [Google Scholar] [CrossRef]
  24. Delaney, B.; Hayden, P.; Kelly, T.; Kennedy, E.; Costello, J. Laser Induced Breakdown Spectroscopy with Annular Plasmas in Vacuo: Stagnation and Limits of Detection. Spectrochim. Acta Part B At. Spectrosc. 2022, 193, 106430. [Google Scholar] [CrossRef]
  25. Allen, L.; Beijersbergen, M.W.; Spreeuw, R.; Woerdman, J. Orbital Angular Momentum of Light and the Transformation of Laguerre-Gaussian Laser Modes. Phys. Rev. A 1992, 45, 8185–8189. [Google Scholar] [CrossRef]
  26. Yao, A.M.; Padgett, M.J. Orbital Angular Momentum: Origins, Behavior and Applications. Adv. Opt. Photonics 2011, 3, 161–204. [Google Scholar] [CrossRef]
  27. Fang, J.; Li, J.; Kong, A.; Xie, Y.; Lin, C.; Xie, Z.; Lei, T.; Yuan, X. Optical Orbital Angular Momentum Multiplexing Communication via Inversely Designed Multiphase Plane Light Conversion. Photonics Res. 2022, 10, 2015–2023. [Google Scholar] [CrossRef]
  28. Ng, J.; Lin, Z.; Chan, C. Theory of Optical Trapping by an Optical Vortex Beam. Phys. Rev. Lett. 2010, 104, 103601. [Google Scholar] [CrossRef]
  29. Omatsu, T.; Miyamoto, K.; Toyoda, K.; Morita, R.; Arita, Y.; Dholakia, K. Twisted Materials: A New Twist for Materials Science: The Formation of Chiral Structures Using the Angular Momentum of Light. Adv. Opt. Mater. 2019, 7, 1970052. [Google Scholar] [CrossRef]
  30. Ni, J.; Wang, C.; Zhang, C.; Hu, Y.; Yang, L.; Lao, Z.; Xu, B.; Li, J.; Wu, D.; Chu, J. Three-Dimensional Chiral Microstructures Fabricated by Structured Optical Vortices in Isotropic Material. Light Sci. Appl. 2017, 6, e17011. [Google Scholar] [CrossRef]
  31. Bretschneider, S.; Eggeling, C.; Hell, S.W. Breaking the Diffraction Barrier in Fluorescence Microscopy by Optical Shelving. Phys. Rev. Lett. 2007, 98, 218103. [Google Scholar] [CrossRef]
  32. Shen, Y.; Wang, X.; Xie, Z.; Min, C.; Fu, X.; Liu, Q.; Gong, M.; Yuan, X. Optical Vortices 30 Years on: OAM Manipulation from Topological Charge to Multiple Singularities. Light Sci. Appl. 2019, 8, 90. [Google Scholar] [CrossRef] [PubMed]
  33. Wang, Q.; Dang, W.; Jiang, Y.; Chen, A.; Jin, M. Emission Enhancement of Femtosecond Laser-Induced Breakdown Spectroscopy Using Vortex Beam. J. Phys. B At. Mol. Opt. Phys. 2022, 55, 095402. [Google Scholar] [CrossRef]
  34. Bao, M.; Zhao, Z.; Wei, K.; Zheng, Y.; Lu, B.; Xu, X.; Luo, T.; Teng, G.; Yong, J.; Wang, Q. Modulate the Laser Phase to Improve the ns-LIBS Spectrum Signal Based on Orbital Angular Momentum. Opt. Express 2024, 32, 4998–5010. [Google Scholar] [CrossRef] [PubMed]
  35. Fu, Y.; Lin, C.; Sun, D.; Han, W.; Chang, J.; Ma, X.; Su, M. Effect of Vortex Beam Shaping on Determination of Trace Elements in Al Alloy by Double Pulse Laser-Induced Breakdown Spectroscopy. Plasma Sci. Technol. 2025, 27, 095503. [Google Scholar] [CrossRef]
  36. Vieira, J.; Mendonca, J. Nonlinear Laser Driven Donut Wake Fields for Positron and Electron Acceleration. Phys. Rev. Lett. 2014, 112, 215001. [Google Scholar] [CrossRef]
  37. Brabetz, C.; Eisenbarth, U.; Kester, O.; Stoehlker, T.; Cowan, T.; Zielbauer, B.; Bagnoud, V. Hollow Beam Creation with Continuous Diffractive Phase Mask at PHELIX. In CLEO: Science and Innovations; Optica Publishing Group: Washington, DC, USA, 2012; p. JTu1K.5. [Google Scholar] [CrossRef]
  38. Busold, S.; Almomani, A.; Bagnoud, V.; Barth, W.; Bedacht, S.; Blažević, A.; Boine-Frankenheim, O.; Brabetz, C.; Burris-Mog, T.; Cowan, T.; et al. Shaping Laser Accelerated Ions for Future Applications—The LIGHT Collaboration. Nucl. Instrum. Methods Phys. Res. A 2014, 740, 94–98. [Google Scholar] [CrossRef]
  39. Shi, Y.; Zhang, X.; Arefiev, A.; Shen, B. Advances in Laser-Plasma Interactions Using Intense Vortex Laser Beams. Sci. China Phys. Mech. Astron. 2024, 67, 295201. [Google Scholar] [CrossRef]
  40. GB/T 212-2008; Proximate Analysis of Coal. Standardization Administration of People’s Republic of China: Beijing, China, 2008.
  41. GB/T 213-2008; Determination of Calorific Value of Coal. Standardization Administration of People’s Republic of China: Beijing, China, 2008.
  42. Wang, W.; Dong, H.; Shi, Z.; Leng, Y.; Li, R.; Xu, Z. Collimated Particle Acceleration by Vortex Laser-Induced Self-Structured “Plasma Lens”. Appl. Phys. Lett. 2022, 121, 211101. [Google Scholar] [CrossRef]
  43. Cristoforetti, G.; De Giacomo, A.; Dell’Aglio, M.; Legnaioli, S.; Tognoni, E.; Palleschi, V.; Omenetto, N. Local Thermodynamic Equilibrium in Laser Induced Breakdown Spectroscopy: Beyond the McWhirter Criterion. Spectrochim. Acta Part B At. Spectrosc. 2010, 65, 86–95. [Google Scholar] [CrossRef]
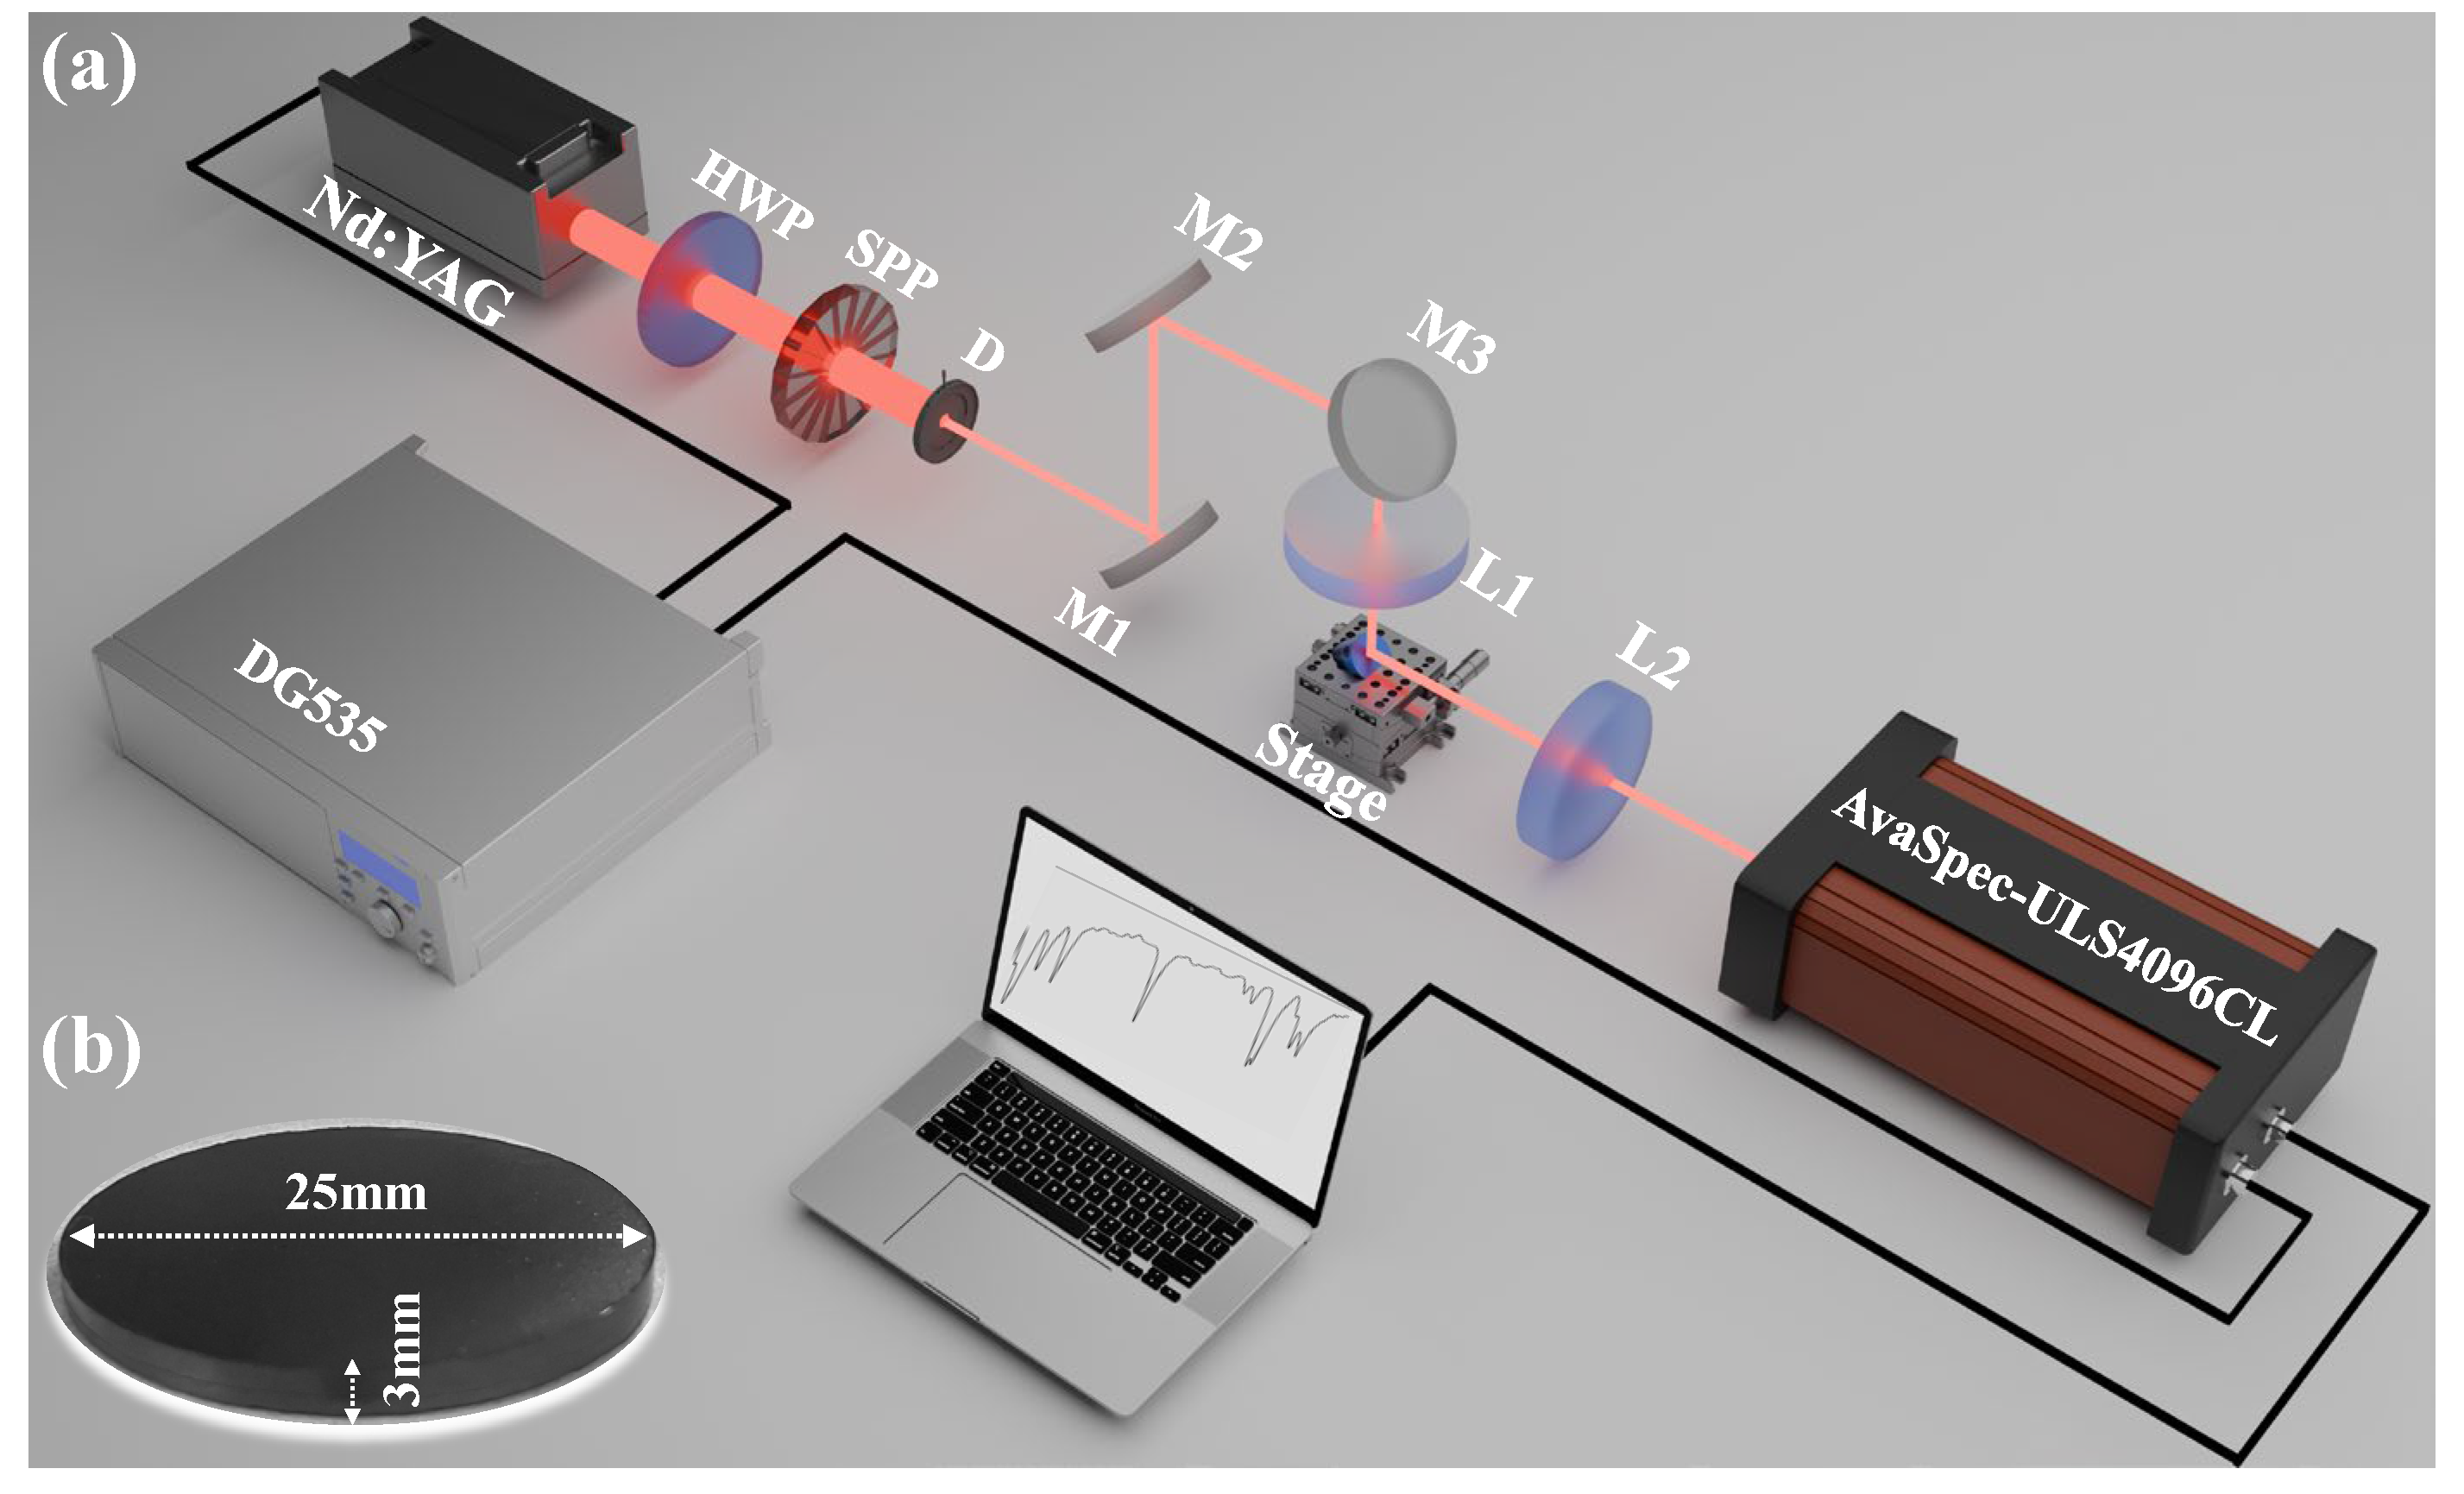
Figure 1. (a) Experimental optical path diagram of vortex beam-induced LIBS on coal; (b) coal sample.
Applsci 15 11590 g001
Figure 2. Near- and far-field intensity profiles: (aa2) Gaussian beam; (bb2) vortex beam. (c) Schematic of beam sizes and far-field focal-spot positions for Gaussian and vortex beams.
Applsci 15 11590 g002
Figure 3. Dependence of spectral emission intensity on detector gate delay for lignite under vortex beam-induced LIBS.
Applsci 15 11590 g003
Figure 4. Average RSD and SBR of characteristic spectral lines versus detector delay time (a,b). Spectral intensity versus laser pulse energy (c) and defocus distance (d).
Applsci 15 11590 g004
Figure 5. Plasma emission spectra of lignite under Gaussian and vortex beam-induced LIBS.
Applsci 15 11590 g005
Figure 6. Boltzmann plot for plasma temperature determination at pulse energies of 50 (Gaussian beam) and 60 mJ (vortex beam).
Applsci 15 11590 g006
Figure 7. Contributions and cumulative contribution rates of principal components. (a) Vortex beam; (b) Gaussian beam.
Applsci 15 11590 g007
Figure 8. PCA component scatter plot for coal. (a) Vortex beam; (b) Gaussian beam.
Applsci 15 11590 g008
Figure 9. Confusion matrices for the PCA-SVM classification model under vortex beam-induced LIBS (a) and Gaussian beam-induced LIBS (b).
Applsci 15 11590 g009
Table 1. Characteristics of coal samples (air-dried basis).
Coal SampleMoisture/%Volatiles/%Ash/%St/%Calorific Value (cal/g)Fixed Carbon/%
Lignite5.338.824.10.02448331.8
High-Sulfur Coal1.58.327.14.98248563.4
Anthracite0.66.510.90.37724582
Long Flame Coal3.531.730.15726261.8
Table 2. Spectral parameters of selected Ca II lines from the NIST database.
IonWavelength (nm)Aki (108 s−1)gkEk (eV)
Ca II315.893.147.05
Ca II317.933.667.05
Ca II373.691.726.47
Ca II393.371.4743.15
Ca II396.851.423.12
Table 3. Classification performance of PCA-SVM and RF under vortex and Gaussian beam excitation.
ModelLight SourceMetricType 1Type 2Type 3Type 4AverageTest Accuracy
(Mean ± Std, %)
PCA-SVMVortexPrecision0.921.001.000.870.9594.42 ± 2.82
Recall1.000.91.000.930.96
F1-Score0.960.951.000.90.95
GaussianPrecision0.611.001.001.000.9086.67 ± 8.13
Recall1.001.000.531.000.88
F1-Score0.761.000.701.000.87
RFVortexPrecision1.001.001.000.930.9894.00 ± 2.56
Recall0.911.001.001.000.98
F1-Score0.951.001.000.970.98
GaussianPrecision0.640.951.000.930.8891.33 ± 3.65
Recall0.821.001.000.670.87
F1-Score0.720.980.800.970.87
Disclaimer/Publisher’s Note: The statements, opinions and data contained in all publications are solely those of the individual author(s) and contributor(s) and not of MDPI and/or the editor(s). MDPI and/or the editor(s) disclaim responsibility for any injury to people or property resulting from any ideas, methods, instructions or products referred to in the content.