Article

From Benchmarking to Optimisation: A Comprehensive Study of Aircraft Component Segmentation for Apron Safety Using YOLOv8-Seg

by
Emre Can Bingol
* and
Hamed Al-Raweshidy
Department of Electronic and Electrical Engineering, Brunel University of London, London UB8 3PH, UK
*
Author to whom correspondence should be addressed.
Appl. Sci. 2025, 15(21), 11582; https://doi.org/10.3390/app152111582
Submission received: 7 October 2025 / Revised: 23 October 2025 / Accepted: 26 October 2025 / Published: 29 October 2025

Abstract

Apron incidents remain a critical safety concern in aviation, yet progress in vision-based surveillance has been limited by the lack of open-source datasets with detailed aircraft component annotations and systematic benchmarks. This study addresses these limitations through three contributions. First, a novel hybrid dataset was developed, integrating real and synthetic imagery with pixel-level labels for aircraft, fuselage, wings, tail, and nose. This publicly available resource fills a longstanding gap, reducing reliance on proprietary datasets. Second, the dataset was used to benchmark twelve advanced object detection and segmentation models, including You Only Look Once (YOLO) variants, two-stage detectors, and Transformer-based approaches, evaluated using mean Average Precision (mAP), Precision, Recall, and inference speed (FPS). Results revealed that YOLOv9 delivered the highest bounding box accuracy, whereas YOLOv8-Seg outperformed in segmentation, surpassing some of its newer successors and showing that architectural advancements do not always equate to superiority. Third, YOLOv8-Seg was systematically optimised through an eight-step ablation study, integrating optimisation strategies across loss design, computational efficiency, and data processing. The optimised model achieved an 8.04-point improvement in mAP@0.5:0.95 compared to the baseline and demonstrated enhanced robustness under challenging conditions. Overall, these contributions provide a reliable foundation for future vision-based apron monitoring and collision risk prevention systems.

1. Introduction

Airport aprons are among the most critical safety zones in civil aviation, where aircraft, ground vehicles, and personnel interact within limited spaces. Ground collisions on aprons are common, resulting in substantial economic losses, operational delays, and reputational damage [1,2,3]. According to the International Air Transport Association (IATA), without further safety interventions, the financial impact of ground damage could rise to nearly $10 billion annually by 2035 [4]. This alarming projection highlights the urgent need for innovative solutions to improve operational safety on aprons. Even seemingly minor incidents like wingtip collisions can lead to aircraft being withdrawn from service for expensive inspections and repairs. This clearly demonstrates that apron safety is both a persistent problem and one that should not be ignored. Traditional airport safety systems, including human surveillance, Surface Movement Radar (SMR), Automatic Dependent Surveillance-Broadcast (ADS-B) and CCTV, can only partially provide apron safety [5,6]. While SMR and ADS-B are considered reliable for location data, they cannot perform object-level classification. Closed-Circuit Television CCTV, on the other hand, provides rich visual information but requires human attention and is susceptible to factors such as fatigue, low visibility, or adverse weather conditions [7,8,9,10,11]. Alternative technologies such as thermal infrared cameras and LiDAR systems provide additional layers of surveillance, but their widespread use is vulnerable by their high cost, limited resolution, or signal degradation from weather conditions [12,13,14,15]. These limitations reveal that no isolated system suffices for comprehensive apron safety, necessitating integrated, intelligent approaches that leverage emerging technologies.
In this context, Artificial Intelligence (AI) and Computer Vision (CV) are increasingly recognised as enabling technologies with significant potential. In particular, deep learning supports the automated detection, classification, and tracking of aircraft, vehicles, and personnel in real time, thereby reducing reliance on human operators and enhancing situational awareness [16,17]. While existing AI applications in aviation have addressed challenges such as foreign object debris (FOD) detection [18,19,20,21], perimeter surveillance [22,23,24], turnaround monitoring [25,26], and wildlife hazard management [27,28,29], a critical gap remains. Comprehensive solutions that integrate component-level detection of aircraft, supported by systematic benchmarking of state-of-the-art models and targeted optimisation, are notably limited in the current literature. Accordingly, the research presented herein seeks to establish a robust, data-driven foundation for the development of next-generation, intelligent apron surveillance systems.

1.1. Motivation and Research Questions

This research is motivated by the persistent risks of apron incidents in civil aviation and the lack of reliable, open datasets and systematic model evaluations. While state-of-the-art detectors such as YOLO-based architectures, Faster R-CNN, and Transformer-based approaches have demonstrated remarkable results on generic benchmarks, their applicability to airport ground operations remains underexplored. Equally, object detection model optimisation studies tailored for aviation safety are scarce. To address these gaps, we pursue the following research questions:
  • What are the essential characteristics of a benchmark dataset designed to effectively train and validate deep learning models for the high-fidelity detection of individual aircraft components in diverse apron environments?
  • How do state-of-the-art object detection and segmentation architectures compare in terms of accuracy, computational efficiency, and practical robustness when systematically benchmarked for aircraft component identification?
  • What constitutes a systematic optimisation framework for a state-of-the-art segmentation model (YOLOv8-Seg) to enhance its performance for the specific demands of apron safety, and what is the quantifiable and qualitative impact of such a framework?

1.2. Key Contributions

The key contributions of this study are presented as follows:
  • We developed and publicly released a novel hybrid dataset of 1112 images featuring detailed, pixel-level annotations for five critical aircraft components. This resource directly addresses the critical gap of coarse-labelled and proprietary datasets in aviation research, enabling reproducible and fine-grained analysis.
  • We conducted a systematic benchmark of twelve state-of-the-art detection and segmentation models, spanning three distinct architectural paradigms. This analysis provides a definitive performance comparison using critical metrics (mAP, Recall, F1-Score, FPS), establishing a clear hierarchy of model suitability for apron safety.
  • We introduce a systematic and reproducible optimisation framework for YOLOv8-Seg. This framework is rigorously validated through an eight-step ablation study that first quantifies the individual impact of each technique from data augmentation to architectural scaling and then demonstrates the powerful cumulative effect of combining the most effective strategies. The final optimised model achieves a quantifiable (8.04 p.p.) in mAP@0.5:0.95 gain and significantly enhances robustness, bridging the gap between benchmark accuracy and operational reliability.

1.3. Structure of the Paper

The remainder of this paper is organised as follows: Section 2 reviews related work in aviation safety datasets and object detection algorithms. Section 3 presents the methodology, including dataset creation, model training, and the eight-step optimisation process. Section 4 reports the results of benchmarking and optimisation, while Section 5 discusses their implications and comparative insights, including limitations and directions for future research. Finally, Section 6 concludes the study.

2. Related Work

Vision-based apron safety research covers applications from remote sensing to ground-level surveillance. In satellite and aerial imagery, detection methods have progressed through feature fusion, multi-scale processing, and super-resolution techniques to address small aircraft sizes and crowded scenes. However, these approaches still face challenges with real-time performance requirements and complex background environments [30,31,32,33,34]. While valuable for large-area monitoring, apron-level surveillance typically demands higher resolution, faster processing speeds, and more detailed object information than remote sensing can provide [35,36].
From a technical perspective, two-stage detection methods like R-CNN variants offer strong accuracy but often lack the speed needed for real-time apron operations [37,38,39,40]. Single-stage detectors such as SSD [41], RetinaNet [42], and particularly the YOLO series such as YOLOv1 [43], YOLOv5 [44], YOLOv8 [45], YOLOv9 [46], YOLOv10 [47], YOLOv11 [48], YOLOv12 [49], YOLOv5-Seg [50], YOLOv8-Seg [45], YOLOv11-Seg [51], models combine object localisation and classification with competitive processing speeds. Meanwhile, transformer-based models including DETR and RF-DETR introduce global contextual understanding through attention mechanisms [52,53]. A notable limitation is that validation often relies on general-purpose datasets like COCO, with limited aviation-specific evaluation, and many studies compare only one or two YOLO versions [21,54,55,56].
In apron and CCTV applications, recent research has adapted detectors for small targets and limited computing resources. Examples include ASSD-YOLO, which enhances YOLOv7 with attention and transformer components for improved performance on surveillance footage [57], AD-YOLO combining YOLOv7 with Swin and ECSA modules while maintaining over 100 FPS [58], and Edge-YOLO systems that achieve over 90% mAP with minimal cloud support for real-time apron monitoring [59]. Beyond aircraft detection, some approaches like YOLOv3 with MOSSE tracking monitor ground service operations with over 90% precision [25], while airport-specific YOLOv5 adaptations target component detection or efficient CPU deployment [54,60,61].
Data availability remains one of the most significant limitations in this field. For example, remote sensing-based datasets such as DOTA and RSOD contain airport imagery but typically only provide aircraft-level labels, which limits detailed component analysis and the reproducibility of results [62,63]. In recent years, instance segmentation models such as Mask R-CNN have enabled component-aware analysis by detecting and delineating individual aircraft parts. While semantic segmentation approaches like DeepLabV3 can classify regions corresponding to aircraft components, they lack instance-level separation. Both methods, however, often require extensive data augmentation, exhibit reduced performance on small objects (e.g., nose, tail), and are sensitive to class imbalance due to significant variations in part sizes [64,65,66]. Although recent models like YOLOv5, YOLOv8, and YOLOv11 now support instance segmentation [51], publicly available datasets with component-level annotations under realistic apron conditions remain scarce. Most existing datasets rely on satellite or aerial imagery, which fail to capture the challenges of ground-level operations. As a result, developing robust, real-time detection and segmentation models capable of performing reliably across varying lighting, weather, and visibility conditions becomes significantly challenging. To highlight these gaps, Table 1 presents a summary of representative datasets used in aircraft and apron-related tasks within civil aviation.
An examination of Table 1 reveals that the vast majority of existing datasets in the literature concentrate on remote sensing or satellite-based aircraft detection. For instance, the HRPlanes, DOTA, and RSOD datasets are oriented towards identifying only the general locations of aircraft in high-resolution satellite images at the Bounding Box level, conversely, they do not provide component-level detail or segmentation information. The COCO dataset, while comprehensive and containing dozens of objects classes, defines the aircraft category only as ‘aircraft’, with no sub-classes representing aircraft parts [56]. The FGVC-Aircraft dataset, developed by Maji et al. [68], focused on the classification of 102 different aircraft models, yet it did not include component-level annotations. He et al. [54] adopted an approach closer to the apron environment, detecting sub-components such as the aircraft’s nose, tail, engine, landing gear, and apron personnel at the BBox level with an enhanced YOLOv5-based system; however, this dataset lacks segmentation labels. Similarly, Yilmaz and Karsligil [66], used apron security camera images from the Turkish Airlines R&D Centre to perform detection of only the aircraft’s door and tail sections using Mask R-CNN; however, this dataset is not publicly available. Consequently, while the existing literature concentrates on ‘aircraft detection’ or ‘model classification’, there remains a clear lack of a publicly available, comprehensive data source for component-level segmentation of aircraft parts that also reflects real apron conditions.
In summary, research gaps persist in three key areas: the absence of publicly available datasets with component-level annotations, the lack of comprehensive multi-architecture benchmarking under consistent evaluation protocols, and the limited presence of systematic optimisation strategies addressing apron safety requirements, including scenario robustness.
This study addresses these gaps by introducing a public dataset with component-level instance segmentation, evaluating twelve detection and segmentation architectures under uniform conditions, and presenting an eight-step optimisation framework for YOLOv8-Seg tailored to safety-critical apron applications, thereby contributing to the development of more reliable, real-time, and safety-aware vision systems for airport operations.

3. Methodology

3.1. Dataset Development

A new hybrid dataset was created using three different data sources to reliably detect and segment aircraft on aprons. First, real-world photographs of commercial aircraft were collected from publicly licensed platforms. Variety was exploited through different aircraft types, lighting, and background conditions. Second, CCTV footage was used. Finally, synthetic data was generated using Microsoft Flight Simulator (MSFS; Microsoft Corporation, Redmond, WA, USA) to simulate real-world conditions. This combination enabled the dataset to reflect both realistic apron conditions and rare but safety-critical scenarios.
However, creating a dataset for aircraft and aircraft components presents several challenges. As emphasised in the literature, these challenges are largely due to licensing restrictions, access limitations, and data privacy. Many existing datasets are private and not accessible to the public. The dataset developed in this study was meticulously compiled over several months of intensive effort to address the identified challenges and limitations. The vast majority of the images were professionally collected from different airports; some of the data was obtained from real CCTV footage, while a small portion was obtained from MSFS-based synthetic scenarios to increase diversity. The dataset is not limited to outdoor conditions, it also covers snow, rain, fog, day, night, and intense lighting conditions. This diversity makes the dataset more representative of dynamic and variable work environments like aprons, rather than being uniform. The prepared dataset is designed to be publicly accessible, and this approach contributes to reducing data access barriers and increasing reproducibility in apron safety research.
All images were annotated using Roboflow platform, with instance segmentation aircraft and four main parts, fuselage, wings, tail, and nose. These component-level annotations were chosen because most apron incidents include discrete parts of aircraft rather than whole fuselages. In addition, the annotation process was manually verified to ensure accuracy and consistency across classes. The dataset comprises 1112 images with 7420 total annotations. Images resolutions (median 1200 × 822) and an average image size of 0.97 MP. The dataset was split into training, validation, and test subsets at a ratio of 80/15/5, with class balance carefully preserved.
A summary of the dataset structure is provided in Table 2, which reports the number of instances per class before augmentation. To our knowledge, this dataset represents a detailed publicly available resources for apron safety research, so offering fine-grained labels that directly support aircraft component-level analysis.
Additional dataset statistics are provided in the Supplementary Materials, including per-class label distribution (Table S1), the number of labels per image (Table S2), image size categories (Table S3), and image aspect ratio distribution (Table S4).

3.2. Selection of Deep Learning Models

This study evaluates twelve representative detection and segmentation models from three main architectural families. The first group comprises YOLO variants (v5, v8–v12) and their segmentation versions (YOLOv5-Seg, YOLOv8-Seg, YOLOv11-Seg), selected for their real-time capability by unifying object localisation and classification in a single step [43,45,46,47,69]. The second group includes Faster R-CNN, a two-stage detector valued as an accuracy benchmark despite slower inference speeds [39]. The third group encompasses transformer-based models DETR and RF-DETR, which formulate detection as a set prediction task and leverage attention mechanisms for global context modelling [53,70].
These families represent key evolutionary trends in object detection: two-stage precision-oriented methods, single-stage speed-optimised YOLO architectures, and transformer-based global reasoning approaches. Instead of reiterating architectural details, this analysis focuses on their comparative performance in apron surveillance scenarios. Key characteristics of each model family are summarised in Table 3, while comprehensive implementation details (backbone, neck, and head configurations) are provided in the Supplementary Materials (Tables S5–S7) to ensure reproducibility.

3.3. Experimental Configuration for Model Comparison

All experiments were conducted on Google Colab Pro (Python 3.11.12, CUDA 12.4, PyTorch 2.6.0+cu124), equipped with an NVIDIA A100 GPU (40 GB VRAM), 2–4 virtual CPUs with 25 GB memory. YOLO variants (v5, v8–v12) and their segmentation counterparts were implemented using the Ultralytics YOLO framework (Ultralytics LLC, London, UK; v8.3.134), while transformer-based models (DETR, RF-DETR) were implemented with the HuggingFace Transformers library (Hugging Face Inc., New York, NY, USA; v4.52.2).
While the dataset was initially divided into 80% training, 15% validation, and 5% test subsets, the quantitative benchmarking of all twelve models was conducted on the 15% validation subset (~167 images) rather than the small 5% test split (~56 images). This approach reduces statistical variance and provides more stable mAP estimates. The 5% test portion was retained exclusively for qualitative inspections and sanity checks.
To ensure a fair and transparent benchmark, the twelve models were grouped into three architectural families: single-stage YOLO-based models, the two-stage Faster R-CNN, and transformer-based DETR variants. To provide a methodologically fair basis for comparison that addresses potential convergence differences between these families, each was trained using its canonical, literature-recommended hyperparameter configuration. However, a uniform experimental framework was maintained across all runs.
Specifically, all YOLO and YOLO-Seg variants (v5–v12) were trained under identical conditions: AdamW optimiser (learning rate 0.00111), (640 × 640) input resolution, batch size of 16, and 130 epochs with early stopping. Faster R-CNN employed its standard SGD optimiser (momentum 0.9, learning rate 0.01) with (800 × 1333) inputs. The Transformer-based models DETR and RF-DETR used AdamW (learning rate 0.0001) with dynamic input resizing, reflecting their native training schemes.
Across all experiments, the dataset split (80/15/5), augmentation pipeline, and hardware/software environment remained identical. This balanced approach ensures that performance differences reflect architectural design rather than training bias, making the comparisons scientifically reproducible.
Finally, experimental reproducibility was maintained through consistent data partitioning and controlled random seeds. Full hyperparameter details for each architecture are listed in Table S8 of the Supplementary Materials, confirming that no model was trained under advantageous conditions beyond its original design.

3.4. Performance Evaluation Metrics

We selected widely used object detection and segmentation metrics to effectively test the performance of the models. Intersection over Union (IoU) is used to determine true and false positives by calculating the overlap between the predicted and true bounding boxes [71]. Precision shows the fraction of correct detections among all positive predictions, while Recall indicates how many of the true objects were detected [71]. The trade-off between these two metrics is illustrated by the Precision–Recall (PR) curve, which presents the model performance at different confidence thresholds [54].
From the PR curve plot, Average Precision (AP) is calculated for each class as well as Precision and Recall are combined into a single score [72]. For tasks with multiple classes, Average Precision (mAP) combines the AP values of all categories [73]. Two common thresholds are reported: mAP@0.5, which uses a 0.5 IoU threshold, and mAP@0.5:0.95, which averages the results between thresholds from 0.5 to 0.95 in steps of 0.05 as defined in the COCO benchmark [72].
For segmentation quality, the Mean Intersection Over Union (mIoU) is used to identify the pixel-level overlap between predicted and true masks across classes [74]. To ensure methodological clarity, all reported metrics are labelled as BBox for bounding-box evaluation and Mask for mask-based evaluation. Metrics labelled BBox were computed using standard Bounding-box IoU, whereas those labelled Mask followed the COCO Mask-AP protocol, which measures pixel-level mask IoU rather than bounding-box overlap. This distinction enables consistent and independent assessment of detection BBox and segmentation Mask performance under the same COCO-standard evaluation framework [73,75].
F1-score is defined as the harmonic mean of precision and recall, is used to provide a single measure of trade-off between false positives and false negatives [76]. Inference speed is evaluated using FPS metric, which reflects model performance in real-time conditions. Collectively, these metrics provide a multidimensional framework evaluating accuracy, segmentation quality, and operational efficiency, enabling comprehensive assessment of model suitability for apron surveillance applications.

3.5. Methodological Validation: Statistical and Visual Analysis

This section presents a two-way validation framework designed to rigorously assess model robustness, increase the generalisability of findings, and ensure practical applicability. Standard assessments based on a single fixed test split can be susceptible to partitioning bias and may not fully represent the data variance. This can potentially lead to overly optimistic or misleading performance estimates [77].
To mitigate these risks and create a more holistic methodology, our study employed both:
  • Statistical evaluation through k-fold cross-validation and,
  • Quantitative failure mode and qualitative visual analysis under various apron scenarios.

3.5.1. Statistical Evaluation Using K-Fold Cross Validation

As outlined in Section 3.3, the initial benchmark of twelve models was conducted using a 15% validation subset (167 images) to provide a stable basis for model selection, as the 5% test set (56 images) was too small for reliable evaluation. However, single-shot evaluations, even on a validation set, are susceptible to statistical variance and partitioning bias. To address this and obtain an unbiased measure of model performance, a 10-fold cross-validation (CV) procedure was performed on the three candidate models: YOLOv8, YOLOv8-Seg and YOLOv11-Seg. The choice of k = 10 balances computational cost with reliable variance estimation, as supported by the literature [77].
In this procedure, the entire dataset (1112 images) was divided into 10 equal, stratified folds. For each iteration, one fold (10%, 111 images) was reserved as the test set, while the remaining 90% was split into 80% for training (890 images) and 10% for validation (~111 images) to select the best model weights (best.pt). This process was repeated 10 times, ensuring each data point was used for testing exactly once. Performance metrics (BBox mAP@0.5:0.95, BBox mAP@0.5, Mask mAP@0.5:0.95, Mask mAP@0.5) from each fold’s test set were aggregated to compute the mean, standard deviation (StdDev), coefficient of variation (CV), and 95% confidence intervals (Student-t). In addition to t-intervals, non-parametric bootstrap confidence intervals were also estimated for mAP metrics to further quantify performance variability.
Mathematically, these ratios can be defined as follows:
Test   ratio = 1 k = 1 10 = 10 %
Validation   ratio = k 1 k × 1 k 1 = 9 10 × 1 9 = 10 %
Training   ratio = 1 Test + Validation = 80 %
At each iteration, the model was retrained and tested based on these ratios, thus, each model was trained independently 10 times. To prevent data leakage, the training and test sets for each fold were kept completely separate, and the training hyperparameters, learning rate, and other experimental conditions were fixed to fully comply with those defined in Section 3.3. Thus, the results of different folds were only affected by the variability of the data subset, and the true performance stability of the model was measured. The evaluation focused on the mAP@0.5 and mAP@0.5:0.95 metrics for BBox and mask (segmentation) performance. These metrics were chosen because they reflect both the overall accuracy and the consistency of the model across different IoU thresholds. Using the metric values calculated for each fold, the following statistical measurements were obtained:   For   the   k = 10   folds ,   the   score   set   { x 1 , x 2 , , x k } was obtained and the following statistics were computed.
Arithmetic Mean: It is the average of k scores that represents the expected overall performance of the model.
x ¯ = 1 k i = 1 k x i
Here:
x ¯ = arithmetic mean of all folds,
x i = result of each fold,
k = total number of folds (e.g., 10).
Standard Deviation (s): Indicates the model’s stability, or rather its variability, in performance across different data subsets. A lower s value indicates more consistent performance.
s = 1 k 1 i = 1 k x i x ¯ 2
Here:
s : standard deviation of the sample.
95% Confidence Interval (CI): Due to the sample size of k = 10, the Student-t distribution was used to estimate the range within which the true average performance of the model would lie. This range provides a more reliable basis for comparison than a single numerical score.
C I 95 % = x ¯ ± t α / 2 , k 1 s k
C I 95 % = 95% confidence interval for the mean,
t α / 2 , k 1 = t -distribution critical value for a 95% confidence level and k − 1 degrees of freedom, a significance level of α = 0.05 ( t 0.025 , 9 ≈ 2.262)

3.5.2. Quantitative Failure Mode and Visual Scenario-Based Analysis

This phase aimed to move beyond the statistically evaluated overall performance of the models by analysing their consistency under real-world operational conditions and identifying their specific failure modes. The goal was to examine how the models perform not only in terms of numerical metrics but also when exposed to environmental variability and visual complexity.
To achieve this, the analysis was conducted in two complementary dimensions. First, the failure patterns of the models at the component level were quantitatively assessed using confusion matrices, focusing on True Positive (TP), False Positive (FP), and False Negative (FN) cases observed in the most challenging classes. This quantitative evaluation was designed for analysing typical failure modes and to reveal class-specific weaknesses in detection. Second, a visual analysis was conducted to assess the generalisation ability of the three best-performing object detection models across diverse apron scenarios. Six representative conditions including foggy weather, low light, complex background, partial occlusion, glare, and sensor noise were selected to simulate the environmental and operational challenges encountered in real apron operations. Each scenario enabled the observation of how models maintained stability and robustness under varying visual complexities.

3.6. Systematic Optimisation Framework for a YOLOv8-Seg

Based on prior model evaluation, YOLOv8-Seg was selected for systematic optimisation due to its effective balance of segmentation and detection accuracy alongside computational efficiency. Furthermore, the aim was to provide a more reliable basis for flow tracking and more accurate detection. Therefore, systematic optimisation was required to increase its efficiency in real-world apron environments. The optimisation strategy was designed as a comprehensive ablation study that individually tested the effectiveness of six different techniques. Each applied technique was evaluated independently on the YOLOv8-Seg model, targeting different aspects of the training or inference pipeline.
  • Loss Function Modification: To reduce class imbalance between large fuselages and smaller components (wings, tails, and noses), a custom function called v8WeightedSegmentationLoss was used instead of the standard Loss function. This function combines class-weighted cross-entropy with geometric metrics such as IoU and Dice to improve boundary accuracy on long structures such as wings. In practice, all other hyperparameters were kept constant.
  • Inference Efficiency Optimisation: In this step, an adjustment was made to torch.inference_mode() in the YOLOv8-Seg model. To improve computational efficiency during the distribution process, gradient calculations were disabled during forward propagation. This eliminated some unnecessary calculations during feature extraction and aimed to reduce memory usage and latency. This aimed to enable the selected model to perform faster and more resource-efficient real-time inference under apron supervision.
  • Mixed-Precision Computing: In this optimisation step, we enabled Automatic Mixed Precision (AMP) via the torch.cuda.amp.autocast() mode. This change allowed some tasks to run at FP16, while keeping critical operations running at FP32. This optimisation step aims to reduce memory usage and speed up inference. In addition, a callback mechanism has also been added to the prediction function.
  • Increasing Input Resolution: In this step, only the model’s input resolution was changed, while all other hyperparameters were held constant. The input size was increased from 640 × 640 pixels to 1024 × 1024 pixels. This adjustment was intended to enable the model to process finer spatial details of components such as the fuselage, wings, and tail. It was anticipated that using higher resolution would enable the convolution layers to capture more local texture and boundary information, particularly for thin and long geometric structures like wings.
  • Epoch Count Adjustment: In this control experiment, only the training time parameter was changed. The epoch count was increased from 130 to 170 to allow the network to perform more iterations for weight optimisation. The aim was to ensure that the model could learn more complex spatial patterns more reliably across different classes and lighting conditions. To prevent potential over-learning, the early stopping and verification-based monitoring mechanisms were retained. Thus, the training time extension was implemented solely to enhance representation learning. To measure the individual impact of this change, all other parameters (resolution, learning rate, etc.) were kept the same as the baseline model.
  • Adjusting the Learning Rate: In this step, to examine its impact on the final performance of the model, the learning rate (LR) was slightly adjusted from 0.00111 to 0.001. This minor modification aimed to test the sensitivity of the model’s training dynamics to subtle variations in the learning rate and potentially provide a more stable weight update trajectory. This experiment was also run in isolation, independent of all other hyperparameters.
  • Model Scaling: The YOLOv8-Seg model was scaled from its nano configuration to a larger version. This step increased the model’s depth and parameter count. This scaling allowed the model to handle more complex geometric features and generate more detailed segmentation masks for aircraft components.
  • Data Augmentation and Expansion: The dataset was expanded by 3.5-fold through augmentation techniques applied exclusively to the training split, as detailed in Table 4. This strategic expansion enhances the model’s capacity for robust feature learning in object detection while maintaining evaluation integrity, as validation and test sets contained no augmented samples.

4. Results

4.1. Model Performance Comparison

4.1.1. Performance of the Evaluated Models

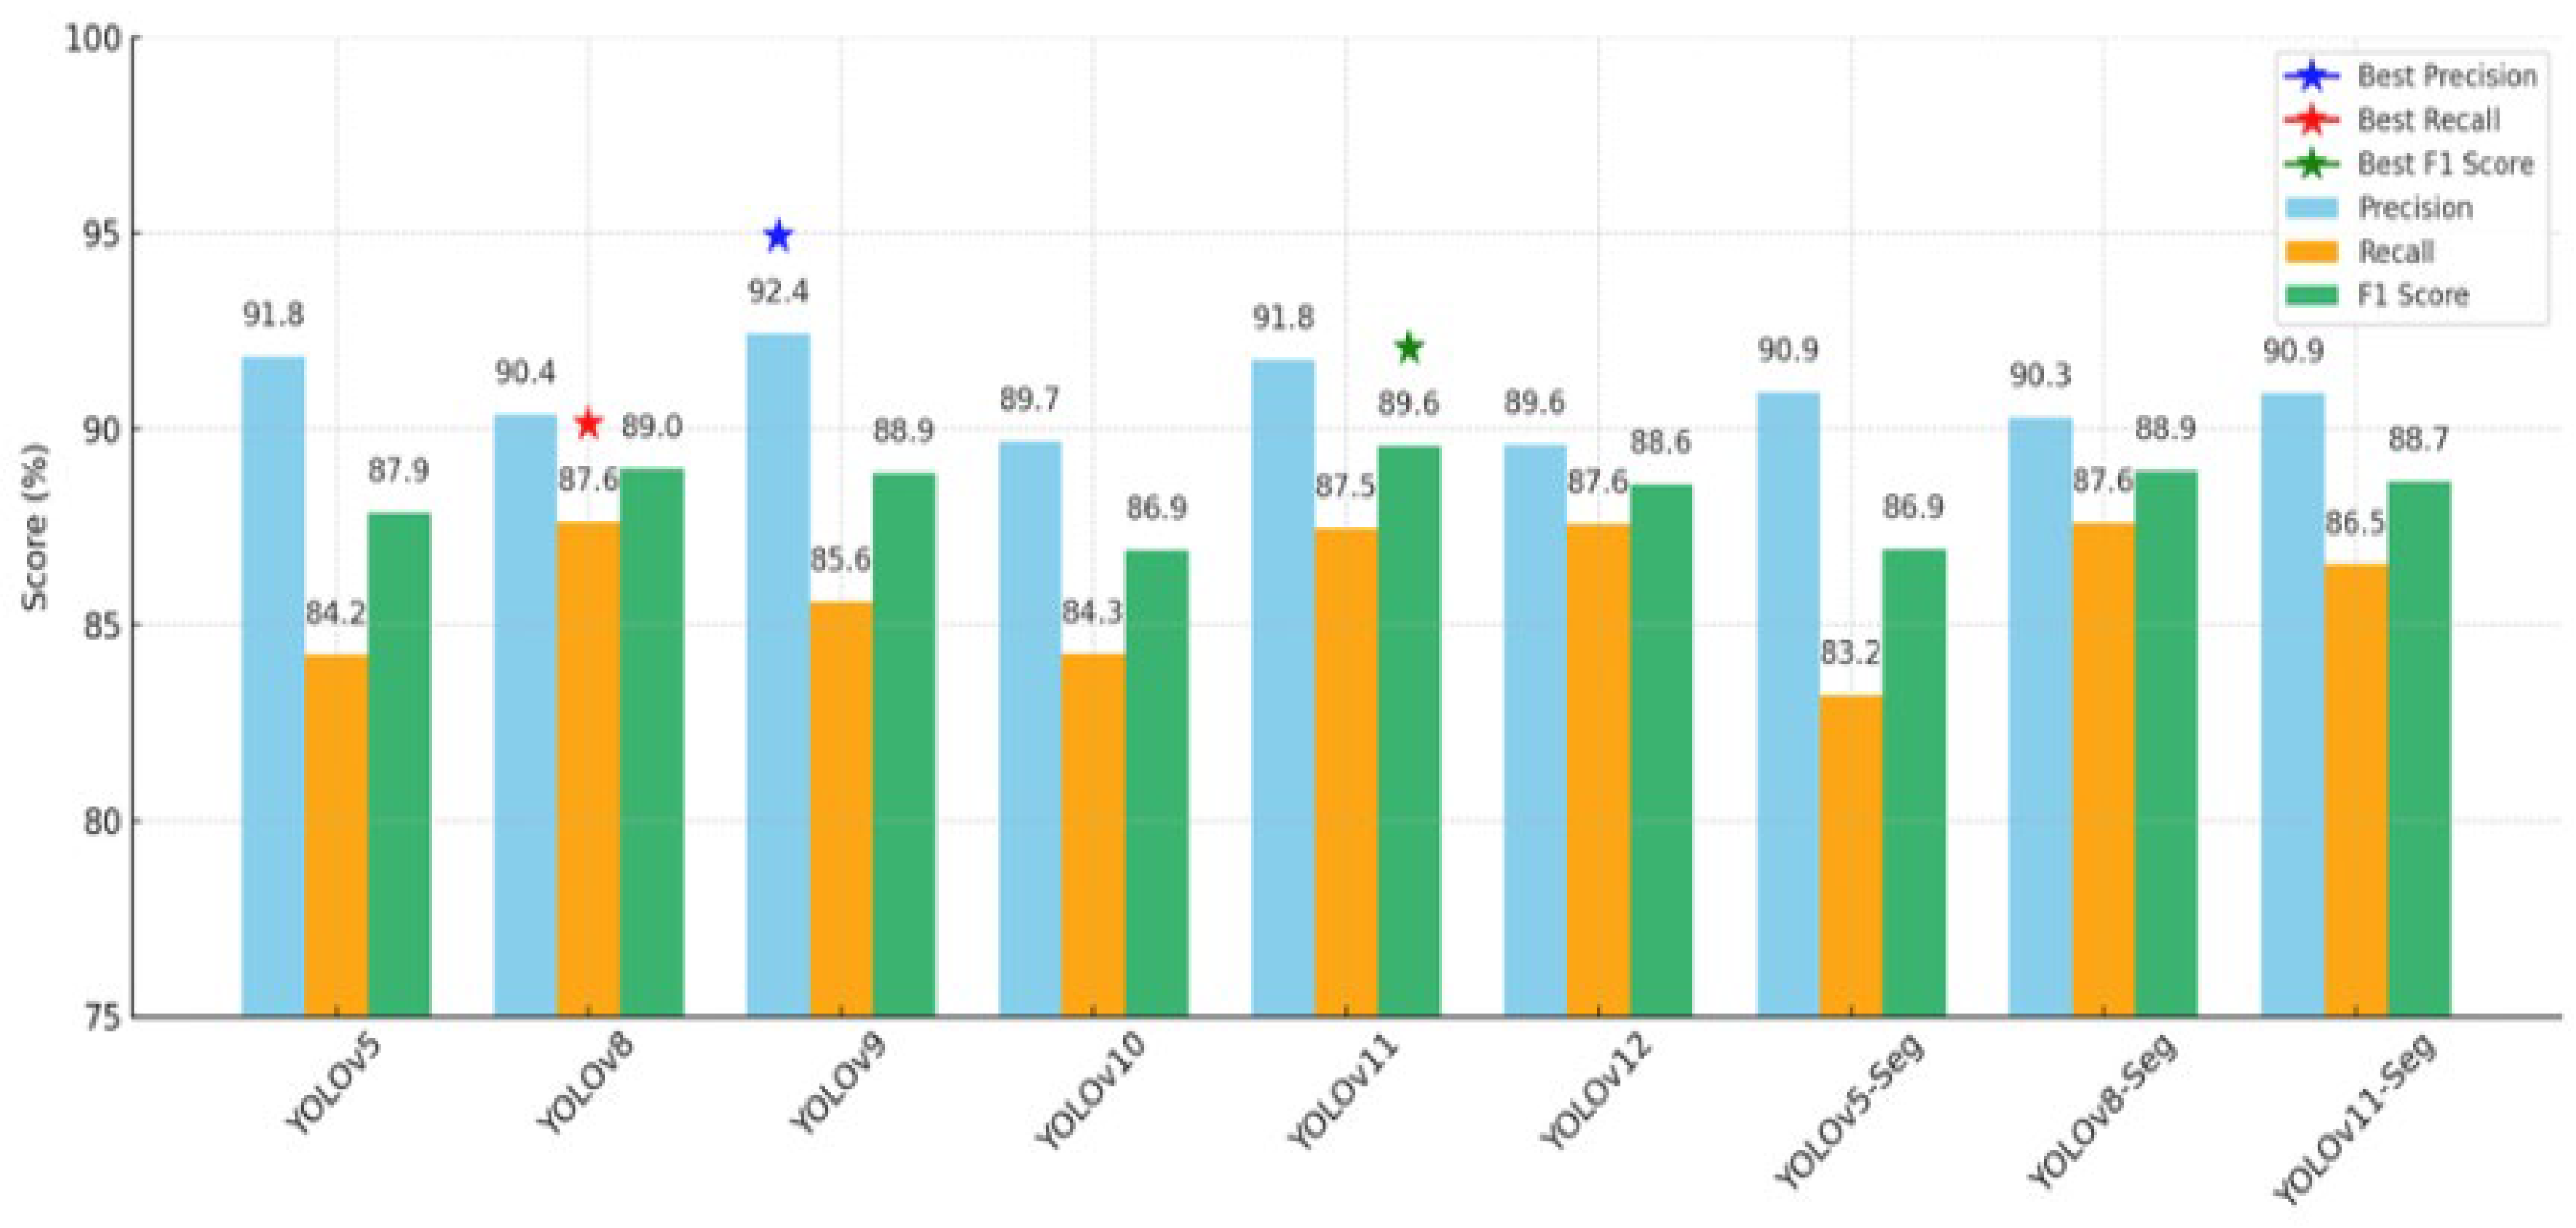
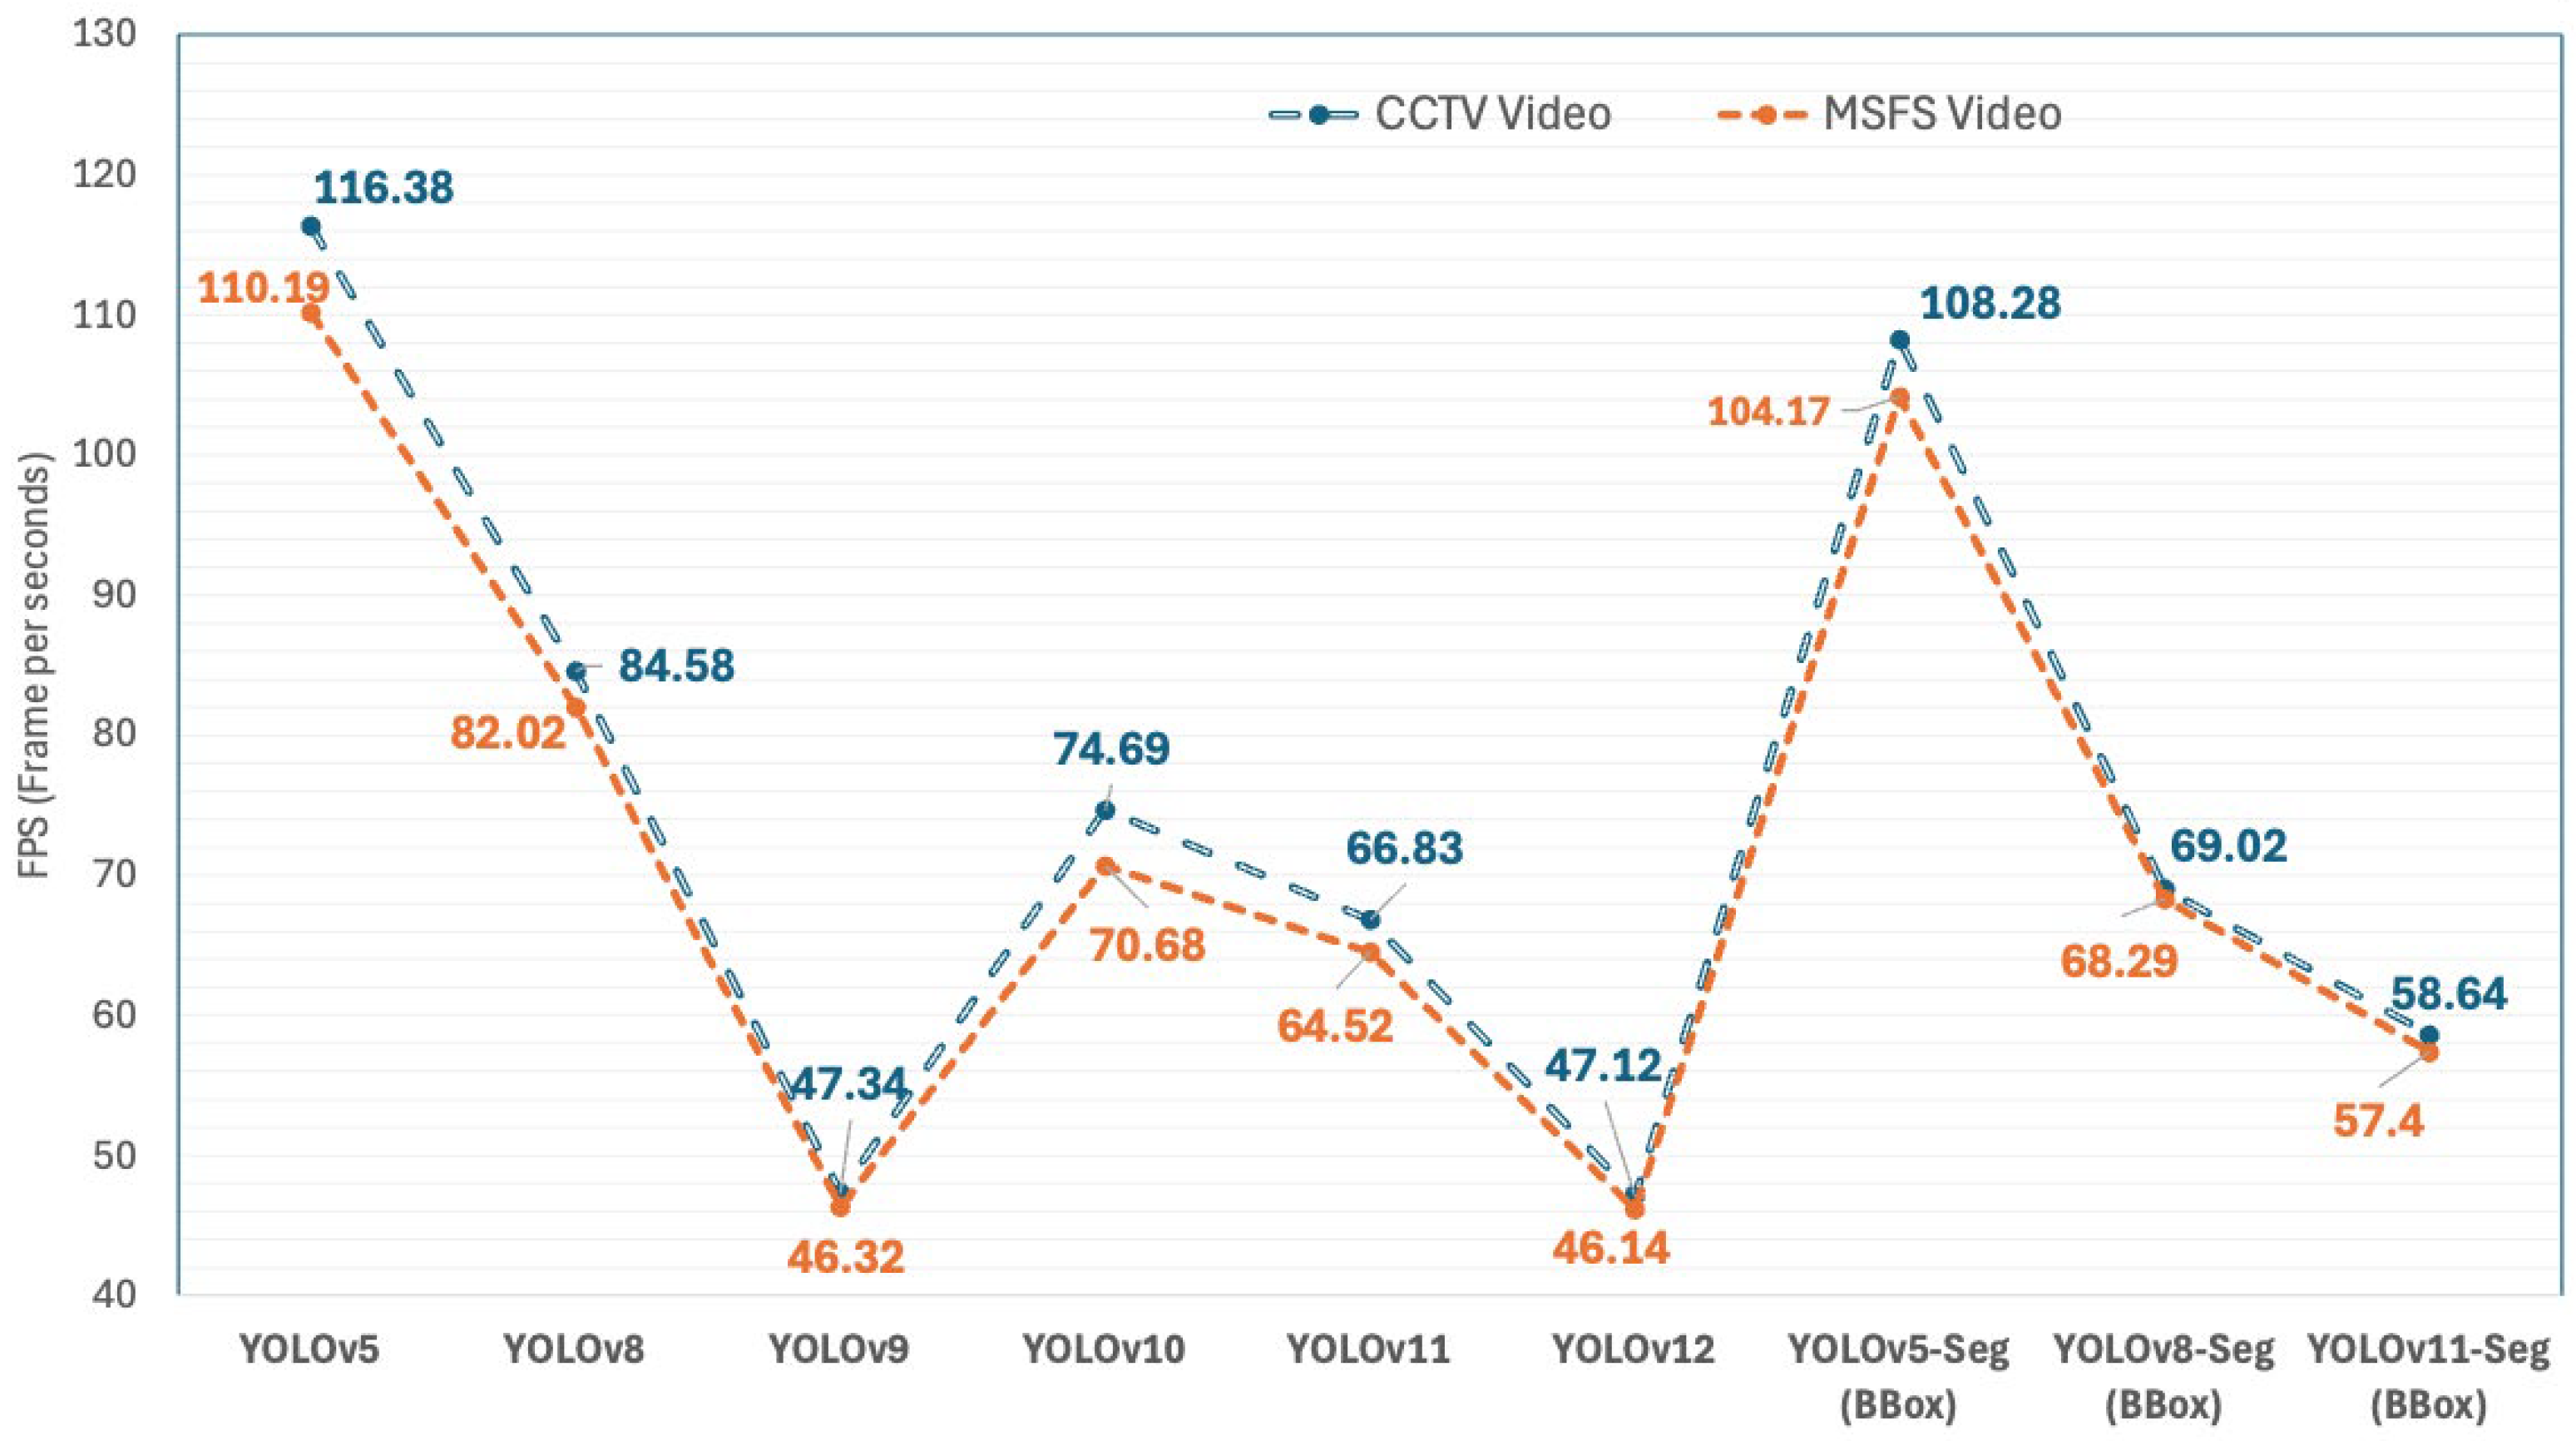
The benchmark experiments conducted in this study cover a total of twelve object detection and segmentation models representing three main architectural families: YOLO, R-CNN, and DETR-based transformer models. All models were trained and tested under the experimental conditions described in Section 3.3. Models belonging to the YOLO family (YOLOv5–v12) and their segmentation-capable derivatives (YOLOv5-Seg, YOLOv8-Seg, YOLOv11-Seg) were evaluated in both bounding box (BBox) and mask tasks, while non-YOLO architectures (Faster R-CNN, DETR, and RF-DETR) were examined in a separate group for comparative analysis. Table 5 summarises the quantitative detection results of the YOLO series models, reporting key performance metrics: mAP@0.5:0.95, mAP@0.5, Precision, Recall, F1-Score, and FPS on both CCTV and MSFS test streams. According to these results, YOLOv9 achieved the highest overall accuracy with 73.4% in mAP@0.5:0.95, while YOLOv8 achieved the highest single-threshold performance mAP@0.5 with 91.3% and the highest Recall value 87.6%. YOLOv9 also demonstrated the highest selectivity with a Precision of 92.4%, while YOLOv11 achieved the best Precision–Recall balance with an F1-Score of 89.6%. In real-time tests, YOLOv5 stood out as the fastest model with a speed of over 110 FPS. These findings reveal key performance trends among YOLO models and provide a methodological backdrop for the comparative and optimisation analyses presented in subsequent sections.
Figure 1, Figure 2 and Figure 3 are prepared from Table 5 to summarise the benchmark results for the YOLO variants. Figure 1 shows the mAP scores, Figure 2 presents the Precision, Recall, and F1 results, while Figure 3 demonstrates the inference speeds across CCTV and MSFS videos.
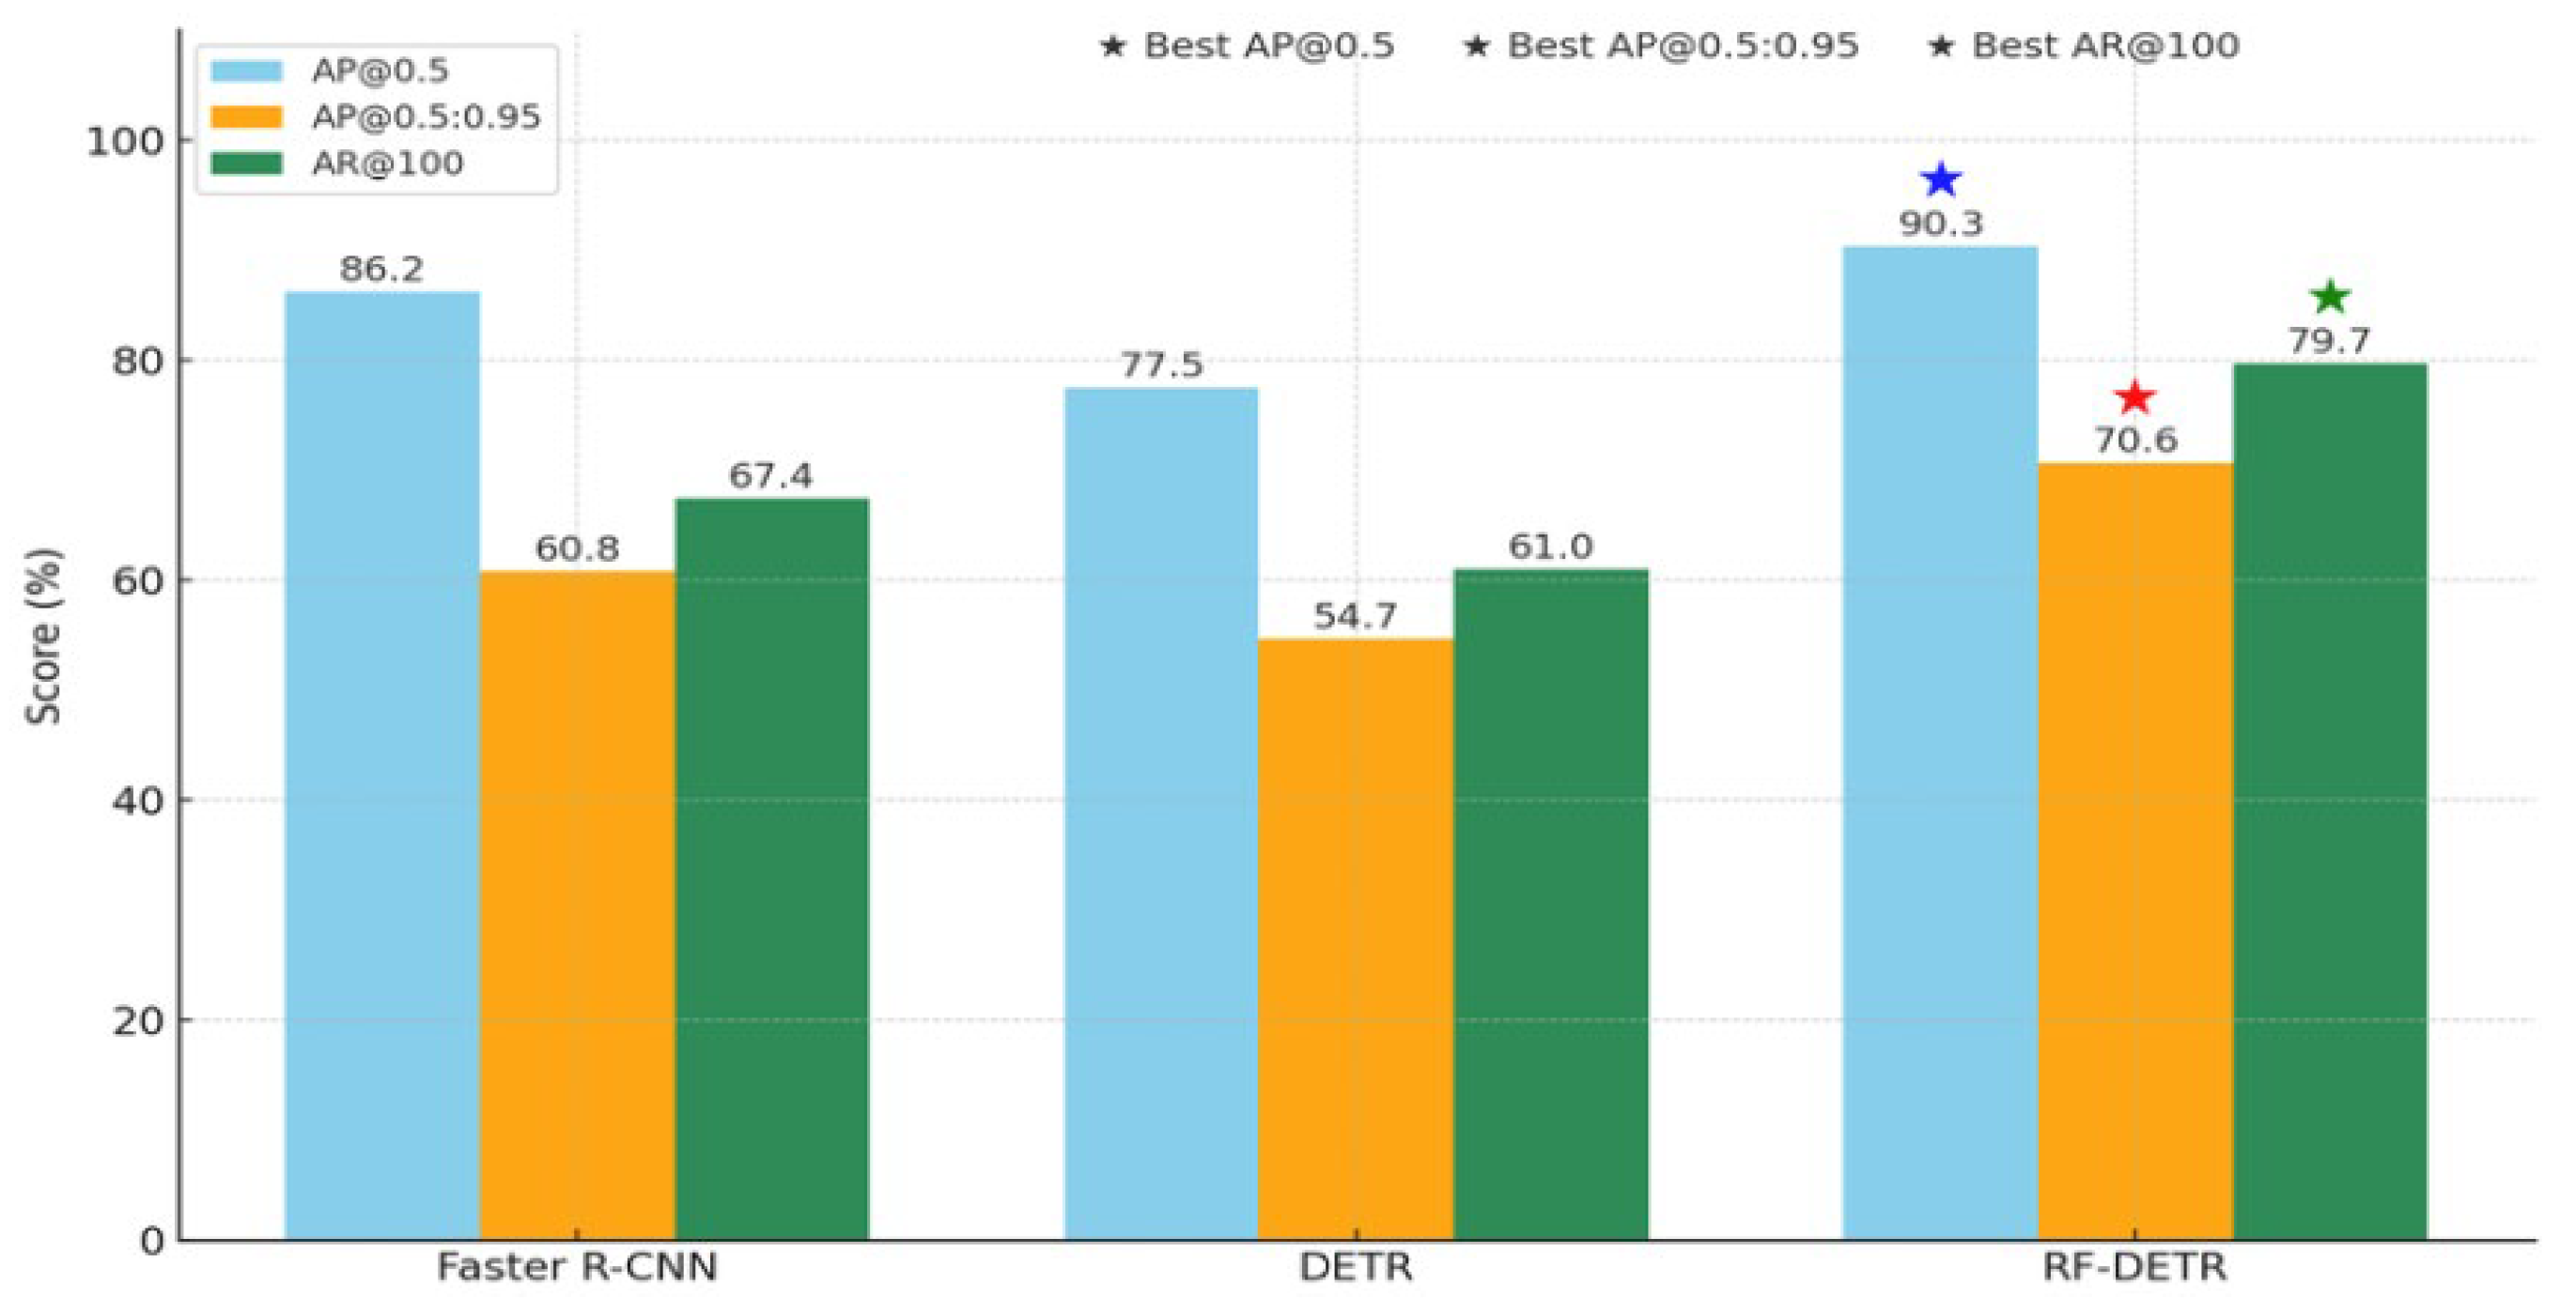
Table 6 details the results of non-YOLO architectures, including Faster R-CNN, DETR, and RF-DETR. Among them, RF-DETR achieved the highest detection accuracy with an AP@0.5 of 90.3% and AP@0.5:0.95 of 70.6%. Faster R-CNN followed with AP@0.5 of 86.2% and AP@0.5:0.95 of 60.8%, while DETR scored 77.5% and 54.7% on the same metrics. In terms of small object detection, Faster R-CNN reached the highest AP-small value (18.1), while RF-DETR obtained the highest values for AP-medium and AP-large categories.
As shown in Figure 4, RF-DETR demonstrates superior performance under stricter IoU thresholds and achives higher Recall compared to Faster R-CNN and DETR.

4.1.2. Class-Specific BBox Accuracy

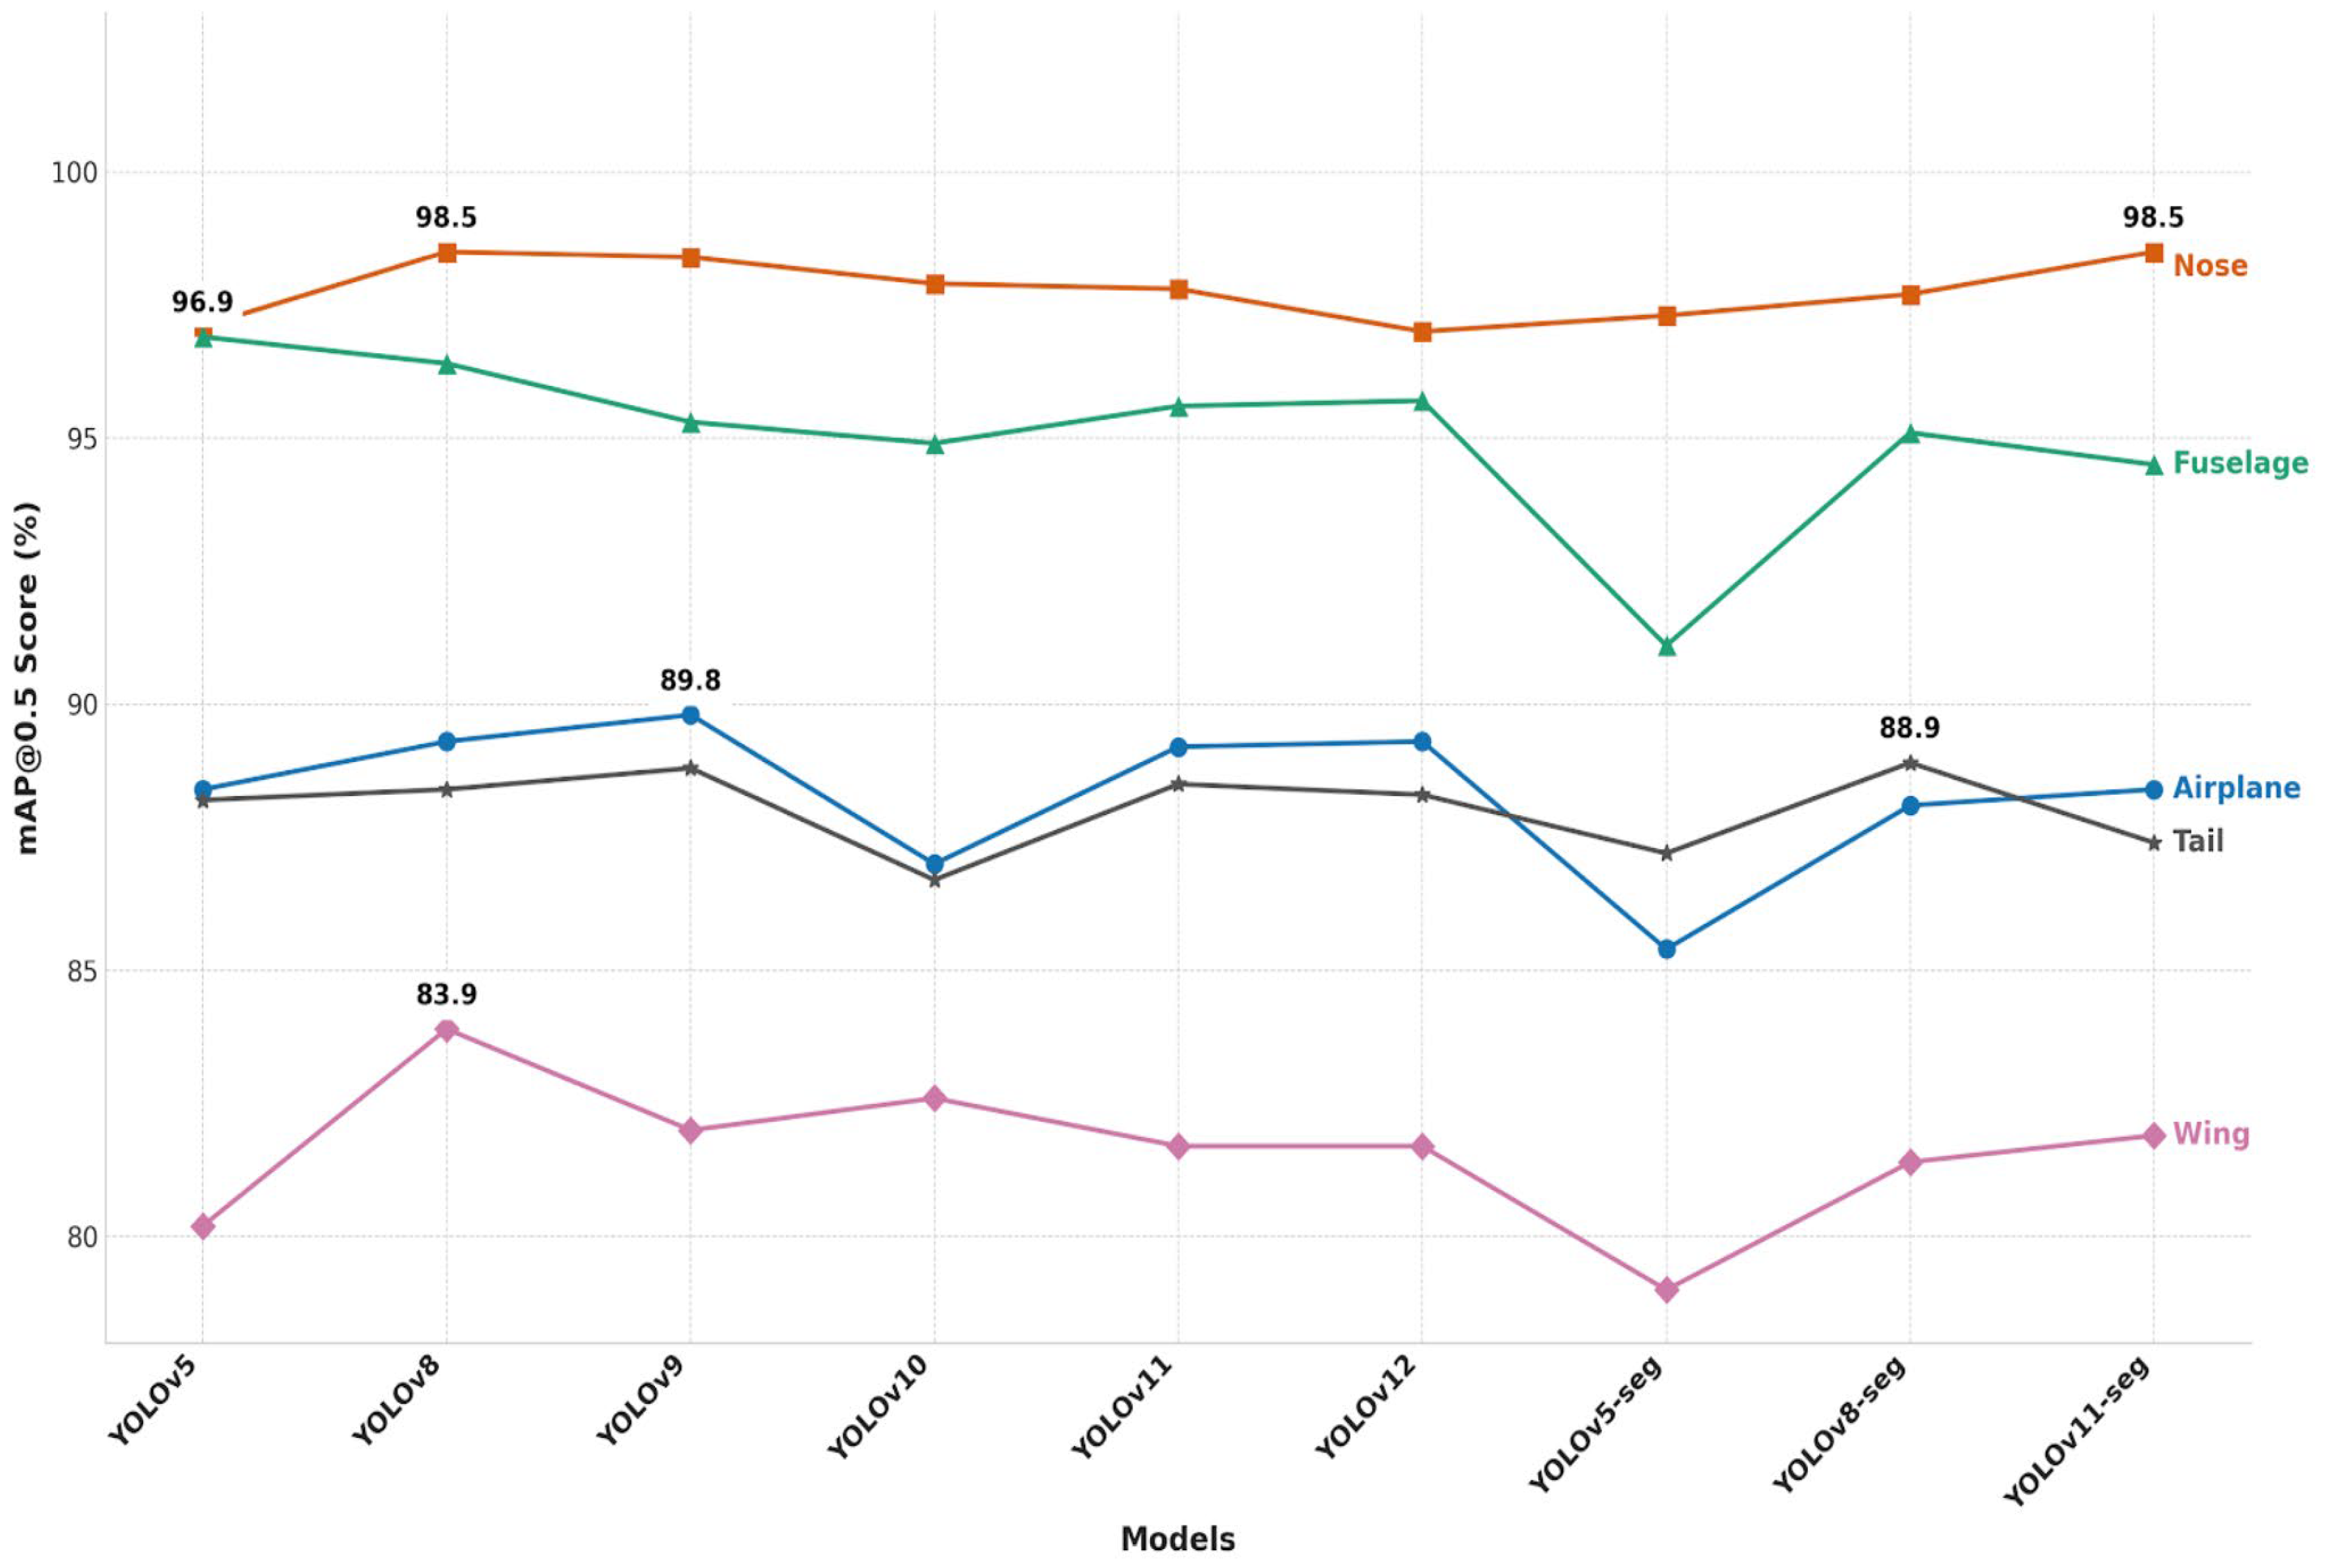
Table 7 summarises the class-wise detection performance mAP@0.5 of all evaluated YOLO models across five aircraft-specific categories. It provides individual mAP scores for the Airplane, Nose, Fuselage, Wing, and Tail classes, along with the average mAP across all categories. Among the standard object detection models, YOLOv8 reached the highest average mAP score across all classes 91.3%. In terms of individual categories, YOLOv9 achieved the highest mAP for the Airplane class 89.8%, while YOLOv8 and YOLOv11-Seg both reached the top score 98.5% for the Nose class. YOLOv5 recorded the highest mAP 96.9% for the Fuselage class. Notably, YOLOv8-Seg achieved the best result for the Tail class 88.9%.
Figure 5 was generated based on the class-wise detection results in Table 7. Class-based detection performance mAP@0.5 of YOLO models across five aircraft-related categories. Best scores for each class are shown in bold.Across all evaluated models, the Nose class consistently showed the highest mAP@0.5 scores, indicating it was the most accurately detected aircraft component. In contrast, the Wing class received the lowest scores across all models, suggesting it posed the greatest challenge for detection. The Aircraft and Tail classes demonstrated moderate performance levels.

4.1.3. Mask Performance of Segmentation Models

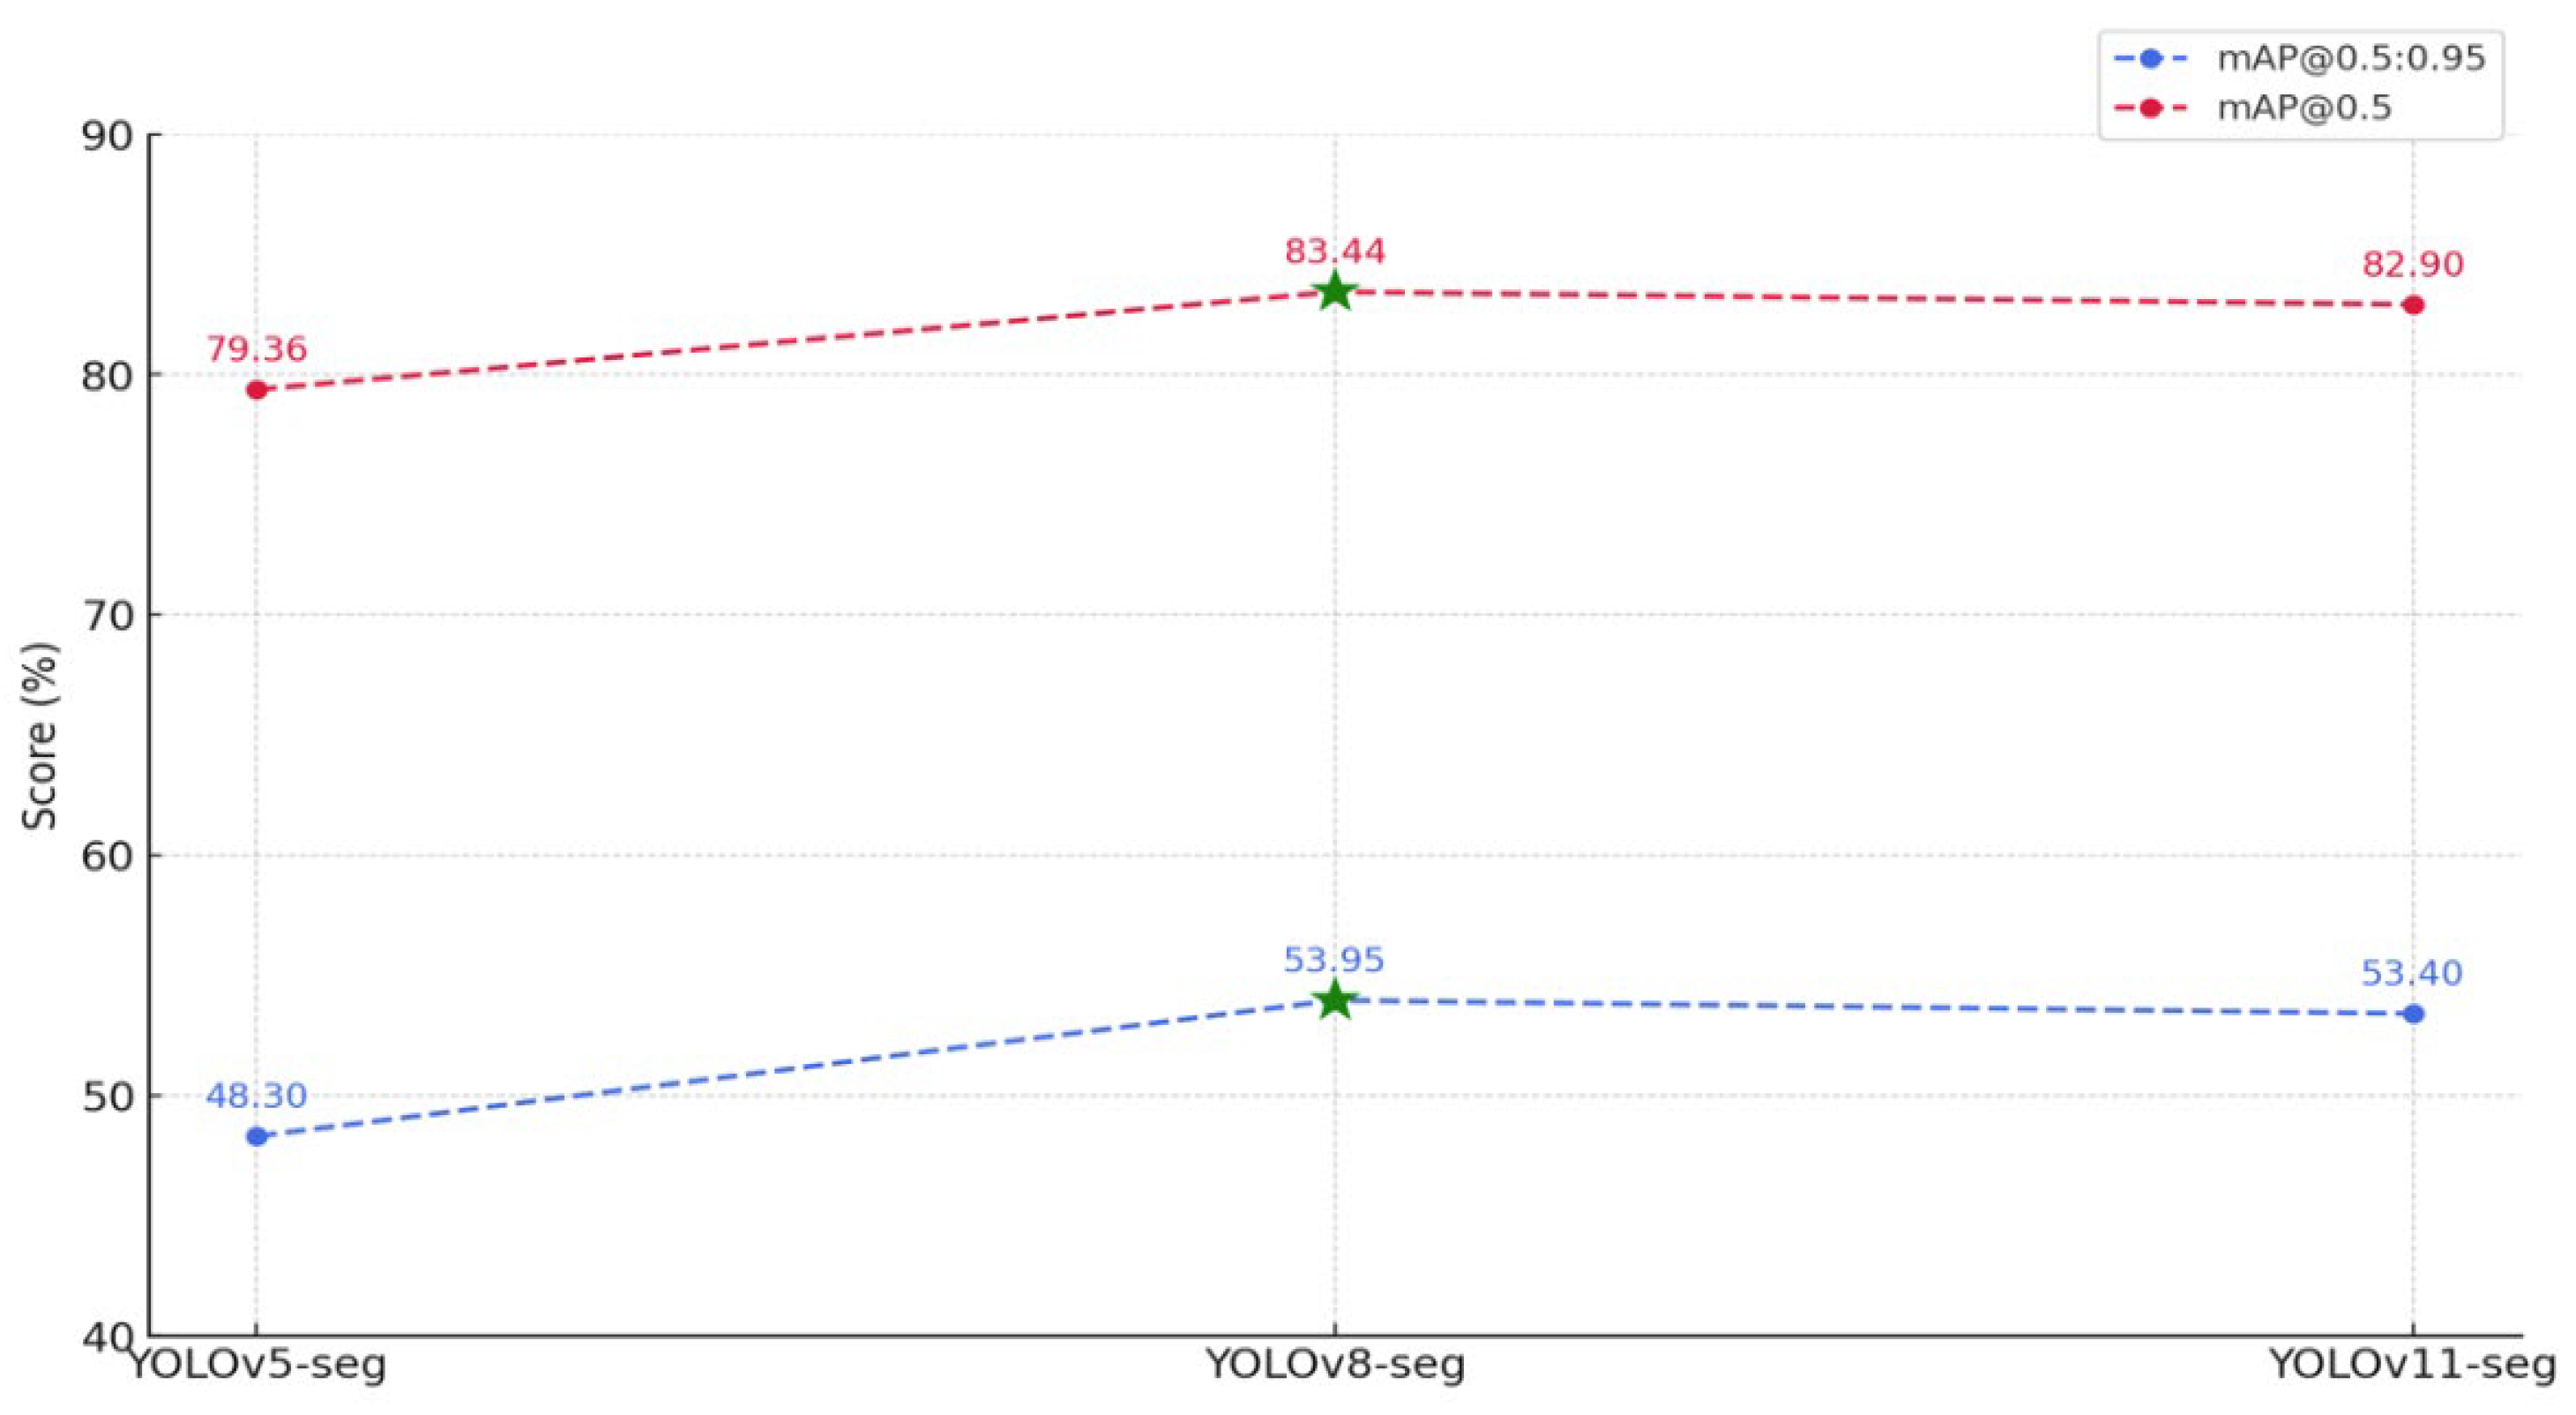
The segmentation performance of YOLOv5-Seg, YOLOv8-Seg, and YOLOv11-Seg was evaluated using mask-based metrics, including mAP@0.5:0.95, mAP@0.5, precision, recall, F1 score, and Validation Segmentation Loss. Results are summarised in Table 8, with visual comparisons provided in Figure 6 and Figure 7.
Table 8 summarises the segmentation performance of the YOLO-Seg models. YOLOv8-Seg achieved the highest scores in mAP@0.5 with 83.44%, mAP@0.5:0.95 53.95%, Recall 82.81%, and F1-score 83.91%. YOLOv11-Seg attained the top Precision at (85.74%). In terms of FPS, YOLOv5-Seg recorded the fastest inference speeds 108.28 FPS on CCTV and 104.17 FPS on MSFS videos. In addition, the lowest validation segmentation loss (0.0296) was achieved by YOLOv5-Seg.

4.1.4. Class-Specific Segmentation Mask Accuracy

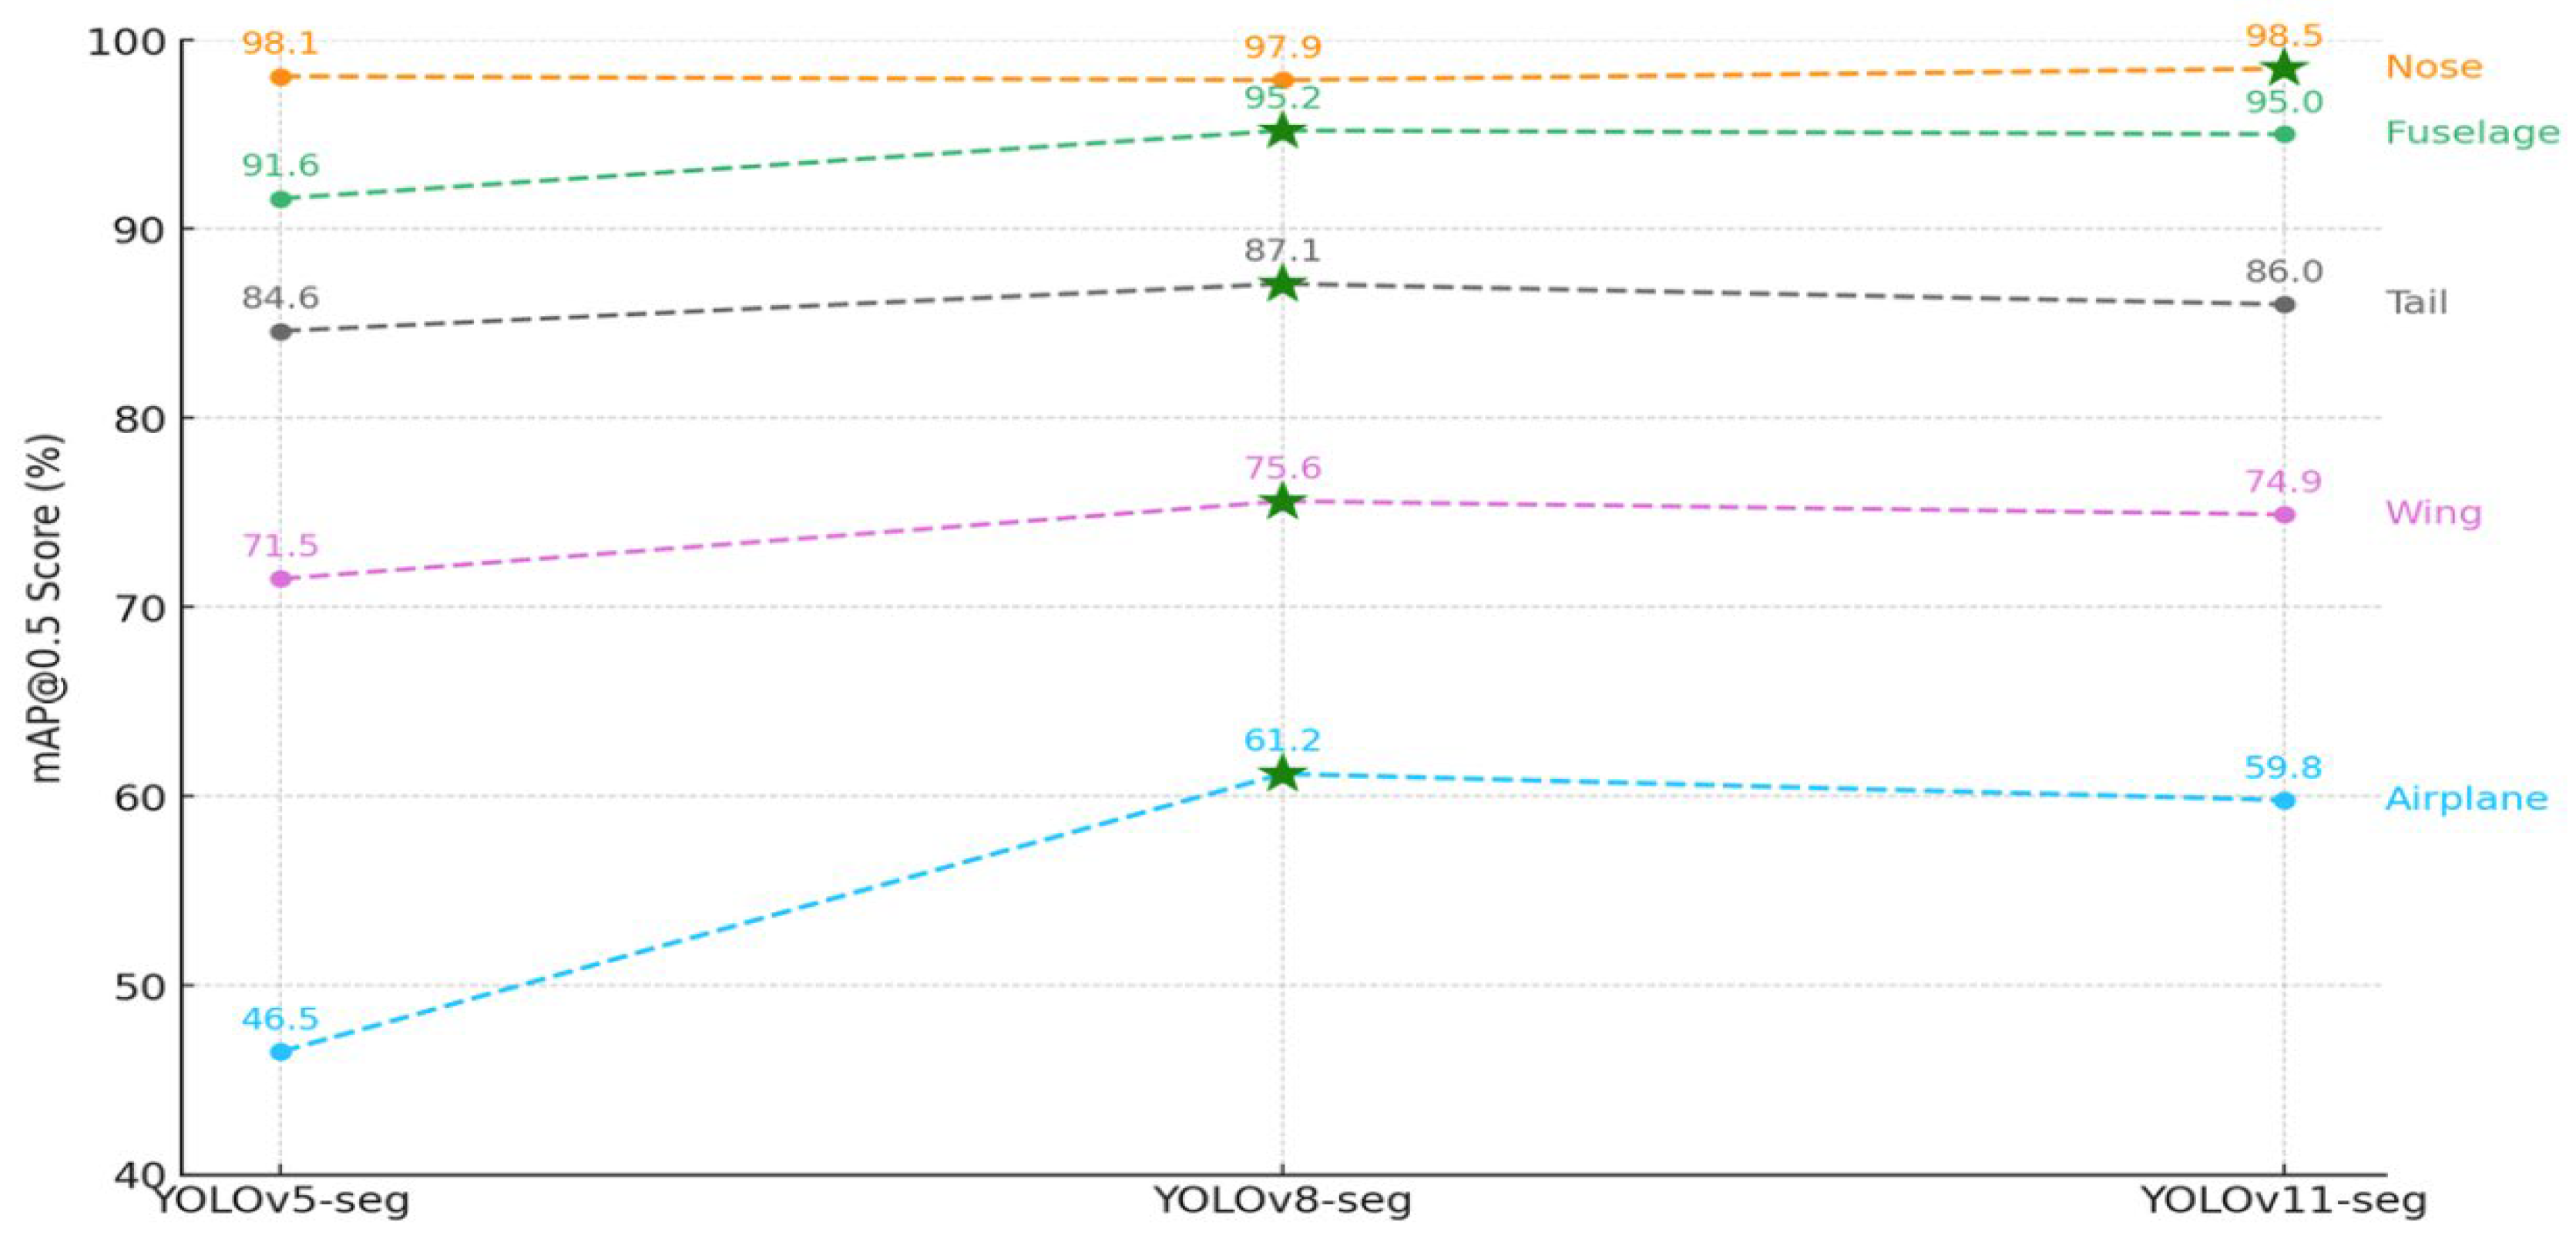
The class-spesific mask segmentation performances of the YOLO variants are summarised in Table 9 and visualised in Figure 7. Considering the average values for all components, YOLOv8-Seg reached the highest accuracy with 83.4%. YOLOv11-Seg performed closely with 82.8%, while YOLOv5-Seg stayed behind the other models with 78.4%.
Comparing the aircraft and all other components, the YOLOv8-Seg model achieved the highest results except for the Nose class. The newer model, YOLOv11-Seg, achieved 98.5% accuracy only in the Nose class, exceeding the (97.9%) accuracy of YOLOv8-Seg. The performance trend illustrated in Figure 8 indicates that the Nose class achieved the highest segmentation accuracy across all models, followed by the Fuselage and Tail classes. In contrast, the composite Airplane class consistently proved to be the most challenging to segment. Based on the quantitative results from Table 5, Table 8 and Table 9 and Figure 8, YOLOv8-Seg demonstrated the best overall performance among the segmentation models.

4.1.5. Failure Mode Analysis: FP/FN Comparison on Wing and Tail Classes

In previous sections, the quantitatively identified the ‘Wing’ and ‘Tail’ classes as the most challenging components due to the complexity of the apron environment (see Figure 5). An analysis was conducted to quantitatively deepen this finding and uncover the main failure modes specific to these classes. In this section, the False Positive (FP) and False Negative (FN) counts for these classes for the three main models were compared using raw count data obtained from unnormalised confusion matrices. The findings, along with the Precision and Recall values, were calculated based on these raw counts.
The quantitative findings presented in Table 10 indicate that the error trends of the models differed significantly across classes. This difference was particularly evident in the Wing and Tail classes. The Wing class was the only class consistently dominated by False Negatives (FN) across all models. FN values ranging from 52 to 73 indicate that the detection rate of wing components remained relatively low, with recall values ranging from 72.1% to 78.5%. In contrast, the error distribution in the Tail class varied depending on the model architecture. While FN > FP was observed in the YOLOv8 model, a trend towards FP > FN was observed in the YOLOv8-Seg and YOLOv9 models. This change suggests an increase in the number of FP in the Tail class and a partial decrease in precision values. In general, the models exhibited a tendency towards under detection FN in the Wing class and a tendency towards FP in the Tail class.

4.1.6. Statistical Robustness Analysis via Repeated 10-Fold Cross-Validation

Initial benchmarking provided a comparative performance overview based on a fixed validation split. However, a more rigorous validation protocol was implemented to ensure that the observed performance differences were statistically significant and not an artifact of a particular data partition. This is particularly critical for datasets of limited size, where performance metrics can exhibit high variance across different data splits.
Therefore, a 10-fold cross-validation experiment was conducted to evaluate the statistical robustness and stability of the highest-performing models: YOLOv8, YOLOv8-Seg, and the newly proposed YOLOv11-Seg. The dataset was divided into 10 mutually exclusive folds. In each of the 10 iterations, one fold was reserved as the test set (10%). Of the remaining nine layers (90%), one layer served as the validation set (10%), while the other eight layers (80%) served as the training set.
This process was repeated 10 times, ensuring that each layer was used exactly once for testing. The mean (μ), standard deviation (σ), and 95% confidence intervals (CI) of mAP@0.5:0.95 and mAP@0.5, key performance metrics for both the BBox and segmentation mask tasks, were calculated across all 10 layers. This approach provides a robust estimate of the models’ generalisation performance and quantifies the uncertainty associated with point estimates.
The quantitative findings of the 10-fold CV protocol are summarised in Table 11. This table lists the mean (μ), standard deviation (σ), 95% confidence interval and Bootstraps, and values of the three best-performing models (YOLOv8, YOLOv8-Seg, YOLOv11-Seg) on the key metrics, mAP@0.5:0.95 and mAP@0.5.
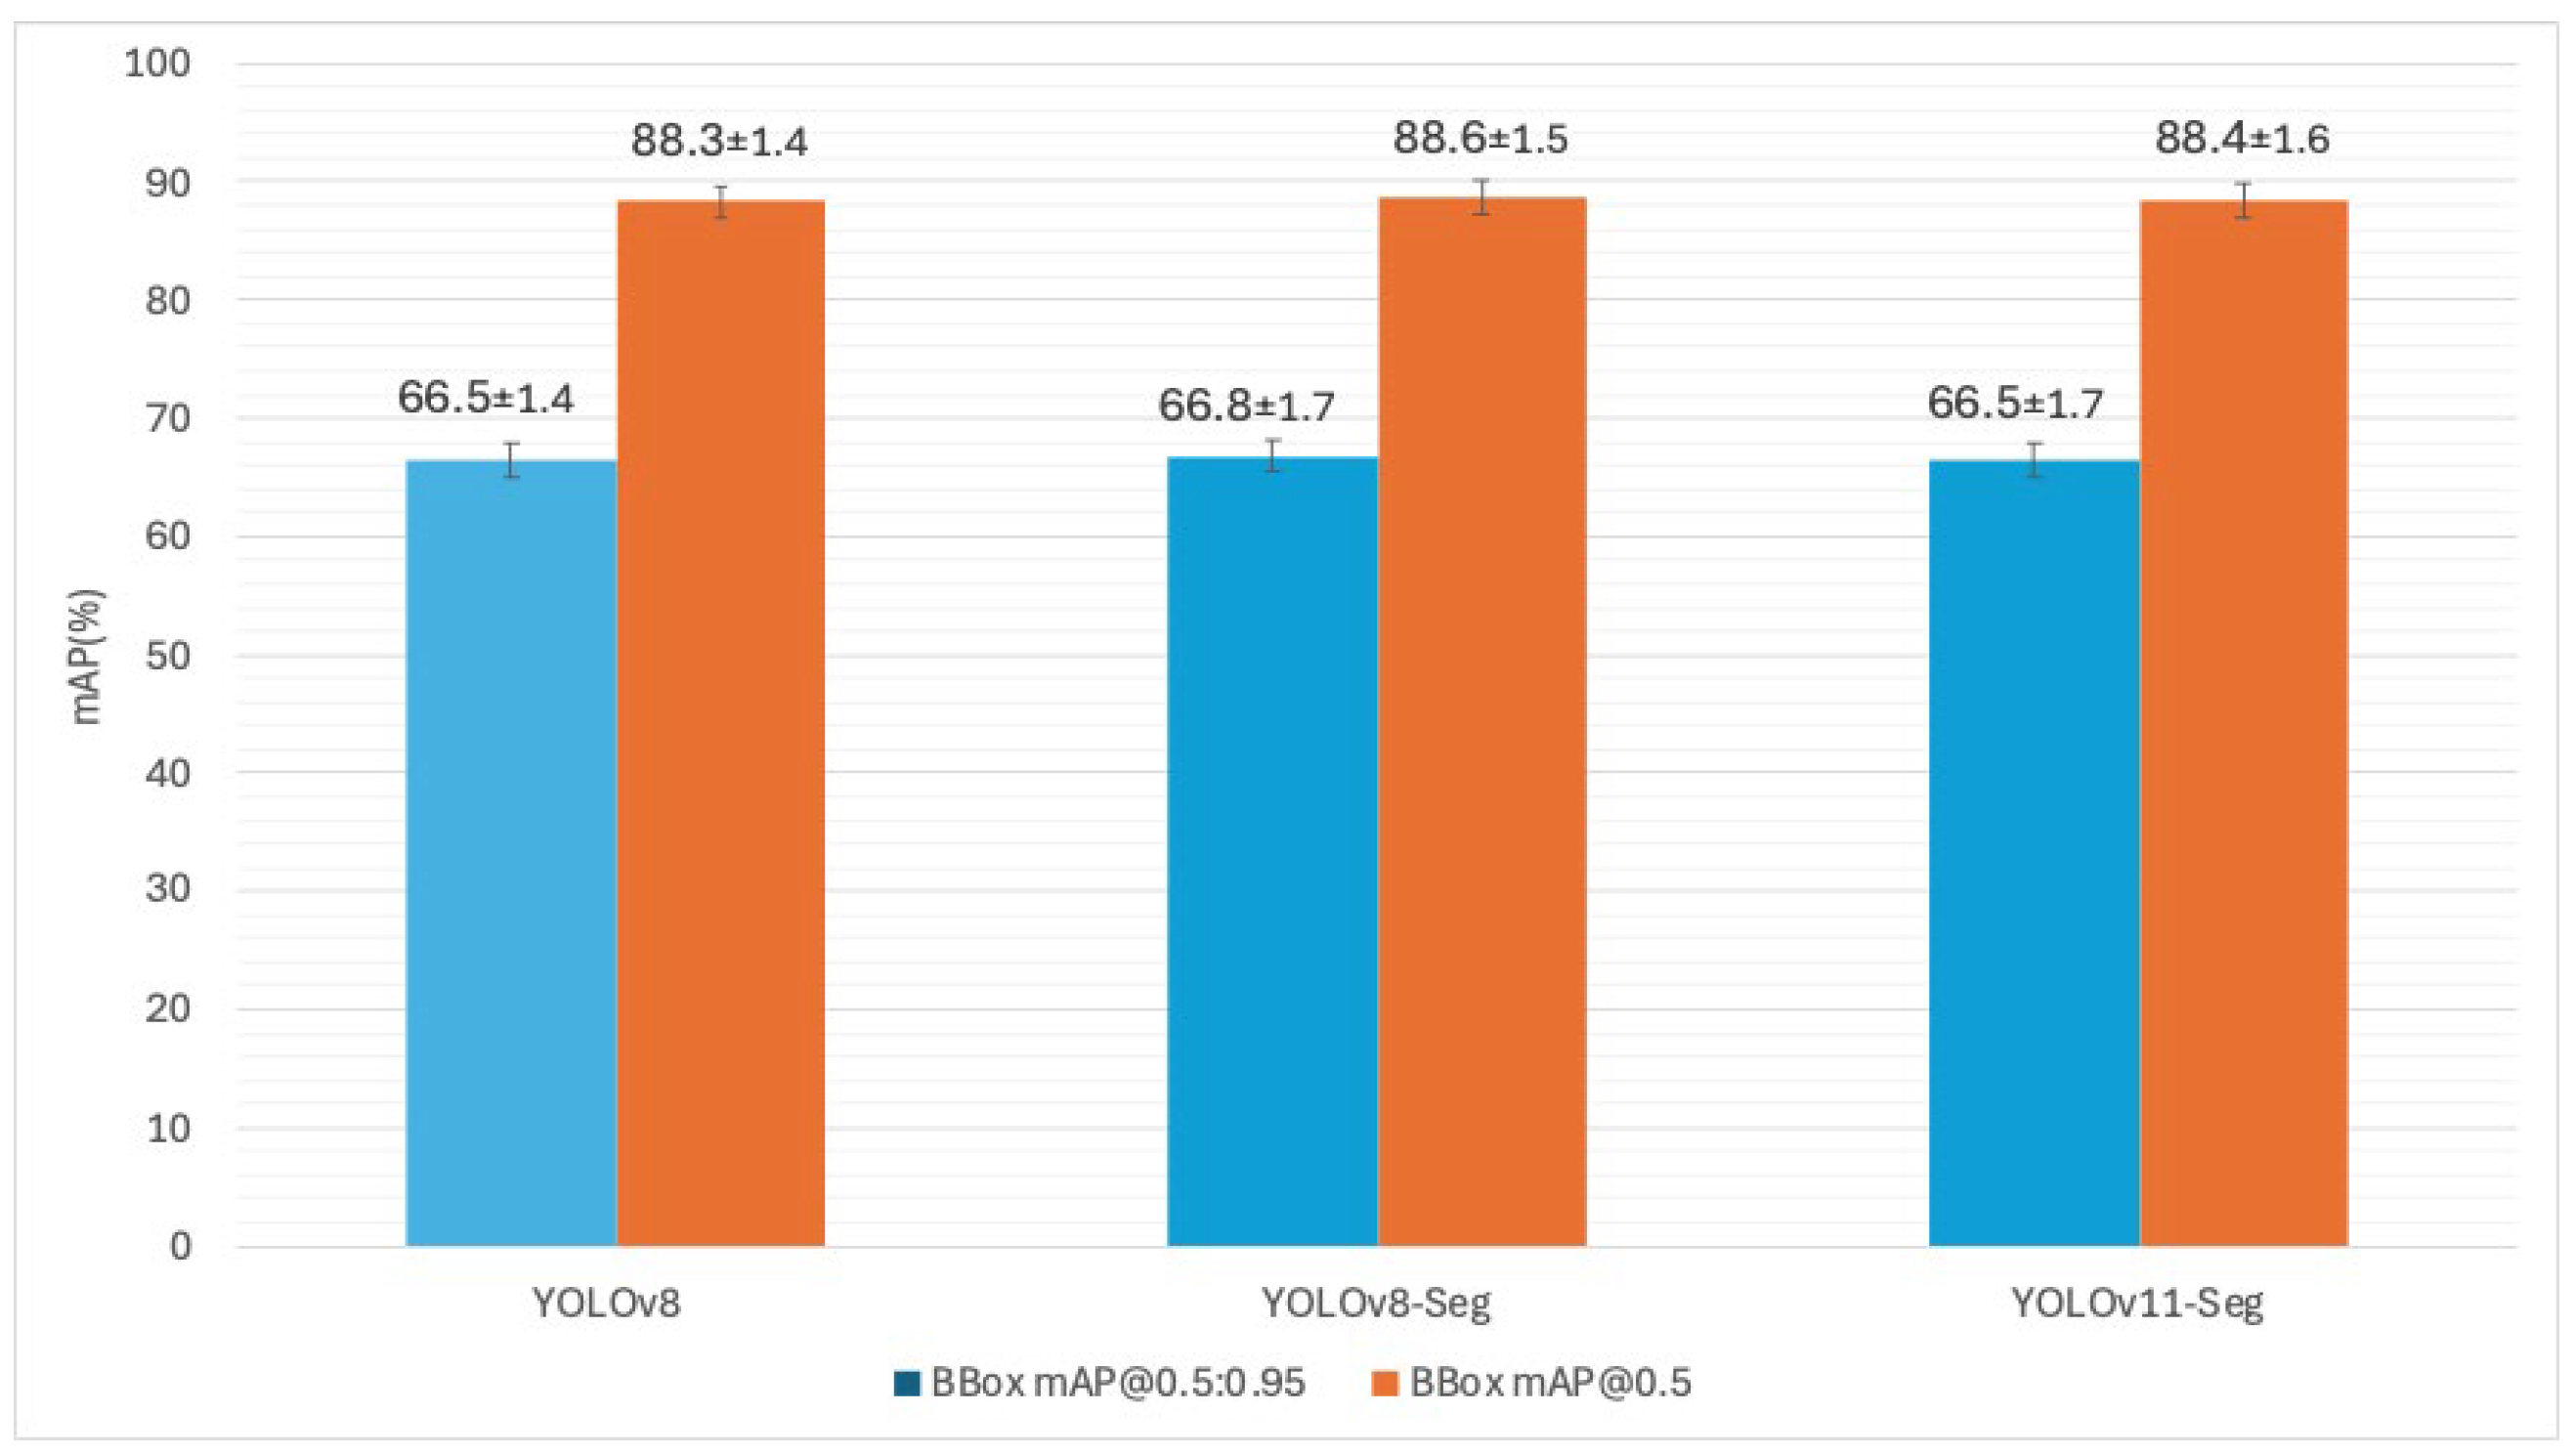
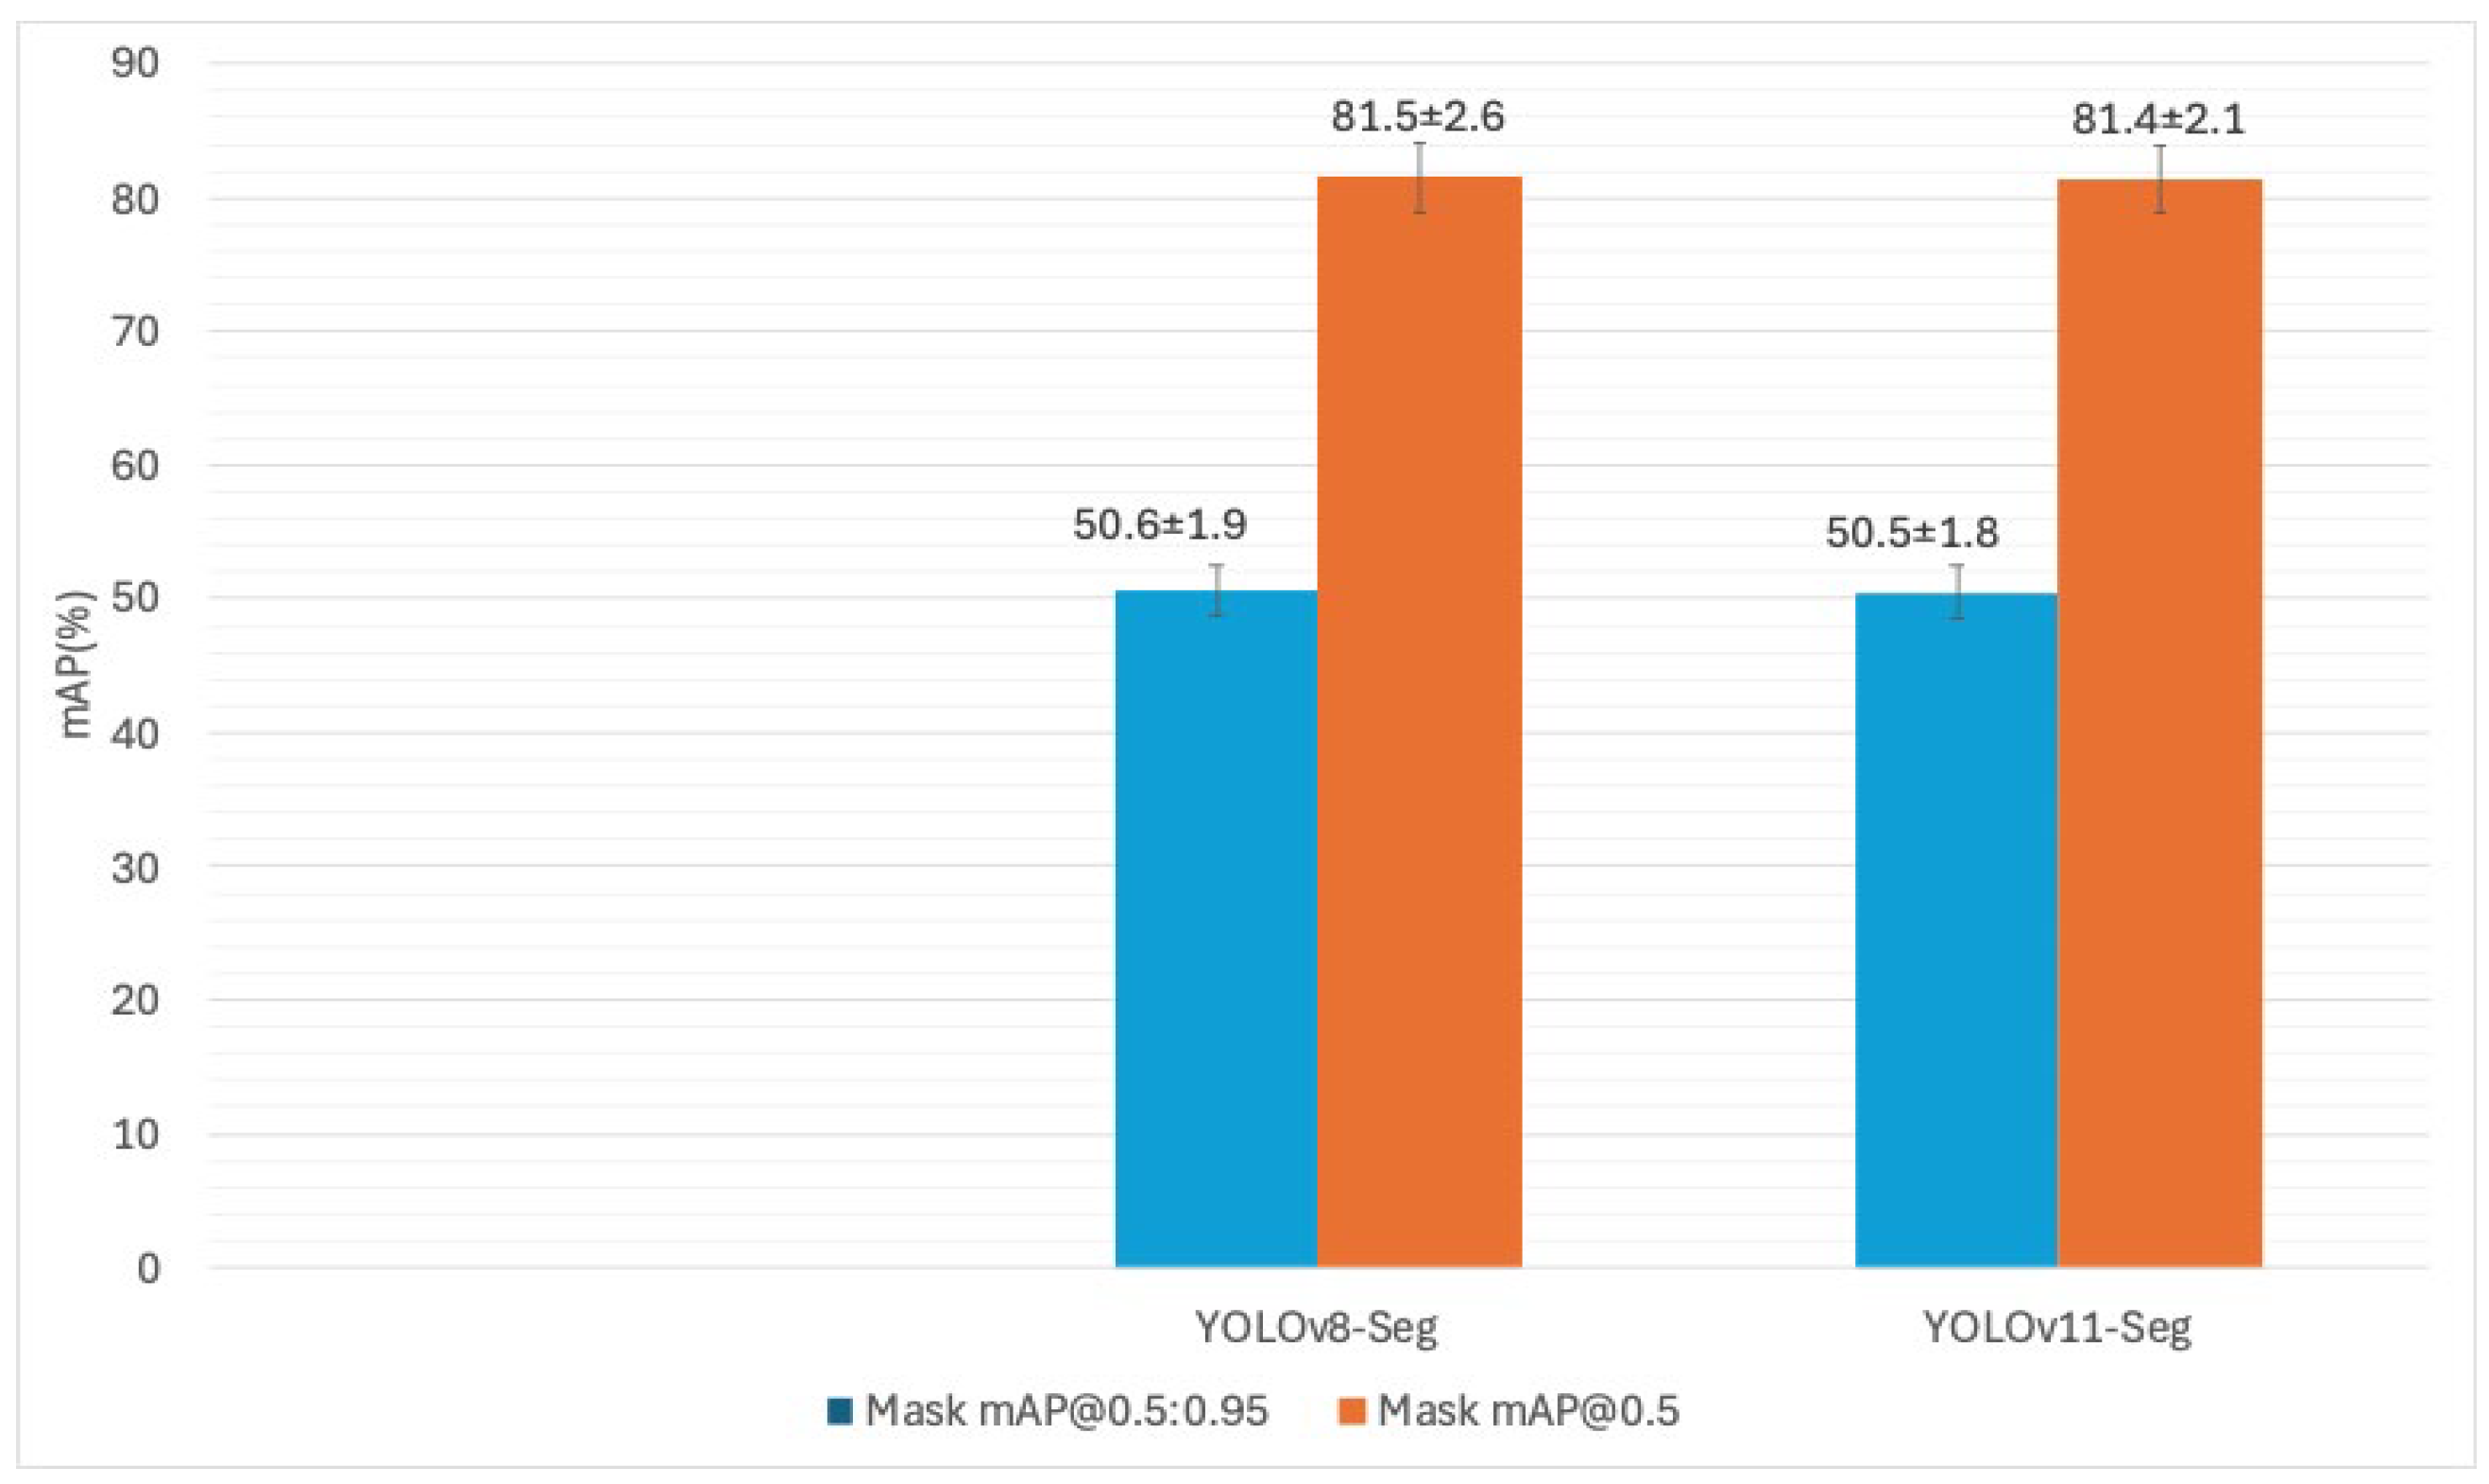
The presented data demonstrates high stability of the results across 10 folds. All models showed low standard deviations, σ ≤ 1.7% for the BBox mAP@0.5:0.95 metric and σ ≤ 1.6 for the BBox mAP@0.5 metric. While the standard deviation for the mask performance (σ ≈ 1.9% and 2.6) was slightly higher, overall stability was maintained. The 95% confidence intervals estimated using t-based analytical method and the non-parametric bootstrap approach were highly consistent across all metrics, confirming the statistical reliability of the reported mean values. When the average performance values are examined, it is seen that the YOLOv8-Seg model achieves the highest average score in all four tested metric categories (BBox mAP@0.5:88.6%, Mask mAP@0.5:81.5%). For a clearer comparison and visualisation of these statistical findings, mean performance values and 95% confidence intervals are presented in two separate figures.
Figure 9 compares the performance of all three models on BBox tasks. It visually confirms that the average performance of all three models is very close to each other on the mAP@0.5 range 88.3–88.6% and mAP@0.5:0.95 range 66.5–66.8% metrics. As the error bars indicate, the differences between the models’ BBox performances are statistically narrow.
Figure 10 focuses on the performance of two models with segmentation capabilities on mask segmentation tasks. YOLOv8-Seg mAP@0.5 with81.5% achieved a slightly higher average mAP@0.5 score than YOLOv11-Seg mAP@0.5 with 81.4%. The mAP@0.5:0.95 performance of both models is also similarly close 50.6% and 50.5%, respectively. The variation in mask results of ±1.8–2.6% is acceptable for the reliability of 10-fold validation tests.
Finally, the 95% confidence intervals obtained in the Bootstrap analysis almost overlap with the t-based intervals, supporting the statistical stability of the measurement.

4.1.7. Qualitative Performance Evaluation in Challenging Apron Scenarios

To complement the quantitative measurements, the results of the best-performing models are presented with numerical data. YOLOv9 and YOLOv8 achieved the highest success in detection tasks, while YOLOv8-Seg achieved the best results in segmentation tasks. Therefore, these three models were selected for comparative testing in challenging apron scenarios. The aim was to observe the models’ behaviour in real airport conditions, where visibility, geometry, and background complexity create uncertainties. The visual results provide additional insight into the numerical comparisons by revealing false negatives, false positives, boundary inconsistencies, and segmentation redundancies.
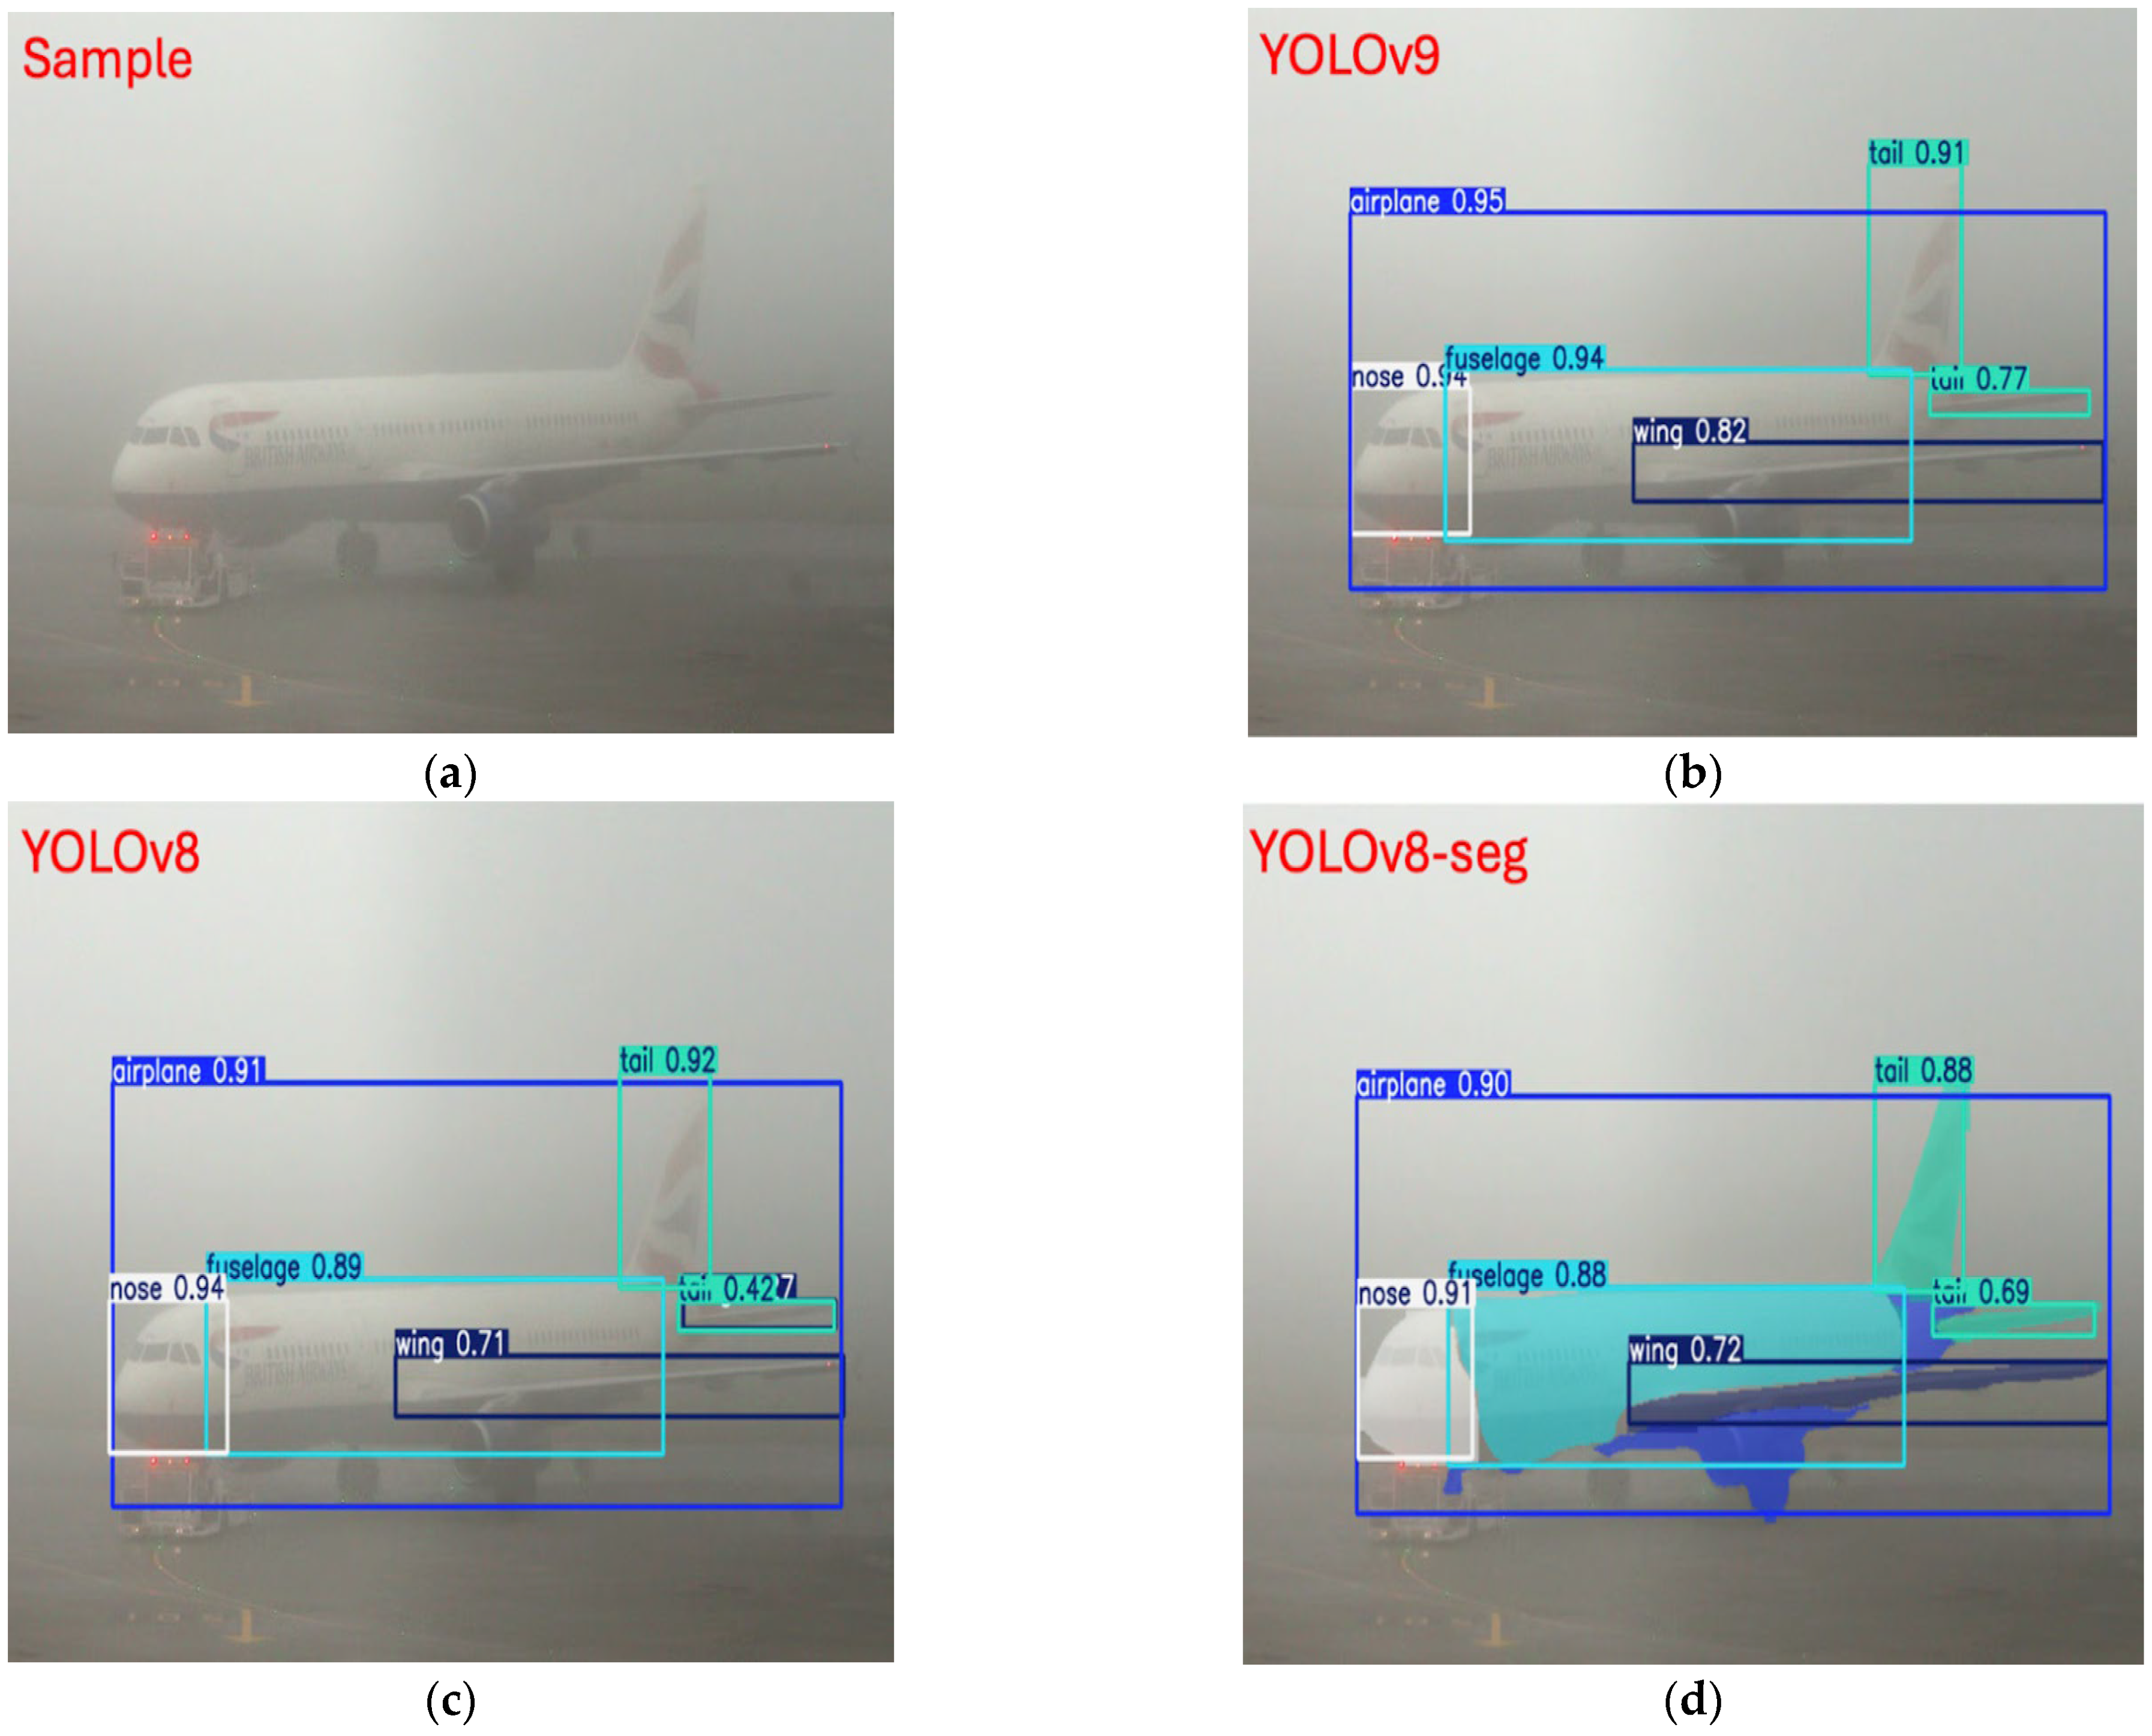
Scenario 1: Detection Under Foggy Apron Conditions
The first scenario in Figure 11 was obtained at an airport in dense fog, with low visibility and poor visibility between the aircraft and its surroundings.
According to visual results, YOLOv9 showed the best performance locating all ma- jor aircraft parts with high accuracy. YOLOv8 also produced generally stable results; however, the accuracy in wing detection was slightly lower. In addition, YOLOv8-Seg successfully distinguished the aircraft’s fuselage class and correctly masked the other classes. Overall, the results confirm that all three models were able to operate effectively despite the severe degradation in visual clarity.
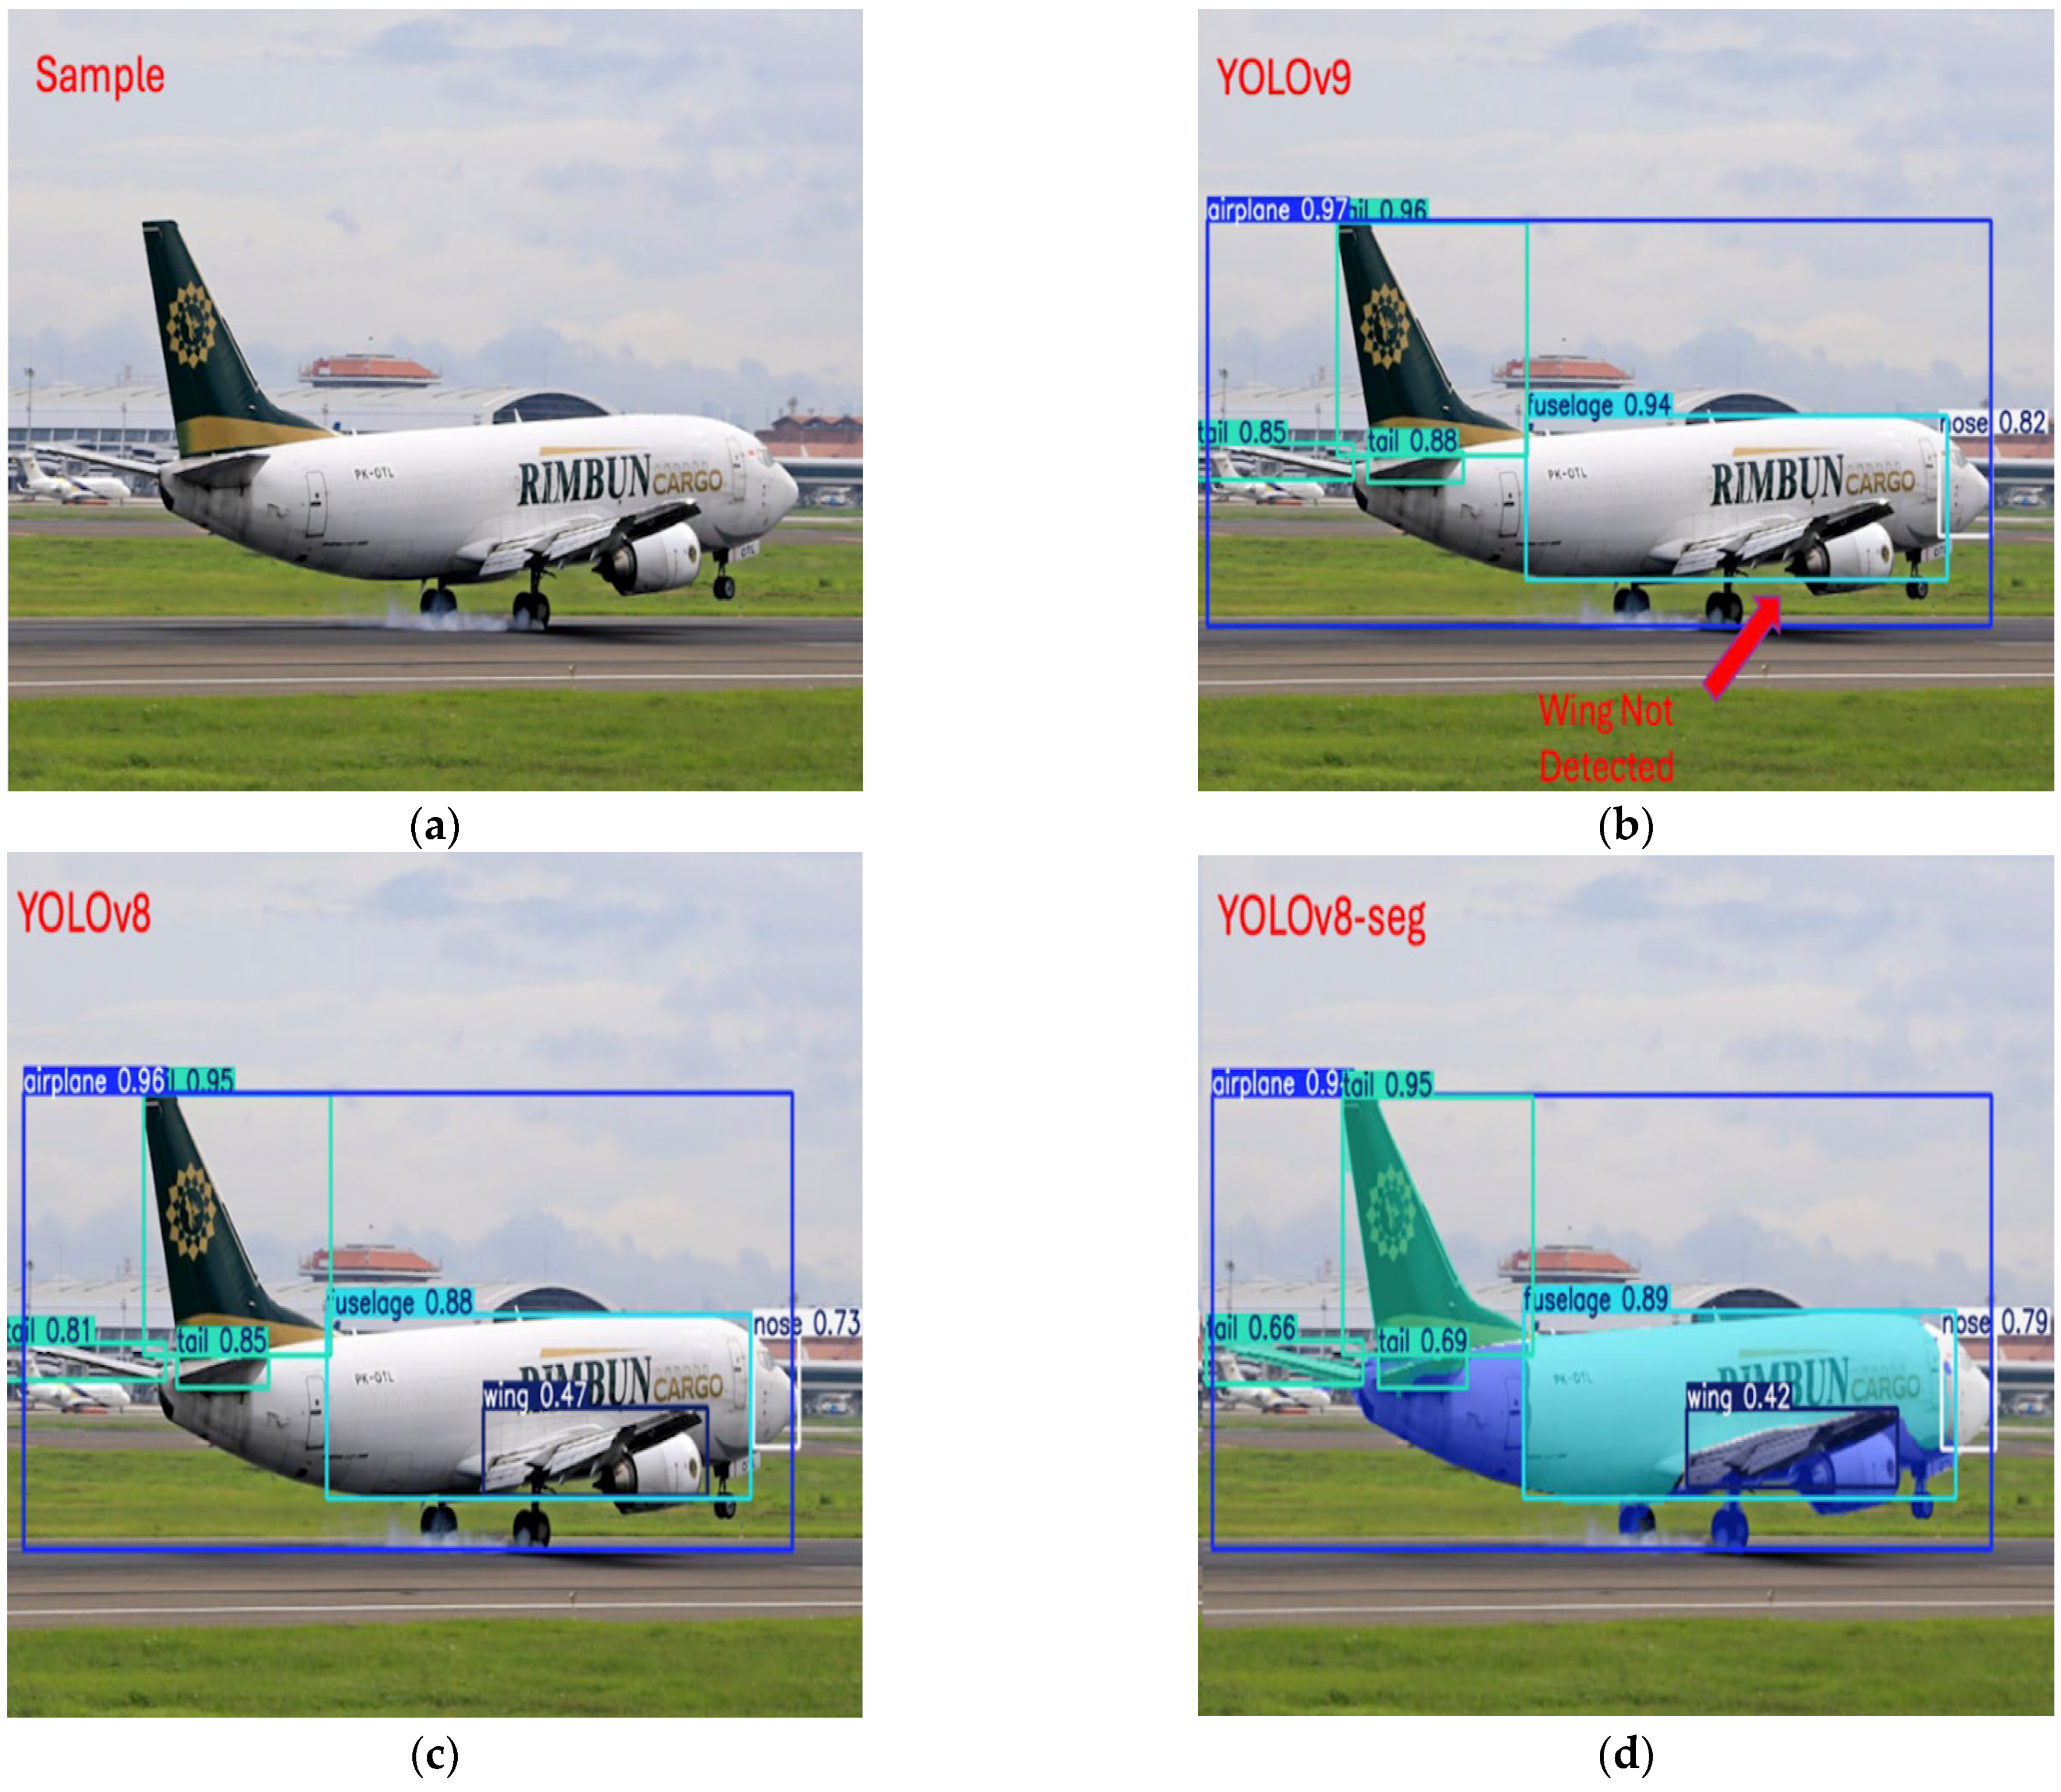
Scenario 2: Detection Under Clear Visibility Conditions
Under clear weather conditions, all three models achieved high detection accuracy for large structures such as fuselage and tail. However, YOLOv9 failed to detect the wing in one case, resulting in a false negative. YOLOv8 maintained reliable detection across all classes, while YOLOv8-Seg provided the most visually understandable output with bounding boxes and masks. Overall, these results confirm that all three models perform strongly when visibility is optimal. In such conditions, only isolated errors were observed, mainly in the wing class. Under clear visibility conditions, the qualitative comparison in Figure 12 demonstrates how YOLOv9, YOLOv8, and YOLOv8-Seg differ in wing detection accuracy and mask interpretability.
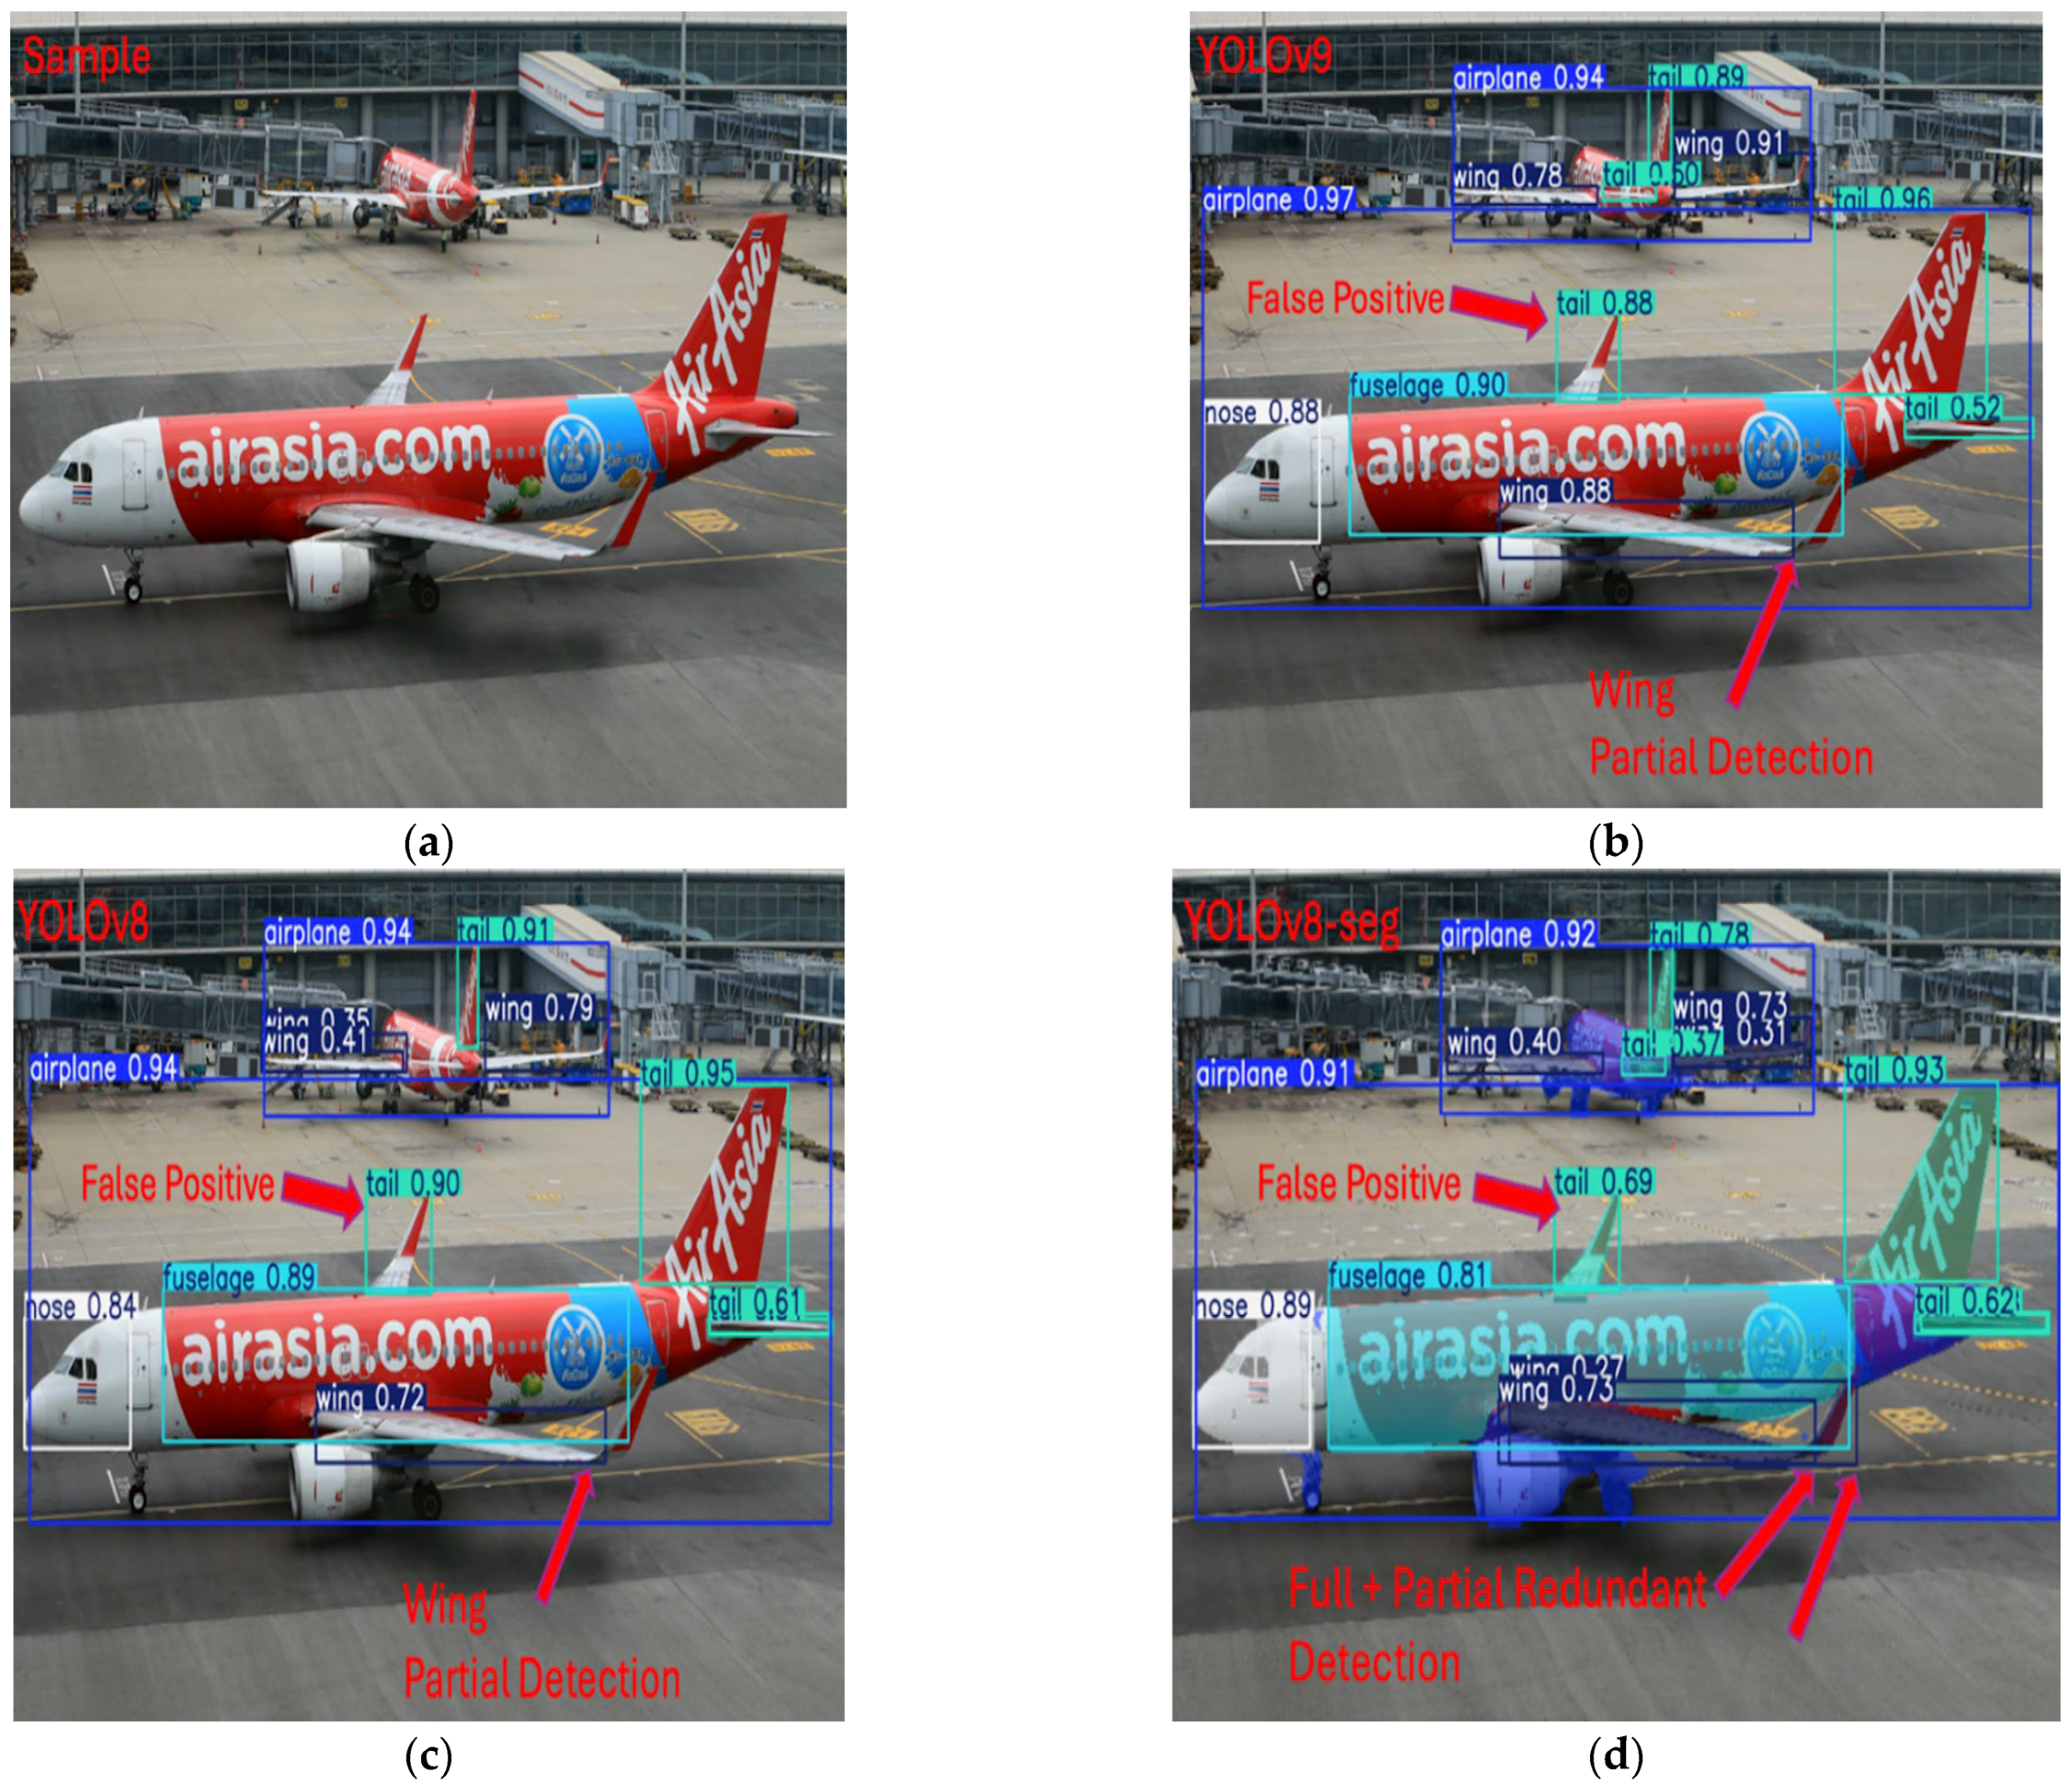
Scenario 3: Detection Under Complex Background and Geometric Challenges
In dense apron scenarios, all models demonstrated robust detection of primary aircraft components (fuselage, nose, tail) but faced challenges with fine geometrical details like ailerons and wingtips. YOLOv8-Seg delivered the most comprehensive segmentation by uniquely identifying complex structures such as the left wing and its aileron, though with some redundant detections. In contrast, YOLOv9 produced the cleanest outputs with minimal background noise. The results confirm that fine structural segmentation remains a challenge in complex environments, despite high performance on major components. Representative qualitative results under this scenario are illustrated in Figure 13.
Overall, these three qualitative scenarios demonstrate the complementary strengths of YOLOv9 (high detection success in low visibility conditions), YOLOv8 (balanced performance across scenarios), and YOLOv8-Seg (enhanced interpretability through masks). Consequently, these scenarios provide a more general basis for the use of CV systems in operational apron environments for safety.

4.2. Ablation Study on YOLOv-8-Seg

4.2.1. Bounding-Box Detection Performance After Optimisation

The ablation study was conducted to systematically evaluate the effect of incremental optimisation strategies applied to the YOLOv8-Seg baseline model. Eight optimisation steps were individually tested, each targeting a specific component of the pipeline such as loss function replacement, inference efficiency adjustments, hyperparameter refinements. Finally, the most effective steps were combined in a single model, which was then trained to evaluate the overall improvement.
Table 12 shows the individual Bounding Box results of eight different optimisation steps applied to the YOLOv8-Seg model. All optimisation steps, excluding the loss function adjustment, were selected based on their individually validated performance gains and subsequently integrated to retrain the YOLOv8-Seg base model. According to the results, the optimised model achieved a 6.17 p.p. increase in the mAP@0.5:0.95 metric. In addition, other best values were obtained for mAP@0.5, Precision, F1 Score, Val Box Loss, and Val Cls Loss.

4.2.2. Segmentation Performance After Optimisation

Table 13 shows the results of the mask optimisation steps of the YOLOv8-Seg model. The model’s mask performance followed a similar trend to the BBox results in Table 12. Single-step improvements progressed increasingly, while all steps exluded Loss Func. Replacement step were merged in the combined configuration. This combined model achieved the highest mAP@0.5 88.17% and mAP@0.5:0.95 with 61.99% values. It also achieved the highest results in Precision, Recall, and F1 Score metrics.
In addition, the optimisation steps applied individually for the YOLOv8-Seg model and the results of the final combined model for mAP@0.5:0.95 and mAP@0.5. Specifically, the combined model achieves an 8.04 p.p. improvement compared to the baseline model.

4.2.3. Class-Specific Segmentation Mask Accuracy After Optimisation

Table 14 details the mask performance of the optimisation steps applied to the base YOLOv8-Seg model for the aircraft components and overall performance. The combined optimisation strategy reached the highest mean accuracy 88.2% across all classes. A significant improvement was observed for the challenging Airplane class, where performance increased from 61.2% to 72.7%. A notable gain was also recorded for the Wing class, which improved from 75.6% to 85.5%. For the already high-performing Nose class, accuracy saw a marginal further increase to 98.4%.

4.2.4. Comparative Summary of Baseline and Optimised YOLOv8-Seg Models

To illustrate the collective impact of the optimisation, Table 15 and Table 16 present a direct numerical comparison between the baseline and optimised versions of the YOLOv8-Seg model. The previous subsections detailed the individual effects of each factor in the eight-step optimisation process, inference optimisation, AMP, resolution increase, epoch extension, learning rate adjustment, model scale, and data augmentation. This section presents the final performance values achieved by combining all of these steps and training the model in one go (with the loss function held constant). The results show that collective optimisation significantly improves the overall performance of the model. The optimised model achieved a +6.17 ppm increase in the mAP@0.5:0.95 BBox metric and a +8.04 ppm increase in the mAP@0.5:0.95 Mask metric compared to the baseline version. Moreover, meaningful increases were observed in both evaluation types BBox and Mask at mAP@0.5.
Class-based analyses revealed gains of +11.5 p.p. for Airplane and +9.9 p.p. for Wing, particularly due to their high structural complexity, strongly representing the overall improvement trend of the model. Overall, the combined optimisation steps increased the model’s segmentation accuracy and overall detection stability, demonstrating a synergistic effect between complementary hyperparameter settings.

4.2.5. Qualitative Comparison: Baseline vs. Optimised Model

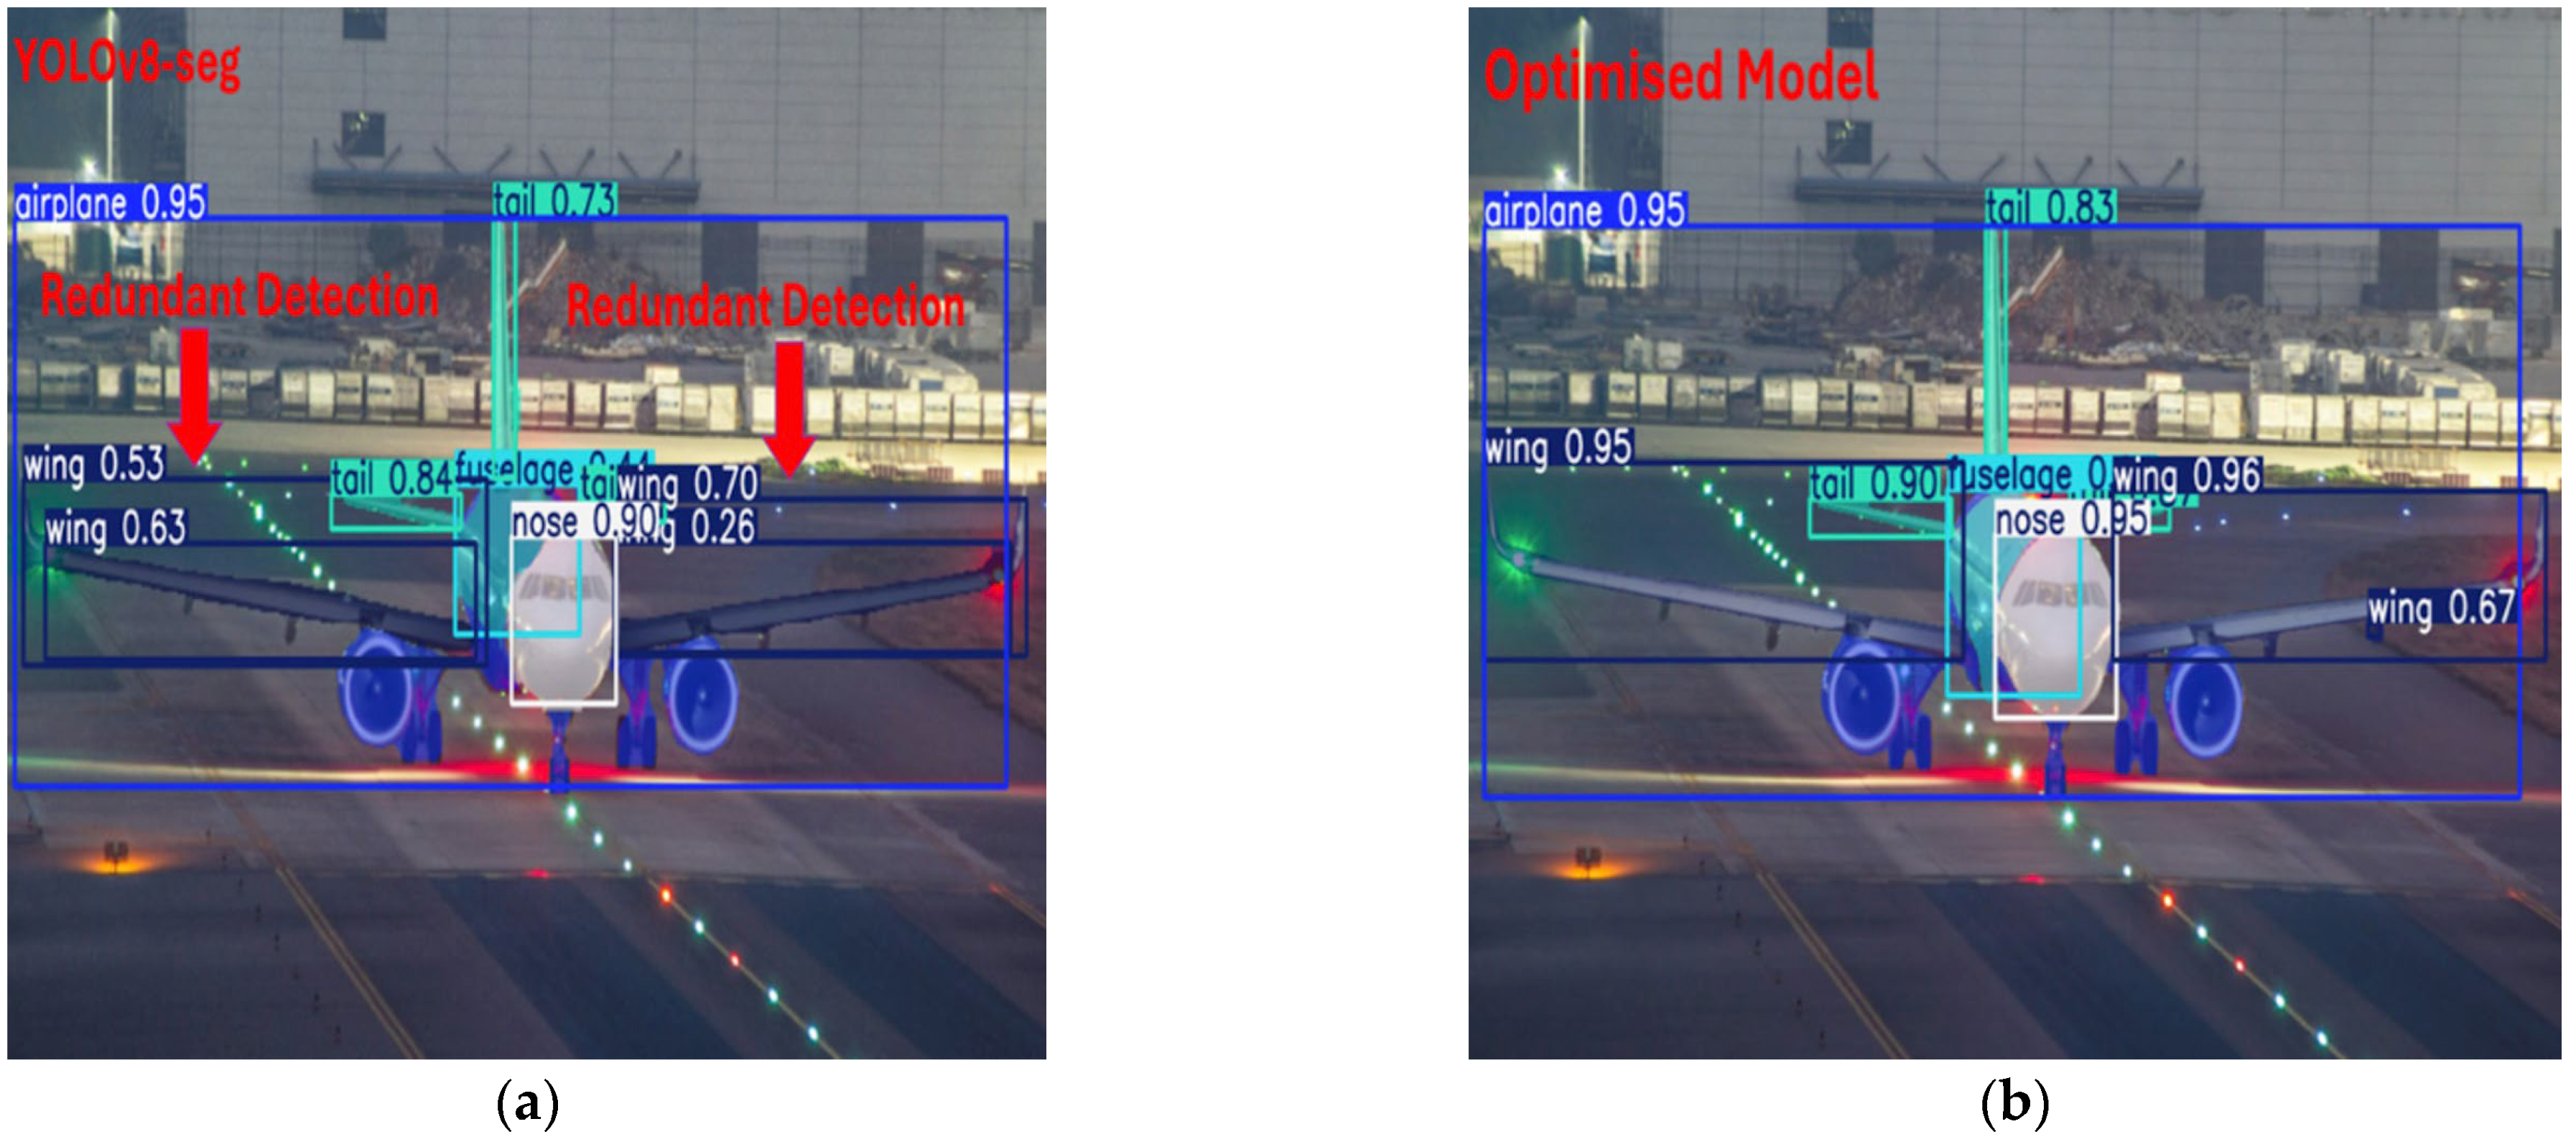
This subsection presents a qualitative comparison between the baseline YOLOv8-Seg model and the final optimised model across different real-world apron scenarios (See Figure 14, Figure 15 and Figure 16). While the quantitative results in the ablation study have already shown the performance improvements of the optimised model, visual inspection will reveal improvements in the optimised model in boundary sensitivity, reduction in redundant detections, and robustness under harsh conditions.
Scenario 4: Detection Reliability Under Optimal Conditions
Under ideal visibility conditions as shown in Figure 14, both the baseline and optimised YOLOv8-Seg models successfully segmented the aircraft and its main components. The optimised model, however, demonstrated superior mask quality by generating more stable component boundaries and significantly higher detection confidence. This improvement is quantified by the increased confidence scores for key components, such as the Wing rising from (55%) to (94%) and the Nose from (81%) to (95%).
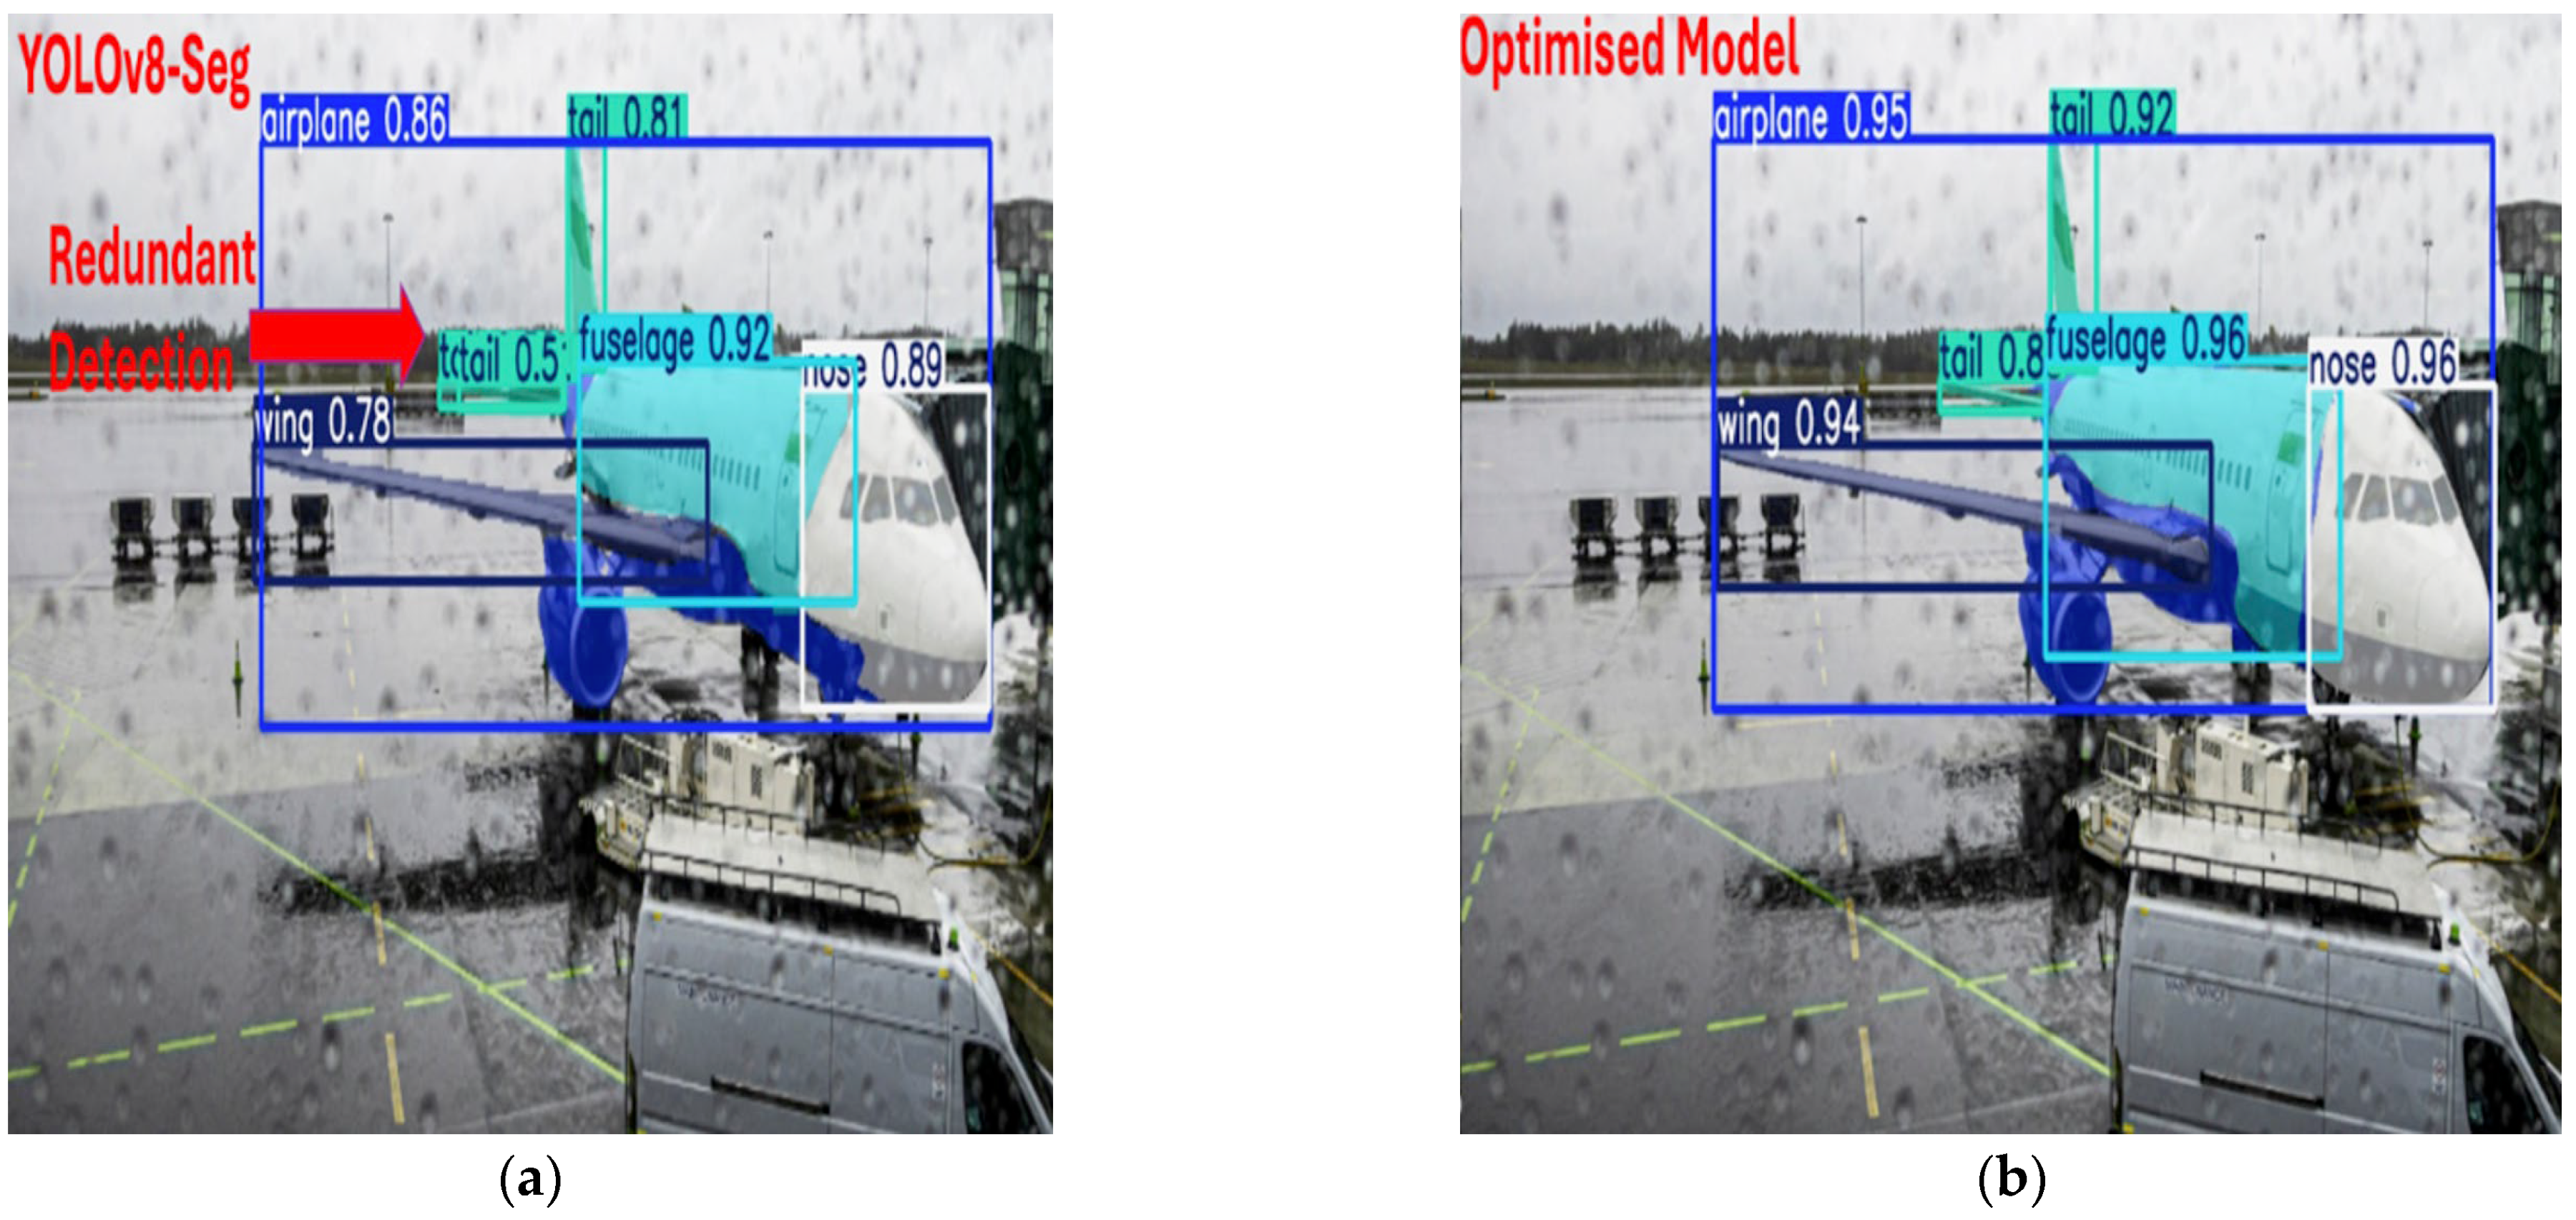
Scenario 5: Robustness Under Low-Visibility and Sensor Noise
Scenario 5 evaluated model performance under heavy rain and sensor noise as shown in Figure 15. The baseline YOLOv8-Seg model successfully detected the aircraft and its components but exhibited instability, producing redundant detections in the tail region with confidence scores of (81%) and (50%) and a low confidence score (78%) for the wing. In contrast, the optimised model eliminated redundancy and generated a single, coherent detection for the tail with a higher confidence of (92%). It also consistently increased confidence scores across all other main components, demonstrating enhanced robustness and detection stability in challenging weather conditions.
Scenario 6: Stability Under Low-Light, Glare, and HDR Conditions
Under low-light conditions with intense runway lighting in Figure 16, the baseline YOLOv8-Seg model produced multiple redundant masks, particularly over the wing regions. The optimised model rectified this issue, correctly segmenting the left and right wings as distinct components. Furthermore, it achieved a substantial increase in detection confidence for main parts, with the fuselage score rising from (44%) to (96%) and the tail from (73%) to (83%), demonstrating significantly improved reliability in a high-contrast nighttime environment.
Overall, the qualitative results indicate that the model optimisation steps reduced redundant detections and improved segmentation consistency across all components and scenarios, particularly under visually challenging conditions.

5. Discussion

Before interpreting the benchmark results, it is critical to underscore the methodological basis of the findings. As detailed in Section 3.3 and comprehensively presented in Table S8 of the Supplementary Materials, each architectural family (YOLO, DETR, and R-CNN) was trained with its own accepted standard hyperparameter configuration. Exogenous variables such as dataset partitioning and hardware/software infrastructure were kept consistent and identical across all models. This balanced approach ensures that reported performance differences directly reflect differences in architectural design, rather than a biased training protocol that favours a particular model (See Supplementary Tables S5–S7). Therefore, the discussion that follows is built upon a fair comparison conducted with scientific rigor.
In this section, the experimental results are related to the study objectives and discussed from an apron safety perspective. A comparison of twelve object detection models and a systematic optimisation of YOLOv8-Seg are discussed, and the significance of the findings and potential applications are evaluated.

5.1. Model Benchmarking, Error Characterisation, and Statistical Reliability

5.1.1. Model Performance and Architectural Comparison

Benchmark results show that YOLOv9 and YOLOv8 had the strongest bounding-box performance among the twelve tested models (Table 5). In segmentation tasks, YOLOv8-Seg consistently outperformed YOLOv11-Seg and YOLOv5-Seg, achieving the best overall results (Table 8 and Table 9). In particular, YOLOv9 demonstrated robustness across different IoU thresholds, achieving the highest mAP@0.5:0.95 with 73.4%. In contrast, YOLOv8 achieved the highest mAP@0.5 with 91.3%, representing its capacity to make broadly accurate detections.
An important observation is that newer YOLO variants (v10–v12) did not surpass the performance of YOLOv8 and YOLOv9, despite architectural updates. This indicates that incremental innovations in backbone or head design do not always translate to better generalisation in domain-specific tasks such as apron surveillance. YOLOv8’s balance of C2f modules and efficient detection head [47], and YOLOv9’s GELAN backbone combined with Programmable Gradient Information (PGI) [48], appear to offer the optimal trade-off between precision and recall in this setting. In contrast, YOLOv10–12 may introduce complexity that does not necessarily benefit datasets characterised by scale variation, adverse weather, and background clutter, underscoring that “newer” does not equate to “better” without context-driven validation.
Another important point is the trade-off between speed and accuracy. While YOLOv9 achieved the highest mAP@0.5:0.95 of 73.4%, its inference speed was lower than that of YOLOv8 and YOLOv5. As presented in Table 5 and Figure 3, YOLOv5 achieved high speed, exceeding 110 FPS, while maintaining acceptable accuracy. In contrast, YOLOv9 reached just 47.34 FPS, which is less than half the speed of YOLOv5. This difference may explain the widespread adoption of YOLOv5 in prior studies [54,60,61]. While YOLOv5 is not the most accurate model, its efficiency makes it attractive for applications where resources are limited, and latency is critical. These findings show that when selecting a model for apron surveillance, consideration should be given not only to accuracy but also to real-time speed requirements.
Class-based results indicate important differences among aircraft components. In both segmentation Mask and BBox tests, the Nose and Fuselage classes were detected with the highest accuracy rates (Figure 5, Figure 6, Figure 7 and Figure 8). This is likely due to their distinct shapes and boundaries, which are more easily distinguished by the models. In contrast, the Wing and Tail classes were detected with lower accuracy, presenting challenges due to their long structures and partially overlapping geometries. This significant finding demonstrates that the models are robust in more structurally distinct regions but limited in more complex components.
Finally, the YOLO models demonstrated a clear advantage when compared to models like Faster R-CNN, DETR, and RF-DETR. While RF-DETR achieved the best accuracy among non-YOLO models, it did so at the expense of slower inference and higher computational cost (Supplementary Materials Table S8). Overall comparisons suggest that single-stage YOLO architectures are a more suitable option for applications requiring both high precision and real-time speed, such as apron surveillance.

5.1.2. Class-Wise Error Trends and Confusion Matrix Insights

As shown in the Results section, all object detection models struggled significantly with the Wing and Tail classes, which proved to be the most difficult components to detect (see Figure 5 and Figure 8). Confusion matrix analysis showed a significant difference in error trends in these two classes. The Wing class exhibited an almost systematic dominance of FN across the models, with FN values ranging from 52 to 73, and recall values ranging from 72.1% to 78.5% (See Table 10) This suggests that detection stability decreases for components with extended and partially overlapping geometries.
In contrast, the error profile in the Tail class varied depending on the architecture. While the YOLOv8 model exhibited a trend of FN > FP, this balance shifted towards FP > FN in the YOLOv8-Seg and YOLOv9 models. This change shows that segmentation-based architectures improve recall performance while leading to a small decrease in precision values. In general, the high FP ratio in the Wing class indicates that the models under-detect geometrically complex components, while the increased FP in the Tail class indicates that architectural differences directly affect the error distribution.

5.1.3. Statistical Robustness via 10-Fold Cross-Validation

The benchmarking and error analysis findings presented in the previous sections demonstrated the performance of the models on a fixed validation set. To assess the statistical significance of the performance differences, 10-fold CV was applied to YOLOv8, which performed well in the BBox task, YOLOv8-Seg, which performed best in the segmentation task, and YOLOv11-Seg, which has a more advanced architecture. The results revealed that all models exhibited high stability across layers. Standard deviations remained within the range of σ ≤ 1.7% in the bounding-box task and σ ≤ 2.6% in the mask task. The almost complete overlap of the 95% confidence intervals obtained using the t-distribution and bootstrap methods demonstrates the statistical reliability of the mean values.
These low variance values confirm not only the model’s stability but also the balanced and representative nature of the dataset. An examination of the average performances reveals that the YOLOv8-Seg model achieves the highest average performance in both BBox mAP@0.5 with 88.6% and mask mAP@0.5 with 81.5% tasks. Specifically, for the mAP@0.5:0.95 metric, YOLOv8-Seg 66.8% outperformed the newer and more complex YOLOv11-Seg model 66.5%. This result demonstrates that lighter and more optimised architectures can provide more efficient generalisation compared to overly complex architectures.
Overall, the 10-fold validation findings suggest that performance differences are due not to data fragmentation, but to architectural efficiency and structural balance factors. These results confirm that the benchmarking and optimisation strategies are based on a statistically sound basis, and that YOLOv8-Seg is the most reliable reference model in terms of accuracy-generalisation.

5.1.4. Qualitative Scenario-Based Discussion Under Apron Conditions

Scenario 1: Low-Visibility: In fog and low-visibility conditions, YOLOv9 successfully detected all aircraft components with high confidence. This suggests that its GELAN backbone is effective in preserving feature integrity under low-contrast settings. This observation is supported by recent work by Zhang et al. [78], who introduced an enhanced YOLOv9s framework tailored for haze-degraded environments, demonstrating substantial improvements in detection accuracy using contrastive learning and attention mechanisms. Importantly, YOLOv8-Seg demonstrates more robust performance compared to its baseline model. The accurate separation of small components, such as the horizontal stabiliser, indicates that multi-task learning allows the network to focus on finer details.
Scenario 2: Clear-Weather: In ideal weather conditions, YOLOv9 missed the aircraft’s right wing entirely, creating a safety-critical false negative. However, YOLOv8 successfully detected all aircraft components. As shown in Table 7, YOLOv8 had already achieved superior performance to YOLOv9 in the Wing class, and this scenario further validates that result. YOLOv8-Seg, on the other hand, provides a more visually understandable and accurate interpretation of aircraft components by drawing segmentation masks more clearly.
Scenario 3: Complex Background: In this scenario, where the apron environment contained complex geometry and intense background noise, several weaknesses were revealed for all models. The most noticeable error was the frequent misclassification of the winglet as a Tail likely due to the models’ excessive reliance on vertical shape features. YOLOv8 and YOLOv8-Seg also exhibited instability in complex structures, producing redundant or partial boxes in the wing region. However, YOLOv9, despite making errors, was better at distinguishing background clutter, more clearly separating the aircraft from its surroundings.
Overall, the benchmarking and scenario-based evaluations highlight three main findings. YOLOv8, YOLOv9, and YOLOv8-Seg achieved the best balance between accuracy, recall, and speed, showing that maturity and adaptability can outweigh novelty, as newer variants (YOLOv10–12) did not outperform them. Moreover, practical deployment requires considering both accuracy and inference speed, explaining why YOLOv5 remains relevant in latency-sensitive applications. Scenario analyses further revealed that YOLOv9 excelled in low-visibility but made class-specific errors, while YOLOv8 showed more consistent balance across conditions. YOLOv8-Seg combined this stability with precise segmentation masks, reliably detecting both large and small components. These findings justify its selection for optimisation, as it offers the strongest foundation for improving both quantitative metrics and qualitative robustness.

5.2. Interpretation of Optimisation Efficacy

5.2.1. Implications of the Quantitative Findings

In this study, eight separate optimisation steps were systematically tested on the YOLOv8-Seg model. Each step was individually evaluated to target a specific component of the model (e.g., computational efficiency, data diversity, resolution and learning dynamics). However, based on the findings, the Loss Function change was not included in the final optimisation combination, the final optimised model was obtained by applying the remaining seven steps together. This allowed for both numerical quantification of the independent effect of each step and validation of the combined contribution of these seven optimisation steps in a separate experiment.
The findings indicate that while each step contributes to performance at different scales, applying all steps together creates a synergistic effect, leading to higher accuracy gains. In particular, the Model Scaling (N to L) and Data Augmentation (3.5×) steps produced the strongest individual improvements. The scaling step produced the largest quantitative gain, with the BBox mAP@0.5:0.95 increasing from 69.6% to 74.4% (+4.8 p.p.). Although the numerical contribution of data augmentation was smaller, it effectively enhanced generalisation stability, particularly for small objects and boundary regions.
Three separate optimisation steps for the training parameters: increasing the resolution to 1024 × 1024, increasing the epoch counts to 170, and recalibrating the learning rate, all had complementary effects on the model’s learning behaviour. The resolution increase had a positive, albeit limited, impact on BBox performance, particularly by improving the recognition of small and fine structured components. Increasing the number of epochs strengthened the model’s long-term learning stability. The most significant improvement was achieved by adjusting the Learning Rate among Hyperparameter settings, in addition to improving overall accuracy in the Mask task, this step increased the reliability of edge detection by increasing mAP@0.5 from 75.6% to 78.0% (+2.4 p.p.) in the Wing class. Thus, adjusting the learning stabilised the model’s convergence, reduced its tendency to overfit, and rate enabled it to produce more consistent masks in challenging classes.
Applying all optimisation steps together produced significant performance gains for the model in both the BBox and Mask tasks. BBox mAP@0.5:0.95 increased from 69.6% to 75.77% (+6.17 p.p.), and mAP@0.5 increased from 90.41% to 92.28% (+1.87 p.p.), demonstrating that the optimisation improved localisation fidelity in high-IoU regions. The gains were even more striking in the Mask task: mAP@0.5:0.95 increased from 53.95% to 61.99% (+8.04 p.p.), and mAP@0.5 increased from 83.44% to 88.18% (+4.74 p.p.). This result demonstrates that the model improved both overall mask accuracy and discrimination ability in complex boundary regions. Overall, these increases confirm that the performance gains are not random but rather the result of an integrated effect that strengthens the structural efficiency of the model.
When examined by class, the largest improvements were observed in the Airplane (+11.5 p.p.) and Wing (+9.9 p.p.) classes for the Mask mAP@0.5 metric. This result demonstrates that the optimisation reduces errors in geometrically complex, partially overlapping components.
Consequently, the final configuration, obtained by testing eight optimisation steps individually and applying seven of them together, produced a synergistic gain greater than the combined effect of the individual steps. These improvements were observed sustainably at both mAP@0.5 and mAP@0.5:0.95 levels, indicating that the achieved performance is not random but rather based on the model’s architectural efficiency and statistical soundness. Therefore, the optimised YOLOv8-Seg model stands out as the most stable structure, achieving a high balance of accuracy and computational efficiency in both detection and segmentation tasks.

5.2.2. Qualitative Validation Under Realistic Apron Scenarios

Scenario 4: Detection Reliability under Optimal Conditions. Under daytime apron conditions, both the baseline and optimised YOLOv8-Seg detected all aircraft classes correctly. However, the optimised model produced higher confidence scores and more precise boundaries, confirming the effectiveness of the applied optimisation strategies.
Scenario 5: Robustness under Low Visibility and Sensor Noise. Heavy rain and sensor noise caused significant instability in the baseline YOLOv8-Seg, including redundant detections in the tail region that compromise multi-object tracking. The optimised model eliminated these issues, producing more consistent and reliable outputs across all components. This demonstrates the value of the data augmentation strategies introduced in the ablation study (see Table 4) for preparing models to handle adverse weather conditions.
Scenario 6: Stability under Low-Light, Glare, and HDR Conditions. Under strong runway lighting and high-contrast changes, the baseline model generated redundant detections, especially on the wings, which disrupted temporal stability. In contrast, the optimised model eliminated these redundancies, more clearly distinguishing the left and right wings and improving confidence in fuselage and tail detection. These results show that the optimisations strengthened the model’s structural integrity under difficult lighting.
Overall, the ablation study confirmed that dataset expansion and model scaling yielded the largest accuracy gains, while efficiency-focused strategies improved stability and reduced error rates. Crucially, combining these optimisations produced a more generalisable model than applying them individually. The qualitative scenario analyses reinforced these outcomes, demonstrating that the optimised YOLOv8-Seg not only enhanced computational accuracy but also eliminated redundant detections, thereby improving confidence and robustness under diverse apron conditions. Together, these results suggest that the optimised model provides a strong basis for further research and potential applications in apron safety.

5.3. Practical Implications for Apron Safety

Building on the robust performance of the optimised YOLOv8-Seg model demonstrated in our results, this section explores its practical implications for enhancing apron safety. One of the most common problems encountered at airports is aircraft incidents, such as wingtip collisions and ground handling vehicle accidents, which cost the industry billions of dollars annually according to ICAO and IATA reports. The optimised YOLOv8-Seg model reliably detects aircraft components under various and challenging conditions, and, combined with multiple objects tracking algorithms, significantly contributes to the monitoring and prevention of these risks.
The operational efficiency and stability of the model developed in our study make it suitable for real-time integration into apron surveillance systems. Many airports have infrastructures operating with CCTV cameras, ADS-B sensors, and ground-based radars. The proposed system can be integrated into this existing surveillance system, providing an additional layer of safety without requiring expensive infrastructure upgrades.
Furthermore, this study aligns with international initiatives on “smart airports” and the digitalisation of ground operations [35]. As aviation agencies such as ICAO and EASA strive to develop practical safety management systems, deep learning-based tools like object detection models can contribute to this goal. In particular, accurate detection and tracking of aircraft components can enhance both safety and ground-handling efficiency, including maintenance planning.
Beyond its immediate detection capability, the optimised YOLOv8-Seg framework could serve as an initial step toward a technically robust foundation for future multi-object tracking (MOT) pipelines. The segmentation outputs have the potential to support tracking algorithms in establishing object association, motion analysis, and early collision-risk evaluation. This methodological connection provides early insight into how detection and tracking may be integrated for proactive apron-safety systems in future research.
In summary, this study proposes a systematic and data-driven framework for evaluating and optimising segmentation models under realistic apron conditions. Although further validation is required before operational deployment, the optimised YOLOv8-Seg model shows clear potential for integration into future vision-based security systems in airport environments.

5.4. Limitations and Future Work Directions

This study demonstrates that the optimised YOLOv8-Seg model provides robust and consistent results for apron safety. However, several limitations and open questions must be addressed to bridge the gap between this research and full operational implementation. First, real-world airport environments introduce additional complexities, such as unpredictable lighting, extensive occlusions from ground vehicles, camera vibrations, and sensor degradation from adverse weather conditions [36]. These factors may negatively impact the model’s generalisation ability and will require large-scale field testing and adaptive calibration strategies. Second, while data augmentation steps improve performance, further gains require access to larger, rigorously labelled datasets covering a wider variety of operational conditions.
Collaborations between airports and research institutions can help address this need and ensure validation in diverse geographic and operational environments. Third, despite the eight optimisation steps, the computational resources required for high-resolution segmentation may limit real-time performance, especially on resource constrained hardware common in airport systems. Therefore, techniques such as hardware-aware pruning, low-bit quantization, and information distillation should be explored in the future to create lighter and more efficient models. Finally, the integration of this framework with MOT algorithms is an important future direction. Such a combined system would not only detect aircraft and components but also track their movements over time, enabling collision risk analysis and early anomaly detection. In summary, the optimised YOLOv8-Seg framework developed using the systematic methodology proposed in this study provides a solid methodological foundation for future research in the field of apron safety. However, transitioning to practical implementation requires addressing identified technical and operational challenges through collaborative real-world validations and incremental improvements.

6. Conclusions

This study presented a new hybrid dataset with detailed annotations for aircraft and their key components, compared twelve object detection and segmentation models, and developed the optimised YOLOv8-Seg through an eight-step ablation study. The results show that while the YOLOv9 model achieved the highest BBox accuracy, the optimised YOLOv8-Seg model delivered the best segmentation performance, demonstrating a substantial improvement over the baseline, with an (+8.04 p.p) increase in mAP@0.5:0.95 and (+4.74 p.p.) in mAP@0.5 for the masking task. The largest class-level improvements were observed in the Airplane (+11.5 p.p.) and Wing (+9.9 p.p.) categories for the Mask mAP@0.5 metric, highlighting the model’s enhanced capacity to outline complex structural boundaries.
Qualitative tests conducted under challenging conditions such as fog, night, clear weather, and complex backgrounds confirmed the robustness of the optimised YOLOv8-Seg model, demonstrating improved reliability and edge accuracy compared to the base model. Overall, the study makes three main contributions: a publicly available dataset, a comprehensive multi-model comparison, and an optimised segmentation framework specifically designed for apron safety. Together, these developments provide a robust foundation and a promising step toward operational deployment, offering valuable insights for the design of vision-based surveillance systems aimed at improving both safety and efficiency in airport operations.

Supplementary Materials

The following supporting information can be downloaded at https://www.mdpi.com/article/10.3390/app152111582/s1, Table S1: Label Distribution per Class; Table S2: Number of Labels per Image; Table S3: Image Size Categories; Table S4: Image Aspect Ratio Distribution; Table S5: Architectural Components of YOLO Model Variants; Table S6: Architectural Components of YOLO-Seg Models; Table S7: Architectural Components of Faster R-CNN and DETR Models; Table S8: Experimental Setup Parameters for 12 Models; Table S9: Summary of Hardware, Software, and Training Parameters for All Optimisation Steps and Final Optimised Model.

Author Contributions

Conceptualisation, E.C.B. and H.A.-R.; methodology, E.C.B.; software, E.C.B.; validation, E.C.B.; formal analysis, E.C.B.; investigation, E.C.B.; resources, E.C.B.; data curation, E.C.B.; writing—original draft preparation, E.C.B.; writing—review and editing, E.C.B. and H.A.-R.; visualisation, E.C.B.; supervision, H.A.-R.; project administration, E.C.B.; funding acquisition, E.C.B. All authors have read and agreed to the published version of the manuscript.

Funding

This research received no specific external funding. The first author’s PhD studies are supported by a scholarship from the Ministry of National Education of Türkiye, but this did not directly fund the present work.

Institutional Review Board Statement

Not applicable.

Informed Consent Statement

Not applicable.

Data Availability Statement

The dataset used in this study was created by the authors and is currently hosted in a private workspace. The dataset will be made publicly available on Roboflow upon the publication of this article.

Acknowledgments

The authors gratefully acknowledge the first author’s family for their unwavering support, encouragement, and patience throughout this research. Their guidance and understanding have been invaluable to the completion of this work.

Conflicts of Interest

The authors declare no conflicts of interest.

Abbreviations

The following abbreviations are used in this manuscript:
ADS-BAutomatic Dependent Surveillance–Broadcast
AIArtificial Intelligence
AMPAutomatic Mixed Precision
APAverage Precision
CCTVClosed-Circuit Television
COCOCommon Objects in Context
CVComputer Vision
DETRDEtection TRansformer
DOTADataset for Object deTection in Aerial Images
FODForeign Object Debris
FPFloating-Point (as in FP16/FP32)
FPSFrames Per Second
GPUGraphics Processing Unit
IATAInternational Air Transport Association
IOUIntersection over Union
LIDARLight Detection and Ranging
mAPmean Average Precision
mIoUmean Intersection over Union
MSFSMicrosoft Flight Simulator
MOTMulti Object Tracking
PGIProgrammable Gradient Information
PRPrecision–Recall
R-CNNRegion-based Convolutional Neural Network
RF-DETRReal-time DEtection TRansformer
RSODRemote Sensing Object Detection
SMRSurface Movement Radar
SSDSingle Shot Detector
YOLOYou Only Look Once

References

  1. International Air Transport Association (IATA). 2023 Industry Statistics Fact Sheet; International Air Transport Association (IATA): Montreal, QC, Canada, 2023; Available online: https://www.iata.org/en/iata-repository/publications/economic-reports/industry-statistics-fact-sheet-december-2023/ (accessed on 1 October 2025).
  2. International Civil Aviation Organization. First ICAO Global Air Cargo Summit. Available online: https://www.icao.int/Meetings/IACS/Pages/default.aspx (accessed on 11 May 2025).
  3. O’Kelly, M.E. Transportation Security at Hubs: Addressing Key Challenges across Modes of Transport. J. Transp. Secur. 2025, 18, 4. [Google Scholar] [CrossRef]
  4. Flight Safety Foundation (FSF). 2022 Safety Report; Flight Safety Foundation (FSF): Alexandria, VA, USA, 2023; p. 11. [Google Scholar]
  5. Abdulaziz, A.; Yaro, A.; Ahmad, A.A.; Namadi, S. Surveillance Radar System Limitations and the Advent of the Automatic Dependent Surveillance Broadcast System for Aircraft Monitoring. ATBU J. Sci. Technol. Educ. (JOSTE) 2019, 7, 15. Available online: http://www.atbuftejoste.com.ng/index.php/joste/article/view/683 (accessed on 7 April 2019).
  6. Thai, P.; Alam, S.; Lilith, N.; Nguyen, B.T. A Computer Vision Framework Using Convolutional Neural Networks for Airport-Airside Surveillance. Transp. Res. Part. C Emerg. Technol. 2022, 137, 103590. [Google Scholar] [CrossRef]
  7. Chen, X.; Gao, Z.; Chai, Y. The Development of Air Traffic Control Surveillance Radars in China. In Proceedings of the 2017 IEEE Radar Conference, RadarConf 2017, Seattle, WA, USA, 8–12 May 2017; pp. 1776–1784. [Google Scholar] [CrossRef]
  8. Galati, G.; Leonardi, M.; Cavallin, A.; Pavan, G. Airport Surveillance Processing Chain for High Resolution Radar. IEEE Trans. Aerosp. Electron. Syst. 2010, 46, 1522–1533. [Google Scholar] [CrossRef]
  9. Lukin, K.; Mogila, A.; Vyplavin, P.; Galati, G.; Pavan, G. Novel Concepts for Surface Movement Radar Design. Int. J. Microw. Wirel. Technol. 2009, 1, 163–169. [Google Scholar] [CrossRef]
  10. Skybrary Surface Movement Radar (SMR). Available online: https://skybrary.aero/articles/surface-movement-radar (accessed on 15 April 2024).
  11. Ding, M.; Ding, Y.-Y.; Wu, X.-Z.; Wang, X.-H.; Xu, Y.-B. Action Recognition of Individuals on an Airport Apron Based on Tracking Bounding Boxes of the Thermal Infrared Target. Infrared Phys. Technol. 2021, 117, 103859. [Google Scholar] [CrossRef]
  12. Lee, S. M-ABCNet: Multi-Modal Aircraft Motion Behavior Classification Network at Airport Ramps. IEEE Access 2024, 12, 133982–133993. [Google Scholar] [CrossRef]
  13. Štumper, M.; Kraus, J. Thermal Imaging in Aviation. MAD-Mag. Aviat. Dev. 2015, 3, 13. [Google Scholar] [CrossRef]
  14. Rivera Velázquez, J.M.; Khoudour, L.; Saint Pierre, G.; Duthon, P.; Liandrat, S.; Bernardin, F. Analysis of Thermal Imaging Performance Under Extreme Foggy Conditions: Applications to Autonomous Driving. J. Imaging 2022, 8, 306. [Google Scholar] [CrossRef]
  15. Brassel, H.; Zouhar, A.; Fricke, H. 3D Modeling of the Airport Environment for Fast and Accurate LiDAR Semantic Segmentation of Apron Operations. In Proceedings of the 2020 AIAA/IEEE 39th Digital Avionics Systems Conference (DASC), San Antonio, TX, USA, 11–15 October 2020. [Google Scholar] [CrossRef]
  16. Atlioğlu, M.C.; Gökhan, K.O.Ç. An AI Powered Computer Vision Application for Airport CCTV Users. J. Data Sci. 2021, 4, 21–26. [Google Scholar]
  17. Munyer, T.; Brinkman, D.; Huang, C.; Zhong, X. Integrative Use of Computer Vision and Unmanned Aircraft Technologies in Public Inspection: Foreign Object Debris Image Collection. In Proceedings of the 22nd Annual International Conference on Digital Government Research, Omaha, NE, USA, 9–11 June 2021; pp. 437–443. [Google Scholar] [CrossRef]
  18. ICAO. International Civil Aviation Organization FOD Management Programme. Available online: https://www2023.icao.int/ESAF/Documents/meetings/2024/Aerodrome%20Certification%20Worksljop%20Luanda%20Angola%2013-17%20May%202024/Presentations/FOD%20Management%20Programme.pdf (accessed on 19 June 2024).
  19. Shan, J.; Miccinesi, L.; Beni, A.; Pagnini, L.; Cioncolini, A.; Pieraccini, M. A Review of Foreign Object Debris Detection on Airport Runways: Sensors and Algorithms. Remote Sens. 2025, 17, 225. [Google Scholar] [CrossRef]
  20. Mo, Y.; Wang, L.; Hong, W.; Chu, C.; Li, P.; Xia, H. Small-Scale Foreign Object Debris Detection Using Deep Learning and Dual Light Modes. Appl. Sci. 2024, 14, 2162. [Google Scholar] [CrossRef]
  21. Kucuk, N.S.; Aygun, H.; Dursun, O.O.; Toraman, S. Detection and Classification of Foreign Object Debris (FOD) with Comparative Deep Learning Algorithms in Airport Runways. Signal Image Video Process 2025, 19, 316. [Google Scholar] [CrossRef]
  22. Friederich, N.; Specker, A.; Beyerer, J. Security Fence Inspection at Airports Using Object Detection. In Proceedings of the 2024 IEEE Winter Conference on Applications of Computer Vision Workshops, WACVW 2024, Waikoloa, HI, USA, 1–6 January 2024; pp. 310–319. [Google Scholar] [CrossRef]
  23. Bahrudeen, A.A.A.; Bajpai, A. Attire-Based Anomaly Detection in Restricted Areas Using YOLOv8 for Enhanced CCTV Security. arXiv 2024, arXiv:2404.00645. [Google Scholar] [CrossRef]
  24. Kheta, K.; Delgove, C.; Liu, R.; Aderogba, A.; Pokam, M.-O. Vision-Based Conflict Detection Within Crowds Based on High-Resolution Human Pose Estimation for Smart and Safe Airport. arXiv 2022, arXiv:2207.00477. [Google Scholar]
  25. Yıldız, S.; Aydemir, O.; Memiş, A.; Varlı, S. A Turnaround Control System to Automatically Detect and Monitor the Time Stamps of Ground Service Actions in Airports: A Deep Learning and Computer Vision Based Approach. Eng. Appl. Artif. Intell. 2022, 114, 105032. [Google Scholar] [CrossRef]
  26. Muecklich, N.; Sikora, I.; Paraskevas, A.; Padhra, A. The Role of Human Factors in Aviation Ground Operation-Related Accidents/Incidents: A Human Error Analysis Approach. Transp. Eng. 2023, 13, 100184. [Google Scholar] [CrossRef]
  27. Said Hamed Alzadjail, N.; Balasubaramainan, S.; Savarimuthu, C.; Rances, E.O. A Deep Learning Framework for Real-Time Bird Detection and Its Implications for Reducing Bird Strike Incidents. Sensors 2024, 24, 5455. [Google Scholar] [CrossRef]
  28. Mendonca, F.A.C.; Keller, J. Enhancing the Aeronautical Decision-Making Knowledge and Skills of General Aviation Pilots to Mitigate the Risk of Bird Strikes: A Quasi-Experimental Study. Coll. Aviat. Rev. Int. 2022, 40, 7. [Google Scholar] [CrossRef]
  29. Dat, N.N.; Richardson, T.; Watson, M.; Meier, K.; Kline, J.; Reid, S. WildLive: Near Real-Time Visual Wildlife Tracking Onboard UAVs. arXiv 2025, arXiv:2504.10165. [Google Scholar]
  30. Zeng, B.; Ming, D.; Ji, F.; Yu, J.; Xu, L. Top-Down Aircraft Detection in Large-Scale Scenes Based on Multi-Source Data and FEF-R-CNN. Int. J. Remote Sens. 2022, 43, 1108–1130. [Google Scholar] [CrossRef]
  31. Zhou, L.; Yan, H.; Shan, Y.; Zheng, C.; Liu, Y. Aircraft Detection for Remote Sensing Images Based on Deep Convolutional Neural Networks. J. Electr. Comput. Eng. 2021, 2021, 4685644. [Google Scholar] [CrossRef]
  32. Tahir, A.; Adil, M.; Ali, A. Rapid Detection of Aircrafts in Satellite Imagery Based on Deep Neural Networks. arXiv 2021, arXiv:2104.11677. [Google Scholar] [CrossRef]
  33. Yang, Y.; Xie, G.; Qu, Y. Real-Time Detection of Aircraft Objects in Remote Sensing Images Based on Improved YOLOv4. In Proceedings of the 2021 IEEE 5th Advanced Information Technology, Electronic and Automation Control Conference (IAEAC), Chongqing, China, 12–14 March 2021; pp. 1156–1164. [Google Scholar] [CrossRef]
  34. Wang, Y.Y.; Wu, H.; Shuai, L.; Peng, C.; Yang, Z. Detection of Plane in Remote Sensing Images Using Super-Resolution. PLoS ONE 2022, 17, e0265503. [Google Scholar] [CrossRef]
  35. Flight Safety Foundation Ground Accident Prevention (GAP). Available online: https://flightsafety.org/toolkits-resources/past-safety-initiatives/ground-accident-prevention-gap/ (accessed on 1 October 2025).
  36. Van Phat, T.; Alam, S.; Lilith, N.; Tran, P.N.; Binh, N.T. Deep4Air: A Novel Deep Learning Framework for Airport Airside Surveillance. In Proceedings of the 2021 IEEE International Conference on Multimedia and Expo Workshops, ICMEW 2021, Shenzhen, China, 5–9 July 2021. [Google Scholar] [CrossRef]
  37. Girshick, R.; Donahue, J.; Darrell, T.; Malik, J. Rich Feature Hierarchies for Accurate Object Detection and Semantic Segmentation. In Proceedings of the IEEE Computer Society Conference on Computer Vision and Pattern Recognition, Columbus, OH, USA, 23–28 June 2014; pp. 580–587. [Google Scholar] [CrossRef]
  38. Girshick, R. Fast R-CNN. In Proceedings of the IEEE International Conference on Computer Vision, Santiago, Chile, 7–13 December 2015; pp. 1440–1448. [Google Scholar] [CrossRef]
  39. Ren, S.; He, K.; Girshick, R.; Sun, J. Faster R-CNN: Towards Real-Time Object Detection with Region Proposal Networks. IEEE Trans. Pattern Anal. Mach. Intell. 2015, 39, 1137–1149. [Google Scholar] [CrossRef] [PubMed]
  40. He, K.; Gkioxari, G.; Dollár, P.; Girshick, R. Mask R-CNN. In Proceedings of the 2017 IEEE International Conference on Computer Vision (ICCV), Venice, Italy, 22–29 October 2017; pp. 2961–2969. [Google Scholar] [CrossRef]
  41. Liu, W.; Anguelov, D.; Erhan, D.; Szegedy, C.; Reed, S.; Fu, C.Y.; Berg, A.C. SSD: Single Shot Multibox Detector. In Proceedings of the European Conference on Computer Vision (ECCV), Amsterdam, The Netherlands, 11–14 October 2016; pp. 21–37. [Google Scholar] [CrossRef]
  42. Lin, T.Y.; Goyal, P.; Girshick, R.; He, K.; Dollar, P. Focal Loss for Dense Object Detection. IEEE Trans. Pattern Anal. Mach. Intell. 2018, 42, 318–327. [Google Scholar] [CrossRef] [PubMed]
  43. Redmon, J.; Divvala, S.; Girshick, R.; Farhadi, A. You Only Look Once: Unified, Real-Time Object Detection. In Proceedings of the IEEE Computer Society Conference on Computer Vision and Pattern Recognition, Las Vegas, NV, USA, 27–30 June 2016; pp. 779–788. [Google Scholar] [CrossRef]
  44. Jocher, G. YOLOv5 by Ultralytics. 2020. Available online: http://github.com/ultralytics/yolov5 (accessed on 29 May 2025). [CrossRef]
  45. Ultralytics YOLOv8 Models. Available online: https://docs.ultralytics.com/models/yolov8/ (accessed on 23 December 2024).
  46. Wang, C.-Y.; Yeh, I.-H.; Liao, H.-Y.M. YOLOv9: Learning What You Want to Learn Using Programmable Gradient Information. In Proceedings of the 18th European Conference on Computer Vision. (ECCV), Milan, Italy, 29 September–4 October 2024; pp. 1–18. [Google Scholar] [CrossRef]
  47. Wang, A.; Chen, H.; Liu, L.; Chen, K.; Lin, Z. YOLOv10: Real-Time End-to-End Object Detection. arXiv 2024, arXiv:2405.14458. Available online: https://arxiv.org/abs/2405.14458 (accessed on 12 February 2025).
  48. Ultralytics Ultralytics YOLO11. Available online: https://docs.ultralytics.com/models/yolo11/ (accessed on 12 February 2025).
  49. Tian, Y.; Ye, Q.; Doermann, D. YOLOv12: Attention-Centric Real-Time Object Detectors. arXiv 2025, arXiv:2502.12524. [Google Scholar]
  50. Ultralytics_Team. Introducing Instance Segmentation in Ultralytics YOLOv5 v7.0. Available online: https://www.ultralytics.com/blog/introducing-instance-segmentation-in-yolov5-v7-0 (accessed on 19 April 2023).
  51. Ultralytics Instance Segmentation—Ultralytics YOLO Docs. Available online: https://docs.ultralytics.com/tasks/segment/ (accessed on 23 April 2024).
  52. Zhu, X.; Su, W.; Lu, L.; Li, B.; Wang, X.; Dai, J. Deformable DETR: Deformable Transformers for End-To-End Object Detection. In Proceedings of the ICLR 2021—9th International Conference on Learning Representations, Virtual, 3–7 May 2021. [Google Scholar]
  53. Robicheaux, P.; Gallagher, J.; Nelson, J.; Robinson, I. RF-DETR: A SOTA Real-Time Object Detection Model. Available online: https://blog.roboflow.com/rf-detr/ (accessed on 31 May 2025).
  54. He, Z.; He, Y.; Lv, Y. DT-YOLO: An Improved Object Detection Algorithm for Key Components of Aircraft and Staff in Airport Scenes Based on YOLOv5. Sensors 2025, 25, 1705. [Google Scholar] [CrossRef]
  55. Huang, B.; Ding, Y.; Liu, G.; Tian, G.; Wang, S. ASD-YOLO: An Aircraft Surface Defects Detection Method Using Deformable Convolution and Attention Mechanism. Measurement 2024, 238, 115300. [Google Scholar] [CrossRef]
  56. Lin, T.Y.; Maire, M.; Belongie, S.; Hays, J.; Perona, P. Microsoft COCO: Common Objects in Context. In Computer Vision–ECCV 2014, Proceedings of the 13th European Conference, Zurich, Switzerland, 6–12 September 2014; LNCS; Springer: Cham, Switzerland, 2014; Volume 8693, pp. 740–755. [Google Scholar] [CrossRef]
  57. Zhou, W.; Cai, C.; Zheng, L.; Li, C.; Zeng, D. ASSD-YOLO: A Small Object Detection Method Based on Improved YOLOv7 for Airport Surface Surveillance. Multimed. Tools Appl. 2023, 83, 55527–55548. [Google Scholar] [CrossRef]
  58. Zhou, W.; Cai, C.; Li, C.; Xu, H.; Shi, H. AD-YOLO: A Real-Time YOLO Network with Swin Transformer and Attention Mechanism for Airport Scene Detection. IEEE Trans. Instrum. Meas. 2024, 73, 5036112. [Google Scholar] [CrossRef]
  59. Lyu, Z.; Luo, J. A Surveillance Video Real-Time Object Detection System Based on Edge-Cloud Cooperation in Airport Apron. Appl. Sci. 2022, 12, 128. [Google Scholar] [CrossRef]
  60. Zhou, R.; Li, M.; Meng, S.; Qiu, S.; Zhang, Q. Aircraft Objection Detection Method of Airport Surface Based on Improved YOLOv5. J. Electr. Syst. 2024, 20, 16–25. [Google Scholar] [CrossRef]
  61. Xu, Y.; Liu, Y.; Shi, K.; Wang, X.; Li, Y.; Chen, J. An Airport Apron Ground Service Surveillance Algorithm Based on Improved YOLO Network. Electron. Res. Arch. 2024, 32, 3569–3587. [Google Scholar] [CrossRef]
  62. CAPTAIN-WHU DOTA: Dataset for Object DeTection in Aerial Images. Available online: https://captain-whu.github.io/DOTA/index.html (accessed on 10 September 2024).
  63. RSIA-LIESMARS-WHU Remote Sensing Object Detection Dataset (RSOD-Dataset). Available online: https://github.com/RSIA-LIESMARS-WHU/RSOD-Dataset- (accessed on 20 February 2024).
  64. Utomo, S.; Sulistyaningrum, D.R.; Setiyono, B.; Nasution, A.H.I. Image Augmentation For Aircraft Parts Detection Using Mask R-CNN. In Proceedings of the 2024 International Conference on Smart Computing, IoT and Machine Learning, SIML 2024, Surakarta, Indonesia, 6–7 June 2024; pp. 186–192. [Google Scholar] [CrossRef]
  65. Thomas, J.; Kuang, B.; Wang, Y.; Barnes, S.; Jenkins, K. Advanced Semantic Segmentation of Aircraft Main Components Based on Transfer Learning and Data-Driven Approach. Vis. Comput. 2025, 41, 4703–4722. [Google Scholar] [CrossRef]
  66. Yilmaz, B.; Karsligil, M.E. Detection of Airplane and Airplane Parts from Security Camera Images with Deep Learning. In Proceedings of the 2020 28th Signal Processing and Communications Applications Conference, SIU 2020, Gaziantep, Turkey, 5–7 October 2020; pp. 21–24. [Google Scholar] [CrossRef]
  67. Bakirman, T.; Sertel, E. A Benchmark Dataset for Deep Learning-Based Airplane Detection: HRPlanes. Int. J. Eng. Geosci. 2023, 8, 212–223. [Google Scholar] [CrossRef]
  68. Maji, S.; Rahtu, E.; Kannala, J.; Blaschko, M.; Vedaldi, A. Fine-Grained Visual Classification of Aircraft. arXiv 2013, arXiv:1306.5151. [Google Scholar] [CrossRef]
  69. Ultralytics YOLO12: Attention-Centric Object Detection. Available online: https://docs.ultralytics.com/models/yolo12/ (accessed on 20 May 2025).
  70. Carion, N.; Massa, F.; Synnaeve, G.; Usunier, N.; Kirillov, A.; Zagoruyko, S. End-to-End Object Detection with Transformers. In Proceedings of the 16th European Conference, Glasgow, UK, 23–28 August 2020. [Google Scholar] [CrossRef]
  71. Padilla, R.; Passos, W.L.; Dias, T.L.B.; Netto, S.L.; Da Silva, E.A.B. A Comparative Analysis of Object Detection Metrics with a Companion Open-Source Toolkit. Electronics 2021, 10, 279. [Google Scholar] [CrossRef]
  72. Padilla, R.; Netto, S.L.; Da Silva, E.A.B. A Survey on Performance Metrics for Object-Detection Algorithms. In Proceedings of the International Conference on Systems, Signals, and Image Processing, Niteroi, Brazil, 1–3 July 2020; pp. 237–242. [Google Scholar] [CrossRef]
  73. Ultralytics YOLO Performance Metrics—COCO Metrics Evaluation. Available online: https://docs.ultralytics.com/guides/yolo-performance-metrics/#coco-metrics-evaluation (accessed on 23 May 2024).
  74. Long, J.; Shelhamer, E.; Darrell, T. Fully Convolutional Networks for Semantic Segmentation. IEEE Trans. Pattern Anal. Mach. Intell. 2015, 39, 640–651. [Google Scholar] [CrossRef]
  75. Lin, T.-Y.; Maire, M.; Belongie, S.; Hays, J.; Perona, P. COCO: Common Objects in Context. Available online: https://cocodataset.org/#home (accessed on 16 January 2022).
  76. Everingham, M.; Van Gool, L.; Williams, C.K.I.; Winn, J.; Zisserman, A. The Pascal Visual Object Classes (VOC) Challenge. Int. J. Comput. Vis. 2010, 88, 303–338. [Google Scholar] [CrossRef]
  77. Kohavi, R. A Study of Cross-Validation and Bootstrap for Accuracy Estimation and Model Selection. In Proceedings of the International Joint Conference on Artificial Intelligence (IJCAI), Montreal, QC, Canada, 20–25 August 1995; pp. 1137–1143. [Google Scholar]
  78. Zhang, Y.; Zhou, B.; Zhao, X.; Song, X. Enhanced Object Detection in Low-Visibility Haze Conditions with YOLOv9s. PLoS ONE 2025, 20, e0317852. [Google Scholar] [CrossRef]
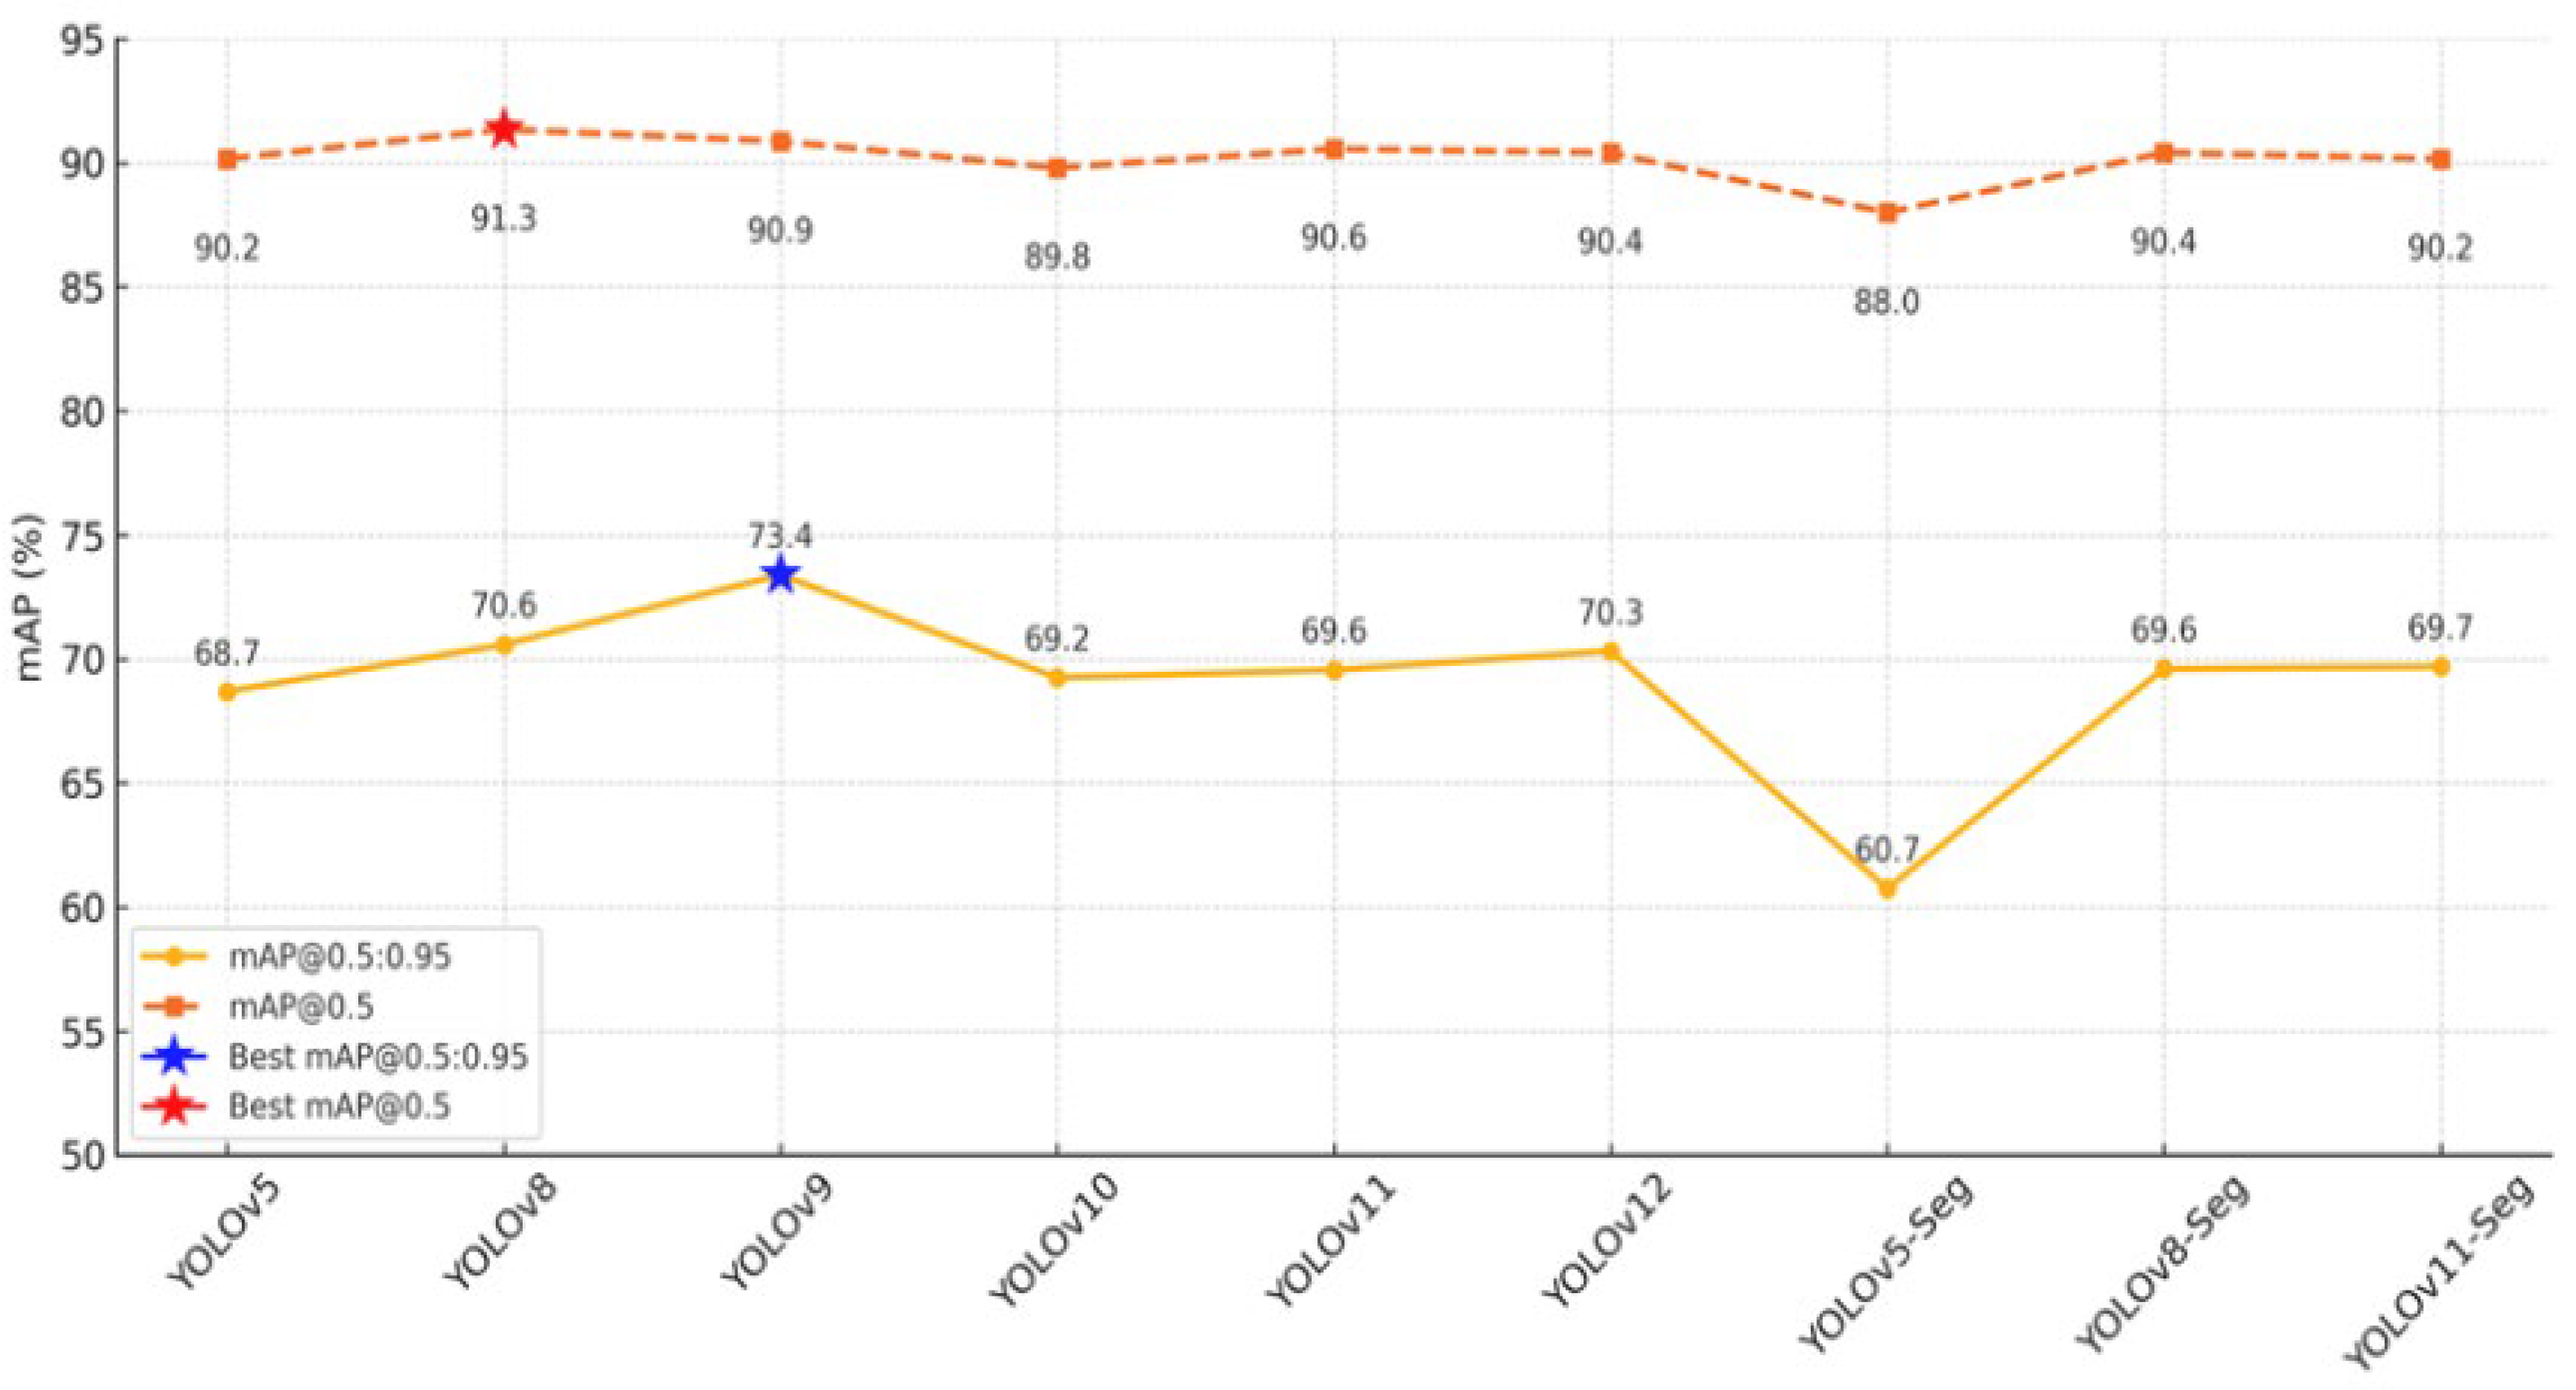
Figure 1. Comparison of YOLO models in terms of mAP@0.5 and mAP@0.5:0.95. Star symbols indicate the best performance values for each metric.
Applsci 15 11582 g001
Figure 2. Comparison of Precision, Recall, and F1 Score across YOLO models.
Applsci 15 11582 g002
Figure 3. FPS comparison of YOLO models on CCTV vs. MSFS video.
Applsci 15 11582 g003
Figure 4. Visual comparison of Faster R-CNN, DETR, and RF-DETR across AP@0.5, AP@0.5:0.95, and AR@100. RF-DETR leads, particularly in stricter IoU thresholds and Recall. Best AP@0.5: blue star; best AP@0.5:0.95: red star; best AR@100: green star.
Applsci 15 11582 g004
Figure 5. Class-Specific comparison of YOLO models based on mAP@0.5. Nose was the most accurate class, while Wing was the most challenging.
Applsci 15 11582 g005
Figure 6. Comparison of segmentation accuracy across YOLO-seg models in terms of mAP@0.5 and mAP@0.5:0.95. The star symbol indicates the best score for each metric.
Applsci 15 11582 g006
Figure 7. Precision, recall, and F1 score comparison of YOLO-segmentation models, highlighting YOLOv8-Seg’s overall balance.
Applsci 15 11582 g007
Figure 8. Class-based mask segmentation performance comparison of YOLOv5-Seg, YOLOv8-Seg, and YOLOv11-Seg models. The line graph visualises mAP@0.5 scores for each aircraft class, with asterisk markers indicating the highest-performing model per class.
Applsci 15 11582 g008
Figure 9. Bounding-box detection results of YOLOv8, YOLOv8-Seg, and YOLOv11-Seg models across 10-fold cross-validation, showing mean mAP@0.5:0.95 and mAP@0.5 scores with standard deviations.
Applsci 15 11582 g009
Figure 10. Mask segmentation results of YOLOv8-Seg and YOLOv11-Seg across 10-fold cross-validation, showing mean mAP@0.5:0.95 and mAP@0.5 scores with standard deviations.
Applsci 15 11582 g010
Figure 11. Model predictions under foggy apron conditions, showing robustness to low-visibility environments and comparative detection confidence among models. (a) Sample image; (b) YOLOv9 predictions with the highest confidence for all aircraft components; (c) YOLOv8 predictions with slightly reduced accuracy for wing detection; (d) YOLOv8-Seg predictions successfully segmenting the fuselage and other parts.
Applsci 15 11582 g011
Figure 12. Performance comparison of YOLOv9, YOLOv8, and YOLOv8-Seg under clear visibility conditions, highlighting differences in wing detection and boundary precision: (a) Sample image; (b) YOLOv9 results showing a false negative for the wing class; (c) YOLOv8 predictions with consistent detection across all components; (d) YOLOv8-Seg output combining bounding boxes and segmentation masks for improved interpretability.
Applsci 15 11582 g012
Figure 13. Testing YOLOv9, YOLOv8, and YOLOv8-Seg in a complex apron scene with background clutter and challenging geometry: (a) Sample image; (b) YOLOv9 results showing accurate fuselage and nose detection but partial detection for the wing; (c) YOLOv8 predictions with occasional false positives from the background; (d) YOLOv8-Seg separating the fuselage correctly but generating both full and partial redundant wing detections.
Applsci 15 11582 g013
Figure 14. Performance comparison of baseline YOLOv8-Seg and the Optimised model under clear apron conditions. (a) YOLOv8-Seg baseline results; (b) Optimised model results.
Applsci 15 11582 g014
Figure 15. Qualitative comparison of the baseline YOLOv8-Seg and the optimised model under heavy weather conditions: (a) YOLOv8-Seg baseline results showing redundant detection; (b) Optimised model results with improved detection consistency.
Applsci 15 11582 g015
Figure 16. Comparison of baseline YOLOv8-Seg and optimised model under nighttime glare, showing: (a) YOLOv8-Seg baseline results showing redundant detections and lower confidence levels; (b) Optimised model results with no redundant detections and higher confidence for wing, fuselage, nose and tail.
Applsci 15 11582 g016
Table 1. Overview of existing aircraft-related datasets, illustrating the lack of publicly available, component-level annotated data from apron environment.
Dataset/AuthorsLabelling TypeImages/ObjectsDomainOpennessKey Focus
HRPlanes [67]BBox
(YOLO/VOC)
3092 Google Earth
images,
18,477 airplanes
Satellite
(Google Earth)
PrivateAircraft detection in high-res Satellite imagery
(DOTA) [62]Oriented BBox2806 images/188 k
objects
Aerial/
Remote sensing
Restricted/
Academic
Multi-class aerial object detection including aircraft
(RSOD) [63]BBox (PASCAL VOC) 976 images (446 for aircraft)Remote sensingPublicAircraft and airport object detection in satellite imagery
(AAD) [54]BBox8643 images/6 classesApron CCTVPrivateAircraft, monitoring ground Staff, and ground support equipment.
COCO) [56]BBox + Instance Segmentance328,000 images/
80 different categories
Generic Scenes
(incl. aircraft)
PublicGeneral object detection and segmentation (Person, Car, Cat, Stop Sign, etc.)
(FGVC) [68]Bbox10,000 Images/102 models of Aircraft ImagesAirport/SpottingPublic/
Research Only
Fine-grained aircraft model classification
Yilmaz and Karsligil [66]Instance Segmentation (Mask R-CNN) PASCAL VOC1000 Images/2 classesApron Security CameraPrivate (Turkish Airlines R&D Centre)Detection and segmentation of aircraft parts (tail and doors) from apron CCTV
Our Proposed DatasetBBox + Instance Segmentation1112 images/7420 labels, 5 classesHybrid (Real, CCTV + Synthetic)Public (Planned)Aircraft and Component-level segmentation for apron safety
Table 2. General Features of the Dataset.
FeatureValue
Number of images1112
Number of annotations7420
Average annotations per image6.7
Number of classes5
Average image size, MP *0.97
Min image size MP *0.09
Max image size MP *44.76
Median resolution (px)1200 × 822
Annotation typeSegmentation
* MP = megapixels. Resolution and size are reported as provided by sources; no pre-submission resizing was applied.
Table 3. Overview of the twelve selected architectures grouped by family. The table shows model year, architectural type, and a concise summary of their primary strengths.
ModelYearArchitecture TypeKey Strength
YOLOv52020Single-StageLightweight, real-time detection
YOLOv82023Single-StageImproved backbone, strong accuracy
YOLOv92024Single-StageEnhanced bounding-box accuracy
YOLOv102024Single-StageSpeed–accuracy trade-off
YOLOv112024Single-StageExtended segmentation capability
YOLOv122025Single-StageLatest YOLO variant, stability focus
YOLOv5-Seg2020Single-Stage (Seg)Pixel-level segmentation
YOLOv8-Seg2023Single-Stage (Seg)Best segmentation accuracy
YOLOv11-Seg2024Single-Stage (Seg)Newer segmentation variant
Faster R-CNN2015Two-StageHigh accuracy, region proposals
DETR2020Transformer-BasedAnchor-free, attention reasoning
RF-DETR2025Transformer-BasedRefined DETR, faster convergence
Table 4. Data augmentation techniques and parameters used for YOLOv8-Seg dataset expansion.
Data AugmentationsRates
RotationBetween −15° and +15°
Saturation changesUp to 18%
Brightness adjustmentUp to 22%
Exposure changesUp to 15%
BlurUp to 1.2 pixels
Adding Random Noise2.2%
Table 5. Detection results of YOLO models (v5, v8–v12, including Seg variants) with mAP, Precision, Recall, F1, FPS, and Validation Loss. Best scores are highlighted in bold.
MODELmAP
@0.5:0.95
mAP
@0.5
PrecisionRecallF1 ScoreFPS
CCTV
FPS
MSFS
Val Box
Loss
ValCls
Loss
Val Dfl
Loss
YOLOv568.67990.15791.83684.21087.858116.38110.190.9460.6351.149
YOLOv870.57891.34190.37087.61988.97384.5882.020.8820.5791.107
YOLOv973.37890.86292.43085.59088.87947.3446.320.8420.5531.212
YOLOv1069.24389.79789.68684.25486.88574.6970.681.9001.2632.238
YOLOv1169.55290.55891.76987.45389.55866.8364.520.9020.6051.113
YOLOv1270.31490.40789.59487.57488.57447.1246.140.9000.5811.137
YOLOv5-Seg (BBox)60.74687.98090.93983.21286.919108.28104.170.0320.006-
YOLOv8-Seg (BBox)69.59990.40790.30087.59388.92669.0268.290.8900.5891.118
YOLOv11-Seg (BBox)69.69490.15490.90286.53388.66458.6457.400.9040.6281.123
Table 6. Comparison of AP@0.5, AP@0.5:0.95, and AR@100 metrics for Faster R-CNN and DETR family. Best results are highlighted in bold.
MODELAP@0.5:0.95AP@0.5AR@100AP-SmallAP-MedAP-
large
Faster R-CNN60.8086.267.418.141.765.3
DETR54.7077.561.03.817.065.3
RF-DETR70.6090.379.714.847.875.6
Table 7. Class-based detection performance (mAP@0.5) of YOLO models across five aircraft-related categories. Best scores for each class are shown in bold.
ModelAirplaneNoseFuselageWingTailAll Class
YOLOv588.497.196.980.288.290.2
YOLOv889.398.596.483.988.491.3
YOLOv989.898.495.382.088.890.9
YOLOv1087.097.994.982.686.789.8
YOLOv1189.297.895.681.788.590.6
YOLOv1289.397.095.781.788.390.4
YOLOv5-Seg (Bbox)85.497.391.179.087.288.0
YOLOv8-Seg (BBox)88.197.795.181.488.990.3
YOLOv11-Seg (BBox)88.498.594.581.987.490.1
Table 8. Segmentation performance of YOLO models (v5-Seg, v8-Seg, v11-Seg). Best results are highlighted in bold.
ModelmAP@0.5:0.95mAP@0.5PrecisionRecallFPS
CCTV
FPS
MSFS
F1 ScoreVal
Seg
Loss
YOLOv5-Seg (Mask)48.29979.36384.94678.632108.28104.1781.660.029
YOLOv8-Seg (Mask)53.95383.43585.03482.81069.0268.2983.901.523
YOLOv11-Seg (Mask)53.39582.90285.74181.99158.6457.4083.821.563
Table 9. Class-specific mask segmentation performance (mAP@0.5) of YOLOv5-Seg, YOLOv8-Seg, and YOLOv11-Seg models on five main aircraft classes. Best results are highlighted in bold.
ModelAirplaneNoseFuselageWingTailAll-Class
YOLOv5-Seg (Mask)46.598.191.671.584.678.4
YOLOv8-Seg (Mask)61.297.995.275.687.183.4
YOLOv11-Seg (Mask)59.898.595.074.986.082.8
Table 10. Class-wise FP and FN comparison for Wing and Tail components across three YOLO models, with corresponding Precision and Recall metrics. Best results are highlighted in bold.
ModelClassTPFPFNPrecision (%)Recall (%)
YOLOv8Tail292475886.183.5
Wing190365284.178.5
YOLOv8-SegTail285543584.189.1
Wing189377383.672.1
YOLOv9Tail266733278.589.3
Wing189376683.674.1
Table 11. Mean Performance Metrics of YOLO Models on Bounding Box and Mask Tasks Across 10-Fold Cross-Validation. Best results are highlighted in bold.
ModelTaskMetricMean (μ) ± Std. Dev. (σ)95% CI (t-dist)95% CI (Bootstrap)
YOLOv8BBoxmAP@0.5:0.9566.5 ± 1.4%[65.6, 67.6][65.7, 67.4]
BBoxmAP@0.588.3 ± 1.38%[87.3, 89.3][87.5, 89.1]
YOLOv8-SegBBoxmAP@0.5:0.9566.8 ± 1.7%[65.6, 68.0][65.8, 67.7]
BBoxmAP@0.588.6 ± 1.5%[87.5, 89.7][87.7, 89.4]
MaskmAP@0.5:0.9550.6 ± 1.9%[49.3, 52.0][49.5, 51.7]
MaskmAP@0.581.5 ± 2.6%[79.6, 83.3][79.9, 82.9]
YOLOv11-SegBBoxmAP@0.5:0.9566.5 ± 1.7%[65.3, 67.6][65.5, 67.4]
BBoxmAP@0.588.4 ± 1.6%[87.2, 89.6][87.5, 89.4]
MaskmAP@0.5:0.9550.5 ± 1.8%[49.2, 51.7][49.4, 51.5]
MaskmAP@0.581.4 ± 2.1%[79.9, 82.9][80.2, 82.7]
Table 12. Bounding Box performance comparison of YOLOv8-Seg base model, individual optimisation steps, and combined model. Best results are highlighted in bold.
Optimisation StepsmAP
@0.5:0.95
mAP
@0.5
PrecisionRecallF1 ScoreVal
Box
Loss
Val
Cls Loss
Val
Dfl Loss
Base YOLOv8-Seg (BBox)69.59990.4090.3087.5988.920.890.5891.12
Loss Function70.2290.0791.5186.6489.010.890.5961.10
Inference Opt.70.3390.0890.6887.2588.930.890.5901.11
AMP70.9090.8891.7287.6589.630.920.5911.12
Resolution (1024 × 1024)69.2190.7591.4187.0289.170.950.6431.18
Epochs (130170)69.8690.0991.2585.7988.430.900.6091.14
L. Rate (0.001110.001)69.8790.4990.1687.6188.860.900.5871.12
Model Scl. (NL)74.3791.7589.8487.9688.890.800.5171.16
Data Augmentation (3.5×)71.6190.6392.7485.0988.740.880.6141.19
Optimised Model75.7792.2893.15687.2490.060.790.511.41
Table 13. Segmentation Mask performance comparison of YOLOv8-Seg base model, individual optimisation steps, and combined model. Best results are highlighted in bold.
Optimisation StepsmAP@0.5:0.95mAP@0.5PrecisionRecallF1 ScoreVal Loss
Base YOLOv8-Seg (Mask)53.95383.4385.0382.8183.911.52
Loss Function53.8683.1886.5981.1383.771.48
Inference Opt.53.7683.6586.0582.5384.251.54
AMP54.4983.8886.9482.8784.861.50
Resolution (1024 × 1024)55.6884.2485.8183.1484.461.18
Epochs (130170)55.0683.4783.8282.3283.071.52
L. Rate (0.001110.001)54.1284.7288.1381.1684.521.52
Model Scl. (NL)57.5185.8987.6983.9185.761.61
Data Augmentation (3.5×)56.3985.4389.1380.5884.642.07
Optimised Model61.98688.1789.3283.2986.182.15
Table 14. Performance comparison of YOLOv8-Seg base model, individual optimisation steps, and the combined model with class-based segmentation mask. Best results are highlighted in bold.
Optimisation StepsAirplaneNoseFuselageWingTailAll-Class
Base YOLOv8-Seg (Mask)61.297.995.275.687.183.4
Loss Function59.598.294.876.287.083.2
Inference Opt.62.298.095.474.987.783.7
AMP58.398.096.379.787.283.9
Resolution (1024 × 1024)60.397.595.375.588.683.4
Epochs (130170)62.298.894.875.386.483.5
L. Rate (0.001110.001)65.698.294.378.086.284.5
Model Scl. (NL)67.296.894.680.789.985.9
Data Augmentation (3.5×)70.899.195.77586.385.4
Optimised Model72.798.495.585.588.788.2
Table 15. Baseline vs. optimised YOLOv8-Seg model comparison for bounding-box and mask tasks, showing performance improvements (Δ, p.p.) across major metrics including mAP@0.5:0.95, mAP@0.5, and Validation Loss.
MetricBaseline (BBox)Optimised (BBox)Δ (p.p.)Baseline (Mask)Optimised (Mask)Δ (p.p.)
mAP @0.5:0.9569.6075.77+6.1753.9561.99+8.04
mAP @0.590.4192.28+1.8783.4488.18+4.74
Precision90.3093.16+2.8685.0389.33+4.30
Recall87.5987.24–0.3582.8183.29+0.48
F1 Score88.9390.06+1.1383.9186.18+2.27
Val. Loss0.890.79–0.101.522.15+0.63
Table 16. Comparison of class-wise mask segmentation results between baseline and optimised YOLOv8-Segmodels, showing mAP improvements (Δ, p.p.) across individual aircraft components.
Class (Mask)Baseline mAP (%)Optimised mAP (%)Δ (p.p.)
Airplane61.272.7+11.5
Nose97.998.4+0.5
Fuselage95.295.5+0.3
Wing75.685.5+9.9
Tail87.188.7+1.6
All-Class Mean83.488.2+4.8
Disclaimer/Publisher’s Note: The statements, opinions and data contained in all publications are solely those of the individual author(s) and contributor(s) and not of MDPI and/or the editor(s). MDPI and/or the editor(s) disclaim responsibility for any injury to people or property resulting from any ideas, methods, instructions or products referred to in the content.