1. Introduction
Carbon dioxide emissions into the atmosphere pose a global challenge linked to the economic growth of individual countries. According to the Global Carbon Project, annual anthropogenic CO2 emissions worldwide (primarily from fossil fuel combustion and industrial processes) amount to 36–37 billion tonnes (Gt), equivalent to about 100 million tonnes (Mt) per day. The consequences of these emissions, namely progressive climate warming and increasingly frequent extreme weather events, pose a serious threat to global safety. Drastic reduction in CO2 emissions is therefore one of the most pressing challenges of modern civilization.
The combination of international agreements aimed at reducing emissions and the resulting legal regulations and financial restrictions, and the sheer scale of CO2 generation, has created strong demand for capture and storage facilities. This creates opportunities for significant financial returns for operators with the capability to manage emissions effectively.
Available data show that Poland’s CO
2 emissions exceeded 320 Mt in 2021 [
1]. Taking into account the costs associated with the EU Emissions Trading System (ETS), this highlights the scale of potential economic benefits of implementing carbon management solutions.
In addition to transitioning from fossil fuels to renewable energy sources, one of the most effective methods of reducing atmospheric CO
2 is to capture emissions directly at their source and store them in deep geological formations, such as depleted hydrocarbon reservoirs or saline aquifers [
2,
3].
The article presents preliminary results—appropriate to the limited amount of available data—of an assessment of the geological structure’s potential in terms of the storage capacity of the reservoir layer and its sealing properties. In estimating the total storage capacity of the structure, injection wells with injection rates exceeding 2 million tons over 30 years were taken into account. These rates fall within the broad range of values achieved in existing projects, such as the Quest Carbon Capture and Storage Project, in which CO2 is injected into Cambrian sandstones (Quest Carbon Capture and Storage Project Annual Summary Report—Alberta Department of Energy and Minerals, 2023).
Due to the complexity of the overall investment process—which encompasses the costs of drilling wells, constructing technical infrastructure, transportation, operation, monitoring during the injection process and for many years after its completion, and other related factors—the authors did not analyze the economic aspects of the potential development of the studied structure, leaving this task to the assessment of appropriate specialists.
2. Geological Setting
The structure evaluated in this study for its CO2 storing potential is located in the Polish Exclusive Economic Zone of the Baltic Sea. It was selected based on initial exploration results indicating that its structural configuration and petrophysical characteristics make it a promising sequestration site. The structure occupies the northern part of the Rozewie tectonic block and is bounded by fault zones: Karwia to the east, Kuźnica to the west, and the Riga–Pskov zone to the north (trending south-west to north-east) and to the south, the Sambia dislocation zone. It covers an area of nearly 1200 km2.
The targeted storage layer is the Middle Cambrian
Paradoxides paradoxissimus (Cm2pp) sandstone aquifer, where oil and gas accumulations have already been discovered within and near the study area. This formation lies at depths ranging from approx. 1500 m in the northwest to roughly 2700 m in the southwest, a dipping monoclinically southward at an angle of approx. 4°. It has an average thickness of 38 m, porosity ranging from 3% to 9% (mean approx. 6.0%), and permeability ranging from less than 1 mD to more than 1000 mD. The formation primarily consists of fine- and very fine-grained quartz arenites, with minor shale and siltstone interbeds [
4,
5,
6]. In wells drilled within the area, pore pressures in the injection layer were close to hydrostatic values, exceeding them by no more than 5%.
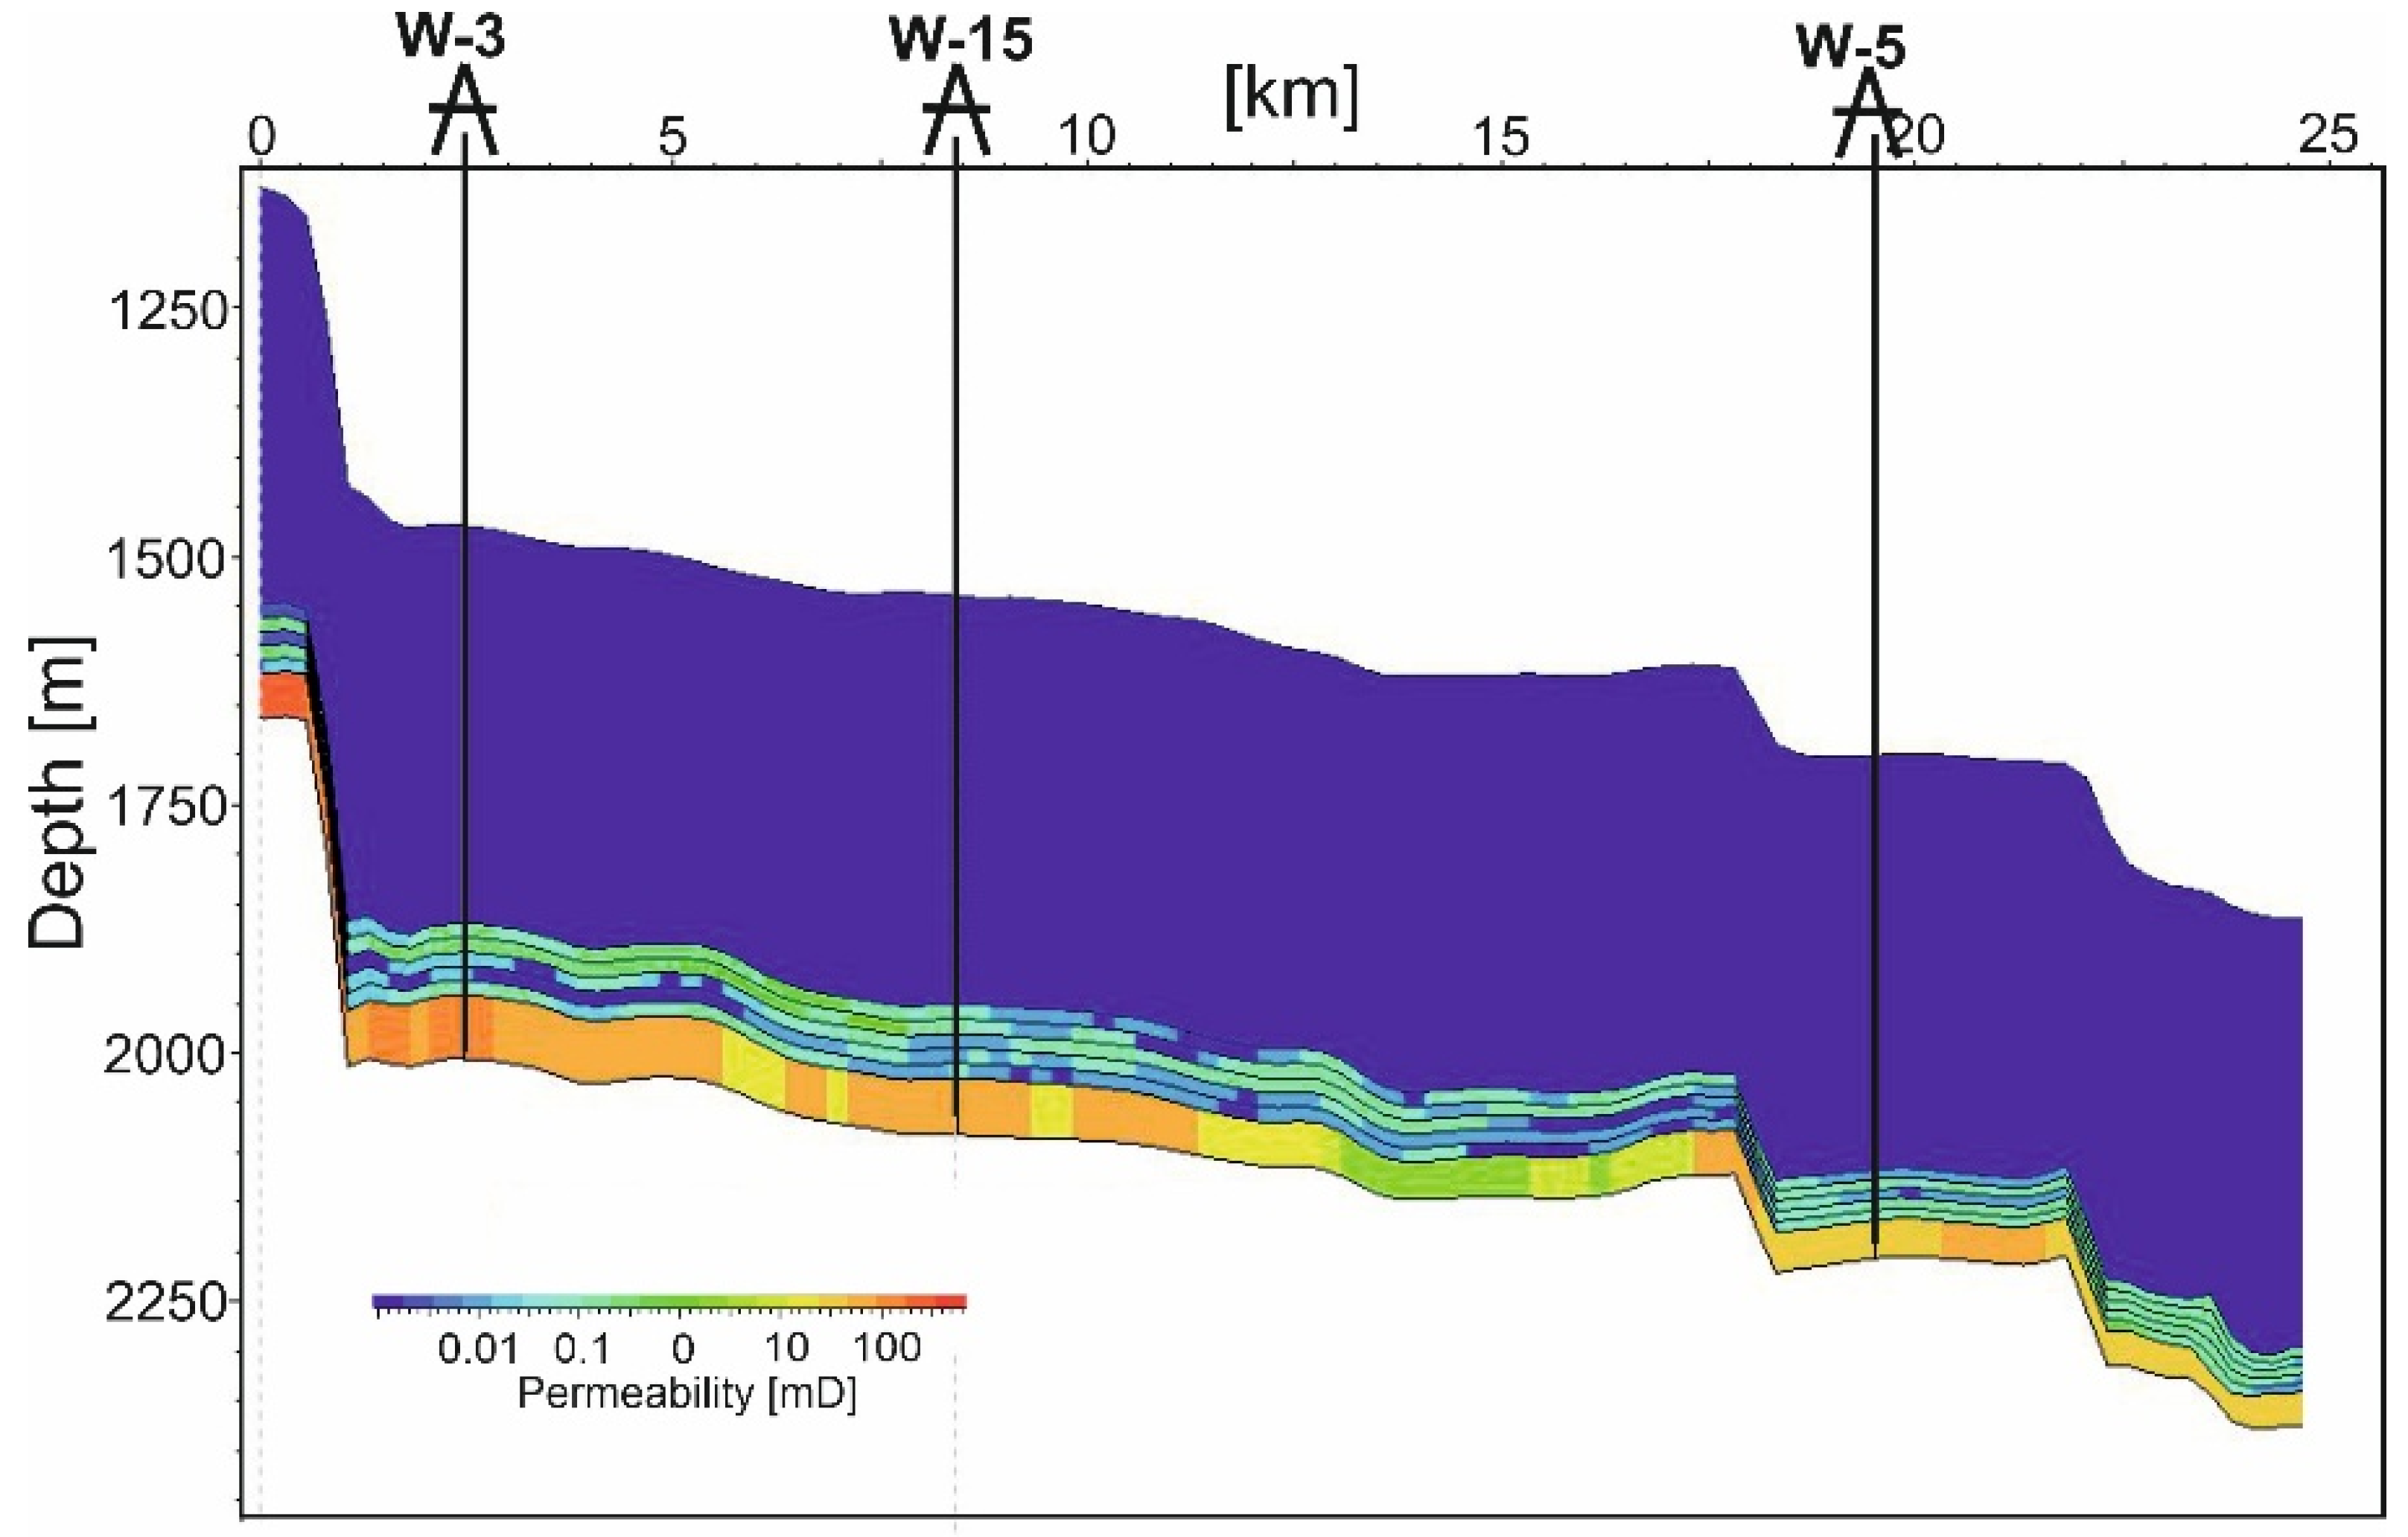
The first sealing unit above the reservoir is a 50–100 m thick (average approx. 75 m) Ordovician mudstone–limestone complex. Their profile begins with black and grey claystones, which are overlain by limestones and marly limestones, followed by an upward increase in claystones and marl content at the expense of carbonate facies [
7,
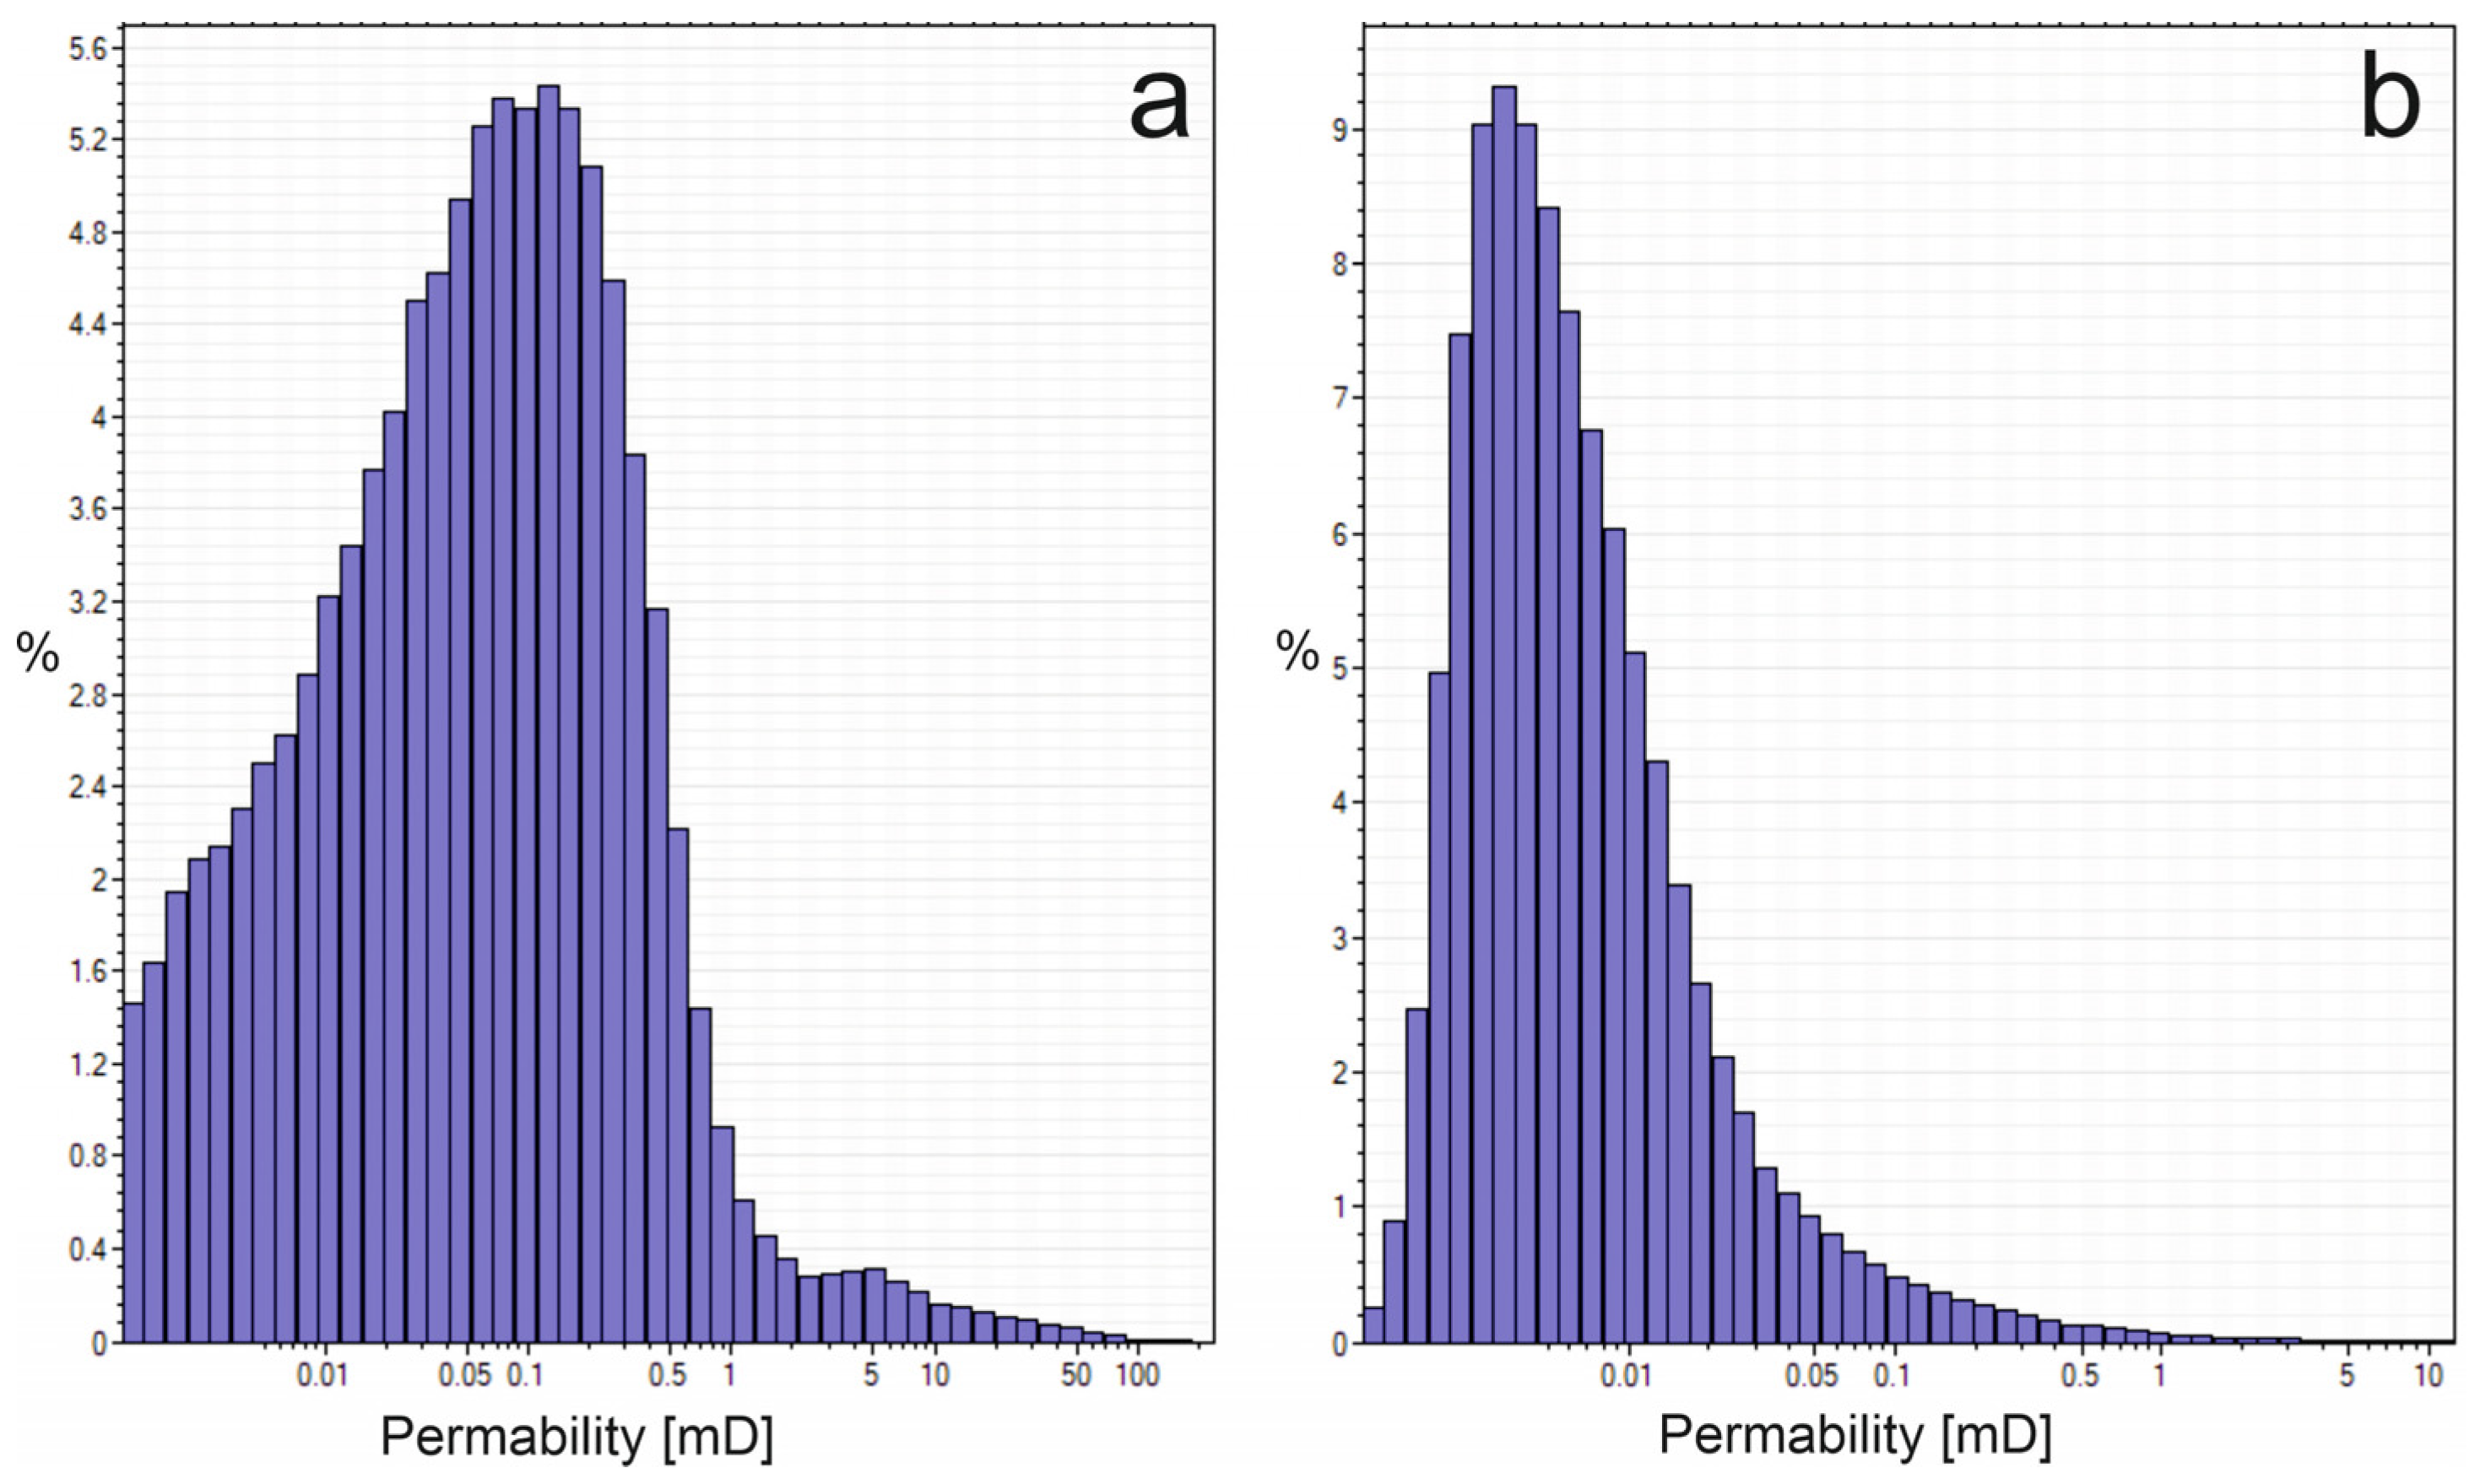
8]. Porosity ranges from 0 to 6% (average 2.2%) and the average permeability calculated based on the 3D parametric model is approximately 0.4 mD, with a median value of about 0.05 mD (
Figure 1a).
The second sealing unit is represented by a Silurian mudstone–shale complex, with a thickness ranging from approximately 700 to 1400 m and an average porosity of about 3%. These formations are characterized by better sealing properties than those of the first sealing level. The average permeability of the Silurian formations, calculated based on the 3D parametric model, is approximately 0.05 mD, with a median value of about 0.005 mD (
Figure 1b).
The median absolute permeability of Silurian samples is slightly lower than that of Ordovician samples. Capillary breakthrough pressure measurements in the mercury–air system, conducted on five Silurian samples with porosities between 0.9 and 1.7%, yielded values ranging from 41 to 83 MPa. These results are typical for the corresponding lithological facies and degree of diagenesis [
9,
10,
11,
12,
13]. Combined with the relatively large thickness of the Silurian succession, this suggests that the interval represents an effective sealing formation.
3. Methodology
The modelling approach chosen for CO2 storage depends on the level of geological knowledge available for the site. There are two main strategies that can be used to simulate reservoir behaviour and plume migration.
The detailed approach requires comprehensive geological, geophysical, and reservoir data. The methodology follows that used in hydrocarbon field development [
14,
15,
16,
17,
18]. This involves the creation of geological, geochemical, and geomechanical models, combined with dynamic simulations of CO
2 plume migration within the structure and reservoir level. This work can be carried out, for example, using the Schlumberger software suite and applications, such as Petrel, Visage, and Eclipse. These tools enable the assessment of forecast storage capacity, definition of effective injection management scenarios (number of wells, their locations, injection rates, etc.), and evaluation of risks associated with injection. Coupling geological, geomechanical, mineralogical, and flow models helps to reduce uncertainty, particularly with regard to the possible activation or reactivation of faults and fractures, which are of key importance for ensuring the safety of the injection process [
19].
In contrast, the simplified approach is better suited to regional and semi-regional sites where data coverage is more limited. Here, CO
2 injection and migration are simulated using the enhanced PetroMod petroleum systems simulator, recently updated to include CCS functionalities. This approach was deemed appropriate for the current study and was therefore adopted. In this study, the modelling extends beyond the reservoir units targeted for CO
2 injection to include both overlying and underlying formations. This encompasses the full overburden (up to the land surface or seabed) as well as the lithostratigraphic units beneath the reservoir. In both approaches, the sealing capacity of the host rock, caprock formations and fault zones is crucial. For petroleum system analysis, this is evaluated over geological timescales to determine the likelihood of hydrocarbon preservation. However, for CCS applications, the focus shifts from present-day conditions into the future, covering both the operational life of the storage site and the post-closure monitoring phase [
12,
20,
21].
3.1. Structural and Parametric Model
Well and seismic data were used to create structural and parametric models of the study area, the later describing the spatial distribution of key reservoir properties. Geostatistical methods were employed to map clay content, porosity, and permeability within the stratigraphic units. The structural model defines the geometric framework of the parameterised volume of a geological formation. This was constructed using depth maps of the tops of individual lithostratigraphic intervals as interpreted from 2D seismic data, as well as tectonic dislocation zones (faults), which also defined the lateral boundaries. To achieve sufficient resolution, both the Paradoxides paradoxissimus (Cm2pp) reservoir horizon and the sealing (O) horizon were both divided into five sublayers. The horizontal grid spacing was set at 250 × 250 m and the modelled area covers a rectangle measuring approx. 50 × 25 km.
Parametric models depicting the spatial distribution of petrophysical parameter variability for individual lithostratigraphic sections, as well as the distribution of clay content, were created based on the results of geophysical interpretation integrated into the geostatistical modelling process for the spatial distributions of these parameters and seismic attributes, using correlation relationships between petrophysical parameters of the analysed geological formations and seismic attributes in the Petrel programme (
Figure 2).
Since porosity correlates with clay content, the spatial distribution of clay minerals was incorporated into the modelling of the spatial distribution of porosity. A similar approach was applied to the spatial distribution of permeability, based on the correlation between permeability and porosity.
Simulations of CO2 injection and plume migration were then performed in PetroMod. A key task was to precisely reconstruct spatial distributions of petrophysical parameters (porosity and permeability) of the reservoir and sealing formations and implement them in the PetroMod simulation model. This required the introduction of an appropriate number of lithological facies within each horizon, differing in terms of the values and mutual relationships of the petrophysical parameters.
The construction of lithological models for both the reservoir facies and the first sealing facies was carried out by defining, for each model, the appropriate lithologies, compaction curves, and porosity–permeability relationships. This approach aimed to accurately reproduce the spatial distribution of these properties (porosity and permeability) in accordance with the distributions obtained from parametric models developed using geostatistical procedures in Petrel. The percentage composition of petrographic components and the range of filtration parameters for each reservoir rock facies are summarized in
Table 1.
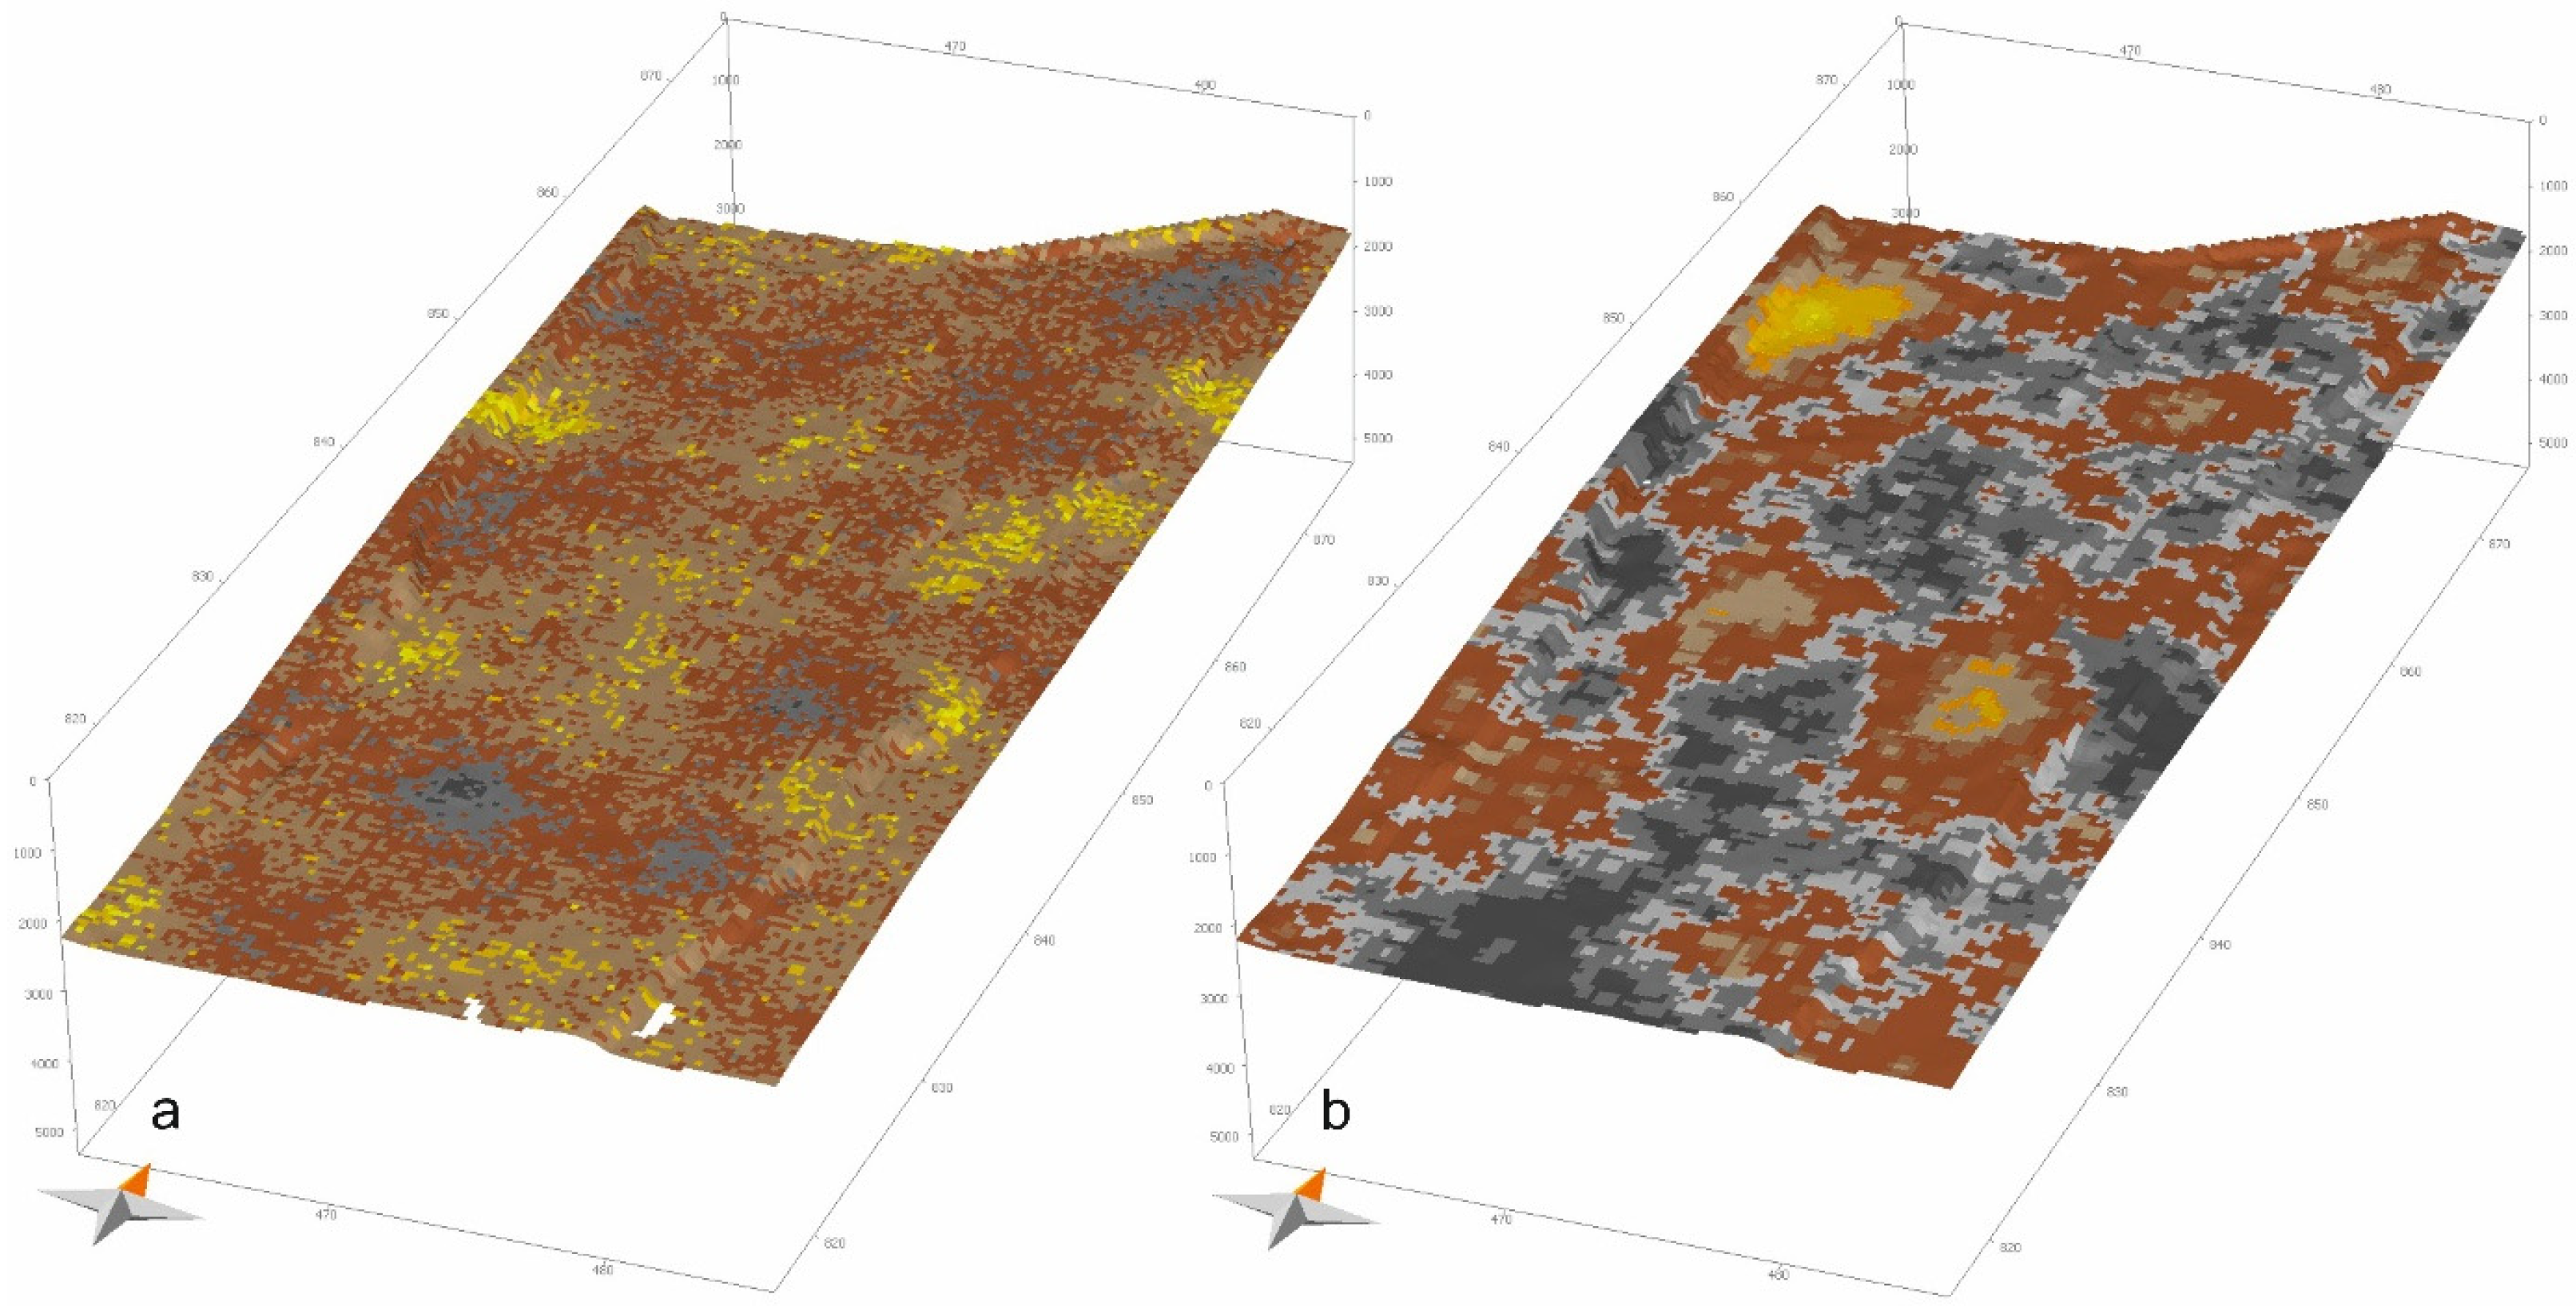
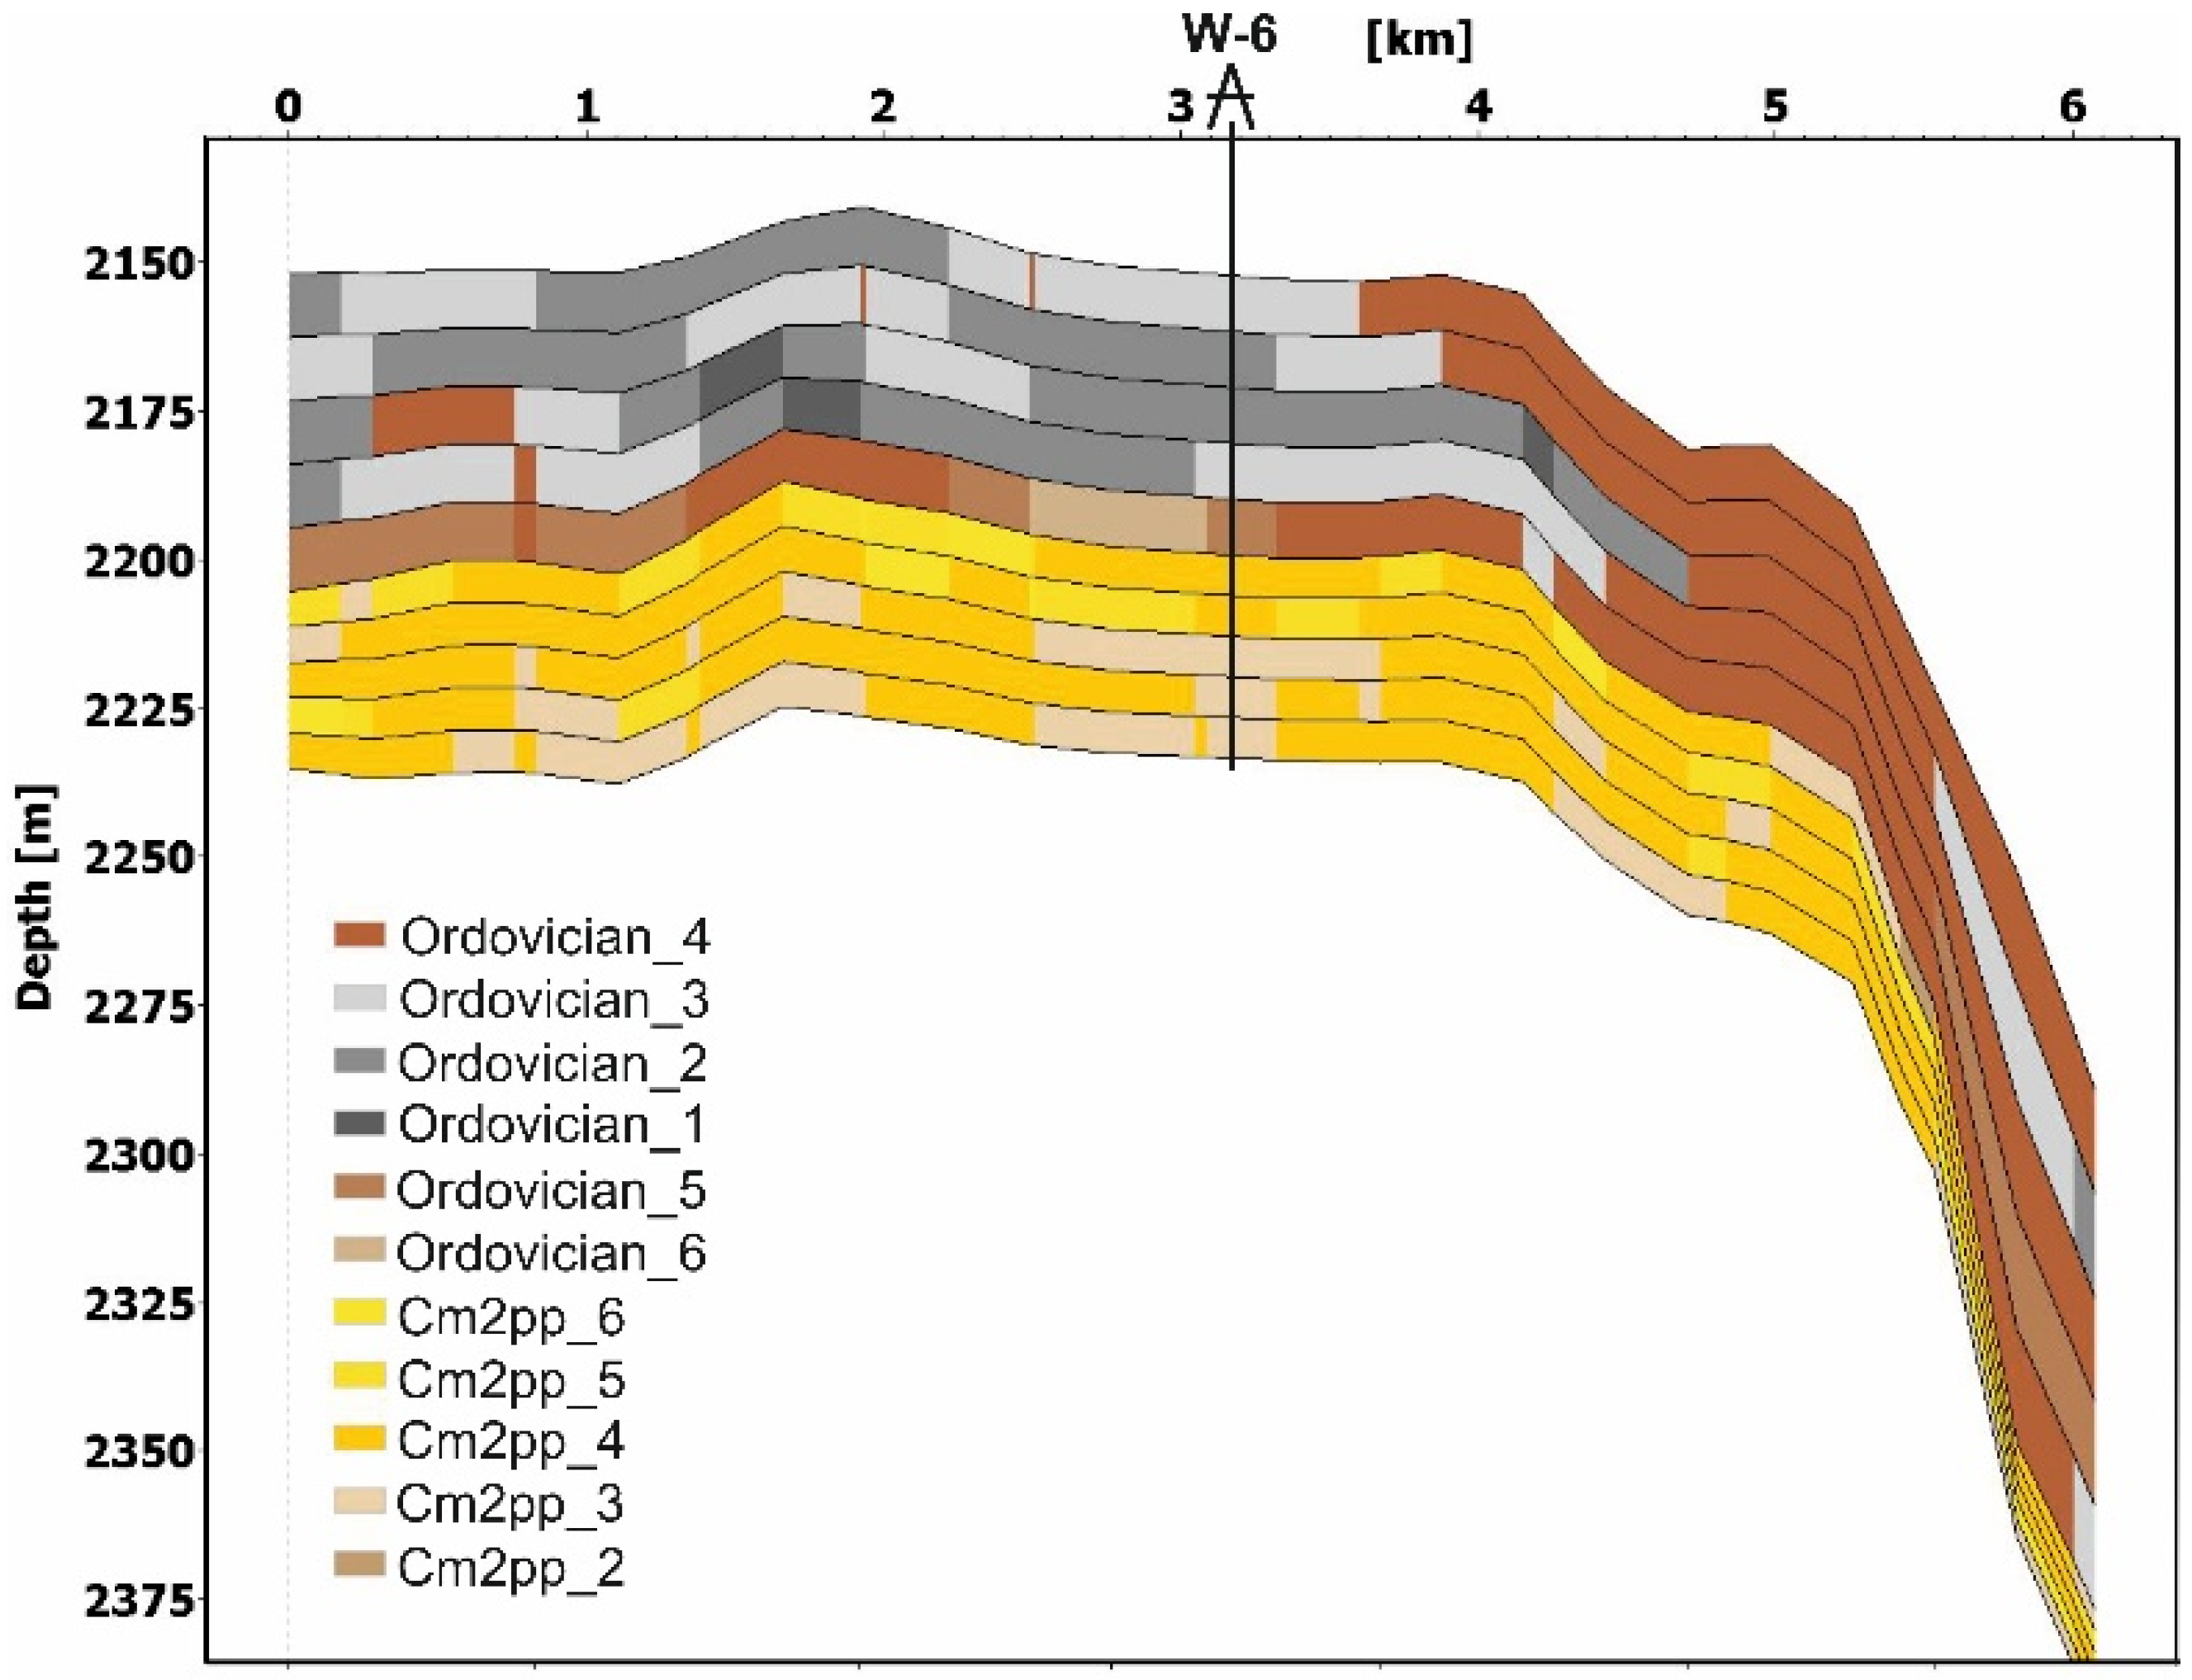
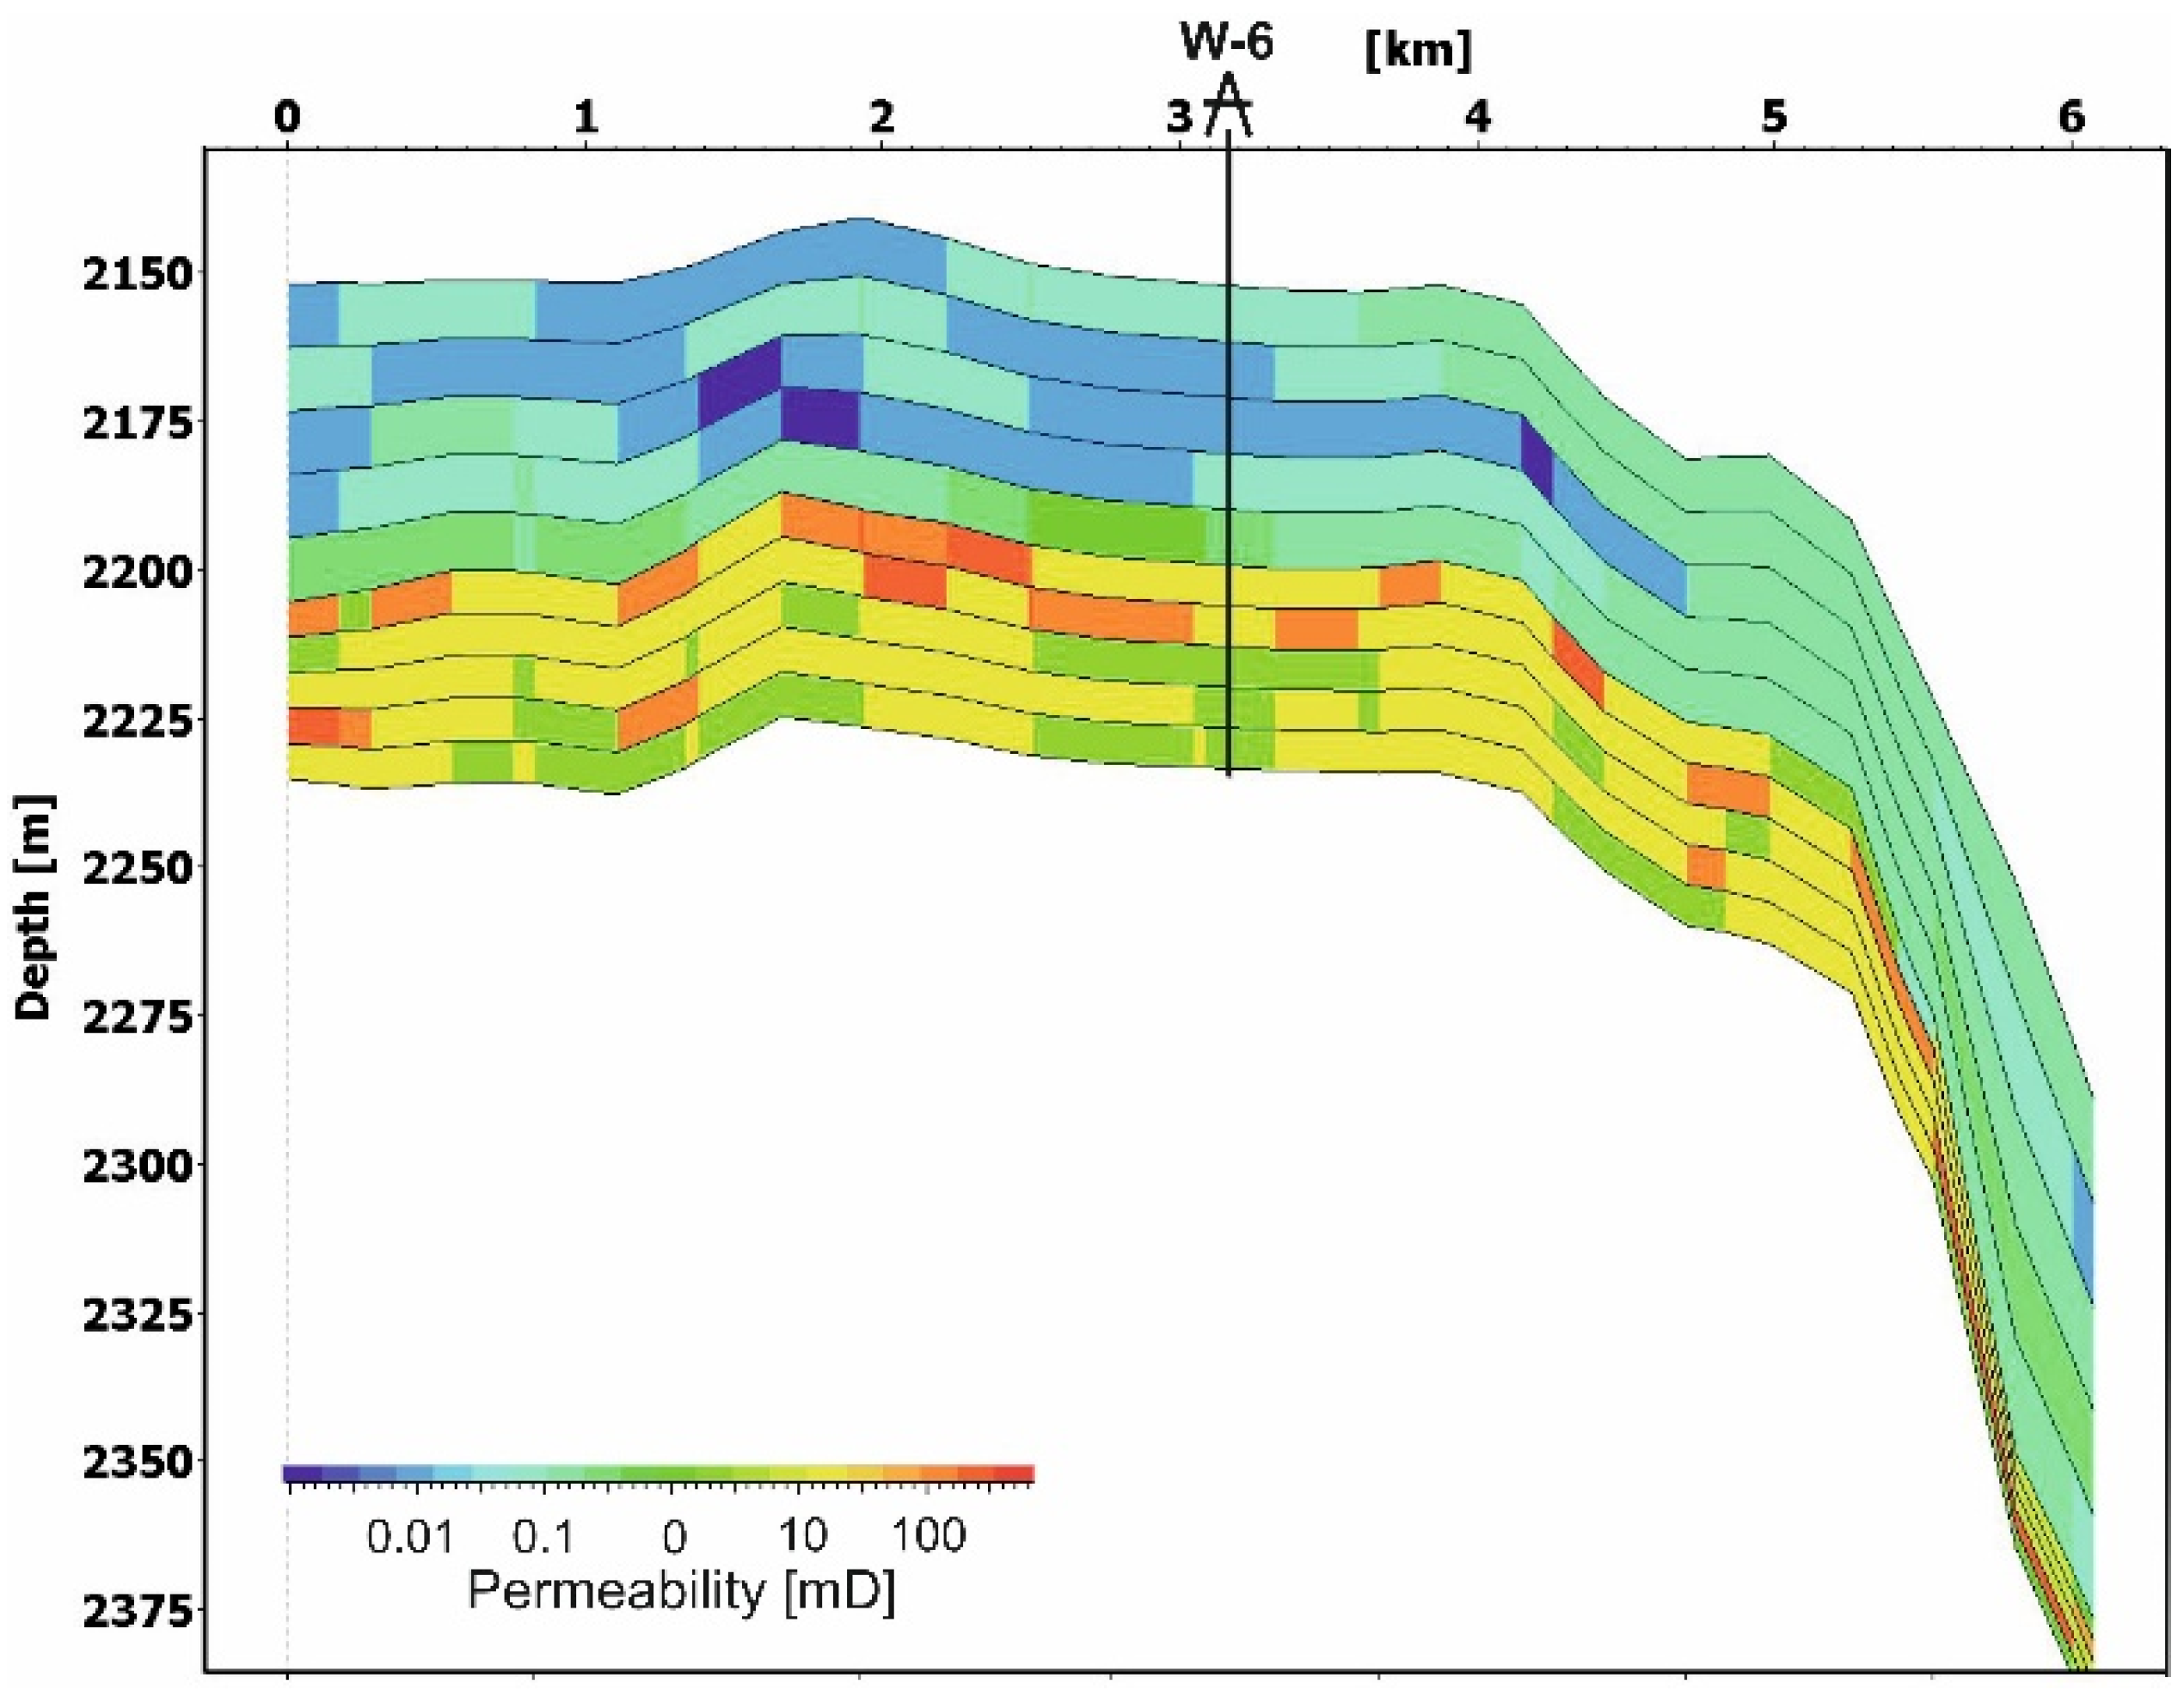
The lithological models that define the porosity/permeability relationships for each facies were iteratively calibrated. Six facies were defined for the reservoir horizon and ten for the sealing horizon. Each facies were defined based on values of such properties as shale content as well as porosity and permeability. Their spatial distributions in representative sublayers of the reservoir and sealing horizons are shown in
Figure 3. The introduction of these lithological models into the geological model enabled accurate reproduction of the variation and spatial distributions of porosity and permeability across both reservoir and sealing horizons.
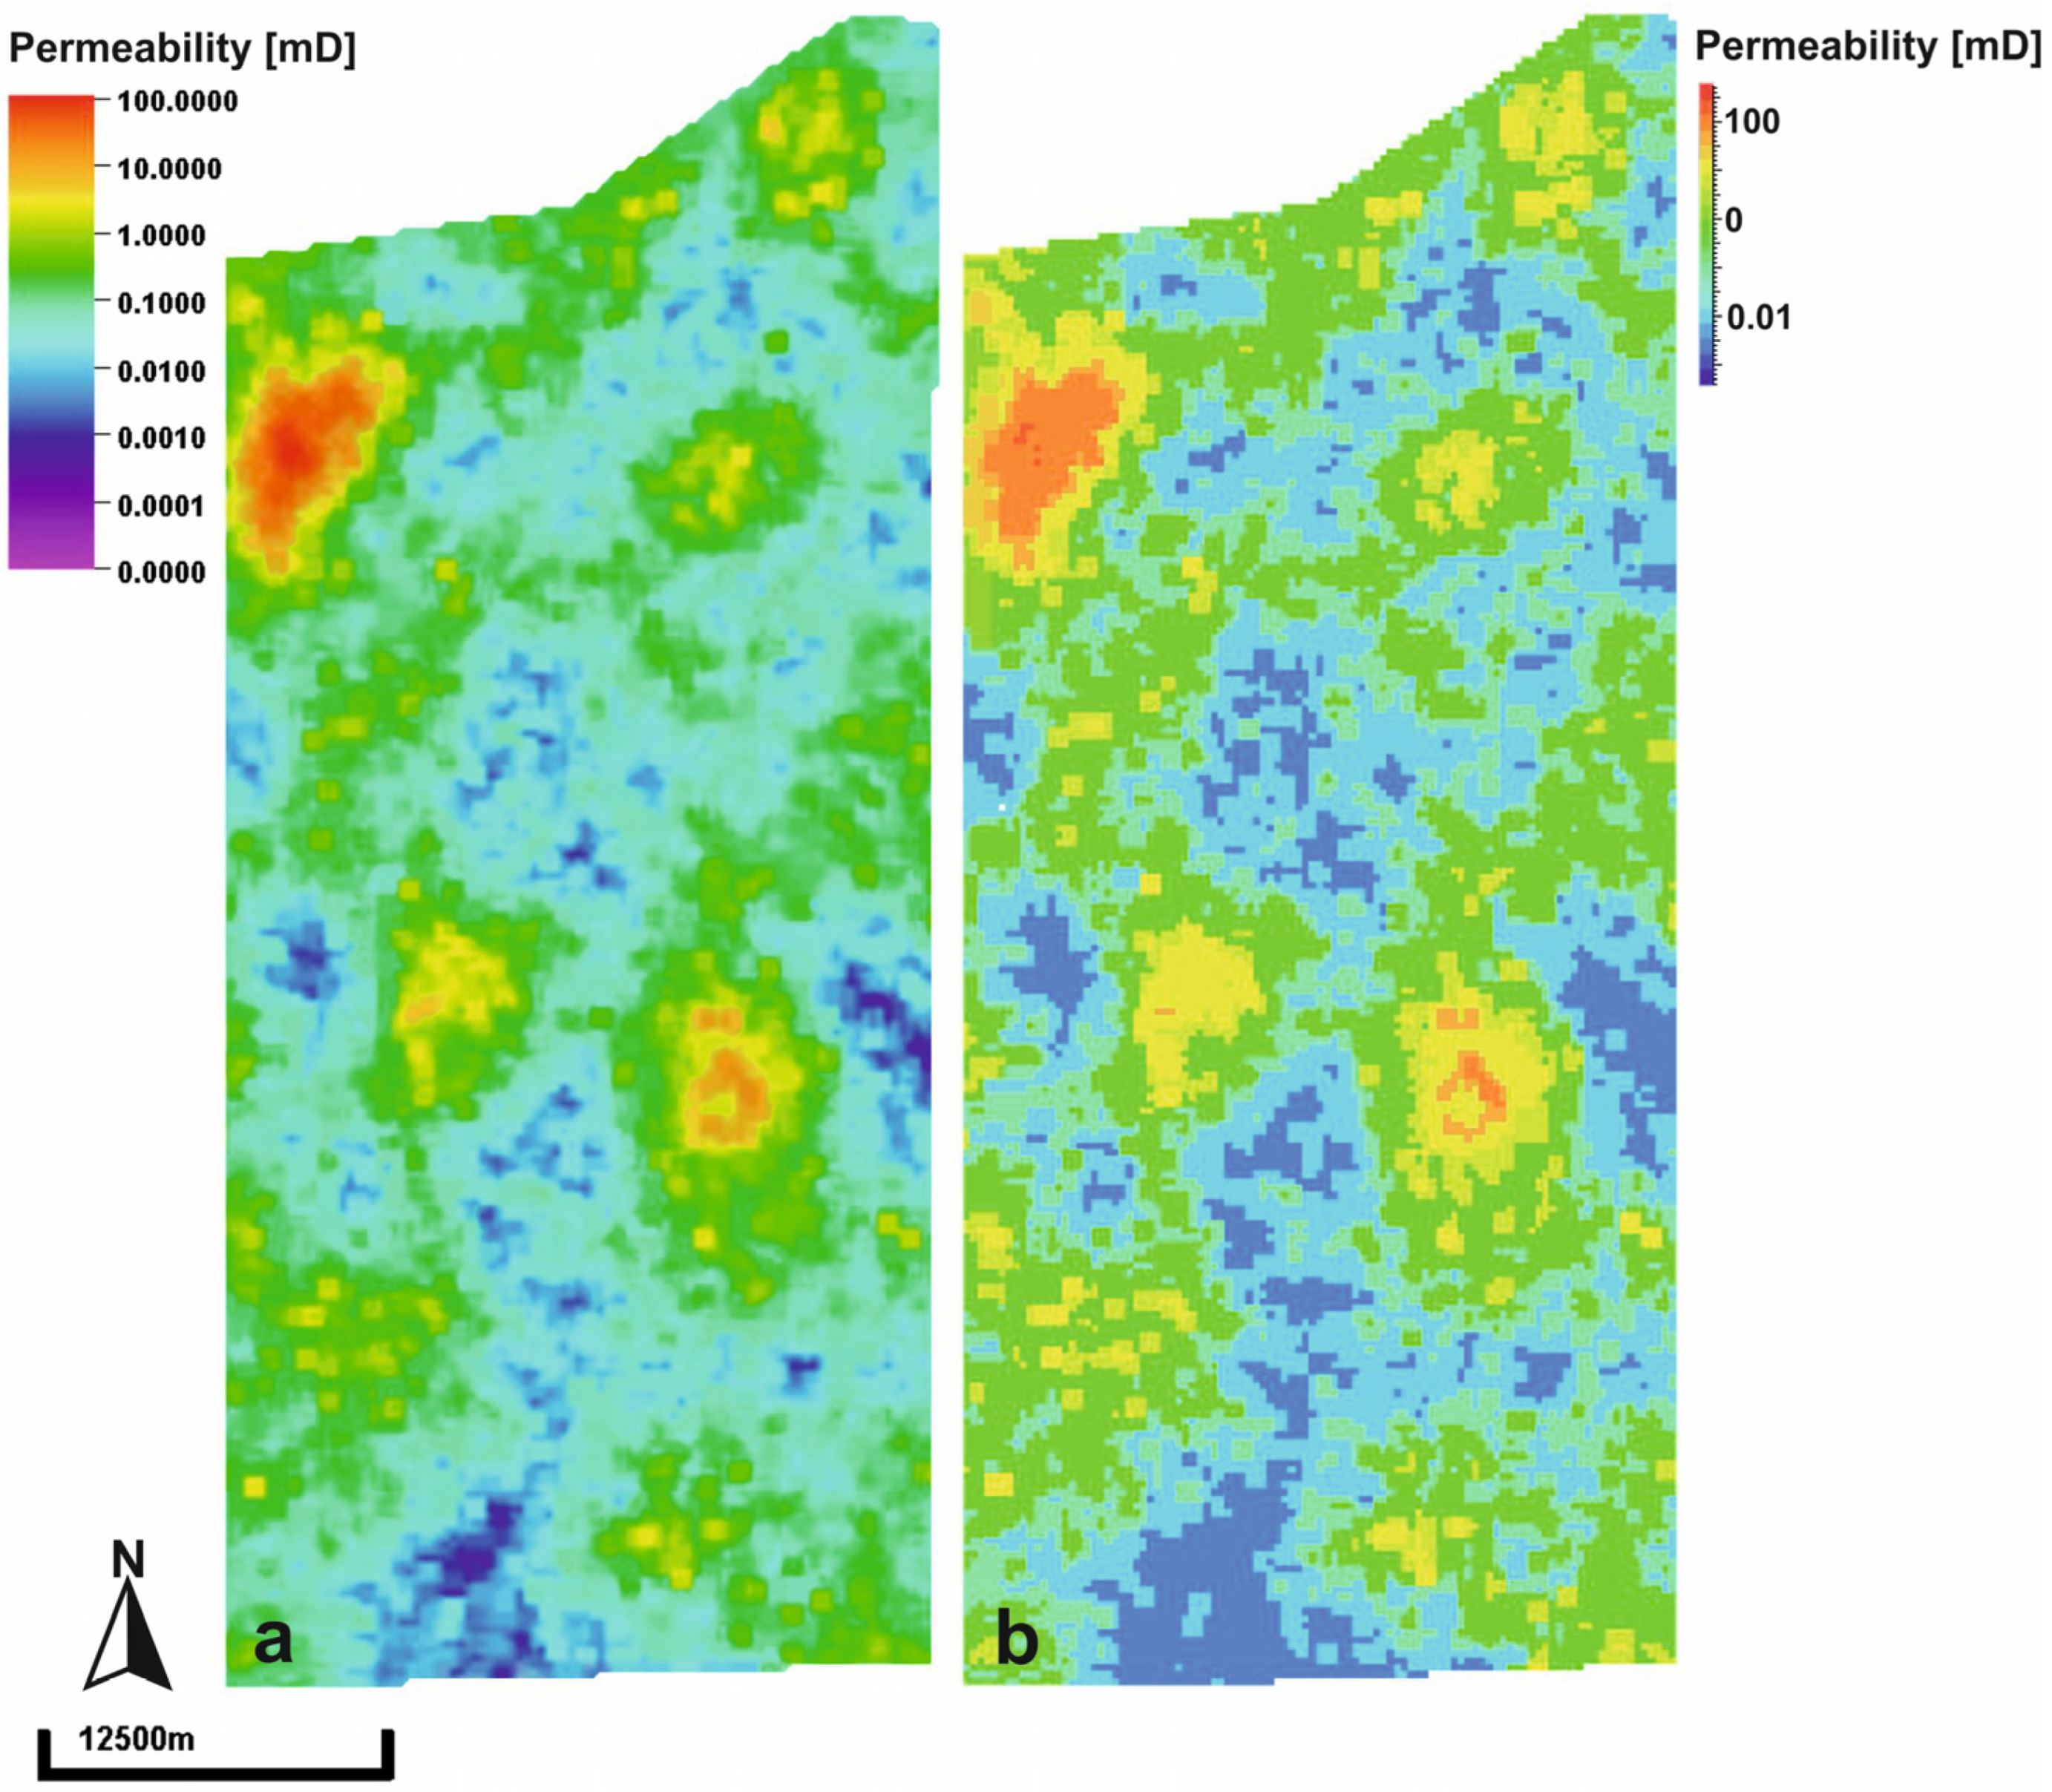
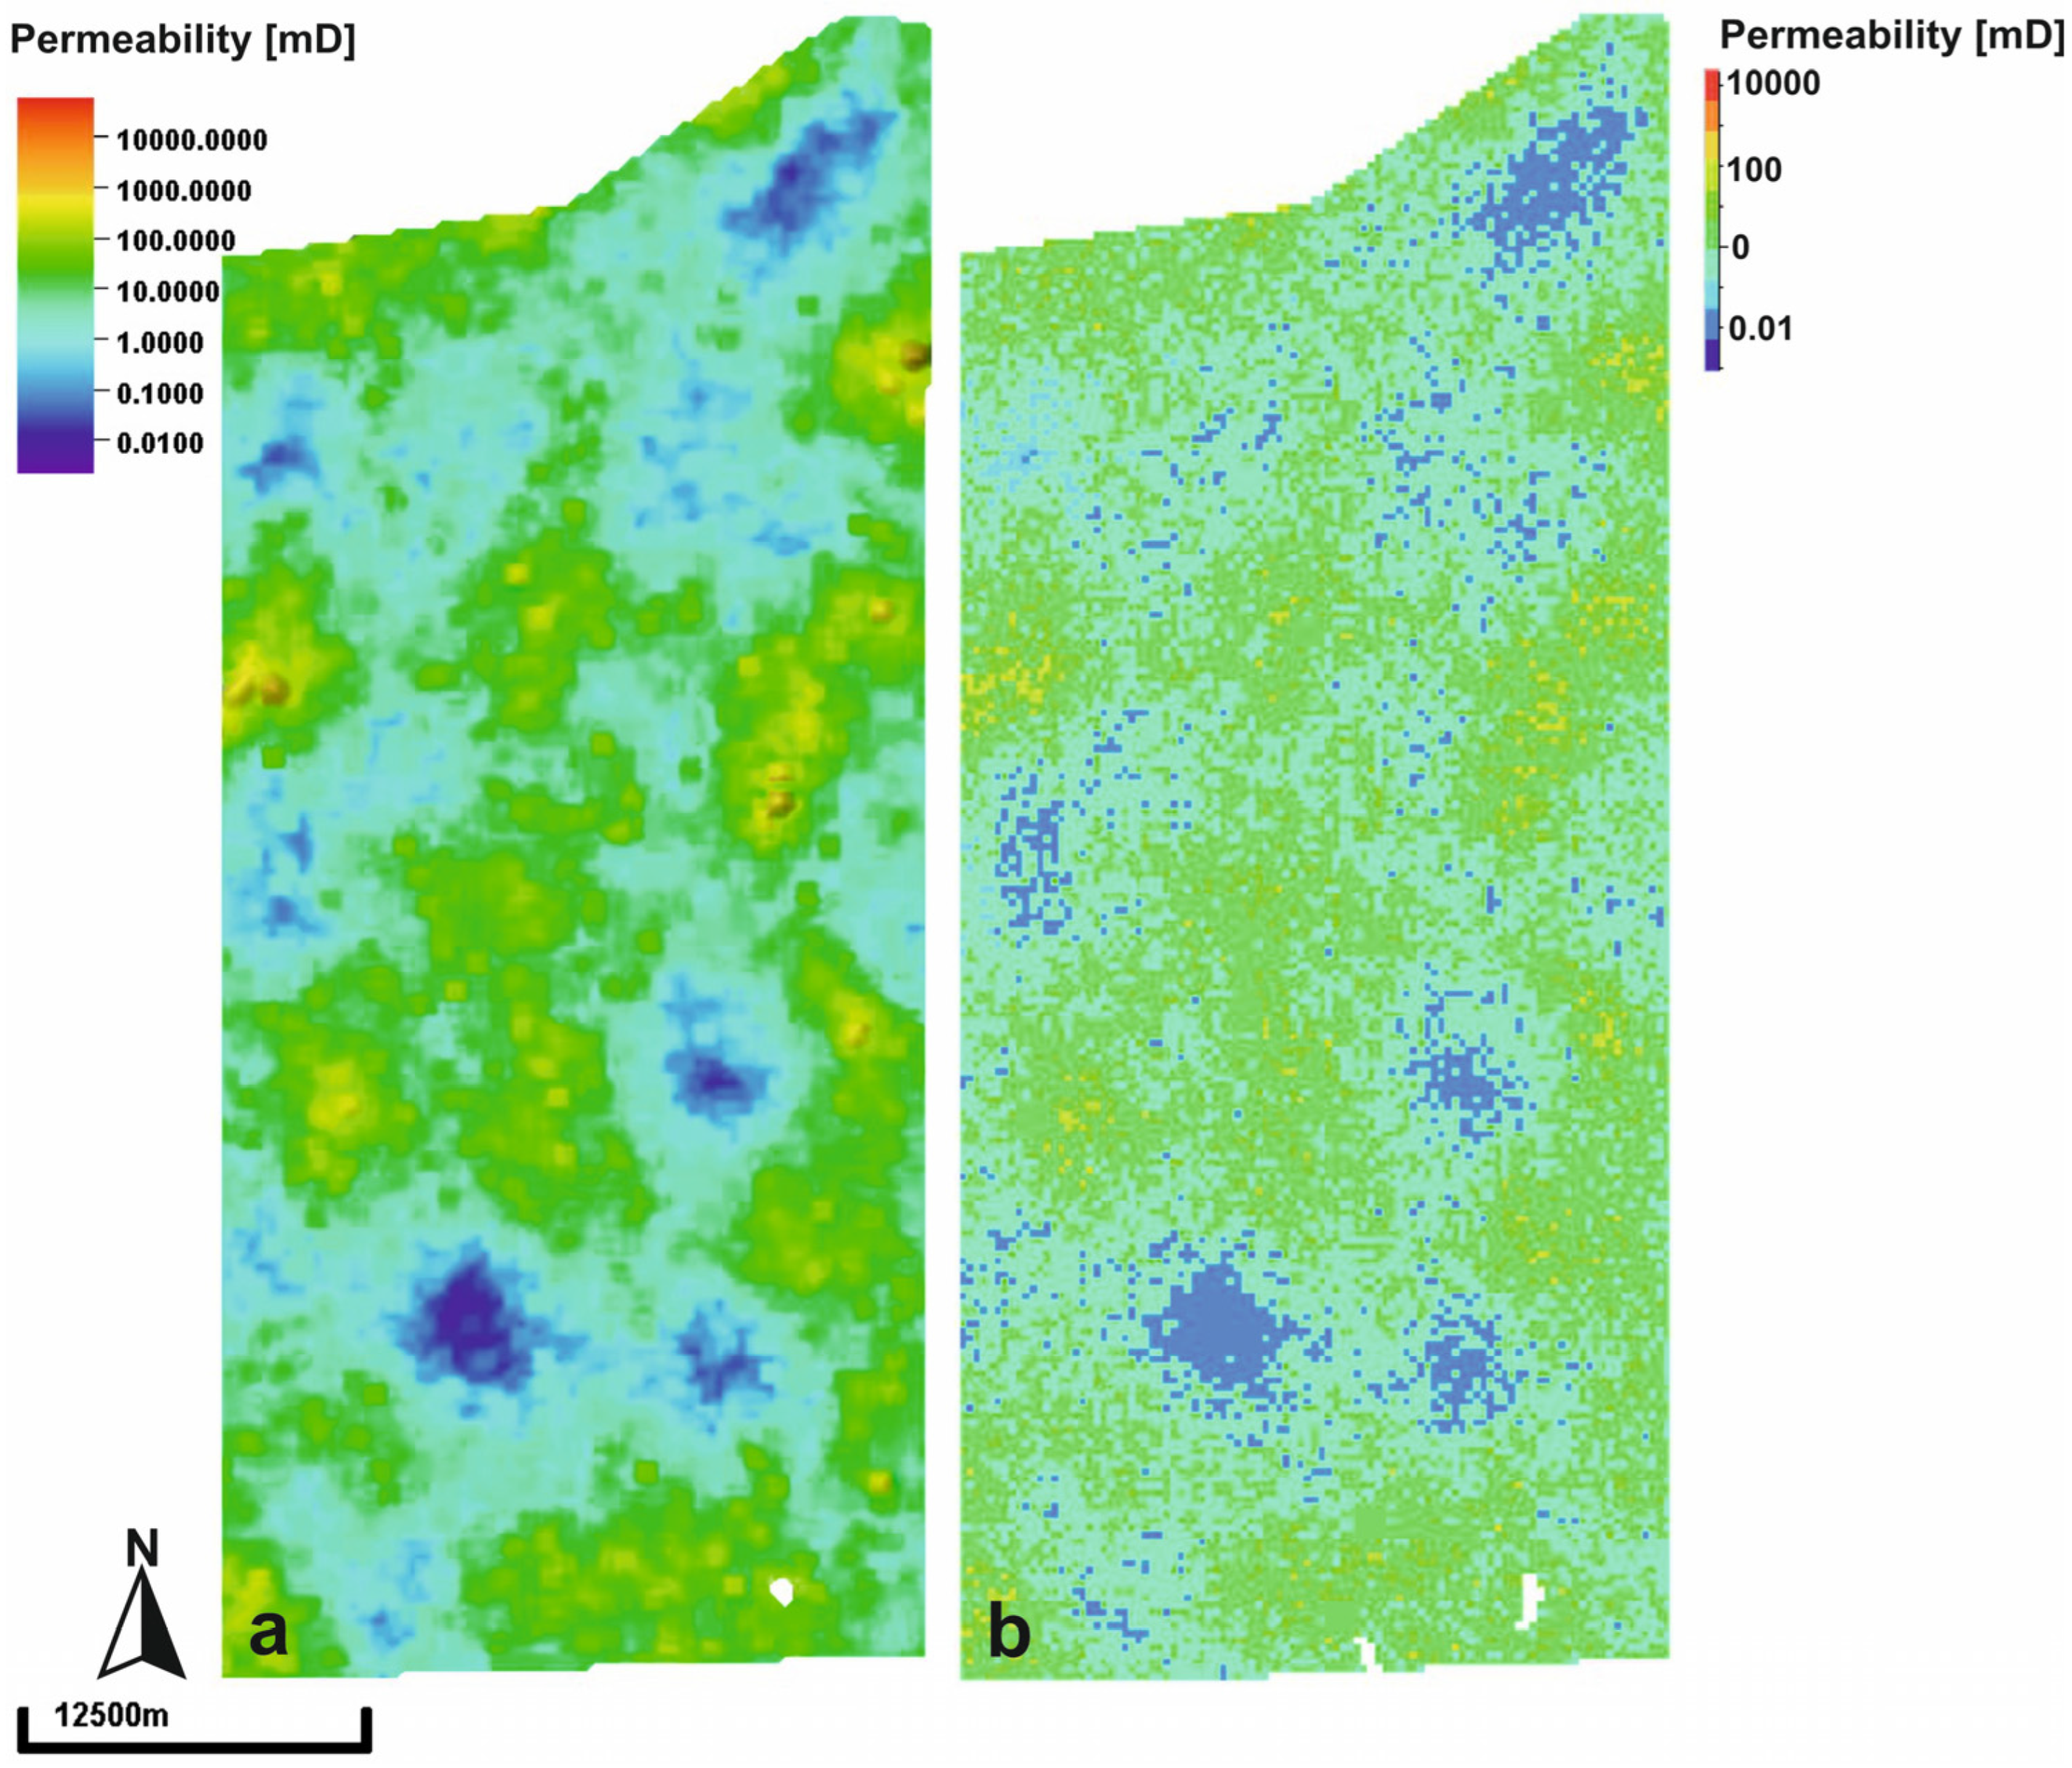
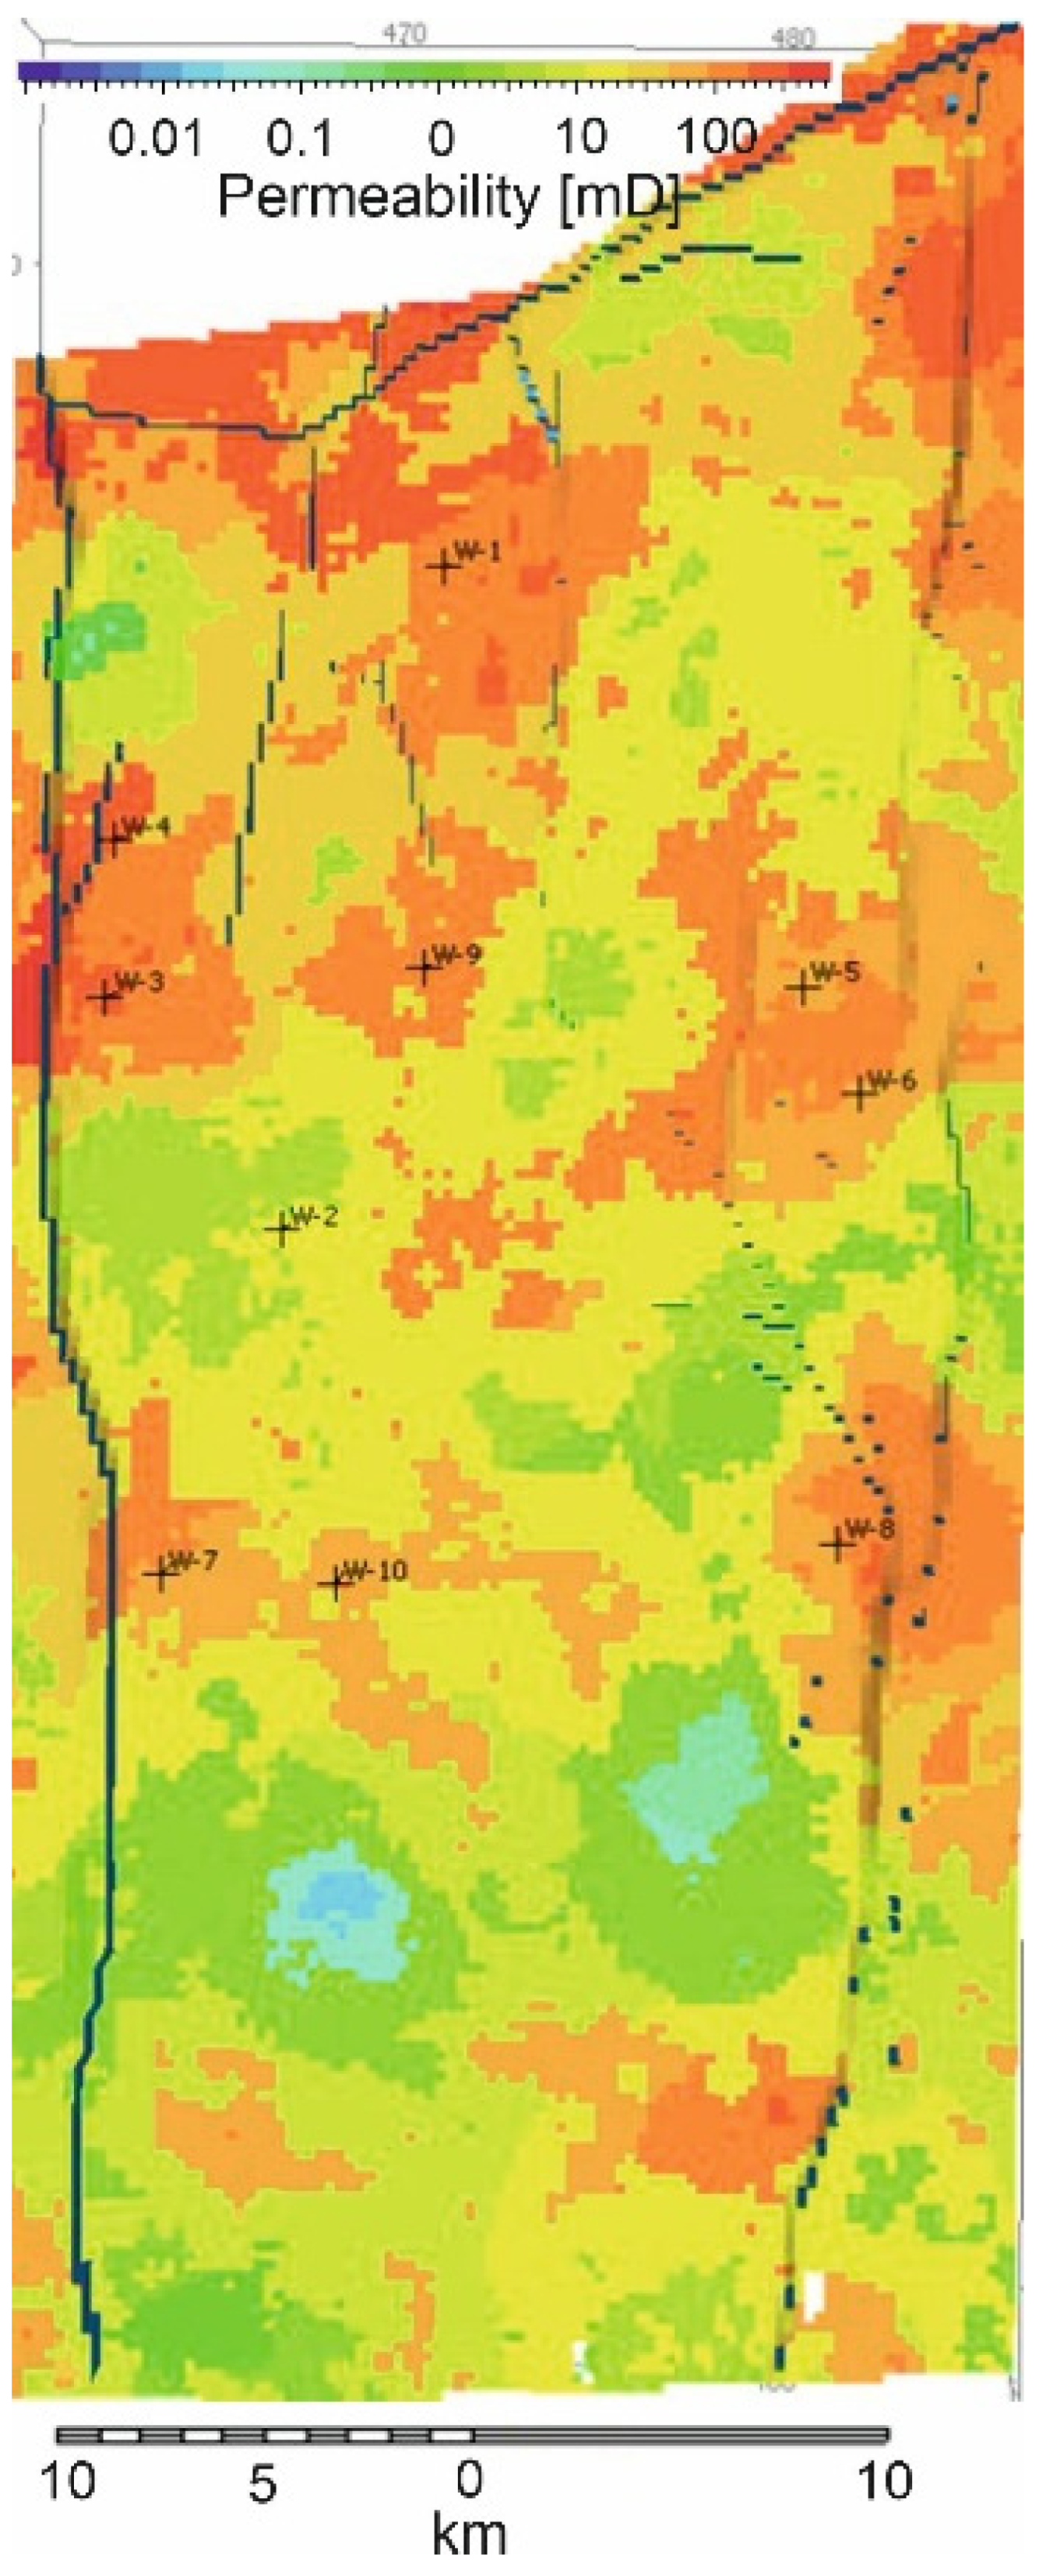
Figure 4 and
Figure 5 illustrate the comparison of permeability across selected sublayers of the reservoir and the sealing horizon I between Petromod and Petrel. The differences are due to different upscaling methods, since Petrel uses Cell based values and Petromod node point data.
In order to determine the sequestration potential of the selected structure, it was also necessary to assess the permeability of the fault zones which define the boundaries of the structure. The presence of oil and gas accumulations in fault-adjacent zones within the Cm2pp horizon, both, inside and outside the study area, suggests that these faults may act as effective seals. Nevertheless, the presence of structures devoid of hydrocarbons within the same context raises doubts. Consequently, the verification of fault seal capacity was treated as a priority task in the present study.
PetroMod provides a number of alternative procedures for estimating fault seal capacity, with each procedure reliant on a distinct set of input data. One such algorithm is based on the Shale Gouge Ratio (SGR) [
22]. The concept is expressed by Equation (1) and evaluates the contact relationships along a fault plane between reservoir and sealing layers, together with their clay mineral content, which are brought into juxtaposition by tectonic displacement (
Figure 6).
where Vcl—clay content from the parametric model,
—layer thickness, d—fault throw.
However, an assessment of fault sealing based solely on SGR distribution for reservoir media such as water, hydrocarbons, or CO
2 carries the risk of overestimating sealing capacity [
23,
24,
25]. In such cases, it has been demonstrated that the application of two additional parameters, i.e., Fault Permeability Prediction (FPP) and Fault Capillary Pressure (FCP), can yield more robust results.: Both are functions of several factors, including the clay content coefficient derived from SGR [
24] described a strong relationship between threshold pressure and permeability, which are expressed by the following formulas:
where V
f—clay content coefficient (SGR), z
max—maximum burial depth, z
f—depth at the time of faulting; constants: a
1 = 80,000, a
2 = 19.4, a
3 = 0.00403, a
4 = 0.0055, a
5 = 12.5.
where k
f—fault zone permeability.
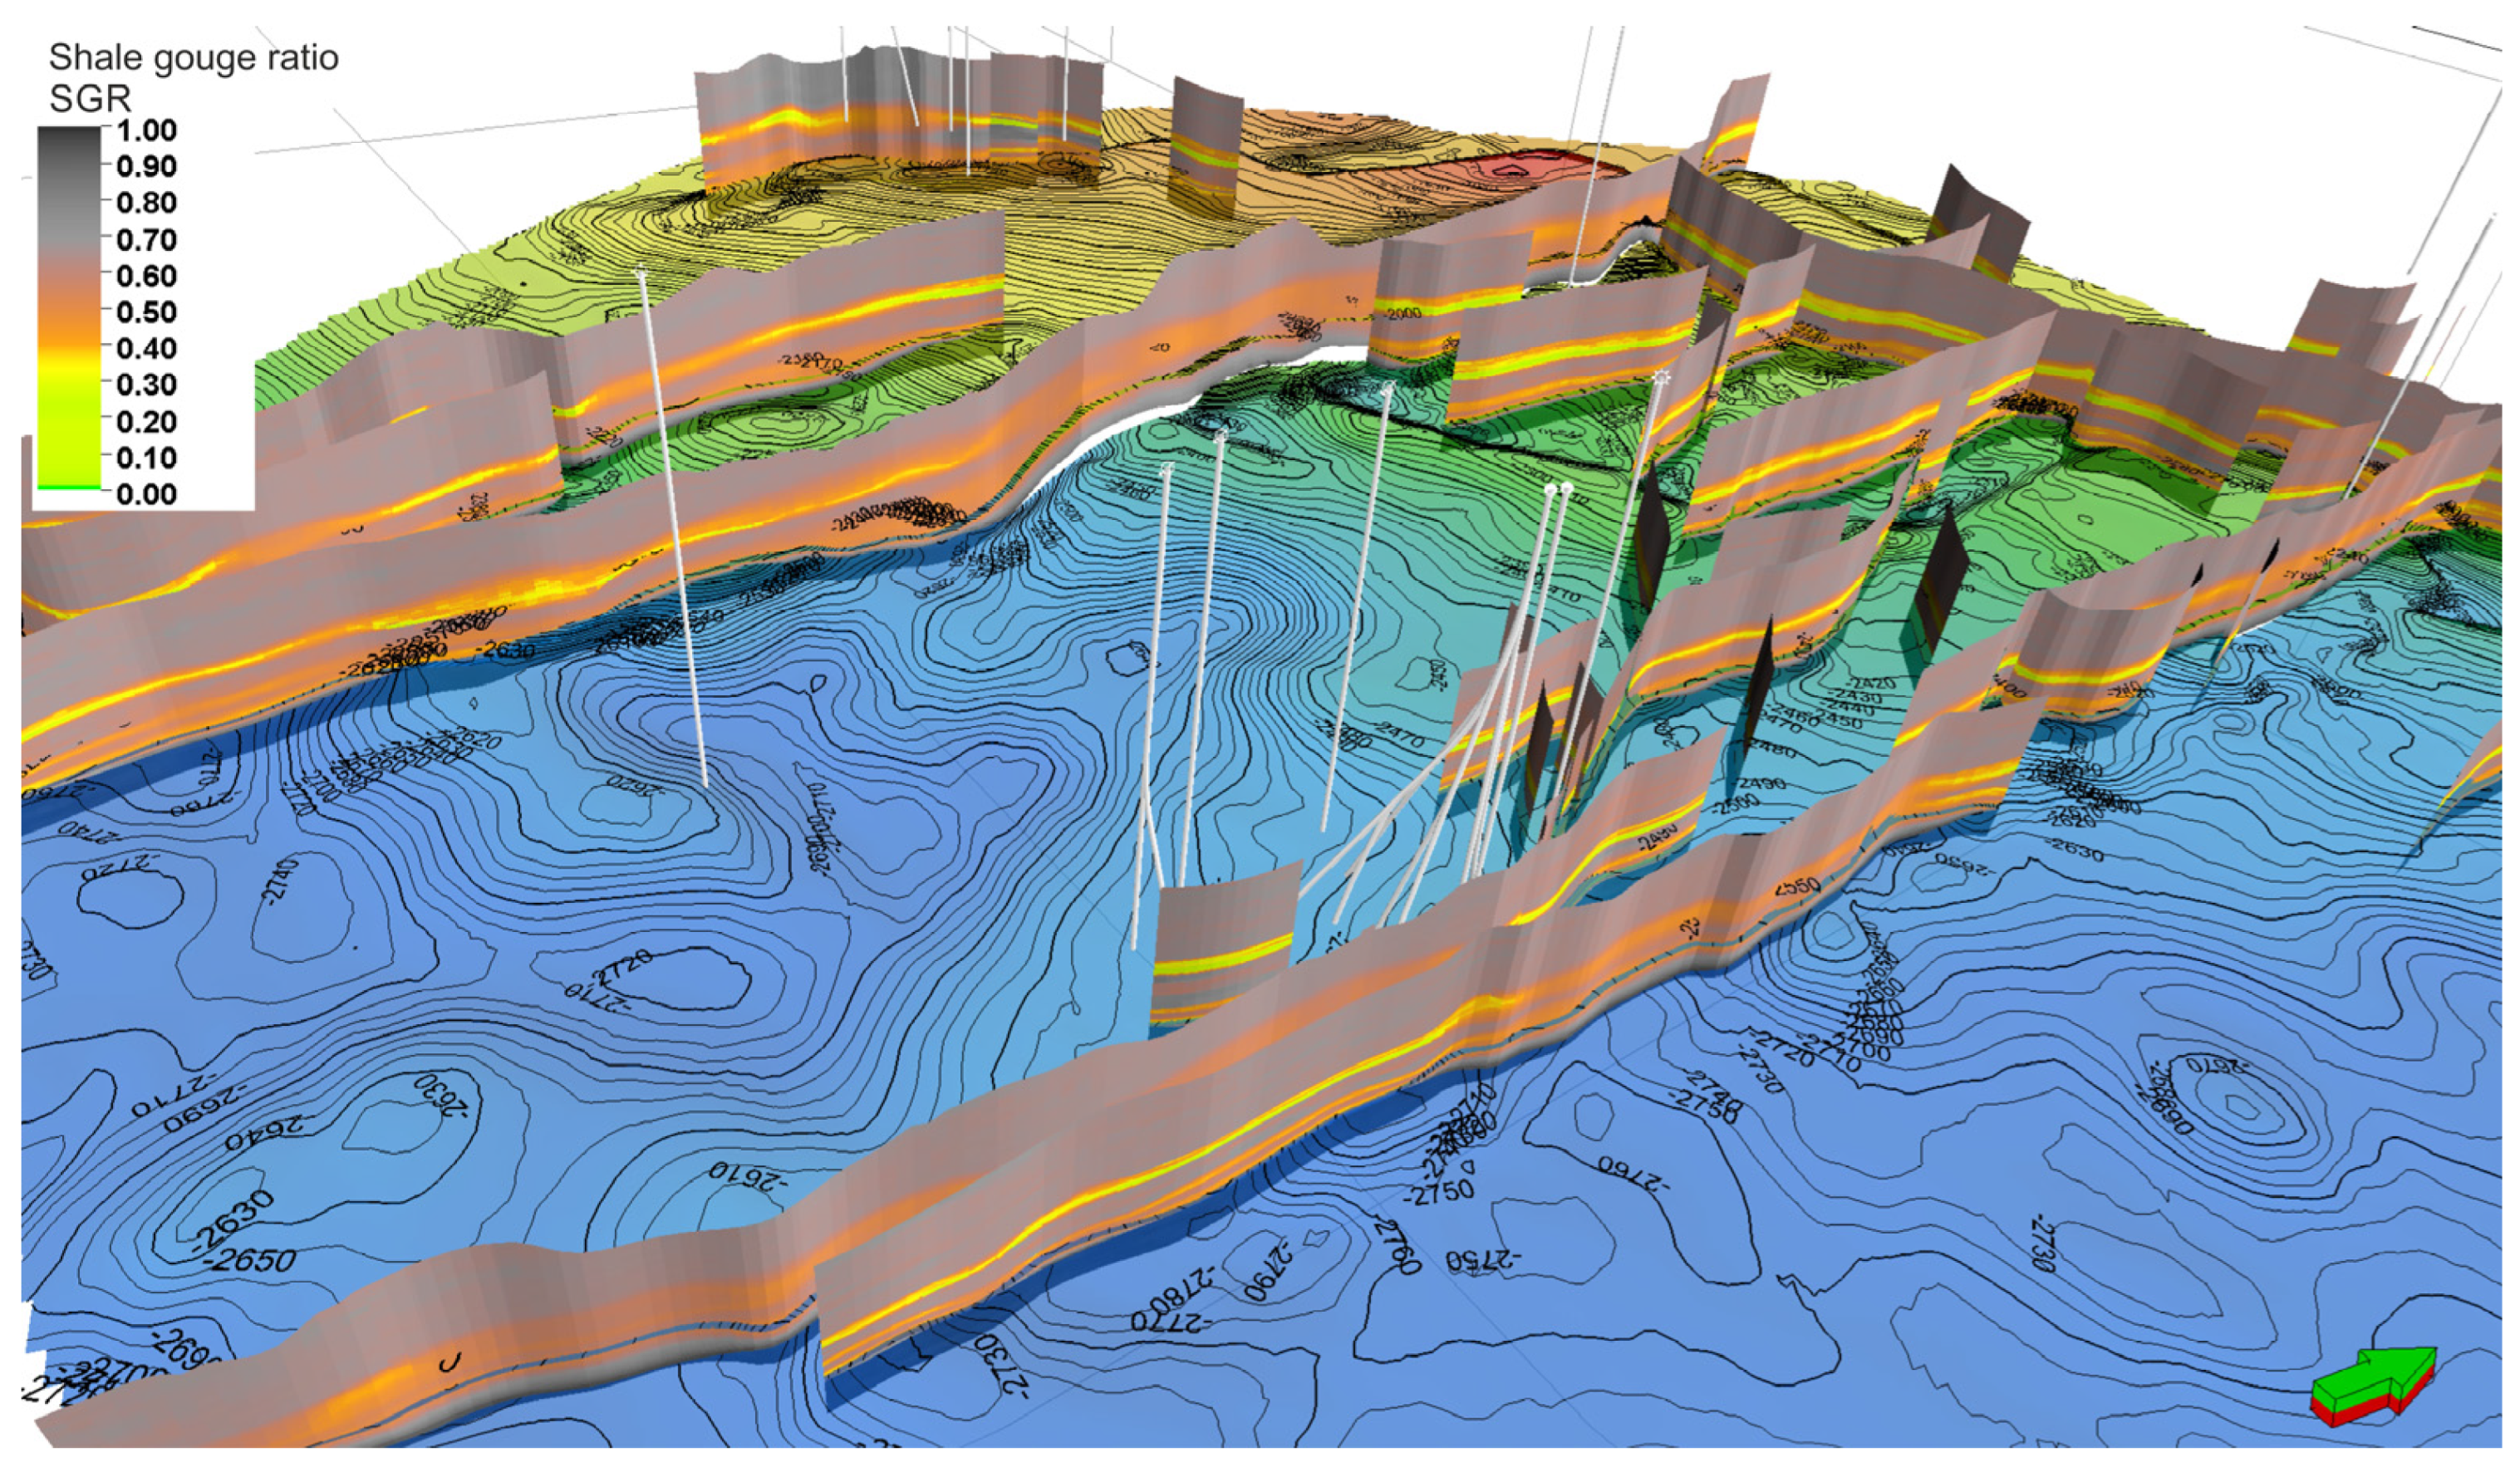
The SGR distribution calculations were performed in Petrel, based on a clay content model constructed from the interpretation of well log data from wells within the study area. The results are presented in
Figure 7.
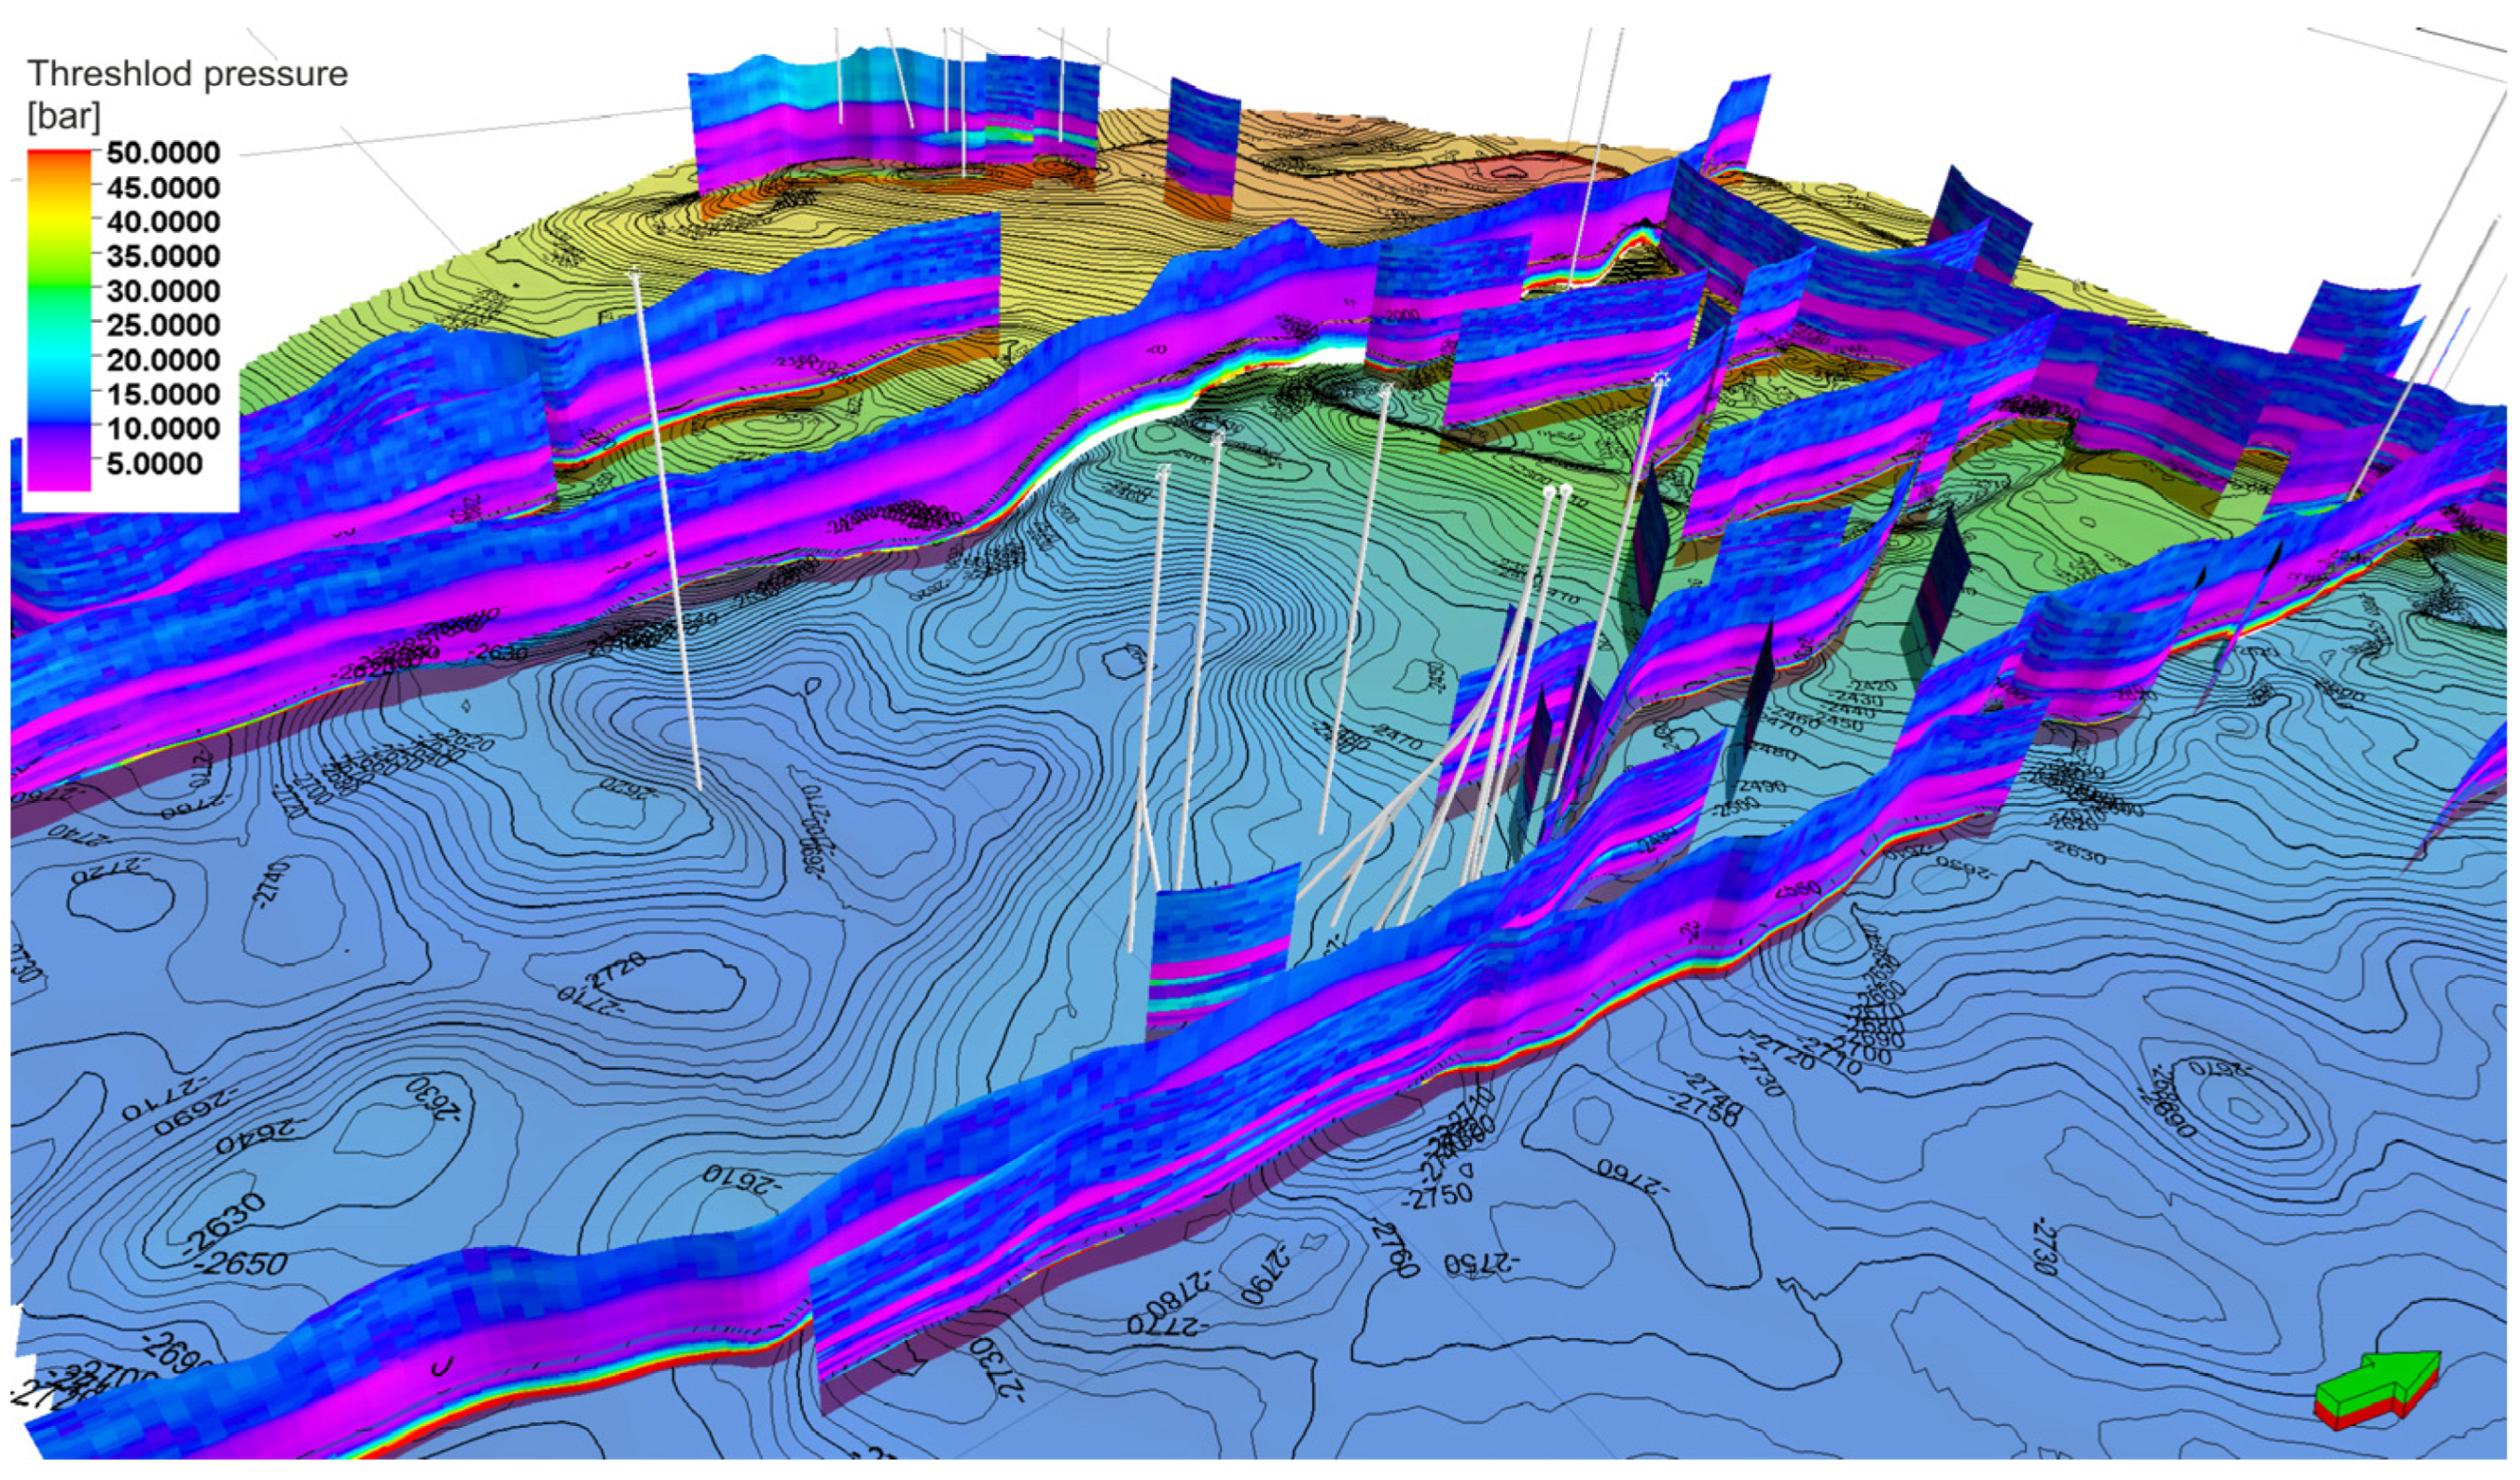
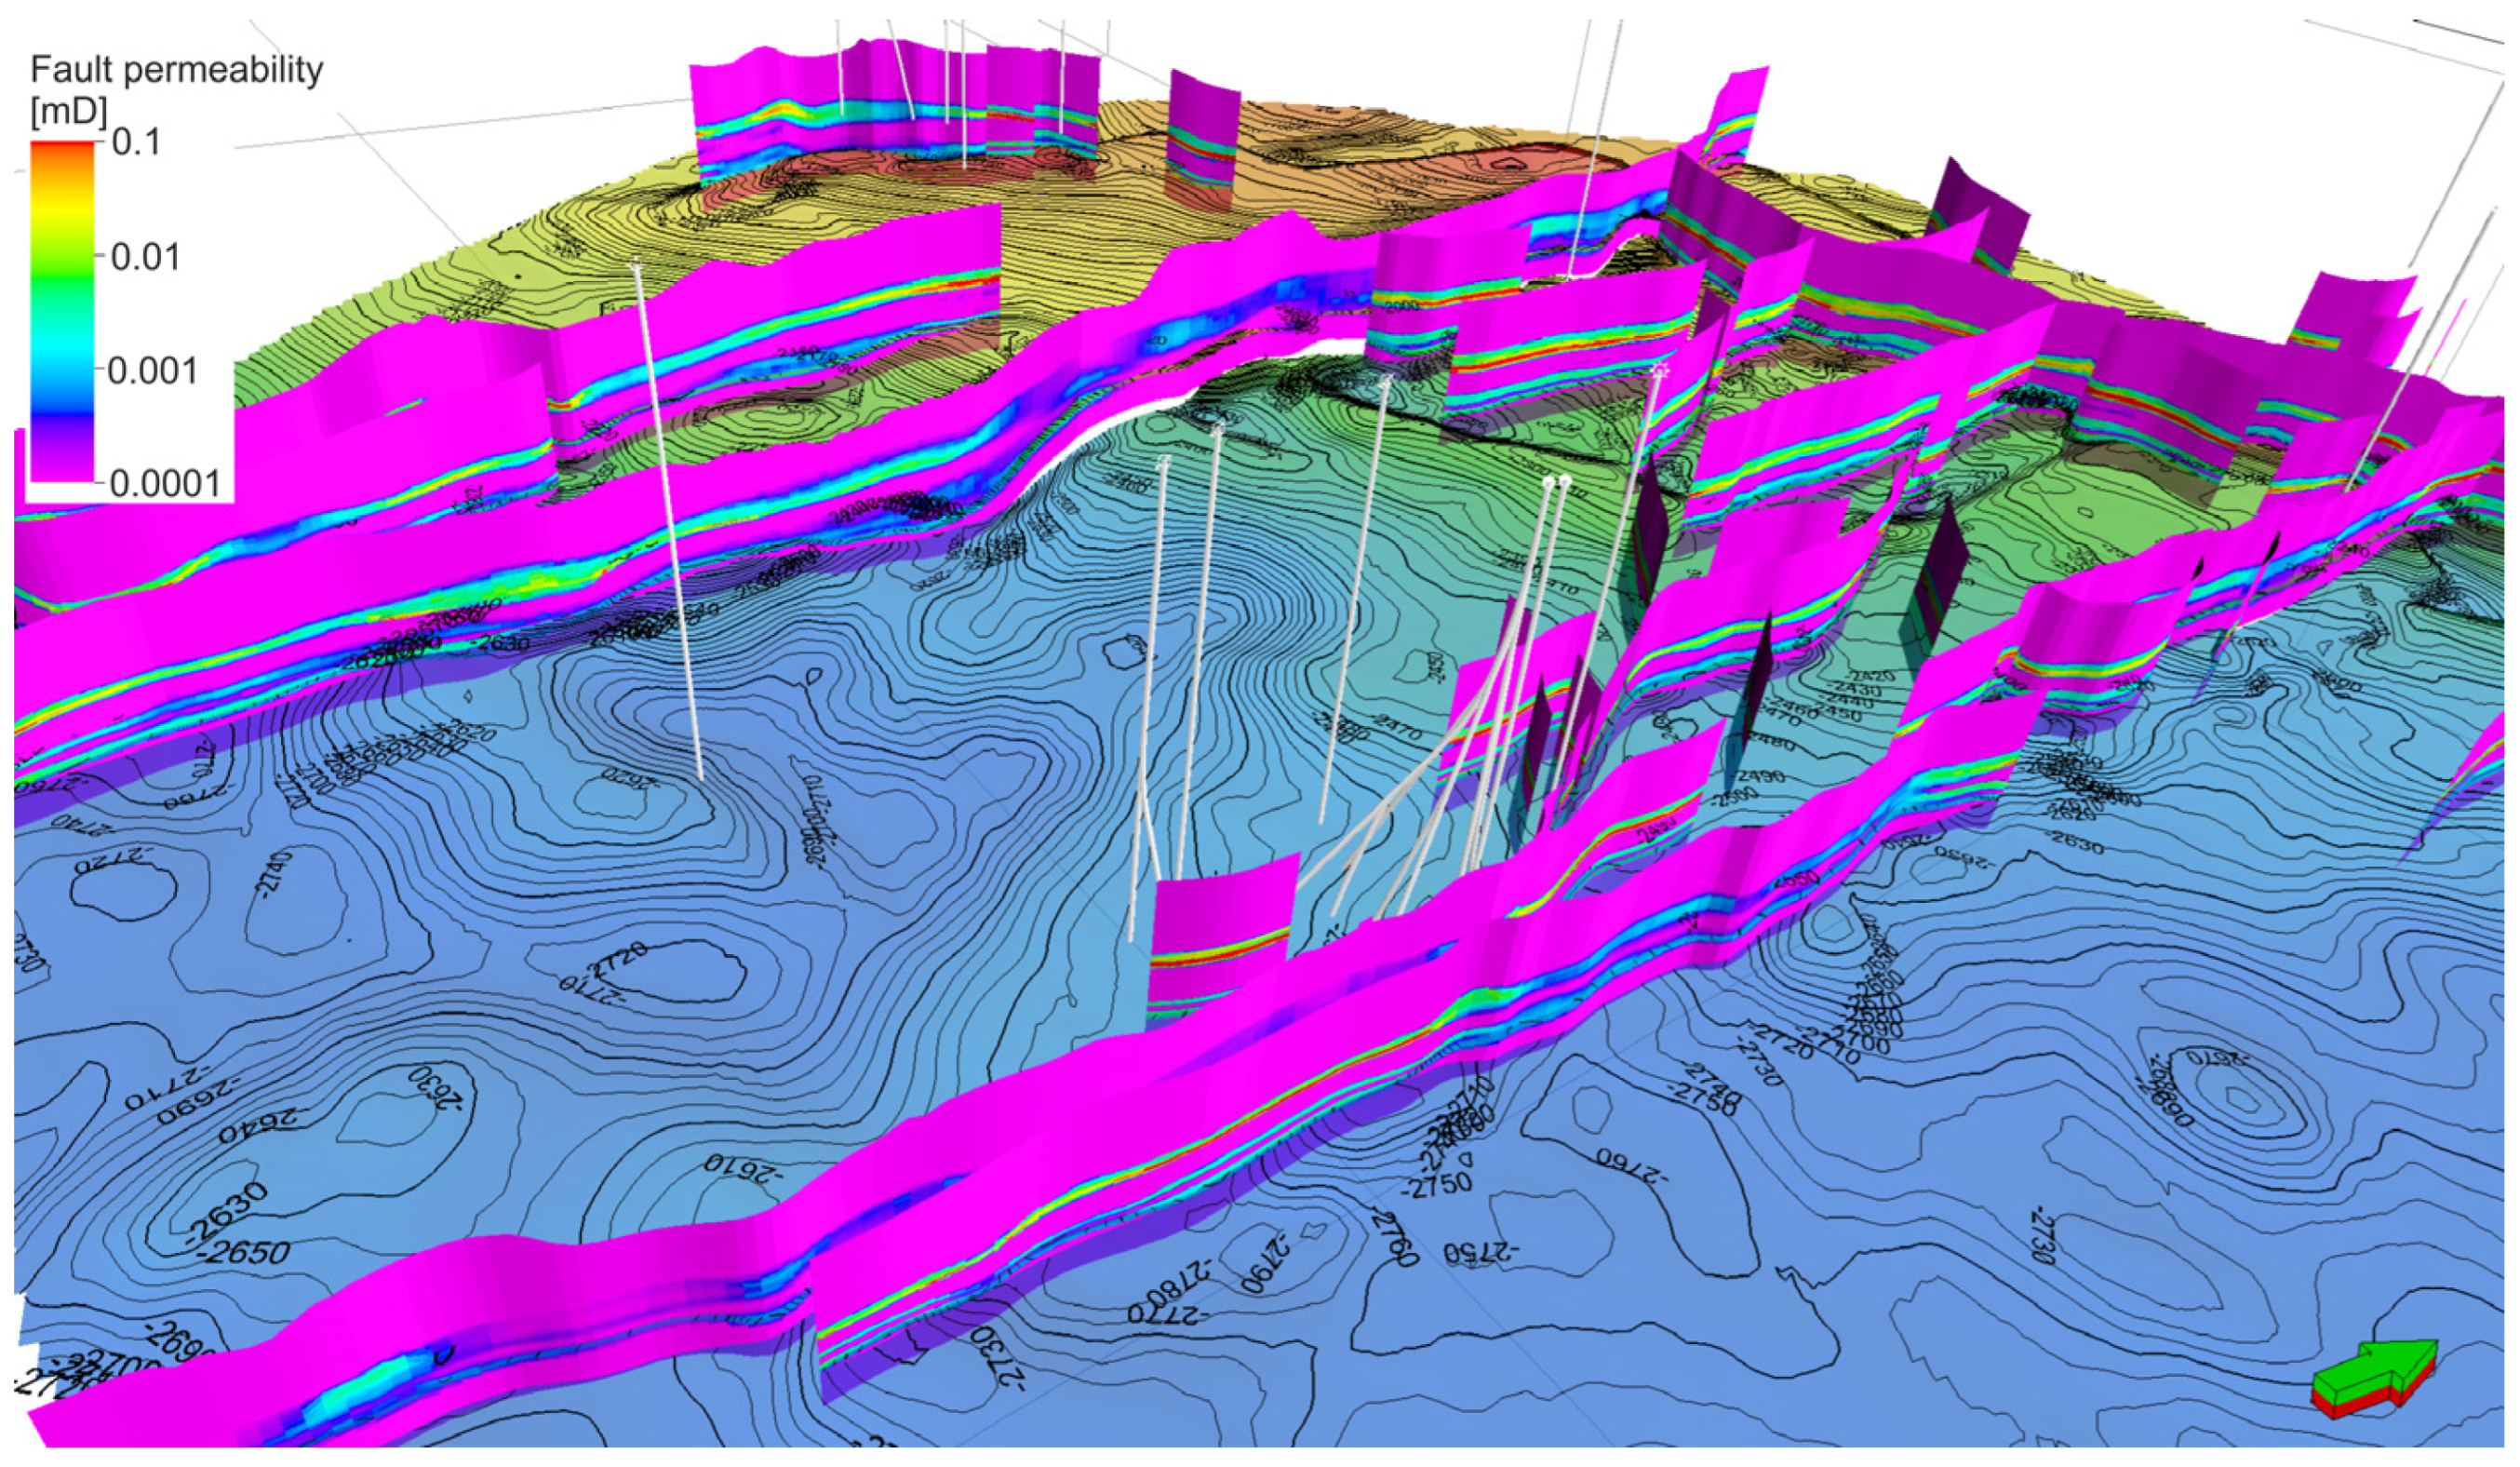
Distributions of FCP (
Figure 8) and FPP (
Figure 9) for the foot wall, the hanging wall, and the fault-zone plane were calculated considering the clay-content coefficient and the maximum burial depth (i.e., time–temperature history). Effective stress values (as a function of depth) at the time of faulting were also included for the fault plane itself.
The results of these calculations, indicate that the analysed faults can be regarded as sealing with respect to CO2 migration.
Subsequently, the FCP and FPP parameters were incorporated into the PetroMod dynamic simulations as descriptors of fault properties.
3.2. Injection Simulation
Preliminary assumptions, accounting for the specifics of the Polish power sector and the resulting demand, anticipated the need to sequester around 100 Mt of CO
2 over the next 30 years. In view of the geological–structural conditions of the selected structure, the thickness of the aquifer, its storage properties, and global experience reported in the literature, it was initially assumed that 100 Mt of CO
2 could be injected into the analysed structure over 30 years. In view of the considerable expense associated with drilling injection wells, whose planned number should be optimised in the project’s economic calculations, it was initially estimated that injection would be carried out with ten injection wells. The locations of these wells were selected on the basis of aquifer thickness and reservoir parameters, while simultaneously assuming sufficient tightness of the dislocation zones (
Figure 10). It should be noted, however, that the number of injection wells planned at the preliminary stage may change following the completion of additional studies and analyses.
The injection of 10 Mt per well over a 30-year period results in an approx. continuous rate of 38 tonnes of CO2 per hour. In light of the lateral and vertical variability of the hydraulic parameters of the injection layer, it was to be expected that achieving the planned, uniform injection rate in each well would require different injection pressures, the values of which would depend on pore volume and hydraulic parameters (that is, layer thickness, porosity, permeability, and capillary pressures) in both the near-wellbore and the more distant surroundings. Two simulation scenarios were tested, differing in their vertical resolution of the reservoir.
3.2.1. Scenario I—Simulations on a Model with High Vertical Resolution of Reservoir
In the higher-resolution models, the reservoir was divided into five sublayers of equal. This approach enabled the capture of captured facies variability (
Figure 11) and the subsequent determination of the vertical variation in porosity and permeability (
Figure 12). The simulations assumed the injection of supercritical CO
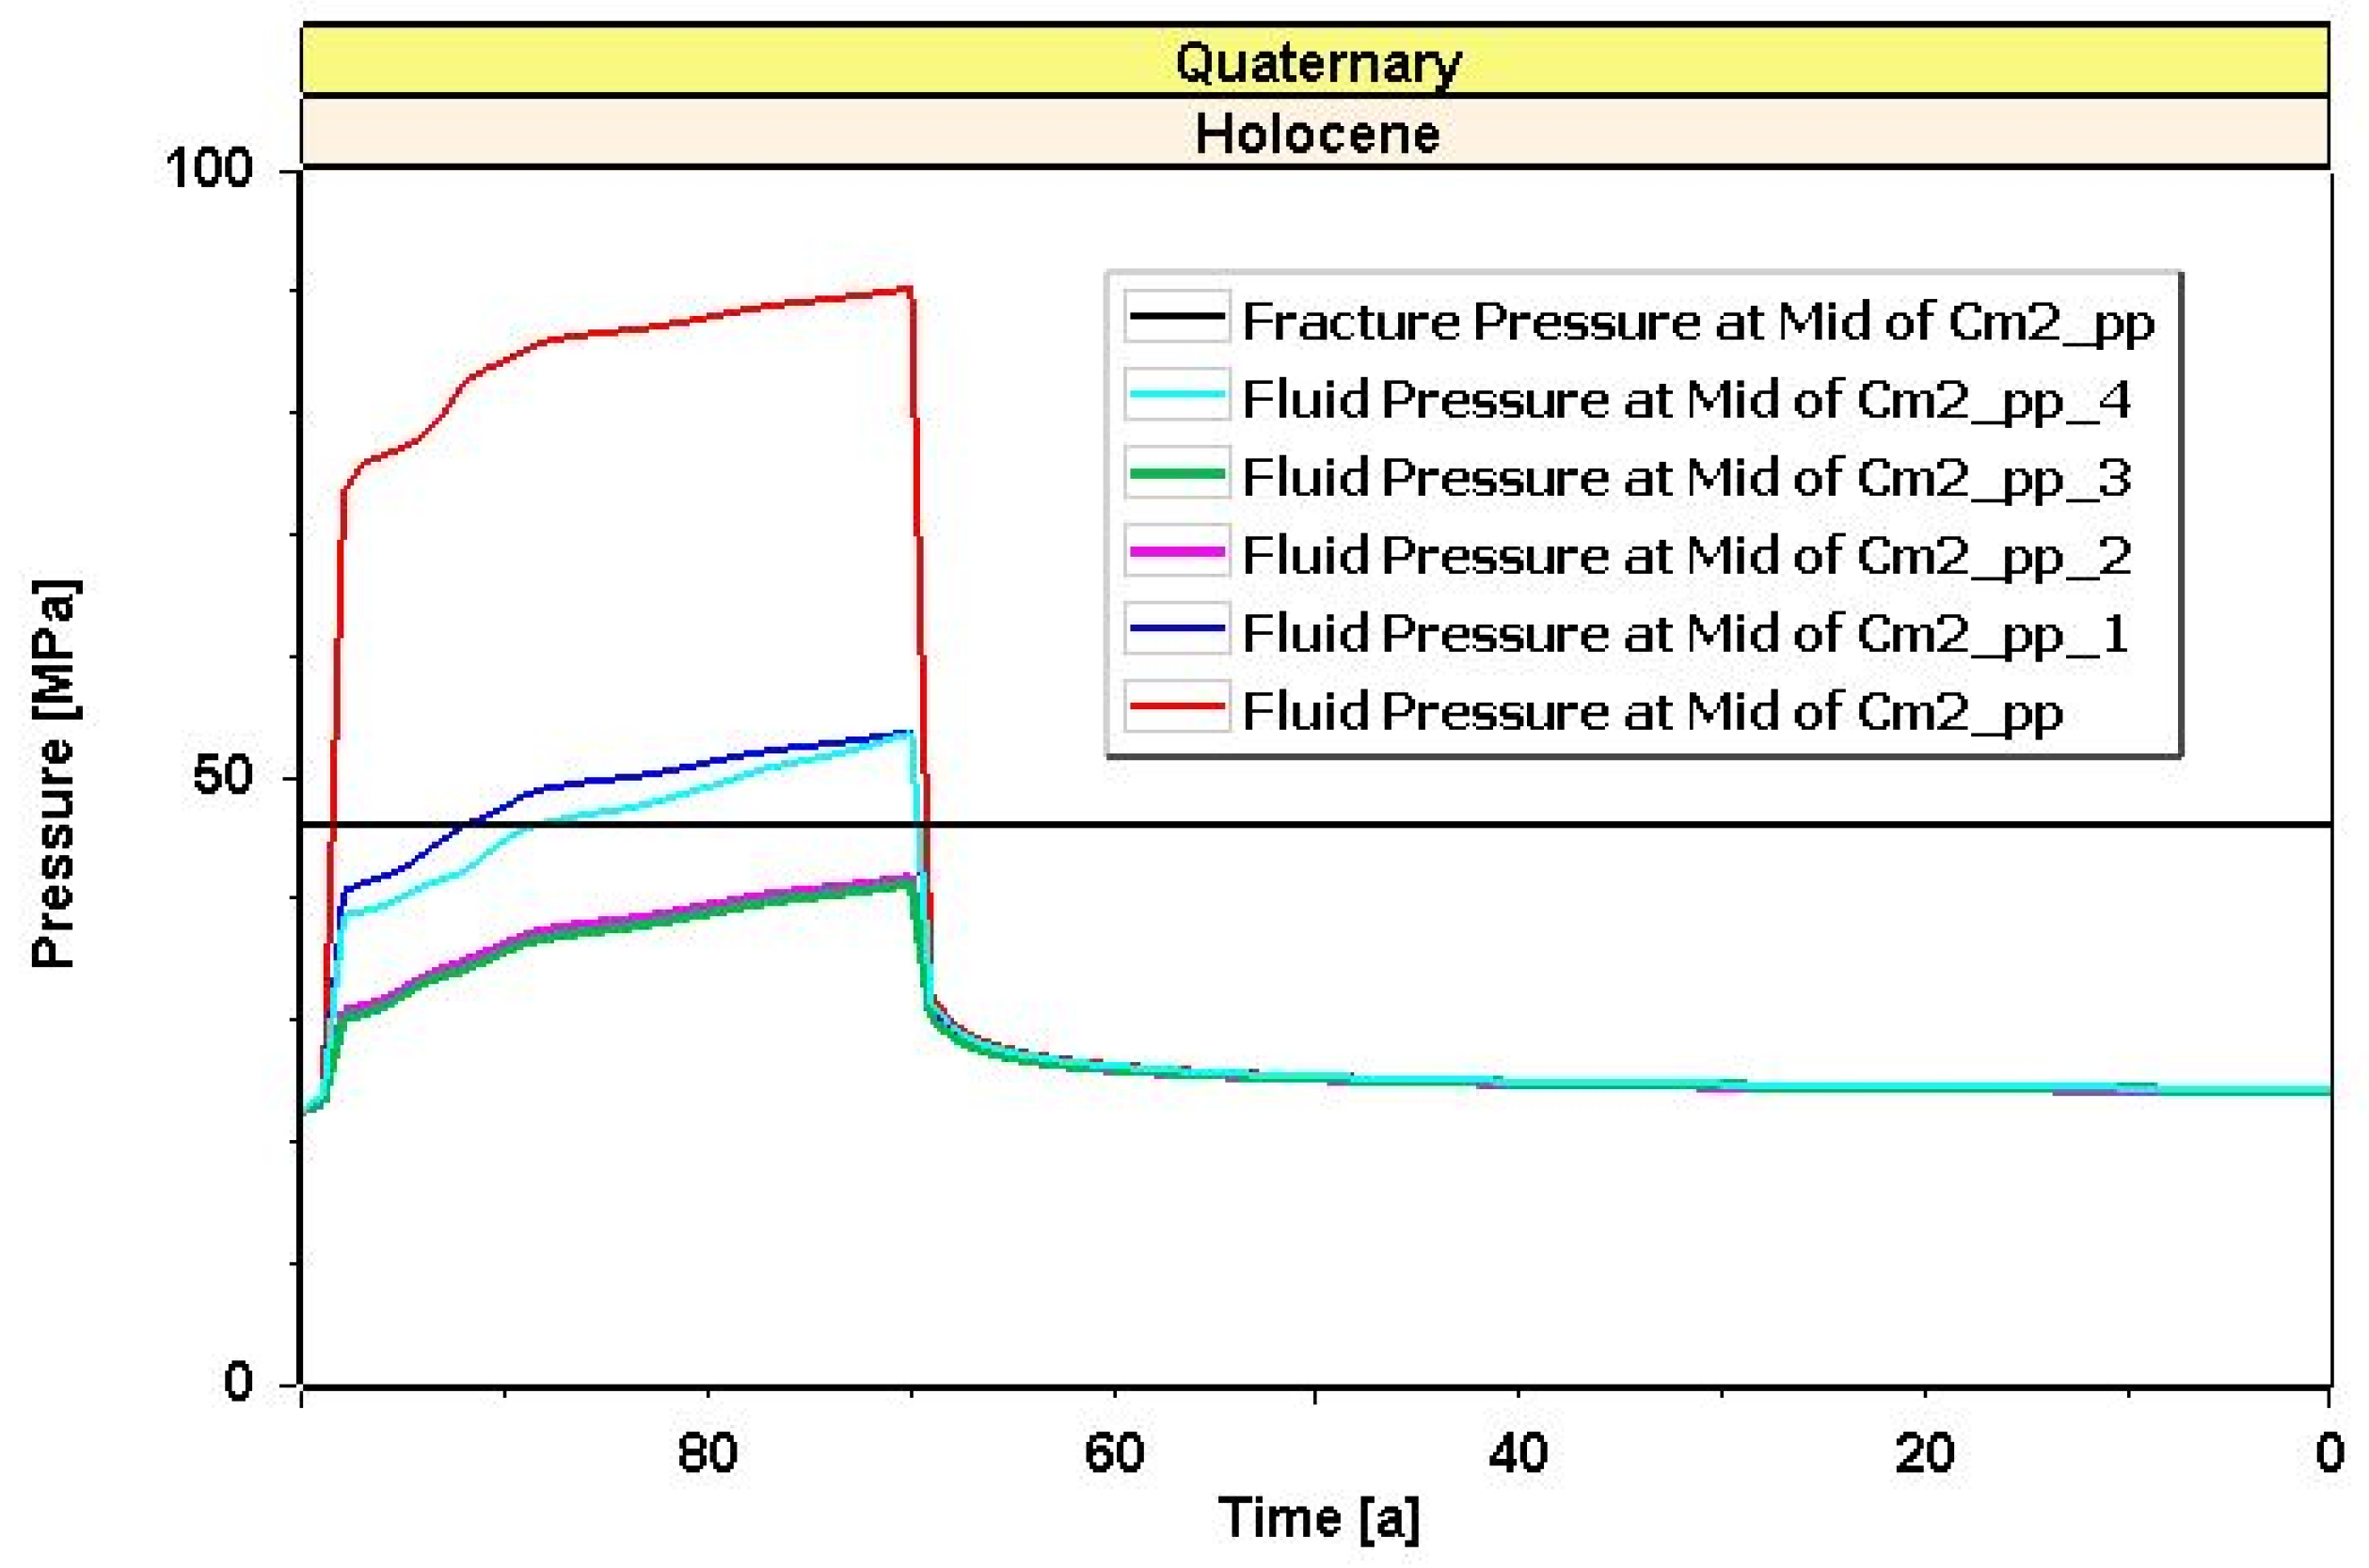
2 into each sublayer at a constant rate of 2 Mt per 30 years, giving a total of 10 Mt per injection well per 30 years. The simulation results demonstrated a rapid increase in the pressures required to maintain the planned injection rate. This is particularly evident in locations where the layer exhibits poorer hydraulic parameters. In such cases, values exceeding fracturing pressures were reached after only a few years (
Figure 13).
Furthermore, fault zone (with estimated parameters of permeability—FPP and breakthrough pressure—FCP) under the induced pressures (required to inject at the planned rate) would not provide sufficient barriers to gas flow. Consequently, a portion of the gas injected by wells located near fault zones would use them as escape routes into the sealing horizon and the overburden. The simulations demonstrated that for the selected injection well locations (
Figure 14), with 100 Mt of CO
2 injected over 30 years, approx. 3% of the gas remigrated out of the injection layer 70 years after injection ceased.
In light of the above-mentioned observations, injection into wells located too close to fault zones is not suggested. The locations of new, additional wells were optimised, with consideration given to their distance from fault zones. Concurrently, injection rates were reduced while the number of injection wells was increased. The results indicated a declining trend in injection performance at locations moving southwards, attributable to the markedly smaller thickness of the layer and the deteriorating reservoir properties of the storage layer. In total, injection performance was tested at 33 selected locations. The capacity of the reservoir proved to be highly variable, both between locations and between sublayers within individual locations. Simulations of models with high vertical resolution of the reservoir showed that, in the best locations, a single well could inject up to 1.4 Mt of CO
2 per sublayer over a 30-year period, i.e., 7 Mt of CO
2 per well. It is important to note that the pressures required to inject at the planned rate into individual sublayers differed very significantly in several locations (
Figure 13).
In subsequent simulations, injection into the wells was discontinued in instances where the injection into any sublayer at a rate of 400,000 tonnes of CO
2 per 30 years would result in the fracturing pressures being exceeded, as well as wells being too close to faults through which injected gas migrated into the overburden. Ultimately, 15 locations were identified as the most suitable for the injection into each sublayer at a rate of at least 400,000 tonnes of CO
2 per 30 years (i.e., at least 2 Mt of CO
2 per well per 30 years) without generating pressures exceeding 90% of the fracturing pressure of the reservoir. Injection into up to 15 wells, with injection rates controlled by local reservoir properties (ranging from 2 to 7 Mt of CO
2 per well over 30 years), would enable the storage of 58 Mt of CO
2 over 30 years without exceeding 90% of the reservoir’s fracture pressure, thereby minimizing the risk of CO
2 migration beyond the confining formations (
Figure 15).
However, implementing the assumption of injecting at the same rate into each of the sublayers that differ in permeability is practically impossible, because this would require different injection pressures. The pressure generated by a single well will be very similar for all sublayers (dependent essentially on depth, not on their permeability). Vertical differentiation of hydraulic parameters (permeability) between sublayers in well profiles is a determining factor in the pressure threshold that must be exceeded to inject into each of them at the same (planned) rate. Therefore, the result obtained indicates only that, at a given pressure, intervals (sublayers) characterised by better hydraulic parameters will absorb the injected CO2 more efficiently than intervals with worst parameters; it does not indicate the total rates for all five sublayers combined in individual injection wells. This issue was addressed in the numerical model by averaging the parameters of the reservoir layer over its entire depth interval of the injection layer.
3.2.2. Scenario II—Simulations on a Model with Low Vertical Resolution of the Storage Interval
Scenario II on the other hand, assumes that the injection layer consists of a single layer with (low vertical resolution) with a single averaged facies map for the entire depth interval to describe the lateral variation of facies within the layer. A total of six lithological facies were distinguished, for which lithological models were developed. The purpose of these models was to define variability and mutual relationships of petrophysical parameters, in particular the filtration properties of the layer (
Figure 16).
Consequently, the horizontal resolution remained constant when compared to the previous models, whereas each computational cell of the reservoir grid was assigned one new averaged value for each parameter defining its assigned facies (
Figure 17).
The scenario 2 model was subjected to a series of simulations, with the objective of testing relationships between injection rates and fluid pressure build-up during the injection process. Injection rates at individual locations have been iteratively optimised, ranging from 2 to 7 Mt per 30 years, and are appropriate to the reservoir parameters of the layer in the immediate vicinity of the well (
Table 2).
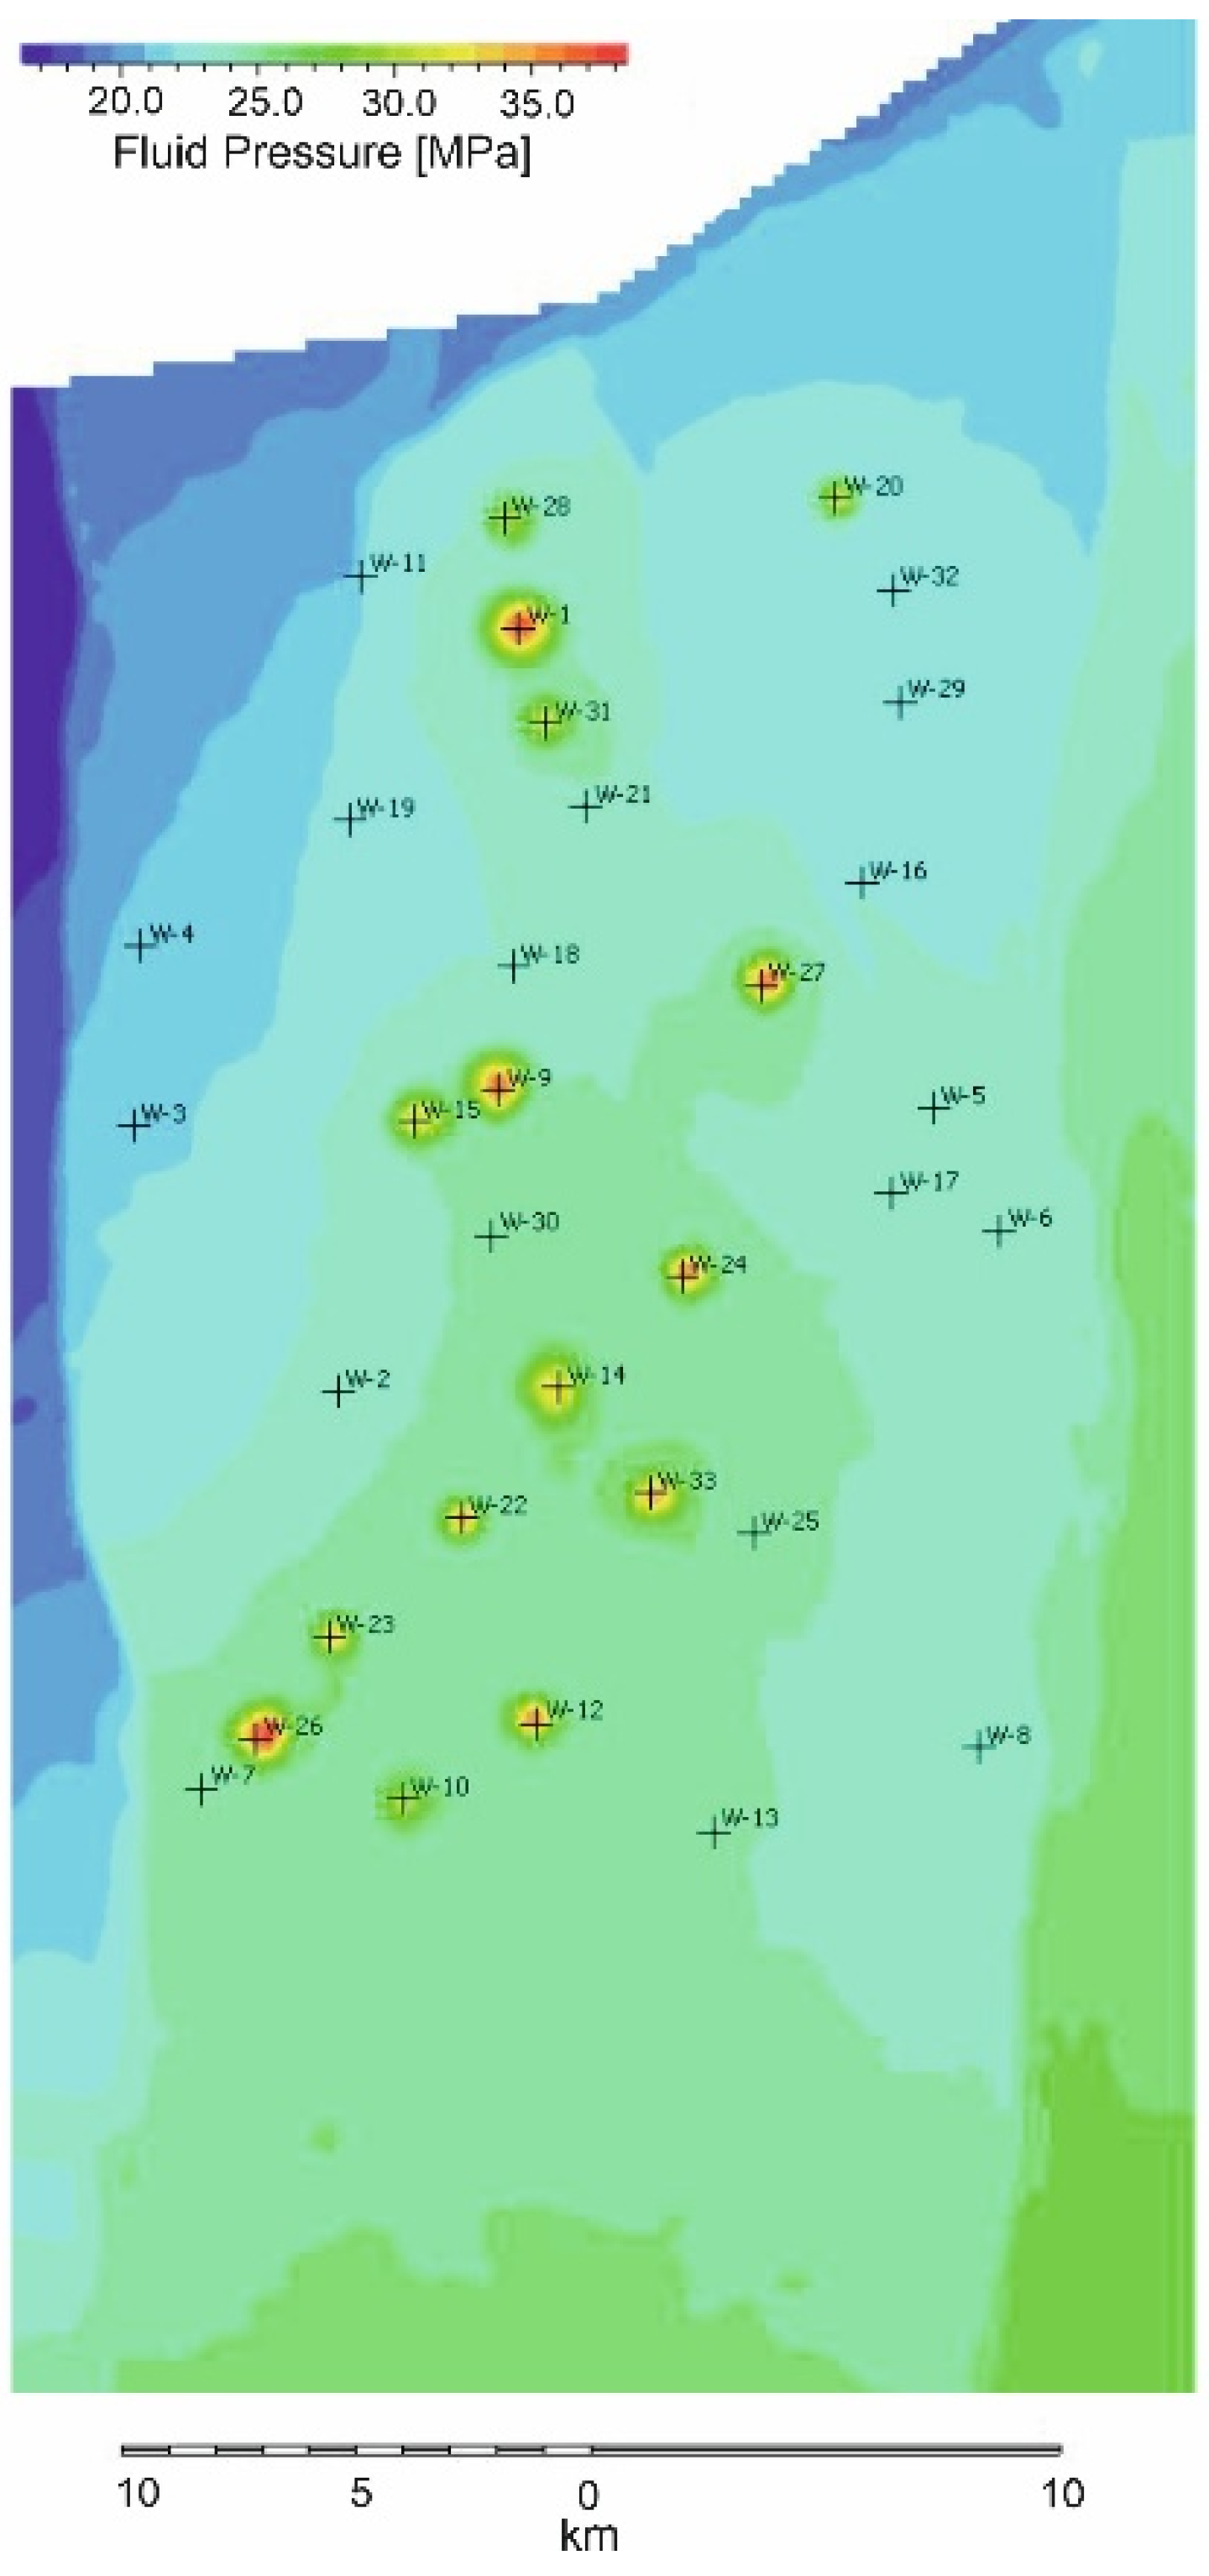
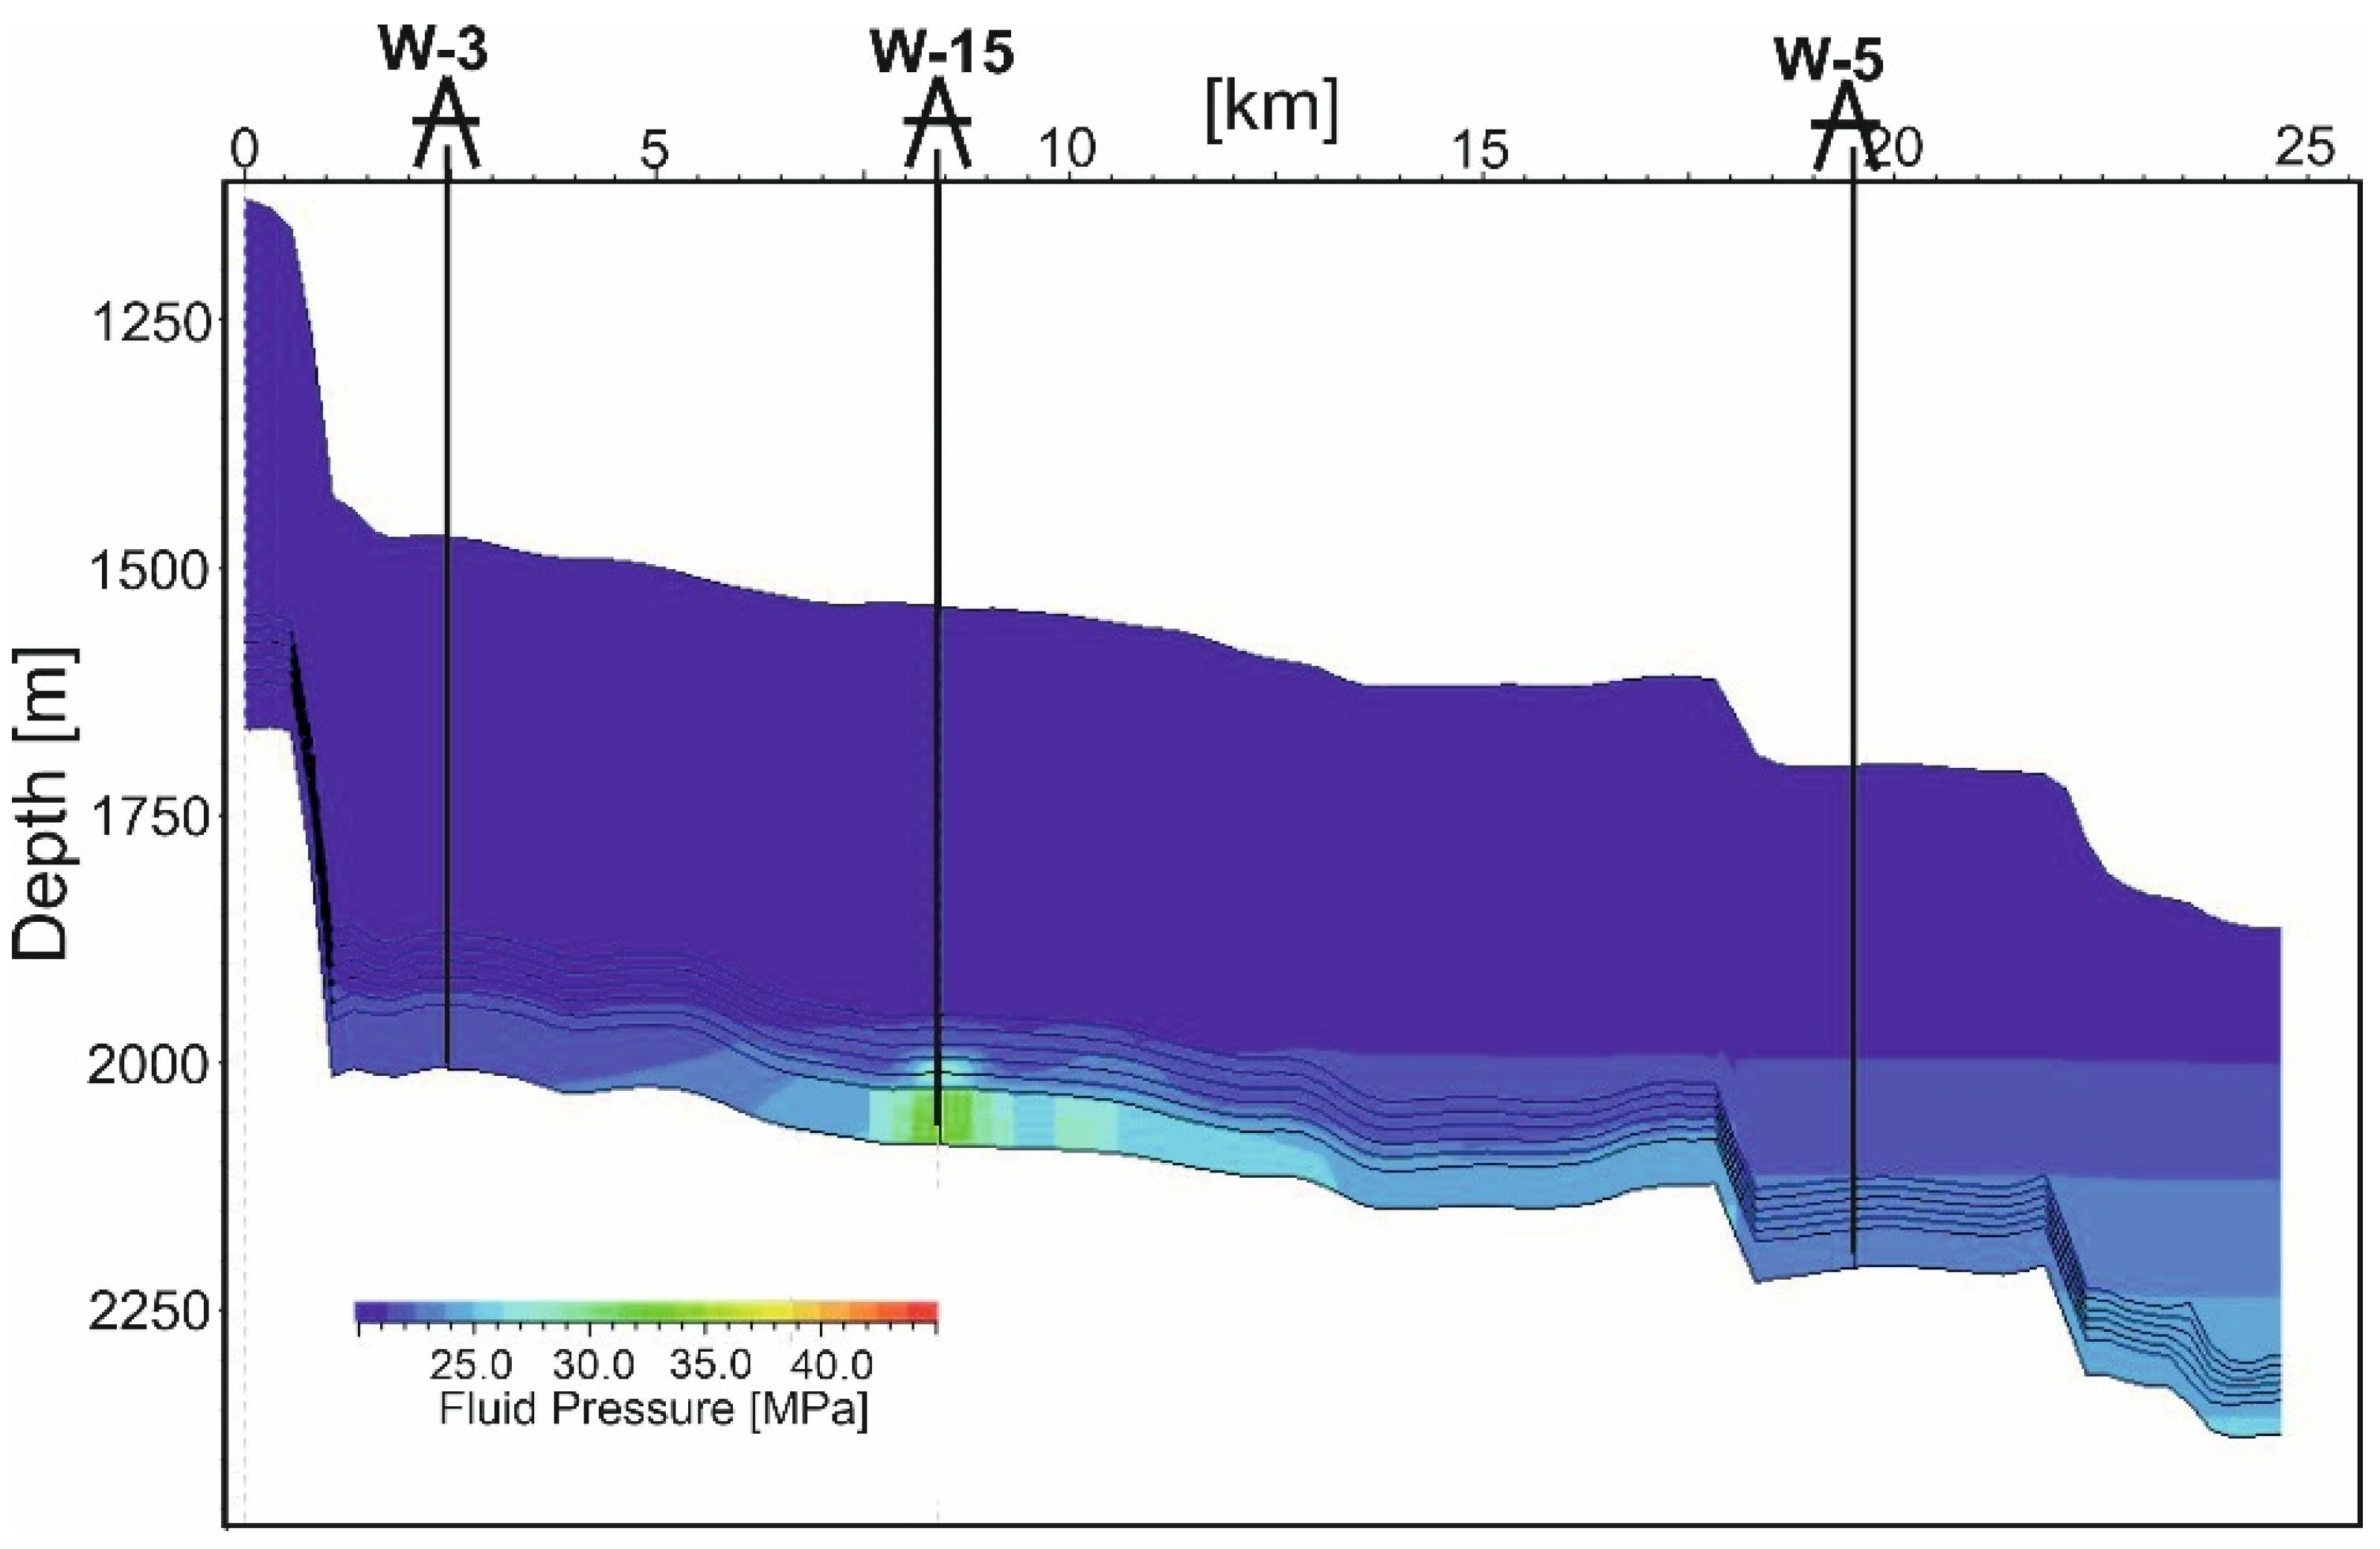
Figure 18 shows fluid pressure in the vicinity of well W-15 after 30 years of injection at a rate of 7.0 Mt per 30 years.
For the majority of locations, scenario II results demonstrate a marginal increase in injection performance in comparison to scenario I, and the amount of CO2 that can be stored over a 30-year period increased from 58 to 65 Mt (by approx. 12%). As in scenario I, injection at excessive rates into wells located too close to fault zones resulted in the leakage of injected gas into the overburden beyond the sealing horizons. In such cases, even in the absence of leakage at rates lower than 2 Mt per 30 years, injection into these wells was abandoned entirely and they were excluded from the overall dynamic capacity balance of the structure. A summary of injection performance for both scenarios is presented in the table below.
4. Discussion of the Results
The assessment of the dynamic capacity of a geological structure in the context of carbon dioxide storage and safe injection rates is a highly complex task. Its outcome is associated with considerable uncertainty, which is linked to the heterogeneous characteristics of the rock medium, characterized by numerous interacting factors that determine the dynamics of fluid flow and chemical reactions in the porous medium. The implementation of such a project requires the use of a comprehensive amount of geological data, concerning primarily the reservoir horizon, but also the sealing horizons and fault zones. The availability of these data is often limited, and in certain cases the data are completely missing, which forces researchers to adopt certain assumptions or, in case of some parameters, to rely on default values.
The limited availability of data, in conjunction with the awareness of their significant uncertainty—particularly with regard to the spatial distribution of reservoir parameters of the storage layer and filtration parameters of the primary sealing horizon—as well as the specific characteristics of the analysed structure, which consists of high horizontal and vertical variability of these parameters, prompted the authors to develop two model scenarios. These scenarios differed in the vertical resolution of the reservoir layer and were tested in terms of possible injection rates, depending on the reservoir parameters of the aquifer and the permeability of the sealing formations.
This approach was primarily determined by the assumed objectives of identifying optimal locations for injection wells and estimating the maximum safe injection rate and the dynamic capacity of the reservoir layer. Initially, it was hypothesised that the first objective would be best achieved on the basis of simulation results from the higher-resolution model, while the second objective would be best addressed by results from the lower-resolution model. Ultimately, however, it was found that their results did not differ significantly.
Several dozen simulations were conducted. The initial objective was to use the simulation models to reproduce the distribution of reservoir and hydraulic parameters of the reservoir layer and sealing formations consistent with the distributions in the parametric model developed in the Petrel software v. 2024. Subsequently, the models exhibiting the highest consistency of distributions were subjected to injection simulations at different rates. The rates were selected so that fluid pressures during injection did not exceed 90% of fracture pressures. Various injection rates were tested and selectively applied depending on the porosity and permeability of the reservoir layer in the immediate vicinity of the injection wells. At excessively high injection rates, fluid pressures exceeded fracture pressures or caused fault leakage and the upward migration of injected CO2.
The results obtained, concerning both injection performance at individual locations and the total dynamic capacity of the structure, were found to be lower than expected. For both scenarios, similar injection rates were obtained in specific locations, which, depending on the reservoir parameters in the immediate vicinity of injection wells, reached a maximum of 7 Mt of CO
2 per 30 years. Locations (wells) with injection rates lower than 2 Mt per 30 years were ignored in the overall balances. The total storage capacity of the structure, after excluding these locations, amounted to 58 Mt for scenario I and 65 Mt for scenario II (
Table 2).
The awareness of the sensitivity of modeling results to variations and uncertainties in input parameters prompted the authors to perform simulations of models in which the input data were modified. The simulations showed that increasing the porosity of the reservoir layer from a range of 3.5–6.5% to 4.5–8.5% (on average by about 1.5%) improved injection performance in individual wells and created additional space for locating new injection wells, thereby increasing the storage capacity of the structure to approximately 100–110 million tons of CO2.
The proposed well arrangement did not demonstrate any significant impact of gas injection in neighbouring wells (interference effect) on the pressure increase dynamics in their vicinity. This suggests the possibility of reducing the spacing between wells, thereby increasing their number and enhancing the storage capacity of the structure. Furthermore, following the results of economic calculations, it may be possible to utilize some of the 33 tested locations that were excluded from the overall balance due to injection rates lower than 2 Mt per 30 years.
Permeability was found to have a particularly significant impact on the storage capacity of the analysed structure, both in the reservoir layer and in the sealing horizons. The simulation results demonstrated that a marginal increase in reservoir layer permeability generally has a positive effect, as it increases the migration radius, reduces the required injection pressure, and thereby allows for higher injection rates. However, in the case of locations situated too close to fault zones, increased permeability was found to have a negative effect. Increasing the horizontal migration range enabled the gas to reach fault zones and migrate upwards toward the surface. In this context, the obtained modelling results regarding fault permeability indicate insufficient sealing capacity to contain the migrating gas plume. This is somewhat inconsistent with the occurrence of hydrocarbon deposits, for which these faults serve as traps. The issue of fault sealing is therefore of key importance, as simulation results indicate that an increase in pore pressure in the fault-adjacent zones of approx. 2 MPa relative to initial pressures leads to fault leakage and upward migration of injected gas. The migration of CO2 along fault zones may result from two main types of causes: mechanical opening of fault fractures due to stresses induced by the increase in pressure from injected CO2, or differences between the physicochemical properties of CO2 and those of oil and gas. Compared to oil and gas, CO2 has significantly lower viscosity, lower interfacial tension with water, and greater solubility in water. Lower viscosity facilitates its movement through micropores and microfractures, while reduced interfacial tension with water leads to lower capillary pressure in the water/CO2 system, thereby promoting migration within water-saturated pores.
Greater solubility in water enables migration in a dissolved form; moreover, CO2 dissolved in water forms carbonic acid, which is chemically aggressive and, by reacting with rock-forming minerals, can alter the rock’s pore structure and increase the permeability of the fault zone. The dissolution of CO2 in brine also allows for its long-term neutralization (trapping) within the aquifer. CO2 dissolved in water forms carbonic acid, which, being denser than water, tends to occupy the lower parts of the structure, making it less mobile and reducing the risk of leakage. Additionally, the ions of carbonic acid react with calcium, magnesium, and iron ions to form carbonates that permanently bind CO2. These reactions—alongside structural and stratigraphic trapping mechanisms, in which formation water is displaced from pore spaces and replaced by CO2—represent the main processes of CO2 trapping in aquifer formations. Furthermore, CO2 can be retained within rock micropores by capillary forces, which constitute the mechanism of residual trapping.
Therefore, to determine the sealing integrity of the structure, additional laboratory tests of the reservoir rock should be carried out to assess changes in its filtration parameters resulting from interactions with CO2-saturated brine. It is also necessary to drill wells that would allow for testing the sealing properties of the faults. Should the fault show high sealing capacity, it would be possible to place injection wells also in the vicinity of fault zones, where reservoir parameters of the layer are most favourable and significantly increase the storage capacity of the structure.
The permeability of the sealing horizons is equally important. The large variability of horizontal and vertical permeability of the first sealing horizon (on average in the range of 10−3–102 mD) vastly complicates the determination of optimal locations for injection wells, introducing a high degree of risk associated with potential unsuccessful choices. The results of simulations conducted for multiple potential well locations demonstrated inadequate sealing and vertical migration of the injected gas into overlying strata. In such cases, even a slight shift in the well location in an appropriate direction sometimes changed the outcome drastically. It appears that the Ordovician formations, defined as the first sealing horizon, do not constitute an ideal seal. Locally, their hydraulic parameters exhibit properties not much different from those of the storage layer.
