Abstract
In response to the imperative to mitigate methane—one of the most potent greenhouse gases—this study proposes and tests an integrated workflow for designing methane drainage boreholes targeting post-mining areas in an active underground coal mine (Pniówek, Poland). The workflow combines the following: (1) forecasting methane emissions from goafs and active longwalls for 2024–2040; (2) 3D geological characterization (structural and lithofacies models); (3) selection and sealing of goaf zones; and (4) optimization of well placement, drilling, and performance evaluation of drainage boreholes, including an assessment of energy use from the recovered gas. Applying the method delineated priority capture zones and estimated recoverable rates under multiple scenarios. Preliminary field data from a borehole near seam 362/1 indicate stable methane inflow to the drainage system and a concomitant reduction in methane load within the ventilation network. The integrated design improves targeting efficiency and provides a quantitative basis for scheduling, risk management, and sizing of surface-to-underground infrastructure. The results suggest that systematic drainage of post-mining voids can enhance safety, limit fugitive emissions, and create opportunities for on-site power generation. The approach is transferable to other active mines with legacy workings, provided site-specific calibration and monitoring are implemented.
1. Introduction
Methane emissions from coal seams constitute a significant technical and environmental problem for the industry [1]. Gas desorption into mine workings during underground extraction creates serious risks to worker and operational safety and has climatic implications [2,3]. Capturing methane improves worker safety and reduces environmental releases; moreover, it can be valorized as an energy source or chemical feedstock—including for power/heat generation or hydrogen production—thus supporting a transition toward lower-emission operations [4]. Effective methane management is therefore not only a requirement for occupational safety, but also a key element of environmentally responsible and sustainable mining.
Longwall mining creates caved zones (post-mining voids; goafs) filled with collapsed roof strata that, once partially isolated from the active ventilation network, become preferential reservoirs of methane [5]. The effect is intensified in multi-seam coal mine settings, where complex gas migration occurs within the rock mass and barometric pressure fluctuations modulate emission dynamics [6]. From a safety standpoint, methane is a primary cause of underground disasters. From an environmental standpoint, its 100-year global warming potential exceeds that of CO2, as reported by international assessments [7,8]. These aspects justify strategies that integrate safety requirements with greenhouse gas mitigation goals.
The most effective means of reducing methane hazards in underground mining is drainage of the rock mass using dedicated methane (drainage) boreholes [9]. When properly designed and executed, drainage systems deliver multiple benefits. The key is a precise understanding of gas release, migration, and accumulation in the rock mass, employing three-dimensional numerical modeling of flow, delineation of desorption zones, and optimization of borehole patterns based on detailed geological characterization of roof and floor units, geomechanical conditions, and forecasts of absolute methane emission from the longwall [10]. A specific challenge is posed by post-mining (goaf) areas, where rock mass dynamics and methane release intensity differ from the active production front. The industry literature describes methodologies for identifying methane accumulation zones in goafs, which guide borehole siting [11].
The aim of this article is to present an integrated approach to the design of methane drainage boreholes under complex geological and mining conditions of a post-mining area. The Pniówek hard-coal deposit is located on the south-western limb of the Main Syncline of the Upper Silesian Coal Basin (USCB) (Figure 1), the largest and most important hard-coal mining district in Poland. The USCB covers ~5600 km2 and contains 80.3% of Poland’s documented anticipated economic hard-coal resources (as defined by national reporting).
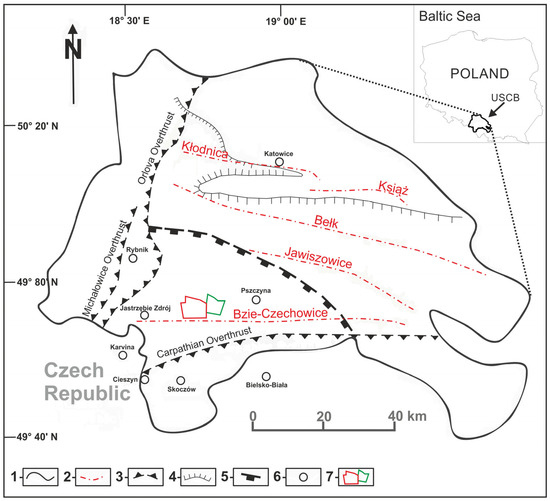
Figure 1.
Map of the Upper Silesian Coal Basin (modified after [12]): (1) boundaries of the Polish part of the USCB; (2) major fault zones; (3) overthrusts; (4) extent of the continuous Miocene cover; (5) extent of the secondary methane zone (ticks inward); (6) major cities; (7) Pniówek and Pawłowice mine boundary.
The case study is an area within the Pniówek coal mine. The methodology covers an analysis of forecasted methane release to goafs, delineation of optimal drainage zones based on defined criteria, and detailed trajectory design of boreholes supported by a three-dimensional structural–facies model as well as selection and sealing of the goaf zones. The paper concludes with the technical aspects of the project and results that form the basis for discussing the effectiveness and deployment potential of the proposed methodology. For the Pniówek case study, the integrated design indicates that targeted drainage of post-mining voids can enhance safety by lowering the ventilation methane load, reduce fugitive emissions, and provide sufficiently stable flows for methane-to-power utilization, subject to site-specific calibration and monitoring.
Geological Settings
Pniówek is a multi-seam deposit with 62 documented coal seams occurring at depths of ~223–1300 m. Seam thickness and quality vary substantially (Group II variability in Polish classification). The tectonic fabric is complex: numerous faults with throws from ~10 m up to ~300 m dissect the area. Faults striking approximately E–W may act as preferential migration pathways and locally promote deep degassing, whereas N–S and oblique NW–SE faults can behave as barriers, fostering local methane accumulations. These relationships align with basin-scale observations for the USCB, where structural compartmentalization exerts first-order control on CH4 storage and migration. In particular, the stratigraphic stack comprises the Paralic Series and overlying continental (limnic) deposits of the Upper Carboniferous; the Saddle, Ruda, and Orzesze beds form a monocline dipping NE to ENE; and the Carboniferous top is strongly incised by erosional paleovalleys (locally to ~100 m). A regionally thick, low-permeability Miocene overburden (~150–850 m thick) provides an effective seal and conditions the extent of the “secondary methane zone” [12,13].
In the Upper Carboniferous host rocks, methane occurs as sorbed CH4 bound to the coal matrix (and dispersed in adjacent clastics) and free gas occupying pores and fractures in coal seams and surrounding strata; phase partitioning is governed by local pressure–temperature conditions. Laboratory sorption studies on USCB coals corroborate high CH4 sorption capacities and their sensitivity to rank, pressure, and burial depth. Average gas content at Pniówek ranges from ~2.158 m3/Mg csw at the −550 m level (≈830 m) to ~6.414 m3/Mg csw at the −1020 m level (≈1300 m), with the highest values toward the Carboniferous roof, where vertical zoning of gas accumulation is observed [14,15].
Pniówek is classified as a high-methane mine; CH4 emissions to workings occur during development and extraction and scale with longwall advance. Elevated gas contents, abundant faulting, and fractured zones increase the risk of gas-and-rock outbursts—among the most severe natural hazards in underground coal mining. Preventive measures include targeted methane drainage via strategically placed boreholes (the subject of this paper), systematic gas content measurements (vacuum degassing) and desorbometric testing, alongside ventilation management to control in-mine methane concentrations. At the basin scale, Pniówek and neighboring Budryk are consistently identified as among the most methane-gassy Polish mines, with documented variability in coal output, gas content, and emissions controlled by geology and mining practice [13].
The USCB hosts one of the largest coalbed methane (CBM) potentials in Europe; methane recovery from mine drainage in the basin totals roughly 200–300 million m3 annually, and undeveloped CBM resources outside active mining districts exceed ~38 billion m3, underscoring the broader relevance of engineered drainage and utilization [16].
2. Materials and Methods
2.1. Emission of Methane into Post-Mining Areas
The design of the methane intakes from the goaf was based on the forecasts developed for methane release into the longwall. On this basis, the values of the prognoses of methane release to the goaf in subsequent years after the completion of the extraction were calculated. Forecasts of methane release into the projected longwalls and forecasts of methane release into isolated goaf areas after their extractions were completed were based on the coal seam exploitation schedule prepared by “Pniówek” Mine for the period 2024–2030.
Based on comprehensive investigations by the Central Mining Institute, a model has been developed to prognostically determine the volume of methane emitted into longwall goafs from distressed strata following mining operations (Figure 2) [17].
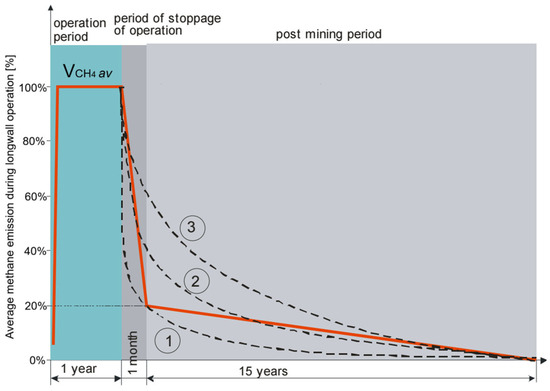
Figure 2.
Model of methane emissions to the longwall goaf during and after mining operations [17].
The model encompasses the entire emission lifecycle: the average 1-year operational period, a 1–3-month closure phase, and a prolonged 15-year post-mining emission period [18]. Initially, high-volume degassing of undermined and overmined seams occurs during active mining and equipment dismantling. This is followed by a long tail of slower methane desorption from those seams.
The post-mining emission profile is governed by the relative contribution of methane from these surrounding seams:
- Curve 1 reflects a scenario where methane from the mined seam itself predominates, with minimal contribution from the surrounding strata. If no gassy seams are present in the destressed zone, inflow can be nearly zero.
- Curves 2 and 3 indicate a significant and sustained methane influx from the destressed undermined and overmined seams, which becomes the primary long-term source. Underground field tests and geological analysis confirm this high variability in emission patterns.
Consequently, the presented model facilitates the prognostic estimation of methane emissions into the longwall goaf after the cessation of mining operations. On the basis of the model described above, it is possible to estimate the emission of methane into the longwall goaf after mining operations [19]:
where
—average methane flow rate during mining operations, m3CH4/min;
u—the number of years since longwall exploitation was stopped.
To summarize, statistical data from Polish coal mines indicate that the methane flow rate from a longwall goaf following mining operations averages 20% of the mean rate observed during active extraction. Although the estimation method does not consider annual coal production rates or longwall advancement speeds, this omission is unlikely to introduce significant error. Historical data from the Pniówek mine show that production figures align with the extraction schedule, and both the number of active longwalls and planned production are expected to remain stable.
Based on this model and the 2024–2030 extraction schedule, the forecast curves (including the 20% post-mining rule and the 15-year decay) were mapped to individual goafs and used as the primary criterion to delineate the study area for further analysis, i.e., to rank and select the zones with the highest expected post-mining methane inflows for subsequent high-resolution geological modeling and drainage borehole design.
Stage I of the methane drainage potential assessment covers the “Pniówek” and “Pawłowice” mining areas, illustrated together with the deposit parts (Figure 3). The analysis focuses on the “Pniówek” area and the non-exploited “Pawłowice” area within the operational parts: “K,” “C,” “N-3,” “N-2,” “N-1 K-1,” “W-1,” “W-2,” “P-1,” “P-2,” “PW,” and “PN” (locations in Figure 3).
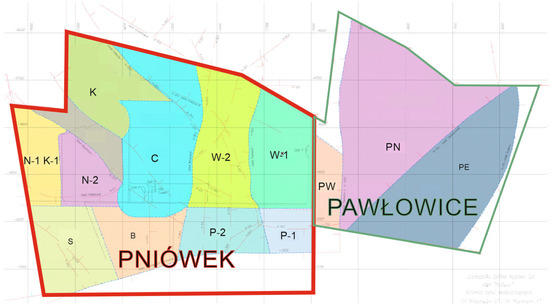
Figure 3.
The ‘Pniówek’ and ‘Pawłowice’ mining areas under methane drainage potential evaluation, together with the deposit parts. This extent is shown relative to the entire USCB in Figure 1 (Legend 7).
2.2. Three-Dimensional Geological Characterization
Two nested 3D models are constructed to quantify the lithological architecture that controls gas storage and flow and to provide direct inputs for drainage well placement. The mine-scale structural model (50 × 50 m horizontal resolution) comprises 40 zones (coal seams and interbeds) and honors mapped faults, seam-floor and seam-thickness maps, and well correlations. A local high-resolution model (10 × 10 m) covers the planned drainage area, inherits large-scale trends from the mine model, and integrates underground borehole profiles to resolve near-field heterogeneity relevant for well trajectories.
The data set included locations and trajectories of surface and underground boreholes, stratigraphic and lithological logs, geophysical well logs in six boreholes (Figure 4), traces of tectonic dislocations/faults, digital seam-floor and -thickness maps, and supporting laboratory descriptors. The workflow (Figure 5) comprised compilation and QC of inputs; inter-well correlation with correction of inconsistencies (level of lithological detail and occasional seam mis-ties) to a harmonized stratigraphic scheme; construction of the structural model (horizons, faults, and zoning) including capturing the geometry of longwalls within all coal seams under exploitation; and facies modeling to reconstruct the lateral–vertical distribution of sandstone/coal/shale on the 50 × 50 m and 10 × 10 m grids. The resulting structural grids, facies probability volumes, and local lithology cubes were exported and used to define candidate drainage horizons, azimuths relative to anisotropy, and borehole trajectories.
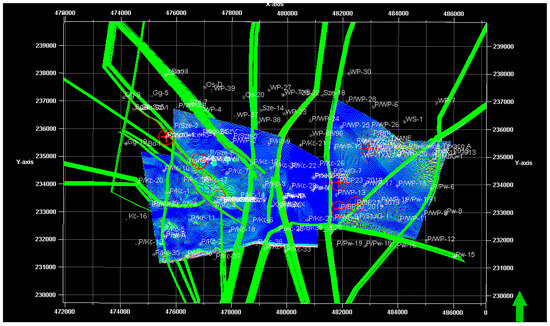
Figure 4.
Location of the main (high-resolution) model against the mine extent, showing available spatial digital data (faults and contour lines of individual coal-seam floors) and the locations of boreholes with available geophysical well-logging curves (red symbols).
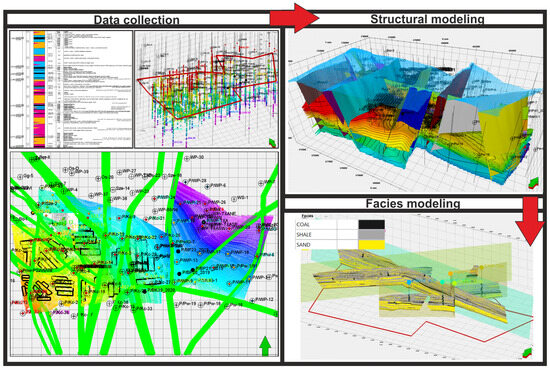
Figure 5.
Modeling workflow illustrating data collection (including data types), followed by structural modeling and facies modeling.
2.3. Selection, Design, and Evaluation of the Dam Sealing
To maintain stable pressure conditions and minimize the impact of active mining operations on goaf-zone drainage efficiency, the investigated area required targeted sealing interventions. The selection of sealing isolation dam locations was informed by a comprehensive geological assessment, emphasizing structural discontinuities and potential methane migration pathways.
Based on the general 3D geological model, a local-scale submodel representing a selected dam area was extracted and employed to develop a simulation framework for the sealing process using the Thermal & Advanced Processes Simulator (STARS; Computer Modelling Group Ltd., Calgary, Alberta, Canada. Within the submodel, a local fracture zone occurring concentrically around the sidewalk was incorporated, as identified, e.g., during exploratory borehole drilling. Fracture porosity was parameterized with a radial gradient, ranging from 0.6 at the sidewalk wall and gradually decreasing to 0.1 at a distance of approximately 5 m. A similar spatial trend was applied to fracture permeability, with values decreasing from about 3 Darcy adjacent to the sidewalk wall to approximately 1 Darcy at 5 m distance. The initial conditions of the simulation assumed a methane saturation (Sg) of 0.85 in both the fracture system and the rock matrix, with a corresponding water saturation (Sw) of 0.15. The dam area was initialized at atmospheric pressure (1 atm) and a temperature of 30 °C. The sidewalk wall was defined as an impermeable boundary, whereas the void space of the sidewalk itself was excluded from flow calculations to ensure consistent model initialization. The injection scenario considered eight wells, each approximately 12 m in length (fully perforated) and 9 cm in diameter, arranged concentrically around the dam area. Injection constraints were selected according to the capabilities of underground injection equipment with max flow of 220 m3/day (~ 9.2 m3/h) and max operating pressure of 14,000 kPa. The injection time was assumed to be 1:30 h.
2.4. Drainage Borehole Design, Drilling, and Measurement Protocols
Drilling stations are planned along the strike of the selected goafs, using accessible workings as drilling bases. Borehole trajectories are designed to intersect the caved zones (Figure 6) and stress-relieved units, thereby maximizing contact length with high-transmissivity intervals. A 3D geological model is examined to define seam positions and to identify sandstone and siltstone layers that provide favorable drilling conditions. Boreholes are drilled with a hydraulic rig; near-wellbore stability is ensured by installing and cementing a surface casing section. Drilling proceeds until indicators of highly permeable or fractured zones are observed (e.g., significant drilling fluid loss), after which the well is completed with a production string and subjected to sealing and perforation according to the design. Each borehole is tied into the methane drainage header (via flexible hoses or a steel pipeline) and equipped with a measurement system based on an orifice plate or an equivalent flow transducer at a specified drawdown. Methane concentration (vol%) and total gas mixture flow (m3·min) are recorded at fixed intervals; methane flow (m3 CH4/min) is computed as the product of mixture flow and CH4 fraction. The procedures include instrument calibration, documentation of measurement conditions, and filtering of operational anomalies to ensure data comparability across stations and over time.
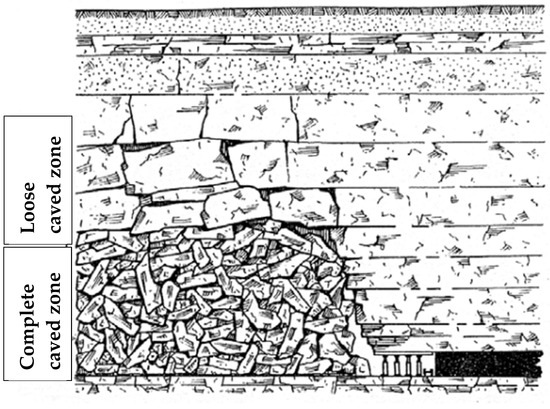
Figure 6.
Mechanism of caved zone formation [18].
3. Results
We present the findings in four parts that mirror the integrated workflow. First, we report the screening results that delineate zones with the highest expected post-mining methane potential and motivate the selection of the K part. Second, we summarize the 3D geological modeling at the mine scale and local scale, which constrains seam geometry and shows facies distribution. Third, we describe goaf-zone selection and sealing, isolating abandoned panels to stabilize pressure regimes and limit interference from ongoing mining. Fourth, we present drilling and methane drainage performance, including initial rates, methane fraction, temporal behavior, and cumulative capture, and relate these observations to the model predictions.
3.1. Assessment of the Potential for Projected Release of Methane into Goafs in the Analyzed Parts of the Pniówek Coal Seam
Calculations of the projected release of methane into the goafs of “Pniówek” Mine were carried out in two stages:
- Stage I: analysis of the predicted release of methane into the goaf areas in parts “K”, “C”, “N-3”, “N-2”, and “N-1 K-1” (locations are shown in Figure 3).
- Stage II: analysis of the predicted release of methane into the goaf areas in parts “W-1”, “W-2”, “P-1”, “P-2”, “PW”, and “PN” (locations are shown in Figure 3).
The sections of the deposit analyzed under Stage I were characterized by a greater intensity and number of longwalls than the projected longwalls in the parts included in Stage II. In Stage I, forecasts of methane release into post-mining goaf areas were prepared separately for five parts in the “Pniówek” mining area: “K,” “C,” “N-3,” “N-2,” and “N-1 K-1” in m3 CH4/min for years 2024 to 2037 (Table 1 and Table 2, Figure 7).

Table 1.
Summary of predictions of methane release into the goaf areas of the “K”, “C”, and “N-3” deposit parts of the “Pniówek” mining area in m3 CH4/min.
Table 2.
Summary of predictions of methane release into the goaf areas of the “N-2” and “N-1 K-1” deposit parts of the “Pniówek” mining area in m3 CH4/min.
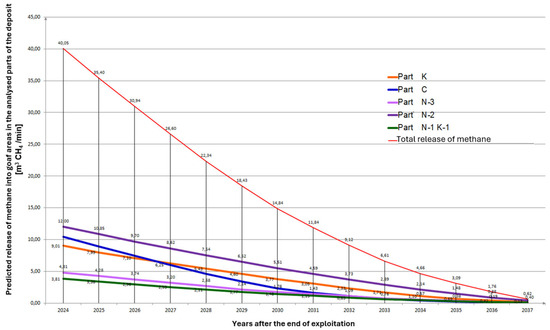
Figure 7.
Summarized projected release of methane into goafs in parts “K”, “C”, “N-3”, “N-2”, and “N-1 K-1” of the “Pniówek” mining area.
Forecast methane releases into goaf areas in the analyzed parts of the deposit indicate favorable conditions for partial capture of desorbing methane.
The analyzed seams were mined between 1980 and 2010, which created the potential for methane migration and was confirmed by the capture of methane by boreholes drilled from the 705 m level to the 580 m level [20].
The design of a de-methanation borehole to extract methane from the goaf areas of the parts analyzed under Stage I (area of Exhaust Shaft IV) will be carried out in the surroundings of the intact deposit (the protection pillar of Exhaust Shaft IV). Methane release into goaf in the “N-2” part of the “Pniówek” Mine at 12 m3 CH4/min in 2024 represents the highest value of the projected potential for methane gas release into goafs. The goaf area in the “K” part of the “Pniówek” Mine is characterized by the second highest potential of the projected methane release estimated in 2024 at 9 m3 CH4/min.
Part “C” of the “Pniówek” Mine is characterized by a projected methane release value of 10.42 m3 CH4/min due to the stress-relieving and degassing nature of the exploited deposit.
The “N-3” part, with methane release into the goaf projected to be less than 5 m3 CH4/min in 2024, is not attractive for methane capture in the post-mining goaf area.
The three designed locations for potential methane intakes from goaf in the “K,” “C,” and “N-2” parts are not enough to meet the assumptions of the REM project, which aims to increase the efficiency of de-methanation at the Pniówek Mine. Hence, the scope of de-methanation was extended to Stage II.
The projected surface de-methanation station at Shaft V of “Pniówek” Mine requires the development of gas models for the projected longwalls and goaf areas in the eastern parts of the mining area, ventilated to Shaft V of “Pniówek” Mine (Stage II).
In Stage II, the total value of the projected methane release into the isolated goaf areas was calculated for the years 2024–2045 in the parts “W-1”, “W-2”, “P-1”, “P-2”, “PW”, and “PN” in the mining areas “Pniówek” and “Pawłowice “.
Table 3 presents the calculated predictions of methane release into isolated goaf areas after longwall extraction in the “W-1”, “W-2”, “P-1”, “P-2”, “PW”, and “PN” parts from 2025 to 2045. Figure 8 shows the total release of methane into isolated longwall goaf areas selected in parts “W-1”, “W-2”, “P-1”, “P-2”, “PW”, and “PN” in 2025–2045.
Table 3.
Summary of predictions of methane release into the goaf areas of the “W-1”, “W-2”, “P-1”, “P-2”, “PW”, and “PN” deposit parts of the “Pniówek” and Pawłowice” mining areas in m3 CH4/min.
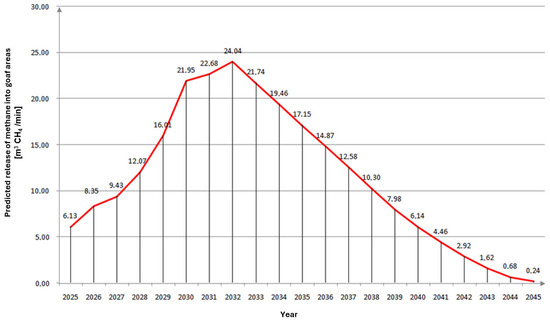
Figure 8.
Total methane release into isolated longwall goafs selected in parts “W-1”, “W-2”, “P-1”, “P-2”, “PW”, and “PN” in 2025–2045.
Considering the period of exploitation of coal seams in parts “W-1”, “W-2”, “P-1”, “P-2”, “PW”, and “PN” before 2024, the actual release of methane from longwalls exploited after 2010, that is, in 2011–2023, should be considered. Calculations of predictions of methane release were carried out. Actual methane release into goafs of longwalls exploited in the parts “W-1”, “W-2”, “P-1”, “P-2”, “PW”, and “PN” should be referred to the Stage II part of the “Pniówek” mining area and exploited longwalls in the seams 361 and 362/1 (Table 4 and Figure 9).
Table 4.
Predicted release of methane to goafs from selected longwalls in seams 361 and 362/1 of the “W-1” part.
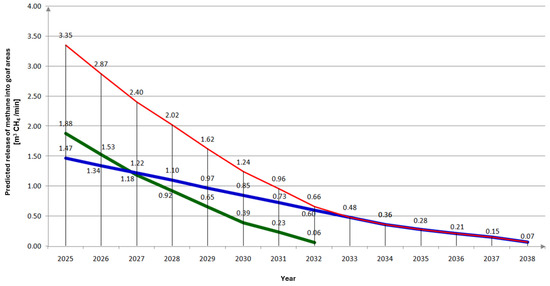
Figure 9.
Predicted release of methane into isolated goafs of longwalls selected in the “W-1” and “W-2” parts of seams 361 and 362/1 in 2010–2024 (blue—seam number 361; green—seam number 362/1; red—cumulative release).
The calculated quantities of methane released into the areas of the projected longwalls between 2025 and 2031 mainly relate to the longwalls subjected to previous partial distressing and degassing of their surroundings.
The exception is the proposed exploitation of the poorly recognized seam 357/1 in the “PN” part of the “1” mining area, which the mine plans to extract first in this part of the mine.
Predicted values of methane release into goaf areas of post-mining parts of the deposit included in Stage I are about twice as big as the predicted methane releases into the goafs of post-mining parts of the deposit analyzed under Stage II. Intensive exploitation of the western and central parts of the “Pniówek” mining area currently influences the total value of prognoses of methane release into post-mining goafs (Figure 10). The volumes of methane intake from the longwalls and post-mining goaf areas in the eastern part of the “Pniówek” mining area and the western part of the “1” mining area will shape the volume flux of methane discharged through the network of de-methanation pipelines to the surface de-methanation station projected near the V Shaft.
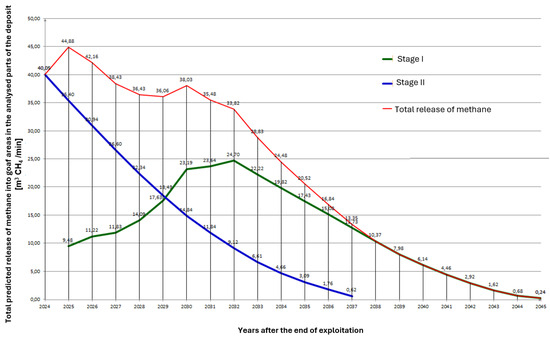
Figure 10.
Total forecasted release of methane into goaf areas of post-mining parts (red) calculated under Stages I (blue) and II (green).
An analysis of the projected release of methane into goaf areas after longwall mining in 2024–2031 at the Pniówek Mine, together with goaf areas formed by earlier mining through 2023, made it possible to identify potential locations for methane intakes in individual parts of the deposit. Based on gas models developed for the Pniówek Mine that predict methane release into goaf areas, 15 candidate intake locations were tentatively indicated in active workings of the ventilation network using directional boreholes drilled into the goafs.
The comprehensive assessment of methane release across the mine enables long-term planning of methane drainage, facilitating effective management of emissions. This study delineated specific zones with significant methane potential, thereby supporting the strategic placement of methane intakes. When considered alongside gas content, a set of objective selection criteria (absence of significant tectonic discontinuities, no ongoing extraction, availability of infrastructure and utilities, and isolation from the active ventilation network) identified the “K” part in the north-western sector of the Pniówek field as the only area meeting all key requirements. This area was therefore subjected to 3D geological analysis and used for the design and execution of methane drainage boreholes.
Effective methane drainage of isolated goafs in the “K” part, performed via boreholes from the K-2 ramp in seam 362/1, will require maintaining ventilation in the workings. Keeping ventilation in seam 362/1 (ramps K-4, K-2, and K-3) will enable drainage of the “K”-part goafs down to seam 362/3+363 from the K-2 ramp. Methane captured by these drainage boreholes will also include gas desorbing into the goaf during longwall operations in seams 401/1 and 404/1. From the K-2 ramp (362/1), it is proposed to drill four bundles of two directional boreholes into the 362/3+363 goaf; directional boreholes TM 1, TM 2, TM 3, and TM 4 would thus constitute the strategic drainage wells for the ongoing operations in the “K” part (Figure 11).
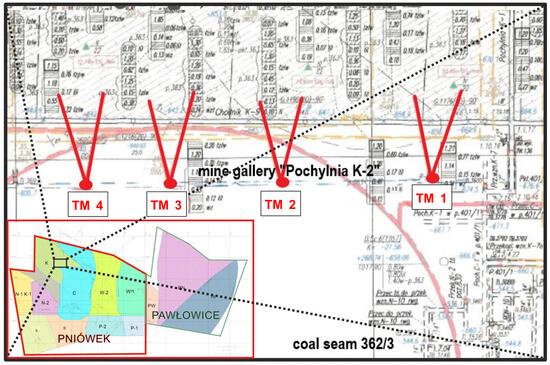
Figure 11.
Location of the drainage area in section K and the planned trajectories (1) of drainage boreholes from ramp K-2 (2) to the selected longwall (3).
3.2. Three-Dimensional Geological Model
The area selected for drainage was then subjected to 3D geological modeling in two variants: a low-resolution mine-scale model and a local high-resolution model. The mine-scale structural model (with a horizontal resolution of 50 × 50 m) reconstructed the geometry of the principal horizons and the tectonic framework, including faults that segmented the deposit. Continuity of the seams in the study area was achieved by integrating all available sources—primarily seam-floor contour lines and seam depths interpreted from surface borehole profiles. The seam-floor trends confirmed a monoclinal dip toward the NE/ENE and document morphological variability in the roofs of overlying units. These results provided the basis for transferring generalized trends and the tectonic framework to the local model (Figure 12).
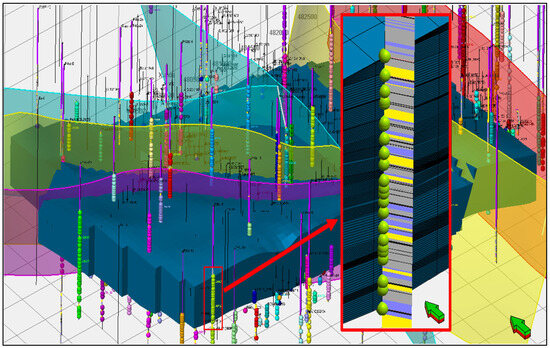
Figure 12.
Mine-scale structural model showing morphological trends.
Within the planned methane drainage zone (the defined K part area), a local high-resolution structural model on a 10 × 10 m horizontal grid was constructed and constrained by underground borehole profiles. The model refined seam geometry in the target area, enabling a higher level of detail in the spatial lithology model required for precise drainage borehole trajectory design. Vertical relationships between the K-2 ramp (seam 362/1) and the target seams (360/1, 361, 362/3+363, and 360/1) were determined with precision, which allowed us to define expected contact intervals within caving zones and to delineate the trajectory of the boreholes. Intervening zones between seams were subdivided into additional layers so that the vertical resolution captured lithological variability in the well profiles, with particular emphasis on sandstones as preferred drilling targets. A view of the structural model with the imposed layering is shown in cross-section A–A′ traversing the study area (Figure 13).
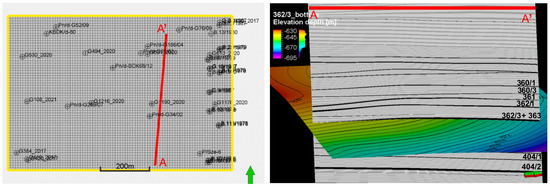
Figure 13.
Local structural model visualized along cross-section A–A′, covering the selected methane drainage zone, with explicit layering and coal seams shown.
The local high-resolution facies model reconstructed the three-dimensional depositional architecture and the distribution of defined lithological types. Given the varying level of detail in well descriptions, lithology was generalized to three classes—coal, shale, and sandstone—which, at the design stage, translate directly into the selection of drainage horizons, the density and spacing of boreholes, the choice of borehole orientations/azimuths with respect to flow anisotropy, and the choice of completion/sealing technology and lengths of perforated intervals.
Within the precisely reconstructed coal-seam geometry, zones dominated by sandstone facies (potentially favorable for transmission and efficient gas capture) and zones with elevated siltstone/mudstone content (local flow barriers) were identified (Figure 14). Unlike the structural model, which defines the geometry of seams and faults, the lithological (facies) model represents spatial lithological variability, allowing for assessment of intervals and contacts that promote methane escape to mine workings versus those that favor its retention and accumulation in goafs, as well as estimation of the risk of flow discontinuities arising from local facies changes.
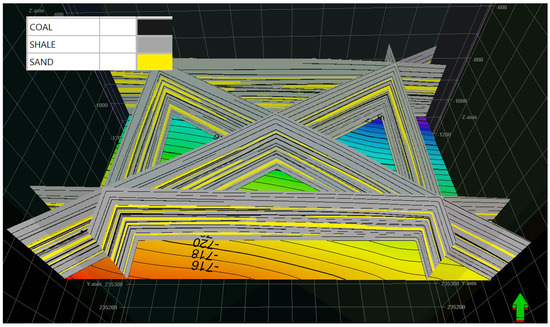
Figure 14.
Cross-sectional views through the facies model within the methane drainage interval (between seams 360/1 and 404/1), shown against the structural map of the 404/1 seam floor.
Building on this foundation, the facies model provides the basis for more detailed investigations, including spatial parametric analyses (e.g., porosity and permeability/stress proxies along planned trajectories), volumetric calculations (e.g., facies-controlled storage and contact lengths within caving envelopes), and uncertainty analyses that propagate data and correlation ambiguities through to drainage design and performance forecasts.
3.3. Sealing Efficiency
Tectonic dislocation zones were recognized as preferential pathways for methane flow. These structures hydraulically connect the deeper, thermogenic methane-bearing formations with shallower, secondary gas accumulations, thereby increasing the likelihood of upward gas migration into mine workings or highly permeable strata. A key stratigraphic transition occurs at depths of approximately 800–1000 m, delineating the interface between thermogenic methane reservoirs and biogenic accumulation zones. Within this interval, the Lower Badenian succession contains porous clastic sediments (20–30% porosity) that act as efficient traps for secondary methane accumulations beneath the low-permeability Miocene overburden. Based on the integration of geological, structural, and gas-monitoring data, optimal sealing dam sites were identified at the contacts between the Carboniferous reservoir units and the Miocene caprock. These sites correspond to zones with elevated methane concentrations detected via borehole sampling. Sealing of selected isolation dams in these structural settings is expected to inhibit upward methane flow along fault planes and permeable pathways, thereby mitigating gas inflow hazards to active mine levels. In total, nine isolation dams located within areas K, C, and N (see Figure 3) were selected for sealing operations. These interventions constitute a key component of a broader strategy for controlling methane migration and enhancing mine safety under complex geological conditions. To ensure more efficient drainage, effective sealing of the mine workings was necessary. Previously used high-viscosity sealing fluids did not provide adequate sealing, resulting in significant gas leaks from the dams. Therefore, the effectiveness of fluids with varying viscosities was tested.
In the simulation studies, the injection process was modeled for three types of fluids, whose properties corresponded to laboratory-tested sealing agents. These resin systems were classified according to their initial viscosity as very low (VLOWV), low (LOWV), and high (HIGHV). The simulation assumptions and key results are summarized in Table 5.
Table 5.
Sealing efficiency simulation assumptions and results.
The injected fluid was transported almost exclusively through the fracture system within the zone of elevated permeability (extending 4–5 m from the sidewalk wall).
All three tested sealing agents demonstrated the potential to create a continuous sealing zone around the analyzed section of the dam, providing a tight barrier limiting methane migration. However, low-viscosity sealing agents achieved greater penetration into the fracture system (Table 5). The maximum sealing radius, characterized by nearly complete fracture filling, reached approximately 2 m from the sidewalk wall for the LOWV case and gradually decreased with increasing distance from the wall.
In the HIGHV case, sealing followed a similar pattern, but the radius of the fully sealed zone was limited to approximately 1.5 m. Moreover, injection at the maximum rate caused a rapid pressure increase up to the allowable limit, necessitating a progressive reduction in the injection rate. As a result, the total injected volume was significantly lower compared to the lower-viscosity fluids.
In conclusion, sealing systems with low initial dynamic viscosity proved to be the most effective, making them the most suitable option for achieving reliable dam isolation. They created a tight seal around the dam, effectively blocking preferential gas flow paths over a greater distance and ensuring a favorable pressure distribution for efficient drainage from the designed wells. The sealing potential of the LOWV system is visualized in Figure 15.
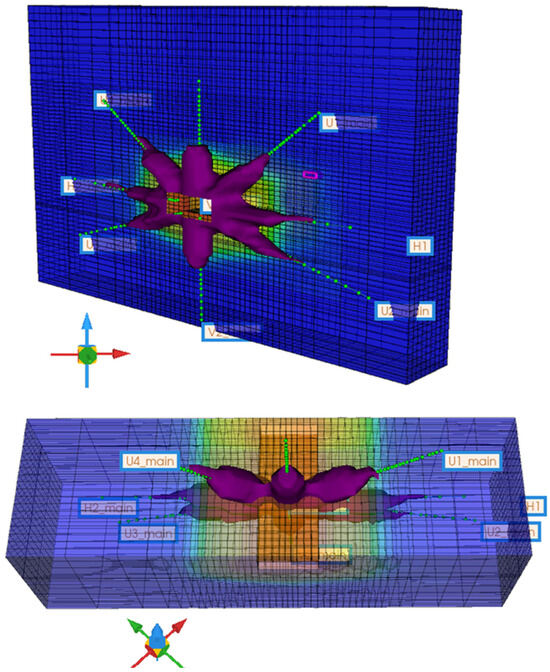
Figure 15.
Distribution of the LOWV injectant around injection wells. The purple zone represents regions with a mass fraction of LOWV greater than 0.95, shown within the zone of increased fracture permeability surrounding the sidewalk. Top: view in the direction perpendicular to the tunnel axis. Bottom: aerial view along the tunnel axis, with the upper grid layers removed to visualize the internal distribution.
3.4. Borehole Performance
The primary criterion for selecting the mining working for the program was its location with respect to the exhausted seams 360/1, 361, 362/1, and 362/3 in the K part. A reconnaissance was performed for transport access, opening dimensions, utilities, and the possibility of installing a methane drainage pipeline. The working adopted for the planned drilling and drainage operations was the K-2 ramp in seam 362/1.
Three of the four designed boreholes were drilled from the K-2 ramp (seam 362/1) (Figure 16); the TM-3 station remains scheduled for drilling. The stations were positioned along the run of longwall K-5 in seam 361, which was exhausted in 2011. Using a spatial lithotype model—integrating lithological well logs and mine workings maps—the area was evaluated for the positions of exhausted seams and for the likely occurrence of sandstone and siltstone intervals favorable for drilling.
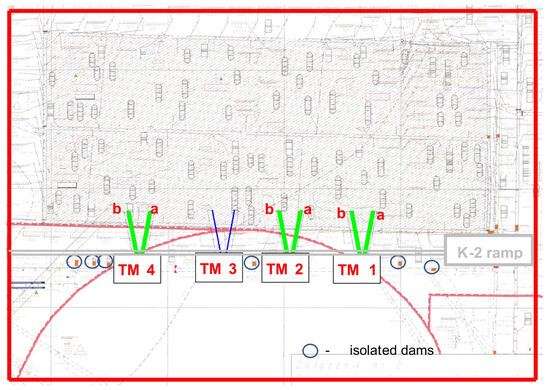
Figure 16.
Location of the designed methane drainage boreholes and isolation dams in relation to the K-2 ramp (362/1). Boreholes marked in green have been drilled; the borehole marked in blue is planned for drilling.
The target seams selected were 360/1, 361, 362/1, 362/3, and 363. In defining the technical parameters of the methane boreholes, we accounted for the extraction height of longwall K-5 in seam 361 and the vertical distances to adjacent exhausted seams. An illustrative axial cross-section of methane boreholes from station TM-1a/b against the lithological distribution along section A–A′ is provided (Figure 17).
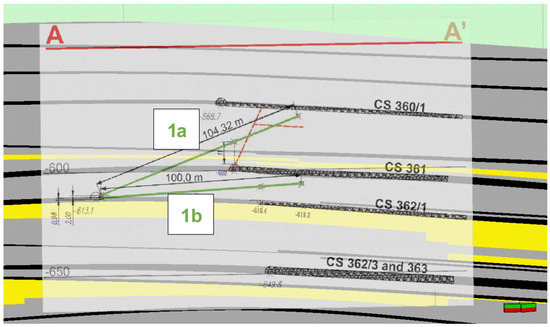
Figure 17.
Axial cross-section of the trajectories of methane drainage boreholes from station TM-1a–b, shown against the lithological distribution.
The average vertical distances from coal seam 362/1 to the seams located within the influence zone are presented in Table 6.
Table 6.
Coal seams subject to methane drainage.
All boreholes were designed to intersect the theoretical caving zone of the exhausted longwall K-1 in seam 362/1 and the destressed zone resulting from the extraction of seam 361 (longwall K-5), as well as the theoretical compacted caving zone of longwall K-5 in seam 361.
The TM-1a borehole was connected to the drainage network using four 50 mm hoses to a common header. Measurements employed a 100/80 mm orifice at a maximum depression of 160 mmHg. Contrary to initial expectations (no overpressure prior to tie-in), high volumetric flows of the methane–air mixture with high methane fractions were obtained. The record was observed after 3 days: 17.2 m3 CH4/min; elevated output persisted for 12 days thereafter.
Borehole TM-1b, once connected to the drainage network, demonstrated an initial performance comparable to that of TM-1a; however, a complete decline in methane flow occurred within five days of operation, after which the borehole was decommissioned. The methane drainage performance of borehole TM-1b is summarized in Table 7.
Table 7.
Summary of measurement results and de-methanation calculations for borehole TM-1 a and b.
The remaining boreholes in the system show stable but lower outputs of approximately 0.5 m3 [CH4/min] each and remain in operation to date.
The observed spread in borehole performance (0.5–17.2 m3 [CH4/min]) indicates pronounced geological heterogeneity within the area and local hydrogeological controls on drainage efficiency. The exceptionally high rate of TM-1a suggests penetration of a zone with favorable reservoir properties and/or hydraulic connection to a natural fracture system in the rock mass.
Monthly totals of captured methane are compiled in Table 8, enabling assessment of the long-term performance of the drainage system and planning of subsequent optimization steps.
Table 8.
Total monthly volume of methane capture.
4. Discussion
The analysis of methane drainage results for 4 months confirmed heterogeneous efficiency across elements of the drainage system. Boreholes 1 and 2 located near the K-2 ramp in seam 362/1 exhibited a stable output of about 0.5 m3 CH4/min at an average methane concentration of 41.0%. These parameters indicate probable upward migration of methane toward higher parts of the deposit, which may be related to the prior extraction of seam 360/1 (K-11 longwall). At the same time, the exceptionally high performance of borehole TM-1a (17.2 m3 CH4/min) is most likely associated with an unintended upward deviation of the drilling trajectory and intersection of intervals with differing reservoir properties; the lack of inclinometry prevents verification of this hypothesis.
Despite the anticipated effect of the main fan on westward redistribution of methane, all drilled methane boreholes showed broadly similar performance values. This suggests that, over the study period, operational factors did not dominate the system response compared with local geological conditions and the actual borehole trajectories.
In response to the results obtained, a decision was made to redesign the methane boreholes to more effectively penetrate the 360/1 goaf. The ongoing extraction of seam 401/1 (K-2 longwall) may significantly shape future methane drainage efficiency due to the multi-level configuration of goafs: almost the entire K-2 longwall in seam 401/1 is mined beneath the goafs of seams 362/3 and 363 at a vertical separation of 12.0–17.0 m.
The section at 100.0–608.0 m of the longwall run proceeds beneath the goafs of seam 362/1 at a vertical separation of 40.6–52.0 m; the initial segment up to 670.0 m of the run is mined beneath the goafs of seam 360/1 at a vertical separation of 97.0–99.0 m.
Such a configuration may induce additional degassing processes and extend the effective operating period of existing drainage boreholes, which necessitates systematic monitoring in subsequent phases of the study.
A more detailed analysis of the spatial distribution of lithofacies could constitute an important point of reference in this context. However, given the availability of lithological logs with varying levels of detail, a consequential decision was made to simplify the lithological types applied in the model to three categories (coal, sandstone, and shale). The extended version of the lithological profile in a subset of boreholes also included intermediate lithofacies such as carbonaceous shale, sandy shales, and siltstones. Consequently, this simplification—imposed by the non-uniformity of the available lithological characterization—substantially limited the extent to which the lithofacies modeling results could be utilized for the methane drainage problem within the selected area. Notwithstanding these limitations, the constructed structural model (delineating the locations of tectonic faults) and the model representing the morphology of individual coal seams served as key references for borehole design.
5. Conclusions
This work followed a coherent four-step workflow: (1) Study area delineation—screening based on forecasts of post-mining inflow focused effort on zones with the highest expected methane potential, narrowing the search space before any field intervention. (2) Geological modeling—the mine-scale and local 3D models translated this screening into specific trajectory corridors, accounting for seam geometry, caving envelopes, and local fault segmentation. (3) Goaf-zone selection and sealing-efficiency evaluation—targeted abandoned panels were isolated to stabilize pressure regimes and reduce interference from ongoing mining, enhancing drainage performance. Numerical simulations enabled forecasting of sealing-fluid behavior, including the extent of barrier formation, the required injection rates, and the injection pressures necessary to achieve effective isolation. All three tested fluids showed the potential to create a tight sealing zone around the dam, thus limiting methane migration; however, low-viscosity fluids achieved greater penetration into the fracture system while reducing the risk of exceeding allowable injection pressures, making them the most suitable option for field application. (4) Drilling and methane drainage—measured outputs provided verification data, closing the loop and informing incremental adjustments to borehole siting and target depths.
In the present work, the lithological model did not play a decisive role in final design choices because, given heterogeneous well descriptions, lithology had to be generalized to three classes (coal, shale, and sandstone). This simplification was necessary for data integration and sufficient to highlight sandstone-dominated zones within the caving envelope as preferred targets, but it limited fine-scale discrimination of flow properties and barriers.
Although detailed petrophysical–geomechanical modeling was not performed “on the detailed model area” (for example, see [21,22]), such work would enable multi-dimensional analyses, including mapping and calibration of permeability/stress proxies in caved zones and evaluation of stress-dependent permeability, sensitivity and uncertainty analyses (e.g., ranges in facies or volumetric parameters) in a probabilistic framework, and trajectory and perforation optimization (contact lengths within caving envelopes, azimuth selection, and borehole spacing) with explicit wellbore stability constraints (casing setting depths, sealing/perforation strategy, and avoidance of weak intervals) to maximize capture while minimizing ventilation load.
Overall, the integrated approach—area screening, 3D modeling, sealing injection simulations, and iterative field verification—reduces uncertainty in siting and execution, while the observed performance underscores the value of steering future work toward richer parametric characterization where data permit.
Author Contributions
Conceptualization, W.K.-K., and M.S.-V.; methodology, W.K.-K., M.S.-V., R.C.-S., R.S., and A.W.; software, W.K.-K., M.S.-V., and M.W.; validation, R.C.-S., and W.K.-K.; formal analysis, W.K.-K., M.S.-V., and R.C.-S.; investigation, W.K.-K., M.S.-V., and R.C.-S.; resources, W.K.-K., M.S.-V., R.C.-S., R.S., and A.W.; data curation, W.K.-K., M.S.-V., R.C.-S., R.S., and A.W.; writing—original draft preparation, W.K.-K., M.S.-V., R.C.-S., M.W., R.S., and A.W.; writing—review and editing, W.K.-K., and M.S.-V.; visualization, W.K.-K., M.S.-V., R.S., and A.W.; supervision, W.K.-K., M.S.-V., and R.C.-S.; project administration, R.C.-S., G.L., A.K., A.B., and Z.L.; funding acquisition, A.B., A.W., and G.L. All authors have read and agreed to the published version of the manuscript.
Funding
This report is part of the project entitled “Reduction of methane emissions from post mining goafs to minimise their inflow into VAM” (acronym: REM) that has received funding by the European Union’s Research Programme of the Research Fund for Coal and Steel, grant agreement number 101099061-REM—RFCS-2022-JT and from the Polish Ministry of Science and Higher Education (contract no. 5404/FBWiS/2023/2 and 5458/FBWiS/2023/2).
Data Availability Statement
The original contributions presented in this study are included in the article; further inquiries can be directed to the corresponding author.
Conflicts of Interest
Authors Radosław Surma and Artur Badylak were employed by the Jastrzębska Spółka Węglowa SA. The remaining authors declare that the research was conducted in the absence of any commercial or financial relationships that could be construed as a potential conflict of interest.
References
- Krause, E. Zagrożenie Metanowe w Kopalniach Węgla Kamiennego; Wydawnictwo GIG: Katowice, Poland, 2019; pp. 162–163. ISBN 978-83-65503-16-9. [Google Scholar]
- Kotas, A. (Ed.) Coal Bed Methane Potential of the Upper Silesian Coal Basin, Poland; Prace PIG, CXLII; Państwowy Instytut Geologiczny: Warszawa, Poland, 1994.
- Karacan, Ç.Ö.; Ruiz, F.A.; Cotè, M.A.; Phipps, S. Coal mine methane: A review of capture and utilisation practices with benefits to mining safety and to greenhouse gas reduction. Int. J. Coal Geol. 2011, 86, 121–156. [Google Scholar] [CrossRef]
- Szlązak, N.; Swolkień, J. Possibilities of Capturing Methane from Hard Coal Deposits Lying at Great Depths. Energies 2021, 14, 3542. [Google Scholar] [CrossRef]
- Swolkień, J.; Szlązak, N. The Impact of the Coexistence of Methane Hazard and Rock-Bursts on the Safety of Works in Underground Hard Coal Mines. Energies 2021, 14, 128. [Google Scholar] [CrossRef]
- Black, D.J.; Aziz, N. Improving UIS Gas Drainage in Underground Coal Mines. In Proceedings of the Coal Operators’ Conference, Wollongong, Australia, 14–15 February 2008; pp. 186–196. [Google Scholar]
- IPCC. Climate Change 2014: Synthesis Report; Contribution of Working Groups I, II and III to the Fifth Assessment Report of the Intergovernmental Panel on Climate Change; IPCC: Geneva, Switzerland, 2014; p. 151. [Google Scholar]
- International Energy Agency (IEA). Global Methane Tracker 2023; IEA: Paris, France, 2023; Available online: https://www.iea.org/reports/global-methane-tracker-2023 (accessed on 30 November 2024).
- UNECE. Best Practice Guidance for Effective Methane Drainage and Use in Coal Mines, 2nd ed.; United Nations Publications, ECE Energy Series No. 47; United Nations Economic Commission for Europe: Geneva, Switzerland, 2016; ISBN 978-92-1-117121-1. [Google Scholar]
- Guo, H.; Todhunter, C.; Qu, Q.; Kerr, H.; Qin, J. An Innovative Drainage System for Coal Mine Methane Capture Optimisation and Abatement Maximisation. In Proceedings of the 2016 Coal Operators’ Conference, Wollongong, Australia, 18–20 February 2016; Aziz, N., Kininmonth, B., Eds.; pp. 380–393. Available online: https://ro.uow.edu.au/coal/624 (accessed on 15 June 2025).
- Bagherzadeh, A.; Najafi, M.; Mohammad, F.; Noroozi, M. A Proper Borehole Pattern Design for Coal Seam Methane Drainage in Tabas Coal Mine Using COMSOL Multiphysics. J. Sustain. Min. 2022, 21, 5. [Google Scholar] [CrossRef]
- Kędzior, S.; Kotarba, M.; Pękała, Z. Geology, spatial distribution of methane content and origin of coalbed gases in Upper Carboniferous (Upper Mississippian and Pennsylvanian) strata in the south-eastern part of the Upper Silesian Coal Basin, Poland. Int. J. Coal Geol. 2013, 105, 24–35. [Google Scholar] [CrossRef]
- Urych, T.; Chećko, J.; Rosa, M.; Wątor, A. Evaluation of undeveloped hard coal deposits and estimation of hard coal reserves in the Upper Silesian Coal Basin, Poland. J. Sustain. Min. 2021, 19, 230–242. [Google Scholar] [CrossRef]
- Dreger, M.; Kędzior, S. Methane Emissions Against the Background of Natural and Mining Conditions in the Budryk and Pniówek Mines in the Upper Silesian Coal Basin (Poland). Preprint 2020. [Google Scholar] [CrossRef]
- Weniger, P.; Franců, J.; Hemza, P.; Krooss, B. Investigations on the methane and carbon dioxide sorption capacity of coals from the SW Upper Silesian Coal Basin, Czech Republic. Int. J. Coal Geol. 2012, 93, 23–39. [Google Scholar] [CrossRef]
- Sechman, H.; Kotarba, M.; Kędzior, S.; Kochman, A.; Twaróg, A. Fluctuations in methane and carbon dioxide concentrations in the near-surface zone and their genetic characterization in abandoned and active coal mines in the SW part of the Upper Silesian Coal Basin, Poland. Int. J. Coal Geol. 2020, 227, 103529. [Google Scholar] [CrossRef]
- Kędzior, S.; Teper, L. Coal Properties and Coalbed Methane Potential in the Southern Part of the Upper Silesian Coal Basin, Poland. Energies 2023, 16, 3219. [Google Scholar] [CrossRef]
- Tajduś, K. Określenie Wartości Parametrów Odkształcenia Górotworu Uwarstwionego w Rejonie Wpływów Eksploatacji Górniczej. Ph.D. Thesis, AGH University of Science and Technology, Kraków, Poland, 2008. [Google Scholar]
- Krause, E.; Pokryszka, Z. Investigations on methane emission from flooded workings of closed coal mines. J. Sustain. Min. 2013, 12, 40–45. [Google Scholar] [CrossRef]
- Krause, E. Systematisation of seams designed for extraction in mines from the aspect of the mining-geological and gas recognition level. Arch. Min. Sci. 2009, 54, 203–222. [Google Scholar]
- Teng, T.; Chen, Y.; Wang, Y.; Qiao, X. In situ nuclear magnetic resonance observation of pore fractures and permeability evolution in rock and coal under triaxial compression. J. Energy Eng. 2025, 151, 04025036. [Google Scholar] [CrossRef]
- Li, X.; Ren, Z.; Cao, Z.; Ren, H. Study on coal drawing parameters of deeply buried hard coal seams based on PFC. Sci. Rep. 2025, 15, 21934. [Google Scholar] [CrossRef] [PubMed]


Disclaimer/Publisher’s Note: The statements, opinions and data contained in all publications are solely those of the individual author(s) and contributor(s) and not of MDPI and/or the editor(s). MDPI and/or the editor(s) disclaim responsibility for any injury to people or property resulting from any ideas, methods, instructions or products referred to in the content. |
© 2025 by the authors. Licensee MDPI, Basel, Switzerland. This article is an open access article distributed under the terms and conditions of the Creative Commons Attribution (CC BY) license (https://creativecommons.org/licenses/by/4.0/).