Abstract
With the continuous construction and operation of urban subways, rapid changes in various urban elements have occurred, subsequently resulting in land subsidence along subway lines. Compared to the construction period, monitoring and multi-factor analysis of subway deformation during the operational period is relatively limited. In this paper, we examine the issue through the novel lens of socio factor agglomeration. Both Sentinel-1, TerraSAR-X, ascending/descending LuTan-1 images and a Block PS-InSAR method were used to monitor 8-year ground subsidence for Kemulang station on Guangzhou Metro Line 6. Compared with the leveling measurements, the root mean square error (RMSE) of the InSAR results was 2.24 mm. Furthermore, social agglomeration effects such as population concentration, property clustering, commercial aggregation and the intensification of resource consumption were considered to analyze the main reason of ground subsidence, the synergistic process of multiple factors and the mechanism of accelerated subsidence phenomenon. We can find from the results that the fundamental cause of the large-scale land subsidence along the subway line is groundwater over-extraction triggered by population agglomeration, coupled with the response of adverse geological formations. Groundwater over-extraction has caused irreversible damage to the local strata. The research shows that the social agglomeration effect will cause more complex disturbance to the subway and lead to more continuous ground subsidence and more covert safety threat for subway operation, which should not be ignored.
1. Introduction
With the continuous development of urbanization in China and the ongoing advancement of underground space utilization, subway systems have become vital infrastructure bearing the burden of urban transportation. As of February 2025, a total of 58 cities in China had urban rail transit systems in operation, encompassing 361 lines with a total operational length of 12,160.77 km. Furthermore, the national urban rail transit network was undergoing significant expansion, with 226 lines under construction, which would add 5833.04 kilometers to the network [1]. Ground subsidence can occur along the metro lines during both the construction and operational periods, which poses risks to surface structures, roads and the safety of approximately 30 billion passenger trips annually. Consequently, it is imperative to implement subsidence monitoring along subway lines [2].
Owing to its all-day, all-weather, large-scale and high-precision capabilities, interferometric synthetic aperture radar (InSAR) technology has become one of the main methods for large-scale deformation monitoring [3,4]. The launch of the Sentinel-1 satellites, in particular, has provided a continuous and stable data supply since 2014, thereby significantly enhancing the capability of InSAR for backdating and measuring surface deformation [5,6]. Regions such as Shanghai [7,8], Beijing [9,10], Guangzhou [11], Seoul [12], Bucharest [13], Tehran [14] and Manila [15] have employed InSAR technology to conduct large-scale, long-term ground subsidence monitoring along subway lines, with promising outcomes.
Due to the more pronounced ground deformation induced by shield tunneling, many scholars have focused their research on the construction period [13,16,17,18]. Some environmental factors also need to be considered to analyze land-subsidence susceptibility for subways such as elevation, slope, topographic wetness index, profile curvature, normalized differential vegetation index and so on [12,19,20], but most of them are physical factors. However, subway construction is not merely an engineering project but also generates significant social agglomeration effects [21,22], including population concentration, property clustering, commercial aggregation and the intensification of resource consumption. Social agglomeration effects can give rise to more complex surface and subsurface disturbances over a longer period of time. Thus, continuous deformation monitoring of subways during their operational phase is equally critical. However, research and analysis in this area remain relatively limited.
In this study, we selected the Kemulang Station on Guangzhou Metro Line 6 as the research area. By using multi-track SAR data including Sentinel-1, TerraSAR-X, ascending and descending LuTan-1, and Block PS-InSAR algorithm, we conducted a retrospective measurement of surface deformation over an eight-year period. Furthermore, considering the perspective of social agglomeration effects triggered by the operation of the subway station, the coupling relationship between ground subsidence and the clustering of social factors (such as population concentration, building density and water resource consumption) was analyzed, along with the process of subsidence evolution.
2. Study Area and Methods
2.1. Study Area
As shown in Figure 1, Kemulang Village [23] is located in Tianhe District, Guangzhou City, Guangdong Province, covering an area of 8.2 square kilometers. It comprises 15 natural villages and contains 3775 buildings, most of which are self-built structures. The village has a permanent population of approximately 41,000 people and a history spanning over 300 years, making it one of the well-known historical villages in Tianhe District. To the northeast of Kemulang Village lies Fenghuang Mountain, while to the south is Huolu Mountain. With an annual rainfall of up to 2000 millimeters, the area serves as a natural catchment zone. In August 2003, experts identified a massive underground mineral water belt in this region, with water reserves exceeding 10 million tons. As a result, it has been common practice for villagers to extract groundwater for drinking, leading to a relatively low penetration rate of tap water in the area.
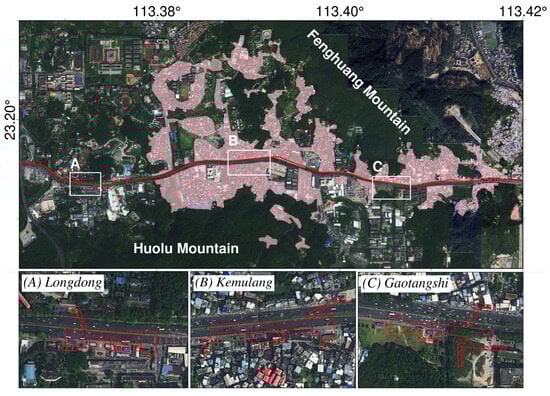
Figure 1.
Study area. Red lines show the Metro Line 6 and three subway stations: Longdong station, Kemulang station and Gaotnagshi station. Pink patches show the location of natural villages in Kemulang Village.
Within the study area, there are three subway stations on Metro Line 6: Longdong Station, Kemulang Station and Gaotangshi Station. Among them, Kemulang Station was constructed by using the open-cut excavation method, with a burial depth of 16.6 meters [24]. The tunnel boring was completed in September 2014, and the station commenced operation on 28 June 2017. Following its opening, the station has triggered significant agglomeration effects, with passenger flow reaching 1.2 million passengers per month by August 2022.
2.2. Methods
2.2.1. Block PS-InSAR Workflow
In this paper, we adopted the persistent scatterer InSAR (PS-InSAR) method to extract surface deformation. Considering that the spatial resolution of some SAR images (TerraSAR-X and LuTan-1) is better than 3 m, and there are more than 1.8 million PSs in study area, the traditional PS-InSAR algorithm cannot deal with such a large sequence of point targets [25]. Therefore, a hierarchical and partitioned approach called Block PS-InSAR [26] was adopted to achieve efficient extraction of deformation measurements. The workflow of the Block PS-InSAR is shown in Figure 2.
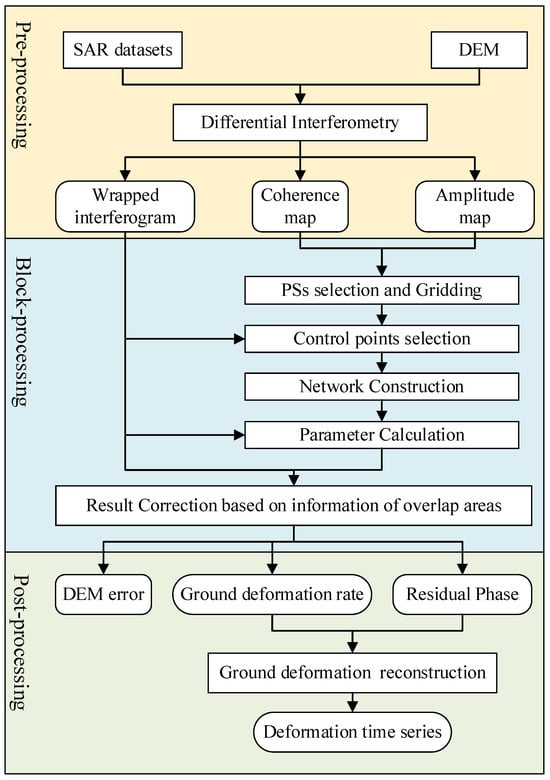
Figure 2.
Workflow of Block PS-InSAR adopted from [26].
Unlike the traditional PS-InSAR method, which only constructs a single integrated network for the entire area [25,27,28], the Block PS-InSAR divides the whole study area into several regular blocks and sets overlap between adjacent blocks. Drawing on the grade leveling survey [29], two levels of PS networks in the blocks (secondary network) and between blocks (primary network) were constructed. Primary network consists of PS points with the optimal phase quality within each block and constructed by triangular irregular network to form the control network over the study area. Secondary network is constructed in each block. Star network is used to form the detail survey network. After two-level network adjustment, we can obtain the ground subsidence efficiently for large-scale area and massive number of PS points.
Block control point selection is one of the most important processing for Block PS-InSAR. A two-step method is used in this part. Firstly, we increased the coherence threshold and the amplitude dispersion threshold to select top 50 PS points with the highest coherence and the lowest amplitude dispersion as candidate control points. Secondly, 50 star-shaped networks were construction-centered on every individual candidate control point. For a PS point, the interferometric phase in the ith interferogram can be expressed as in Equation (1) [26]:
where and are the wavelength, the satellite-target distance and the incidence angle for the sensor, respectively; and are the temporal baseline and perpendicular baseline, respectively; is the linear deformation rate for the PS point; is the elevation error due to inaccurate Digital Elevation Model (DEM) data; and is the residual phase contributed by atmospheric delay, non-linear residual motion, noise error and so on.
The differential phase for an arc that connects two PSs can be derived as in Equation (2) [26]:
where is the phase difference between two neighboring pixels; and are the mean deformation rate difference and residual elevation difference in each of the persistent scatterer pair, respectively; and is the difference in residual phase and composed by non-linear deformation and phase noise.
If a given candidate control point exhibits a relatively low phase signal-to-noise ratio (SNR), the sum of the residual phase along the arcs within the star-shaped network centered on this candidate control point tends to be larger. Therefore, by computing the mean multi-image phase coherence [28] in Equation (3) for each star-shaped network, the candidate control point with the highest mean coherence value is selected as the final control point for the block.
where N is the number of full-resolution interferograms, and is an imaginary unit with ; can be derived using Equation (2).
After above, we can derive deformation results over the study area by using solution-space searching [30] method and weighted least-squares method. Due to the relative independence of the computation within each grid cell, parallel processing algorithms can be utilized to significantly enhance computational efficiency. Finally, to address result discontinuity between adjacent blocks, the least-squares adjustment method is used once again by considering result differences of overlapping regions within different blocks. Finally, all of the block results can be corrected accurately, and we can obtain deformation rate for each PS point with high accuracy.
2.2.2. Data Processing
The LuTan-1 is China’s first civilian L-band synthetic aperture radar satellite. It consists of two satellites, A and B, operating in the same orbit for coordinated Earth observation [31,32,33]. Since June 2023, the system has been conducting continuous observations with a revisit cycle of 28 days [34].
Owing to imprecise orbital parameters, some interferograms exhibit pronounced trend errors, which can compromise the accuracy of PS-InSAR. In this paper, deformation results obtained by Sentinel-1 were used to simulate the deformation phase and removed from LuTan-1 interferograms. Then, we unwrapped the interferogram and fitted trend error using polynomial to refine the orbital parameters. Finally, the refined orbital parameters were used to produce interferograms again for LuTan-1 data. The above processing can significantly enhance the accuracy of deformation measurements derived from LuTan-1 data.
Additionally, to enable comparative analysis of deformation measurements from different SAR data, this study assumes that the deformation in the study area is mainly contributed by vertical direction [11]. Consequently, the line-of-sight (LOS) deformation measurements were projected onto the vertical direction in this paper [35,36]. Furthermore, to unify the reference frames of different SAR deformation time series and leveling observations, we used the Sentinel-1 time-series results as the benchmark. For each of the other results, a measurement taken within a 3-day interval of the Sentinel-1 result was selected and the difference between this value and the Sentinel-1 result is calculated as the overall correction for the sequence, thereby enabling comparison across different series results.
Moreover, given the spatial continuity of strata, data from adjacent boreholes belonging to the same stratum are directly connected to construct a two-dimensional stratigraphic profile of the area.
3. Datasets and Results
In this paper, four types of SAR data acquired between March 2017 and January 2025 were employed, including Sentinel-1, TerraSAR-X, ascending LuTan-1 and descending LuTan-1 (the parameters of each SAR data are described in Table 1). The coverage of those SAR data is shown in Figure 3. Additionally, to validate the accuracy of the deformation monitoring results, 58 scenes of leveling measurement data between September 2020 and July 2022 from four ground points (P1–P4 in Figure 3) and 415 scenes of groundwater level records between September 2020 and January 2025 from two monitoring stations (W1–W2 in Figure 3) within the study area were also collected with time intervals ranging from several days to several months.

Table 1.
Parameters for SAR datasets.
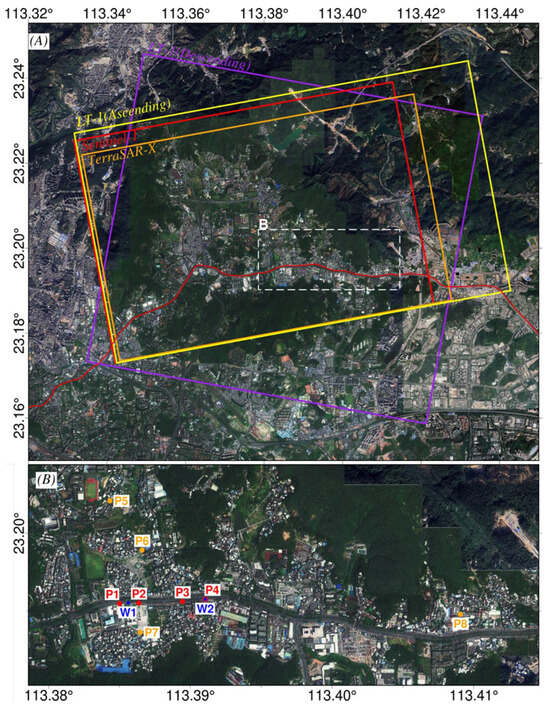
Figure 3.
Data coverage. (A) Red, orange, yellow and pink rectangles represent the coverage of Sentinel-1, TerraSAR-X, ascending LuTan-1 and descending LuTan-1, respectively; (B) red, orange and blue points show the InSAR monitoring points (P1–P8), leveling monitoring points (P1–P4) and groundwater level monitoring points (W1–W2).
Single-reference interferograms were constructed and the spatial–temporal baselines of the interferograms are shown in Figure 4. A LiDAR 1 m DEM produced by us was used to remove the topographic phase as much as possible.
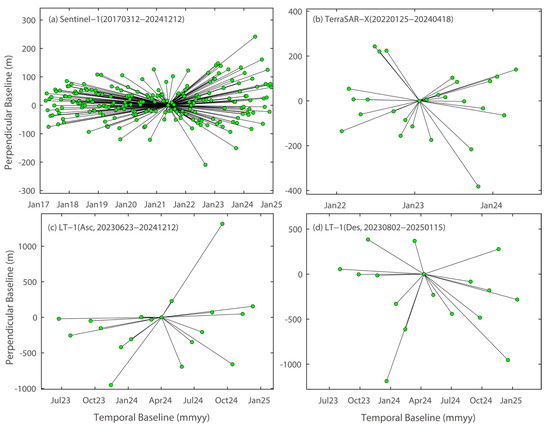
Figure 4.
The spatial–temporal baselines of the interferograms for Sentinel–1, TerraSAR–X and LuTan–1.
After Block PS-InSAR processing, we have obtained the linear deformation rates of the study area over different time periods. As shown in Figure 5, two subsidence funnels are identified along Metro Line 6, located at Kemulang Station and Gaotangshi Station, respectively. Kemulang funnel measures approximately 1.5 km × 1 km, with a maximum settlement rate of 39.6 mm/year. Gaotangshi funnel covers an area of about 0.44 km × 0.55 km, with a maximum settlement rate of 14.3 mm/year. Those two subsidence funnels exhibited noticeable uplift after 2022. The Gaotangshi funnel began to uplift first, followed by the Kemulang funnel, with a maximum uplift rate of 26.1 mm/year.
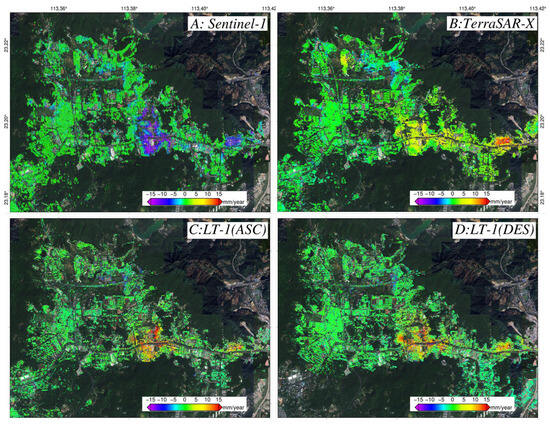
Figure 5.
Deformation rate for Kemulang Village.
To further analyze the spatio-temporal evolution of deformation in the area, we extracted the deformation time series (shown in Figure 6) from eight monitoring points (shown in Figure 3B, P1–P8). Among these, points P1–P4 are distributed along the east–west direction of the Kemulang funnel, located near the leveling monitoring station, while points P5–P7 are aligned in a north–south direction. Point P8 is situated within the Gaotangshi funnel. We can find from the results that the InSAR-derived deformation time series shows strong agreement with the leveling measurement data, with a mean RMSE of 2.24 mm, demonstrating the high accuracy of the InSAR-based deformation monitoring results. We can also find that Kemulang funnel subsided continuously since 2017 and accelerated after March 2021. The subsidence ceased after March 2022, followed by a gradual uplift. The maximum cumulative settlement exceeded 180 mm. In contrast, the Gaotangshi funnel remained stable before November 2020, after which rapid subsidence occurred at a rate of 80 mm/year. This subsidence stopped after March 2022, giving way to uplift.
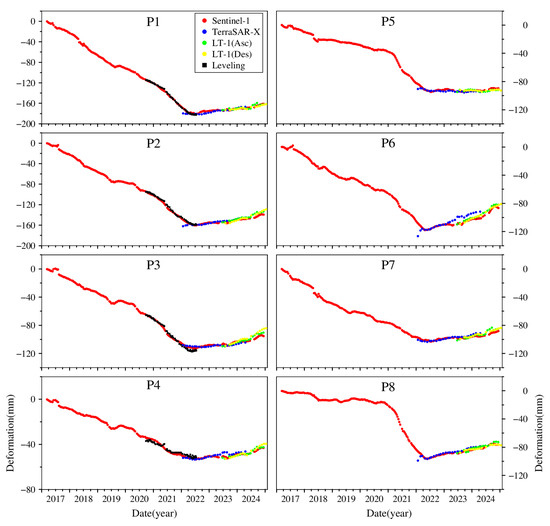
Figure 6.
Comparison of Sentinel-1 (red point), TerraSAR-X (blue point), ascending LuTan-1 (green point), descending LuTan-1 (yellow point) and leveling (black point) time series deformation for (P1–P8) described in Figure 3B.
Meanwhile, the change deformation time series across profile P1–P2–P3–P4 and P5–P6–P2–P7 revealed that the center of the Kemulang funnel is primarily located along Guangshan Road, with the deformation attenuating gradually toward the north and south directions. Furthermore, the accelerated settlement trend observed in 2021 also exhibited a temporally delayed propagation from the central zone to the northern and southern areas.
4. Discussion
In this section, we analyzed the correlation and inducing mechanisms between social agglomeration effects induced by the operation of the metro station (such as population concentration, building density and water resource consumption) and the ground subsidence observed in Kemulang station. Additionally, this paper examines the primary triggers (such as groundwater extraction and increase in impermeable surface) of groundwater changes and their corresponding geological responses.
4.1. Effects of Buildings and Population Agglomeration on Ground Subsidence
The construction of metro stations signifies not only an improvement in transportation accessibility but also leads to the agglomeration of buildings and population [37,38,39,40]. Since the metro commenced operation in 2017, Kemulang Village has undergone large-scale building construction and expansion, with newly built and rooftop extension areas exceeding 1.79 million square meters. Meanwhile, the mobile population in this village also increased significantly. By 2020, the number of the mobile population had reached 38,987, accounting for 44.5% of the total population. We used two JiLin-1 optical images acquired in 2016 and 2024, with 0.5 m resolution, to conduct change detection analysis [41,42]. We can find from the results that there are many new constructions (Figure 7A), surface hardening (Figure 7C) and rooftop extensions (Figure 7B,D) within the two subsidence funnels. The substantial increase in building structures has contributed to additional surface loading, thereby accelerating local ground subsidence.
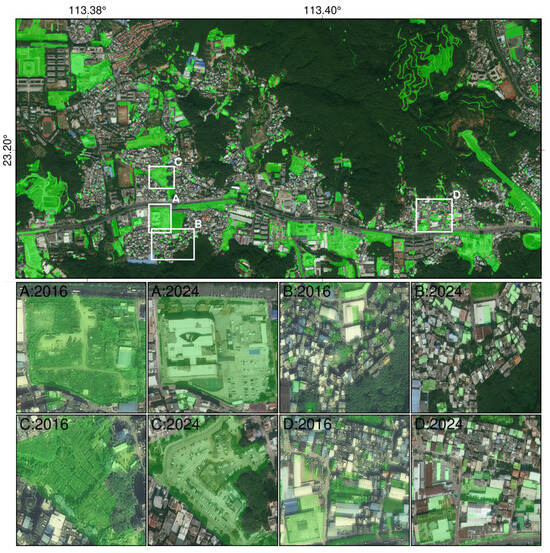
Figure 7.
Change detection results by using two optical images acquired in 2016 and 2024. Image comparison of new construction (A), surface hardening (C) and rooftop extensions (B,D) is shown in detail.
Most buildings in this area are self-built structures with shallow foundations and inherent structural vulnerability. Long-term and large-scale ground subsidence may therefore induce significant risks to building safety. This study further evaluates building safety risks [43,44,45,46]. Using high-resolution InSAR deformation monitoring results, parameters such as the maximum deformation rate, differential deformation rate and building slope rate within the area were extracted. According to the threshold value described in Table 2, the risk of building deformation is divided into levels A, B, C and D (shown in Figure 8). Statistical results indicate that 150 buildings in the area were classified as Grade D risk, accounting for 3.5% of the total number of 4227 buildings, underscoring significant building safety concerns in the region.
Table 2.
Parameter threshold for building safety risk evaluation according to [47].
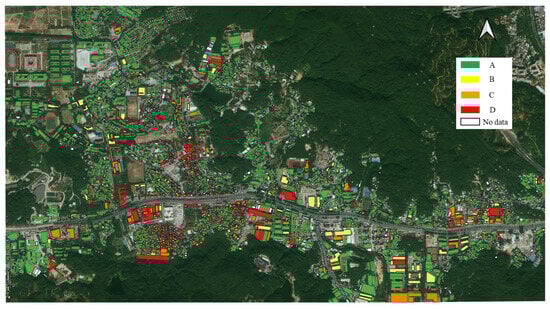
Figure 8.
Building risk assessment for Kemulang Village.
4.2. Effects of Resource Consumption Agglomeration on Ground Subsidence
As described in Section 2.1, Kemulang Village is known for its concentrated underground mineral water resources in Guangzhou, where locals have the habit of drilling wells for water. According to statistics, up to 64% of households in the area primarily rely on underground extraction for their water supply. With the continuous growth of population and buildings expanding, water consumption in the area has increased significantly. Figure 9 illustrates the tap water usage among local users obtained from Guangzhou Water Authority [48] through a public website: https://swj.gz.gov.cn/mssw/szy/szygb/index.html, accessed on 1 May 2025, showing a gradual rise since 2014. The growth accelerated notably after the completion of Metro Line 6 in 2016 and exhibited a sharp rise in 2021. It can be inferred that a similar increasing trend likely occurred in groundwater extraction during the same period.
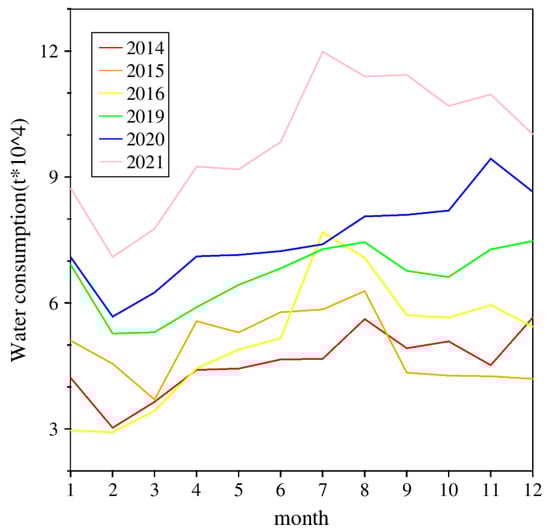
Figure 9.
Monthly statistics of tap water consumption in Kemulang Village.
We also collected groundwater level data from two monitoring points W1 and W2 (the data are shown in Figure 10, the locations are shown in Figure 3). As illustrated in the figure, the groundwater level continued to decline during the monitoring period, even falling below 25 m in 2022. The rate of decline accelerated in early 2021. The trend of groundwater level change is generally consistent with the subsidence observed at nearby locations. Thus, we can conclude that the continuous decline in groundwater levels is a direct cause of subsidence in this region.
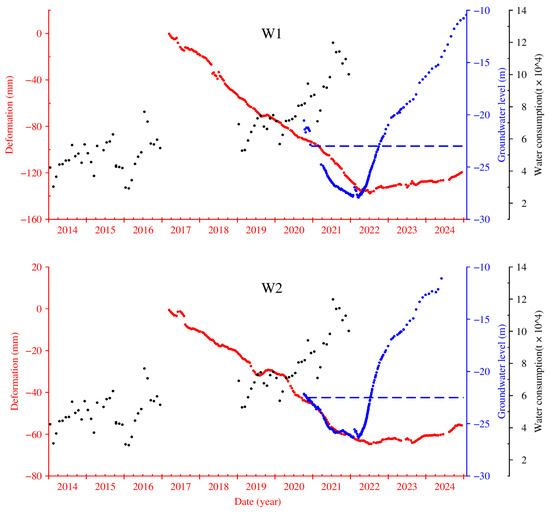
Figure 10.
Groundwater level time series vs. time-series deformation for the nearby well station. Red points show the deformation time series and blue points show the groundwater level change. Blue dashed lines show the corresponding groundwater level when its decline started to accelerate and black dots indicate the tap water consumption in Kemulang Village, as shown also in Figure 9.
The continuous decline in groundwater levels can be attributed to two factors. On one hand, with the ongoing construction and development of Kemulang Village, large areas of natural surface have been hardened, and the implementation of drainage infrastructure has enhanced regional drainage capacity. These changes have led to a persistent increase in impervious surfaces within the area, resulting in reduced rainfall infiltration and a consequent decrease in groundwater recharge [49,50]. On the other hand, population growth has intensified water demand, leading to widespread unauthorized extraction of groundwater and the construction of numerous water storage tanks (as shown in Figure 11). Some well depths have increased progressively to nearly 100 meters, which accelerates the decline in groundwater levels in the area. Furthermore, the influence of rainfall on groundwater level changes is extensive. Under identical precipitation conditions between 2019 and 2021, monitoring results from areas outside the study region showed no significant fluctuations in groundwater levels, indicating that rainfall variation does not serve as the triggering factor for the notable decline in groundwater levels within the study area. This finding further underscores the impact of the aforementioned human activities.
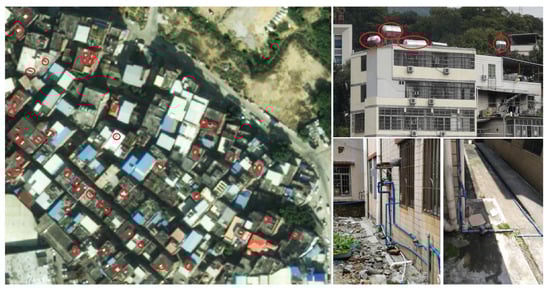
Figure 11.
Unauthorized extraction and storage of groundwater in Kemulang Village. The red circle in the figure represents the water storage tank.
In 2022, serious ground subsidence in the area began to threaten the safe operation of the metro line. In response, relevant government authorities prohibited groundwater extraction activities and expanded the tap water supply infrastructure. Consequently, the groundwater level recovered rapidly and resulted in the cessation and even uplift of ground subsidence (shown in Figure 10). These findings confirm that unauthorized groundwater extraction was the primary cause of subsidence in the region [51]. However, we note that the relationship between water level recovery and surface uplift was non-linear, indicating that groundwater pumping has caused irreversible damage to the local strata [52,53].
4.3. Analysis of Regional Geological Strata on Ground Subsidence
To further investigate the fundamental causes and influencing processes of land subsidence, this study collected 22 geological borehole data within the Kemulang subsidence funnel and constructed a geological stratigraphic profile along the metro line. Figure 12 shows that the regional strata can be classified into plastic layer (including fill, mire, sandy soil and silty clay), stiff layer (sandy clay) and weathered layer (strongly weathered granite or completely weathered granite). Thick layers of strongly/completely weathered granite strata are prevalent within the main subsidence area, characterized by a high void ratio and significant compressibility. In contrast, the eastern part of the Kemulang funnel contains a thick layer of hard sandy clay, which offers strong support and is difficult to be compressed [54]. This geological condition aligns well with the observed spatial distribution pattern of the subsidence.
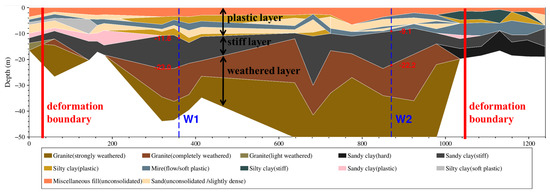
Figure 12.
Geological stratigraphic profile of Kemulang funnel. Red line shows the deformation boundary. Blue line shows the stratigraphic thickness data at the locations of two groundwater monitoring stations W1 and W2.
To understand the temporal evolution of the subsidence and particularly the accelerated subsidence in 2021, we extracted stratigraphic thickness data at the locations of two groundwater monitoring stations. The data show that the top depths of the weathered layer at these two locations are –23 meters and –22.2 meters, respectively. Meanwhile, according to Figure 10, when accelerated subsidence occurred in 2021, the groundwater level had also dropped to approximately –23 meters. Hence, we infer that the accelerated subsidence primarily resulted from the groundwater level dropping to the weathered layer. This decline led to an increase in soil porosity and reduction in pore water pressure for the weathered layer [55,56]. Weathered granite was re-compacted and contributed to further subsidence.
5. Conclusions
The metro system is an important carrier of urban transportation, with annual passenger volume exceeding 30 billion in China. Ensuring the safety of the metro system is extremely important. Ground subsidence can occur during both the construction and operational periods of metro systems. Construction-induced subsidence, induced by activities such as shield tunneling, tends to be more concentrated in time and space, greater in magnitude and more widespread, and thus receives greater attention. In contrast, operational-period subsidence is often scattered and has typically been addressed as isolated or incidental cases. However, metro systems not only have physical attributes but also have social dimensions. The commencement of metro operations often leads to the agglomeration of social elements, including population concentration, commercial clustering and intensified building construction, which in turn drives increased resource consumption. In this study, we take Kemulang Station on Guangzhou Metro Line 6 as a case study. By using multiplatform SAR images, we conducted an eight-year subsidence monitoring after the commencement of operations. Two subsidence funnels in the area were found in our results. Through comparisons with leveling measurements at four monitoring points, the monitoring accuracy is 2.4 mm.
In addition, this study collected optical images and some survey data. These data were used to extract information on building changes, population changes and water resource consumption. Through correlation analysis and quantitative research between the subsidence time series and changes in social agglomeration factors, it was found that extensive unauthorized groundwater extraction triggered by population agglomeration was the main reason of subsidence in the area. Additionally, increased surface loading due to building concentration and reduced groundwater recharge caused by surface hardening also contributed to the ground subsidence. Moreover, to investigate the accelerated subsidence observed after March 2021, this study collected 22 geological borehole records and constructed a regional stratigraphic profile. We can find that there are thick weathered strata within the subsidence zone. The decline in groundwater levels into this weathered layer led to dehydration and compression of soil, which is identified as the fundamental reason for the accelerated subsidence in the region.
This study demonstrates that the social agglomeration effects induced by metro operations can lead to more complex ground disturbances over a long time, thereby causing more continuous ground subsidence and a more covert safety threat for subway operation. The findings of this research are expected to provide valuable insights for metro site selection and subsidence hazards prevention for subway stations.
Author Contributions
Conceptualization, Y.L., Z.L. and J.H.; methodology, J.H., Y.L. and Z.L.; software, J.H. and C.S.; validation, X.M., X.Z. and G.L.; data curation, J.H.; writing—original draft preparation, J.H., X.Z., G.L. and C.S.; writing—review and editing, Y.L., Z.L., J.H., X.Z., G.L., C.S. and Y.D. All authors have read and agreed to the published version of the manuscript.
Funding
This research was funded partly by the Collaborative Innovation Center for Natural Resources Planning and Marine Technology of Guangzhou, grant number 2023B04J0301, 2025B04T0035; partly by the Joint Project of Municipal-University (Academy)-Enterprise of the Basic Research Program in Guangzhou under Grant 2025A03J3102.
Institutional Review Board Statement
Not applicable.
Informed Consent Statement
Not applicable.
Data Availability Statement
Some SAR datasets (such as Sentinel-1, TerraSAR-X, LuTan-1) were used in our paper. Sentinel-1 data were obtained freely from ESA and can be derived from the web: https://search.asf.alaska.edu/, accessed on 1 May 2025. TerraSAR-X data were obtained from Deutsches Zentrum für Luft- und Raumfahrt (DLR) and are available from Jingxin Hou with the permission of DLR. LuTan-1 data were obtained from Land Satellite Remote Sensing Application Center, MNR and are available from Jingxin Hou with the permission of Land Satellite Remote Sensing Application Center, MNR.
Acknowledgments
We would like to thank the ESA for supplying the Sentinel-1 data, the DLR for TerraSAR-X data and Land Satellite Remote Sensing Application Center, MNR for LuTan-1 data. We also give many thanks for the support of Academic Specialty Group for Urban Sensing in Chinese Society of Urban Planning.
Conflicts of Interest
Author Jingxin Hou, Yang Liu, Xiao Zhang, Guochao Liu and Chunshuai Si were employed by the company Guangzhou Urban Planning & Design Survey Research Institute Co., Ltd. Author Xing Min was employed by the company Guangzhou Metro Design & Research Institute Co., Ltd. The remaining authors declare that the research was conducted in the absence of any commercial or financial relationships that could be construed as a potential conflict of interest.
References
- China Association of Metros. Statistical Analysis Report on Urban Rail Transit (2024). 2025. Available online: https://www.camet.org.cn/xytj/tjxx/660844283682885.shtml (accessed on 1 May 2025).
- Wang, S.; Chen, Z.; Zhang, G.; Xu, Z.; Liu, Y.; Yuan, Y. Overview and Analysis of Ground Subsidence along China’s Urban Subway Network Based on Synthetic Aperture Radar Interferometry. Remote Sens. 2024, 16, 1548. [Google Scholar] [CrossRef]
- Wang, Y.; Feng, G.; Li, Z.; Luo, S.; Wang, H.; Xiong, Z.; Zhu, J.; Hu, J. A Strategy for Variable-Scale InSAR Deformation Monitoring in a Wide Area: A Case Study in the Turpan–Hami Basin, China. Remote Sens. 2022, 14, 3832. [Google Scholar] [CrossRef]
- Zhu, J.; LI, Z.; Hu, J. Research Progress and Methods of InSAR for Deformation Monitoring. Acta Geod. Cartogr. Sin. 2017, 46, 1717–1733. [Google Scholar] [CrossRef]
- Potin, P.; Rosich, B.; Grimont, P.; Miranda, N.; Shurmer, I.; O’Connell, A.; Torres, R.; Krassenburg, M. Sentinel-1 mission status. In Proceedings of the Proceedings of EUSAR 2016: 11th European Conference on Synthetic Aperture Radar, Hamburg, Germany, 6–9 June 2016; pp. 1–6. [Google Scholar]
- Geudtner, D.; Torres, R.; Snoeij, P.; Davidson, M. Sentinel-1 System Overview. In Proceedings of the Fringe, Frascati, Italy, 19–23 September 2011. [Google Scholar]
- Zhang, J.; Ke, C.; Shen, X.; Lin, J.; Wang, R. Monitoring Land Subsidence along the Subways in Shanghai on the Basis of Time-Series InSAR. Remote Sens. 2023, 15, 908. [Google Scholar] [CrossRef]
- Yang, M.; Wang, R.; Li, M.; Liao, M. A PSI targets characterization approach to interpreting surface displacement signals: A case study of the Shanghai metro tunnels. Remote Sens. Environ. 2022, 280, 113150. [Google Scholar] [CrossRef]
- Huang, C.; Tan, L.; Liu, J.; Yan, K. Multi-Temporal-InSAR Ground Deformation Mapping of Beijing Subway Network Based on ALOS-2 and Sentinel-1 Data. Pol. J. Environ. Stud. 2024. [Google Scholar] [CrossRef]
- Ge, D.; Zhang, L.; Li, M.; Liu, B.; Wang, Y. Beijing subway tunnelings and high-speed railway subsidence monitoring with PSInSAR and TerraSAR-X data. In Proceedings of the 2016 IEEE International Geoscience and Remote Sensing Symposium (IGARSS), Beijing, China, 10–15 July 2016; pp. 6883–6886. [Google Scholar]
- Wang, H.; Feng, G.; Xu, B.; Yu, Y.; Li, Z.; Du, Y.; Zhu, J. Deriving Spatio-Temporal Development of Ground Subsidence Due to Subway Construction and Operation in Delta Regions with PS-InSAR Data: A Case Study in Guangzhou, China. Remote Sens. 2017, 9, 1004. [Google Scholar] [CrossRef]
- Fadhillah, M.F.; Achmad, A.R.; Lee, C.-W. Integration of InSAR Time-Series Data and GIS to Assess Land Subsidence along Subway Lines in the Seoul Metropolitan Area, South Korea. Remote Sens. 2020, 12, 3505. [Google Scholar] [CrossRef]
- Gheorghe, M.; Armaș, I.; Dumitru, P.; Călin, A.; Bădescu, O.; Necsoiu, M. Monitoring subway construction using Sentinel-1 data: A case study in Bucharest, Romania. Int. J. Remote Sens. 2019, 41, 2644–2663. [Google Scholar] [CrossRef]
- Younesi Sienaki, A.; Akhoondzadeh Hanzaei, M. Monitoring of urban subway lines subsidence Using satellite radar interferometry method (Study area: Part of Tehran Metro Line 7). J. Geomat. Sci. Technol. 2023, 12, 16–29. [Google Scholar] [CrossRef]
- Espiritu, K.W.; Reyes, C.J.; Benitez, T.M.; Tokita, R.C.; Galvez, L.J.; Ramirez, R. Sentinel-1 Interferometric Synthetic Aperture Radar (InSAR) reveals continued ground deformation in and around Metro Manila, Philippines, associated with groundwater exploitation. Nat. Hazards 2022, 114, 3139–3161. [Google Scholar] [CrossRef]
- Wang, X.; Wang, M.; Jiang, R.; Xu, J.; Li, B.; Wang, X.; Yu, J.; Su, P.; Liu, C.; Yang, Q.; et al. Structural deformation monitoring during tunnel construction: A review. J. Civ. Struct. Health Monit. 2023, 14, 591–613. [Google Scholar] [CrossRef]
- Saraswat, A.; Tsai, Y.-L.S.; Chen, F.-C.; Han, J.-Y. 3D deformation analysis in a metropolitan area during ongoing subway construction using time series InSAR. Tunn. Undergr. Space Technol. 2025, 155, 106190. [Google Scholar] [CrossRef]
- Wu, S.; Zhang, B.; Liang, H.; Wang, C.; Ding, X.; Zhang, L. Detecting the Deformation Anomalies Induced by Underground Construction Using Multiplatform MT-InSAR: A Case Study in To Kwa Wan Station, Hong Kong. IEEE J. Sel. Top. Appl. Earth Obs. Remote Sens. 2021, 14, 9803–9814. [Google Scholar] [CrossRef]
- Pradhan, B.; Abokharima, M.H.; Jebur, M.N.; Tehrany, M.S. Land subsidence susceptibility mapping at Kinta Valley (Malaysia) using the evidential belief function model in GIS. Nat. Hazards 2014, 73, 1019–1042. [Google Scholar] [CrossRef]
- Abdollahi, S.; Pourghasemi, H.R.; Ghanbarian, G.A.; Safaeian, R. Prioritization of effective factors in the occurrence of land subsidence and its susceptibility mapping using an SVM model and their different kernel functions. Bull. Eng. Geol. Environ. 2019, 78, 4017–4034. [Google Scholar] [CrossRef]
- Davies, G.W. The Effect of a Subway on the Spatial Distribution of Population. J. Transp. Econ. Policy 1976, 10, 126–136. [Google Scholar]
- Calvo, F.; de Oña, J.; Arán, F. Impact of the Madrid subway on population settlement and land use. Land Use Policy 2013, 31, 627–639. [Google Scholar] [CrossRef]
- Housing Construction and Landscape Bureau of Tianhe District. Available online: https://www.thnet.gov.cn/thdt/tzgg/qtgg/content/post_6469073.html (accessed on 1 May 2025).
- Zhu, W.; Zhang, H.; Mi, J.; Huang, C.; Chen, J.; Hu, Y. Research on the Causes and Prevention of Subsidence of Operating Subway in the Granite Weathering Trough Section. Subgrade Eng. 2024, 22–29. [Google Scholar] [CrossRef]
- Crosetto, M.; Monserrat, O.; Cuevas-González, M.; Devanthéry, N.; Crippa, B. Persistent Scatterer Interferometry: A review. ISPRS J. Photogramm. Remote Sens. 2016, 115, 78–89. [Google Scholar] [CrossRef]
- Hou, J.; Xu, B.; Li, Z.; Zhu, Y.; Feng, G. Block PS-InSAR ground deformation estimation for large-scale areas based on network adjustment. J. Geod. 2021, 95, 111. [Google Scholar] [CrossRef]
- Ferretti, A.; Prati, C.; Rocca, F. Permanent scatterers in SAR interferometry. IEEE Trans. Geosci. Remote Sens. 2001, 39, 8–20. [Google Scholar] [CrossRef]
- Ferretti, A.; Prati, C.; Rocca, F. Nonlinear subsidence rate estimation using permanent scatterers in differential SAR interferometry. IEEE Trans. Geosci. Remote Sens. 2000, 38, 2202–2212. [Google Scholar] [CrossRef]
- Whalen, C.T. Control Leveling; US Department of Commerce, National Oceanic and Atmospheric Administration: Silver Spring, MD, USA, 1978; Volume 73.
- Luo, X.; Liu, G.; Huang, D. A new approach to accurately estimate deformation in PS-DInSAR: Solution-space search. In Proceedings of the International Symposium on Lidar and Radar Mapping 2011: Technologies and Applications, Nanjing, China, 26–29 May 2011; pp. 99–106. [Google Scholar]
- Li, T.; Tang, X.; Zhou, X.; Zhang, X.; Li, S.; Gao, X. Deformation Products Of Lutan-1(Lt-1) Sar Satellite Constellation for Geohazard Monitoring. In Proceedings of the IGARSS 2022–2022 IEEE International Geoscience and Remote Sensing Symposium, Kuala Lumpur, Malaysia, 17–22 July 2022; pp. 7543–7546. [Google Scholar]
- Tang, X.; Li, T.; Chen, J.; Wei, C.; Zhang, X.; Liu, Y.; Liu, D.; Zhang, X.; Zhou, X.; Lu, J.; et al. Twin-Satellite Constellation Design and Realization for Terrain Mapping and Deformation Monitoring: LuTan-1. IEEE Trans. Geosci. Remote Sens. 2025, 63, 5214014. [Google Scholar] [CrossRef]
- Wang, R.; Liu, K.; Cai, Y.; Liang, D.; Yu, W.; Liu, D.; Chen, Y.; Yang, Q.; Li, J.; Liu, L. LuTan-1: An Innovative L-band Spaceborne Bistatic Interferometric SAR Mission. In Proceedings of the EUSAR 2024; 15th European Conference on Synthetic Aperture Radar, Munich, Germany, 23–26 April 2024; pp. 984–988. [Google Scholar]
- Li, T.; Tang, X.; Zhang, X.; Lu, J.; Zhang, X. Current Status and Prospects of the LuTan-1 Mission. In Proceedings of the 2024 IEEE International Conference on Signal, Information and Data Processing (ICSIDP), Zhuhai, China, 22–24 November 2024; pp. 1–4. [Google Scholar]
- Hu, J.; Ding, X.L.; Li, Z.W.; Zhang, L.; Zhu, J.; Sun, Q.; Gao, G. Vertical and horizontal displacements of Los Angeles from InSAR and GPS time series analysis: Resolving tectonic and anthropogenic motions. J. Geodyn. 2016, 99, 27–38. [Google Scholar] [CrossRef]
- Zheng, W.; Hu, J.; Lu, Z.; Hu, X.; Sun, Q.; Liu, J.; Huang, B. Enhancing 4-D landslide monitoring and block interaction analysis with a Novel Kalman-filter-based InSAR approach. J. Geophys. Res. Earth Surf. 2024, 129, e2024JF007923. [Google Scholar] [CrossRef]
- Han, D.; Attipoe, S.G.; Han, D.; Cao, J. Does transportation infrastructure construction promote population agglomeration? Evidence from 1838 Chinese county-level administrative units. Cities 2023, 140, 104409. [Google Scholar] [CrossRef]
- Chatman, D.G.; Noland, R.B. Do Public Transport Improvements Increase Agglomeration Economies? A Review of Literature and an Agenda for Research. Transp. Rev. 2011, 31, 725–742. [Google Scholar] [CrossRef]
- Zhao, M.; Liu, S.; Qi, W. Exploring the differential impacts of urban transit system on the spatial distribution of local and floating population in Beijing. J. Geogr. Sci. 2017, 27, 731–751. [Google Scholar] [CrossRef]
- Jin, J.; Kim, D. Expansion of the subway network and spatial distribution of population and employment in the Seoul metropolitan area. Urban Stud. 2018, 55, 2499–2521. [Google Scholar] [CrossRef]
- Li, J.; Huang, X.; Tu, L.; Zhang, T.; Wang, L. A review of building detection from very high resolution optical remote sensing images. GIScience Remote Sens. 2022, 59, 1199–1225. [Google Scholar] [CrossRef]
- Lv, Z.; Liu, T.; Benediktsson, J.A.; Falco, N. Land Cover Change Detection Techniques: Very-high-resolution optical images: A review. IEEE Geosci. Remote Sens. Mag. 2022, 10, 44–63. [Google Scholar] [CrossRef]
- Huang, W.; Yang, M.; Zhao, Z.; Liu, C.; Zhao, F.; Liu, R. Satellite-Based InSAR Data-Driven Urban Building Stability Assessment: A Case Study of Kunming City. Geomat. Inf. Sci. Wuhan Univ. 2025, 50, 1669–1681. [Google Scholar] [CrossRef]
- Ma, P.; Zheng, Y.; Zhang, Z.; Wu, Z.; Yu, C. Building risk monitoring and prediction using integrated multi-temporal InSAR and numerical modeling techniques. Int. J. Appl. Earth Obs. Geoinf. 2022, 114, 103076. [Google Scholar] [CrossRef]
- Yang, K.; Yan, L.; Huang, G.; Chen, C.; Wu, Z. Monitoring building deformation with InSAR: Experiments and validation. Sensors 2016, 16, 2182. [Google Scholar] [CrossRef] [PubMed]
- Xu, Y.; Wu, Z.; Zhang, H.; Liu, J.; Jing, Z. Land subsidence monitoring and building risk assessment using InSAR and machine learning in a Loess Plateau City—A case study of Lanzhou, China. Remote Sens. 2023, 15, 2851. [Google Scholar] [CrossRef]
- JGJ 125-2016; Standard for Dangerous Building Appraisal. Ministry of Housing and Urban-Rural Development of the People’s Republic of China: Beijing, China, 2016.
- Guangzhou Water Authority. Available online: https://swj.gz.gov.cn/mssw/szy/szygb/index.html (accessed on 1 May 2025).
- Sharp, J.M. The impacts of urbanization on groundwater systems and recharge. AQUA Mundi 2010, 2719. [Google Scholar] [CrossRef]
- Han, D.; Currell, M.J.; Cao, G.; Hall, B. Alterations to groundwater recharge due to anthropogenic landscape change. J. Hydrol. 2017, 554, 545–557. [Google Scholar] [CrossRef]
- Galloway, D.L.; Burbey, T.J. Regional land subsidence accompanying groundwater extraction. Hydrogeol. J. 2011, 19, 1459–1486. [Google Scholar] [CrossRef]
- Tu, X.; Jian, B.; Wang, S.; Bian, H.; Wang, J.; Li, S. Swelling behavior induced by alteration in granite and its implications on underground excavation. Tunn. Undergr. Space Technol. 2005, 20, 378–389. [Google Scholar] [CrossRef]
- Zhang, X.; Cheng, Z.; Xu, B.; Gui, R.; Hu, J.; Yang, C.; Yang, Q.; Xiong, T. Coupling the relationship between land subsidence and groundwater level, ground fissures in Xi’an city using multi-orbit and multi-temporal InSAR. Remote Sens. 2023, 15, 3567. [Google Scholar] [CrossRef]
- Revil, A.; Grauls, D.; Brévart, O. Mechanical compaction of sand/clay mixtures. J. Geophys. Res. Solid Earth 2002, 107, ECV 11-1–ECV 11-15. [Google Scholar] [CrossRef]
- López-Fernández, C.; Prieto, D.A.; Fernández-Viejo, G.; Pando, L.; Fernández, E.C. Surface subsidence induced by groundwater drainage tunneling in granite residual soils (Burata Railway Tunnel, Spain). J. Geotech. Geoenviron. Eng. 2013, 139, 821–824. [Google Scholar] [CrossRef]
- Jia, R.; Shan, Y.; Yang, K.; Wang, Y.; Hu, Z.; Li, Y.; Cui, J. Effect of suffosion on deterioration of weathered granite soil: A multi-scale study from macroscopic to microscopic investigations. Acta Geotech. 2025, 20, 4213–4229. [Google Scholar] [CrossRef]


Disclaimer/Publisher’s Note: The statements, opinions and data contained in all publications are solely those of the individual author(s) and contributor(s) and not of MDPI and/or the editor(s). MDPI and/or the editor(s) disclaim responsibility for any injury to people or property resulting from any ideas, methods, instructions or products referred to in the content. |
© 2025 by the authors. Licensee MDPI, Basel, Switzerland. This article is an open access article distributed under the terms and conditions of the Creative Commons Attribution (CC BY) license (https://creativecommons.org/licenses/by/4.0/).