Abstract
The existing research on open-set recognition (OSR) and novel class discovery (NCD) has largely treated these tasks as independent fields. OSR aims to identify samples that do not belong to the training set classes, while NCD seeks to further classify such unseen, unlabeled samples into novel classes. However, there is a lack of a unified framework to automate both tasks systematically. In this paper, we propose a unified training framework to identify and categorize unseen samples. Specifically, we conduct a comprehensive evaluation of existing post hoc OSR methods and observe that their performance is highly sensitive to the temperature scaling factor. To address this, we introduce a distance-based evaluation method for OSR, which not only outperforms existing post hoc approaches but also integrates seamlessly with them to deliver enhanced performance. Furthermore, we developed a prototype-based classification head leveraging this distance metric, which facilitates compact feature representations for known classes and guides the clustering of unknown classes, thereby significantly enhancing the classification accuracy for novel classes. On the CUB-200-2011 dataset, our unified framework achieves a 0.95–6.12% improvement in AUROC scores on OSR benchmarks and a 3.19% increase in classification accuracy for novel classes. Extensive experiments and visualizations validate the effectiveness of the proposed approach. We believe that this unified framework will pave the way for automating the integration of OSR and NCD, offering a more efficient and systematic approach to addressing these tasks.
1. Introduction
In recent years, with the significant enhancement of computing power and the scale of AI models, we have witnessed tremendous success in AI technologies, particularly those based on deep learning, within both academia and industry [1]. In the field of computer vision, deep learning models have significantly surpassed human-level performance in areas such as facial recognition [2], object detection [3], and fine-grained image retrieval [4]. In natural language processing, large models have achieved a proficiency level in processing and generating general text data comparable to that of human assistants. However, most of these studies have been conducted under the assumption of closed-world learning, where the test and training sets are assumed to follow the same distribution. As AI application scenarios diversify, the complexity and uncertainty of open environments pose severe challenges to the safety and trustworthiness of AI, revealing the limitations and risks of current AI technologies in this regard [5].
Some studies summarize open-world machine learning as addressing the distribution shift between the test set and the training set to handle data closer to real-world scenarios. Enhancing the performance of deep learning models in processing uncertain data in open environments is one of the fundamental approaches to achieving safe and trustworthy artificial intelligence [6]. The ever-growing need for machine learning systems to operate in open-world scenarios has spurred significant research in open-set recognition (OSR) and novel class discovery (NCD). These tasks address two critical challenges in the open-world: recognizing samples that do not belong to any of the known training classes and clustering such unseen samples into new, meaningful classes.
OSR aims to classify known class samples in the test set while identifying unknown class samples. This capability supports robust classifiers in many real-world applications such as autonomous driving, medical diagnostics, and security surveillance. One of the main challenges in recognizing unknown samples lies in the dominance of known class features, which often occupy the feature space intended for unknown classes, leading to confusion between the two. Additionally, OSR methods are usually sensitive to hyperparameters such as temperature scaling factors, leading to suboptimal performance. We provided the performance of score-based OSR methods on various datasets, as shown in Figure 1.
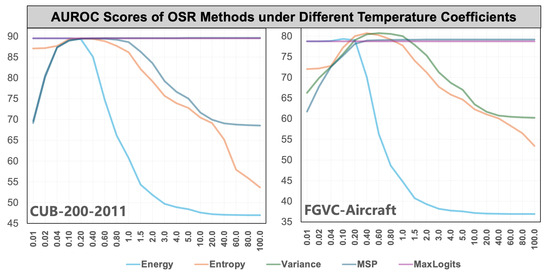
Figure 1.
AUROC scores of different OSR methods under varying temperature-scaling factors.
NCD seeks to utilize prior knowledge of known classes to guide the clustering and classification of unknown or unlabeled samples. This capability fosters the development of automated labeling and significantly reduces manual annotation costs. NCD methods typically depend on feature extraction from pre-trained models, which are not explicitly optimized for the clustering of novel classes or the relationship between known and unknown classes. Recent research [7] shows that while knowledge transfer through latent feature space has been successful, it does not adequately capture the associations between known and new classes. By visualizing the feature space of linear classifier heads, we observed a mismatch between the number of clusters and the actual number of classes. As shown in Figure 2, the Uniform Manifold Approximation and Projection (UMAP) for a 50-class aircraft reveals 42 clusters. We argue that such a mismatch resulted in smaller inter-class distances than intra-class distances, thereby negatively affecting pseudo-labels’ initialization and ultimately impacting the NCD performance. From a representation learning perspective, a linear classifier head essentially establishes class relationships in the semantic space. Dividing decision boundaries in the semantic space may result in a less compact feature space. This phenomenon is particularly pronounced in fine-grained datasets.
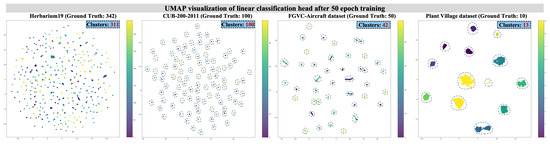
Figure 2.
UMAP visualization of four datasets in a known class training stage using a linear classification head. Although the clusters of known categories exhibit clear separation, there remains a noticeable discrepancy compared to the actual number of classes, which could pose potential risks in NCD tasks.
Despite the intertwined nature of these tasks, they have predominantly been studied in isolation, limiting the development of integrated approaches capable of addressing real-world requirements where these challenges coexist. The lack of unified frameworks forces practitioners to address OSR and NCD independently, increasing complexity and reducing efficiency in real-world applications. In some practical scenarios, such as autonomous inspection, medical diagnosis, and agricultural disease detection, intelligent systems must not only detect or reject unknown samples (as in OSR) but also categorize them into new, meaningful classes (as in NCD) to support adaptive learning and decision-making. Merging these two capabilities is essential for deploying robust AI models that can continuously evolve under dynamic data distributions, ensuring both reliability and discovery in open-world environments. This paper aims to establish a unified training framework and evaluation protocol for OSR and NCD to facilitate the classification of unknown samples.
Before unifying OSR and NCD, it is essential to highlight their similarities.
- i.
- OSR and NCD are both critical tasks in open-world machine learning, where the "open-world” assumption typically lies between completely closed and entirely open scenarios. Completely open scenarios assume the model may encounter an infinite number of unknown classes, which could be entirely unrelated or unpredictable. Such scenarios are highly challenging and nearly unsolvable with existing machine-learning methods. Furthermore, completely open scenarios may be impractical and nonsensical. For instance, a car classifier is unlikely to encounter an image of a bird.
- ii.
- Test datasets for evaluating OSR and NCD methods typically include both known and unknown classes, with the known and unknown classes being mutually exclusive. Known classes are often referred to as “in-distribution classes,” “normal classes,” or “labeled classes.” Conversely, unknown classes may be referred to as “out-of-distribution classes,” “abnormal classes,” or “unlabeled classes.” Despite differences in terminology across tasks, from a representation learning perspective, known classes generally represent the part of the dataset that follows the same independent and identically distributed (i.i.d.) assumptions as the training set.
- iii.
- Known and unknown classes in OSR and NCD tasks usually belong to different classes within the same target domain. In other words, there exists a categorical relationship between known and unknown classes. For example, in the CUB-200-2011 dataset, both known and unknown classes fall under the domain of birds. In contrast, asking a bird classifier to distinguish classes within aircraft is clearly unreasonable and impractical. However, such scenarios might be meaningful in specific applications, such as out-of-distribution detection [8].
By highlighting these similarities and understanding the limitations of current approaches, this paper seeks to integrate the tasks of OSR and NCD into a unified framework. Our proposed methodology not only addresses the individual challenges posed by these tasks but also leverages their interconnected nature to achieve improved performance and practical applicability in open-world scenarios. Our main contributions are as follows:
- Distance-based evaluation for OSR: We propose a robust distance-based score that mitigates the sensitivity of existing OSR methods to hyperparameter tuning, enhancing the detection of unknown samples. This metric is also utilized within our prototype-based classification head to improve feature representations.
- Prototype-based classification head: Based on the score in the previous stage, we design a prototype-based classification head to facilitate compact and discriminative feature representations for known classes. These compact representations enable a better clustering of unknown samples, enhancing NCD accuracy.
- Unified training pipeline: Our framework combines OSR and NCD into a systematic pipeline, automating the identification and categorization of unseen samples. This approach reduces manual intervention and hyperparameter dependency, making it more efficient.
- Extensive experimental validation: Our framework achieves notable performance gains on benchmark datasets, including a 4.85% AUROC improvement and a 3.19% boost in novel class accuracy on CUB-200-2011 for OSR tasks.
2. Related Works
2.1. OSR Methods Based on Discriminative Representation Scores
A widely adopted class of open set recognition (OSR) methods relies on discriminative representation scores to identify unknown samples. These approaches [9,10,11,12] typically exploit the output confidence or feature distribution learned via deep neural networks, without modifying the training procedure or introducing generative models. One of the simplest and most commonly used baselines is the maximum softmax probability (MSP) method, which assumes that samples with lower softmax scores are more likely to be unknown [9]. Hendrycks and Gimpel [9] also propose estimating the uncertainty of predictions by computing the information entropy of the softmax output. Building upon these ideas, ODIN enhances the separation between known and unknown samples by incorporating temperature scaling and input perturbation during inference [10]. However, later work [12] argues that softmax-based confidence scores tend to produce overconfident posterior probabilities for out-of-distribution (OOD) data. To mitigate this issue, they advocate for the use of maximum logits as a more reliable indicator for OOD detection. Subsequently, energy-based methods were introduced, leveraging the log-sum-exp of logits to compute an energy score [11], which serves as a theoretically grounded and empirically validated confidence metric for OSR.
Beyond raw score computation, recent studies have explored improving the structure of the feature space to enhance the reliability of score-based methods. For example, class anchor clustering (CAC) introduces a class-wise clustering regularization in logit space to enforce intra-class compactness and maximize the margin between known and unknown samples [13]. Orientational Distribution Learning (ODL) further refines the feature distribution by regularizing both feature direction and spread, thereby increasing the open-set separability without relying on auxiliary data or external modules [14]. Despite their simplicity and flexibility, score-based methods face several limitations. Notably, when unknown samples are semantically similar to known classes, such methods often yield overconfident predictions, resulting in high false positive rates. Moreover, we observe that certain score-based approaches—such as MSP and energy-based methods—are highly sensitive to hyperparameters like temperature scaling. As a result, developing OSR techniques that are robust to such hyperparameter variations remains a promising and important research direction.
Our study adheres to the strict definition of the OSR problem, in which no samples from unknown classes are available during training, and the test set contains a mixture of both known and unknown class samples.
2.2. Novel Class Discovery
The task of NCD was originally formulated under a two-stage training framework. In the first stage, the model is trained solely on labeled data from known categories. In the second stage, it is further fine-tuned using only the unlabeled data from unknown categories. Based on this setting, Hsu et al. [15] introduced the problem of transferring clustering models across tasks, which aligns with the objective of NCD. A central challenge in NCD lies in the absence of ground-truth labels for the novel classes. To address this, a widely adopted strategy is to leverage the compact feature space learned from known classes to guide the clustering of unknown samples.
Han et al. [16] proposed a method to facilitate clustering of novel classes with support from known categories. Their approach proceeds in two phases: initially, a data embedding is learned from labeled data using metric learning techniques; subsequently, this embedding is fine-tuned while simultaneously optimizing cluster assignments on the unlabeled data. Notably, they also introduced an approach for estimating the number of classes present in the unlabeled dataset. This work is regarded as the first to formally define the NCD problem. Following this foundational formulation, numerous methods [7,17,18] have adopted the two-stage training paradigm proposed in [16]. Several studies [17,19] further demonstrate that contrastive learning [20,21] can significantly improve the clustering quality and overall performance in NCD tasks.
In response to the limitations of the two-stage design, single-stage approaches have been proposed to allow simultaneous training on both known and unknown categories. These methods aim to learn more generalizable representations through contrastive objectives and enable end-to-end optimization. For instance, neighborhood contrastive learning (NCL) [18] enhances clustering performance by integrating contrastive learning with neighbor mining, using informative positive and negative pairs, and introducing hard negative generation (HNG) to further refine feature learning. UNO [7] introduces a multi-view self-labeling strategy [22] to generate pseudo-labels for both known and unknown categories, followed by unified training using a cross-entropy loss, thereby removing the need for self-supervised pretraining.
Gu et al. [23] observed that the relationships between labeled and unlabeled categories are often underutilized during the discovery phase. To address this, they proposed a knowledge distillation framework that effectively transfers knowledge from known to unknown categories, demonstrating the significance of modeling class-level relations. Inspired by this insight, our work further investigates class relation modeling, aiming to enhance NCD through a prototype-based knowledge distillation mechanism.
Recent research has extended the scope of NCD to a variety of challenging scenarios, including generalized category discovery [24], object detection [25,26], semi-supervised learning [27,28], long-tailed recognition [29], continual learning [30], and ultra-fine-grained categorization [31]. While these advances significantly broaden the applicability of NCD, they often redefine the problem settings to suit specific domains. For example, several recent approaches assume an open-world scenario where novel classes continuously emerge and must be incrementally discovered and learned in a semi-supervised manner [28,30].
In contrast, our work adheres to the classical definition of NCD, where known and unknown categories are disjoint yet semantically related. Unlike methods that rely on incremental learning and continuous class arrival [30], our approach focuses on learning inter-class relationships using a prototype-guided knowledge distillation framework, without assuming dynamic class expansion. Moreover, in our proposed paradigm, unlabeled samples from novel classes must be automatically identified by the model during the testing phase, rather than assuming their availability in advance.
3. Methodology
3.1. Problem Statement
We address a unified open-world learning task that combines OSR and NCD, with three objectives: (1) classify known-class samples, (2) detect and reject unknown-class samples, and (3) categorize the rejected unknowns.
Formally, we are given a labeled training set, , from known classes and a test set, , containing both known-class samples, , and unknown-class samples, . The first stage focuses on identifying and separating unknowns. In the second stage, the model is trained on both and and evaluated on with the complete label space, .
As is unknown beforehand, the task also involves estimating the number of novel classes, posing additional challenges under realistic open-world conditions.
3.2. Unified Framework
An overview of the proposed unified framework is provided in Figure 3, which systematically integrates OSR and NCD into a coherent training pipeline. This unified system achieves three key objectives: (1) classification of known classes, (2) detection and capture of unknown samples, and (3) clustering and classification of the discovered unknown samples into novel classes.
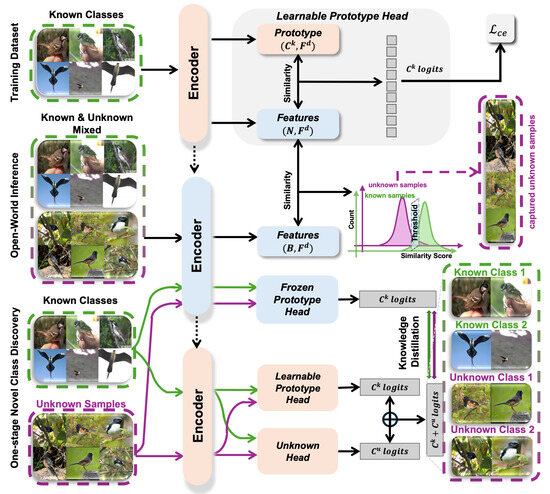
Figure 3.
Overview of the unified framework. All encoders across the three stages share parameters. Parameters are frozen only during the inference phase. In Stage 3, the student encoder continues training for novel class discovery, guided by the frozen checkpoint model from Stage 2 through knowledge distillation. The dashed arrows between encoders indicate parameter sharing and initialization. The peach-colored modules denote trainable components, while the light blue modules represent frozen or non-trainable components.
System Pipeline: The training and inference procedures unfold in three sequential stages:
Stage 1: Supervised Pre-Training with Known Classes. In this initial phase, the encoder is trained exclusively on a labeled dataset containing only known classes. The system employs a learnable prototype classification head, where each known class is represented by a prototype vector . The encoder maps input samples into a feature space, and the classification is conducted based on similarity to these prototypes. A cross-entropy loss () supervises the training to form robust class representations.
Stage 2: Open-World Inference and Unknown Sample Capture. Due to inherent uncertainties in open-world scenarios, during inference, the model is required to handle not only known classes but also unknown-class samples. To reject unknown samples during open-world inference, we evaluate the similarity between the test instance and previously seen training samples. Specifically, the similarity score is computed as follows: for N training samples from known classes, we retain their feature representations extracted in Stage 1, denoted as a matrix of shape , where is the feature dimension.
Given a test sample, , we extract its feature vector, , and compute cosine similarity with each of the N known training features. The maximum similarity value is then used as the final score to assess whether belongs to the known classes:
If falls below a predefined threshold, the sample is considered to originate from an unknown class and is subsequently rejected. To minimize the inclusion of known-class samples in the rejected pool, we set the similarity threshold to a relatively low value (e.g., 0.2). This conservative setting ensures that the rejected pool primarily contains truly unknown samples. To prevent contamination and preserve the integrity of Stage 3 training, the model is trained on this purified pool of unknown samples for novel class discovery.
Stage 3: One-Stage Novel Class Discovery. In this final stage, captured unknown samples are combined with known class data for joint training. The system employs a dual-headed structure: (1) a frozen prototype head (to preserve known-class knowledge), and (2) a learnable prototype head coupled with an additional unknown-class head. Both the teacher and student encoders share the same network architecture. During training, the parameters of the teacher encoder are fixed, providing stable guidance to the student encoder. The student encoder, initialized with shared parameters, continues training to adapt to novel categories while maintaining consistency with the frozen teacher model. Knowledge distillation is performed between the frozen and learnable heads, facilitating the discovery and classification of novel classes.
Prototype Classification Head: We introduce a prototype-based classification head to provide an interpretable and effective means of classification. Each prototype represents a known class in the feature space . The similarity between a sample, , and prototype is computed using cosine similarity:
where higher values of consistently indicate greater similarity, thus facilitating robust classification. The probabilities of a sample belonging to each prototype are computed through a softmax function, enabling optimization with the prototype-based cross-entropy loss:
Optimization via this loss encourages tight intra-class feature clusters around their prototypes, enhancing classification interpretability and discriminative power.
Knowledge Distillation Loss: To facilitate the effective transfer of semantic knowledge from known to unknown classes, the framework incorporates a knowledge distillation strategy. The pre-trained (teacher) model generates softened outputs for unlabeled samples:
where t is the temperature scaling factor, and superscripts T and S denote teacher and student models, respectively. The student model learns to replicate teacher predictions via the KL divergence:
A similar KL divergence term is computed for known classes (). The combined knowledge distillation loss is thus as follows:
where balancing the contribution of known and unknown class distillation. This effectively leverages knowledge of known classes to guide novel class discovery, preserving previous learning while enabling the system to adaptively learn novel categories. In this work, is set to a fixed value of 0.01 across all datasets.
3.3. Estimating the Number of Novel Classes
In open-world classification tasks, the number of unknown categories is typically not available in advance. Consequently, estimating the number of novel classes beforehand becomes a crucial step for effectively organizing and classifying unknown samples. After isolating the unknown-class subset , the optimal number of clusters can be estimated using the elbow method [32]. This technique identifies a turning point—known as the “elbow”—on the sum of squared errors (SSE) curve, where the rate of decrease in SSE significantly slows. SSE quantifies the compactness of clusters by measuring the squared distance between each data point and its assigned cluster centroid.
In this work, we explore three elbow-based strategies using K-means clustering to estimate the optimal number of clusters in . The Max Second Derivative method [33] determines the optimal point by locating the position on the SSE curve with the largest second derivative, corresponding to the greatest curvature where further increases in cluster number yield diminishing SSE improvements. The Max Distance method [34] selects the cluster count associated with the point that has the maximum distance from a straight line drawn between the start and end of the SSE curve. The Min Angle method [35] identifies the elbow by locating the smallest angle formed by three consecutive points on the SSE curve, which suggests a sudden reduction in SSE gain.
Beyond elbow-based methods, we also implement several classical techniques for estimating the optimal cluster count, which rely on internal clustering validation indices rather than SSE directly. The Silhouette Coefficient [36] evaluates clustering quality by measuring the balance between intra-cluster cohesion and inter-cluster separation, achieving its maximum when clusters are both dense and well separated. The Calinski–Harabasz Index [37] computes the ratio of between-cluster dispersion to within-cluster dispersion, with higher values indicating more distinct and compact clusters. Lastly, the Davies–Bouldin Index [38] calculates the average similarity between each cluster and its most similar one, and lower values imply better clustering structure characterized by low intra-cluster variance and high inter-cluster separation. Implementation details are provided in Appendix A.
4. Experiments
4.1. Implementation Details
In the first stage, we train all models for 50 epochs. Subsequently, we evaluate the model on and to assess its ability to classify known classes and to reject samples from unknown classes.
To categorize the unknown samples, we train the model for 100 epochs on the combined dataset , following a procedure similar to that of UNO [7]. We employ the SGD optimizer with a learning rate schedule that initially follows a linear warm-up and then decays following a cosine annealing schedule. The backbone network is initialized using the ViT-Base model pre-trained with dino-v2 [39].
Our implementation is based on PyTorch1.10.0 and can be efficiently executed on a single Nvidia RTX 4090 GPU (Santa Clara, CA, USA), demonstrating strong computational efficiency. To ensure a fair comparison, we apply identical training configurations across all re-implemented methods. All reported results in the tables are obtained using a fixed random seed of 2023, which aligns with the default setting used in the baseline method Cr-KD [23]. In practice, we also conducted additional experiments with different random seeds, and the minor variations observed did not affect the overall conclusions.
4.2. Datasets and Splits
We evaluate our framework on four fine-grained datasets covering birds, aircraft, plants, and leaf diseases to ensure domain-consistent open-world settings. Each dataset is split into disjoint known and unknown classes following prior work. The splits are designed to test the model’s ability to generalize across semantically related categories. Details of the datasets, class partitions, and download links are provided in Appendix B.
4.3. Evaluation Metrics
We evaluate known-class classification on using standard accuracy [40]. For unknown detection on , we report FPR@TPR95 [41] and AUROC [42], which assess the false positive rate at 95% TPR and the area under the ROC curve, respectively.
To evaluate clustering of unknown samples in and , we use Cluster Accuracy (ClusterAcc), defined as follows:
where P is the set of all label permutations, solved via the Hungarian algorithm [43].
We adopt both task-aware (separate known/unknown evaluation) and task-agnostic (mixed evaluation) protocols. The latter jointly evaluates classification (Accuracy) and discovery (ClusterAcc) without assuming prior knowledge of sample type, better reflecting real-world deployment.
4.4. Main Result
To comprehensively evaluate our framework, we report results from three perspectives: classification accuracy on known classes, performance under OSR conditions, and NCD ability. The report is based on the dino-v2 pre-training model.
4.4.1. Accuracy on Known Classes
As shown in Table 1, our prototype-based classification head achieves competitive or superior accuracy on all datasets compared to the linear classification head. For instance, on CUB-200-2011 and Herbarium19, we observe performance gains of and , respectively. This improvement stems from our prototype mechanism, which encourages intra-class compactness and inter-class separability in the learned feature space. On FGVC-Aircraft, performance is slightly lower (), potentially due to high inter-class visual similarity that may reduce the discriminative capacity of prototypes. Nonetheless, our method preserves the original performance on Plant Village (), indicating its stability in easier classification tasks.

Table 1.
Accuracy of known classes.
4.4.2. Open-Set Recognition Performance
Table 2 presents the OSR results evaluated by two standard metrics: the false positive rate at 95% true positive rate (FPR@95 ↓) and the area under the ROC curve (AUROC ↑). We analyze the results from three perspectives:
(1) Comparison with Original Baselines: Our method consistently outperforms the original confidence-based methods such as Energy, Entropy, MSP, and Max-Logits. For example, on the CUB-200-2011 dataset, Energy-based detection yields an AUROC of 82.37%, whereas our method improves it to 88.40% with a significantly lower FPR of 48.68%. A similar pattern is observed across other benchmarks, demonstrating that our similarity-aware strategy better distinguishes between known and unknown samples.
(2) Compatibility with Existing Methods: The gray-shaded rows in Table 2 represent the performance of original methods enhanced by integrating our approach. This integration boosts AUROC while reducing FPR@95. Notably, even strong baselines such as Energy and Max-logits benefit from this enhancement. For instance, on the Plant Village (T/C) setting, the original Energy method achieves an AUROC of 96.31% with an FPR@95 of 11.49%, which is significantly improved to 99.72% AUROC and only 0.90% FPR@95 when combined with our prototype-based rejection strategy.
(3) Temperature-Free Robustness: As illustrated in Figure 1, several existing OSR methods are highly sensitive to the temperature coefficient t and tend to achieve their best performance when . Table 2 reports OSR performance under a fixed temperature coefficient of , which is commonly considered optimal for these evaluated datasets. However, the optimal value of t often depends on various factors, such as network architecture, pretraining data, and implementation details. In contrast, our approach is inherently independent of temperature tuning. Our method consistently achieves higher AUROC and lower FPR@95 across all baseline methods. For example, on the Plant Village (T/D) benchmark, our method reaches an AUROC of 99.13%, outperforming all competing approaches. This robustness underscores the stability and practical generalizability of our framework in open-world scenarios.
In summary, our prototype-guided rejection framework not only improves standalone performance but also serves as a plug-in module to strengthen existing OSR techniques without introducing additional temperature-sensitive parameters.
Table 2.
Open-set recognition results. All results in the table are reported with the temperature coefficient .
Table 2.
Open-set recognition results. All results in the table are reported with the temperature coefficient .
| Dataset | FPR@95 ↓/AUROC ↑ (%) | |||||
|---|---|---|---|---|---|---|
| Known/Unknown | Energy | Entropy | Variance | MSP | Max-Logits | Ours |
| CUB-200-2011 | 57.66/82.37 | 50.85/87.58 | 54.52/87.32 | 55.12/87.21 | 55.32/83.55 | 48.68/88.40 |
| (100/100) | 48.75/88.49 | 48.62/88.53 | 48.58/88.58 | 48.58/88.53 | 48.65/88.49 | - |
| FGVC-Aircraft | 96.94/42.96 | 86.99/59.54 | 82.22/62.43 | 82.88/62.80 | 96.43/45.71 | 80.75/81.84 |
| (50/50) | 81.44/81.74 | 82.31/81.98 | 81.89/81.95 | 81.68/81.91 | 80.93/81.77 | - |
| Herbarium19 | 94.88/51.82 | 71.31/80.75 | 70.52/81.51 | 69.74/81.44 | 89.45/63.89 | 66.75/82.99 |
| (341/342) | 68.82/82.74 | 66.12/83.26 | 66.11/83.39 | 65.87/83.35 | 67.77/82.84 | - |
| Plant Village | 97.41/26.88 | 21.39/93.08 | 21.33/92.96 | 21.33/92.95 | 96.51/28.84 | 5.45/98.81 |
| (T/A) | 4.55/98.89 | 5.51/98.79 | 5.51/98.79 | 5.51/98.80 | 4.61/98.89 | - |
| Plant Village | 72.82/50.41 | 12.34/96.07 | 11.49/96.31 | 11.49/96.31 | 72.01/52.76 | 0.90/99.68 |
| (T/C) | 0.81/99.72 | 0.94/99.68 | 0.94/99.68 | 0.90/99.68 | 0.86/99.72 | - |
| Plant Village | 99.38/16.37 | 8.98/97.55 | 9.60/97.49 | 9.60/97.48 | 99.34/16.98 | 28.13/95.53 |
| (T/G) | 27.88/95.47 | 27.80/95.68 | 27.97/95.63 | 28.01/95.60 | 27.84/95.47 | - |
| Plant Village | 99.69/25.21 | 53.89/70.64 | 53.51/70.53 | 53.51/70.53 | 99.61/25.37 | 47.34/79.06 |
| (T/P) | 48.42/79.47 | 47.26/79.02 | 47.26/79.02 | 47.26/79.04 | 48.42/79.47 | - |
| Plant Village | 97.97/26.22 | 25.83/90.82 | 25.30/91.00 | 25.29/91.00 | 97.00/28.30 | 7.21/98.08 |
| (T/H) | 7.20/98.06 | 7.13/98.10 | 7.17/98.09 | 7.17/98.09 | 7.20/98.06 | - |
| Plant Village | 93.03/41.72 | 28.11/90.84 | 27.56/91.00 | 27.54/91.00 | 91.41/43.80 | 4.35/99.13 |
| (T/D) | 3.19/99.30 | 4.37/99.12 | 4.37/99.12 | 4.37/99.12 | 3.19/99.30 | - |
The gray color indicates the baseline method enhanced by our methods.
4.4.3. Novel Class Discovery Performance
Table 3 summarizes the performance of our method compared to two baselines—K-means and Cr-kd—across these fine-grained datasets under task-aware and task-agnostic settings.
Table 3.
Main results in novel class discovery task under task-aware and task-agnostic protocol.
Our method outperforms K-means and Cr-kd in both task-aware and task-agnostic settings. For example, on the CUB-200-2011 dataset, our approach achieves 83.38% task-aware novel accuracy and 83.02% task-agnostic novel accuracy, improving upon K-means (79.41%, 65.26%) and Cr-kd (79.48%, 79.83%). For labeled class classification, our method attains 88.71%, slightly surpassing Cr-kd (88.70%) and clearly outperforming K-means (86.86%). On the FGVC-Aircraft dataset, our method also maintains strong generalization to novel classes. It achieves 77.54% in task-aware novel accuracy and 76.70% in task-agnostic novel accuracy—both higher than K-means (70.01%, 57.60%) and Cr-kd (69.72%, 70.30%). This highlights our method’s ability to handle fine-grained object categories and complex inter-class similarity distributions.
Additionally, K-means shows simplicity and reasonable performance but often falls short compared to more sophisticated methods. For instance, in the Herbarium19 dataset, K-means achieves a task-aware novel class accuracy of and a task-agnostic novel class accuracy of , which are significantly lower than the results obtained by our method ( and , respectively). Moreover, Cr-kd utilizes knowledge distillation but does not perform as well as our approach in most scenarios. In the Plant Village (A) subset, for example, Cr-kd achieves a task-aware novel class accuracy of and a task-agnostic novel class accuracy of , while our method reaches and , respectively.
On the Plant Village dataset, which contains fewer categories, our method demonstrates more pronounced advantages. Specifically, in Plant Village (T/A) and Plant Village (T/C), our approach achieves over 90% accuracy in both task-aware and task-agnostic settings, while Cr-kd and K-means often fall below 70% in task-agnostic scenarios. The most notable improvement is observed in Plant Village (T/G) subset, where our method attains 99.59% task-aware and 99.48% task-agnostic novel class accuracies—significantly outperforming K-means (72.08%, 69.46%) and Cr-kd (89.11%, 88.98%). These results suggest that our framework is particularly effective when the number of classes is small but intra-class similarity is high, as the prototype-guided representation learning helps better preserve local decision boundaries.
Lastly, our method consistently demonstrates superior task-agnostic novel class accuracy. This metric is particularly important in real-world deployments, where task-specific boundaries are often unavailable. Our model reliably distinguishes between labeled and novel classes without prior knowledge of task structure, indicating strong generalization and open-world robustness.
In summary, our method outperforms existing baselines across nearly all evaluation settings, with particularly strong results in the task-agnostic scenario. By integrating prototype-based classification with distillation-guided representation learning, our framework completes the full loop of open-world learning—comprising classification, rejection, and discovery—thus offering a scalable and generalizable solution for real-world applications.
4.5. Ablation Study
Table 4 presents the ablation study conducted on the CUB-200-2011 dataset, illustrating the contribution of each module to the overall novel class discovery (NCD) performance. Three configurations are evaluated to isolate the effects of the unsupervised knowledge distillation loss and the prototype-based classifier.
Table 4.
The impact of different modules on NCD performance, evaluated on the CUB-200-2011 dataset.
The first row represents the baseline configuration that uses a linear classifier without . Although it achieves a strong pre-training accuracy of 94.95%, its task-agnostic novel accuracy remains relatively low at 73.45%, indicating limited generalization to unseen categories. When the unsupervised distillation loss is introduced, both task-aware and task-agnostic accuracies improve substantially—from 78.87% to 79.48% for task-aware novel accuracy and from 79.69% to 84.24% for overall task-agnostic accuracy. This demonstrates that transferring semantic information from known to unknown classes effectively enhances clustering consistency and model generalization.
Further improvement is observed when the prototype-based classifier is added. In this complete configuration, the model achieves the best overall performance, with 83.38% task-aware novel accuracy and 85.86% task-agnostic accuracy. The prototype structure enforces tighter intra-class compactness and clearer inter-class separation, facilitating more interpretable feature representations. Overall, the results confirm that both and the prototype-based head play complementary roles in improving robustness and fine-grained discrimination within the unified OSR–NCD framework.
4.6. Estimating the Number of Unknown Classes
In this section, we evaluate several unsupervised methods for estimating the number of novel classes across a variety of datasets, as shown in Table 5. Each method reports both the predicted value and the absolute error (in parentheses) relative to the ground truth. The evaluated methods include the following: Second Derivative, Maximum Distance, Minimum Angle, Silhouette Coefficient, Calinski–Harabasz Index, and Davies–Bouldin Index.
Table 5.
Result of estimating the number of novel classes.
Among these, the Maximum Distance method consistently demonstrates the most reliable performance across diverse settings. For example, on the CUB-200-2011 dataset with 100 novel classes, it estimates 96 with only four classes of error. It also achieves exact estimates for FGVC-Aircraft and Plant Village subsets, such as (G) and (C). Even in more complex datasets like Herbarium19, which contains 342 novel classes, it maintains an error below 10%, significantly outperforming the Minimum Angle method and clustering-based indices.
The Second Derivative method also performs well on simpler subsets such as Plant Village (A), (C), and (G), achieving either exact or near-exact estimates. However, its effectiveness diminishes on large-scale datasets, with the error increasing to 40 on Herbarium19. This indicates that, while curvature-based estimators can be effective in low-complexity scenarios, they tend to struggle with scalability.
In contrast, clustering index-based methods, including the Silhouette Coefficient, the Calinski–Harabasz Index, and the Davies–Bouldin Index, consistently show inferior accuracy, particularly in datasets with high intra-class variance or numerous categories. On Herbarium19, all three clustering metrics underestimate the number of novel classes by 60 to 80. Moreover, they exhibit high error rates (20% or more) across other datasets, indicating their lack of robustness and generalizability.
Overall, these results suggest that geometry-based approaches leveraging the SSE curve—particularly the Maximum Distance method—provide more accurate and stable estimations across datasets with varying complexities. This capability is crucial for real-world deployments of novel class discovery systems, where the number of unknown categories is often not known in advance. By integrating such estimators into our open-world learning pipeline, we enable automatic and reliable estimation of novel classes, significantly improving the practical applicability of our framework.
5. Discussion
In this section, we discuss the challenges involved in constructing a unified framework that integrates OSR and NCD. As observed in the previous section, none of the class number estimation methods achieved perfect predictions across all datasets. Therefore, it is essential to evaluate the robustness of the proposed framework under imperfect estimation conditions. In addition, openness may significantly affect the system’s stability, making it necessary to examine how varying levels of openness influence performance. Furthermore, visual analysis offers meaningful insights into the interpretability of the model. To this end, we also compare the distance-based classification head and the prototype-based classification head through feature and attention visualizations. Lastly, we discuss the limitations of the current framework and explore potential directions for future research.
5.1. The Number of Clusters Is Unknown
The above experiments assume that the number of novel classes is known. However, this assumption may not hold in practical scenarios. Therefore, to further validate the effectiveness of our method in real-world applications, we conduct experiments under the condition of an unknown number of classes. We assume that the deviation between the estimated and true class numbers ranges from −20% to +20%, which aligns with the range of class number estimation errors discussed in the previous section. For example, in the case of 50 novel classes in the FGVC-Aircraft dataset, a −20% error rate means that the estimated number of classes is 10 fewer than the true number, while a +20% error rate indicates that the estimated number of classes is 10 more.
As shown in Figure 4, our method consistently outperforms the baseline methods. Additionally, the more accurate the class estimation, the higher the clustering accuracy for unknown classes tends to be. When the model is trained with the true number of unknown classes, the accuracy typically peaks. However, when the error exceeds ±10%, the accuracy drops significantly. We speculate that, when the class estimation error is relatively large, multiple novel classes may merge or split, making the relationship between the novel and known classes noisy and not conducive to learning such relationships.
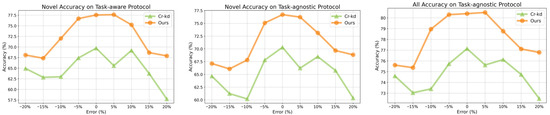
Figure 4.
Comparison with baseline methods in the case of inaccurate estimation of the number of unknown classes. Note that the result is based on FGVC-Aircraft dataset.
In summary, Figure 4 emphasizes the critical importance of accurate class estimation for NCD performance. Our method consistently achieves higher accuracy across all datasets and subsets, demonstrating greater resilience to estimation errors. For example, even with a 10% error in class estimation, our method still outperforms the optimal solution of baseline methods. These findings underscore the practical value of methods that can tolerate inaccuracies in cluster number estimation without significant performance degradation.
5.2. The Impact of Openness
The impact of openness on clustering performance is a crucial aspect to examine [44,45]. This section investigates how different levels of openness influence clustering outcomes based on experiments conducted with the Herbarium19 dataset. Following the definition outlined in [45], we computed the openness for various data splits of the Herbarium19 dataset, as shown on the horizontal axis in Figure 5. The secondary axis on the horizontal axis represents the absolute number of unknown categories.
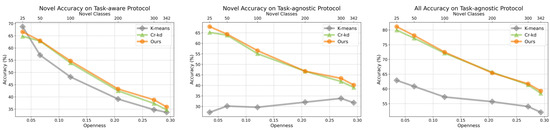
Figure 5.
The performance of three methods under different levels of openness. Note that the result is based on the Herbarium19 dataset.
Figure 5 presents the performance trends of three methods—K-means, Cr-KD, and our approach—across varying levels of openness under different evaluation protocols. The three subplots show the task-aware novel accuracy, task-agnostic novel accuracy, and overall task-agnostic accuracy, respectively. Under the task-aware protocol, our method outperforms Cr-KD and K-means as openness increases in most configurations. At lower levels of openness (e.g., 0.05), all methods achieve relatively high accuracy, with our method and Cr-KD exhibiting comparable performance. However, as openness rises, the accuracy of all methods decreases due to the added complexity of novel classes. K-means performs the worst, highlighting the limitations of training-free methods when faced with more complex scenarios involving higher proportions of novel classes.
5.3. Visualization Analysis and Feature Distribution
Figure 6 compares gradient class attention maps from linear and prototype classification heads during pre-training. For known classes, the prototype head yields more focused attention on semantically relevant regions (e.g., engines, wings), whereas the linear head often attends to background areas. This gap widens for unknown samples: the prototype head maintains localized attention, while the linear head shows dispersed patterns, indicating poor generalization.
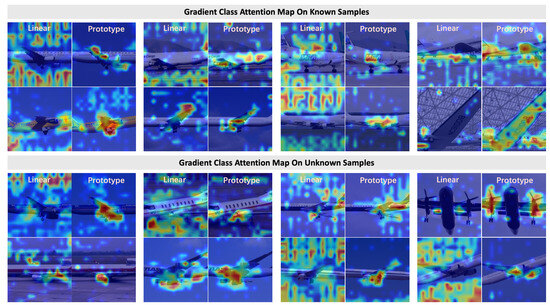
Figure 6.
Gradient attention maps for known and unknown samples during pre-training. Odd-numbered rows: linear head; even-numbered rows: prototype head.
UMAP visualizations in Figure 7 further reveal the structural advantage of prototype-based features. On datasets like CUB-200-2011 and Plant Village, our model achieves near-perfect cluster alignment with the ground truth. In contrast, linear-head features (Figure 2) suffer from fragmentation and over-segmentation. Even in the large-scale Herbarium19 dataset, the prototype head forms 255 coherent clusters from 342 classes, demonstrating scalability.
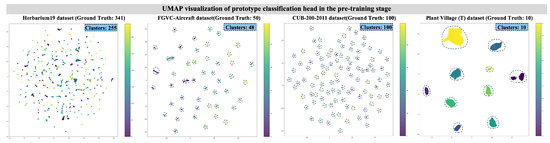
Figure 7.
UMAP visualizations of features from the prototype head during pre-training.
Figure 8 shows clustering of novel classes (FGVC-Aircraft). The prototype head forms 49 clean clusters (vs. 50 ground truth), while the linear head produces overlapping, fragmented clusters (48 total), with red boxes highlighting entangled regions. This reflects the prototype head’s ability to dynamically adapt to unseen classes via centroid-based structure, while the linear head inherits rigid, less transferable decision boundaries.
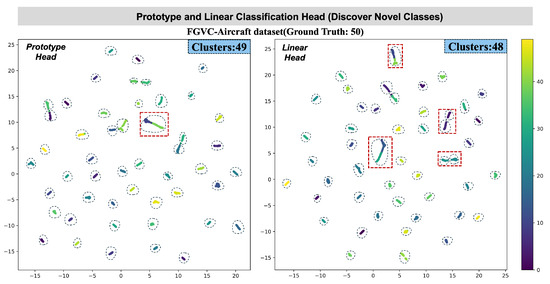
Figure 8.
Comparison of feature distributions for clustering unknown classes: prototype head vs. linear head. The red dashed boxes highlight clustering issues of inter-class overlap and intra-class separation.
Figure 9 presents the confusion matrices for the CUB-200-2011 (left) and FGVC-Aircraft (right) datasets, illustrating the classification behavior of our unified framework on two representative fine-grained benchmarks. For most novel categories, the model achieves highly compact clustering, as indicated by the strong diagonal dominance across both matrices. This suggests that the prototype-guided representation learning effectively captures category-level semantics and promotes clear decision boundaries between known and newly discovered classes.
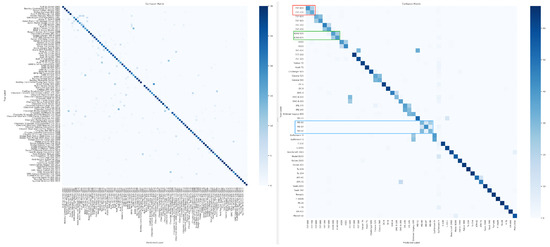
Figure 9.
Confusion matrices on CUB-200-2011 (left) and FGVC-Aircraft (right). Most novel classes are well clustered, while visually similar variants show localized misclassifications.
However, fine-grained misclassifications remain, particularly among visually similar subcategories. In the FGVC-Aircraft dataset, block-structured confusion patterns appear within aircraft families produced by the same manufacturer. As highlighted by the red, green, and blue boxes in the right figure, variants such as Boeing 737 (600/700/800), Airbus A340/A350, and McDonnell-Douglas MD-series (MD-80/87/90) are occasionally misclassified due to nearly identical design structures and visual appearances. This phenomenon reflects the intrinsic challenge of distinguishing models that differ only subtly in geometry or surface texture.
It can be inferred that, if the novel class pool in the CUB-200-2011 dataset were replaced with samples of the same vehicle model produced in different years, similar confusion might also occur. This scenario represents an exceptionally challenging recognition task—even for humans—due to the extremely subtle inter-class variations. Overall, the results indicate that, while most novel categories can be effectively clustered and accurately recognized, distinguishing between highly similar subclasses remains a major challenge for open-world learning systems.
5.4. Complexity, Limitations and Future Directions
In terms of computational complexity, our unified framework introduces no additional trainable parameters compared to existing methods such as Cr-KD [23] and UNO [7]. When using the ViT-Base backbone pre-trained with DINO-v2, the total number of trainable parameters remains approximately 86 million. The training and inference procedures are conducted on a single NVIDIA RTX 4090 GPU, with the training process requiring roughly 3 h (all stages) for the CUB-200-2011 dataset. The GPU memory consumption remains within 22 GB when the batch size is 512, comparable to the baselines. These results indicate that our method achieves improved performance without introducing extra computational overhead.
Despite the promising results, our method has several limitations that warrant further investigation. First, the framework relies heavily on large-scale pre-trained models such as dino-v2, which can be computationally intensive and memory-demanding. This makes deployment in resource-constrained environments challenging. Second, a key limitation arises from the visual similarity between some known-class and unknown-class samples. Ensuring that known samples are not mistakenly rejected as unknown is difficult and hinges critically on the choice of rejection threshold. An improperly tuned threshold may lead to misclassification of known-class instances as unknown, thereby introducing noise into the downstream discovery process and impairing the evaluation of novel categories. Lastly, our current experimental setup does not include scenarios where the number of novel classes significantly exceeds the number of known classes—a condition frequently encountered in real-world applications. The impact of such an imbalance remains an open question.
To the best of our knowledge, this work is the first to unify classification, rejection, and novel class discovery within a single framework. Future directions should aim to make open-world learning more automated and scalable. For example, models should be capable of autonomously discovering and learning novel categories over time without manual intervention, while still retaining robust performance on known classes. We hope that future research can build upon our contributions to design more self-supervised, efficient, and principled open-world learning systems, along with standardized evaluation protocols for better benchmarking.
6. Conclusions
In this work, we have proposed a unified framework that simultaneously addresses three key challenges in open-world learning: the classification of known classes, the rejection of unknown samples, and the discovery of novel classes. By integrating a prototype-based classification head with a knowledge distillation strategy, our method provides a scalable and interpretable solution that preserves known-class performance while enabling the accurate recognition and clustering of unseen categories. Extensive experiments across fine-grained datasets demonstrate the effectiveness of our framework in both class-aware and class-agnostic settings. Our distance-based rejection mechanism shows robustness to temperature hyperparameters and can be flexibly integrated with existing open-set recognition techniques. Furthermore, our method supports the unsupervised estimation of novel class quantities and maintains performance stability even under estimation errors, highlighting its practical utility in real-world applications.
Beyond achieving strong empirical results, this study contributes conceptually by bridging the gap between OSR and NCD within a unified framework. We believe this work lays the foundation for future research in automated open-world learning systems, especially those capable of continually discovering and adapting to emerging categories in dynamic environments.
Author Contributions
All authors contributed to the conception and design of this study. J.D. and S.W. developed the methodology and conducted the experiments. S.Z., Z.L. and H.Z. assisted with data collection and analysis. J.X. provided overall guidance, supervised the research process, and served as the corresponding author. All authors contributed to manuscript preparation, reviewed the results. All authors have read and agreed to the published version of the manuscript.
Funding
This work is supported by the Natural Science Foundation of Shanghai [Grant number 25ZR1401143].
Institutional Review Board Statement
Not applicable.
Informed Consent Statement
Not applicable.
Data Availability Statement
The datasets used in this study are publicly available and can be accessed through the following URLs: CUB-200-2011: https://www.kaggle.com/datasets/wenewone/cub2002011/ (accessed on 15 October 2025); FGVC-Aircraft: https://www.robots.ox.ac.uk/vgg/data/fgvc-aircraft/ (accessed on 15 October 2025); PlantVillage: https://github.com/spMohanty/PlantVillage-Dataset/tree/master/raw (accessed on 15 October 2025); Herbarium 2019: https://www.kaggle.com/c/herbarium-2019-fgvc6/data (accessed on 15 October 2025).
Conflicts of Interest
The authors declare no conflicts of interest.
Appendix A. Estimation Methods for the Number of Novel Classes
NCD assumes that the number of new classes is known to facilitate a fair comparison of classification performance on unknown classes with previous algorithms. However, the number of unknown classes is usually uncertain in the real world. Therefore, assessing the number of unknown classes is essential to the NCD task in practical scenarios. Currently, several studies have proposed various methods for estimating the number of classes [17,27,46]. To maintain the integrity of the NCD task, we use the elbow method to determine the number of unlabeled classes. The elbow method is a technique that determines the optimal number of clusters by plotting the sum of squared errors (SSE) within the cluster against the number of clusters and selecting the point where the curve noticeably bends. In this section, we explore six techniques to determine the optimal number of clusters (k) in a dataset. These methods are part of the elbow method and other related techniques that aim to balance model simplicity and performance. The details are listed as follows:
The Second Derivative Method [33] is based on the observation that the sum of squared errors (SSE) generally decreases as the number of clusters increases. However, the rate of decrease slows down after reaching the optimal number of clusters. This method leverages the second derivative of the SSE curve to identify the point of maximum curvature, which corresponds to the optimal k. The steps are as follows:
- Compute the second derivative of the SSE:
- The optimal number of clusters is found by identifying the point where the second derivative reaches its maximum value:
This method is particularly effective when the SSE curve exhibits a clear “elbow” point, indicating a natural clustering structure in the data.
The Maximum Distance Method [34] is a geometric approach that draws a straight line between the first and the last points on the SSE curve. The optimal k is determined by identifying the point on the SSE curve with the maximum perpendicular distance from this line, representing the most significant deviation from linearity. The procedure is as follows:
- Define the line between the points and .
- For each point, , on the SSE curve, calculate the perpendicular distance to the line:where D denotes the distance.
- The optimal k is the one with the maximum calculated distance.
This method is proper when the SSE curve does not have a sharp “elbow”, but a clear inflection point can be geometrically identified.
Minimum Angle Method [35] evaluates the angles formed by consecutive points on the SSE curve. By calculating the angles between three consecutive points, the method identifies the point that forms the smallest angle, which typically corresponds to the most pronounced “elbow” in the curve. The method is implemented as follows:
- For each (where i ranges from 2 to ), define three points: , , and .
- Compute the vectors and between these points:
- Calculate the cosine of the angle between these vectors:
- The optimal k corresponds to the point with the smallest angle.
This method is particularly effective when the SSE curve forms a distinct “elbow”, but may be less reliable when the curve is smoother.
Silhouette Coefficient Method [36] measures how similar an object is to its own cluster compared to other clusters. The silhouette score ranges from −1 to 1, where a higher score indicates that the object is well matched to its own cluster and poorly matched to neighboring clusters. The procedure is as follows:
- For each k, compute the silhouette score for the clustering solution:where is the average intra-cluster distance, and is the average nearest-cluster distance.
- The optimal k is the one that maximizes the silhouette score.
The Silhouette Coefficient Method is useful for determining the clustering quality, as it directly assesses how well-separated the resulting clusters are.
Calinski–Harabasz Index Method [37], also known as the Variance Ratio Criterion, evaluates the ratio of the sum of between-cluster dispersion to within-cluster dispersion. A higher score indicates better-defined clusters. The steps to compute the index are as follows:
- For each k, compute the Calinski–Harabasz score:where is the between-group dispersion matrix, is the within-group dispersion matrix, and N is the number of data points.
- The optimal k is the one that maximizes the Calinski–Harabasz score.
The Calinski-Harabasz Index is effective when clusters are well separated, providing a clear indication of the optimal number of clusters.
Davies-Bouldin Index Method [38] measures the average similarity ratio between each cluster and its most similar cluster. Lower values of the Davies–Bouldin index indicate better clustering. The procedure is as follows:
- For each k, calculate the Davies–Bouldin score:where and are the intra-cluster distances, and is the distance between cluster centroids and .
- The optimal k is the one that minimizes the Davies-Bouldin score.
The Davies-Bouldin Index is advantageous when evaluating clusters of varying shapes and densities, as it considers both intra-cluster cohesion and inter-cluster separation.
Appendix B. Datasets Information
To ensure realistic OSR and NCD evaluation, we focus on fine-grained datasets where known and unknown classes share the same domain.
CUB-200-2011 [47] includes 11,788 bird images across 200 species with fine-grained distinctions. FGVC-Aircraft [48] contains 10,000 images of 100 aircraft models with subtle inter-class differences. Following [49], we evenly split classes into known and unknown subsets for both datasets.
Herbarium19 [50] has 46,469 plant specimen images across 683 species, posing challenges such as high intra-class variance and long-tailed distribution. We follow [51] to split into 341 known and 342 unknown classes.
Plant Village [52] contains 54,309 leaf images from 14 crop species with multiple disease types. We curate a subset with ten tomato diseases as known classes, and we use leaves from other species (healthy and diseased) as unknowns to simulate domain-consistent open-world settings.
Across datasets, known-to-unknown class ratios are balanced for CUB, FGVC-Aircraft, and Herbarium19. For Plant Village, we explore multiple splits to assess generalization under class imbalance. Dataset splits are shown in Table A1.
Table A1.
Dataset splits for novel class discovery.
Table A1.
Dataset splits for novel class discovery.
| Dataset | Known Classes | Unknown Classes | ||||
|---|---|---|---|---|---|---|
| Training | Test | Classes | Training | Test | Classes | |
| CUB-200-2011 | 2997 | 2884 | 100 | 2997 | 2910 | 100 |
| FGVC-Aircraft | 3332 | 1668 | 50 | 3335 | 1665 | 50 |
| Herbarium19 | 17,013 | 1335 | 341 | 17,212 | 1344 | 342 |
| Plant Village (T/A) | 10,785 | 7374 | 10 | 1889 | 1282 | 4 |
| Plant Village (T/C) | 10,785 | 7374 | 10 | 2333 | 1519 | 4 |
| Plant Village (T/G) | 10,785 | 7374 | 10 | 2428 | 1634 | 4 |
| Plant Village (T/P) | 10,785 | 7374 | 10 | 1297 | 855 | 3 |
| Plant Village (T/H) | 10,785 | 7374 | 10 | 6111 | 3999 | 7 |
| Plant Village (T/D) | 10,785 | 7374 | 10 | 7696 | 5101 | 6 |
References
- Sharifani, K.; Amini, M. Machine learning and deep learning: A review of methods and applications. World Inf. Technol. Eng. J. 2023, 10, 3897–3904. [Google Scholar]
- Opanasenko, V.; Fazilov, S.K.; Radjabov, S.; Kakharov, S.S. Multilevel Face Recognition System. Cybern. Syst. Anal. 2024, 60, 146–151. [Google Scholar] [CrossRef]
- Zou, Z.; Chen, K.; Shi, Z.; Guo, Y.; Ye, J. Object detection in 20 years: A survey. Proc. IEEE 2023, 111, 257–276. [Google Scholar] [CrossRef]
- Koley, S.; Bhunia, A.K.; Sain, A.; Chowdhury, P.N.; Xiang, T.; Song, Y.Z. You’ll Never Walk Alone: A Sketch and Text Duet for Fine-Grained Image Retrieval. In Proceedings of the IEEE/CVF Conference on Computer Vision and Pattern Recognition, Seattle, WA, USA, 16–22 June 2024; pp. 16509–16519. [Google Scholar]
- Kejriwal, M.; Kildebeck, E.; Steininger, R.; Shrivastava, A. Challenges, evaluation and opportunities for open-world learning. Nat. Mach. Intell. 2024, 6, 580–588. [Google Scholar] [CrossRef]
- Yang, J.; Wang, P.; Zou, D.; Zhou, Z.; Ding, K.; Peng, W.; Wang, H.; Chen, G.; Li, B.; Sun, Y.; et al. OpenOOD: Benchmarking Generalized Out-of-Distribution Detection. In Proceedings of the Thirty-Sixth Conference on Neural Information Processing Systems Datasets and Benchmarks Track, Virtual, 28 November–9 December 2022. [Google Scholar]
- Fini, E.; Sangineto, E.; Lathuilière, S.; Zhong, Z.; Nabi, M.; Ricci, E. A unified objective for novel class discovery. In Proceedings of the IEEE/CVF International Conference on Computer Vision, Montreal, BC, Canada, 11–17 October 2021; pp. 9284–9292. [Google Scholar]
- Dong, J.; Yao, Y.; Jin, W.; Zhou, H.; Gao, Y.; Fang, Z. Enhancing Few-Shot Out-of-Distribution Detection with Pre-Trained Model Features. IEEE Trans. Image Process. 2024, 33, 6309–6323. [Google Scholar] [CrossRef]
- Hendrycks, D.; Gimpel, K. A Baseline for Detecting Misclassified and Out-of-Distribution Examples in Neural Networks. In Proceedings of the International Conference on Learning Representations, ICLR 2016, San Juan, Puerto Rico, 2–4 May 2016. [Google Scholar]
- Liang, S.; Li, Y.; Srikant, R. Enhancing The Reliability of Out-of-distribution Image Detection in Neural Networks. In Proceedings of the International Conference on Learning Representations, Vancouver, BC, Canada, 30 April–3 May 2018. [Google Scholar]
- Liu, W.; Wang, X.; Owens, J.; Li, Y. Energy-based out-of-distribution detection. In Proceedings of the 34th Conference on Neural Information Processing Systems (NeurIPS 2020), Vancouver, BC, Canada, 6–12 December 2020; pp. 21464–21475. [Google Scholar]
- Hendrycks, D.; Basart, S.; Mazeika, M.; Zou, A.; Kwon, J.; Mostajabi, M.; Steinhardt, J.; Song, D. Scaling Out-of-Distribution Detection for Real-World Settings. In Proceedings of the International Conference on Machine Learning, PMLR, Baltimore, MD, USA, 17–23 July 2022; pp. 8759–8773. [Google Scholar]
- Miller, D.; Sunderhauf, N.; Milford, M.; Dayoub, F. Class anchor clustering: A loss for distance-based open set recognition. In Proceedings of the IEEE/CVF Winter Conference on Applications of Computer Vision, Virtual, 5–9 January 2021; pp. 3570–3578. [Google Scholar]
- Liu, Z.G.; Fu, Y.M.; Pan, Q.; Zhang, Z.W. Orientational distribution learning with hierarchical spatial attention for open set recognition. IEEE Trans. Pattern Anal. Mach. Intell. 2022, 45, 8757–8772. [Google Scholar] [CrossRef]
- Hsu, Y.C.; Lv, Z.; Kira, Z. Learning to cluster in order to transfer across domains and tasks. In Proceedings of the International Conference on Learning Representations, Vancouver, BC, Canada, 30 April–3 May 2018. [Google Scholar]
- Han, K.; Vedaldi, A.; Zisserman, A. Learning to discover novel visual categories via deep transfer clustering. In Proceedings of the IEEE/CVF International Conference on Computer Vision, Seoul, Republic of Korea, 27 October–2 November 2019; pp. 8401–8409. [Google Scholar]
- Han, K.; Rebuffi, S.A.; Ehrhardt, S.; Vedaldi, A.; Zisserman, A. Autonovel: Automatically discovering and learning novel visual categories. IEEE Trans. Pattern Anal. Mach. Intell. 2021, 44, 6767–6781. [Google Scholar] [CrossRef] [PubMed]
- Zhong, Z.; Fini, E.; Roy, S.; Luo, Z.; Ricci, E.; Sebe, N. Neighborhood contrastive learning for novel class discovery. In Proceedings of the IEEE/CVF Conference on Computer Vision and Pattern Recognition, Nashville, TN, USA, 20–25 June 2021; pp. 10867–10875. [Google Scholar]
- Han, K.; Rebuffi, S.; Ehrhardt, S.; Vedaldi, A.; Zisserman, A. Automatically discovering and learning new visual categories with ranking statistics. In Proceedings of the 8th Intennational Conference on Learning Representations, ICLR 2020, Schloss Dagstuhl-Leibniz-Zentrum für Informatik, Virtual, 26 April–1 May 2020. [Google Scholar]
- Jaiswal, A.; Babu, A.R.; Zadeh, M.Z.; Banerjee, D.; Makedon, F. A survey on contrastive self-supervised learning. Technologies 2020, 9, 2. [Google Scholar] [CrossRef]
- Jing, M.; Zhu, Y.; Zang, T.; Wang, K. Contrastive self-supervised learning in recommender systems: A survey. ACM Trans. Inf. Syst. 2023, 42, 1–39. [Google Scholar] [CrossRef]
- Asano, Y.; Rupprecht, C.; Vedaldi, A. Self-labelling via simultaneous clustering and representation learning. In Proceedings of the International Conference on Learning Representations, ICLR 2020, Addis Ababa, Ethiopia, 30 April 2020. [Google Scholar]
- Gu, P.; Zhang, C.; Xu, R.; He, X. Class-relation Knowledge Distillation for Novel Class Discovery. In Proceedings of the 2023 IEEE/CVF International Conference on Computer Vision (ICCV), Paris, France, 1–6 October 2023; IEEE Computer Society: Los Alamitos, CA, USA, 2023; pp. 16428–16437. [Google Scholar]
- An, W.; Tian, F.; Shi, W.; Chen, Y.; Wu, Y.; Wang, Q.; Chen, P. Transfer and alignment network for generalized category discovery. In Proceedings of the AAAI Conference on Artificial Intelligence, Vancouver, BC, Canada, 26–27 February 2024; pp. 10856–10864. [Google Scholar]
- Bharadwaj, R.; Naseer, M.; Khan, S.; Khan, F.S. Enhancing Novel Object Detection via Cooperative Foundational Models. arXiv 2023, arXiv:2311.12068. [Google Scholar] [CrossRef]
- Hayes, T.L.; de Souza, C.R.; Kim, N.; Kim, J.; Volpi, R.; Larlus, D. PANDAS: Prototype-based Novel Class Discovery and Detection. arXiv 2024, arXiv:2402.17420. [Google Scholar] [CrossRef]
- Liu, J.; Wang, Y.; Zhang, T.; Fan, Y.; Yang, Q.; Shao, J. Open-world semi-supervised novel class discovery. In Proceedings of the Thirty-Second International Joint Conference on Artificial Intelligence, Macao, China, 19–25 August 2023; pp. 4002–4010. [Google Scholar]
- Xiao, R.; Feng, L.; Tang, K.; Zhao, J.; Li, Y.; Chen, G.; Wang, H. Targeted representation alignment for open-world semi-supervised learning. In Proceedings of the IEEE/CVF Conference on Computer Vision and Pattern Recognition, Seattle, WA, USA, 16–22 June 2024; pp. 23072–23082. [Google Scholar]
- Zhang, C.; Xu, R.; He, X. Novel Class Discovery for Long-tailed Recognition. arXiv 2023, arXiv:2308.02989. [Google Scholar] [CrossRef]
- Huang, H.; Gao, F.; Sun, J.; Wang, J.; Hussain, A.; Zhou, H. Novel category discovery without forgetting for automatic target recognition. IEEE J. Sel. Top. Appl. Earth Obs. Remote. Sens. 2024, 17, 4408–4420. [Google Scholar] [CrossRef]
- Liu, Y.; Cai, Y.; Jia, Q.; Qiu, B.; Wang, W.; Pu, N. Novel class discovery for ultra-fine-grained visual categorization. In Proceedings of the IEEE/CVF Conference on Computer Vision and Pattern Recognition, Seattle, WA, USA, 16–2 June 2024; pp. 17679–17688. [Google Scholar]
- Liu, F.; Deng, Y. Determine the number of unknown targets in open world based on elbow method. IEEE Trans. Fuzzy Syst. 2020, 29, 986–995. [Google Scholar] [CrossRef]
- Ketchen, D.J.; Shook, C.L. The application of cluster analysis in strategic management research: An analysis and critique. Strateg. Manag. J. 1996, 17, 441–458. [Google Scholar] [CrossRef]
- Milligan, G.W.; Cooper, M.C. An examination of procedures for determining the number of clusters in a data set. Psychometrika 1985, 50, 159–179. [Google Scholar] [CrossRef]
- Thorndike, R.L. Who belongs in the family? Psychometrika 1953, 18, 267–276. [Google Scholar] [CrossRef]
- Rousseeuw, P.J. Silhouettes: A graphical aid to the interpretation and validation of cluster analysis. J. Comput. Appl. Math. 1987, 20, 53–65. [Google Scholar] [CrossRef]
- Caliński, T.; Harabasz, J. A dendrite method for cluster analysis. Commun. Stat. Theory Methods 1974, 3, 1–27. [Google Scholar] [CrossRef]
- Davies, D.L.; Bouldin, D.W. A cluster separation measure. IEEE Trans. Pattern Anal. Mach. Intell. 1979, PAMI-1, 224–227. [Google Scholar] [CrossRef]
- Oquab, M.; Darcet, T.; Moutakanni, T.; Vo, H.V.; Szafraniec, M.; Khalidov, V.; Fernandez, P.; HAZIZA, D.; Massa, F.; El-Nouby, A.; et al. DINOv2: Learning Robust Visual Features without Supervision. arXiv 2023, arXiv:2304.07193. [Google Scholar]
- Krizhevsky, A.; Sutskever, I.; Hinton, G.E. Imagenet classification with deep convolutional neural networks. In Proceedings of the Advances in Neural Information Processing Systems 25 (NIPS 2012), Lake Tahoe, NV, USA, 3–6 December 2012. [Google Scholar]
- Du, X.; Wang, Z.; Cai, M.; Li, Y. Vos: Learning what you don’t know by virtual outlier synthesis. arXiv 2022, arXiv:2202.01197. [Google Scholar]
- Powers, D.M. Evaluation: From precision, recall and F-measure to ROC, informedness, markedness and correlation. arXiv 2020, arXiv:2010.16061. [Google Scholar] [CrossRef]
- Kuhn, H.W. The Hungarian method for the assignment problem. Nav. Res. Logist. Q. 1955, 2, 83–97. [Google Scholar] [CrossRef]
- Yuan, Y.; He, X.; Jiang, Z. Adaptive open domain recognition by coarse-to-fine prototype-based network. Pattern Recognit. 2022, 128, 108657. [Google Scholar] [CrossRef]
- Scheirer, W.J.; de Rezende Rocha, A.; Sapkota, A.; Boult, T.E. Toward open set recognition. IEEE Trans. Pattern Anal. Mach. Intell. 2012, 35, 1757–1772. [Google Scholar] [CrossRef] [PubMed]
- Zhao, B.; Wen, X.; Han, K. Learning semi-supervised gaussian mixture models for generalized category discovery. In Proceedings of the IEEE/CVF International Conference on Computer Vision, Paris, France, 1–6 October 2023; pp. 16623–16633. [Google Scholar]
- Krause, J.; Jin, H.; Yang, J.; Fei-Fei, L. Fine-grained recognition without part annotations. In Proceedings of the IEEE Conference on Computer Vision and Pattern Recognition, Boston, MA, USA, 7–12 June 2015; pp. 5546–5555. [Google Scholar]
- Maji, S.; Rahtu, E.; Kannala, J.; Blaschko, M.; Vedaldi, A. Fine-grained visual classification of aircraft. arXiv 2013, arXiv:1306.5151. [Google Scholar] [CrossRef]
- Luo, Z.; Liu, Y.; Schiele, B.; Sun, Q. Class-incremental exemplar compression for class-incremental learning. In Proceedings of the IEEE/CVF Conference on Computer Vision and Pattern Recognition, Vancouver, BC, Canada, 17–24 June 2023; pp. 11371–11380. [Google Scholar]
- Tan, K.C.; Liu, Y.; Ambrose, B.; Tulig, M.; Belongie, S. The herbarium challenge 2019 dataset. arXiv 2019, arXiv:1906.05372. [Google Scholar] [CrossRef]
- Vaze, S.; Han, K.; Vedaldi, A.; Zisserman, A. Generalized category discovery. In Proceedings of the IEEE/CVF Conference on Computer Vision and Pattern Recognition, New Orleans, LA, USA, 18–24 June 2022; pp. 7492–7501. [Google Scholar]
- Hughes, D.; Salathé, M. An open access repository of images on plant health to enable the development of mobile disease diagnostics. arXiv 2015, arXiv:1511.08060. [Google Scholar]


Disclaimer/Publisher’s Note: The statements, opinions and data contained in all publications are solely those of the individual author(s) and contributor(s) and not of MDPI and/or the editor(s). MDPI and/or the editor(s) disclaim responsibility for any injury to people or property resulting from any ideas, methods, instructions or products referred to in the content. |
© 2025 by the authors. Licensee MDPI, Basel, Switzerland. This article is an open access article distributed under the terms and conditions of the Creative Commons Attribution (CC BY) license (https://creativecommons.org/licenses/by/4.0/).