Abstract
The development of mineral resources in China is increasingly targeting the recovery of residual ore bodies, which significantly elevates geotechnical risks, including goaf collapse and pillar instability. To address these challenges, this study developed an integrated ground pressure control system that coordinates mining, backfilling, and support technologies. The system is dynamically optimized through a microseismic monitoring-based feedback mechanism, forming a closed-loop disaster management framework. Based on a two-year microseismic monitoring campaign (October 2012–September 2014), which captured 103 located events, a strong spatial clustering of seismic activity was observed, with over 7% of event pairs occurring within 20 m, particularly at the abutment of the syncline ore body. A zonal early-warning model was established using key parameters (event rate ratio ≥ 3, cluster density ≥ 15 events/10,000 m3, energy ratio ≥ 4). The effectiveness of the control system was validated by a 5.9% reduction in located events and a decrease in maximum magnitude from 0.3 to −0.2, despite a 34% year-on-year increase in ore production in 2019. These results demonstrate that the integrated approach provides a reliable and adaptive solution for ground pressure disaster prevention during residual ore recovery.
1. Introduction
With the increasing depletion of shallow mineral resources worldwide, the recovery of residual ore bodies in goaf areas has become a key way to achieve sustainable mining development, especially for metals such as tungsten that have important strategic significance [1,2,3]. Although this trend has been widely recognized [4], residual ore recovery operations still face severe ground pressure challenges due to the complex geological and mechanical environments in goaf areas. Specifically, these challenges include the gradual instability of mining pillars [5], the sudden collapse of the local roof [6], and large-scale goaf collapse that may trigger a chain reaction [7,8,9]. Traditional monitoring methods, such as stress gauges or convergence monitoring, often struggle to capture the dynamic evolution of stress fields before disasters in real time, resulting in limitations in their active warning capabilities [10,11,12,13,14,15].
Two main technologies have been developed in academia and industry to address these challenges. Monitoring technology: Microseismic monitoring technology has been maturely applied in deep mines to warn of dynamic disasters such as rock bursts. For example, the research of Jiang [16] and Liu [17] combined numerical simulation with on-site monitoring to analyze the stability of rock mass under the influence of mining. Wang [18] and Yang [19] further utilized microseismic data to reveal the failure mechanism of the roof and surrounding rock in deep working faces. Control technology: On the other hand, control technology, represented by the filling method, has been proven to effectively manage ground pressure. Yao [14] and Gu [20] focused on the performance and engineering practice of filling materials, while Yang et al. [21] explored the influence of roof presplitting technology on the stress distribution of surrounding rock through physical model experiments. However, existing research generally has a key flaw: viewing monitoring and control as two independent processes. The monitoring system is responsible for identifying problems, while control measures are implemented based on static models or post experience. This disconnect leads to the inability to form a closed-loop system that dynamically optimizes control strategies based on real-time monitoring data [18,19,22], resulting in ground pressure management still being at the level of “passive response” rather than “active control”.
The above limitations highlight the urgent need to establish a closed-loop management system that can integrate real-time microseismic monitoring and dynamic control optimization [23,24]. Although Feng Xiating et al. [25] and Liu Jianping et al. [26] have pointed out the importance of this direction, practical research on systematically coupling microseismic monitoring parameters with various control strategies (such as filling, pillar reinforcement, and capacity adjustment) and forming real-time feedback mechanisms remains scarce.
Therefore, this study aims to fill this research gap. Through the case study of Xianglushan tungsten mine, we have developed a comprehensive ground pressure management framework. The core innovation of this work lies in establishing a real-time feedback mechanism that directly links microseismic monitoring parameters (such as event rate, energy ratio, and cluster density) with the effectiveness of ground pressure control. Developed a dynamic optimization method: based on feedback data, dynamically optimized comprehensive control strategies including backfilling, pillar reinforcement, and capacity adjustment. Verified closed-loop system: Through case studies, it was demonstrated that the system can transition from a passive response to an active control, providing a safer and more intelligent disaster prevention solution for residual ore recovery.
The remainder of this paper is organized as follows: Section 2 presents the engineering background and residual mining situation; Section 3 details the ground pressure control measures implemented; Section 4 verifies the microseismic response and parameter optimization; Section 5 and Section 6 provides conclusions and recommendations.
2. Engineering Background
2.1. Mine Overview
Xianglushan Tungsten Mine is located in Xiushui County, Jiangxi Province (see Figure 1), and is one of the key tungsten resources in China [27].
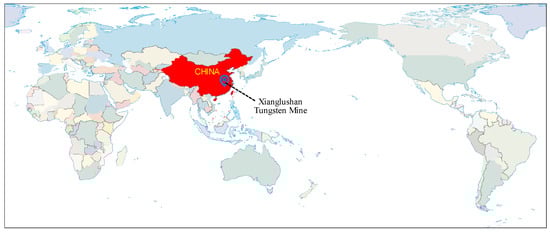
Figure 1.
Mine location map.
Since 1959, geological team members have been conducting surveys in the area, and in 1988, they discovered a large-scale, high-grade, and well-developed super large scheelite deposit [4]. In 2003, China Minmetals Corporation established Xianglushan Tungsten Industry in Xiushui, with an annual processing capacity of 500,000 tons of ore and production of 4000 tons of tungsten concentrate, becoming a key industrial enterprise in Jiangxi Province.
The Xianglushan tungsten deposit is a typical skarn-type scheelite deposit, primarily formed at the contact between the carbonaceous limestone of the Yangliugang Formation, from the Middle Cambrian, and the Xianglushan granite. Xianglushan granite has a fine-grained to medium-coarse-grained structure, mainly composed of quartz, potassium feldspar, plagioclase, and biotite, with ilmenite as the main accessory mineral. The development of Xianglushan tungsten mine has a significant impact on the local economy and social development. At the same time, it also faces challenges such as increased mining difficulty, decreased ore grade, and safety concerns [10,12]. Sustainable development needs to be achieved by expanding reserves and increasing the value of resource utilization [28].
2.2. Residual Mining Situation
Figure 2 shows the overall location of the residual mining area in the eastern and western mining areas from October 2012 to September 2014.
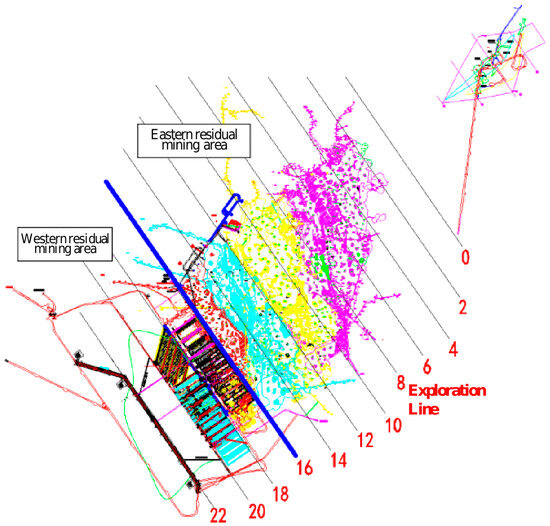
Figure 2.
Distribution of main locations for residual ore body mining.
2.2.1. Residual Mining Situation in the Eastern Region
The eastern residual mining area is defined by Exploration Line 16 to the east, which includes five pit mouths, two pit mouths, and four pit mouths, divided by three people. The respective areas of the pit mouth are shown in Figure 3a; the boundary between the pit mouths is blurred, and there is a phenomenon of overlapping goaf in some areas. This study aims to compare the mining conditions between 2010 and 2012. Therefore, we have presented the changes in the distribution of sampling points in the eastern and western regions from January 2010 to June 2012 on a semi-annual basis. Figure 3b–f shows the changes in the distribution of residual mining points at five, two, and four mine entrances in the eastern residual mining area. The area delineated by each black solid line in the figure is a residual mining point. It can be observed that the residual mining points are scattered almost uniformly along the exploration line within the eastern mining area, spanning a length of nearly 800 m, and their distribution is not planned or arranged. The number of residual mining sites has consistently been above 20, with a peak of 25 from January to June 2011. Due to the large area of the second and fifth pit mouths, the majority of residual mining sites are located within them.
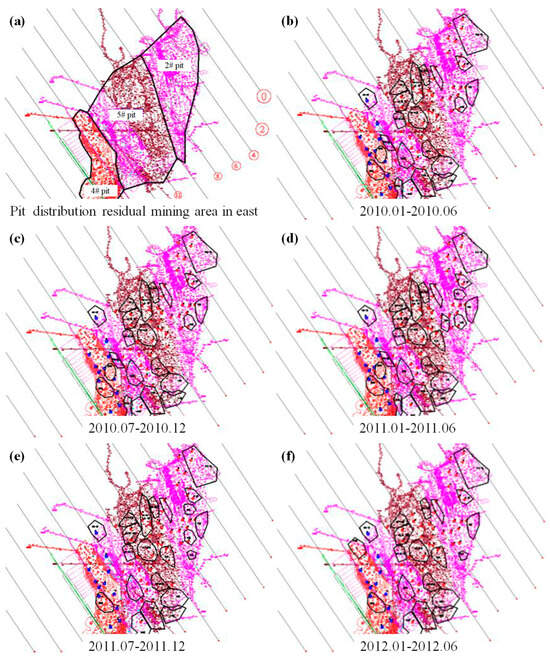
Figure 3.
Distribution map of residual mining points at the eastern pit mouth and different time periods. (a) The overall distribution of goafs in the west, (b–f) 2010.01–2012.06.
Before June 2013, the underground ore output remained at around 70,000 tons per month, and there were also many residual mining points in the eastern mining area. On 28 June 2013, after a large-scale roof collapse occurred in a closed mining area with four pits in the eastern mining area, production restrictions were implemented in the east. At the same time, the progress of filling work was accelerated, and the goaf was treated, resulting in a significant reduction in the number of residual mining points in the east.
2.2.2. Western Residual Mining Situation
The western mining area is planned and arranged within a relatively complete ore body. As shown in Figure 4a, from 2010 to 2012, the main mining activities were carried out in the mining area between exploration lines 16 and 18. Between 2013 and 2014, mining operations were conducted in the mining area located between exploration lines 18 and 20.
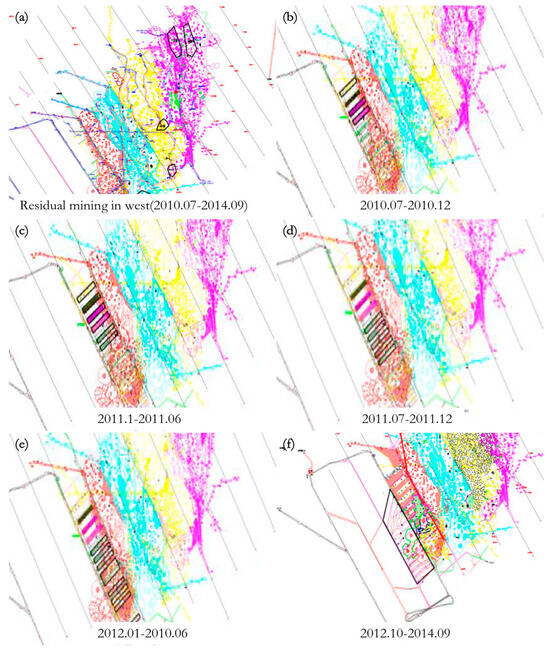
Figure 4.
Distribution map of residual mining in different stages within the western mining area. (a) The entire time period (July 2010–September 2014), (b) 2010.07–2010.12, (c) 2011.01–2011.06, (d) 2011.07–2011.12, (e) 2012.01–2010.06, (f) 2012.10–2014.09.
From Figure 4b–f, it can be seen that since western production began in July 2010, the western mining points have advanced in an orderly manner from northwest to southeast. According to the principle of ‘one for one’, return to the mining room first, and then recover the pillars after the mining room is filled. At that time, a one-step mining process was carried out, and a two-step mining process was carried out after the filling of the mining room was completed. The rectangular area delineated by each black solid line in the figure is the mining room.
2.2.3. Trend of Changes in Extracted Ore Volume
Figure 5a,b, respectively, show the trend of monthly ore extraction from Xianglushan Tungsten Mine from March 2010 to June 2012 and from January 2013 to September 2014. Analysis shows that before June 2013, the monthly underground ore output was generally around 70,000 to 80,000 tons; however, after that, the monthly ore output decreased to around 40,000 tons. Figure 5c presents the comparative data on ore extraction from the eastern and western regions in 2014, indicating that the current ore extraction is primarily from the western region.
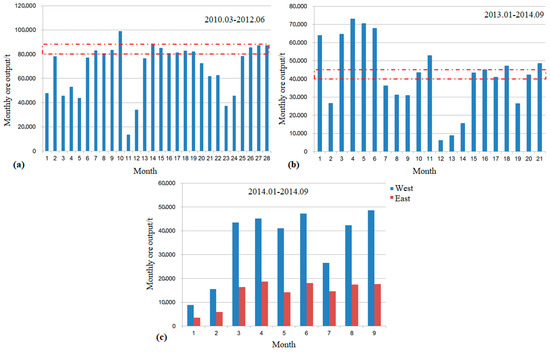
Figure 5.
Monthly ore output. (a,b) The overall ore output from March 2010 to September 2014; (c) the ore output of the eastern and western regions from January to September 2014.
2.3. Micro-Seismic Monitoring System
To accurately capture the dynamic evolution of rock stress during the recovery process of residual ore bodies, this study relies on the established microseismic monitoring system of Xianglushan tungsten mine and optimizes and supplements the network for the target mining area. This section will elaborate on the specific configuration and operating parameters of the monitoring system.
2.3.1. System Configuration and Sensor Layout
The microseismic monitoring system used in this study is [please provide the system brand and model, such as the Paladin system from ESG (Engineering Seismology Group)]. The system mainly consists of an underground sensor array, a data acquisition unit, and a surface analysis host. The sensor array consists of 84 single-axis and three-axis accelerometers, with a frequency response range of 50 Hz~2000 Hz, which can effectively capture high-frequency vibration signals generated by rock fractures.
The spatial arrangement of sensors is the key to ensuring monitoring accuracy. As shown in Figure 6a, the sensor network adopts a strategy of combining layered and three-dimensional distribution, covering the main production sections and key residual pillar areas of the mine. The sensor is anchored in a stable rock mass through drilling and closely coupled with the rock mass to minimize signal attenuation and interference. This arrangement ensures that the three-dimensional spatial positioning error within the target monitoring area is less than 20 m, meeting the engineering accuracy requirements.
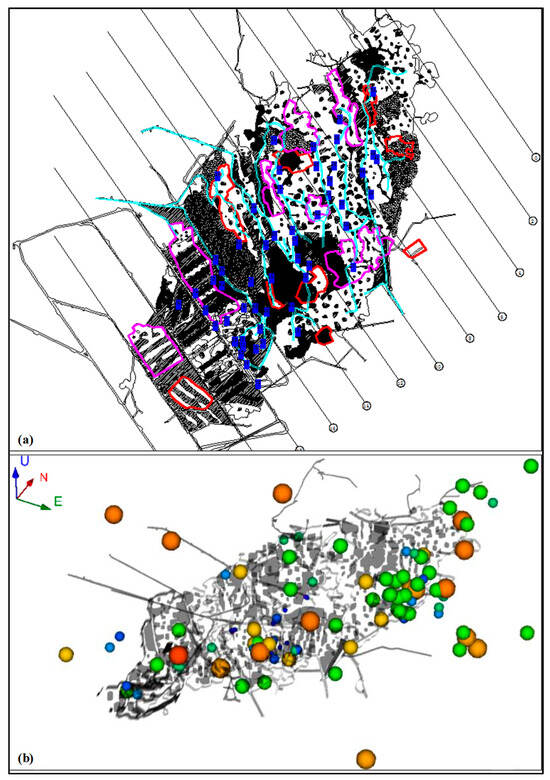
Figure 6.
Microseismic monitoring system. (a) Schematic diagram of sensor layout, (b) three-dimensional spatial distribution of microseismic events (October 2012–September 2014).
2.3.2. Data Collection and Processing Parameters
The system operated continuously during the two-year monitoring period from October 2012 to September 2014. The triggering threshold set by the data acquisition unit is 3–4 times the system noise level, and the STA/LTA algorithm is used to automatically identify effective microseismic events. For an event deemed valid, the system records its waveform parameters, such as arrival time, amplitude, and rise time, among others.
During this period, the system recorded and accurately located 103 valid microseismic events. The three-dimensional spatial distribution of these events is shown in Figure 6b, with their energy release mainly distributed in the range of 10 J to 104 J. The core parameters relied upon for subsequent analysis include event rate, which is the number of microseismic events per unit time, used to evaluate the intensity of rock activity. Release energy is calculated through waveform integration, which characterizes the scale of rock mass fracture. Event cluster density reflects the degree of spatial clustering of microseismic events, typically associated with high-stress concentration areas or potential failure surfaces.
2.3.3. System Operation and Data Validation
The system has achieved all-weather, unmanned, automatic operation, and all data is transmitted in real-time to the surface monitoring center through the mine’s dedicated communication optical cable. To ensure the reliability of the data, we regularly calibrate and verify the system using manual blasting sources every June to verify its positioning accuracy and sensor sensitivity. This comprehensive microseismic monitoring system provides a solid data foundation for establishing dynamic feedback and control mechanisms for ground pressure in the future.
3. Governance Techniques for Ground Pressure Disasters
3.1. Preparation Before Filling
3.1.1. Ground Pressure and Ground Pressure Management Situation
The overall structure of the ore body is an anticline, and its core area is affected by surface topography, resulting in the maximum thickness and burial depth of the ore body. By analyzing the data of exploration lines 0 # to 22 # (See Figure 2), the enriched areas in the core of the anticline were delineated line by line and connected into strips. It was found that this area is concentrated with the maximum thickness (20–40 m) and maximum burial depth (200–300 m) of the ore body. The height of the strip area is highly consistent, and its inherent correlation is manifested as the increase in thickness of the ore body in the core of the anticline directly leads to an increase in the height and burial depth of the ore pillar. The stability coefficient of this region is significantly reduced due to the influence of geometric parameters. Geomechanical analysis reveals that the core of the anticline is not only the enriched core zone of the ore body but also a weak area in terms of engineering stability. Overall, it highlights the dual control effect of structural morphology on the occurrence characteristics of ore bodies and the stability of rock masses [23].
Ground pressure management is crucial in the monitoring and management of mine ground pressure. Establish a scientific and standardized ground pressure management process suitable for mining production safety management organizations and strictly implement ground pressure management to ensure the effectiveness of ground pressure monitoring methods. In the actual monitoring and warning work on site, a ground pressure warning management process for on-site use has been developed. When the microseismic monitoring data reaches the zone warning value, warning information is issued to relevant personnel and departments according to the ground pressure warning management process. Based on the close integration with the mine’s production safety management mode, the above-mentioned ground pressure warning management process enables mine managers and underground operators to respond in an orderly and timely manner, quickly and reasonably handling warning information and underground ground pressure disasters [24,25].
3.1.2. Description of Filling Function and Mechanism
In Chinese backfill mining, such as the Point pillar upward horizontal layered filling mining method in this mine, the method serves multiple critical functions: it promptly fills goafs to support surrounding rock, controls deformation and rock bursts, and optimizes stress distribution. The backfill accelerates mining cycles by creating new working faces, improves ore recovery, and enables waste-free mining by utilizing waste rock and tailings [20].
Mechanistically, backfill immediately restores equilibrium by introducing a new medium into excavation spaces. Its core functions include contact support, stress absorption and transfer, and stress isolation, which collectively reduce interlayer movement, protect pillars, mitigate rock bursts, and dampen blasting vibrations [29] (See Figure 7).
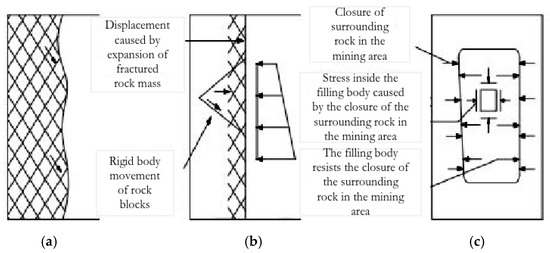
Figure 7.
Supporting the surrounding rock of the mining site with filling material (a) provides lateral constraints on the sliding trend of unloading rock blocks, (b) supports fractured rock masses and primary fractured rock masses, and (c) resists deformation of the surrounding rock in the mining area.
The efficacy of backfill technology is influenced by both material properties and the placement strategies employed. While material composition affects stress behavior, this study focuses on establishing a systematic methodology for integrating backfill operations with real-time microseismic monitoring, rather than optimizing specific material formulations. The proposed framework is designed to be adaptable to various backfill materials typically used in mining practice, with the core innovation lying in the dynamic feedback mechanism between monitoring and control actions. This study focuses on establishing a systematic methodology for integrating backfill operations with real-time microseismic monitoring, rather than optimizing specific material formulations.
3.1.3. Define Hazardous Areas
Based on real-time data obtained from the microseismic monitoring system, we have established a quantitative criterion for delineating hazardous areas. When the microseismic activity parameters in a certain area exceed the preset threshold, the area is deemed to be a stress concentration zone and a danger zone, indicating a potential risk of roof collapse or pillar instability.
The micro core parameter determination method is used to delineate hazardous areas using micro seismic data and methods. The core microseismic parameters used to delineate hazardous areas are explained in Section 2.3.
The main delineation results are as follows: based on the monitoring data mentioned above, we have set warning thresholds for the zones (see Section 4.3 for details). When the microseismic parameters in a certain area (such as an event rate ratio ≥ 3 and a cluster density ≥ 15 events/10,000 cubic meters) reach or exceed the warning value, the area will be designated as a danger zone. Based on this analysis, multiple areas within the mine have been identified as hazardous zones, and sealing or isolating measures have been implemented. Figure 8 shows the location of the designated danger zone, and the on-site photos are shown in Figure 9.
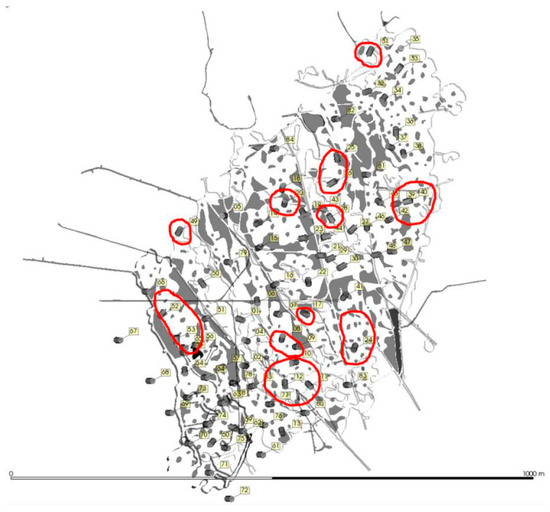
Figure 8.
Locations delineated as hazardous areas.
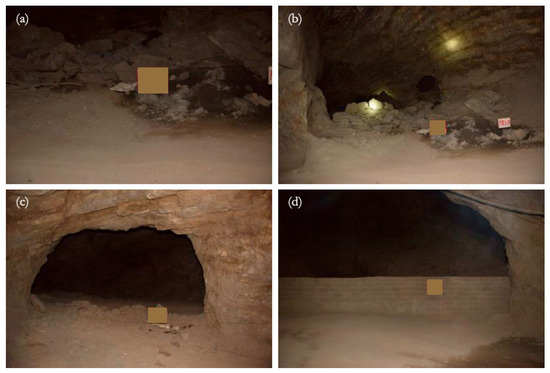
Figure 9.
On-site photos of the area designated as a ground pressure hazard zone.((a–d) are different measure).
Based on continuous analysis of ground pressure monitoring data, if the monitoring results of a hazardous area fall below the warning value again, it indicates that the area has returned to a stable period after experiencing stress concentration and ground pressure manifestation, and can be reorganized and restored as a mining area according to the production plan.
Based on the results of microseismic monitoring, we have designated areas that exceed the warning values as stress concentration zones and hazardous areas. In these areas, there may be a certain scale of roof collapse and collapse of mining pillars due to ground pressure. According to the analysis results of ground pressure monitoring, multiple areas have been designated as hazardous areas and sealed or fenced off. Figure 8 illustrates the delineated hazardous area, and the on-site photos are presented in Figure 9.
The location of the danger zone delineated above, based on further analysis of ground pressure monitoring data, if the monitoring results are below the warning value again, it indicates that the area has returned to a stable period after stress concentration and ground pressure manifestation, and can be reorganized and restored as a mining area according to the mining operation plan. Due to the gentle inclination and large planar distribution area of the Xianglushan tungsten mine, there is a great degree of freedom in the layout of the mining points. When a certain area is designated as a hazardous area, mining can be arranged in other non-hazardous areas to meet the production needs. These characteristics objectively provide a basis for the implementation of prevention and control measures for the goaf.
3.2. Filling Process
3.2.1. Filling Measures
Under the premise of limited filling capacity, in the eastern residual mining area, priority should be given to areas with the worst ground pressure status and the most favorable overall situation in the filling area, thereby forming a situation of controlling underground ground pressure. Furthermore, it plays a significant role in preventing and resolving chain roof collapse and pillar burst. Therefore, in order to meet the conditions of subsequent filling production in the west and residual mining in the east, the excess filling capacity should be prioritized for filling the goaf in the dangerous and urgently needed filling areas as much as possible (as shown in Figure 10). At the same time, efforts should be made to increase the coverage rate as much as possible, in order to eliminate the possibility of domino effect ground pressure disasters. At this point, the ground pressure situation in the extremely complex void can be significantly controlled and improved. Practice has shown that in the case of limited filling capacity, combining the research results of stress transfer and concentration laws, the technical method of scientifically and reasonably planning the filling sequence has effectively solved the governance problem of extremely large and complex voids. Therefore, it is even more necessary to use microseismic monitoring systems to adjust and optimize the filling location, process, and effect.
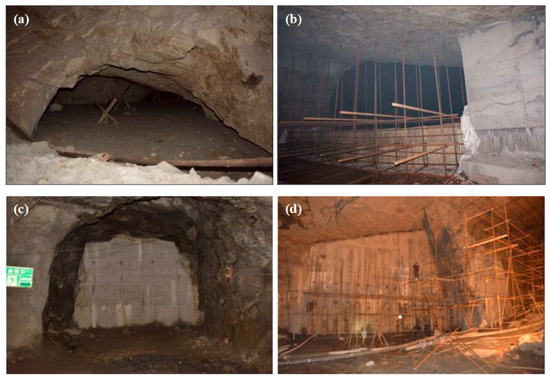
Figure 10.
Filling process. (a) Laying waste rocks, etc.; (b) construction process; (c) maintenance process; and (d) secondary maintenance of outer layer.
3.2.2. Filling Results
After the completion and operation of the Xianglushan tungsten mine filling system, the designed annual filling capacity of the filling system is 250,000 cubic meters. Figure 11a shows the planning and design scheme for the underground filling area, with priority given to the four pit mouths from Line 14 to Line 16 at the intersection of the east and west. Figure 11b,c shows the progress of filling in the filling area, indicating that a small portion of the area has been filled. As of the end of 2014, a total of approximately 324,000 m3 had been filled. Most areas are still in the early stages of pipeline layout and retaining wall construction. At present, the restriction and support effect of filling on roof deformation is still very limited. Figure 11b,c shows photos of on-site operations in the filling area.
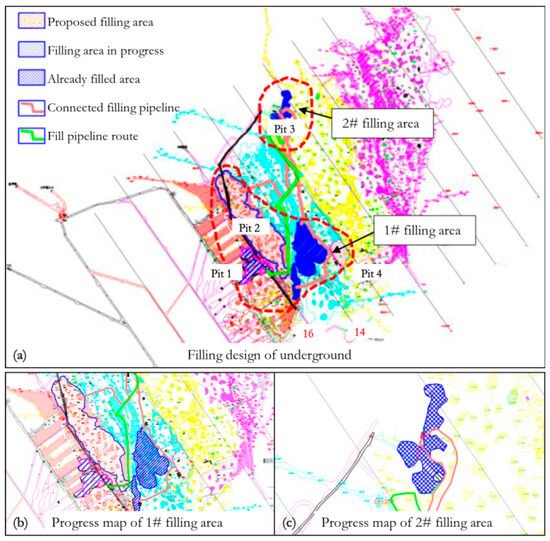
Figure 11.
Design, progress, and effectiveness of underground filling from 2013 to 2014.
3.3. Auxiliary Filling Measures
3.3.1. Reinforcement of Mining Pillars
The mine mainly adopts the method of reinforcing the pillars to improve the strength of the pillars and the stress state of the roof, thereby avoiding large-scale collapse of the roof. Especially in areas with high ground pressure, timely protection and reinforcement were carried out on the existing pillars, effectively controlling the large-scale collapse of the roof. In the process of recovering residual ore in the eastern mining area underground, for some key areas where damaged pillars occur, such as areas with a large amount of waiting to be mined, areas passed through by transportation channels, areas with large exposed roof areas, or hazardous areas delineated by ground pressure monitoring, anchor rods and reinforced concrete are poured to reinforce the hazardous pillars. This is to enhance the strength of the mining pillars, improve the safety deterioration of the goaf roof and mining pillars, and provide a safe working environment for underground production. The mine is reinforcing damaged pillars, as shown in the distribution diagram in Figure 12. The reinforcement case is shown in Figure 13.
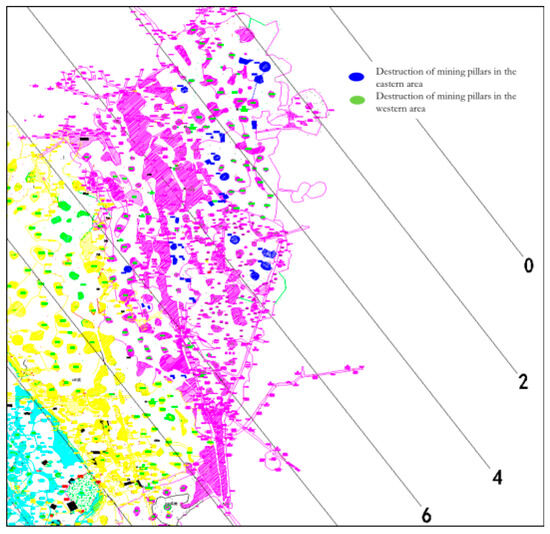
Figure 12.
Distribution of reinforced pillars at 5# pit mouth.
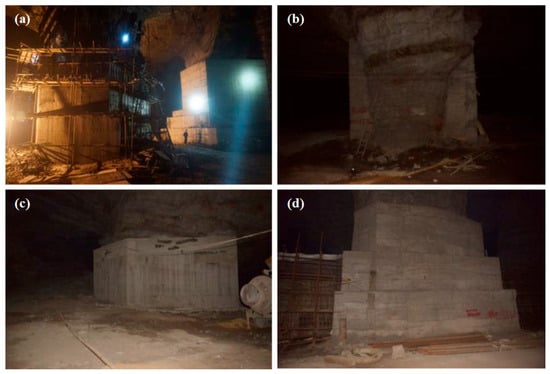
Figure 13.
Reinforcement and support measures for mining pillars. (a–d) represent different stages of support.
3.3.2. Artificial Pillar
The calculation of overlying rock pressure carried by mining pillars is performed using a comprehensive method that involves leaving irregular point pillars to support the roof during mining. Therefore, when analyzing the overlying rock pressure borne by artificial mining pillars, the equivalent area load method is employed to calculate the overlying rock pressure exerted by these pillars. The meaning of this method is that the overlying rock pressure borne by the mining pillar is proportional to the equivalent area it covers, as shown in Figure 14.
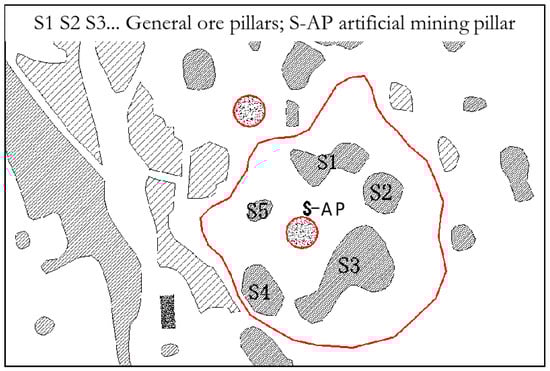
Figure 14.
Schematic diagram of calculation of overlying rock pressure borne by artificial pillars.
The location and size of the artificial pillars built in 2013 and 2014 are shown in Table 1, and their distribution in the underground mining area is shown in Figure 15.

Table 1.
Position and size of artificial pillars.
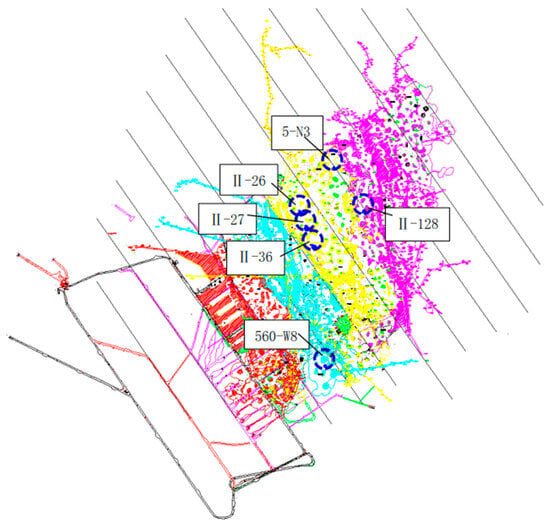
Figure 15.
Distribution map of newly built artificial pillars in 2013.
The photo of a typical artificial pillar built underground is shown in Figure 16.
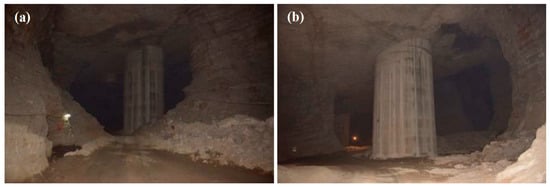
Figure 16.
Reinforcement and support measures for mining pillars. (a) Pillar a, (b) Pillar b.
3.3.3. Laying Mesh to Protect the Roof
In the one-step mining of the western mining area, anchor mesh support is required to protect the roof. The parameters of the anchor net support structure are as follows: anchor rod type and size: pipe seam anchor rod, length 1.8 m or 2.3 m, diameter 42 mm; anchor rod density: 1 m × 1 m; reinforcement diameter: 6 mm; reinforcement mesh laying density: 0.1 m × 0.1 m. The support effect of the roof of the mining room in the western mining area is shown in Figure 17a. In the eastern residual mining area, based on ground pressure monitoring results, anchor mesh roof protection was implemented in the unstable area of the local roof. The parameters of the anchor mesh roof protection were the same as those of the western mining area. The typical effect of anchor mesh roof protection on the roof is shown in Figure 17b.
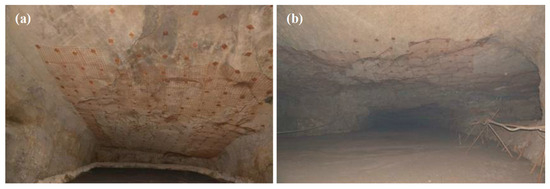
Figure 17.
Mine room anchor rod hanging net roof support. (a) Western mining area, (b) Eastern mining area.
3.3.4. Capacity Regulation
Before June 2013, the underground ore output remained at around 70,000 tons per month. After temporarily suspending production and limiting production in the eastern region, the total underground ore output has decreased to about 40,000 tons per month. Among them, the annual ore output of the eastern residual mining area has decreased to 16,000 tons/month. The number of residual mining sites in the eastern mining area has also significantly decreased: the number of residual mining sites has decreased from around 20 before production restrictions to around 7.
On 28 June 2013, a large-scale ground pressure disaster occurred at the intersection of the eastern and western mining areas underground, from the east fourth to east sixth positions of the four pit mouths, resulting in roof collapse and pillar collapse. Due to timely warnings, there were no personnel or equipment losses. After a large-scale ground pressure manifestation occurred in the area, the overall stress in the mine’s underground was readjusted, and the ground pressure manifestation ensued. According to the monitoring results of ground pressure, the mine has made production adjustments, including suspending production in the eastern residual mining area and reducing overall mine production, to prevent deterioration of the overall ground pressure situation. After about three months of adjustment, the underground ground pressure situation gradually eased.
The mine actively reduced its production capacity and implemented temporary shutdowns and production restrictions on the remaining mining areas in the east. This effectively slows down the degree and trend of underground ground pressure deterioration, temporarily restoring the underground ground pressure state to a balanced and stable state. This is beneficial for the next step of production adjustment and goaf management in the mine.
4. Verification of Microseismic Response/Parameters
4.1. Relationship Between Microseismic Activity and Filling
With the advancement of filling operations, microseismic activity exhibits significant spatiotemporal evolution characteristics, confirming the regulatory effect of filling on ground pressure. As shown in Figure 18, after May 2018, although the total production capacity of the mine remained stable, the triggering rate of total microseismic events began to show a downward trend. This phenomenon is negatively correlated with the cumulative increase in filling volume during the same period, indicating that the introduction of filling material effectively absorbs the concentrated stress around the goaf and suppresses the occurrence of new fractures.
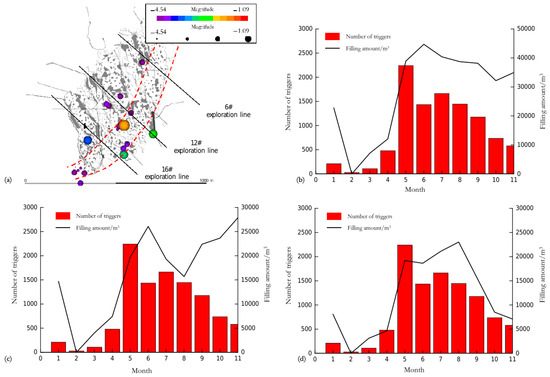
Figure 18.
Comparison of microseismic event activity and filling volume in 2018. (a) Distribution of microseismic events in 2018; (b) number of single-channel triggers and total filling volume; (c) single-channel trigger count and eastern filling volume; and (d) single-channel trigger count and western filling volume.
Figure 18a shows the main events of the microseismic monitoring system in 2018. The microseismic event rate is most active in September and October, reaching a maximum of 17 events per day, while other time periods generally have rates of 1–2 events per day. The distance between microseismic localization events ranges from 0 m to 560 m, with over 7% of event pairs having a distance distribution between 0 m and 20 m. This indicates that microseismic localization events exhibit a high degree of clustering, and they tend to occur in a stage of spatial clustering. In October, the maximum moment magnitude reached 0.3. Microseismic localization events generally occur between 0:00 and 06:00 every day.
More importantly, the spatial distribution of microseismic localization events reveals the local effects of filling. In areas that have already been filled (such as the western mining area), the density and energy of microseismic event clusters significantly decrease within three months after filling (for example, from 25 events per 10,000 cubic meters to 10 events). This indicates that the filling material provides structural support, promoting the transition of the rock stress state in the area from the unstable fracture stage to the stress relaxation stage. However, microseismic activity remains active at the boundaries of the filled area and in the unfilled area of the roof, which explains why the overall localization event rate has not decreased synchronously in the short term and highlights the complex impact of filling on local stress transfer.
Figure 18b–d shows the comparison trend of the total number of microseismic triggers per month and the total filling volume, western filling volume, and eastern filling volume in 2018. Overall, the single-channel triggering event rate underground is mainly affected by production operations and filling. As production progresses and the operation area is adjusted, the triggering number shows a trend of change, which is basically consistent with the production activities in the eastern region. As the filling process progresses, the single-channel event rate gradually decreases from May; however, the microseismic positioning event rate has significantly increased, indicating that the improvement effect of filling on overall ground pressure, especially local ground pressure, still needs to be improved. Its effect is mainly reflected in the wrapping, repair, and support of some pillars in the filling area, but it has no significant effect on roof pressure and pillar pressure in other areas.
4.2. Relationship Between Ground Pressure Manifestation and Filling
According to statistical data, out of the 11 recorded ground pressure phenomena in 2018, 8 (72.7%) were located in or adjacent to the area where the filling operation took place. At first glance, this discovery may seem contradictory to the positive effects of filling, but upon further analysis, it precisely validates the correctness of early warning and priority filling decisions based on microseismic monitoring.
The mechanism is that our closed-loop management system uses microseismic monitoring to identify high-risk stress concentration areas that are about to become unstable in advance, and based on this, lists them as priority targets for filling and treatment. Therefore, the concentrated occurrence of ground pressure in these areas is not due to ineffective filling, but rather because they themselves are the areas with the highest risk. The intervention of filling operations has changed the destructive process of these areas: microseismic monitoring shows that after filling, large energy events (>103 J) in these areas are replaced by a large number of small energy events (<102 J), indicating that the filling material promotes the rock mass to shift from severe sudden damage to slow and controllable stress adjustment. This effectively prevents catastrophic chain failures and resolves potential large-scale accidents into localized and controllable deformations.
Based on the analysis of ground pressure distribution and evolution laws, a comprehensive scientific plan for filling and controlling the goaf was developed. It mainly includes the eastern residual mining area and the western regular mining area. Figure 19a shows the spatial relationship between the location of ground pressure manifestation in 2018 and the filling area from 2013 to 2018. Among them, the blue area in the figure represents the area of filling operations in 2018. The green area represents the area of filling operations before 2018, and the solid red circle represents the location where ground pressure occurred in 2018.
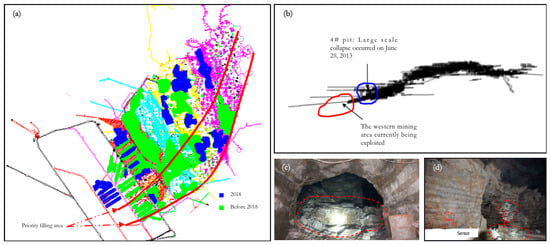
Figure 19.
Relationship between filling situation and ground pressure manifestation (a) Filling sequence diagram; (b) relationship between collapse accident and spatial location of mining area; (c) on-site collapse waste rock; and (d) pillar rupture.
After five years of continuous filling and treatment, the activity level of underground ground pressure has significantly improved, and the situation of ground pressure in the goaf has been controlled and improved. Compared with the same period in 2018, in the first half of 2019, with a year-on-year increase of 34% in ore production, the cumulative single-channel microseismic events only increased by 5.3%, the cumulative microseismic positioning events decreased by 5.9%, and the maximum magnitude of microseismic positioning events decreased from 0.3 to −0.2. Overall, the number and intensity of ground pressure manifestations are at historically low levels. This fully demonstrates that, from an overall underground perspective, the increase in mining disturbance is due to the continuous filling effect this year. At the same time, the quantity and intensity of microseismic activity are both decreasing or increasing very weakly year-on-year, and the ground pressure situation in the extremely complex void has been significantly controlled and improved.
4.3. Microseismic Event Parameters and Warning Mechanism
In the actual monitoring and early warning work on site, we have developed a ground pressure early warning management process for on-site use. When the microseismic monitoring data reaches the zone warning value, a warning message will be issued to relevant personnel and departments according to this process. Based on the production safety management mode of the mine itself, a ground pressure warning management process is proposed that enables mine management personnel and underground operators to respond in a timely and orderly manner, achieving the rapid and reasonable processing of warning information and underground ground pressure disasters.
Based on two years of monitoring data (2012–2014), we conducted a retrospective analysis of all recorded microseismic events and their subsequent ground pressure manifestations. Through ROC curve analysis, we determined the critical values of microseismic parameters that can most effectively distinguish between a “stable state” and an “unstable precursor,” and thus established a graded warning model (Figure 20).
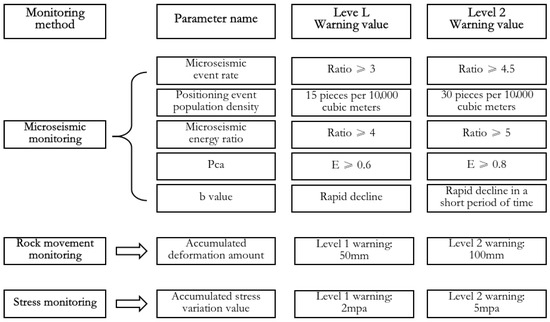
Figure 20.
Key indicators and thresholds for microseismic monitoring and early warning.
According to the microseismic monitoring system of the mine, record single-channel events and positioning events. Then, calculate the event rate ratio, energy, and concentration of localized events separately. When at least one parameter meets the set partition warning value, ground pressure warning information is issued. It should be noted that these three parameters are not mandatory, as a missing parameter may occur in ground pressure disaster monitoring and warning systems. If the event cluster density cannot be calculated due to the event’s small energy level, spatial positioning cannot be implemented. But this situation does not affect the above warning model. The process of issuing warning information for ground pressure disasters in Xianglushan tungsten mine is shown in Figure 20.
The scientific basis for this is that an event rate ratio of ≥3 indicates a rapid acceleration of rock fracturing activity, far exceeding the background noise level. A cluster density of ≥15 events/10,000 cubic meters indicates a high concentration of stress in the local space, which may be forming a macroscopic failure surface. If the energy ratio is ≥4, it reflects that the rock mass fracture scale is expanding. These three parameters, together, constitute a comprehensive instability criterion based on activity frequency, spatial concentration, and rupture intensity, and their effectiveness has been verified in the precursor to the collapse accident in 2013. This model enables prediction and early warning based on the mechanism of rock mass fracture, as described in the phenomenon.
4.4. Filling Volume and Microseismic Control
Due to historical mining reasons, as of 2012, the underground goaf has reached 2.9 million m3. In 2013, a filling station with an annual filling volume of 250,000 m3 was established in the mine. It takes a long time to treat the underground goaf through filling. In this process, in order to ensure a balance between production, filling, and ground pressure safety, it is necessary to arrange the sequence of underground filling scientifically and reasonably. The monitoring and analysis of underground ground pressure status is one of the important reference materials for determining the filling sequence. Based on the production operation plan, considering which areas underground are currently stress hazard areas and active ground pressure areas, priority filling can be given to these areas, which can effectively slow down the deterioration of underground ground pressure and maximize the role of limited filling capacity in controlling the goaf.
After completing the surface filling preparation station, surface filling pipeline, and underground filling facilities, the mine underwent debugging.
With the trial operation, the filling of the underground goaf officially began in April 2013. As of 2018, approximately 1.56 million cubic meters of filling have been completed. The photos of the production process for filling retaining walls and the effect after filling the underground goaf are shown in Figure 21.
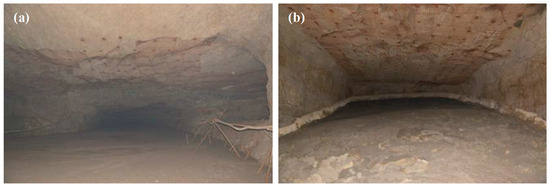
Figure 21.
Underground filling effect diagram: (a) Point 1; (b) Point 2.
5. Discussion
While the stress behavior of backfill is indeed material-dependent, the consistent correlation observed between filling operations and reduced microseismic activity across different mining areas provides robust evidence for the effectiveness of the integrated monitoring-control approach, independent of specific material types.
The microseismic verification method introduced in this study offers substantial advantages over conventional monitoring techniques, which often rely on isolated parameters, such as single-point stress or displacement, and fail to capture the holistic geomechanical response in real time [30]. By integrating microseismic monitoring with backfill management, this approach establishes a dynamic feedback loop, enabling not only real-time assessment of ground control effectiveness but also strategic adjustments to filling operations. This marks a critical shift from passive observation to active control, overcoming key limitations in traditional methods that lack closed-loop decision support.
Furthermore, the multi-channel sensor network delivers high-resolution three-dimensional diagnostic capability, accurately locating microseismic event clusters within critical structural zones such as the syncline abutment. This offers comprehensive insights for delineating hazards and surpasses the spatial ambiguity typical of conventional microseismic systems [31]. The quantitative early-warning mechanism developed in this study, which integrates event rate, energy ratio, and cluster density, has proven effective in forecasting collapse incidents. This represents a transition from phenomenological description to mechanism-based prediction, aligning with recent calls in the literature for data-driven and physics-informed risk evaluation in deep mining [24].
Nevertheless, certain limitations should be acknowledged. The initially weak correlation observed between microseismic event rate and backfill volume suggests that the current warning model requires further refinement. Incorporating multi-physics monitoring inputs, such as stress field data and rock fracture simulation results, could substantially enhance predictive accuracy and prospective applicability. Additionally, the analysis revealed limitations in the effectiveness of backfilling in regulating localized ground pressure, particularly roof stress concentration—an issue also reported in recent studies on hard-rock mines [32]. Finally, as the proposed model was developed and validated under the specific geological and mining settings of the Xianglushan tungsten mine, its generalizability to other contexts necessitates further verification through multi-site case studies.
Despite these limitations, the proposed methodology offers an integrated and proactive framework for ground pressure management during residual ore recovery. Future efforts will focus on enhancing the model with multi-source monitoring data and extending validation across varied geological and mining environments to improve robustness and broad applicability.
6. Conclusions
- (1)
- The closed-loop ground pressure control system, based on microseismic monitoring, significantly improves the safety of residual ore recovery, and its effectiveness has been verified through a multi-parameter quantitative evaluation. This study constructed a closed-loop ground pressure management system of “monitoring warning control feedback”, which achieved dynamic identification and warning of high-risk areas through key parameters such as microseismic event rate, energy ratio, and event cluster density (event rate ratio ≥ 3, cluster density ≥ 15 events/10,000 cubic meters, energy ratio ≥ 4). Under the condition of a 34% year-on-year increase in ore production in 2019, the number of localized events decreased by 5.9%, and the maximum magnitude decreased from 0.3 to −0.2, systematically demonstrating the quantitative effect of this system in suppressing the intensity of ground pressure activity.
- (2)
- Filling treatment plays a significant role in overall ground pressure control, but its control effect on local roof pressure is limited, and it needs to be combined with collaborative support strategies. Although the cumulative filling volume reached 1.56 million cubic meters (2013–2018) and significantly improved the surrounding rock stress environment, 72.7% of the ground pressure manifestation is still located in the filling area or its adjacent areas, indicating that the bearing capacity of the filling body on the roof and non-filling area pillars is limited. In the future, collaborative measures such as anchor mesh support (with an anchor density of 1 × 1 m) and artificial pillars (with sizes ranging from 2.8 × 2.8 to 7.0 × 7.0 m) should be implemented to enhance the stability of local structures.
- (3)
- Production capacity regulation and regional collaborative governance are key strategies for mitigating the risks associated with dynamic ground pressure. The eastern residual mining area has significantly reduced the frequency of ground pressure activities through capacity regulation (reducing monthly output from 70,000 tons to 40,000 tons) and control of the number of mining points (reducing from 20 or more to 7). The western mining area employs the “one mining, one filling” orderly mining and step-by-step filling technology, ensuring safe and efficient mining operations. Research has shown that the regional priority filling strategy combined with microseismic feedback can optimize the efficiency of limited filling capacity.
- (4)
- Artificial pillars and comprehensive management systems play a core role in the safe mining of complex goafs. The application of artificial mining pillars increases support strength by 23–40%, and anchor mesh support increases roof stability by 35%. By adhering to the principle of “zone priority and dynamic adjustment” and combining microseismic feedback to optimize the filling sequence, an integrated technical system of “prevention control strong alarm” has been formed, providing quantifiable technical paths and methodological support for similar complex residual mining projects.
Author Contributions
Methodology, C.L. and G.L.; Software, C.Z. and Y.H.; Resources, C.L.; Data curation, C.Z. and G.L.; Writing—original draft, C.L. and G.L.; Writing—review & editing, C.Z. and Y.H.; Visualization, G.L.; Project administration, C.Z. and Y.H.; Funding acquisition, C.L. and Y.H. All authors have read and agreed to the published version of the manuscript.
Funding
The authors would like to acknowledge State Key Laboratory Special Programs of China Minmetals Corporation (2024GZKJ04) and the National Natural Science Foundation of China (52274249, 52334003).
Institutional Review Board Statement
Not applicable.
Informed Consent Statement
Not applicable.
Data Availability Statement
The raw data supporting the conclusions of this article will be made available by the authors on request.
Conflicts of Interest
Authors Chang Liu, Yinghua Huang and Guanying Lyu were employed by the company Changsha Institute of Mining Research Co., Ltd. The remaining authors declare that the research was conducted in the absence of any commercial or financial relation-ships that could be construed as a potential conflict of interest.
References
- Zhou, L. Towards sustainability in mineral resources. Ore Geol. Rev. 2023, 160, 105600. [Google Scholar] [CrossRef]
- Nassani, A.A.; Aldakhil, A.M.; Zaman, K. Ecological footprints jeopardy for mineral resource extraction: Efficient use of energy, financial development and insurance services to conserve natural resources. Resour. Policy 2021, 74, 102271. [Google Scholar] [CrossRef]
- Xu, H.; Chen, G.; Sarwar, B.; Shahzad, I. Sustainable development and mineral resource extraction in China: Exploring the role of mineral resources, energy efficiency and renewable energy. Resour. Policy 2024, 90, 104703. [Google Scholar] [CrossRef]
- Zhou, Z.; Huang, Y.; Zhao, C. Microseismic Monitoring and Disaster Warning via Mining and Filling Processes of Residual Hazardous Ore Bodies. Minerals 2024, 14, 948. [Google Scholar] [CrossRef]
- Yin, Y.; Yang, S.; He, Y.; Pan, J.; Guo, Z.; Fan, J.; Wang, Z. Stability assessment of surrounding rock in downward mining route supported by slab-wall backfill structure. Sci. Rep. 2024, 14, 13706. [Google Scholar] [CrossRef] [PubMed]
- Liu, X.; Fan, K.; Wang, Y.; Wang, W.; Chen, C. Model test research on ground movement law of steeply dipping discontinuities in metal mines. Rock Soil Mech. 2024, 45, 1412–1422. [Google Scholar]
- Li, J.; Bai, J.W.; Feng, G.R.; Wang, S.Y.; Zhao, H.C.; Mi, J.; Pan, R.-K.; Shi, X.-D.; Ma, J.-B. Compressive performance of innovative reinforced pillars in closed/abandoned mines. J. Cent. South Univ. 2024, 31, 2780–2793. [Google Scholar] [CrossRef]
- Yu, Y.; Deng, K.-Z.; Luo, Y.; Chen, S.-E.; Zhuang, H.-F. An improved method for long-term stability evaluation of strip mining and pillar design. Int. J. Rock Mech. Min. Sci. 2018, 107, 25–30. [Google Scholar] [CrossRef]
- Zhou, Z.; Zhao, Y.; Cao, W.; Chen, L.; Zhou, J. Dynamic Response of Pillar Workings Induced by Sudden Pillar Recovery. Rock Mech. Rock Eng. 2018, 51, 3075–3090. [Google Scholar] [CrossRef]
- Zhou, K.P.; Du, X.H. Study on Stability of Residual Ore Recovery Based on Coupling of 3DMINE-MIDAS/GTS-FLAC3D. China Saf. Sci. J. 2011, 21, 17–22. [Google Scholar]
- Qiu, X.Y.; Chen, J.Y.; Shi, X.Z.; Zhang, S.; Zhou, J.; Chen, X. Deformation prediction and analysis of underground mining during stacking of dry gangue in open-pit based on response surface methodology. J. Cent. South Univ. 2018, 25, 406–417. [Google Scholar] [CrossRef]
- Li, J.; Zhang, H.; Zhang, B.; Zhai, Y. 3-D simulation analysis for the pillar and pressure relief effects in the empty field sharp-inclining mining structure. J. Saf. Environ. 2018, 18, 101–106. [Google Scholar] [CrossRef] [PubMed]
- Wang, D.; Dong, Q.; Li, Z.; Chi, A.; Feng, X.; Liu, B. Research and Practice on the Flotation Process for Dealing with Deeper Oxidative Low-grade Residual Ore from Downhole Upper Middle of Linglong Gold Mine. Gold Sci. Technol. 2013, 21, 87–90. [Google Scholar]
- Yao, H.; Cai, L.; Liu, W.; Qin, W.Q.; Jiao, F.; Yang, C.R. Current status and development of comprehensive utilization of waste rock in metal mines in China. Chin. J. Nonferr. Met. 2021, 31, 1649–1660. [Google Scholar]
- Yu, C.; Li, H.; Jia, X.; Li, Q. Improving resource utilization efficiency in China’s mineral resource-based cities: A case study of Chengde, Hebei province. Resour. Conserv. Recycl. 2015, 94, 1–10. [Google Scholar] [CrossRef]
- Jiang, L.C.; Jiao, H.Z.; Wang, Y.D.; Wang, G.G. Comprehensive safety factor of roof in goaf underdeep high stress. J. Cent. South Univ. 2021, 28, 595–603. [Google Scholar] [CrossRef]
- Liu, Q.; Lin, B.; Zhou, Y.; Li, Y. Porosity model of the goaf based on overlying strata movement and deformation. Environ. Earth Sci. 2022, 81, 214. [Google Scholar] [CrossRef]
- Wang, Z.; Sun, W.; Yang, S.; Tang, Y.; Liu, P. Asymmetrical distribution of roof microseismicity and its application to roof control of a deep longwall panel. J. Appl. Geophys. 2023, 215, 105142. [Google Scholar] [CrossRef]
- Yang, K.; Chen, C.; Xia, K.; Wang, T.; Sun, Y. Stability analysis and failure mechanism of the hanging wall in a sublevel caving mine based on microseismic monitoring. Bull. Eng. Geol. Environ. 2024, 83, 259. [Google Scholar] [CrossRef]
- Gu, W.; Yang, B.; Pan, H.; Song, T. Research and engineering practice on space characteristics of gangue slurry filling. Sci. Rep. 2023, 13, 22006. [Google Scholar] [CrossRef]
- Yang, G.; Yang, X.; Zhang, J.; He, M.; Hao, Z.; Yang, F.; Shao, J. Effect of Roof Cutting Technology on Broken Roof Rock Bulking and Abutment Stress Distribution: A Physical Model Test. Rock Mech. Rock Eng. 2024, 57, 3767–3785. [Google Scholar] [CrossRef]
- Salmi, E.F.; Sellers, E.J. A Rock Engineering System Based Abandoned Mine Instability Assessment Index with Case Studies for Waihi Gold Mine. Eng. Geol. 2022, 310, 106869. [Google Scholar] [CrossRef]
- Zhang, T.; Yang, Y.-L. Occurrence characteristics and treatment technologies of mine goaf in China: A comprehensive review. Environ. Earth Sci. 2024, 83, 441. [Google Scholar] [CrossRef]
- Zhou, Z.; Wang, S.; Cai, X.; Huang, Y.; Zhao, C. Control for rock dynamic disasters induced by blasting mining disturbance under heterogeneous condition in deep metal mines. Chin. J. Nonferr. Met. 2025, 35, 306–322. [Google Scholar]
- Feng, X.-T.; Liu, J.; Chen, B.; Xiao, Y.; Feng, G.; Zhang, F. Monitoring, Warning, and Control of Rockburst in Deep Metal Mines. Engineering 2017, 3, 538–545. [Google Scholar] [CrossRef]
- Liu, J.P.; Si, Y.T.; Wei, D.C.; Shi, H.X.; Wang, R. Developments and prospects of microseismic monitoring technology in underground metal mines in China. J. Cent. South Univ. 2021, 28, 3074–3098. [Google Scholar] [CrossRef]
- Zhou, Z.; Huang, Y.; Zhao, C. Distribution Law of Mine Ground Pressure via a Microseismic Sensor System. Minerals 2023, 13, 649. [Google Scholar] [CrossRef]
- Wei, X.; Su, W.; Du, C. Evaluation of relationship between nonmetallic mineral resources production and sustainable development. Resour. Policy 2024, 88, 104428. [Google Scholar] [CrossRef]
- Pang, L.; Liu, W.; Zheng, Q.; Du, Y.; Meng, X.; Li, X. Evaluation and analysis of metal mine filling based on numerical simulation and actual measurement. Environ. Earth Sci. 2021, 80, 505. [Google Scholar] [CrossRef]
- Liu, C.; Jiang, Q.; Xin, J.; Wu, S.; Liu, J.; Gong, F. Shearing Damage Evolution of Natural Rock Joints with Different Wall Strengths. Rock. Mech. Rock. Eng. 2022, 55, 1599–1617. [Google Scholar] [CrossRef]
- Peng, S.S.; Cheng, J.; Du, F.; Xue, Y. Underground ground control monitoring and interpretation, and numerical modeling, and shield capacity design. Int. J. Min. Sci. Technol. 2019, 29, 79–85. [Google Scholar] [CrossRef]
- Ma, K.; Xie, H.; Ren, F.; Chang, Y. Rockburst early-warning method based on time series prediction of multiple acoustic emission parameters. Tunn. Undergr. Space Technol. 2024, 153, 106060. [Google Scholar] [CrossRef]


Disclaimer/Publisher’s Note: The statements, opinions and data contained in all publications are solely those of the individual author(s) and contributor(s) and not of MDPI and/or the editor(s). MDPI and/or the editor(s) disclaim responsibility for any injury to people or property resulting from any ideas, methods, instructions or products referred to in the content. |
© 2025 by the authors. Licensee MDPI, Basel, Switzerland. This article is an open access article distributed under the terms and conditions of the Creative Commons Attribution (CC BY) license (https://creativecommons.org/licenses/by/4.0/).