Abstract
This study estimates the number of electric vehicles (EVs) and charging stations in Sakarya Province, Türkiye, for 2030 using advanced artificial intelligence time series methods and statistical approaches. The novelty of the work lies in the application of hyperparameter-optimized LSTM and GRU models alongside Multiple Linear Regression (MLR) to a regional dataset, enabling accurate, data-driven forecasting for regional EV planning. Performance was evaluated using multiple metrics, including R2, MAE, MSE, DTW, RMSE, and MAPE, with the GRU model achieving the highest reliability and lowest errors (R2 = 0.99, MAE = 0.3, MSE = 2.9, DTW = 123.2, RMSE = 3.1, MAPE = 2.8%) under optimized parameters. The predicted EV counts and charging station numbers from GRU informed a neighborhood-level allocation of charging stations using Google Maps API, considering local population ratios. These results demonstrate the practical applicability of deep learning for regional infrastructure planning and provide a replicable framework for similar studies in other provinces.
1. Introduction
Recently, as the struggle against global warming has gained attention, electric vehicles (EVs) have been suggested as a substitute for conventional fossil-fuel-powered vehicles [1,2,3]. In transportation, electricity is the first energy source that comes to mind for preventing CO2 emissions due to its zero-emission characteristic [4,5]. The goal is to promote the adoption and widespread use of electric vehicles in transportation to prevent global warming [6,7,8]. Expanding charge infrastructure is critical for the large-scale adoption of electric vehicles [9,10,11]. It is crucial not only to increase the number of installed charging stations but also to position them in the right locations [12,13,14]. When determining the placement of charging stations, the supply-demand balance is taken into account, and the existing network is utilized more efficiently [15,16,17]. Having a sufficient number of charging stations also helps increase the number of electric vehicles [18]. An adequate number of strategically placed charging stations alleviates the driver’s range anxiety [19]. Especially during long-distance travel, the driver should not experience difficulties accessing a charging station. Therefore, even though the use of electric vehicles is being encouraged, the limited number of charging stations hinders their use [20,21]. Along with increasing the number of charging stations, studies on their placement to ensure easy access for drivers are of great importance [22]. Additionally, the charging infrastructure must be supported by renewable energy resources, considering the existing grid and load conditions [9,23,24]. This will contribute significantly to achieving the zero-emission target [25]. Utilizing solar energy to establish charging stations is particularly suitable from both economic and environmental viewpoints [26].
1.1. Related Studies
Numerous academic studies have been conducted on electric vehicle charging infrastructure, primarily focusing on charging station location optimization, energy management, and demand forecasting. Many studies have investigated the optimal placement of charging stations to minimize accessibility challenges for drivers and to enhance grid efficiency. For example, several works have emphasized the importance of considering driver behavior and travel patterns in determining optimal locations [27,28,29]. These studies generally focus on increasing charging demand and propose a variety of optimization algorithms to address the issue of insufficient charging infrastructure. In addition, some researchers have applied artificial intelligence and deep learning approaches to improve spatial balance and reduce installation costs [30,31]. While most of these studies focus on city-level optimization, this study differs by performing neighborhood-scale modeling, incorporating local population density and energy demand into the analysis.
Other researchers have emphasized the integration of renewable energy sources into charging infrastructure planning. Studies in this domain have proposed charging stations powered by solar and wind energy to minimize additional loads on existing grids and support sustainable transportation [32,33,34,35]. However, these approaches generally overlook the population-based scalability of charging infrastructure. In this study, green energy-supported charging stations are integrated into the prediction model, aligning spatial planning with sustainability objectives.
Another crucial line of research focuses on charging demand forecasting, which is essential for planning future charging station networks. Prior works have utilized machine learning and deep learning models such as LSTM and GRU to estimate energy demand and optimize capacity [32,36,37,38,39,40]. While these studies demonstrated high predictive accuracy, they were mostly conducted at national or metropolitan levels. In contrast, the present study provides fine-grained, region-specific forecasts for Sakarya Province, thereby addressing a gap in localized EV infrastructure research.
In addition to spatial optimization and forecasting, several studies have investigated energy management and grid efficiency in EV charging systems. These works consider regional characteristics such as population, current grid capacity, and urbanization levels when determining station locations [41,42,43,44,45,46]. However, most of these studies rely on statistical regression or heuristic models that lack temporal learning capabilities. This study, therefore, integrates deep learning models (LSTM and GRU) with MLR in a unified framework, offering both high prediction accuracy and interpretability, a combination rarely seen in regional EV studies.
Furthermore, apart from deep learning, backpropagation neural networks have been widely used in related energy optimization and forecasting studies. For example, the work titled “Collaborative optimization of fuel economy and battery life for plug-in hybrid electric buses considering traffic condition” applied BP networks to optimize fuel economy and battery performance under varying traffic conditions [47]. Since LSTM is also trained through a modified backpropagation process for recurrent architectures, this study builds upon similar principles while enhancing temporal forecasting capabilities through gated memory mechanisms.
In summary, while extensive research has been conducted on EV charging infrastructure, there remains a clear lack of data-driven, region-specific analyses that combine statistical and deep learning methods. This study fills that gap by applying optimized LSTM, GRU, and MLR models to localized datasets for Sakarya Province, presenting a scalable methodology that can be adapted for other regions with limited data availability.
This study addresses multiple topics simultaneously, making it a unique contribution. Quantitative forecasts for future years provide projections for charging stations and electric vehicle load estimates. These 2030 projections will contribute to energy management by enabling neighborhood-level distribution and positioning of grid and renewable energy sources. No studies have been conducted on charging station planning or load projections for the selected application area. In addition to artificial intelligence-based time series LSTM and GRU models, Multiple Linear Regression methods were incorporated in this study.
1.2. Study Contributions and Structure
While our study does not propose novel forecasting methods, it provides a region-specific application of well-established models (LSTM, GRU, and MLR) to the context of Sakarya Province. To our knowledge, no prior research has offered systematic, data-driven projections of electric vehicle adoption and charging infrastructure development in this region. This study aims to fill this gap, providing actionable insights for local policymakers and urban planners, and demonstrating how standard forecasting models can be effectively applied to small, regional datasets. By doing so, it highlights the practical relevance of applying established machine learning techniques in local transportation planning.
The contributions of this study are summarized as follows:
- Load Estimation: Prediction results for the count of electric vehicles and charging stations in Sakarya Province in 2030 were obtained using LSTM, GRU, and MLR methods.
- Energy Management: The Demand forecasts obtained were evaluated to increase energy efficiency in the charging infrastructure and meet user demand, thus enabling conclusions to be drawn regarding the effective operation of charging stations.
- Charge Infrastructure Location: According to the prediction results, a neighborhood-based distribution of charging stations was implemented, thereby developing a regionally applicable model for planning the charging infrastructure according to future needs. This approach differs from the existing studies in the literature in terms of user access and energy sustainability.
The structure of this article is as follows: Section 2 describes the dataset used in the study. Section 3 explains the methodology, including the LSTM, GRU, and MLR models applied for forecasting. Section 4 presents the evaluation criteria used to assess model performance. Section 5 details the spatial distribution of charging stations. Section 6 provides the Findings and Analysis, while Section 7 summarizes the overall results.
2. Dataset
The data used in the study was collected from two different sources. First, information regarding charging stations in Sakarya Province was obtained through the Şarj\@TR application, a freely accessible platform provided by the Energy Market Regulatory Authority (EMRA). Within this scope, the locations of the stations, their total numbers, whether they are green energy or grid-connected, and AC/DC charging types were recorded. This provided a detailed overview of the existing charging infrastructure across the province. Figure 1 shows the change in the count of charging stations in Sakarya Province and the provinces considered in the study.
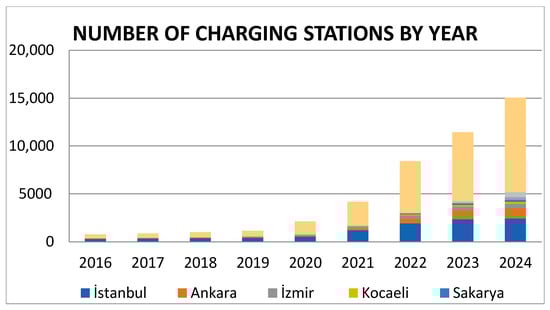
Figure 1.
Number of charging stations by year.
Figure 2 shows the existing charging stations in Sakarya Province. The green ones indicate charging stations powered by renewable energy resources, while the blue ones indicate grid-connected charging stations.
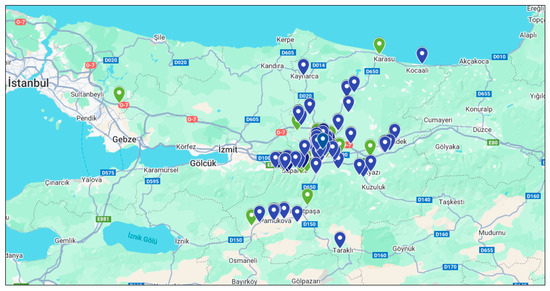
Figure 2.
Current charging stations in Sakarya Province.
Secondly, based on data requested from the Turkish Statistical Institute (TSI), information on the change in the number of electric vehicles in provinces across Türkiye over the years was obtained. These data were used as the basic input to forecast future vehicle numbers specifically for the province of Sakarya. Figure 3 illustrates the change in the count of electric vehicles by year for Sakarya Province and other provinces considered in this study.
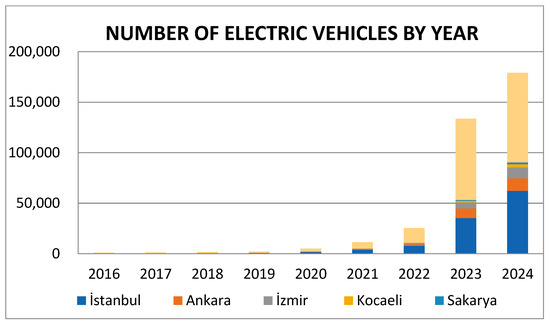
Figure 3.
Number of electric vehicles by year.
Data Preprocessing
This study obtained the count of electric vehicles and charging stations within city limits using the prediction results of LSTM and GRU models. Data on electric vehicles and charging stations from previous years were used to train the models. LSTM and GRU models were trained using electric vehicle data from 2008 to 2024 (up to September), obtained from TSI and charging station data obtained from the EMRA. Eighty percent of the charging station and electric vehicle counts for Sakarya, Kocaeli, Yalova, Bursa, İzmir, İstanbul, Ankara, Düzce, Edirne, and Turkey as a whole were used for model training, while 20% were used as a test set. After completing the training of the models based on these data, their prediction performance was assessed using the testing data.
After determining the count of charging stations, both existing and estimated stations were mapped. Figure 2 shows the placement of charge stations in Sakarya Province based on data shared by the EMRA. There are currently 143 charging stations in Sakarya. Location information (latitude and longitude) and charging station names for these stations were recorded with a total of approximately 286 rows and 2 columns, amounting to 572 data entries. According to TSI data, there are currently 1268 electric vehicles in Sakarya Province. Vehicle distribution data is only provided at the provincial level and not at the neighborhood level. Therefore, population ratios were taken into account to calculate the number of vehicles at the neighborhood level in the distribution of electric vehicle-charging stations.
According to TSI data, 2055 data entries were made, consisting of 411 rows and 5 columns, including the location (latitude and longitude), population, and names of 412 neighborhoods in Sakarya Province, as well as the percentage of the population relative to the total population of the province. This study estimated the count of electric vehicles and charging stations in Sakarya Province for the year 2030. However, since the number of electric vehicles and charging stations for previous years was not available at the neighborhood level, the estimates made for the province as a whole were scaled down to the neighborhood level based on population ratios.
3. Materials and Methods
This study focuses on estimating the count of electric vehicles and charging stations in Sakarya Province by 2030. Supervised learning methods were used in the estimation process, as target variables were included in the model along with data from previous years. Long Short-Term Memory (LSTM) and Gated Recurrent Unit (GRU) architectures were preferred in the study to capture the nonlinear and multivariate structure of time series. Compared to traditional time series methods, these models have the capacity to learn long-term dependencies from the past and produce forecasts with higher accuracy for the future. The GRU model was also used comparatively in the study because it provides similar performance to LSTM while requiring fewer parameters and having lower computational costs. Deep learning-based methods are frequently preferred in the literature, especially for modeling multivariate and structurally complex time series. In this context, data from not only Sakarya Province but also neighboring provinces (Kocaeli, Düzce, Bilecik and Bolu) and Istanbul, Ankara, and Izmir Provinces were included in the model. This ensured regional effects were considered and enhanced the reliability of the forecasts. Furthermore, outputs from artificial intelligence models were compared to estimates obtained through Multiple Linear Regression analysis, thereby evaluating the performance of different methodologies. The primary objective of all models utilized in the study is to estimate the count of electric vehicles and charging stations in Sakarya up to 2030 based on historical data and to provide scientific contributions to support future infrastructure planning through these forecasts.
Although this study was conducted specifically in Sakarya Province, the approach is not limited to this province alone. With the rise in the utilization of electric vehicles, the proper planning of charge installations has become essential for every province. Therefore, Sakarya Province was chosen as a study to demonstrate the applicability of the methods, and the same methods can be easily adapted to other provinces. The general process of an overview of the study is provided in the workflow chart in Figure 4.
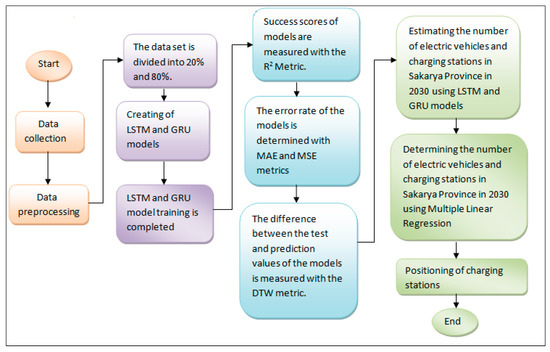
Figure 4.
Workflow chart of the study.
In this study, LSTM, GRU and Multiple Linear Regression methodologies were used to estimate the count of electric vehicles and charging stations in Sakarya Province in 2030. The study process was carried out in four main stages: (1) data collection and preprocessing, (2) model setup, (3) evaluation of the results obtained, and (4) obtaining and positioning the 2030 Sakarya Province forecast results.
The main stages of the study can be presented as follows:
- Data Collection and Preprocessing:
- Actual data was collected.
- Missing observations were adjusted in a way that would not negatively affect the existing data.
The data were standardized to the 0–1 range and transformed using min–max normalization, as shown in Equation (1):
In the equation, X represents each data point, while Xmax and Xmin represent the largest and smallest data points, respectively.
- The data has been reformatted for models in the Python environment.
- The dataset has been divided into two subsets: 80% for training and 20% for testing.
- 2.
- Model Setup:
- Deep learning-based LSTM and GRU time series models were created.
- A Multiple Linear Regression model was also set up for comparison purposes.
- The three methods were trained separately to generate forecasts for Sakarya Province up to the year 2030.
- 3.
- Evaluation of Model Performance:
- Model performance was measured using the R2, MSE, MAE, and DTW metrics.
- 4.
- Obtaining Results and Positioning:
- Predictions for electric vehicles and charging stations in Sakarya Province for the year 2030 were obtained using LSTM, GRU, and Multiple Linear Regression models.
- The charging station prediction values obtained using the GRU model were positioned on a map-based application at the neighborhood level.
- In the distribution process, the ratio of each neighborhood’s population to the total population of Sakarya Province was taken into account.
- Charging stations were classified according to usage scenarios:
- AC type: In long-term parking areas such as schools, hospitals, and similar locations.
- DC type: At locations requiring fast charging, such as highways and gas stations.
- Green charging station: In sustainability-focused areas.
3.1. LSTM Model
In this study, LSTM (Long Short-Term Memory) networks were employed to predict the number of electric vehicles and charging stations in Sakarya Province. LSTM is a type of recurrent neural network capable of learning long-term dependencies in time series data. The model’s information flow is controlled via three gates: input, forget, and output gates. These gates regulate which information is updated, retained, or output at each time step. The model was trained using historical EV and charging station data, with hyperparameters (units, learning rate, dropout, batch size, and epochs) optimized to improve prediction accuracy. The final outputs of the LSTM were used to generate forecasts for 2030, which were subsequently compared to GRU and MLR predictions.
Figure 5 shows the basic block structure of LSTM. Here, f(t) represents the forget gate, i(t) represents the input gate, and o(t) represents the output gate.
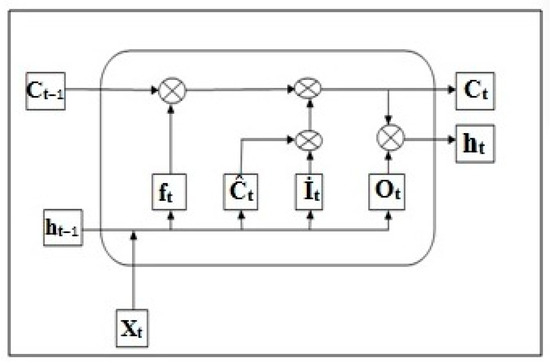
Figure 5.
LSTM block diagram.
The input gate regulates which information is incorporated into the model. At this stage, the sigmoid function decides which information will be updated, while the tanh layer produces new nominal data. The output of the input gate is shown in Equation (2).
The new candidate cell state is generated using the tanh function and is expressed by Equation (3).
The forget gate determines which information from the prior steps will be retained or discarded. The output of this gate is given in Equation (4).
The output of the input gate i (t) is combined with the candidate cell state Ĉt to perform the update. Simultaneously, the cell state from the previous time step, Ct−1, is evaluated together with the forget gate to obtain the new cell state. This operation is represented by Equation (5).
The output port is responsible for producing the final output of the model. The activation of the output port is given in Equation (6).
Finally, the cell state Ct is scaled between −1 and 1 by passing through the tanh function, and the final memory state h(t) is acquired through the effect of the output gate. This situation is shown in Equation (7).
In these equations, W represents the weight matrix, b represents the bias term, x (t) represents the current input, and ht−1 represents the state at the previous time step.
3.2. GRU Model
GRU (Gated Recurrent Unit) networks were used to predict the number of electric vehicles and charging stations in Sakarya Province. The GRU takes historical EV and charging station data as input and generates predictions at each time step. To improve prediction accuracy, hyperparameters including units, learning rate, dropout, batch size, and epochs were optimized. The resulting outputs were used to produce forecasts for 2030 and were compared to predictions from LSTM and MLR models. Figure 6 shows the GRU model.
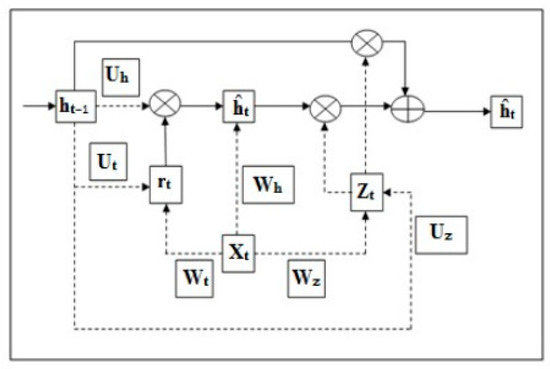
Figure 6.
GRU block diagram.
The update gate establishes what part of the past state will be preserved and is defined by Equation (8).
The reset gate determines what amount of the previous information will be forgotten. The reset gate is shown in Equation (9).
The candidate cell state is calculated as the integration of the current input and the earlier state affected by the reset gate. This process is shown in Equation (10).
Finally, the final hidden state is obtained by balancing the earlier state and the new candidate state using the update gate. This operation is represented by Equation (11).
In the equation, W represents the weight matrix, b represents the bias term, x(t) represents the current input, and ht−1 represents the hidden state.
3.3. Multiple Linear Regression
In this study, the Multiple Linear Regression (MLR) method was employed to predict the number of electric vehicles and charging stations in Sakarya Province. MLR generates predictions based on historical EV and charging station data using linear relationships. The resulting forecasts were produced for 2030 and compared to the predictions obtained from LSTM and GRU models.
The general model of MLR is expressed by Equation (12):
In this Equation:
- Y is the dependent variable at time t (count of electric vehicles and charging stations in Sakarya). A separate Multiple Linear Regression was performed for each dependent variable.
- X is the independent variable: year (trend effect), number of electric vehicles/stations in provinces neighboring Sakarya and data from major cities such as Istanbul, Ankara, and Izmir.
Multiple Linear Regression Application
In this study, in addition to LSTM and GRU models, the MLR method was applied for comparative analysis. The regression model enables the explanation of the total installed charging stations and electric vehicles in Sakarya Province through independent variables. The model was built using the Python programming language with “sklearn”. The data was scaled, and the model’s prediction performance was assessed using R2, MAE, and MSE with an 80–20% training—testing split. The Pandas library was used for reading dataset, column selection, and table operations. The Numpy library was used for mathematical calculations and operations with arrays.
The model was set up through the following steps:
- Data Preparation: The count of electric vehicles or charging stations in Sakarya was selected as the dependent variable, while year, neighboring provinces, and relevant values in major cities were selected as independent variables. Two separate estimation applications were performed at this stage.
- Training and Testing Separation: In accordance with the time series structure, the data was separated into training and testing sets in sequential order without mixing.
- Model Training: Using the Linear Regression class, the model was trained on data, and the coefficients βi for the independent variables and β0 for the constant term were determined.
- Prediction and Performance Evaluation: Predictions were obtained on the test data, and the model’s accuracy was assessed with the MAE, R2, and MSE metrics.
- Coefficient Extraction: The coefficients and constant term learned by the model were used to create the regression equation. These equations and coefficients were presented in tabular form in Section 6.
The predictions obtained from the LSTM and GRU models were comparatively assessed with the Multiple Linear Regression method, thus quantitatively demonstrating the reliability of the 2030 predictions for Sakarya.
4. Evaluation Criteria
Various accuracy and error measures were employed to assess the efficiency of the models in this study. These metrics were selected to reveal the accuracy and robustness levels of the forecasting models.
R2 (R-squared) indicates the model’s explanatory capacity and takes values between 0 and 1. As it approaches 1, the success level of the model increases. The R2 metric is expressed by Equation (13).
The MAE is the absolute mean of the difference between the real values and forecasted values. The MAE metric is expressed by Equation (14).
DTW (Dynamic Time Warping) is a method that measures the distance between two time series by aligning similar points in the time series. It evaluates the difference between the forecasted measure and the observed values in terms of distance, and a lower DTW value indicates that the model provides a better fit. The DTW metric is expressed by Equation (15).
The RMSE (Root Mean Square Error) measures the average magnitude of prediction errors by taking the square root of the mean of the squared differences between the observed and predicted values. It is mathematically expressed by Equation (16).
The MAPE (Mean Absolute Percentage Error) quantifies prediction accuracy as the average absolute percentage difference between the observed and predicted values. It is mathematically expressed by Equation (17).
The MAPE provides an intuitive percentage-based measure of error, allowing for easy comparison across different scales or datasets. Lower MAPE values indicate more accurate predictions and better model performance.
5. Charging Station Distribution
In this study, the estimated number of charging stations for Sakarya Province was further distributed to the neighborhood level. Due to the lack of official neighborhood-level data, the distribution was based on the population proportion of each neighborhood. This ensures that areas with higher population densities receive a proportional share of charging stations. Additionally, charging station types were assigned according to usage scenarios:
- AC charging: For long-term parking areas such as schools and hospitals.
- DC fast charging: For short-term, rapid energy needs such as highways and gas stations.
- Green energy-supported stations: To support sustainability goals.
Equation (18) was used to calculate the neighborhood-based distribution of charging stations.
This approach ensures a more balanced and realistic distribution of charging infrastructure across neighborhoods and provides a practical basis for planning at the local level.
6. Results and Discussion
In this study, estimates were made for the number of electric vehicles and charging stations in Sakarya Province for the year 2030. During the estimation process, time series forecasts were performed using LSTM and GRU deep learning models, and Multiple Linear Regression analysis was also recruited for comparison.
The modeling stages were performed using Python 3.12.2 software, and the libraries Pandas (2.2.2), Numpy (2.1.2), Statsmodels (0.14.4), Sklearn (1.5.2), Flask (3.0.3), and Keras (2.4.3) were used in the process. To prevent overfitting, dropout and Early Stopping methods were used during training. Dropout, added after the GRU and LSTM layers, randomly disabled a portion of the neurons, reducing the models’ tendency to memorize. Loss values were monitored during training, and when no improvement was observed over 10 epochs, the process was terminated using Early Stopping, and the best weights were restored. Hyperparameter optimization was performed for both LSTM and GRU, tuning the units (32, 40, 50, 60), learning rate (0.0005, 0.001, 0.002), epochs (100, 150, 200), dropout (0.0, 0.1, 0.2), batch size (16, 32), and optimizer (Adam). The optimized hyperparameters used for LSTM and GRU are summarized in Table 1.

Table 1.
LSTM and GRU model hyperparameters.
In this study a Multiple Linear Regression model was used in addition to deep learning methods to estimate the count of electric vehicles and charging stations in Sakarya Province. In this analysis, performed in the Python environment using the Stats models library, the total number of installed charging stations and electric vehicles in Sakarya was taken as the dependent variable, while Sakarya’s historical data and the count of electric vehicles in neighboring provinces and major cities such as Istanbul, Ankara, and Izmir were included in the model as independent variables. Two separate predictions were made here: the total installed charging stations and electric vehicles. The coefficients in the Multiple Linear Regression method indicate the effect of independent variables on the outcome. If the model’s coefficients are positive, it indicates an increase in the estimate; if negative, it indicates a decrease in the estimate. According to the test result with the p-value, values less than 0.05 demonstrate that the correct result has been obtained. Table 2 shows which variables have the highest impact on the estimation of electric vehicle in Sakarya.
Table 2.
Multiple Linear Regression coefficients and significance levels for electric vehicles.
Table 3 shows which variables have the highest impact on the estimation of electricvehicle charging stations in Sakarya.
Table 3.
Multiple Linear Regression coefficients and significance levels for charging stations.
After training the LSTM and GRU models, the obtained data was compared to the test values. Both methods were repeated 10 times using the same parameters, and the concluding result was obtained by taking the average over 10 runs. In contrast, the Multiple Linear Regression model was obtained with a single prediction result and compared to the other models.
In addition, hyperparameter optimization was performed to improve the performance of LSTM and GRU models. During this process, different configurations of units (32, 40, 50, 60), learning rates (0.0005, 0.001, 0.002), epochs (100, 150, 200), dropout rates (0.0, 0.1, 0.2), batch sizes (16, 32), and optimizer types (Adam) were tested. The results showed that the GRU model achieved the best performance with 50 units, a learning rate of 0.001, dropout of 0.0, batch size of 32, and Adam optimizer. These optimization results are presented in Table 4. All forecasting results reported in this study were conducted using the most suitable parameter configurations obtained from this optimization process.
Table 4.
Hyperparameter optimization results.
The comparative evaluation was carried out using the parameter values that yielded the best performance for each model. Figure 7 shows the R2 success metrics of the models using DTW and distance metrics. An R2 score of 1 or close to 1 indicates high performance. The R2 scores of the LSTM and GRU models achieved higher scores than Multiple Linear Regression. In terms of DTW and distance metric, since the test and training data are expected to be close to each other, a lower score indicates better performance. According to DTW and distance metric, the LSTM model performed exceptionally, achieving a score of 125.5; the GRU model also performed exceptionally, achieving a score of 123.2, while Multiple Linear Regression demonstrated lower performance with a value of 134.3.
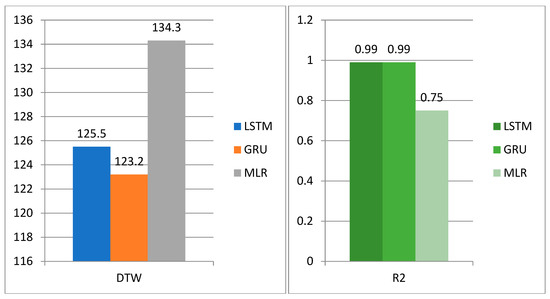
Figure 7.
DTW and R2 scores for LSTM, GRU, and MLR models.
In this study, the MAE and MSE scores were also examined in addition to R2 and DTW scores. Figure 8 shows the MAE and MSE scores of the models. Lower scores in the error metrics indicate higher performance. According to the MAE scores, the GRU achieved a value of 0.3, LSTM achieved 0.5, and the Multiple Linear Regression achieved 0.6. According to the MSE, GRU achieved a value of 2.9, LSTM achieved a value of 3.1, and Multiple Linear Regression achieved a value of 3.7. Based on the error metrics, the GRU model achieved the highest performance with the lowest score.
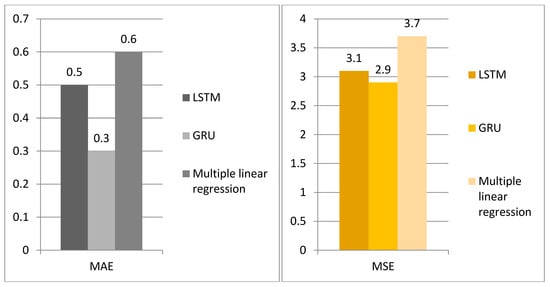
Figure 8.
MAE and MSE scores for LSTM, GRU, and Multiple Linear Regression models.
In this study, MAPE and RMSE error metric scores were examined in addition to R2, DTW, MAE, and MSE metrics. Figure 9 shows the MAPE and RMSE scores of the models. Lower values in these error metrics indicate better model performance. According to the results, the GRU model achieved a MAPE of 3.2% and an RMSE of 1.70, the LSTM model achieved a MAPE of 4.6% and an RMSE of 1.76, and the MLR model achieved a MAPE of 4.8% and an RMSE of 1.92.
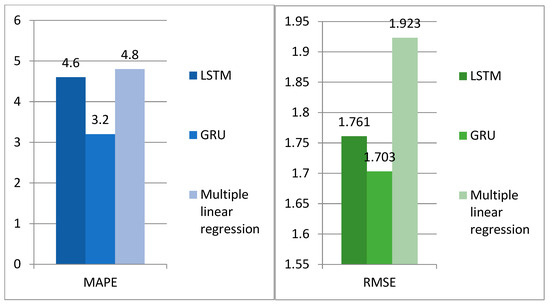
Figure 9.
MAPE and RMSE scores for LSTM, GRU, and Multiple Linear Regression models.
The results obtained from the proposed methods can be explained by several factors. First, the deep learning models, particularly the GRU, effectively captured temporal dependencies in historical electric vehicle and charging station data, resulting in more accurate forecasts compared to Multiple Linear Regression. Hyperparameter optimization further enhanced performance by identifying the most suitable configurations for THE units, learning rate, dropout, batch size, and epochs. Moreover, neighborhood-level distribution of charging stations, based on population ratios and usage scenarios, ensured that the infrastructure planning reflected practical requirements and local demand patterns. These methodological choices together explain why the GRU model achieved the highest predictive accuracy and lowest error rates, while the LSTM model provided slightly less consistent but still reliable estimates. Overall, these factors justify the observed performance differences among the models and highlight the practical applicability of the proposed approach.
Estimates for the count of electric vehicles in Sakarya Province for 2030 were made using LSTM, GRU, and Multiple Linear Regression models, and the count of electric vehicles in Sakarya Province and Turkey in previous years is shown in Figure 10.
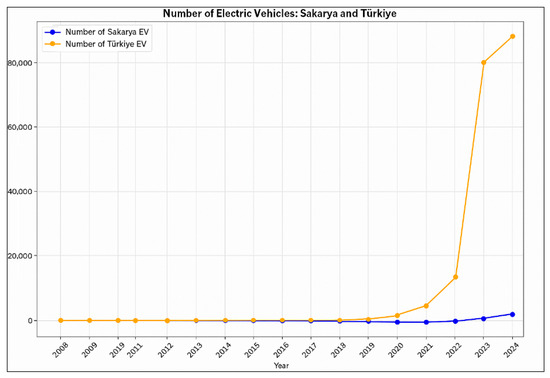
Figure 10.
Count of electric vehicles in Sakarya Province and Türkiye as a whole in previous years.
Figure 10 shows a consistent yearly increase in vehicle counts. Estimates for the count of electric vehicles in Sakarya Province for 2030 were made using LSTM, GRU, and Multiple Linear Regression models, and the count of electric vehicles in Sakarya Province and Turkey in previous years is shown in Figure 10, which illustrates a consistent yearly increase in vehicle numbers, indicating a steady growth trend that supports the forecasted results.
Figure 11 shows the 2030 forecasts for Sakarya Province using the LSTM, GRU, and Multiple Linear Regression models. According to the results obtained, the LSTM model provided 10,884 electric vehicle forecasts, the GRU model provided 9862, and the Multiple Linear Regression model provided 9341.
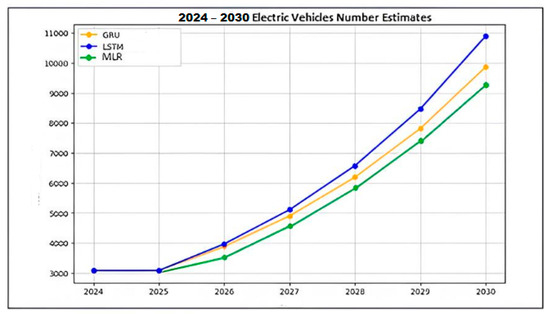
Figure 11.
Count of electric vehicles in Sakarya Province and Türkiye as a whole in previous years.
Estimates for the number of charging stations in Sakarya Province for 2030 were also made using LSTM, GRU, and Multiple Linear Regression models. Figure 12 shows the charging stations in Sakarya Province and across Türkiye in previous years.
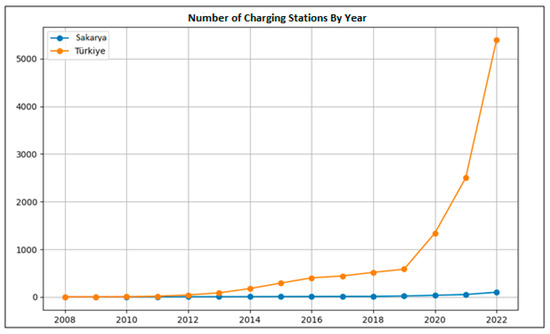
Figure 12.
Count of electric vehicles in Sakarya Province and Türkiye as a whole in previous years.
As shown in Figure 12, there has been an increase in the number of charge stations each year. Figure 13 shows the 2030 estimates for Sakarya Province using the LSTM, GRU, and Multiple Linear Regression models. The results show the LSTM model estimated 1125 charging stations, the GRU model estimated 1096, and the MLR estimated 1032.
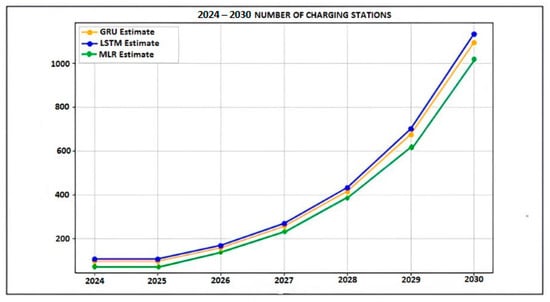
Figure 13.
Forecast of the number of charging stations by 2030 in Sakarya Province.
These data reveal that deep learning models provide higher predictive estimates compared to statistical regression. In particular, the LSTM model shows that the charging infrastructure in Sakarya will expand significantly by 2030, with a higher predictive value than other models.
The estimated charging stations were mapped across Sakarya province based on predictions from the high-performance GRU model. This model provided reliable predictions, producing values close to the statistical regression results. Figure 14 shows the existing charging stations in Sakarya Province, including grid-connected AC and DC stations, as well as AC and DC stations powered by renewable energy sources (green charging stations).
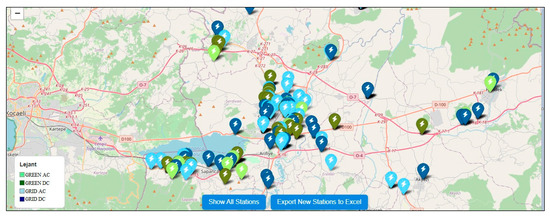
Figure 14.
Existing charging stations in Sakarya Province.
Figure 15 shows the estimated charging station distributions. The estimates for Sakarya province are distributed by neighborhood; however, due to the relatively new application of electric vehicle technology, data has not yet been recorded at the neighborhood level. Therefore, population distribution was taken into account when determining the total installed charging stations per neighborhood. The total number of installed charging stations and electric vehicles in each of the approximately 400 neighborhoods in Sakarya was calculated using Equation (18).
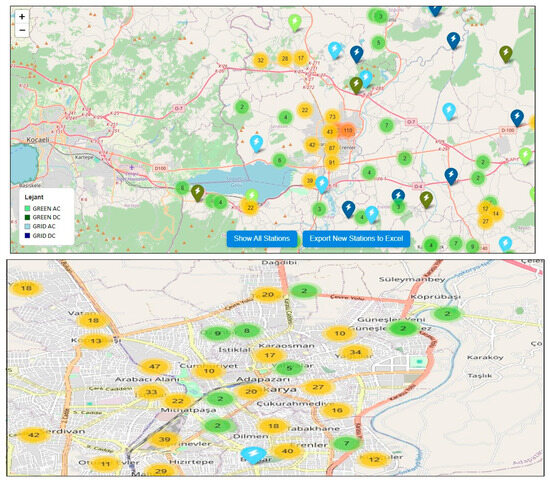
Figure 15.
Charging station distribution.
Figure 16 shows an example of distribution by neighborhood. Here, the distribution for the Sakarya Yenigün neighborhood predicts the placement of 14 charging stations by 2030.
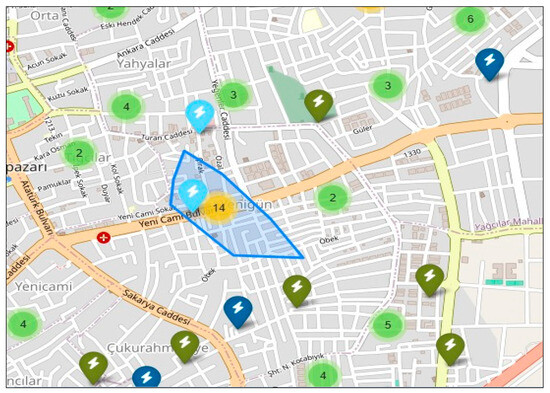
Figure 16.
Charging Station Distribution in Sakarya Yenigün neighborhood by 2030.
When planning the distribution, only areas with high vehicle usage, such as neighborhood centers, parking lots, and shopping centers, were considered. Additionally, the types of charging stations to be installed were differentiated according to usage scenarios. Grid-connected stations will feature AC, DC, and green charging infrastructure. AC charging stations were preferred, especially at schools, hospitals, and similar institutions, due to longer parking or waiting times for vehicles. In contrast, DC fast charging stations were located at points where short-term and rapid energy needs were prominent, such as highway routes and gas stations. This approach both meets user needs and optimizes grid efficiency.
The obtained analysis results are summarized below, followed by the forecasting outcomes and their interpretation.
An essential factor in large-scale EV adoption is ensuring adequate and properly situated charging facilities. Therefore, studies aimed at estimating the future count of electric vehicles and charging stations are of great importance. This study estimated the number of electric vehicles and charging stations in Sakarya Province by 2030. To achieve this goal, predictions were made using LSTM and GRU models incorporating deep learning methods; additionally, statistical analysis results were obtained using the MLR method.
When evaluating the R2, DTW, MAE, and MSE scores of the GRU, LSTM, and MLR models, the GRU model provided more successful results. According to the prediction results of the models, the estimated count of electric vehicles in Sakarya Province for 2030 was 10,884 with LSTM, 9862 with GRU, and 9341 with MLR. The estimated number of electric vehicle charging stations for Sakarya Province in 2030 was 1125 with LSTM, 1096 with GRU, and 1032 with statistical analysis. Examining the prediction results, it can be observed that the three models provide similar values.
In the study the charging station prediction results were plotted on an API map. The GRU model, which achieved higher performance based on its scores on various metrics, was selected for use in the map application. Population ratios by neighborhood were taken into account when distributing the prediction results on the map. In addition, in line with sustainability goals, it was envisaged that green energy-based charging stations would also be integrated into the infrastructure.
As a result, it was determined that the GRU model provides higher accuracy for Sakarya Province and offers the most suitable approach for charging station locations. In future studies, more accurate predictions will be conducted, reflecting regional differences by including socio-economic factors (income level, vehicle ownership rate, fuel prices, urbanization rate, etc.) that may affect electric vehicle demand and charging station needs in the models.
The results obtained from these analyses were further discussed to evaluate their implications, limitations and potential applications.
Within the scope of this study, the number of electric vehicles and charging stations in Sakarya Province for the year 2030 was estimated using different modeling approaches. The findings show that the GRU model stands out with its strong precision and reduced error rates. The LSTM model also demonstrated strong performance, but the GRU model produced more stable results that were closer to MLR. The MLR model performed less well compared to machine learning-based methods, but its prediction values were still found to be consistent with the general trend. This confirms that deep learning methods are a powerful alternative for time series forecasting.
To address the suitability of the models employed, we performed a comparative analysis of LSTM, GRU, and MLR under different parameter configurations. Hyperparameter optimization was conducted by tuning the number of units, learning rate, batch size, dropout rate, and epochs, which revealed the specific conditions under which each model performs more effectively. The GRU model, for example, yielded the most stable results with lower error rates when trained with optimized parameters, while LSTM showed strong but slightly less consistent performance. These comparative results, together with the optimization process, highlight the rationale for selecting these models in the context of EV adoption forecasting.
The novelty of this study lies primarily in its contextual and policy-oriented contribution rather than methodological innovation. Although LSTM, GRU, and MLR are established techniques, their application to Sakarya Province provides empirical evidence on expected growth in electric vehicles and charging stations, which is scarce in the literature. By comparing traditional regression and deep learning approaches, the study demonstrates the added predictive value of machine learning for regional planning, offering a replicable framework for other cities with limited data availability. These findings can guide local decision-makers in strategic planning for sustainable transportation infrastructure.
The distribution of charging stations takes into account not only numerical estimates but also spatial planning. One of the innovative aspects of the study is the distribution of AC and DC charging points based on population density and usage scenarios at the neighborhood level. Furthermore, the planned inclusion of green charging stations during the transition to sustainable energy can be considered a strategic step towards reducing environmental impacts.
However, the study has some limitations. Firstly, long-term data on electric vehicles is lacking, given their relatively recent introduction. Therefore, the dataset on which the predictions are based is relatively limited. Furthermore, socio-economic variables related to the charging infrastructure (income level, vehicle ownership rate, energy costs, etc.) have not been directly included in the model. These factors are expected to play an important role in future demand.
In addition, the spatial distribution of charging stations was primarily based on population scaling, which was adopted due to the limited availability of detailed spatial and mobility data for Sakarya Province. While this approach may appear simplified, it provides a practical framework for initial infrastructure planning in regions with restricted data resources. Future studies should integrate more advanced spatial variables such as mobility patterns, grid capacity constraints, and land-use policies to enhance the accuracy and policy relevance of the proposed model. This would enable a more comprehensive and sustainable evaluation of charging station placement strategies.
The findings obtained from this study are not only applicable to Sakarya Province but also serve as a guide for other provinces with similar demographic and socio-economic structures. Comparing different machine learning methods using broader datasets in the future could enhance the accuracy of predictions. Furthermore, taking into account the capacity constraints of the energy distribution network in optimizing the charging infrastructure will contribute to a more comprehensive planning process.
7. Conclusions
Overall, this study demonstrates the reliability of deep learning methods in predicting electric vehicles and charging stations, while also offering unique contributions in terms of spatial distribution and green energy integration. This study estimated the number of electric vehicles and charging stations in Sakarya Province for the year 2030 using deep learning (LSTM and GRU) and statistical (MLR) models. The results demonstrated that deep learning approaches, particularly the GRU model, provide more accurate and stable forecasts compared to traditional regression techniques. Beyond predictive success, the study also introduced a spatial framework for mapping charging infrastructure at the neighborhood level, taking population distribution and sustainability goals into account. However, this study has certain limitations. Historical data on electric vehicles is relatively limited, and detailed socio-economic and spatial variables (such as income level, vehicle ownership rate, and grid capacity) were not included in the models. Future studies should expand the dataset and incorporate these factors to enhance prediction accuracy and spatial relevance. In addition, integrating mobility behavior data and land-use policies could significantly improve the practical applicability of the proposed framework.
In conclusion, this study demonstrates that deep learning methods can serve as effective tools for electric vehicle and charging infrastructure forecasting. The findings can guide local authorities and policymakers in designing sustainable and data-driven energy and transport strategies for the future.
Author Contributions
A.T.Y.: theoretical framework, methods, software tools, drafting of manuscript, data maintenance. N.A.: mentorship, administrative management of the project. A.Y.: prepared the section pertaining to the MLR method, performed review and editorial tasks. All authors have read and agreed to the published version of the manuscript.
Funding
This research received no external funding.
Institutional Review Board Statement
Not applicable.
Informed Consent Statement
Not applicable.
Data Availability Statement
All data generated or analyzed in this study are available from the corresponding author upon request.
Acknowledgments
We extend our thanks to all who aided us in carrying out this research.
Conflicts of Interest
The authors declare no conflicts of interest.
Abbreviations
The following abbreviations are used in this manuscript:
| R2 | R squared |
| MAE | Mean Absolute Error |
| MSE | Mean Squared Error |
| LSTM | Long Short-Term Memory |
| GRU | Gated Recurrent Units |
| EV | Electric Vehicle |
| RNN | Recurrent Neural Networks |
| RMSE | Root Mean Squared Error |
| MLR | Multiple Linear Regression |
References
- Singh, S.; Rao, D.G.; Dixit, M. Future of Transportation-A Comparison between Internal Combustion Engine, Electric Vehicles and Fuel Cell Vehicles. Univers. J. Mech. Eng. 2023, 11, 13–23. [Google Scholar] [CrossRef]
- Zhao, F.; Chen, K.; Hao, H.; Liu, Z. Challenges, potential and opportunities for internal combustion engines in China. Sustainability 2020, 12, 4955. [Google Scholar] [CrossRef]
- Idris, M.; Garniwa, I.; Soesilo, T.E.B.; Utomo, S.W.; Asyari, M.Z. Environmental Impacts of Internal Combustion Engine vs. Electric Vehicle: Life-Cycle Assessment Review. Int. J. Technol. 2025, 16, 882–913. [Google Scholar] [CrossRef]
- Balgehshiri, S.K.M.; Zohuri, B. The impact of energy transition to net-zero emissions on the world economy and global strategies. J. Econ. Manag. Res. 2023, 4, 2–7. [Google Scholar] [CrossRef]
- Alfatarizqi, A.; Semin, S.; Ariana, I.M.; Kadirgama, K. Hydrogen Application as a Renewable Fuel in the Internal Combustion Engine and Fuel Cell towards Zero Carbon Emission: A Technical Review. J. Adv. Res. Exp. Fluid Mech. Heat Transf. 2025, 21, 96–125. [Google Scholar]
- Alanazi, F. Electric vehicles: Benefits, challenges, and potential solutions for widespread adaptation. Appl. Sci. 2023, 13, 6016. [Google Scholar] [CrossRef]
- Lipu, M.S.H.; Mamun, A.A.; Ansari, S.; Miah, M.S.; Hasan, K.; Meraj, S.T.; Tan, N.M. Battery management, key technologies, methods, issues, and future trends of electric vehicles: A pathway toward achieving sustainable development goals. Batteries 2022, 8, 119. [Google Scholar] [CrossRef]
- Hossain, M.S.; Kumar, L.; Islam, M.M.; Selvaraj, J. A comprehensive review on the integration of electric vehicles for sustainable development. J. Adv. Transp. 2022, 2022, 3868388. [Google Scholar] [CrossRef]
- Ashfaq, M.; Butt, O.; Selvaraj, J.; Rahim, N. Assessment of electric vehicle charging infrastructure and its impact on the electric grid: A review. Int. J. Green Energy 2021, 18, 657–686. [Google Scholar] [CrossRef]
- Barman, P.; Dutta, L. Charging infrastructure planning for transportation electrification in India: A review. Renew. Sustain. Energy Rev. 2024, 192, 114265. [Google Scholar] [CrossRef]
- Çolak, A.M.; Irmak, E. Electric vehicle advancements, barriers, and potential: A comprehensive review. Electr. Power Compon. Syst. 2023, 51, 2010–2042. [Google Scholar] [CrossRef]
- Karolemeas, C.; Tsigdinos, S.; Tzouras, P.G.; Nikitas, A.; Bakogiannis, E. Determining electric vehicle charging station location suitability: A qualitative study of greek stakeholders employing thematic analysis and analytical hierarchy process. Sustainability 2021, 13, 2298. [Google Scholar] [CrossRef]
- Zeb, M.Z.; Imran, K.; Khattak, A.; Janjua, A.K.; Pal, A.; Nadeem, M.; Khan, S. Optimal placement of electric vehicle charging stations in the active distribution network. IEEE Access 2020, 8, 68124–68134. [Google Scholar] [CrossRef]
- Brandstätter, G.; Leitner, M.; Ljubić, I. Location of charging stations in electric car sharing systems. Transp. Sci. 2020, 54, 1408–1438. [Google Scholar] [CrossRef]
- Wang, Z.; Yang, Q.; Wang, C.; Wang, L. Spatial layout analysis and evaluation of electric vehicle charging infrastructure in chongqing. Land 2023, 12, 868. [Google Scholar] [CrossRef]
- Yin, W.; Ji, J.; Qin, X. Study on optimal configuration of EV charging stations based on second-order cone. Energy 2023, 284, 128494. [Google Scholar] [CrossRef]
- Liu, C.; Liu, L.; Peng, Z.; Wu, H.; Wang, F.; Jiao, H.; Wang, J. Planning public electric vehicle charging stations to balance efficiency and equality: A case study in Wuhan, China. Sustain. Cities Soc. 2025, 124, 106314. [Google Scholar] [CrossRef]
- Danese, A.; Torsæter, B.N.; Sumper, A.; Garau, M. Planning of high-power charging stations for electric vehicles: A review. Appl. Sci. 2022, 12, 3214. [Google Scholar] [CrossRef]
- Mashhoodi, B.; Van der Blij, N. Drivers’ range anxiety and cost of new EV chargers in Amsterdam: A scenario-based optimization approach. Ann. GIS 2021, 27, 87–98. [Google Scholar] [CrossRef]
- Ge, Y.; MacKenzie, D. Charging behavior modeling of battery electric vehicle drivers on long-distance trips. Transp. Res. Part D Transp. Environ. 2022, 113, 103490. [Google Scholar] [CrossRef]
- Pan, L.; Yao, E.; Yang, Y.; Zhang, R. A location model for electric vehicle (EV) public charging stations based on drivers’ existing activities. Sustain. Cities Soc. 2020, 59, 102192. [Google Scholar] [CrossRef]
- Dixon, J.; Bell, K. Electric vehicles: Battery capacity, charger power, access to charging and the impacts on distribution networks. ETransportation 2020, 4, 100059. [Google Scholar] [CrossRef]
- Alkawsi, G.; Baashar, Y.; Abbas, U.D.; Alkahtani, A.A.; Tiong, S.K. Review of renewable energy-based charging infrastructure for electric vehicles. Appl. Sci. 2021, 11, 3847. [Google Scholar] [CrossRef]
- Gupta, R.S.; Tyagi, A.; Anand, S. Optimal allocation of electric vehicles charging infrastructure, policies and future trends. J. Energy Storage 2021, 43, 103291. [Google Scholar] [CrossRef]
- Sofuoğlu, E.; Kirikkaleli, D. Towards achieving net zero emission targets and sustainable development goals, can long-term material footprint strategies be a useful tool? Environ. Sci. Pollut. Res. 2023, 30, 26636–26649. [Google Scholar] [CrossRef] [PubMed]
- Nawaz, M.U.; Qureshi, M.S.; Umar, S. Integration of solar energy systems with electric vehicle charging infrastructure: Challenges and opportunity. Rev. Esp. De Doc. Cient. 2024, 18, 1–18. [Google Scholar]
- Lee, J.H.; Chakraborty, D.; Hardman, S.J.; Tal, G. Exploring electric vehicle charging patterns: Mixed usage of charging infrastructure. Transp. Res. Part D Transp. Environ. 2020, 79, 102249. [Google Scholar] [CrossRef]
- Bitencourt, L.; Abud, T.P.; Dias, B.H.; Borba, B.S.; Maciel, R.S.; Quirós-Tortós, J. Optimal location of EV charging stations in a neighborhood considering a multi-objective approach. Electr. Power Syst. Res. 2021, 199, 107391. [Google Scholar] [CrossRef]
- Yuvaraj, T.; Devabalaji, K.R.; Kumar, J.A.; Thanikanti, S.B.; Nwulu, N.I. A comprehensive review and analysis of the allocation of electric vehicle charging stations in distribution networks. IEEE Access 2024, 12, 5404–5461. [Google Scholar] [CrossRef]
- Yapıcı, A.T.; Abut, N.; Erfidan, T. Comparing the Effectiveness of Deep Learning Approaches for Charging Time Prediction in Electric Vehicles: Kocaeli Example. Energies 2025, 18, 1961. [Google Scholar] [CrossRef]
- Li, C.; Dong, Z.; Chen, G.; Zhou, B.; Zhang, J.; Yu, X. Data-driven planning of electric vehicle charging infrastructure: A case study of Sydney, Australia. IEEE Trans. Smart Grid 2021, 12, 3289–3304. [Google Scholar] [CrossRef]
- Eid, A.; Mohammed, O.; El-Kishky, H. Efficient operation of battery energy storage systems, electric-vehicle charging stations and renewable energy sources linked to distribution systems. J. Energy Storage 2022, 55, 105644. [Google Scholar] [CrossRef]
- Sachan, S.; Deb, S.; Singh, P.P.; Alam, M.S.; Shariff, S.M. A comprehensive review of standards and best practices for utility grid integration with electric vehicle charging stations. Wiley Interdiscip. Rev. Energy Environ. 2022, 11, e424. [Google Scholar] [CrossRef]
- Alrubaie, A.J.; Salem, M.; Yahya, K.; Mohamed, M.; Kamarol, M. A comprehensive review of electric vehicle charging stations with solar photovoltaic system considering market, technical requirements, network implications, and future challenges. Sustainability 2023, 15, 8122. [Google Scholar] [CrossRef]
- Güven, A.F.; Yücel, E. Sustainable energy integration and optimization in microgrids: Enhancing efficiency with electric vehicle charging solutions. Electr. Electr. Eng. 2025, 107, 1541–1573. [Google Scholar] [CrossRef]
- Rashid, M.; Elfouly, T.; Chen, N. A Comprehensive Survey of Electric Vehicle Charging Demand Forecasting Techniques. IEEE Open J. Veh. Technol. 2024, 5, 1348–1373. [Google Scholar] [CrossRef]
- Orzechowski, A.; Lugosch, L.; Shu, H.; Yang, R.; Li, W.; Meyer, B.H. A data-driven framework for medium-term electric vehicle charging demand forecasting. Energy AI 2023, 14, 100267. [Google Scholar] [CrossRef]
- Yi, Z.; Liu, X.C.; Wei, R.; Chen, X.; Dai, J. Electric vehicle charging demand forecasting using deep learning model. J. Intell. Transp. Syst. 2021, 26, 690–703. [Google Scholar] [CrossRef]
- Kim, Y.; Kim, S. Forecasting Charging Demand of Electric Vehicles Using Time-Series Models. Energies 2021, 14, 1487. [Google Scholar] [CrossRef]
- Shengyou, W. Short-term electric vehicle charging demand prediction: A deep learning approach. Appl. Energy 2023, 340, 121032. [Google Scholar] [CrossRef]
- Shakerighadi, B.; Anvari-Moghaddam, A.; Ebrahimzadeh, E.; Blaabjerg, F.; Bak, C.L. A hierarchical game theoretical approach for energy management of electric vehicles and charging stations in smart grids. IEEE Access 2018, 6, 67223–67234. [Google Scholar] [CrossRef]
- Narasipuram, R.P.; Mopidevi, S. A technological overview & design considerations for developing electric vehicle charging stations. J. Energy Storage 2021, 43, 103225. [Google Scholar] [CrossRef]
- Hemavathi, S.; Shinisha, A. A study on trends and developments in electric vehicle charging technologies. J. Energy Storage 2022, 52, 105013. [Google Scholar] [CrossRef]
- Ullah, I.; Liu, K.; Yamamoto, T.; Zahid, M.; Jamal, A. Modeling of machine learning with SHAP approach for electric vehicle charging station choice behavior prediction. Travel Behav. Soc. 2023, 31, 78–92. [Google Scholar] [CrossRef]
- Gellrich, M.; Block, A.; Leikert-Böhm, N. Spatial and temporal patterns of electric vehicle charging station utilization: A nationwide case study of Switzerland. Environ. Res. Infrastruct. Sustain. 2022, 2, 021003. [Google Scholar] [CrossRef]
- Jahromi, A.J.; Mohammadi, M.; Afrasiabi, S.; Afrasiabi, M.; Aghaei, J. Probability density function forecasting of residential electric vehicles charging profile. Appl. Energy 2022, 323, 119616. [Google Scholar] [CrossRef]
- Tian, X.; Cai, Y.; Sun, X.; Zhu, Z. Collaborative optimization of fuel economy and battery life for plug-in hybrid electric buses considering traffic condition. J. Energy Storage 2024, 90, 111928. [Google Scholar] [CrossRef]
Disclaimer/Publisher’s Note: The statements, opinions and data contained in all publications are solely those of the individual author(s) and contributor(s) and not of MDPI and/or the editor(s). MDPI and/or the editor(s) disclaim responsibility for any injury to people or property resulting from any ideas, methods, instructions or products referred to in the content. |
© 2025 by the authors. Licensee MDPI, Basel, Switzerland. This article is an open access article distributed under the terms and conditions of the Creative Commons Attribution (CC BY) license (https://creativecommons.org/licenses/by/4.0/).