Article

Quantifying the Acoustic Bias of Insect Noise on Wind Turbine Sound Power Levels at Low Wind Speeds †

Faculty of Mechanical Engineering, University of Ljubljana, Aškerčeva cesta 6, 1000 Ljubljana, Slovenia
*
Author to whom correspondence should be addressed.
This paper is an extended version of our paper published in “Influence of Biological Sounds on Long-Term Measurements of Wind Turbine Noise” published in 11th International Conference on Electrical, Electronics and Computer Engineering (IcETRAN), Novi Sad, Serbia, 3–6 June 2024.
Appl. Sci. 2025, 15(21), 11395; https://doi.org/10.3390/app152111395 (registering DOI)
Submission received: 17 September 2025 / Revised: 1 October 2025 / Accepted: 21 October 2025 / Published: 24 October 2025

Abstract

Accurate wind turbine noise (WTN) measurements are essential for environmental compliance and noise impact assessments. However, these measurements are often polluted by background biological noise, especially from insects. Insect noise is typically assumed to be irrelevant due to frequency separation. This study challenges this assumption by demonstrating that insect sounds, specifically those of the cricket Oecanthus pellucens, can overlap with turbine noise in the 2.5 kHz band and introduce significant measurement bias at low wind speeds. The featured application is a machine learning-based methodology to filter confounding biological sounds (e.g., insect calls) from wind turbine noise measurements. By correcting for these acoustic contaminants, which typically lead to an overestimation of turbine noise at low wind speeds, the method enables more accurate environmental noise impact assessments. This directly supports the development of evidence-based regulatory policies and guidelines. Using long-term acoustic monitoring and an unsupervised Gaussian Mixture Model (GMM) clustering approach, we classified and excluded insect noise from recorded data. We found that the presence of cricket calls can increase measured wind turbine sound power levels (WTSPL) by more than 3 dBA at wind speeds below 6 m/s, with peak deviations reaching up to 10 dBA. These findings have significant implications for rural or low-wind regions where turbine operation at partial load is frequent. Our results underscore the importance of insect noise filtering when performing WTN assessments to ensure regulatory accuracy, particularly when long-term average noise modeling is used for compliance. The presented methodology provides a robust framework for distinguishing insect noise and can improve the consistency and credibility of WTN measurements under real-world environmental conditions.

1. Introduction

Over the past decade, numerous studies have investigated the attributes of wind turbines, including visual impact, noise levels, economic benefits, and environmental impacts [1,2,3,4]. Historically, the primary objective in wind turbine development was maximizing energy performance. Now, however, there is a growing emphasis on other aspects, such as the generated noise.
The rotation of wind turbine blade radiates sound that mainly consists of aerodynamic and mechanical components [5,6]. This noise emitted by wind turbines represents one of the most important problems affecting the quality of life of residents near wind farms [7,8], limiting the large-scale diffusion of wind energy [9]. While the root cause, airfoil noise, can be predicted [10,11], regulatory purposes require that wind turbine noise (WTN) must be measured on-site. This requirement introduces a significant challenge: accurately assessing WTN in the presence of varying background noise conditions. Regulatory frameworks in several countries (including Italy, France, the U.K. and New Zealand) require that measured WTN levels be compared against contemporaneous background noise under identical meteorological conditions [12,13]. However, because background noise itself varies strongly with wind speed and other environmental factors, establishing a single, universally valid limit is inherently difficult [14]. Reliable background noise measurement often requires a temporary shutdown of turbines and a long-term monitoring campaign (typically around three weeks) to capture variability in weather and other events. Measurements taken at different times or distant locations can introduce errors, especially if wind-induced turbulence at the microphone and vegetation noise are not adequately filtered out [13]. Furthermore, it is emphasized that measurements should include collecting weather data, conducting environmental noise monitoring, filtering out spurious events (e.g., anthropogenic and animal noise), and performing iterative data analysis to ensure accurate results [15]. A procedure has been proposed for simultaneously estimating immission and background noise components, emphasizing the importance of accurate background noise measurement in WTN assessments. This is because background noise sources are closely related to wind speed and contribute to overall environmental noise levels [16]. A conservative criterion advocates for retaining only measurements with signal-to-background ratios of at least 6 dB, which yields errors below 1 dB in computed WTN levels [17]. It is similarly recommended to measure the background noise ( L 95 ) during turbine shutdowns and then compare it to the operational equivalent level; this methodology sets a normal tolerability limit at 3 dB for WTN [18]. Furthermore, “true” background noise must exclude all sounds originating from the wind farm or other installations, advocating for measurements to be taken outside the immediate area of interest [19].
  • Background and WTN measurements should be conducted at the same location and under similar meteorological conditions (time of day, wind speed/direction).
  • The measurement procedure itself significantly influences results, as wind speed, wind direction, sound propagation conditions, the presence of other noise sources, and distances to obstacles all affect recorded noise levels [20].
  • The presence of vegetation, which varies seasonally, can influence outcomes. Measurements taken in winter, for instance, may yield different results than those taken in summer.
While most studies focus on meteorological and anthropogenic noise sources, biological sounds, especially those produced by insects, can substantially bias WTN assessments during warm seasons. An abundance of insects and birds has been observed near wind farms, with initial studies focusing on flying insects in relation to bat feeding activity [21,22,23,24,25,26]. However, the significance of terrestrial insects and their calling noises in the context of WTN assessment has recently been highlighted [27,28,29,30]. In order to isolate WTN accurately and evaluate its true impact on the environment and nearby populations, great effort is needed. To mitigate this interference, researchers have
  • Employed frequency filtering techniques to exclude insect communication noise from WTN measurements [27,28,29].
  • Scheduled measurements during periods of minimal animal activity (e.g., cooler months or morning hours) [31].
Despite these advancements, the specific influence of insect noise as a background component has been explicitly addressed in only a few studies [32].

Objective of the Study

Accurate measuring of WTN is fraught with complexities and challenges [13,14,16,18,28,33,34,35,36]. A significant source of variability in these assessments are inconsistencies in correcting for background noise levels, which can lead to differing conclusions about the health impacts of WTN. Among the various factors contributing to this variability, biological sounds produced by insects such as crickets are frequently overlooked or inadequately addressed in WTN measurements and analyses [32]. This study aims to quantify how insect-generated sounds bias wind turbine sound power level (WTSPL) measurements under low-wind (<6 m/s) summertime conditions and to demonstrate that automated GMM classification of long-term acoustic recordings can effectively identify and exclude insect noise, thereby improving the accuracy of wind turbine noise assessments.
The remainder of this paper is organized as follows. Section 2 describes the methodology, including the acoustic measurement protocol, instrumentation, meteorological data acquisition, and the procedure for insect noise classification using Gaussian Mixture Model clustering. Section 3 presents the results of the acoustic monitoring campaign, highlighting the influence of insect vocalizations on measured wind turbine sound power levels. Section 4 discusses the implications of these findings for environmental noise assessments. Finally, Section 5 provides the main conclusions, as well as the study’s limitations and directions for future work.

2. Methodology

All measurements were conducted at a single Enercon E-70 wind turbine (2.3 MW rated power) with a 97 m tower and 71 m-diameter, three-bladed rotor. The measurement point was placed 133.5 m from the tower (see Figure 1), based on turbine specifications and to minimize near-field effects. The azimuthal orientation was chosen according to annual wind-rose data as proposed by [37], and the exact coordinates are 45 43 55 . 3 N , 13 59 35 . 0 E . Local vegetation and tree cover were also considered to ensure an unobstructed path for sound propagation and to prevent additional noise from rustling leaves and branches, with the microlocation chosen as a rock-free area that allowed stable placement of the wooden board, as seen in Figure 2.

2.1. Measurements and Equipement

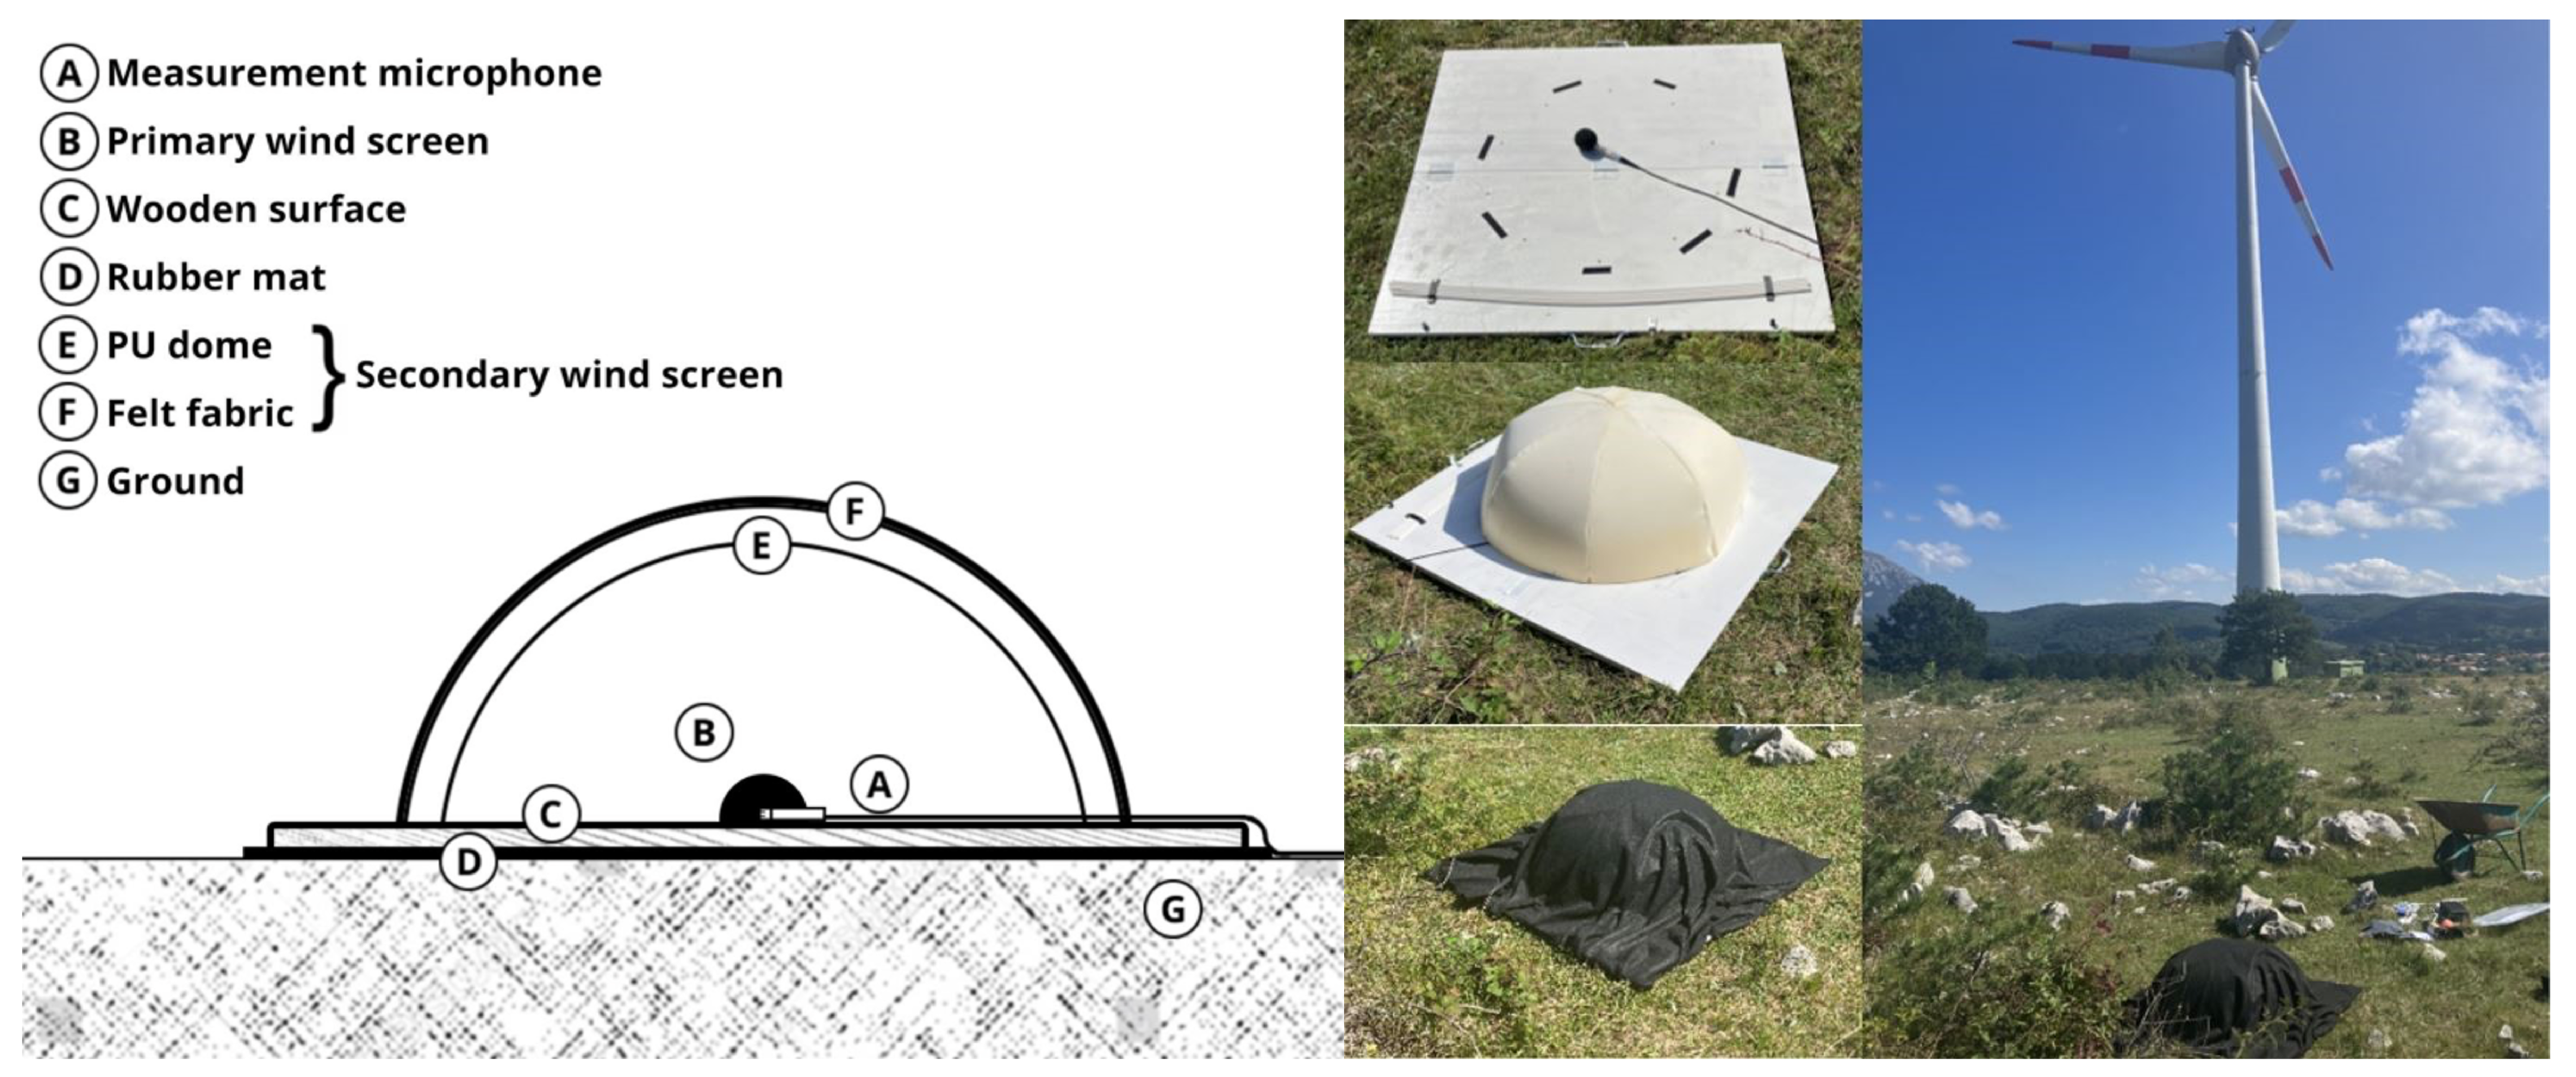
Sound power levels were determined in accordance with Danish noise regulations as presented in [38,39] IEC 61400-11. Danish noise regulations were chosen as the reference standard because they are well established, scientifically robust, and widely recognized for wind turbine noise assessment [14,40,41]. This ensures reproducibility and comparability with prior studies. We employed a two-stage wind-screening system atop a ground-level platform, as its importance was highlighted in studies [30,36,42,43,44,45,46,47]. The primary wind screen was a 100 mm open-cell foam sphere mounted directly on the microphone capsule and the secondary wind screen was a custom polyurethane (PU) foam dome (10 mm thickness) lined with 1 mm felt to shed rainwater and prevent moisture saturation.
By placing the microphone on an 18 mm plywood base (1 m × 1 m), we further reduced wind turbulence and structure-borne vibrations. A 10 mm rubber mat separated the plywood from the ground to isolate floor vibrations (see Figure 2).
Figure 2. Secondary wind screen and placement of the microphone.
Applsci 15 11395 g002
To verify compliance with EN 61400-11:2013 [48], the insertion loss of our thicker PU-foam secondary wind screen was measured in an anechoic chamber. Although its correction factors exceeded 3 dB between 3150 Hz and 20,000 Hz, the increase between adjacent one-third-octave bands never exceeded 2 dB, satisfying the standard’s requirement.
Measurements were conducted using the Norsonic Nor140 sound level meter (measuring range: −10 dB to 137 dB SPL; sampling: 48 kHz, 24-bit WAV files). Audio was stored on an external SD card, yielding over 11,000 files (≈80 GB). The study was conducted from 7 to 14 September under generally stable weather conditions with no rainfall, and temperature was assumed to remain stable throughout this period. Effects of climate were considered negligible. Frequency analysis for tonality was performed on recorded *.wav signals using the LabVIEW 2021 software package. The Nor140 was field-calibrated (pre and post campaign and at each battery change) against a reference source. Throughout the campaign, calibration drift remained within ±0.1 dBA, requiring no mid-campaign adjustments. WTSPL were calculated per Danish regulations [38]. Measurements falling into the reference wind-speed v ref bins (5.5–6.5 m/s and 7.5–8.5 m/s at the reference height z ref , which is 10 m height, ±15° downwind) were selected. The wind speed v z has been measured at a height z above ground level. v ref at a height of 10 m was calculated using Equation (1) [38], taking the influence of the ground roughness z 0 into account.
ν r e f = ν z ln z r e f z 0 , r e f ln h h 0 ln h z 0 , r e f ln z z 0 .
where z represents the height of the wind speed meter, z 0 , ref is the reference roughness of 0.05 m (specified value), and z 0 is the roughness of the ground surface, which is estimated from Table 1.
Wind speed and direction were recorded with a KVT 60A anemometer (0–50 m/s, 0–360°; accuracy ±0.5 m/s, resolution 0.1 m/s for speed; ±2.75°, resolution 5.5° for direction) mounted at 5.5 m height. Data were logged at 1 min intervals.

2.2. Acoustic Data Processing and Insect Classification

A high-quality insect call library was assembled from Xeno-canto (XC) WAV recordings (48 kHz, 24-bit). Files rated “A” or “B” and 20–90 s long were selected to capture complete vocalizations with minimal noise. The final library includes key species (e.g., Oecanthus pellucens, and various grasshoppers) and serves as a training set for classification. All audio (field and reference) was band-pass filtered (6th-order Butterworth, 2–4 kHz) to suppress low-frequency wind and traffic noise prior to segmentation as proposed by [49]. Given the real-world origin of these recordings, they include a mixture of vocalizations from multiple species and ambient noises such as wind and rain, presenting substantial challenges for sound segmentation and classification. As presented in [50], to effectively isolate insect vocalizations, endpoint detection is crucial, enabling the extraction of clear, uninterrupted audio segments from the original recordings marked with a green line in Figure 3. We performed a Short-Time Fourier Transform (STFT) in LabVIEW on 1 s frames using a Hanning window (50% overlap). For each frame, we computed spectral energy and identified contiguous regions exceeding a noise-dependent threshold, yielding time-stamped call segments.
For insect calls, we found that combining the 95th percentile threshold with a zero-crossing method is highly effective for endpoint detection. The dominant frequency signal is zero-leveled at the 95th percentile, and a unidirectional zero-crossing is executed. The use of zero-crossing transforms the signal into a binary sequence of zeros and ones, indicating the presence of signal peaks when crossing the zero value. An envelope is then created over this binary data, and the zero-crossing of the envelope’s 0.5 value is designated as the start and endpoint of an insect call. This method allows us to isolate only the insect calls from the original audio. By doing so, we can compare the extracted feature values of these segments against our recordings, effectively minimizing environmental noise. This sets the stage for precise species classification, using unsupervised techniques to identify species-specific patterns. This approach not only supports the ecological study of insects but also deepens our understanding of their acoustic behaviors within varied environmental contexts. Each extracted segment was subdivided into non-overlapping clips of 200 ms (fine scale) and 5 s (coarse scale). From the 200 ms frames, we extracted dominant frequency, spectral centroid, bandwidth, and zero-crossing rate for onset/offset dynamics. From each 5 s window, we computed the mean of dominant frequencies and the coefficient of variation of dominant frequency. Two feature-vector datasets were created:
  • Insect reference: merged, species-specific call files from extracted segments,
  • Field recordings: continuous WTN recordings subject to classification.
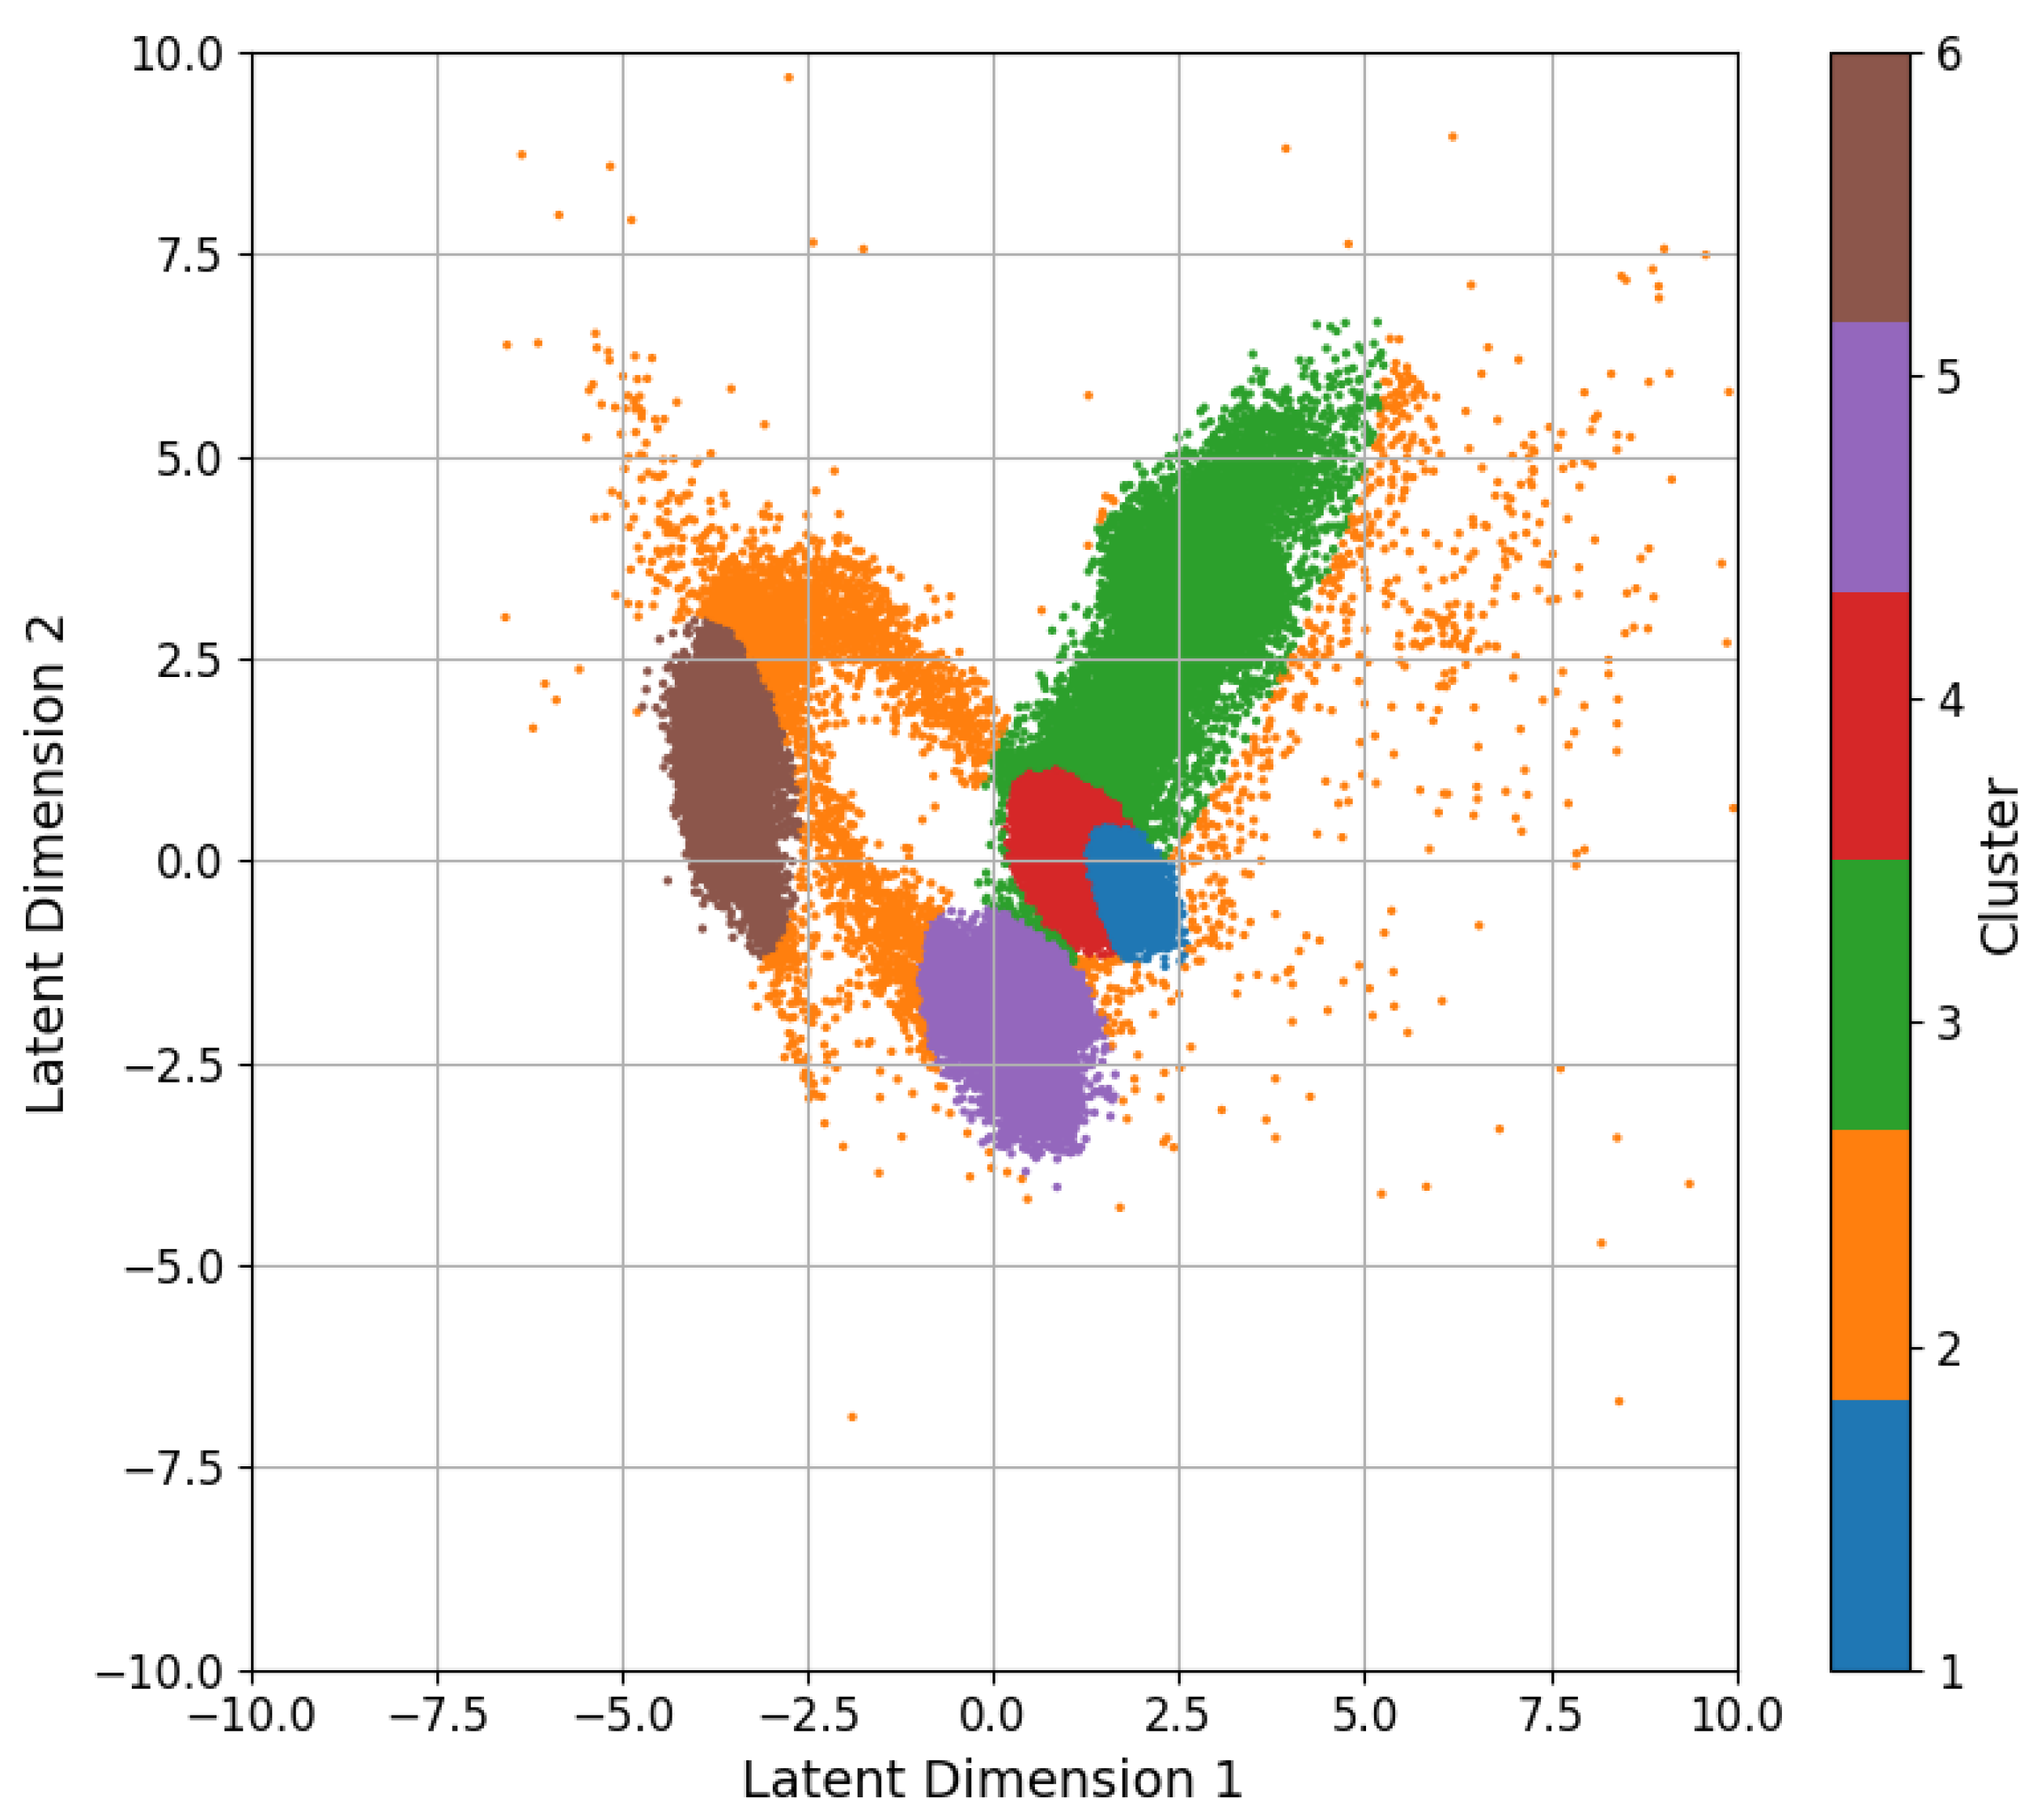
To classify insect vocalizations within our wind turbine audio recordings, we applied the GMM clustering algorithm to the multi-scale feature vectors extracted during preprocessing. GMM clustering works on an assumption that the data consists of a combination of two or more Gaussian distributions. Each Gaussian component represents a cluster, characterized by its mean and covariance. It is a form of unsupervised learning, meaning it does not require labeled training data, but can obtain the posterior probability of belonging to a certian class, achieving “soft” classification. To enhance the accuracy and our understanding of the GMM clustering analysis shown in Figure 4, we augmented our dataset with selected recordings from known species such as Oecanthus pellucens and various grasshoppers from the Xeno-canto archive. The inclusion of these recordings provides crucial reference points, shown as distinct dots among the clusters in the analysis graph, enabling us to validate the clusters that represent authentic insect activity. This approach not only improves our ability to discern genuine insect vocalizations but also ensures our classification aligns with known patterns of insect sounds. The Bayesian information criterion (BIC) was used to determine the optimal number of clusters, despite some prior knowledge of the number of insect species present.
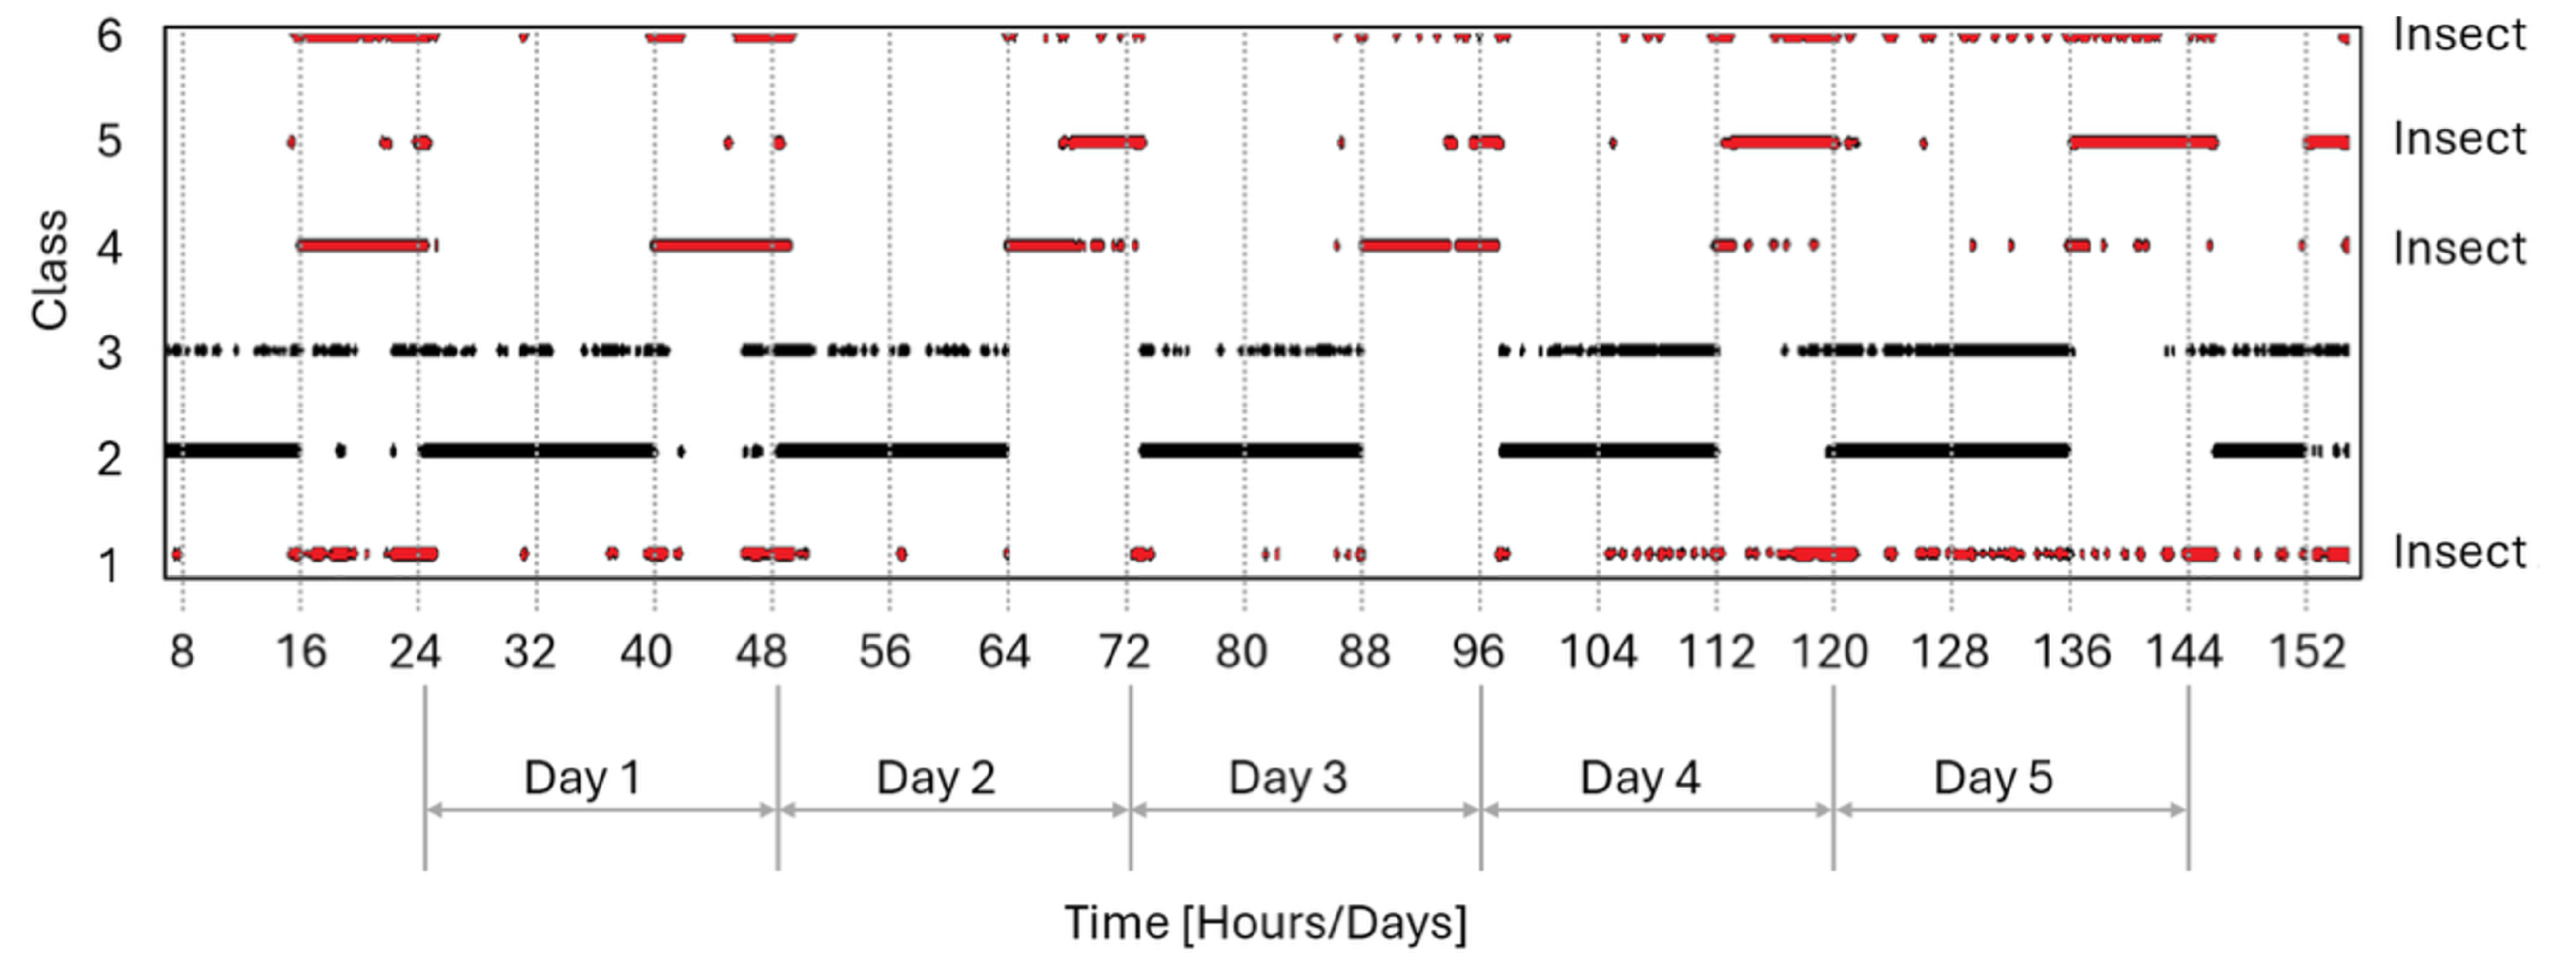
As in [51], unsupervised learning, particularly through methods like GMM clustering, is advantageous in ecological studies like ours where labeled data can be scarce or unreliable. This approach can uncover hidden patterns and structures in the data without the need for labeled examples. By analyzing the dataset in this manner, the algorithm can autonomously identify clusters that likely correspond to different insect species, based on similarities in their sound patterns. The datapoints from the six selected clusters are presented in chronological order in in Figure 5, clearly showing different patterns of insect activity and background noise over time.
To facilitate subsequent noise exclusion in our wind turbine sound power analyses, each one-minute recording block was labeled based on its cluster membership: any block containing at least one feature vector from an insect related cluster was tagged “insect activity,” whereas blocks with exclusively turbine-related cluster assignments were designated “insect-free”. This binary segmentation ensures that all potential insect interference is identified and removed before computing wind turbine sound power levels. A manual auditory inspection was performed to validate the unsupervised classification of insect versus non-insect noise events. All recordings labeled as insect-dominant (Clusters 1, 4, 5, and 6) correctly contained audible cricket calls, yielding a 100% classification accuracy for high-amplitude insect sounds. Among recordings labeled as non-insect (Clusters 2 and 3), 7% contained faint cricket calls detectable by human hearing but were below the 0 dB SPL threshold and spectrally unidentifiable. These events are considered acoustically negligible. The overall validation accuracy was estimated at 96.5%, supporting the robustness of the GMM model for automated classification and exclusion of biological noise in WTN assessments.

3. Results

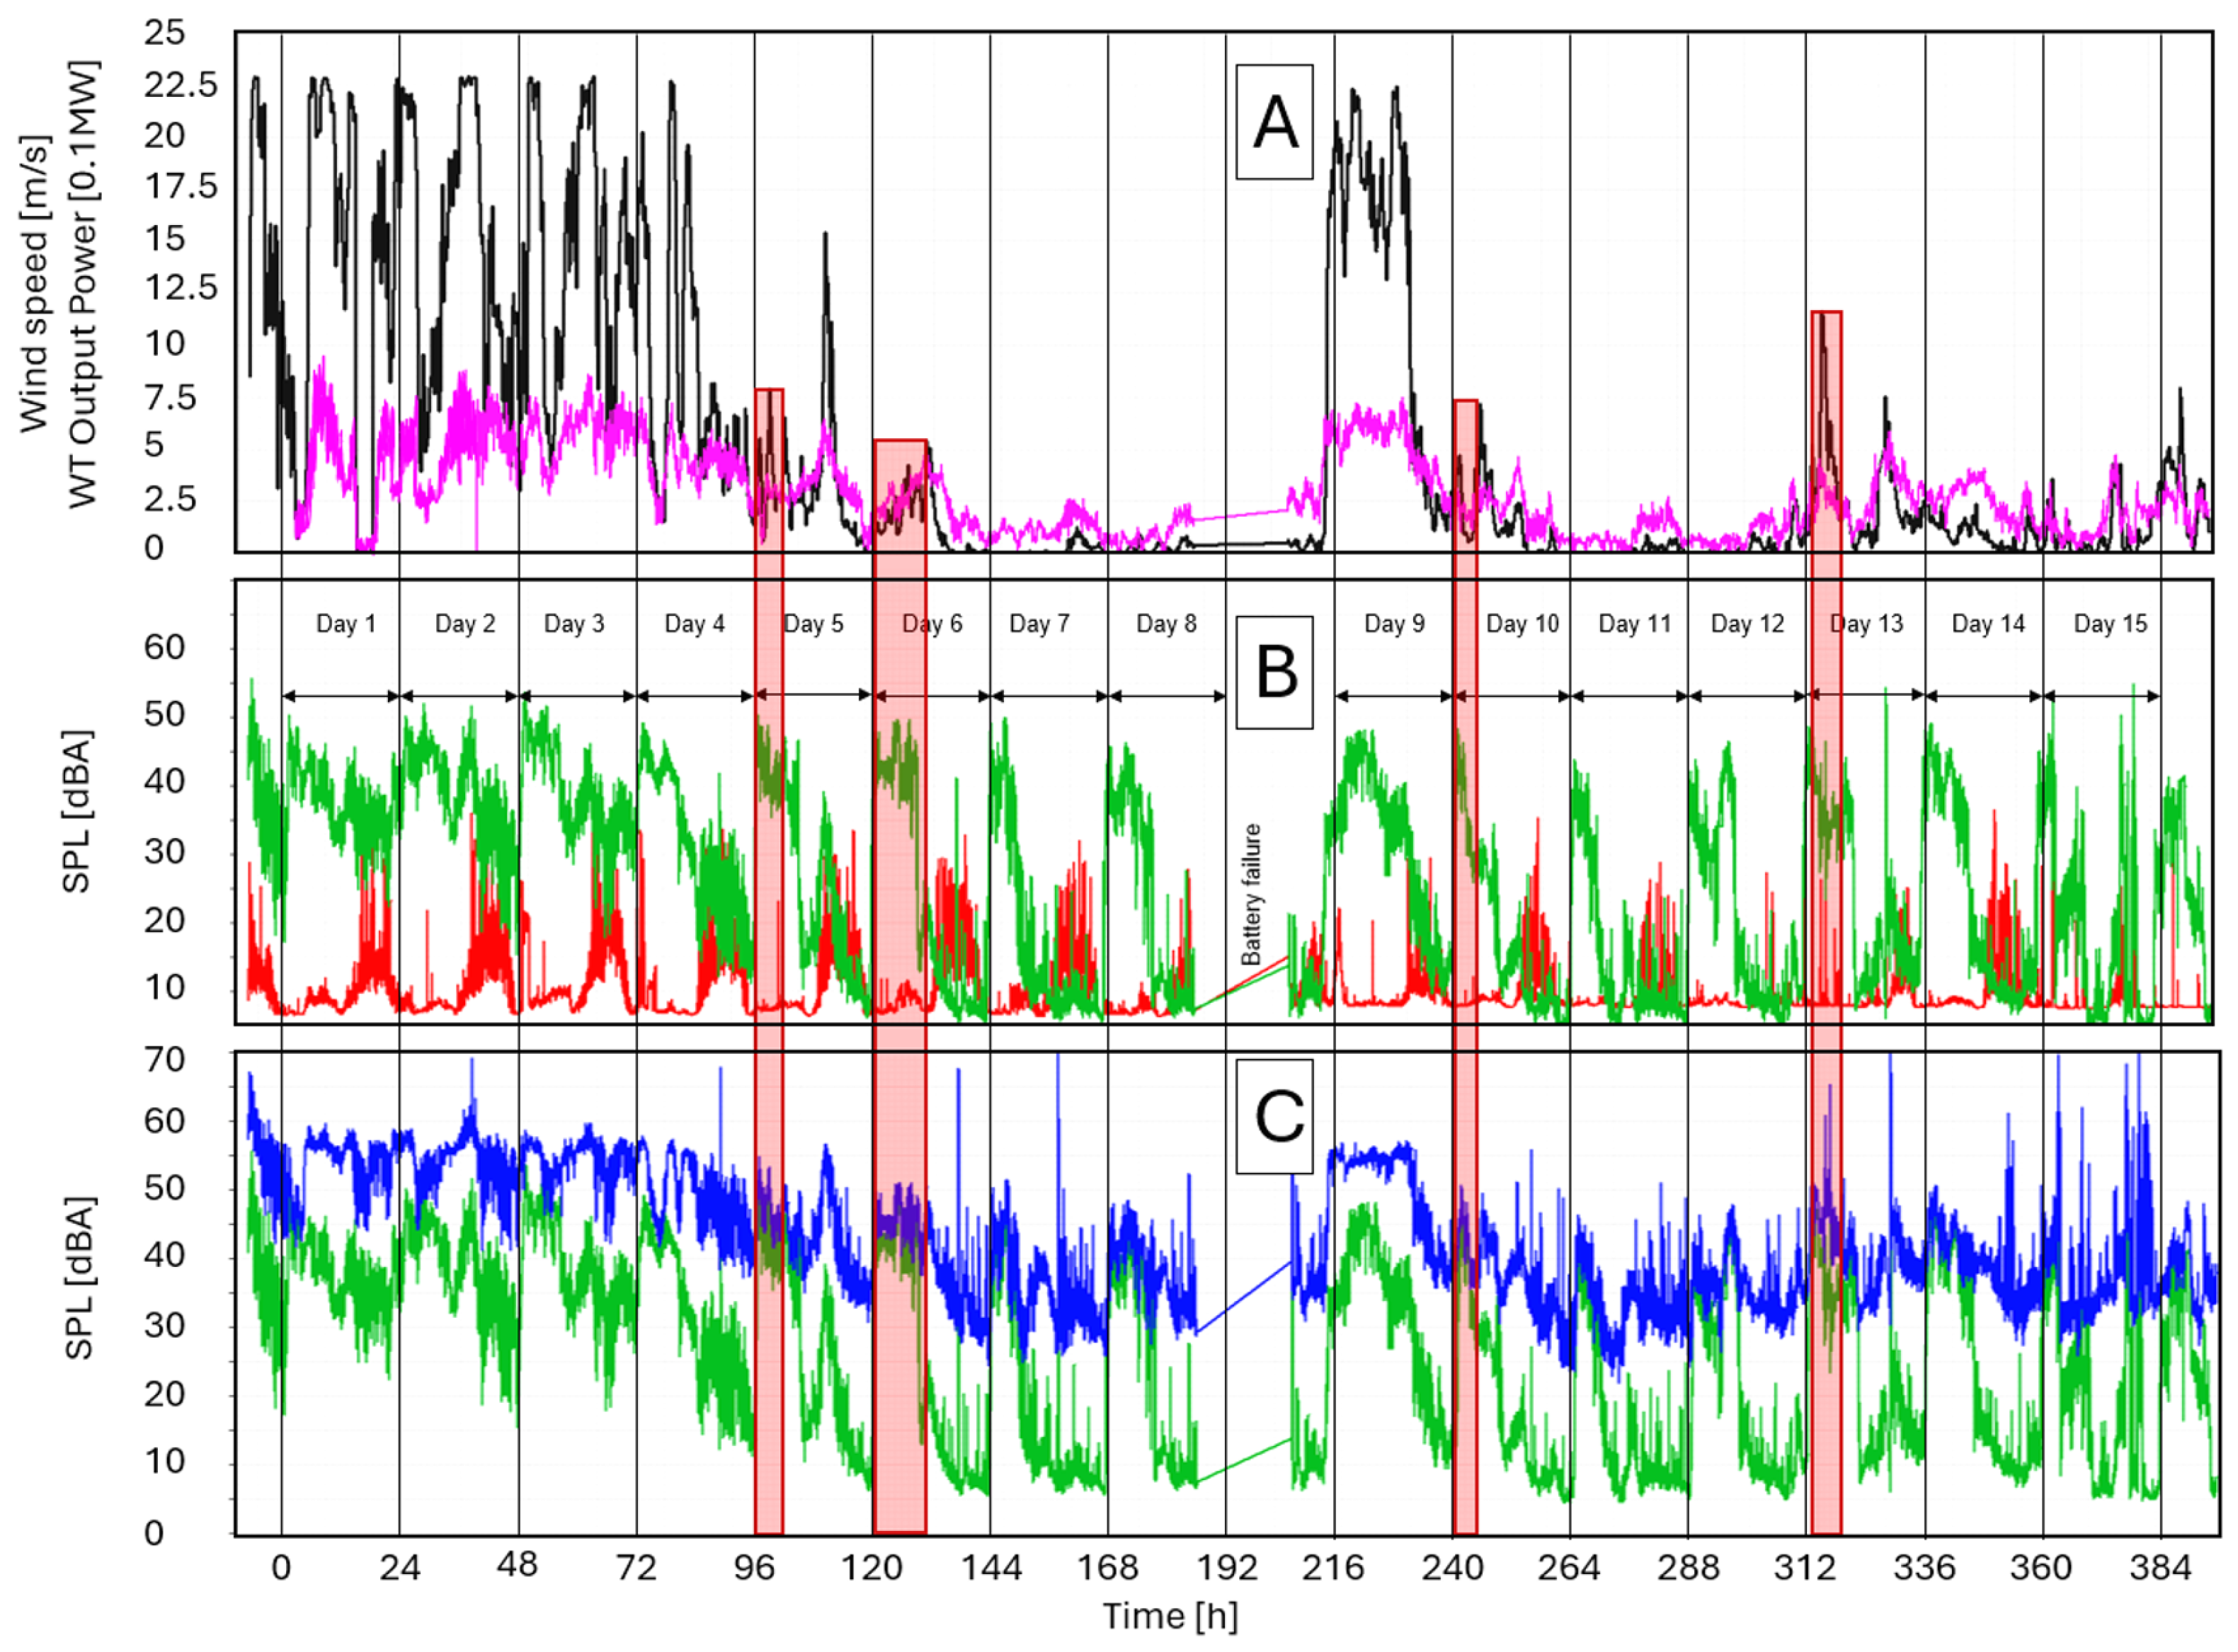
Time-synchronization of the multi-sensor data was required before analysis, as each sensor logged at a different rate. Figure 6A shows the wind turbine’s electrical output (black) alongside the corresponding wind speed (pink). Although higher wind speeds generally drive greater power production, deviations occur due to WT control. Figure 6B plots one-third-octave band levels at 2.5 kHz (green) and 20 kHz (red). Notably, sounds at 20 kHz do not depend on wind speed or WT operating power, whereas the periodic occurrence of sound events at 2.5 kHz is more pronounced during lower wind speeds and reduced WT operation. Field observations and expert consultation confirmed that the 2.5 kHz events correspond to cricket calls, most likely by Oecanthus pellucens. Figure 6C illustrates the overall A-weighted sound level (LAeq) (blue) and the level at 2.5 kHz (green). The frequency at 2.5 kHz, and consequently the sound of the cricket Oecanthus pellucens, is a dominant sound source during measurement periods marked with red intervals. Since the wind speeds and WT output power during these periods were not zero, it was necessary to perform corrections to accurately determine the sound power of the WT as a function of wind speed and to remove sounds of biological origin from the measured signals.
Such corrections of insect background noise are critical when WTSPL data is used for modeling environmental noise. Understanding the statistical distribution of wind speed and direction is vital in these models. In regions with dynamic changes of direction and speed over days, weeks, months, and even years, WTs often operate at partial loads. An overestimation of WTSPL as a function of wind speed can lead to overestimated noise modeling results, potentially resulting in legal restrictions that prevent WT installation, even if the actual noise levels would comply with regulatory limits. This issue highlights the importance of consistent methodologies in background noise corrections across different measurement practitioners. The inclusion or exclusion of insect noise can lead to varying outcomes, contributing to the inconsistent results observed in studies evaluating the impact of WTN on human populations.
To illustrate the temporal distribution of insect interference, Figure 7a–d plots wind direction, wind speed, SPL at the measurement point, and turbine power, respectively, with blue markers for “insect-free” and red for “insect-active” one-minute blocks. Insect calls occur predominantly at night and during low wind speeds, when turbine and ambient wind noise levels are low. Furthermore, Figure 7d illustrates the ouput power of the WT during the measurement period, sourced directly from the turbine operator with a time constant of 15 min. The difference in time constants was mended with applying the same value of power output for 15 consecutive wind and SPL measurements. A correlation between wind speeds and output power is evident, as expected. However, it is notable that SPL exhibits less correlation with wind speed, particularly during nighttime observations. This analysis sheds light on the complex relationship between environmental variables and their impact on recorded parameters, contributing significantly to the broader understanding of the research objectives.
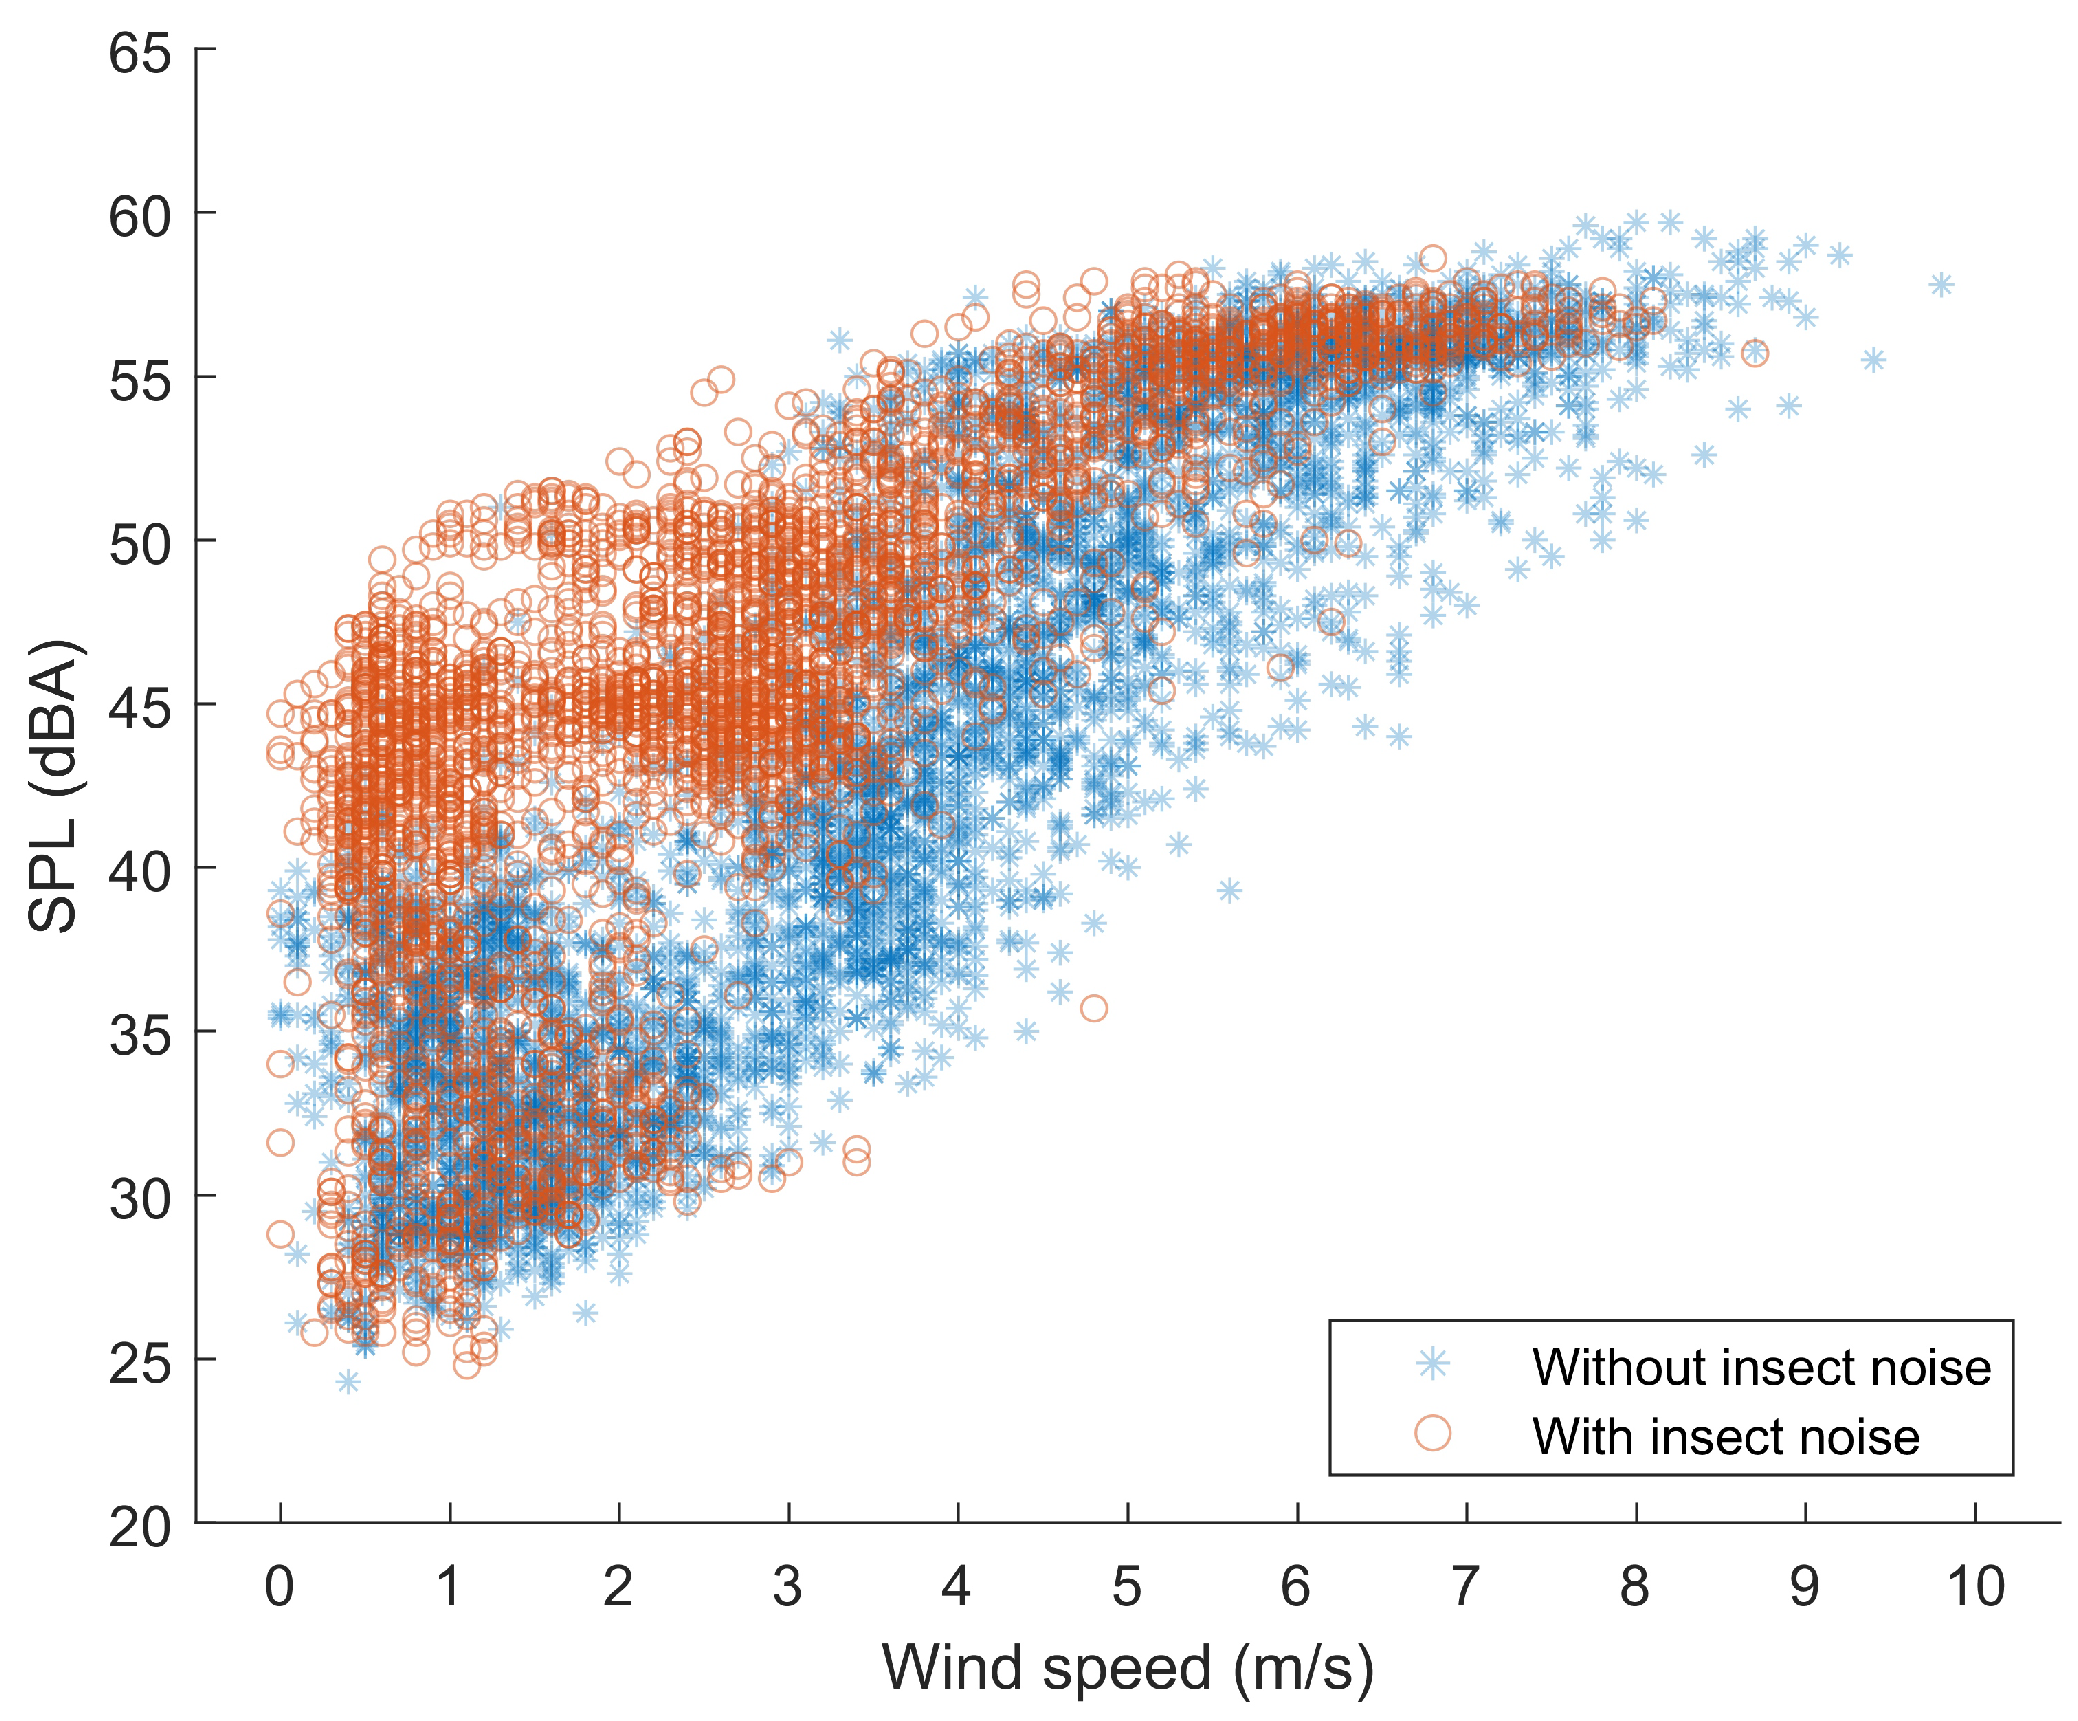
Figure 8 depicts a scatter plot illustrating the correlation between recorded SPL and wind speed. The data reveals a disparity in the relationship between these variables. Observations within the dataset demonstrate instances where a wide range of SPL values, around 55 dBA, are recorded across wind speeds spanning from less than 3 m/s to nearly 10 m/s. This variance underscores the complexity of factors influencing SPL beyond wind speed alone. Higher measured SPL values in recordings with insect noise are noticeable at lower wind speeds.
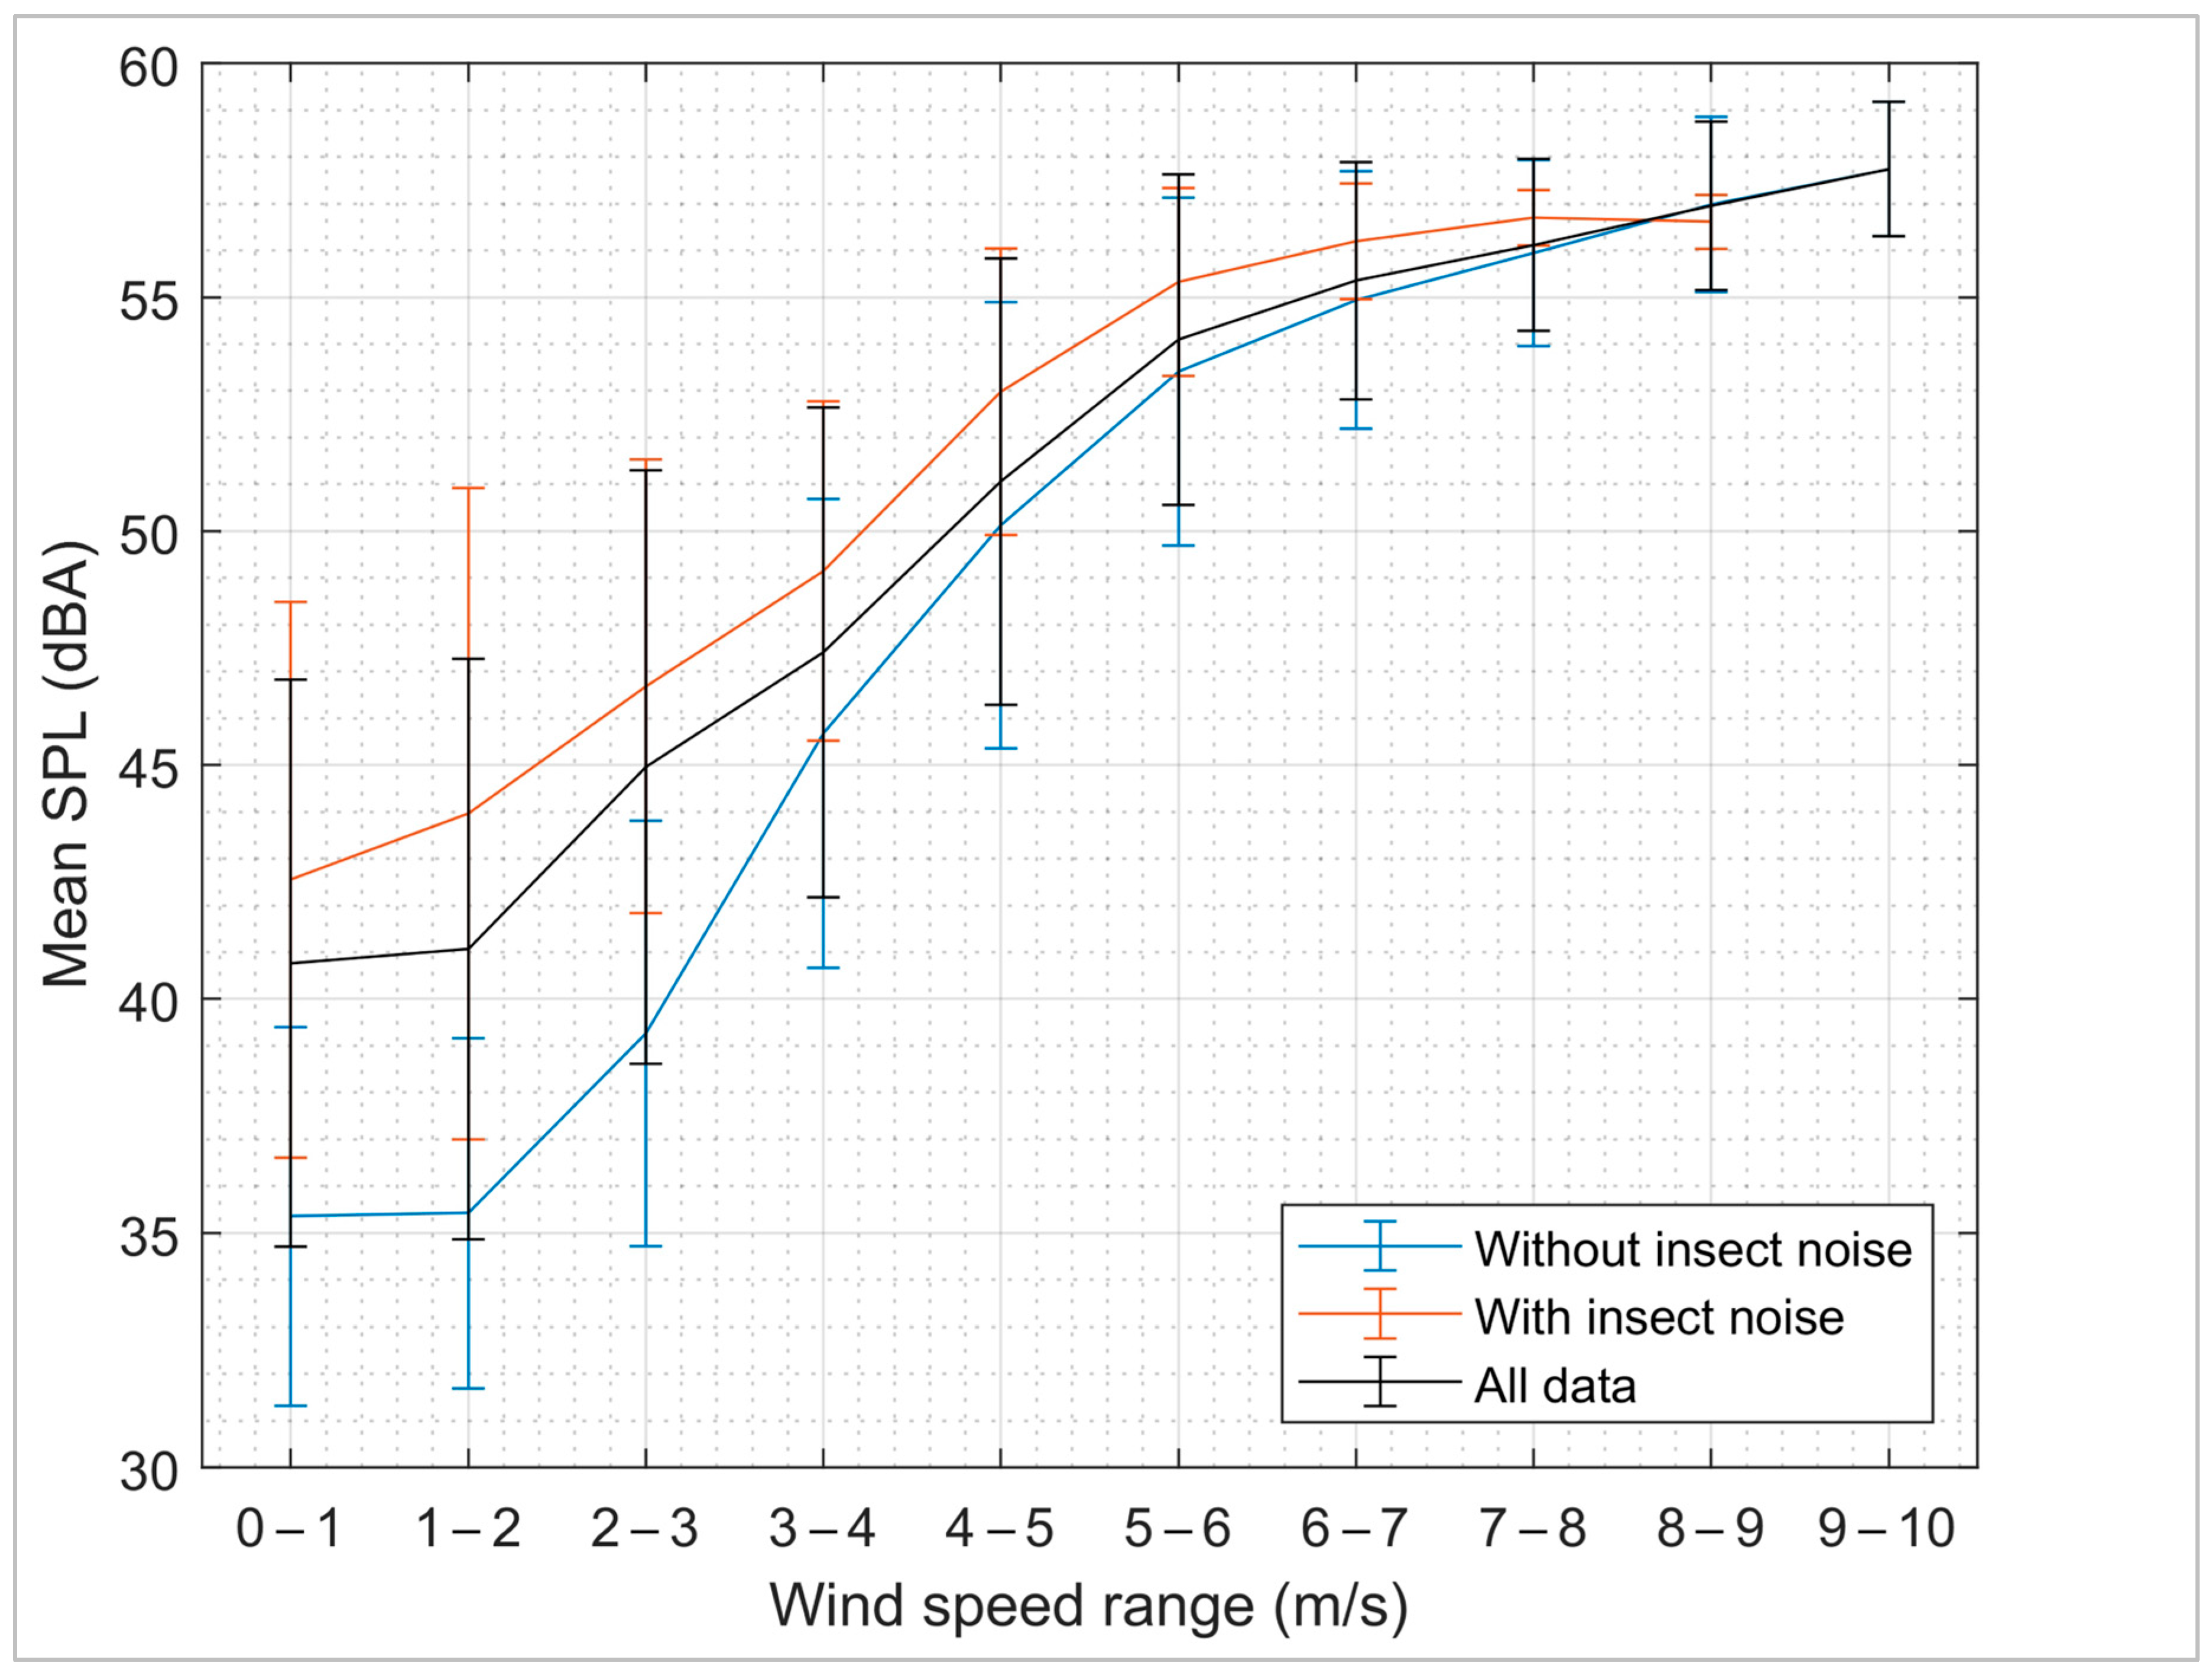
To quantify this influence across wind-speed bins, Figure 9 plots the mean SPL within each 1 m/s interval, comparing insect-free and full datasets. The mean SPL difference grows from <1 dBA at wind speeds above 6 m/s to over 4 dBA below 3 m/s. Long-term (black) versus short-term (red) averaging further reveals that extended measurements mitigate random wildlife noise but do not eliminate the low-wind bias.
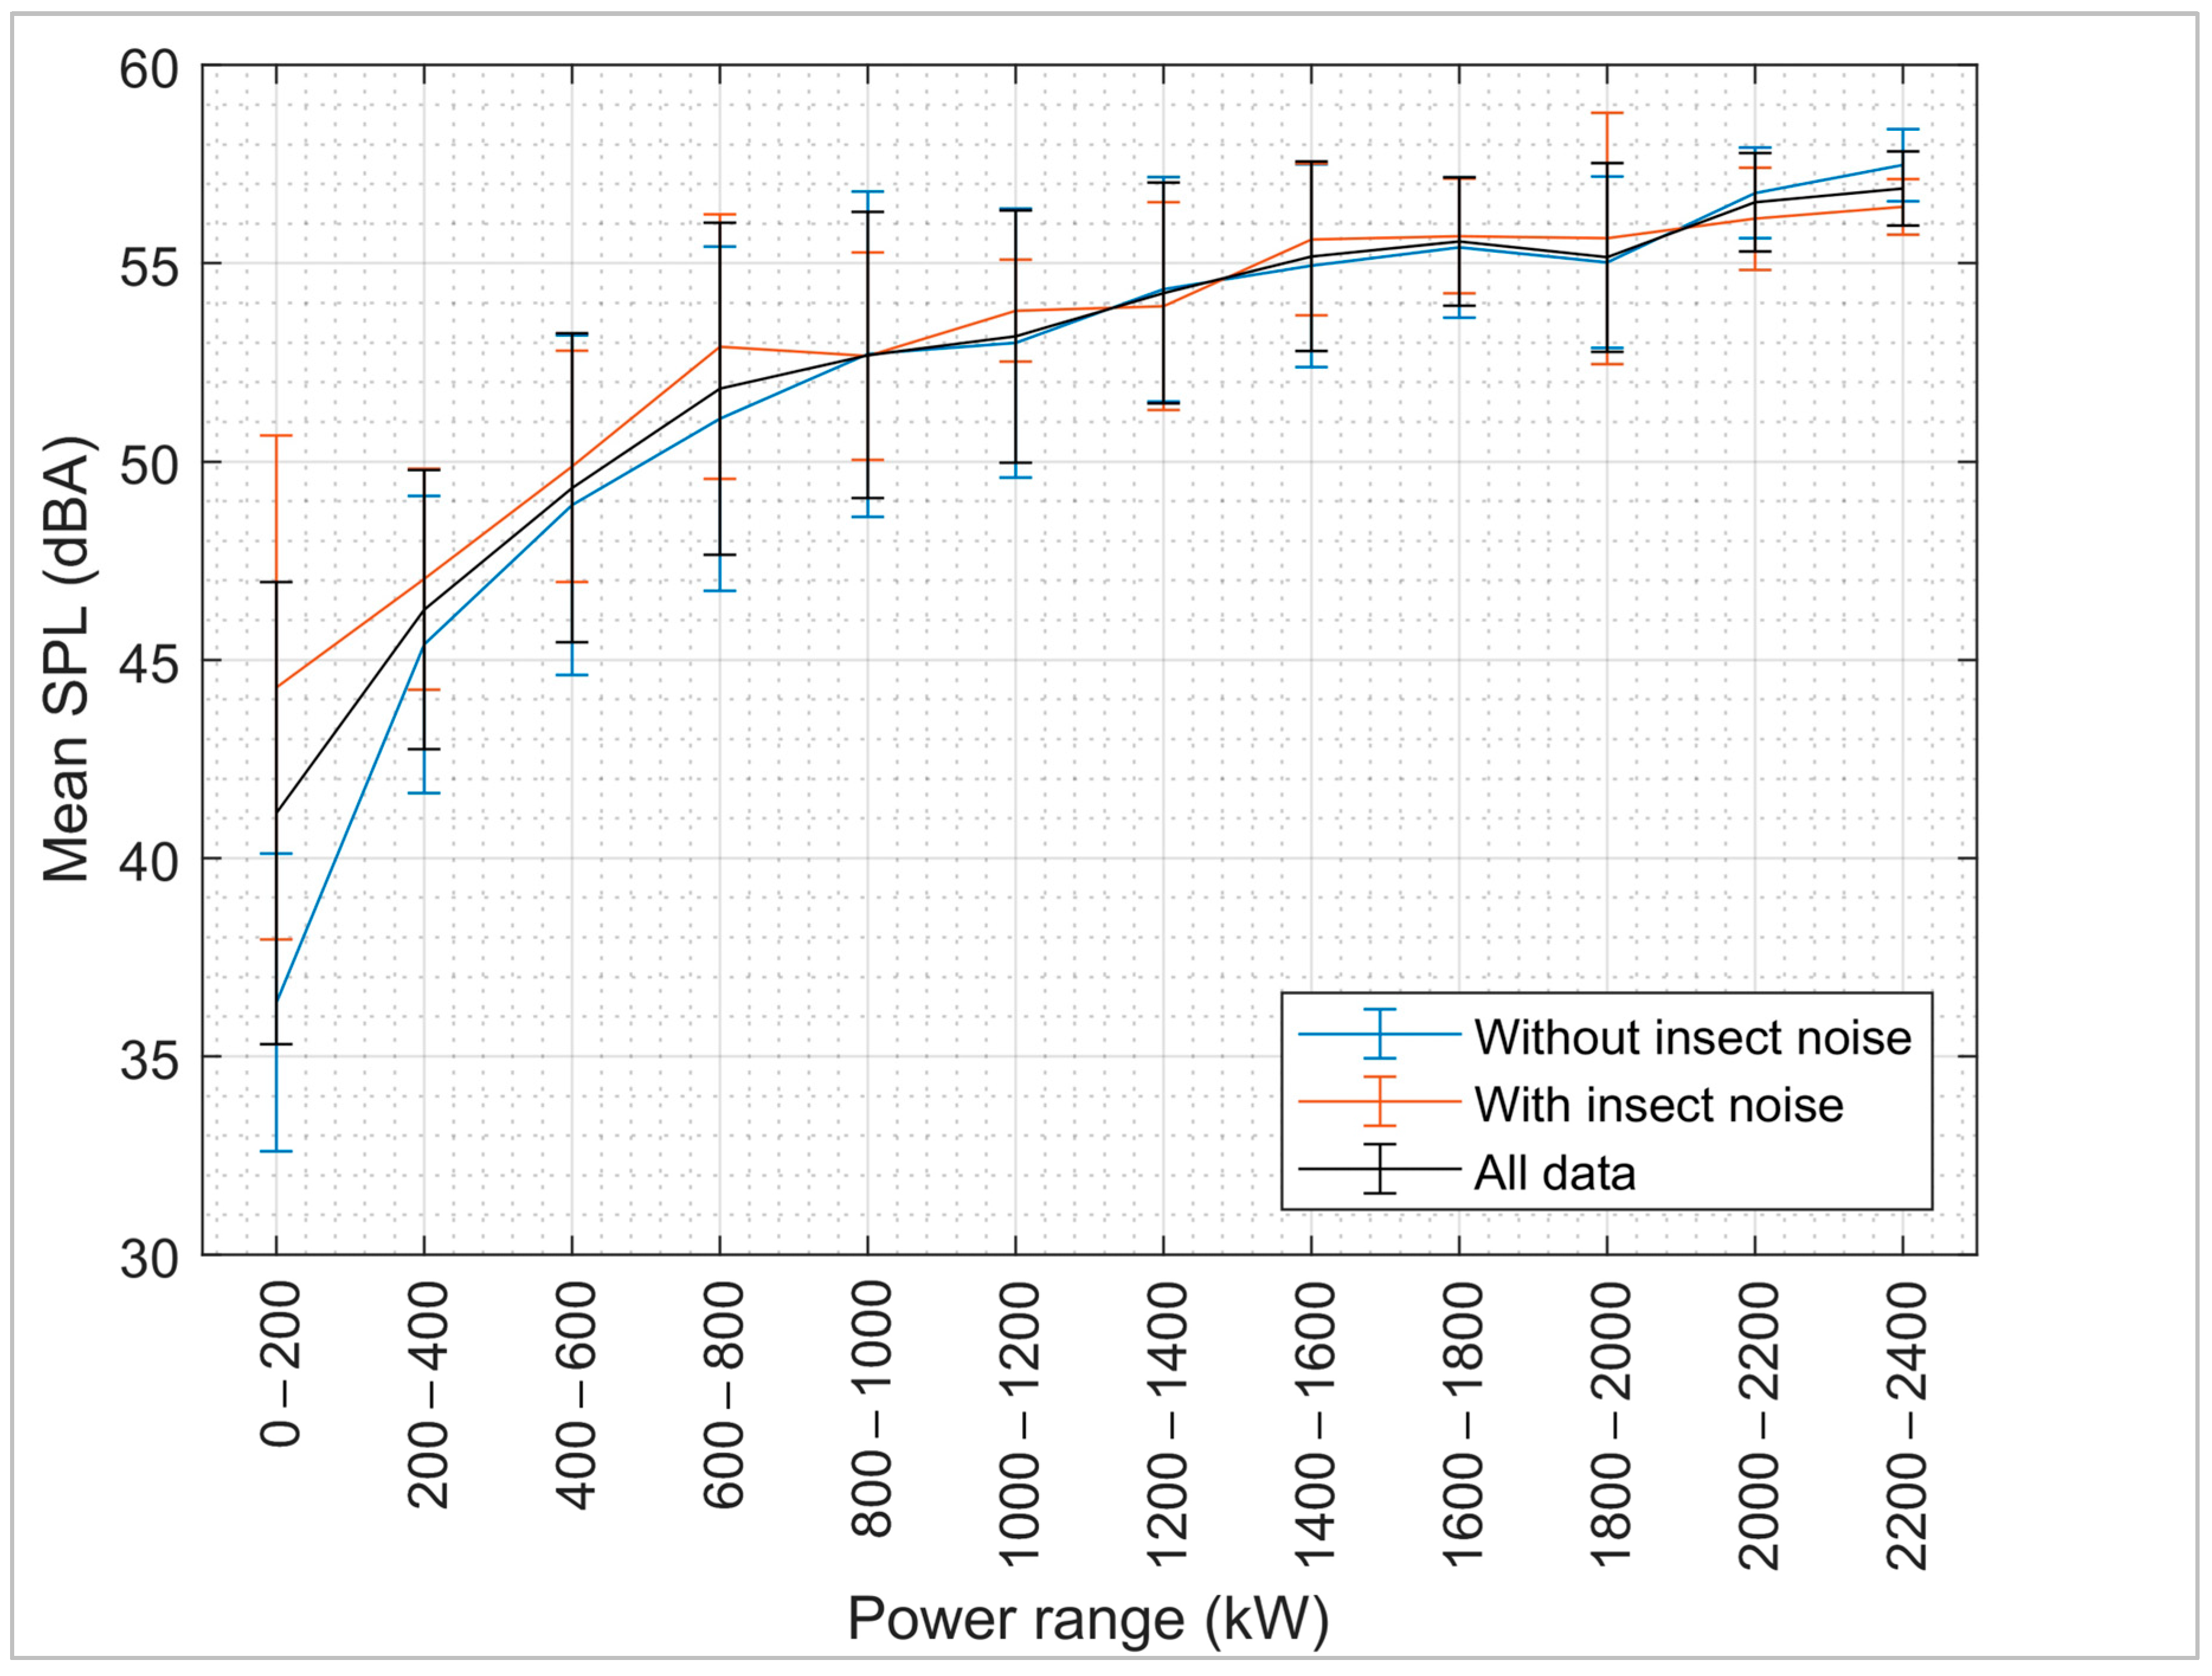
Finally, Figure 10 correlates turbine power output ranges with corresponding SPL statistics. Lower power outputs (partial load) coincide with larger SPL variances due to insect noise, whereas higher outputs mask biological sounds under dominant aerodynamic noise. These findings highlight that failing to correct for insect calls can overestimate Lden in environmental models—potentially leading to overly conservative setback requirements in regions where turbines frequently operate at partial power, such as Dolenja vas.
This difference between SPL values from different WT output power ranges seems small but is especially important for assessment of long-term noise Lden from modeling at areas where wind turbines operate only with partial power output, as is the case in Dolenja vas.

4. Discussion

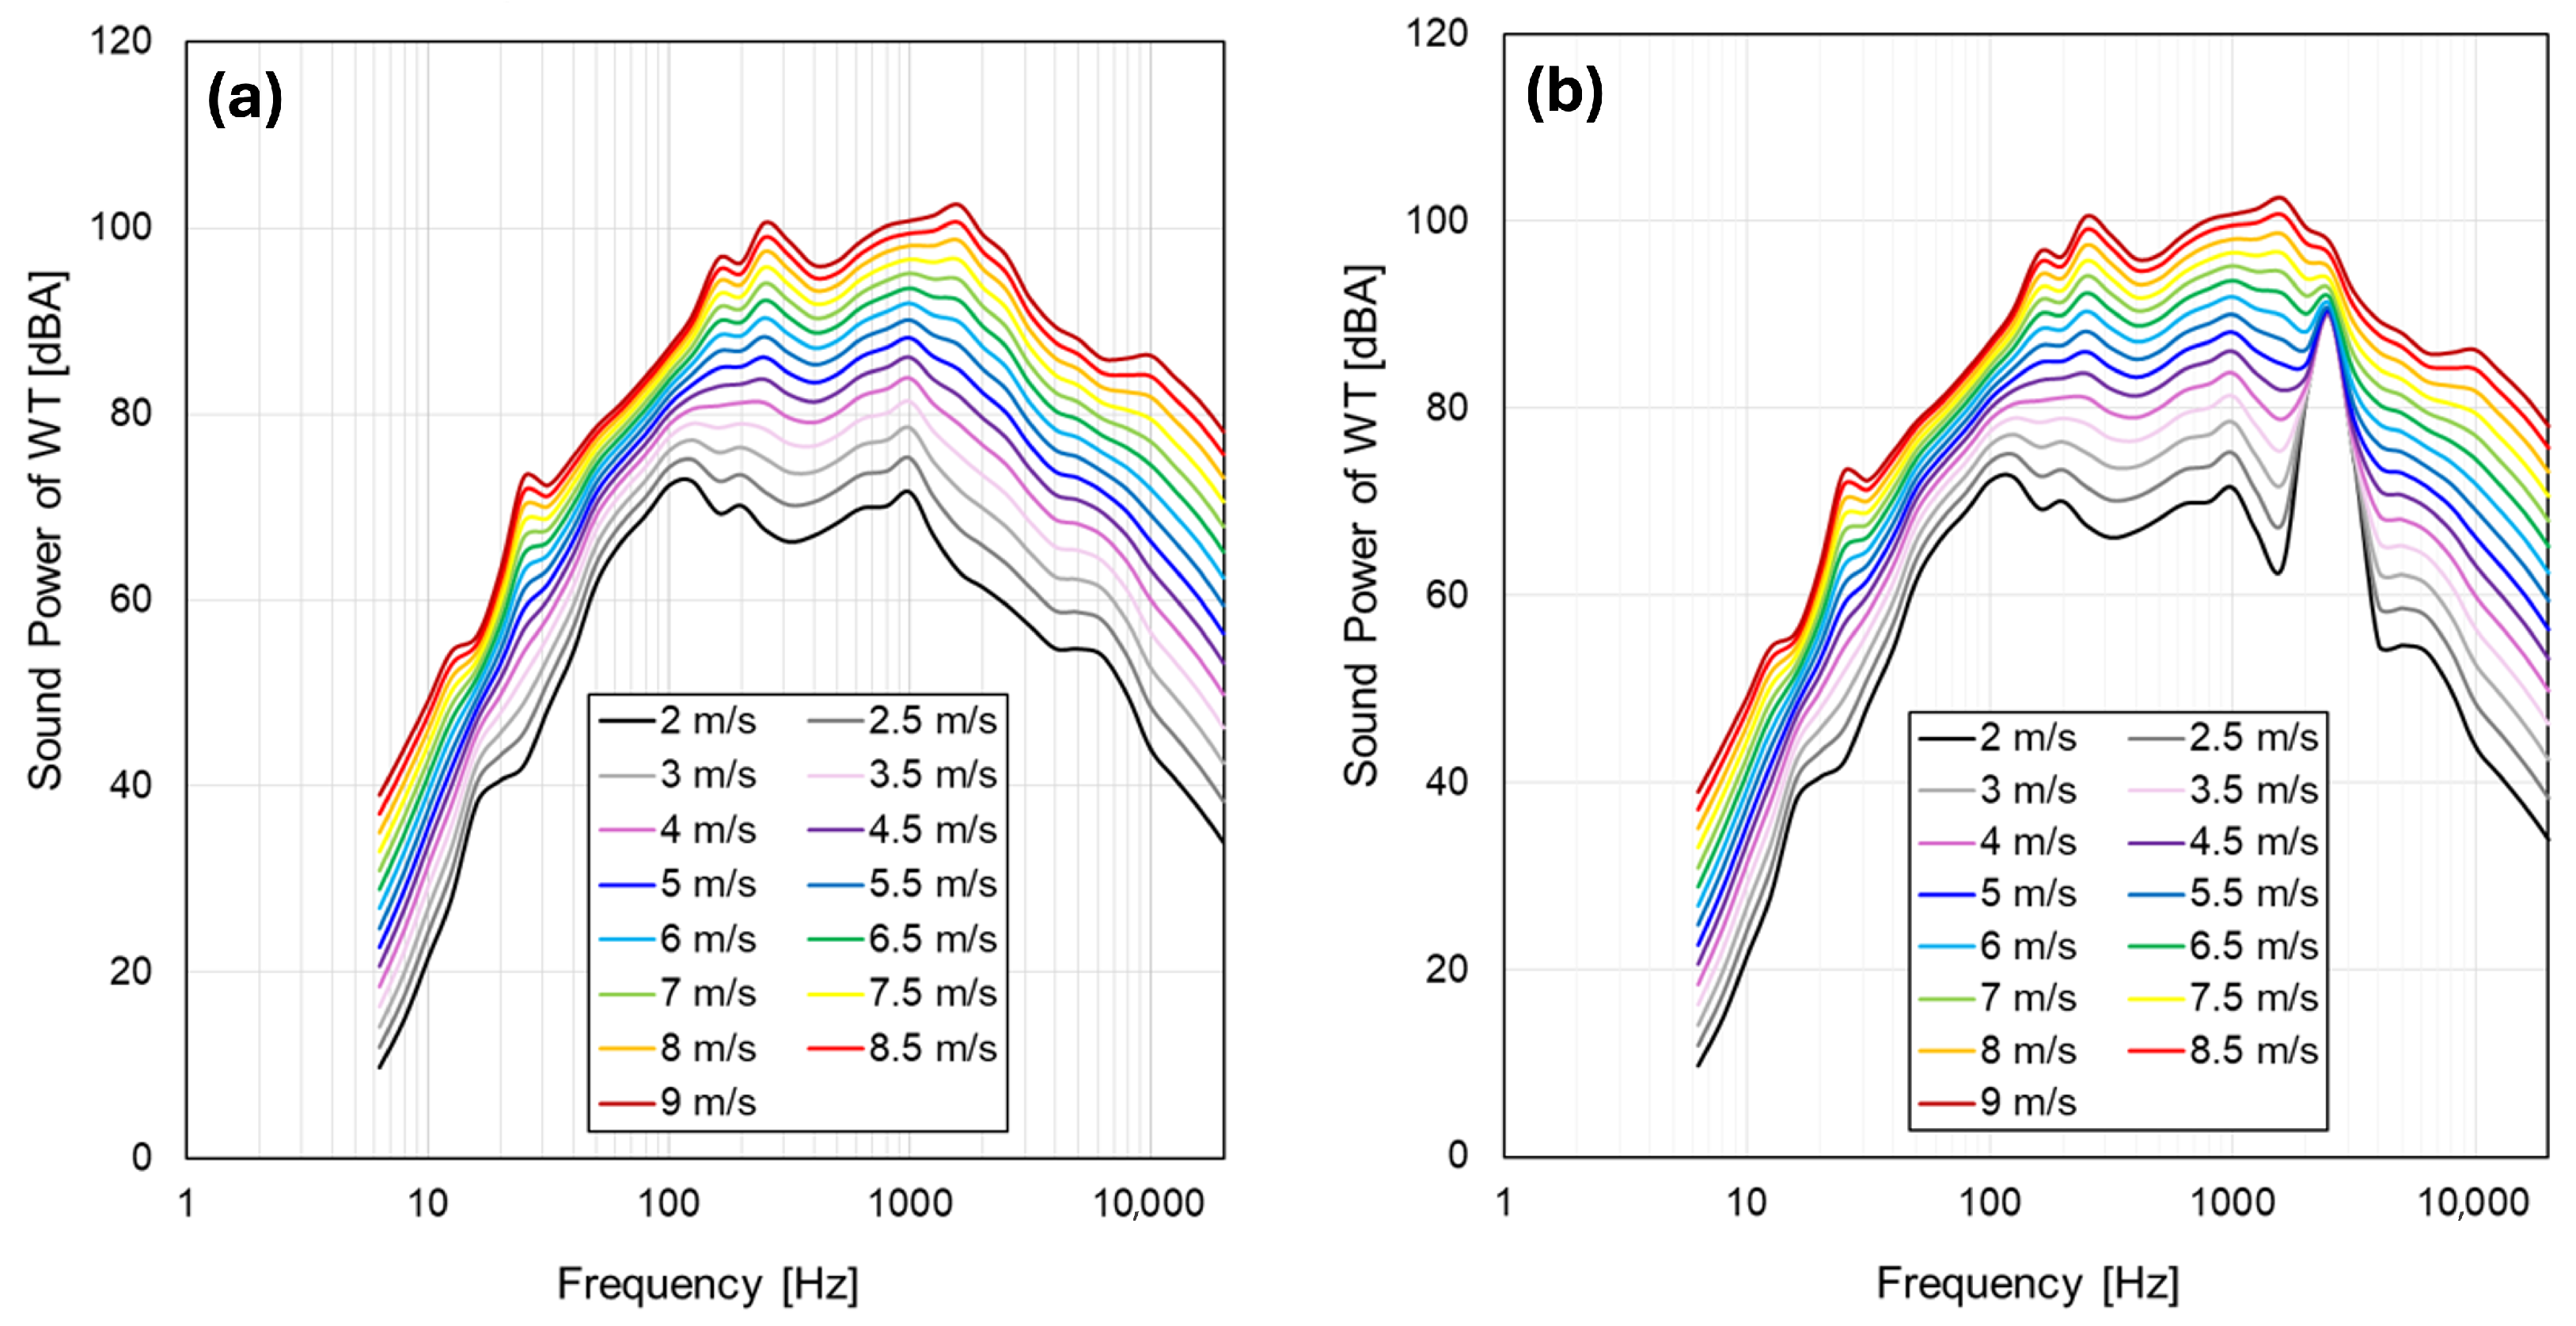
Our results demonstrate that insect vocalizations, particularly those of Oecanthus pellucens, can substantially bias wind turbine sound power maps at low wind speeds. Figure 11 shows A-weighted sound power spectra across wind speeds: when cricket calls are excluded, the spectrum reflects only turbine emissions (left panel), whereas inclusion of insect noise (right panel) elevates the estimated sound power by up to 4 dBA at 4 m/s and by approximately 1 dBA at 6 m/s. Above 8 m/s, insect contributions fall below 0.3 dBA and can be neglected. These wind-speed-dependent errors shown in Figure 12 directly translate into inaccuracies in predicted sound pressure levels ( L p A ) at receptor locations when using standard propagation models (Equation (2) [38]).
Having demonstrated through examples and simulations how crickets affect the measured sound power values of wind turbines (WT), it is essential to further analyze their impact on the estimated total noise levels at protected locations. This assessment is crucial because it determines whether a location is overburdened with noise and falls within the WT’s noise influence zone.
Once the sound power of the WT is established, it is possible to invert equations to calculate the expected sound pressure levels ( L p , A ) at any distance (l) from the wind turbine to the reception point. In performing these calculations, it is important to consider the characteristics of the acoustic environment. For outdoor noise propagation, factors such as potential reflections ( L m ), terrain roughness ( L g ), and air absorption ( L a ) must be accounted for. The equation for calculating the sound pressure level at any distance from the center of the turbine shaft is as follows (Equation (2) [38]):
L p , A = L W , A , r e f 10 log 10 ( l 2 + h 2 ) 11 dB + Δ L g Δ L a + Δ L m ,
where L W , A , r e f is the sound power of the wind turbine, l is the distance from the turbine to the calculation point, h is the height of the wind turbine, from the ground to the rotor shaft, δ L g is the terrain correction (1.5 dB for onshore turbines and 3 dB for offshore turbines), δ L m is the correction for multiple reflections (0 dB for onshore wind turbines), and δ L a is the air absorption, defined by the following equation.
Δ L a = α ( f l 2 + h 2 ) .
The result calculated using Equation (3) [38], as defined in the Danish Statutory Order on noise from wind turbines, provides an estimate of the sound pressure level in a free sound field. This calculation is valid for points located at least six meters above the ground and six meters away from the facades of large surfaces. Noise levels are typically weighted and average over extended periods. During these periods, wind speed exhibits its own statistical distribution.
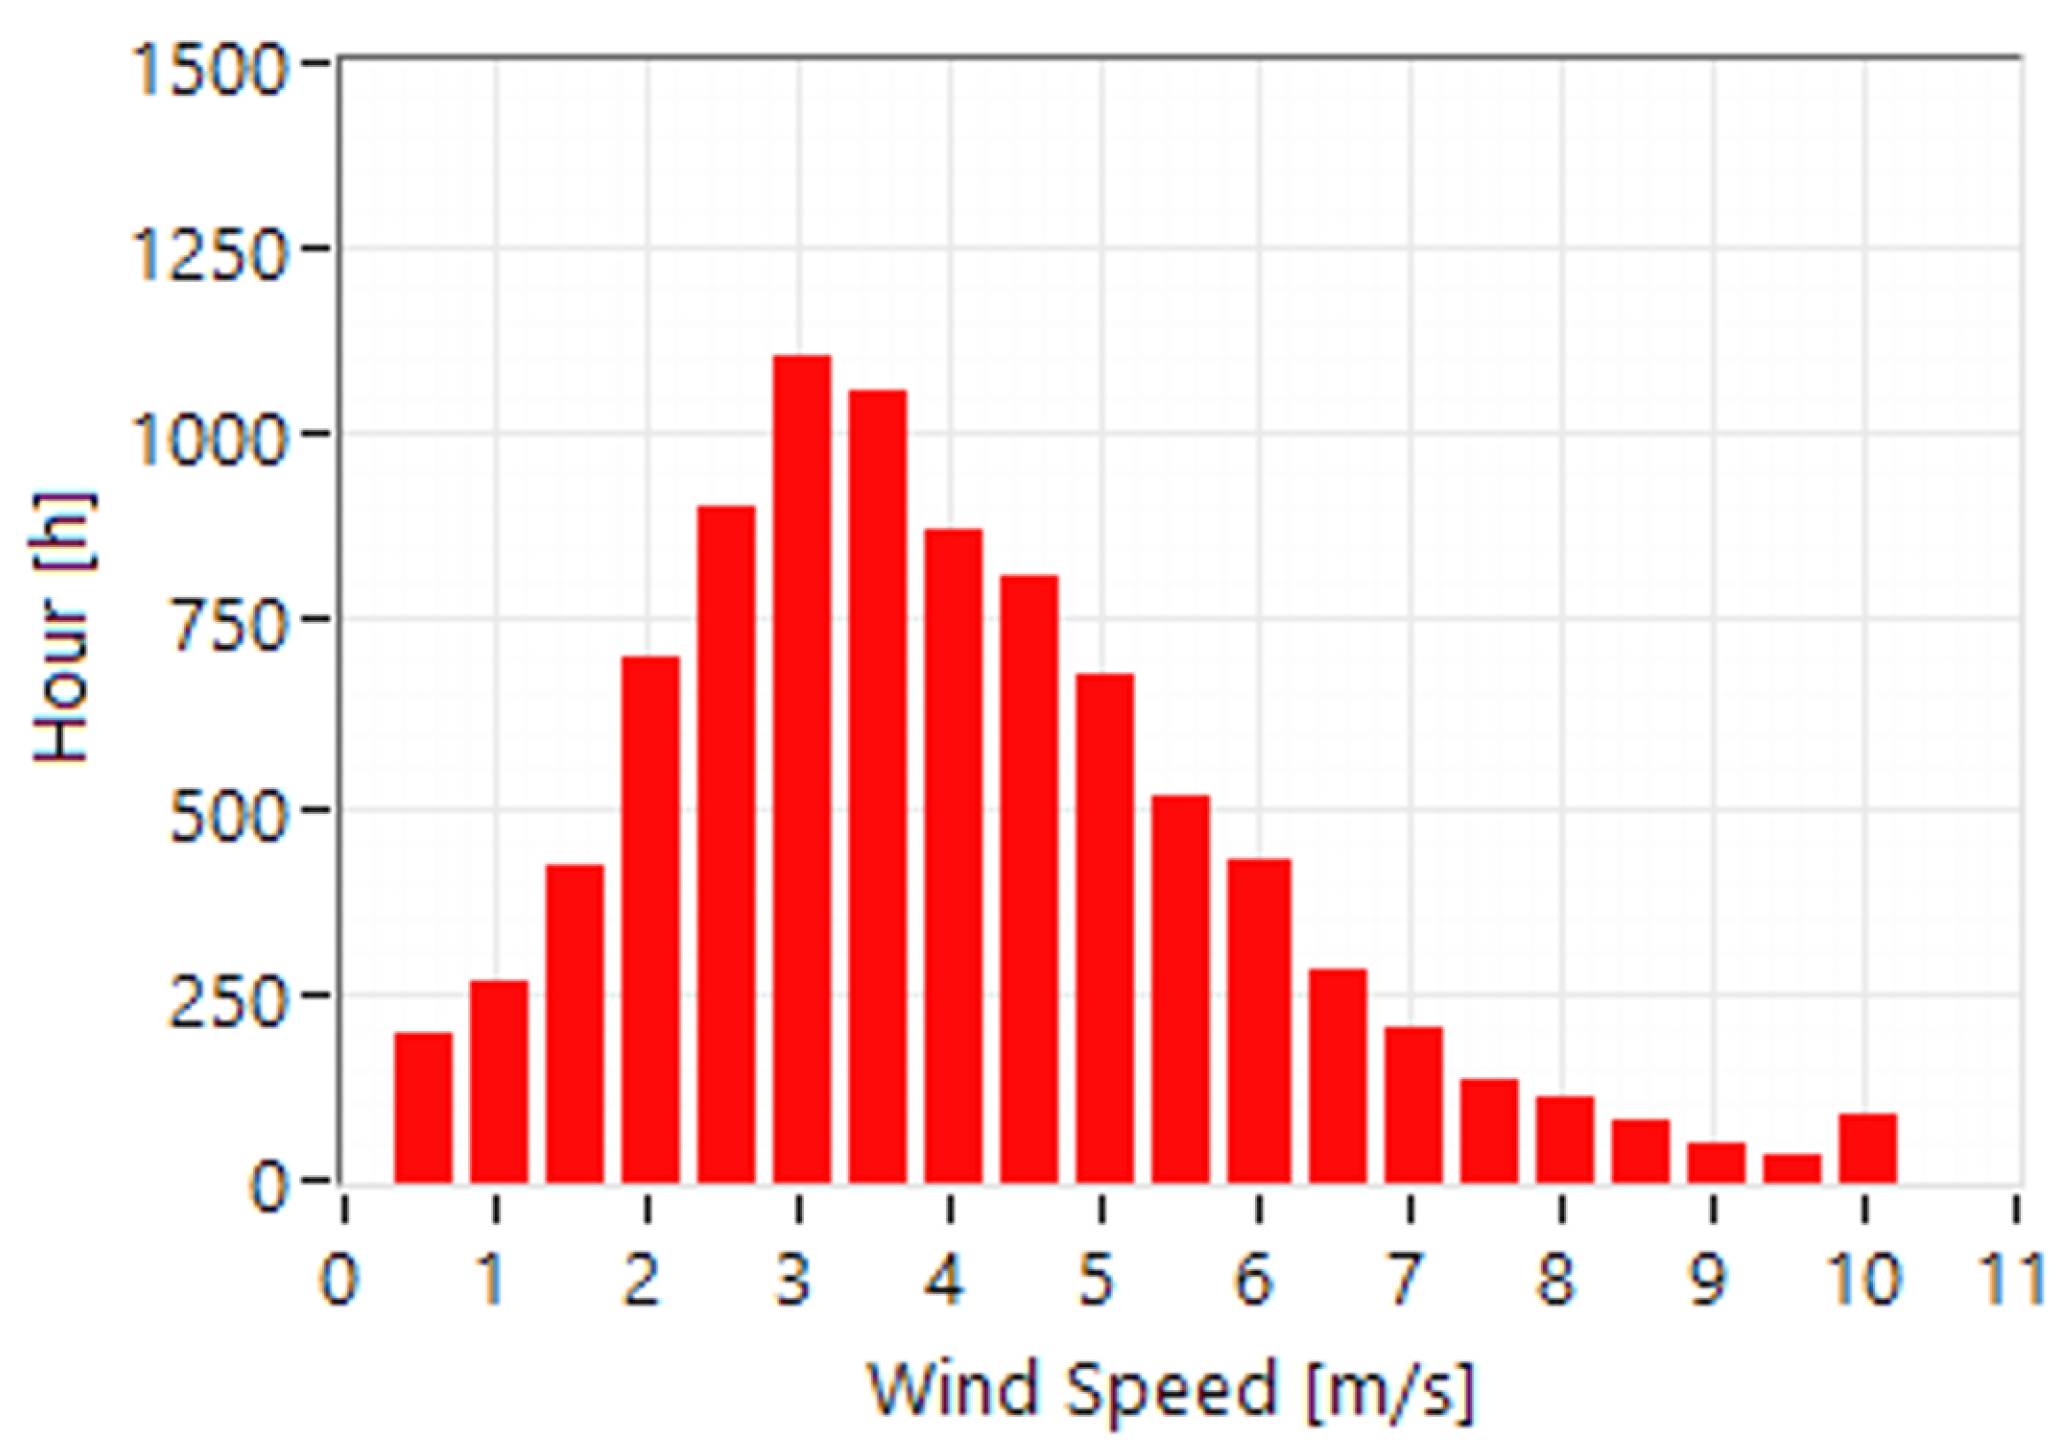
Measurement of wind statistics at several Slovenian locations designated for WTs were made [52]. Based on the data, as shown in Figure 13, an average noise level ( L p , a v g ), time-weighted according to the intervals during which the WT operates at specific levels, was calculated using Equation (4). In this equation, T 0 represents 8760 h, equivalent to one year, while T i denotes the intervals representing the duration of WT operation under wind speed interval i. L p i is the sound pressure level calculated at the evaluation point, situated 6 m above ground level and 6 m in front of the façade (see Table 2).
L p , a v g = 10 log 10 1 T 0 i = 1 N T i 10 L p i 10 .
Although cricket calls elevate results of the WT sound power level map at low velocities, their influence on calculated sound pressure level at higher distances from the WT diminishes rapidly due to strong air absorption at 2.5 kHz.
These findings reinforce the importance of long-term measurements and background noise filtering. Episodic insect activity, most pronounced at night and low wind speeds, can bias short-term sound power estimates and, if uncorrected, lead to overly conservative environmental noise predictions and siting restrictions. Background noise assessment ideally should be performed at the same location without the presence of the wind turbine, but economic constraints make this practically impossible. An alternative approach involves conducting measurements before the installation of wind turbines, although this is less common due to the absence of turbine-generated noise to assess its potential impact on nearby residents.

5. Conclusions

This study demonstrates that biological acoustic contamination introduces a significant positive bias (up to 10 dBA) in wind turbine noise (WTN) measurements, particularly at low wind speeds. Our core contribution is a machine learning-based methodology (GMM clustering) that enables the exclution of these confounding insect calls. This methodology enhances the accuracy of WTN sound power level determination, thus addressing a critical uncertainty in environmental noise impact assessments. The results validate the necessity of using advanced, data-driven filtering techniques for long-term acoustic monitoring to ensure compliance and support evidence-based regulatory policy in wind energy development.

Limitations and Future Work

Future research should focus on generalizing the ML methodology by incorporating a broader database of bio-acoustic contaminants across diverse geographical regions and seasons. This would enhance the robustness and applicability of the approach.

Author Contributions

Conceptualization, J.P., A.H. and L.Č.; methodology, J.P., A.H. and J.M.; software, A.H. and J.M.; validation, A.H.; formal analysis, J.P. and J.M.; investigation, A.H. and J.M.; resources, J.P.; data curation, J.M. and L.Č.; writing—original draft preparation, A.H. and J.M.; writing—review and editing, J.P. and A.H.; visualization, J.P., A.H. and J.M.; supervision, J.P.; project administration, J.P.; funding acquisition, J.P. All authors have read and agreed to the published version of the manuscript.

Funding

This research was supported by (1) combined CRP project from Ministry of the Environment, Climate and Energy (MOPE), and Slovenian Research and Innovation Agency (ARIS): V2-24025: “Managing low-frequency noise in promoting the use of renewable energy sources”. (2) ARIS basic research project J7-50042: “Acoustic Monitoring of Urban Noise and Biodiversity for a Green Future using IoT Sound Radar and AI for Event Classification,” as well as (3) ARIS research project Z7-60185: “Sustainable Environmental Solutions: Spatial Domain as the Future of Noise Monitoring”. (4) ARIS grant P2-0401. (5) We also extend our thanks to MOPE for their financial support of the project “Analysis of Wind Farm Noise Measurement Methodology.”

Institutional Review Board Statement

Not applicable.

Informed Consent Statement

Not applicable.

Data Availability Statement

Data will be made available upon request.

Conflicts of Interest

The authors declare no conflicts of interest.

Abbreviations

The following abbreviations are used in this manuscript:
WTWind Turbine
WTNWind Turbine Noise
GMMGaussian Mixture Model
SPLSound Pressure Level (based on pressure and Pa) [dBA]
WTSPLWind Turbine Sound Power Level (based on power and W) [dBA]

References

  1. Andrej, H.; Jure, M.; Jurij, P. Influence of Biological Sounds on Long-Term Measurements of Wind Turbine Noise. In Proceedings of the 11th International Conference on Electrical, Electronics and Computer Engineering (IcETRAN), Novi Sad, Serbia, 3–6 June 2024; Available online: https://www.etran.rs/2024/E_ZBORNIK_IcETRAN_2024/001_AKI1.3.pdf (accessed on 22 September 2025).
  2. Caporale, D.; Sangiorgio, V.; De Lucia, C. Extended reality-based choice experiment to assess the impact of offshore wind turbines in historic center: The case of Manfredonia. J. Environ. Manag. 2024, 349, 119454. [Google Scholar] [CrossRef]
  3. Pepermans, G.; Rousseau, S. Consumers and citizens: Identity salience in choice settings focusing on local wind turbines. J. Environ. Manag. 2021, 281, 111857. [Google Scholar] [CrossRef]
  4. Trucco, A. Predicting Underwater Noise Spectra Dominated by Wind Turbine Contributions. IEEE J. Ocean. Eng. 2024, 49, 1675–1694. [Google Scholar] [CrossRef]
  5. Yang, C.; Ding, S.; Zhou, G. Wind turbine blade damage detection based on acoustic signals. Sci. Rep. 2025, 15, 3930. [Google Scholar] [CrossRef]
  6. Ferreira da Silva, M.; Nunes Masson, J.E.; Santos, M.F.d.; Rodrigues Silva, W.; Wladimir Molina, I.; Martins, G.M.C. Audible Noise Evaluation in Wind Turbines Through Artificial Intelligence Techniques. Sensors 2025, 25, 1492. [Google Scholar] [CrossRef] [PubMed]
  7. Araújo Alves, J.; Neto Paiva, F.; Torres Silva, L.; Remoaldo, P. Low-Frequency Noise and Its Main Effects on Human Health—A Review of the Literature between 2016 and 2019. Appl. Sci. 2020, 10, 5205. [Google Scholar] [CrossRef]
  8. Rkhiss, A.; Finez, A.; Gloaguen, J.R.; Maillard, J.; Vasile, G. Automatic estimation of the wind turbine noise with recurrent neural networks. In INTER-NOISE and NOISE-CON Congress and Conference Proceedings, Proceedings of the 53rd International Congress and Exposition on Noise Control Engineering, Nantes, France, 25–29 August 2024; Institute of Noise Control Engineering: Wakefield, MA, USA, 2024; Volume 270, pp. 3020–3030. [Google Scholar]
  9. Ciaburro, G.; Iannace, G.; Puyana-Romero, V.; Trematerra, A. Machine Learning-Based Tools for Wind Turbine Acoustic Monitoring. Appl. Sci. 2021, 11, 6488. [Google Scholar] [CrossRef]
  10. Wang, Q.; Zhang, H.; Wang, X.; Ni, Y. Wind Turbine Airfoil Noise Prediction Method Based on Generalized Airfoil Database and Residual Neural Network. Appl. Sci. 2025, 15, 5123. [Google Scholar] [CrossRef]
  11. Yang, H.; Yuan, W.; Zhu, W.; Sun, Z.; Zhang, Y.; Zhou, Y. Wind turbine airfoil noise prediction using dedicated airfoil database and deep learning technology. Appl. Energy 2024, 364, 123165. [Google Scholar] [CrossRef]
  12. Alamir, M.A.; Hansen, K.L.; Zajamsek, B.; Catcheside, P. Subjective responses to wind farm noise: A review of laboratory listening test methods. Renew. Sustain. Energy Rev. 2019, 114, 109317. [Google Scholar] [CrossRef]
  13. Gallo, P.; Fredianelli, L.; Palazzuoli, D.; Licitra, G.; Fidecaro, F. A procedure for the assessment of wind turbine noise. Appl. Acoust. 2016, 114, 213–217. [Google Scholar] [CrossRef]
  14. Fredianelli, L.; Carpita, S.; Licitra, G. A procedure for deriving wind turbine noise limits by taking into account annoyance. Sci. Total Environ. 2019, 648, 728–736. [Google Scholar] [CrossRef] [PubMed]
  15. Zagubień, A.; Wolniewicz, K. The impact of supporting tower on wind turbine noise emission. Appl. Acoust. 2019, 155, 260–270. [Google Scholar] [CrossRef]
  16. Fredianelli, L.; Gallo, P.; Licitra, G.; Carpita, S. Analytical assessment of wind turbine noise impact at receiver by means of residual noise determination without the wind farm shutdown. Noise Control Eng. J. 2017, 65, 417–433. [Google Scholar] [CrossRef]
  17. Echeverri-Londoño, C.A.; González-Fernández, A.E. Model for the prediction of noise from wind turbines. Rev. Fac. De Ing. Univ. De Antioq. 2018, 55–65. [Google Scholar] [CrossRef]
  18. Iannace, G.; Berardi, U.; Ciaburro, G.; D’Orazio, D.; Trematerra, A. Mini-wind turbine noise measured inside near-by houses. Can. Acoust. 2020, 48, 18–20. [Google Scholar]
  19. Zagubien, A. Measurement of Background Noise in the Environment-Cases Studies. Rocz. Ochr. Srodowiska 2018, 20, 1498–1514. [Google Scholar]
  20. Öhlund, O.; Larsson, C. Meteorological effects on wind turbine sound propagation. Appl. Acoust. 2015, 89, 34–41. [Google Scholar] [CrossRef]
  21. Guest, E.E.; Stamps, B.F.; Durish, N.D.; Hale, A.M.; Hein, C.D.; Morton, B.P.; Weaver, S.P.; Fritts, S.R. An updated review of hypotheses regarding bat attraction to wind turbines. Animals 2022, 12, 343. [Google Scholar] [CrossRef]
  22. Kunz, T.H.; Arnett, E.B.; Cooper, B.M.; Erickson, W.P.; Larkin, R.P.; Mabee, T.; Morrison, M.L.; Strickland, M.D.; Szewczak, J.M. Assessing impacts of wind-energy development on nocturnally active birds and bats: A guidance document. J. Wildl. Manag. 2007, 71, 2449–2486. [Google Scholar] [CrossRef]
  23. Jansson, S.; Malmqvist, E.; Brydegaard, M.; Åkesson, S.; Rydell, J. A Scheimpflug lidar used to observe insect swarming at a wind turbine. Ecol. Indic. 2020, 117, 106578. [Google Scholar] [CrossRef]
  24. Rydell, J.; Bogdanowicz, W.; Boonman, A.; Pettersson, S.; Suchecka, E.; Pomorski, J.J. Bats may eat diurnal flies that rest on wind turbines. Mamm. Biol. 2016, 81, 331–339. [Google Scholar] [CrossRef]
  25. Reusch, C.; Lozar, M.; Kramer-Schadt, S.; Voigt, C.C. Coastal onshore wind turbines lead to habitat loss for bats in Northern Germany. J. Environ. Manag. 2022, 310, 114715. [Google Scholar] [CrossRef] [PubMed]
  26. Leroux, C.; Le Viol, I.; Valet, N.; Kerbiriou, C.; Barré, K. Disentangling mechanisms responsible for wind energy effects on European bats. J. Environ. Manag. 2023, 346, 118987. [Google Scholar] [CrossRef]
  27. Ashtiani, P.; Denison, A. Spectral Discrete Probability Density Function of Measured Wind Turbine Noise in the Far Field. Front. Public Health 2015, 3, 52. [Google Scholar] [CrossRef]
  28. Cooper, S. Wind Farm Noise—Modulation of the Amplitude. Acoustics 2021, 3, 364–390. [Google Scholar] [CrossRef]
  29. Smith, M.; Chiles, S. Analysis techniques for wind farm sound level measurements. Acoust. Aust./Aust. Acoust. Soc. 2012, 40, 51–56. [Google Scholar]
  30. Hessler, G.F.; Hessler, D.M.; Bay, K. Experimental study to determine wind-induced noise and windscreen attenuation effects on microphone response for environmental wind turbine and other applications. Noise Control Eng. J. 2008, 56, 300–309. [Google Scholar] [CrossRef]
  31. Whalen, C.E.; Brown, M.B.; McGee, J.; Powell, L.A.; Walsh, E.J. Effects of wind turbine noise on the surrounding soundscape in the context of greater-prairie chicken courtship vocalizations. Appl. Acoust. 2019, 153, 132–139. [Google Scholar] [CrossRef]
  32. Schomer, P.D.; Slauch, I.M.; Hessler, G.F. Proposed. In INTER-NOISE and NOISE-CON Congress and Conference Proceedings; Institute of Noise Control Engineering: Dearborn, MI, USA, 2010; Volume 2010, pp. 3991–4000. [Google Scholar]
  33. Nguyen, P.D.; Hansen, K.L.; Zajamsek, B.; Catcheside, P.; Hansen, C.H. Multi-input model uncertainty analysis for long-range wind farm noise predictions. Appl. Acoust. 2023, 205, 109276. [Google Scholar] [CrossRef]
  34. Wilson, T.C.; Petrin, C.E.; Elbing, B.R. Infrasound and low-audible acoustic detections from a long-term microphone array deployment in Oklahoma. Remote Sens. 2023, 15, 1455. [Google Scholar] [CrossRef]
  35. Juodakis, J.; Marsland, S. Wind-robust sound event detection and denoising for bioacoustics. Methods Ecol. Evol. 2022, 13, 2005–2017. [Google Scholar] [CrossRef]
  36. Martens, S.; Boas, M.; Bohne, T.; Rolfes, R. Towards the use of secondary windscreens to improve wind turbine sound measurements. In Proceedings of the 15th EAWE PhD Seminar on Wind Energy, Nantes, France, 29–31 October 2019; Volume 610. [Google Scholar]
  37. Prezelj, J. Analysis of Wind Power Plant Noise Measurement Methodology. 2023. Available online: https://www.gov.si/assets/ministrstva/MOPE/Okolje/Hrup/Analiza-metodologije-merjenja-hrupa-vetrnih-elektrarn.pdf (accessed on 22 September 2025).
  38. Danish Environmental Protection Agency. Statutory Order on Noise from Wind Turbines: Consolidated Act No. 1033; Danish Environmental Protection Agency: Odense, Denmark, 2017; Available online: https://eng.mst.dk/media/urbm0xut/statutory-order-on-noise-from-wind-turbines-2019-version.pdf (accessed on 22 September 2025).
  39. Keith, S.E.; Feder, K.; Voicescu, S.A.; Soukhovtsev, V.; Denning, A.; Tsang, J.; Broner, N.; Richarz, W.; van den Berg, F. Wind turbine sound power measurements. J. Acoust. Soc. Am. 2016, 139, 1431–1435. [Google Scholar] [CrossRef]
  40. Kirkegaard, J.K.; Cronin, T.H.; Nyborg, S.; Frantzen, D.N. The multiple understandings of wind turbine noise: Reviewing scientific attempts at handling uncertainty. Wind Energy Sci. 2025, 10, 907–924. [Google Scholar] [CrossRef]
  41. Arivukkodi, D.G.; Kanmani, D.S. Acoustic Noise Emission in Wind Turbine: An Overview. Int. J. Res. Appl. Sci. Eng. Technol. 2022, 10, 1686–1697. [Google Scholar] [CrossRef]
  42. Hansen, K.; Zajamsek, B.; Hansen, C. Identification of low frequency wind turbine noise using secondary windscreens of various geometries. Noise Control Eng. J. 2014, 62, 69–82. [Google Scholar] [CrossRef]
  43. Abbott, J.; Raspet, R.; Webster, J. Wind fence enclosures for infrasonic wind noise reduction. J. Acoust. Soc. Am. 2015, 137, 1265–1273. [Google Scholar] [CrossRef]
  44. Abbott, J.; Raspet, R. Calculated wind noise for an infrasonic wind noise enclosure. J. Acoust. Soc. Am. 2015, 138, 332–343. [Google Scholar] [CrossRef] [PubMed]
  45. Bonsma, I.; Gara, N.; McCabe, N. Insertion Loss and Wind-Induced Noise Results for Secondary Windscreens. Can. Acoust. 2017, 45, 24–25. [Google Scholar]
  46. Jones, Z.; Cook, M.R.; Gee, K.L.; Transtrum, M.K.; Lympany, S.V.; Calton, M.F.; James, M.M. Examining wind noise reduction effects of windscreens and microphone elevation in outdoor acoustical measurements. Proc. Mtgs. Acoust. 2020, 42, 045007. [Google Scholar]
  47. D’Amico, S.; Van Renterghem, T.; Botteldooren, D. Measuring infrasound outdoors with a focus on wind turbines: The benefits of a wind-shielding dome. Appl. Acoust. 2021, 178, 108015. [Google Scholar] [CrossRef]
  48. EN 61400-11:2013; Wind Turbines—Part 11: Acoustic Noise Measurement Techniques. CENELEC (European Committee for Electrotechnical Standardization): Geneva, Switzerland, 2013.
  49. Michaud, F.; Sueur, J.; Le Cesne, M.; Haupert, S. Unsupervised classification to improve the quality of a bird song recording dataset. Ecol. Inform. 2023, 74, 101952. [Google Scholar] [CrossRef]
  50. Han, X.; Peng, J. Bird sound classification based on ECOC-SVM. Appl. Acoust. 2023, 204, 109245. [Google Scholar] [CrossRef]
  51. Du, R.; Yang, Y.; Yang, Y.; Zhang, D.; Xia, R.; Yu, M.; He, G.; Hong, S.; Yang, S. A study of benthic habitat classification schemes in the northern equatorial Pacific based on a Gaussian mixture model. J. Environ. Manag. 2025, 377, 124638. [Google Scholar] [CrossRef]
  52. Peršolja, K.P. Analiza vetrnega potenciala na Primorskem z vidika možnosti za proizvodnjo električne energije = An analysis of wind energy in the Coastal Region from the point of view of electricity production. Stroj. Vestn. 2004, 50, 318–327. [Google Scholar]
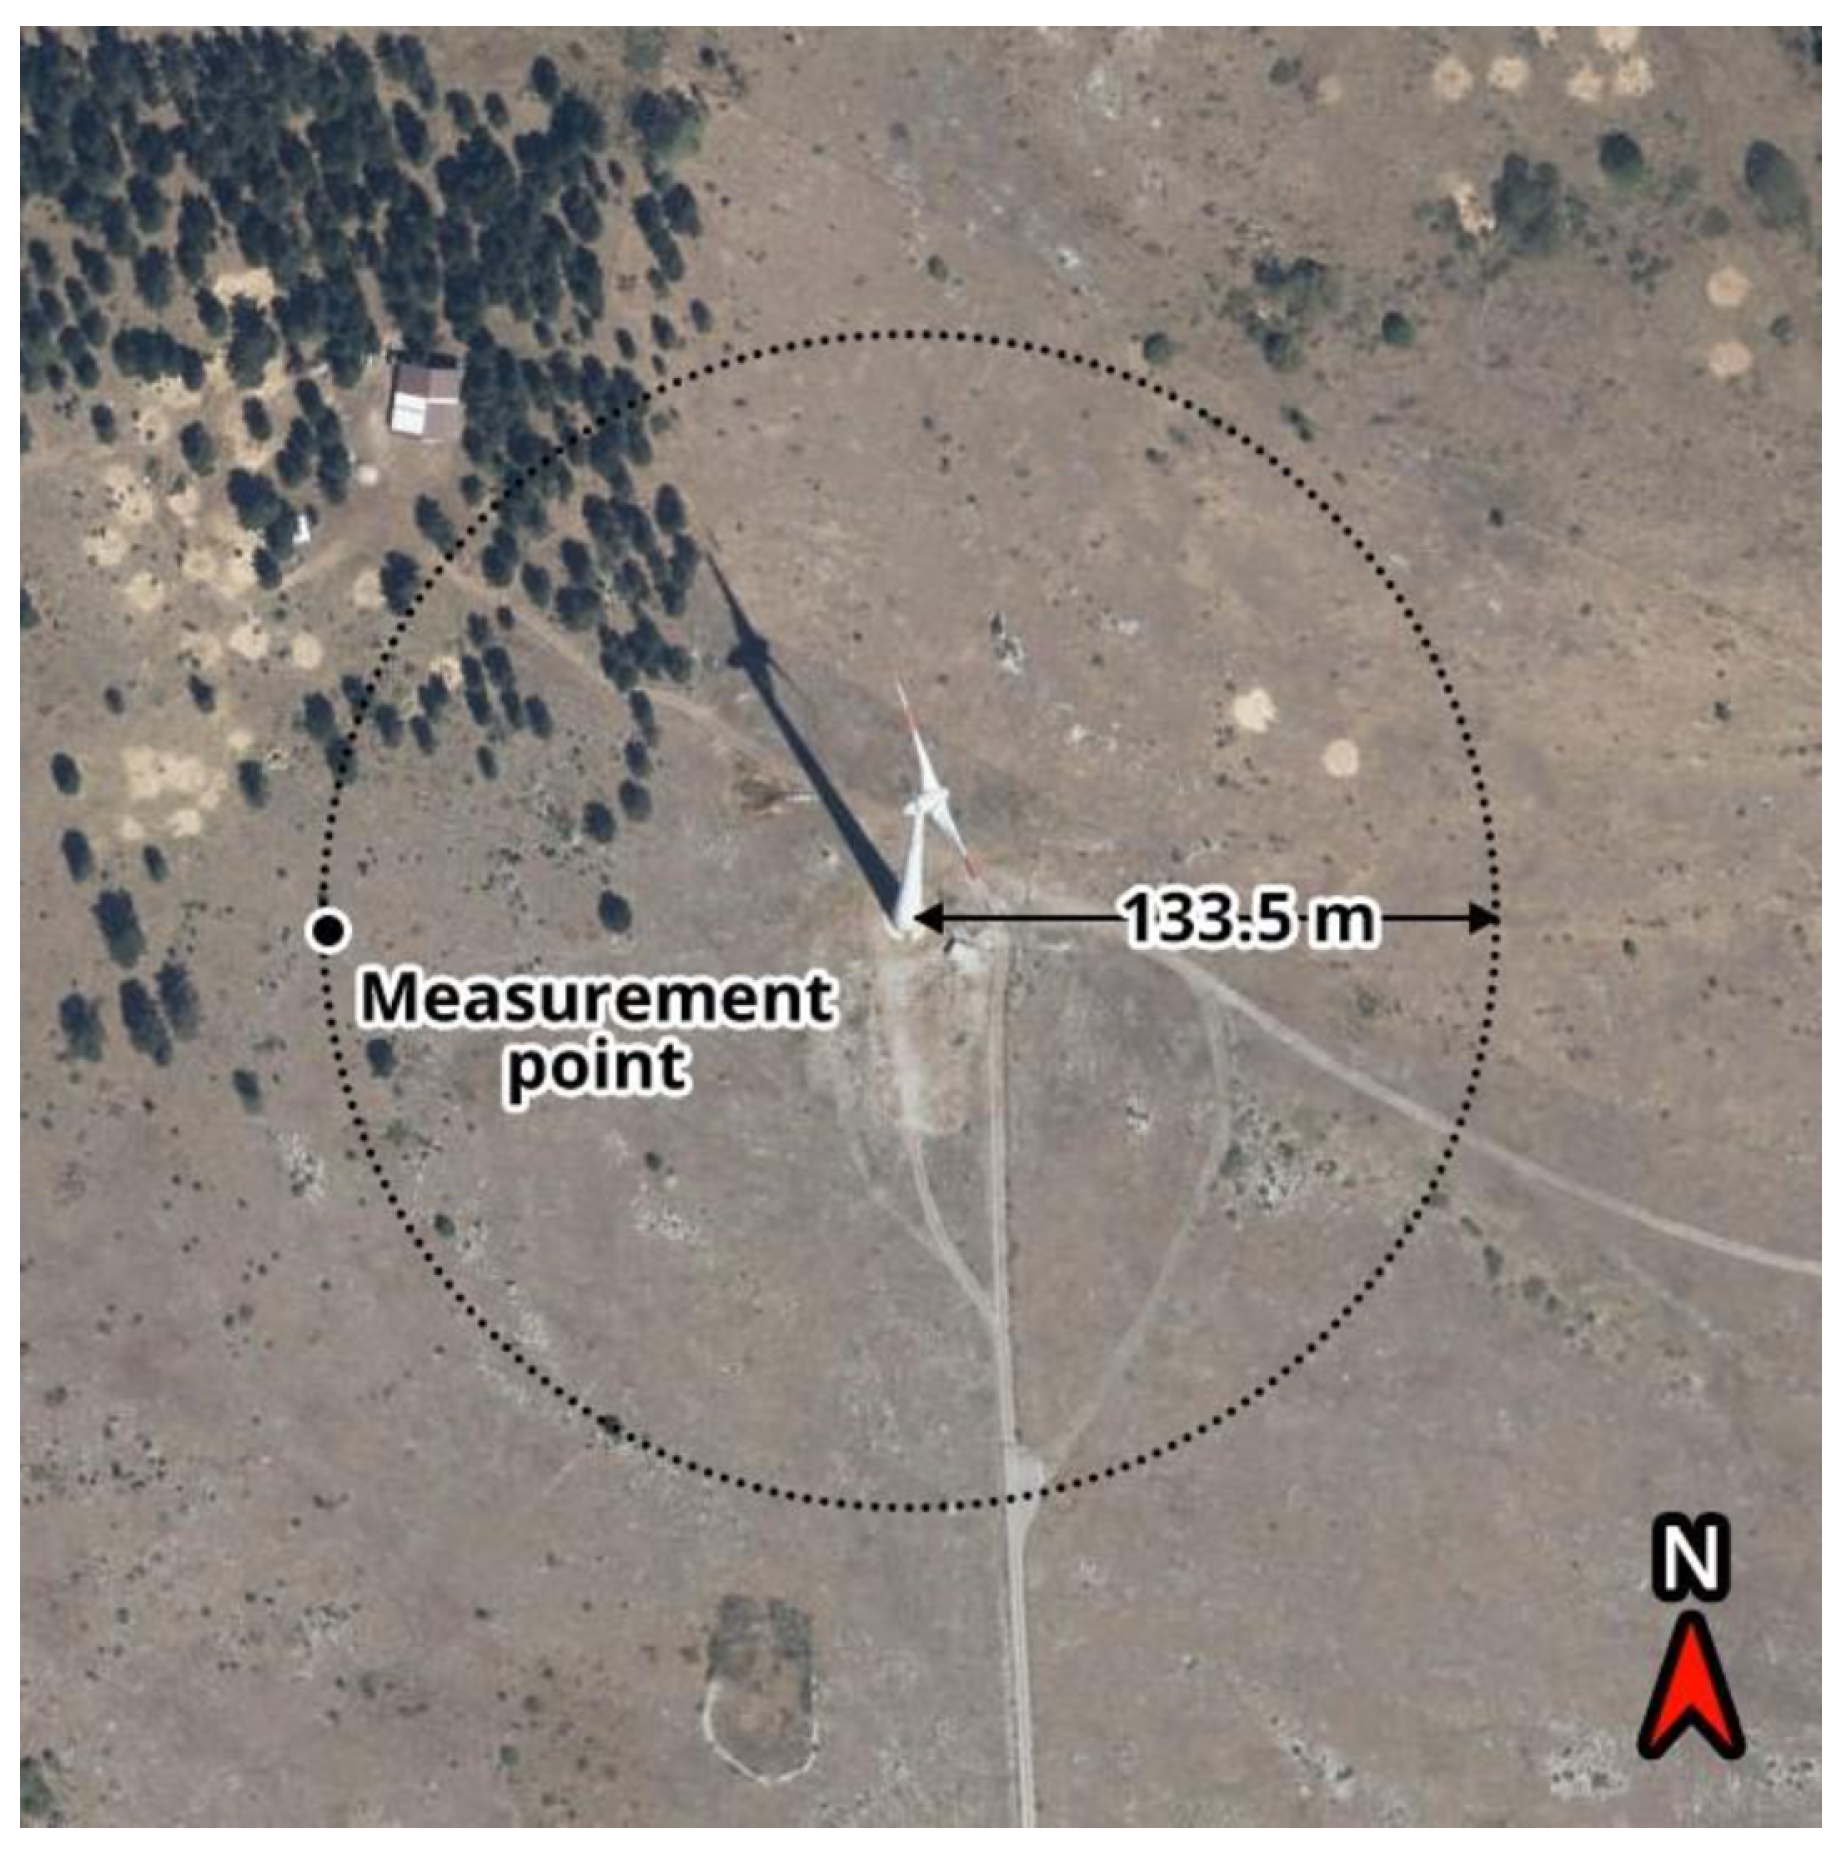
Figure 1. Measurement point (microphone and anemometer) placement.
Applsci 15 11395 g001
Figure 3. Endpoint detection diagram.
Applsci 15 11395 g003
Figure 4. GMM clustering results.
Applsci 15 11395 g004
Figure 5. An example of GMM clustering result where classes 1, 4, 5, and 6 represent insect activity.
Applsci 15 11395 g005
Figure 6. Raw data: (A) WT output power (black) and wind speed (pink), (B) SPL @ 2.5 kHz (green) and @ 20 kHz (red) and (C) comparison between LAeq (blue) and SPL @ 2.5 kHz (green). Intervals marked with red showcase periods where Oecanthus pellucens is a dominant sound source during measurements.
Applsci 15 11395 g006
Figure 7. Measurement data plotted against time: (a) wind direction, (b) wind speed, (c) sound pressure level at measurement location, and (d) wind turbine output power.
Applsci 15 11395 g007
Figure 8. Scatter plot of SPL and wind speed data, with (red) and without (blue) insect noise.
Applsci 15 11395 g008
Figure 9. Logarithmically averaged values of SPL (dBA) as a function of wind speed ranges regardless of wind direction.
Applsci 15 11395 g009
Figure 10. Mean SPL values for different WT output power ranges.
Applsci 15 11395 g010
Figure 11. WT sound power map with eliminated influence of crickets (a), and with crickets (b).
Applsci 15 11395 g011
Figure 12. Estimated error of WT sound power due to insect noise as a function of wind speed.
Applsci 15 11395 g012
Figure 13. Suboptimal wind speed distribution at selected WT location.
Applsci 15 11395 g013
Table 1. Roughness of several types of ground surfaces.
Type of GroundRoughness z 0 [Meters]
Water, snow, sand0.0001
Open plain, bare soil, mown grass0.01
Cultivated agricultural land0.05
Residential area; small town, area with dense, tall vegetation0.3
Table 2. Results of estimated yearly averaged noise levels, in a far field of the WT, 6 m above ground level, without influence of the façade.
Distance [m]1502505001000
Lp with crickets43.337.632.625.1
Lp with eliminated crickets [dBA]42.036.631.924.8
Difference [dBA]1.31.00.70.3
Disclaimer/Publisher’s Note: The statements, opinions and data contained in all publications are solely those of the individual author(s) and contributor(s) and not of MDPI and/or the editor(s). MDPI and/or the editor(s) disclaim responsibility for any injury to people or property resulting from any ideas, methods, instructions or products referred to in the content.