Article

Research on Electrical Energy Parameters in the Distribution System of a Mining Facility

by
Aleksei S. Karpov
*,
Vera V. Yaroshevich
and
Elizaveta I. Gubskaya
Northern Energetics Research Centre—Branch of the Federal Research Centre “Kola Science Centre of the Russian Academy of Sciences” (NERC KSC RAS), 14 Fersman Street, Apatity 184209, Russia
*
Author to whom correspondence should be addressed.
Appl. Sci. 2025, 15(21), 11355; https://doi.org/10.3390/app152111355
Submission received: 1 August 2025 / Revised: 17 October 2025 / Accepted: 19 October 2025 / Published: 23 October 2025
(This article belongs to the Section Electrical, Electronics and Communications Engineering)

Abstract

The study investigates the electrical energy parameters in the distribution system of a mining facility located in Murmansk Oblast, Russia, focusing on power quality (PQ) issues arising substantially from mine hoist operation conditions. Despite compliance with Russian standards related to PQ, discrepancies were observed between PQ measurement results and problems inherent in the system, such as transformer failures. The research employed two instruments, Resurs-UF2M and Metrel MI2892, to conduct a PQ survey, comparing their data aggregation methods and measurement accuracy. Various data aggregation intervals were also used to evaluate the impact of resolution on PQ assessment. Results revealed significant discrepancies between the instruments, with Metrel MI2892 providing a more reliable and detailed dataset, while Resurs-UF2M failed to capture rapid transients and enable profound PQ analysis to be performed. The research identified eight PQ indices exceeding permissible levels, attributed to the electromagnetic influence of high-power mining equipment. The findings underscore the limitations of current regulatory frameworks and measurement methods, emphasizing the need for revised standards to improve diagnostic accuracy. The research highlights the importance of proper instrument selection and configuration to mitigate PQ disturbances, prevent equipment failures, and enhance power system reliability in mining facilities.

1. Introduction

Electrical equipment within power systems represents both a potential source of undesirable electromagnetic interference and a susceptible element vulnerable to negative electromagnetic influence from other technical devices. This causes a need for measures to be taken to ensure normal operation of the electrical equipment when exposed to the adverse electromagnetic impact. The problem is solved within the framework of electromagnetic compatibility (EMC) theory. Therefore, to ensure electrical equipment EMC, a comprehensive analysis of power quality (PQ) is required to be performed.
PQ is the crucial factor affecting the reliability of power supply to an industrial consumer. It directly determines the efficiency of industrial facility operation by influencing voltage stability, harmonic distortion level, etc., and thereby energy losses. Numerous studies have established the importance of PQ management across various industrial contexts. Zhezhelenko et al. [1] highlighted that meeting EMC requirements within industrial power supply systems is significant to ensure reliable operation of equipment. Salor et al. [2] analyzed PQ in Turkey’s iron and steel industry, evaluating methods to solve the flicker problem that contributes to a decrease in energy efficiency and production stability. Nikolaev et al. [3] dealt with the detrimental impact of resonance effects associated with powerful frequency converters, while Kuznetsov et al. [4] linked PQ distortions directly to reduced efficiency of electric power consumption. In [5,6], industrial PQ issues caused by electric arc furnace operation were addressed, and PQ analysis and disturbance mitigation were shown to be vital to maintain technological process efficiency and stability. Martinez et al. [7] reviewed diagnostic techniques for identifying disturbance sources, reinforcing the importance of PQ monitoring to ensure power system reliability. Sukanth et al. [8] and Yaghoobi et al. [9] focused on challenges related to PQ disturbances and their mitigation in underground and weak mining networks to increase voltage regulation, efficiency, and lifespan of consumer installations. Nepsha et al. [10] and Pichuev et al. [11] demonstrated that PQ improvements enhance the reliability and efficiency of mine power systems. Bebikhov et al. [12] analyzed power quality in a mine grid to identify the cause of numerous failures of electrical equipment, confirming that higher harmonics accelerate deterioration of the equipment. Do et al. [13] presented the simulation results showing that PQ distortions adversely affect explosion-proof transformer performance in Vietnamese mines. Further, Sychev and Zimin [14] and Plashchansky et al. [15] proposed filter-compensating devices to improve PQ in mine power systems, thereby enhancing the continuity and stability of technological processes. Semenov [16] reinforced the need to mitigate harmonics to maintain steady and safe operation of mining facilities.
In mine power systems, PQ disturbances are severe, generally due to the use of mine hoists, motor drives, and other high-power cyclic loads. Previous research demonstrated that PQ disturbances directly influence the efficiency of mining processes, with poor PQ leading to reduced equipment lifetime and lower economic performance indicators of mining operations [17]. In [18], the methods aimed at improving the power indices of active rectifiers for mine hoists, which addressed one of the main sources of PQ disturbances in underground mining systems, were proposed. Further studies investigated higher harmonics filtration in thyristor-controlled hoists, presenting practical solutions to mitigate distortions within mining power supply systems [19]. It was also shown that hoists are among the most significant contributors to higher harmonic generation in underground mines, reinforcing their role as critical disturbance sources [20]. To mitigate these effects, advanced compensation systems such as static var generators were explored, offering effective strategies for reactive power management and PQ improvement in mines equipped with thyristor hoisting machines [21].
These studies collectively stress that PQ management is not only a technical requirement but a key condition for ensuring efficiency, safety, and long-term stability of industrial power systems, including the ones supplying mining facilities. However, the studies do not address the urgent problems related to the application of measurement methods specified by the PQ standards, which affect PQ disturbance diagnostic accuracy and PQI data quality.
The research focuses on analysis of PQ survey results, the survey conducted on site at one of the substations supplying a mining facility located in Russia, Murmansk Oblast. The substation was selected because of non-standard operation patterns of industrial equipment powered by it. The main consumers connected to the 6 kV substation network are mine hoists. The operation of a mine hoist is characterized by frequent inrush currents and significant harmonic distortions, thereby presenting major PQ problems for the entire power distribution system.
The need for the investigation emerged from observable discrepancies between the results of PQI measurements conducted by an accredited external laboratory in compliance with Russian standards GOST 32144-2013 [22], GOST 33073-2014 [23], and GOST 30804.4.30-2013 [24] by using the LPW-30 instrument and actual operational problems inherent in the substation. While measurement protocols did not reveal PQI deviations from the standard values, there were emergency conditions, including multiple failures of dry-type transformers related to their insulation overloading.
The study employs advanced instrumentation operating in different data aggregation modes to evaluate the reliability of experimental results and identify hidden problems that potentially remain unnoticed when measurement is conducted in strict compliance with the standards.
The research objectives cover both comprehensive diagnostic assessment of PQ conditions at the mining facility substation and the development of enhanced measurement methods to improve diagnostic accuracy and PQI data quality. The results obtained are of practical importance for mining facilities, as identification of PQ disturbance sources and distortion mitigation enable accidents to be prevented, operating expenses to be reduced, and reliability of power systems to be improved.

2. Materials and Methods

To carry out the PQ survey, one of the key substations (SS-1) of a mining facility located in Murmansk Oblast, Russia, was selected, its diagram shown in Figure 1. The substation SS-1 consists of four 6 kV buses fed by two 35/6/6 kV split-winding transformers of 25 MVA each. Connected to the buses are 80 feeders; nine of those were in reserve during the measurement process. The load of the buses is the following: bus 1–516 A, bus 3–153 A, bus 2–650 A, and bus 4–177 A. The main substation consumers are mine hoists that use asynchronous motors and DC motor drives. Frequent equipment starts and operation with thyristor bridges create large, substantial dynamic loads on power transformers.
The experiments were conducted in two stages. At the first stage, PQI measurement was conducted using two instruments: the Resurs-UF2M recorder and the Metrel MI2892 PQ analyzer, which are class A instruments in accordance with [24], to compare the data collected. Technical characteristics of the instruments are provided in Appendix A.
The instruments were connected in parallel at the measurement point shown in Figure 1. Mine Hoist-1 was powered by 6 kV buses of substation SS-2 and thus had no galvanic connection to SS-1 buses 3 and 4. Meanwhile, Mine Hoist-2 was powered from bus 4; therefore, the PQI measurement was taken on the bus 4 input switch.
Table 1 contains information about the PQI measurement methods that include basic measurement time intervals and data aggregation time intervals for each of the instruments employed.
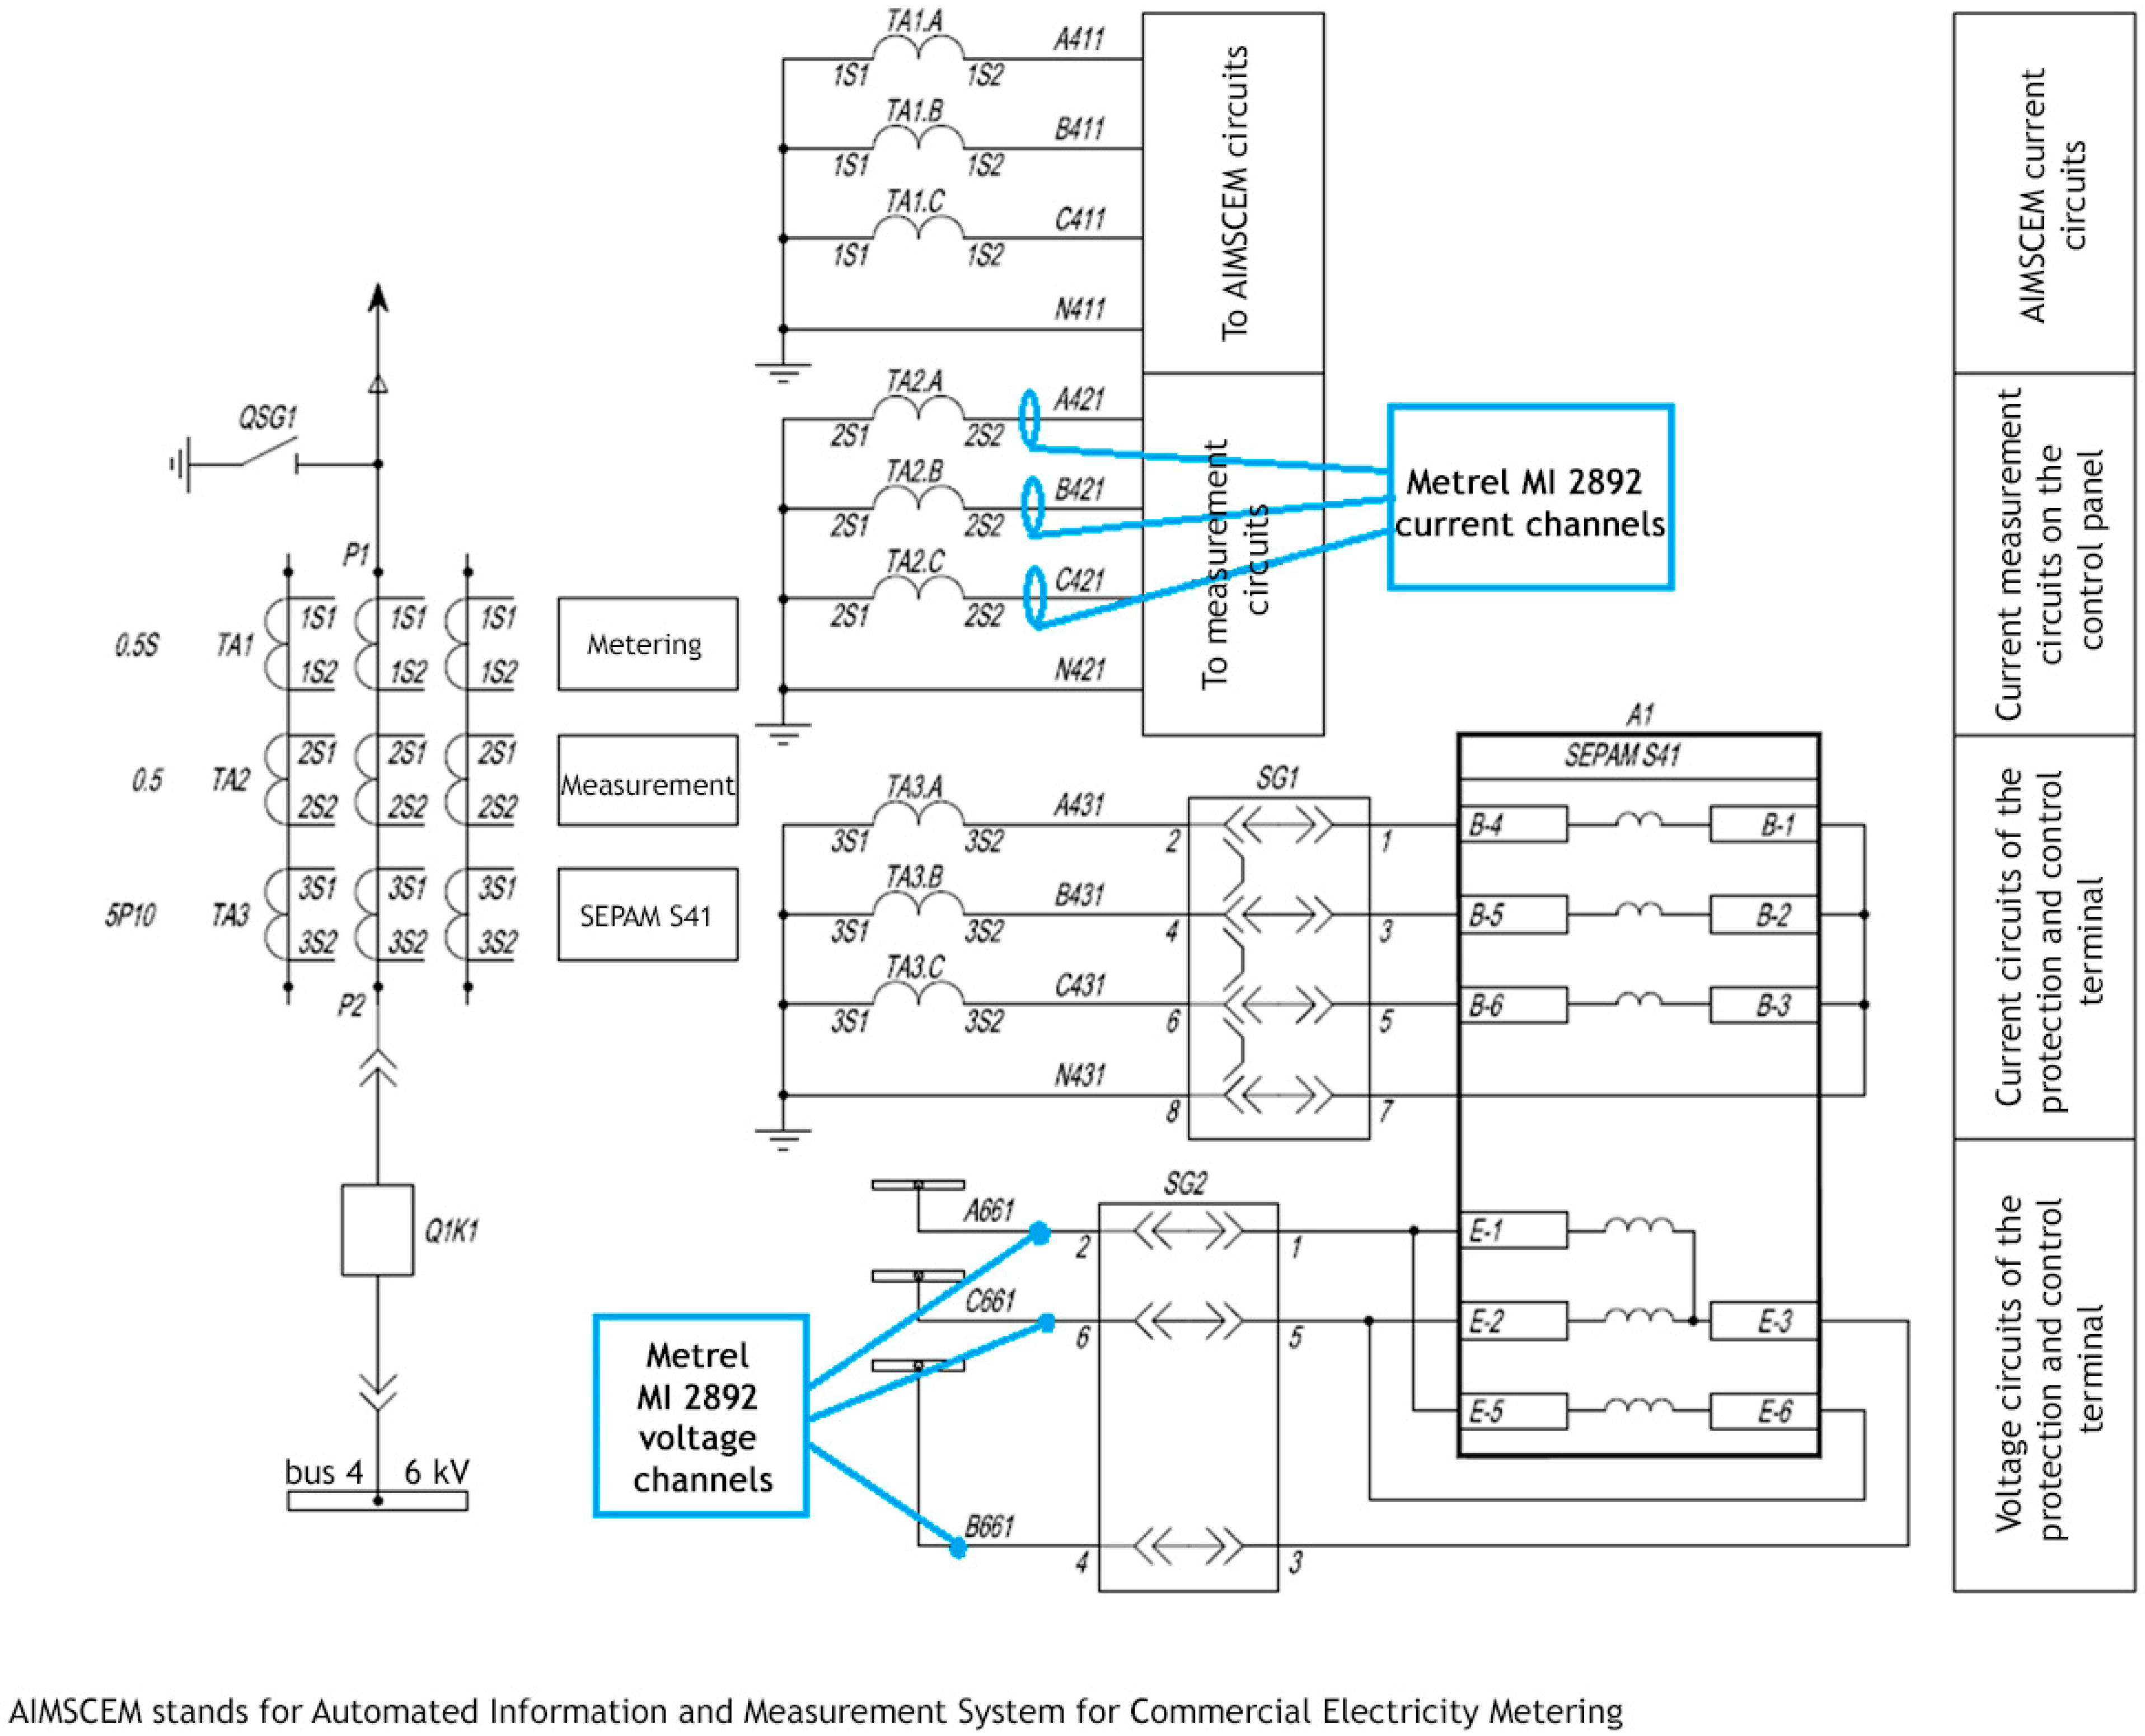
At the second stage, 7-day PQI measurements were taken using a Metrel MI2892 instrument with different aggregation time intervals (a 10 min interval complying with the standard [22] requirements and 1 min, 10 s, and 1 s intervals) at the same point under identical substation operation conditions to evaluate resolution impact on the results. A diagram of instrument connection to the enterprise power system is shown in Figure 2.
The use of the Metrel MI2892 analyzer only at this stage is due to the following conclusions.
  • The results of Metrel MI2892 protocols are more consistent and clearer than those of Resurs-UF2M.
  • Resurs-UF2M protocols are not intended for detailed analysis since these enable only a comparison between the PQI measured and the standard values to be drawn.
  • Resurs-UF2M is completely unsuitable for further use in terms of analyzing distortions recorded and identifying their origins. This is due to the following Resurs-UF2M technical abilities. Firstly, to perform PQ analysis, only a final measurement protocol is provided, with the measurement dataset not accessed, which excludes the possibility of verifying protocol values. The 1 min aggregation interval allows PQI measurement to be conducted only in long-term monitoring mode, which does not enable rapid processes such as lightning, switching surges, or other transients to be taken into account. Therefore, the recorder is unsuitable for analyzing and identifying the root causes of emergency conditions.
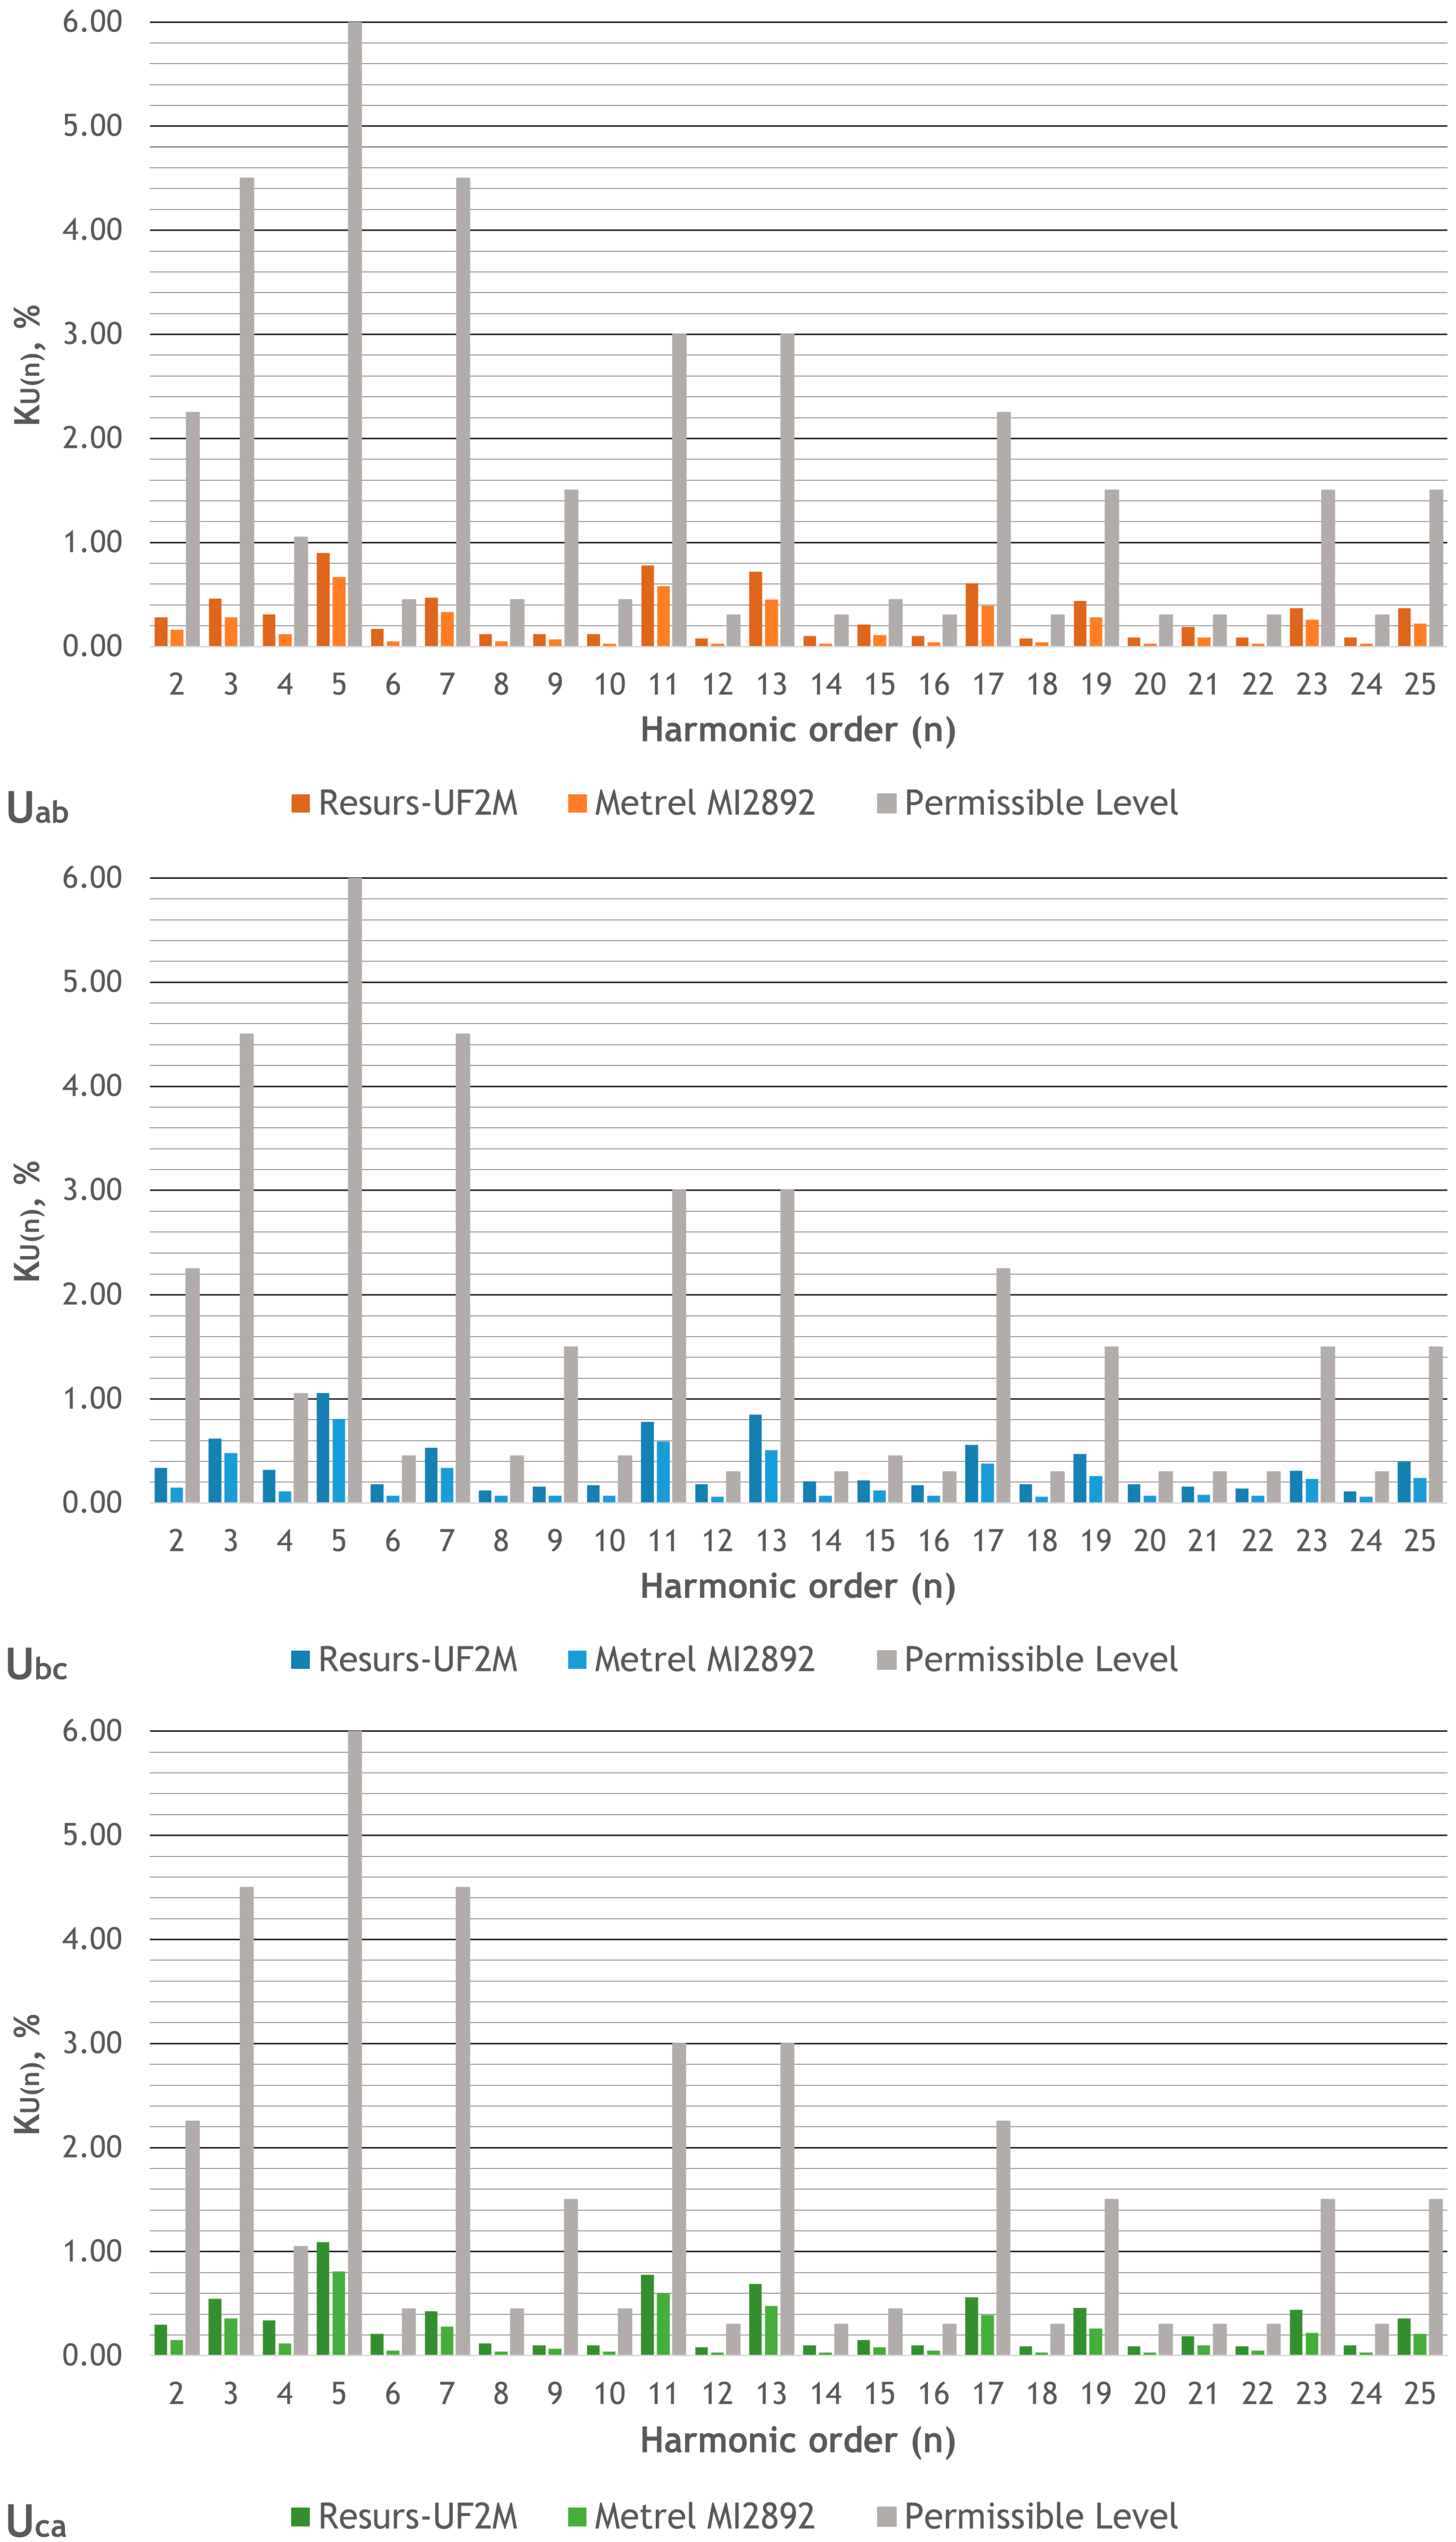
  • Resurs-UF2M recorder shows a total number of voltage dips that differs from Metrel MI2892 data and total dip duration (which is uninformative a without description of dip history and consequences being presented). Since both instruments are certified, this can be explained by instrument accuracy, the aggregation time interval used, and analytics performed when forming statistical data for protocols. Significant discrepancies are also noted in the individual harmonic voltages measured (Figure 3).
  • Resurs-UF2M protocols are given separately for each day, while Metrel MI2892 provides summarized protocols for the entire measurement period. Therefore, comparing measurement results is problematic. Certified PQ recorders standardize only the recording process and data output format; however, some of them do not take into account initial recording time, calculating statistics exclusively from 0:00 h, which became extremely significant for the instruments employed.
  • The values of several PQIs measured by Metrel MI2892 exceed the permissible levels, while all the PQI values measured by Resurs-UF2M do not. Therefore, it should be noted that the Resurs-UF2M recorder is not appropriate for monitoring PQ in high-voltage grids since it does not meet modern requirements for striving towards the Smart Grid concept and fulfilling the full cycle: PQI measurement; PQ analysis—mitigation technique development to modernize problematic areas of the high-voltage network, ensuring uninterrupted and efficient operation of a power system.
Based on the experiment conducted, it was concluded that not every certified instrument can objectively assess the level of PQ distortion danger.
Furthermore, Metrel MI2892 analyzer, enables the assessment of PQ compliance not only with the Russian standard GOST 32144-2013 [22] but also with the international ones (EN 50160:2010 [25], the Chinese power quality standards, etc.). Russian standards set fairly strict limits for PQ, but international standards may vary depending on the specific country or region. For example, the USA power systems use a frequency of 60 Hz, while European and Russian grids operate at 50 Hz.
The analysis of the experimental results and comparison of these with the Russian PQ standards and the international ones (GOST R 54149-2010 [26], IEC 61000-4-30-2017 [27], EN 50160:2010 [25]) highlighted the following significant limitations that hinder an objective PQ assessment.
  • Insufficient time resolution detail. Up-to-date PQ standards limit themselves to specifying only basic requirements for instrument accuracy and minimum measurement cycle duration. For example, EN 50160 requires a minimum time resolution of 1 min, which is insufficient to accurately capture short-term events such as short overvoltages or voltage sags. Such events occur almost instantaneously, often being associated with the switching of high-power loads or commutation processes. The absence of these within a final report creates a false impression of power supply stability.
  • Failure to account for the influence of voltage pulse duration. Standard methods assume averaging data over long-time intervals (up to 1 h or more), ignoring the distribution of pulse deviations within each cycle. For example, a sharp increase in the power of asynchronous motors or induction effects in transformers generates peak overloads lasting only a few milliseconds, which the standard is unable to capture.
  • Instruments fail to meet up-to-date requirements. Some certified instruments use algorithms for calculating PQI based on outdated signal processing principles. For example, the widely used Resurs-UF2M records integral voltage and current parameters, and the detailed waveform reconstruction cannot be performed. This hampers identification of the distortion causes. Instrumentation systems such as the Metrel MI 2892 PQ analyzer enable the performance of more precise monitoring of parameter dynamics but require significant storage resources and computing power.
  • Limited range of frequency recorded. Most instruments used are limited to recording low-order harmonics (usually up to 40th order), although the practice shows the presence of significant higher harmonics (especially under frequency converter and thyristor rectifier operation conditions). Ignoring such components leads to an underestimation of the true distortion pattern and potential flaws in fault diagnosis.
  • Calibration and data verification problems. Most instruments measure independently, increasing the risk of interpretation flaws and reducing the credibility of reports. A mechanism for automatic data synchronization and cross-checking of parameter values obtained by using different instruments is needed to ensure uniformity of approaches and eliminate discrepancies.
  • Standards and permissible levels are technically outdated. A comparative analysis presented in [28,29] shows that Russian and international standards on PQ have similar approaches to the main PQI, although there are distinctions in PQI permissible levels for different voltage levels. However, these standards adopted decades ago do not reflect the realities of modern industrial production associated with the widespread adoption of digital energy management technologies and sensitive electronic devices.

3. Results and Discussion

3.1. Influence of Data Aggregation Time Interval on PQ Assessment

The PQI measurements conducted using a 10 min aggregation interval are insufficient to identify the PQ distortion origins. In this case the measurement protocol includes either steady-state voltage values having systematic distortion nature that can be observed even by stationary control and metering systems or complete network section shutdown that would be noted by substation dispatchers. Therefore, it should be noted that the imperfection of the regulatory framework regarding PQI measurement methods is the cause of measurement protocols performed by accredited external laboratories being compliant with the standard. On one hand, the standard requirements for measurement conduction frequency are fulfilled; however, real problems in a power system remain unnoticed.
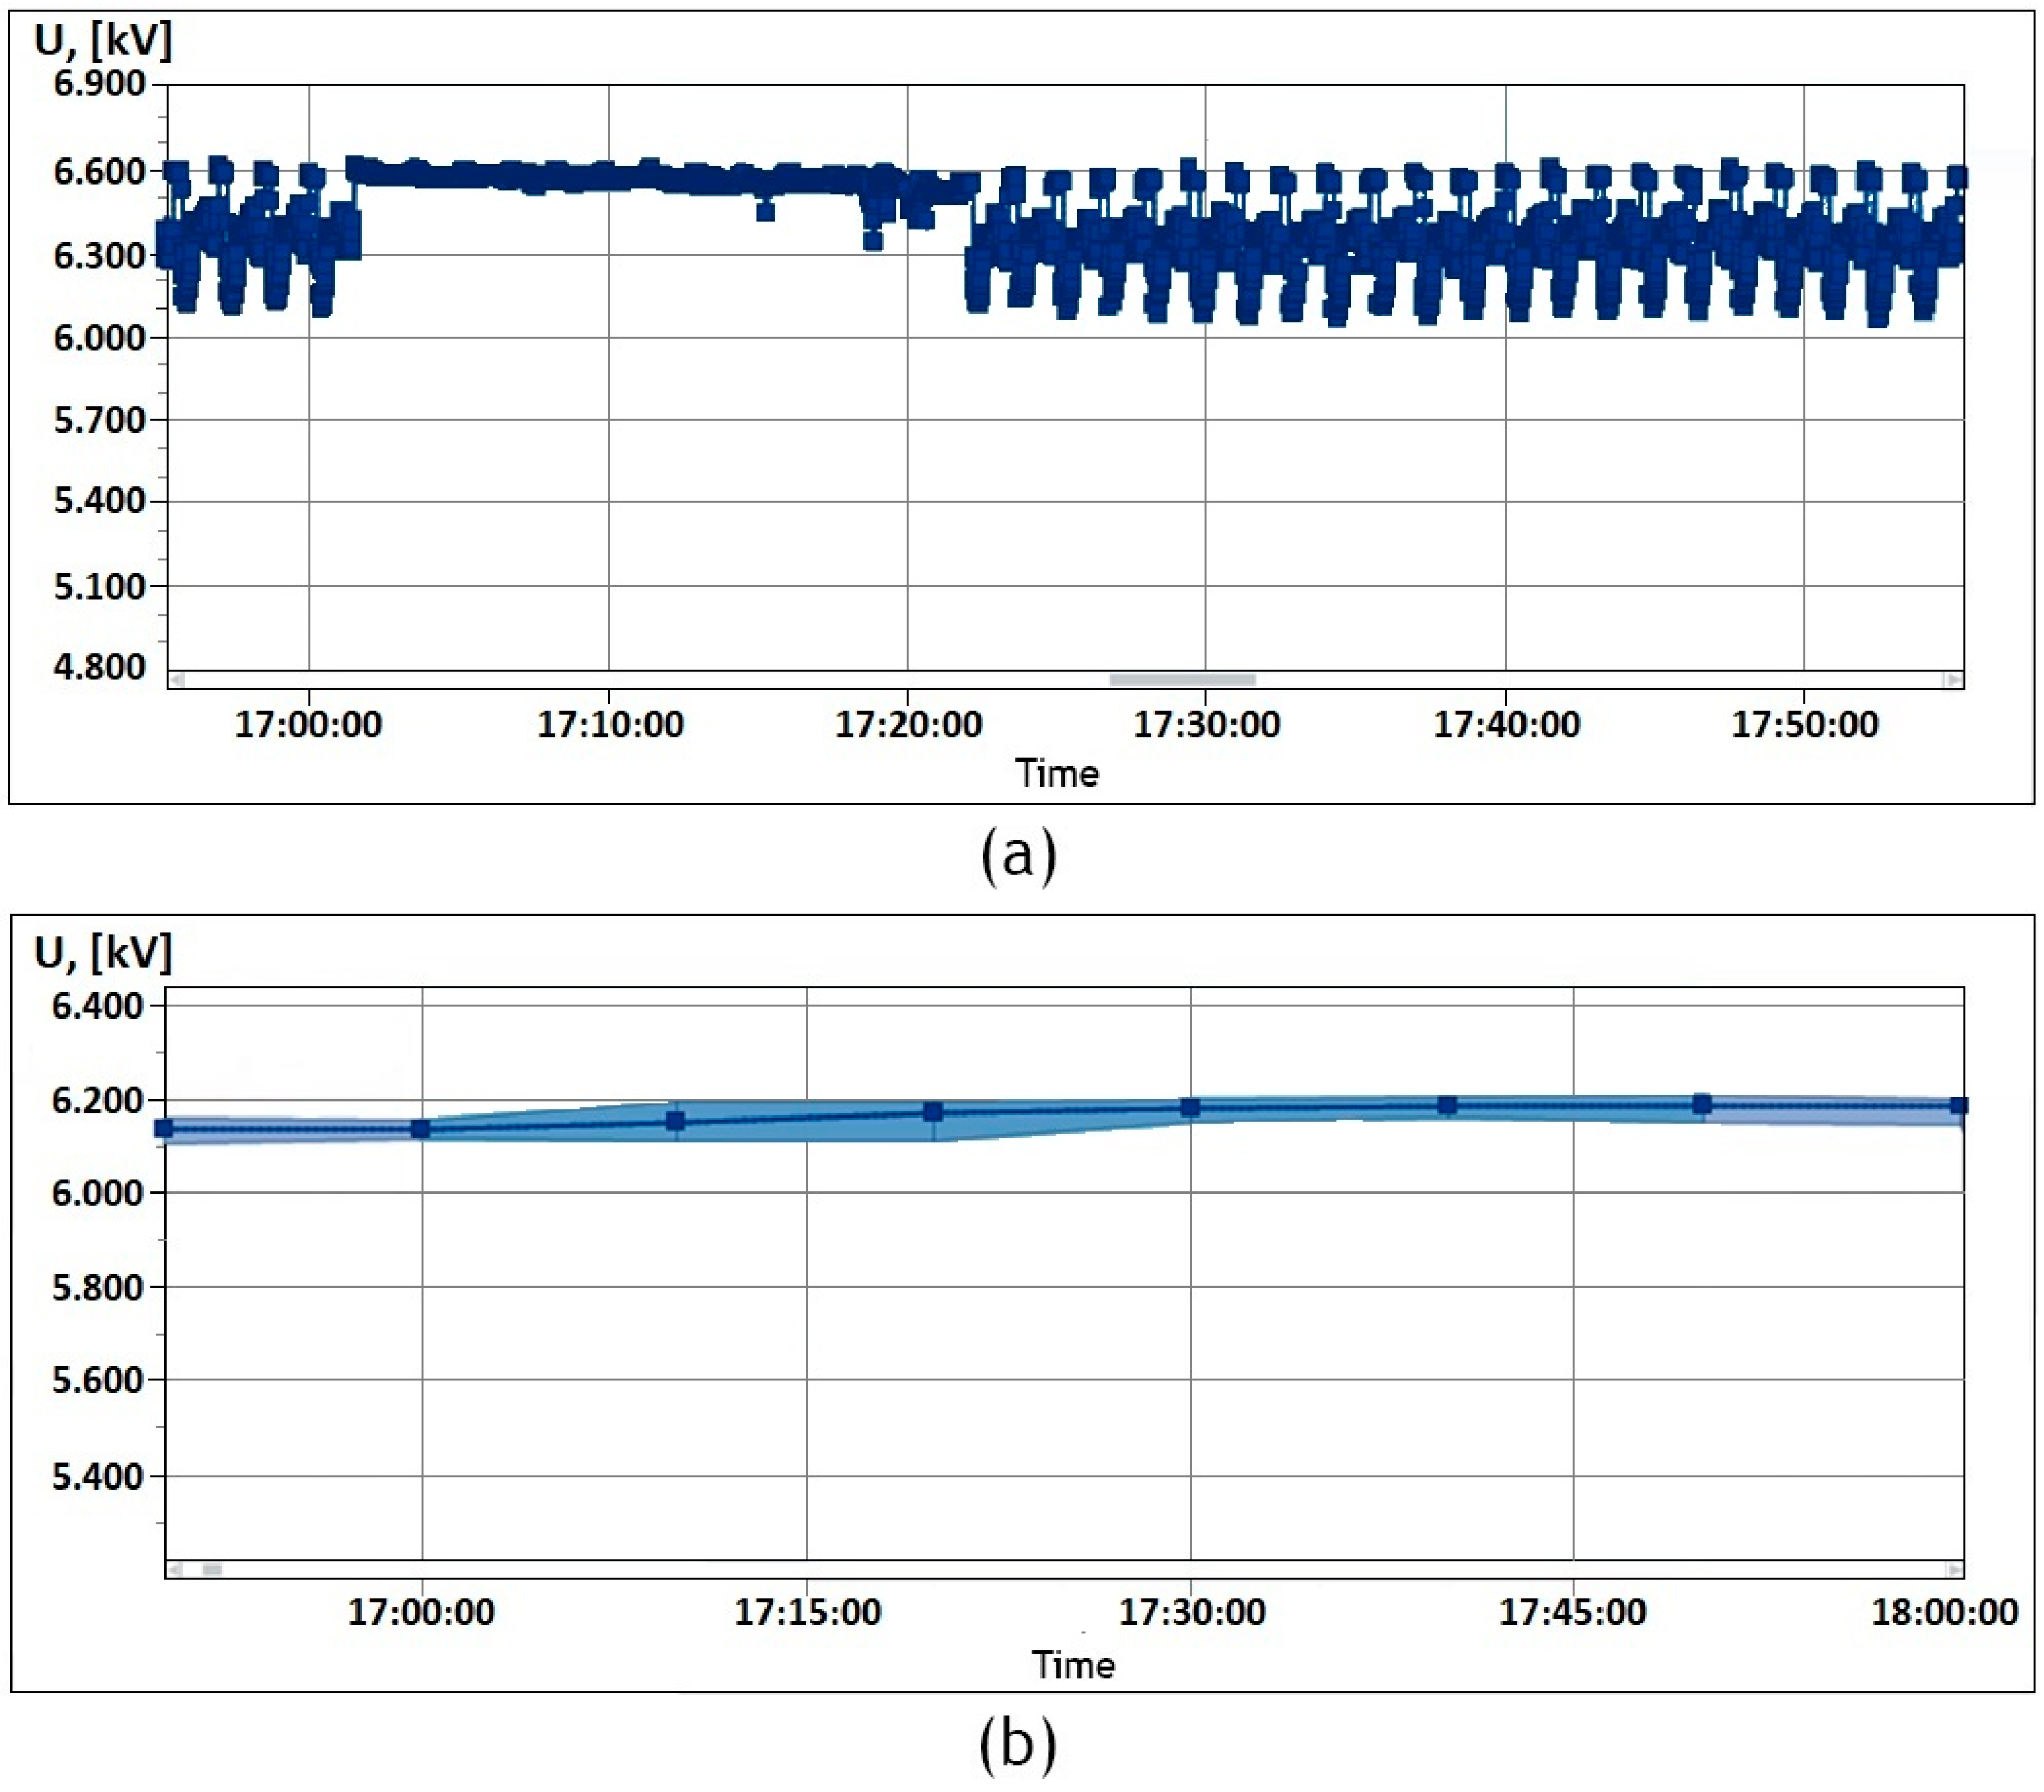
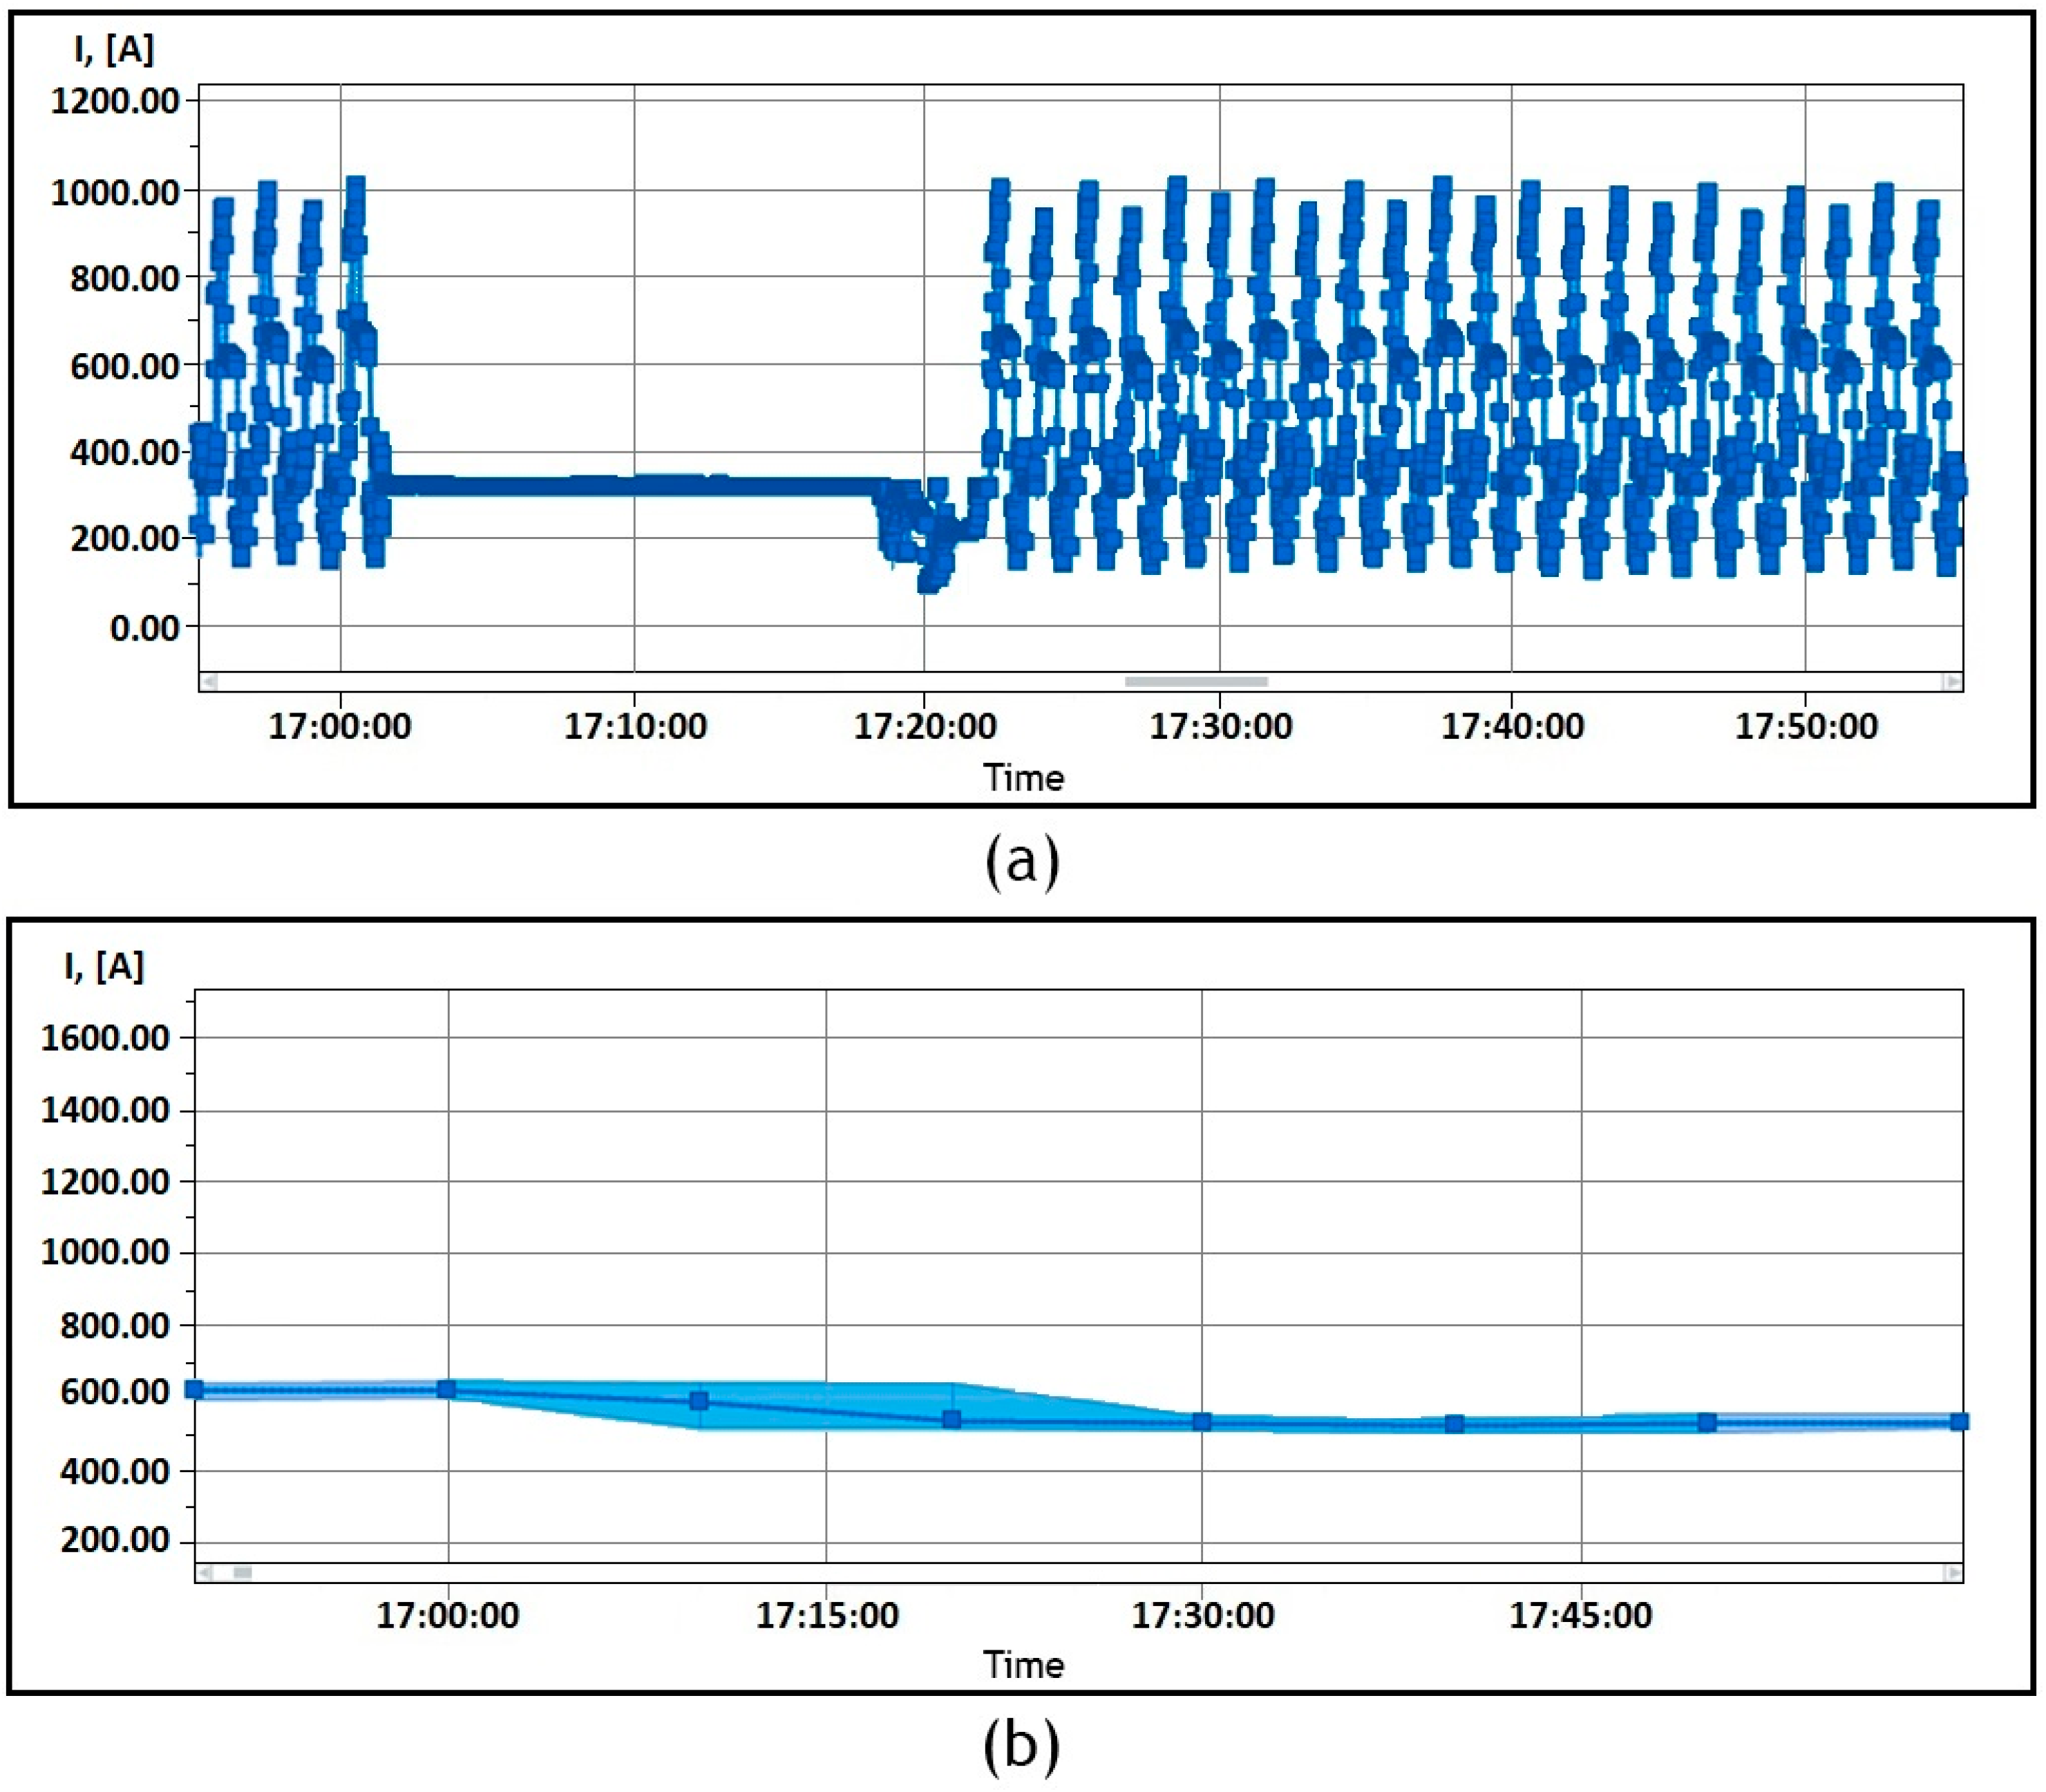
As can be seen from Figure 4 and Figure 5, the employment of a 10 min aggregation interval is insufficient to investigate electromagnetic processes in power systems since only 6 averaged values are obtained per hour of PQI data recording. This is not critical for voltage signal, while 99% of information is lost in regard to current waveform.
It should be noted that such results do not contradict each other, as the experiments were conducted reliably under the same normal operation of the substation. Measurement using 10 min or 1 min aggregation intervals shows potential for manipulating the PQI data recorded and excludes the prospect of timely identification of problematic points in a power system and planning of repair or reorganization works.

3.2. Analysis of the PQ Survey Results

The analysis of PQ in the 6 kV network of the mining facility substation was performed based on the Metrel MI2892 measurement dataset. The permissible levels of PQI in Russian standard GOST 32144-2013 [22] are presented in Table 2 and Table 3.
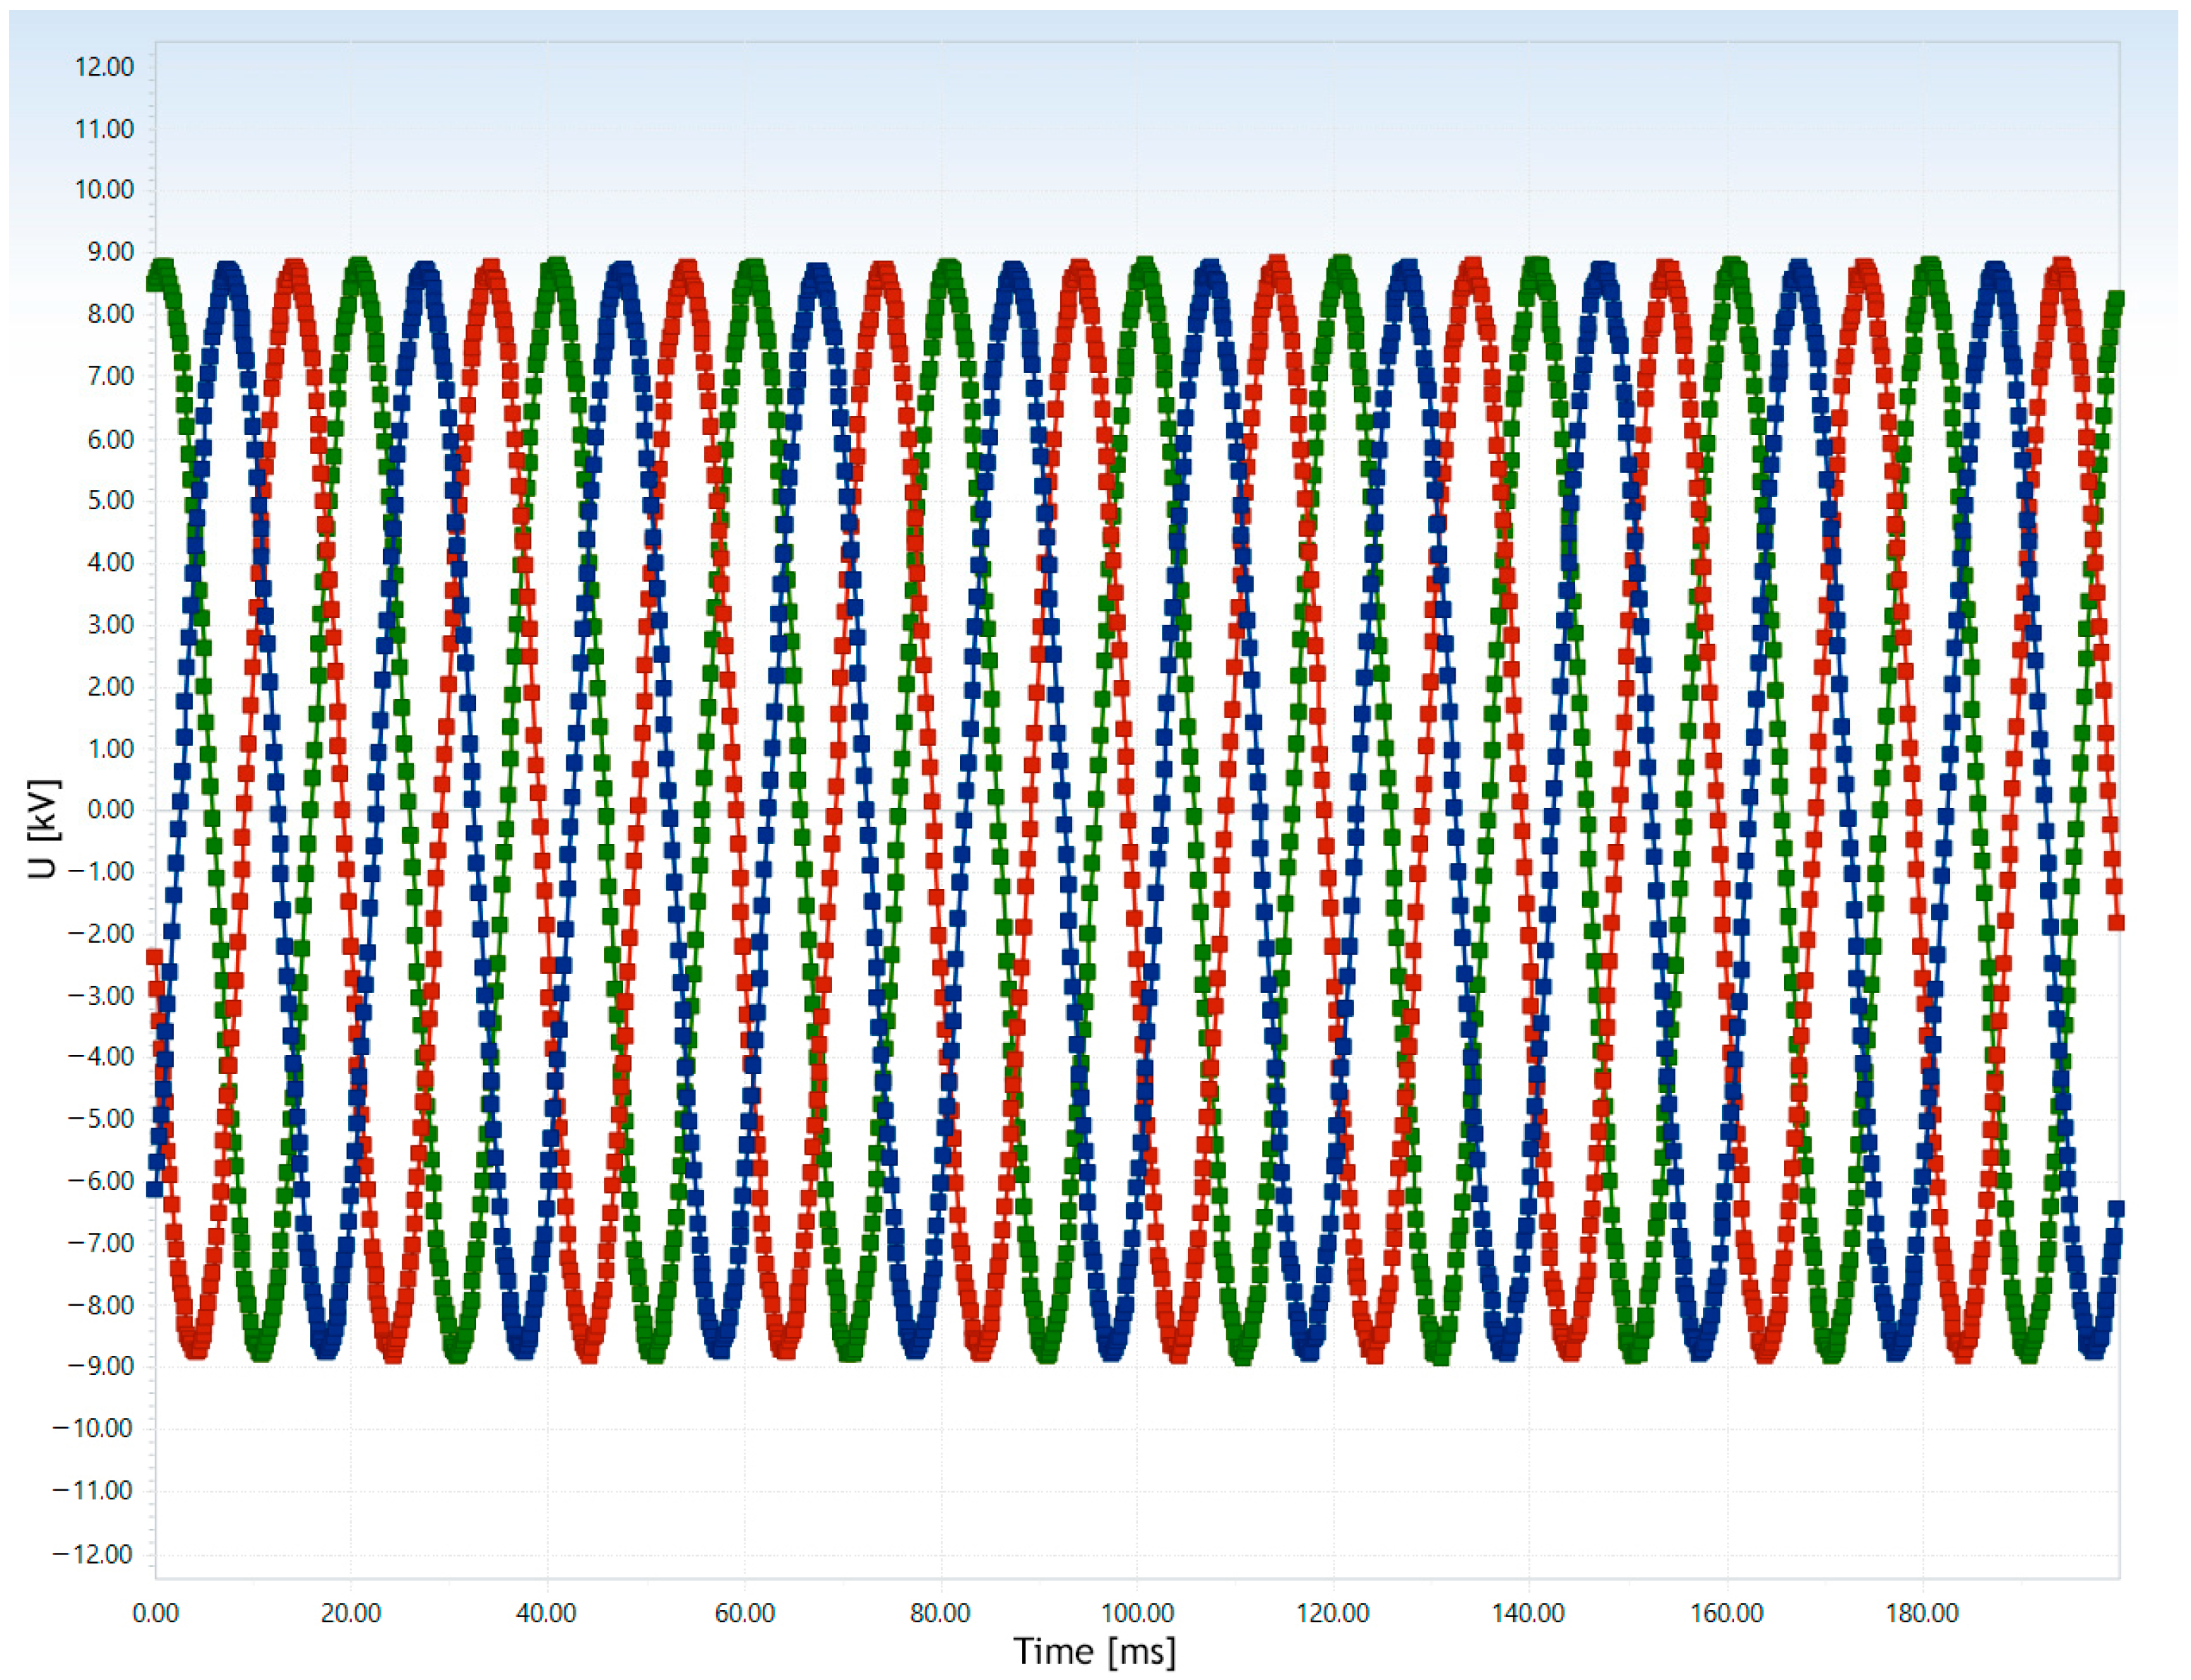
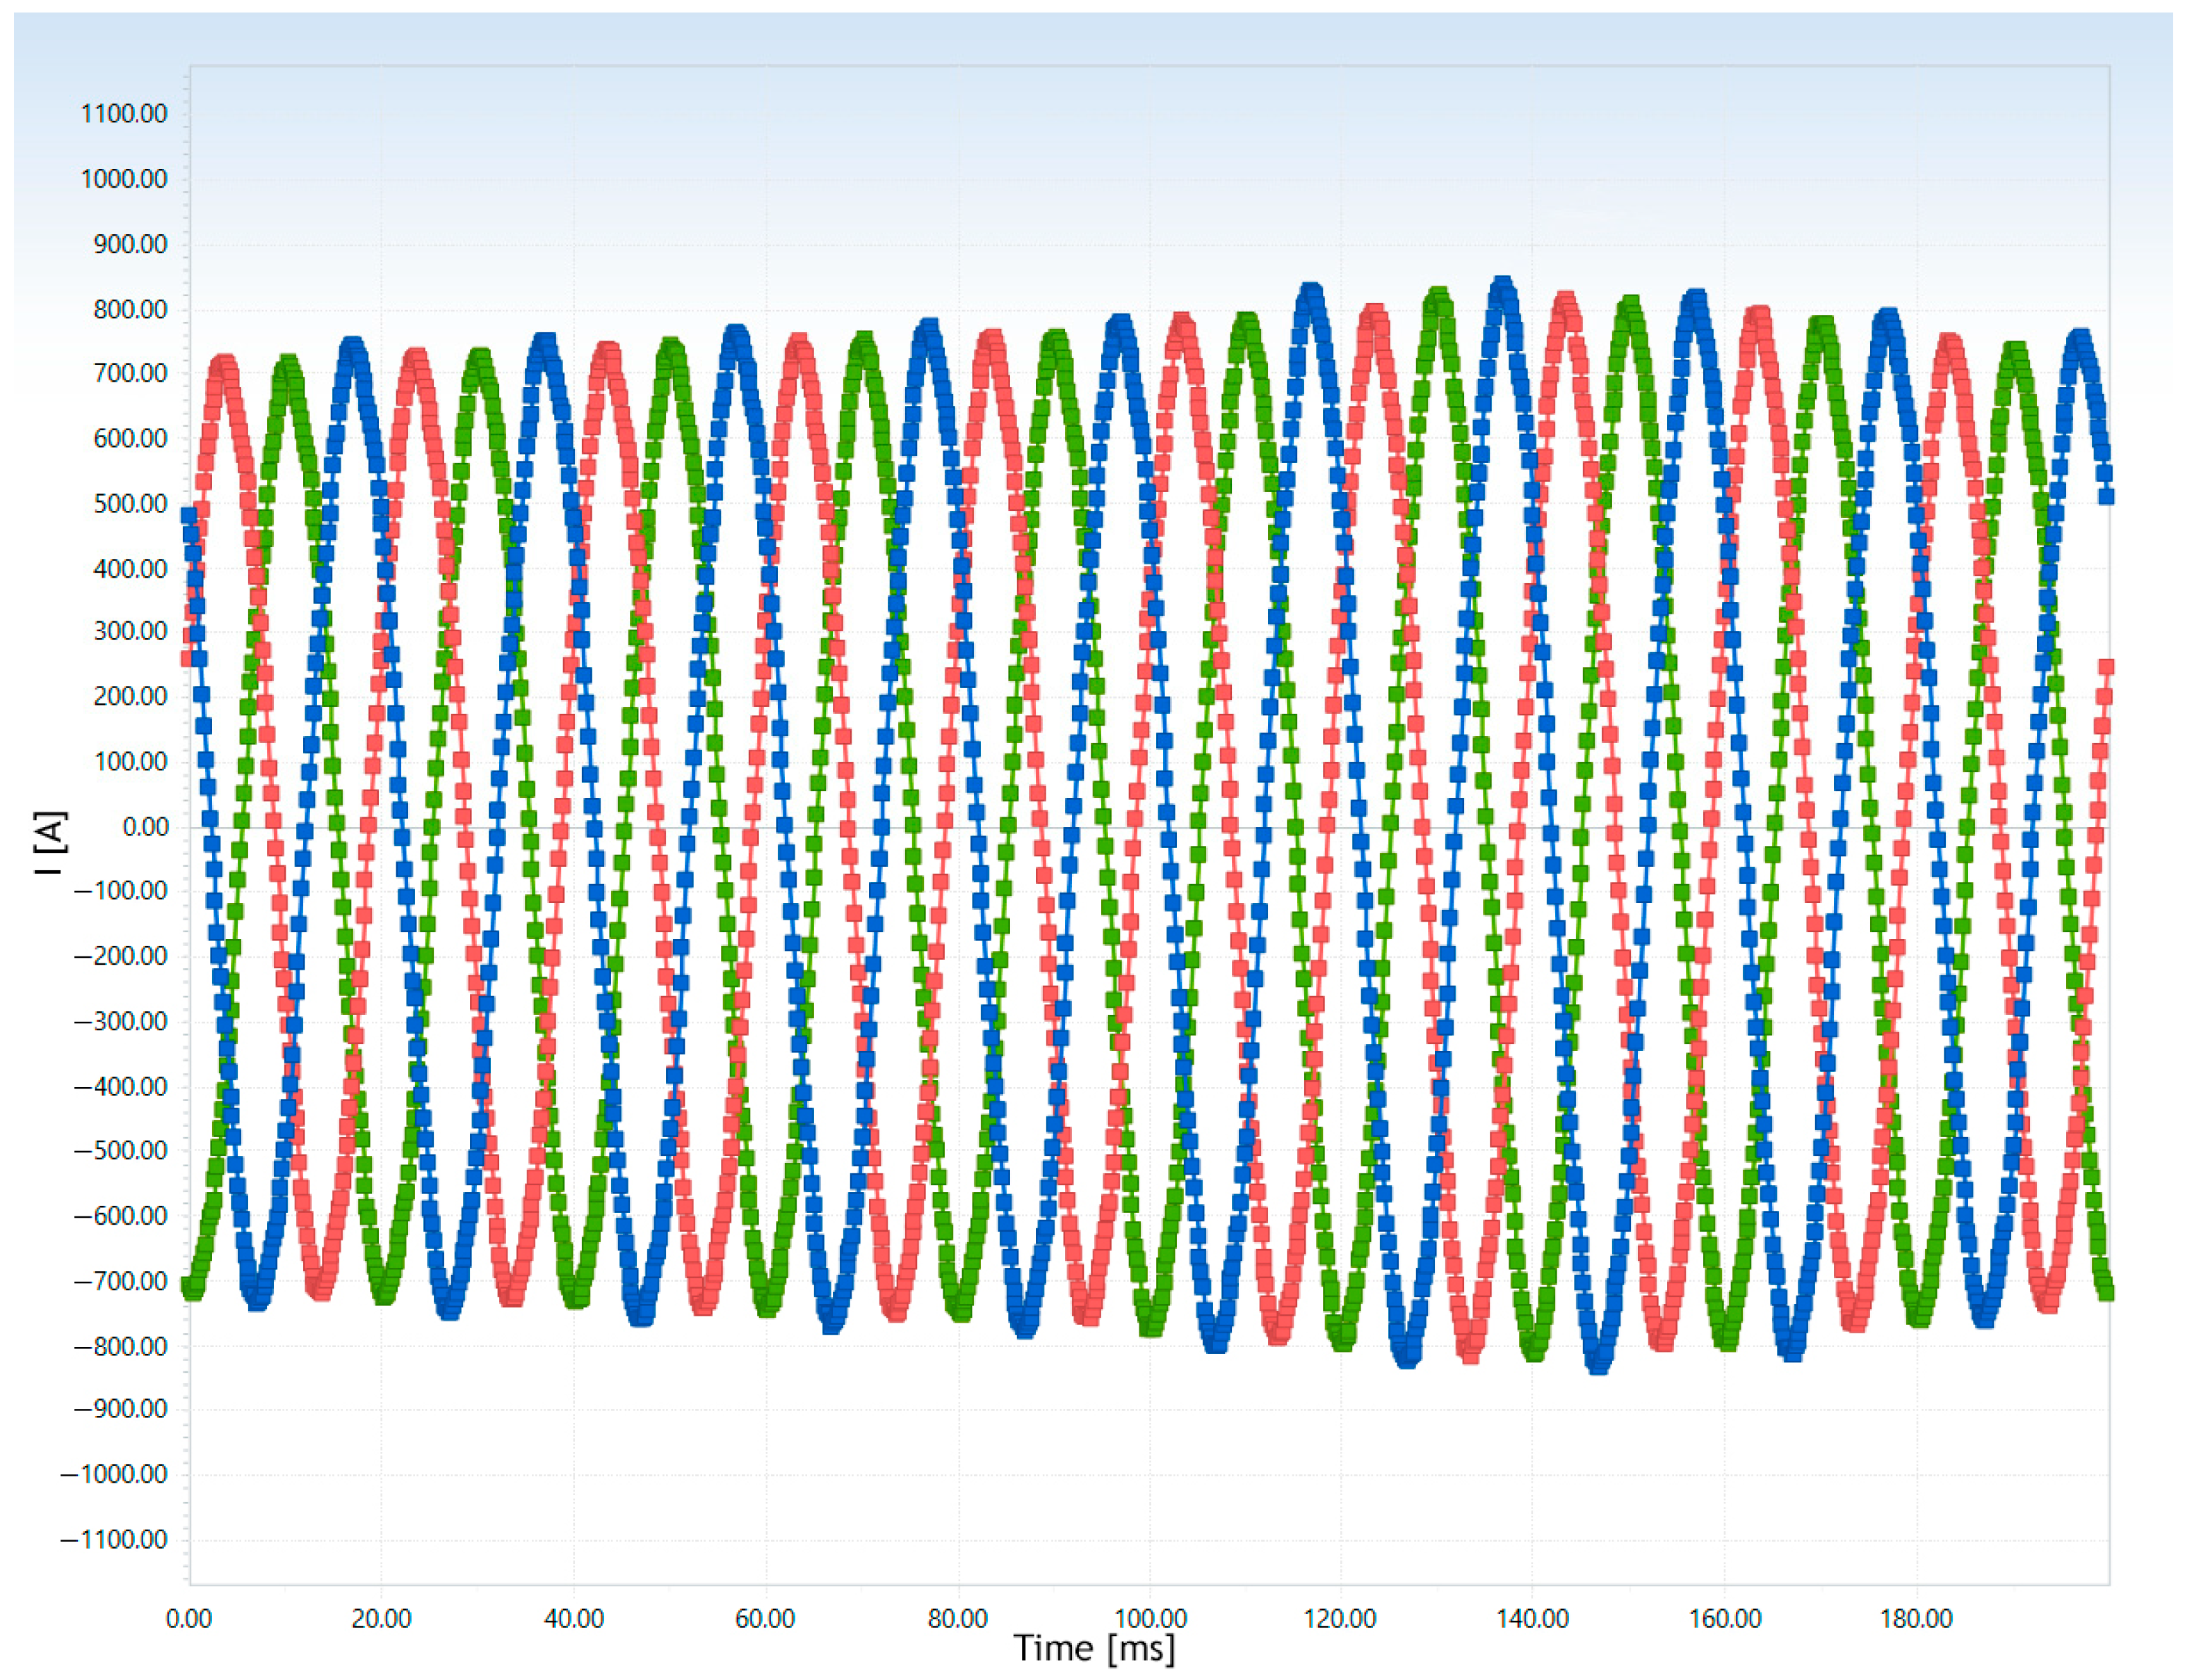
Before the measurement was initiated, the voltage and current signal waveforms shown in Figure 6 and Figure 7 were recorded. As can be seen, the current waveform exhibits distortion.

3.2.1. Results Obtained Using 10 min Data Aggregation Method

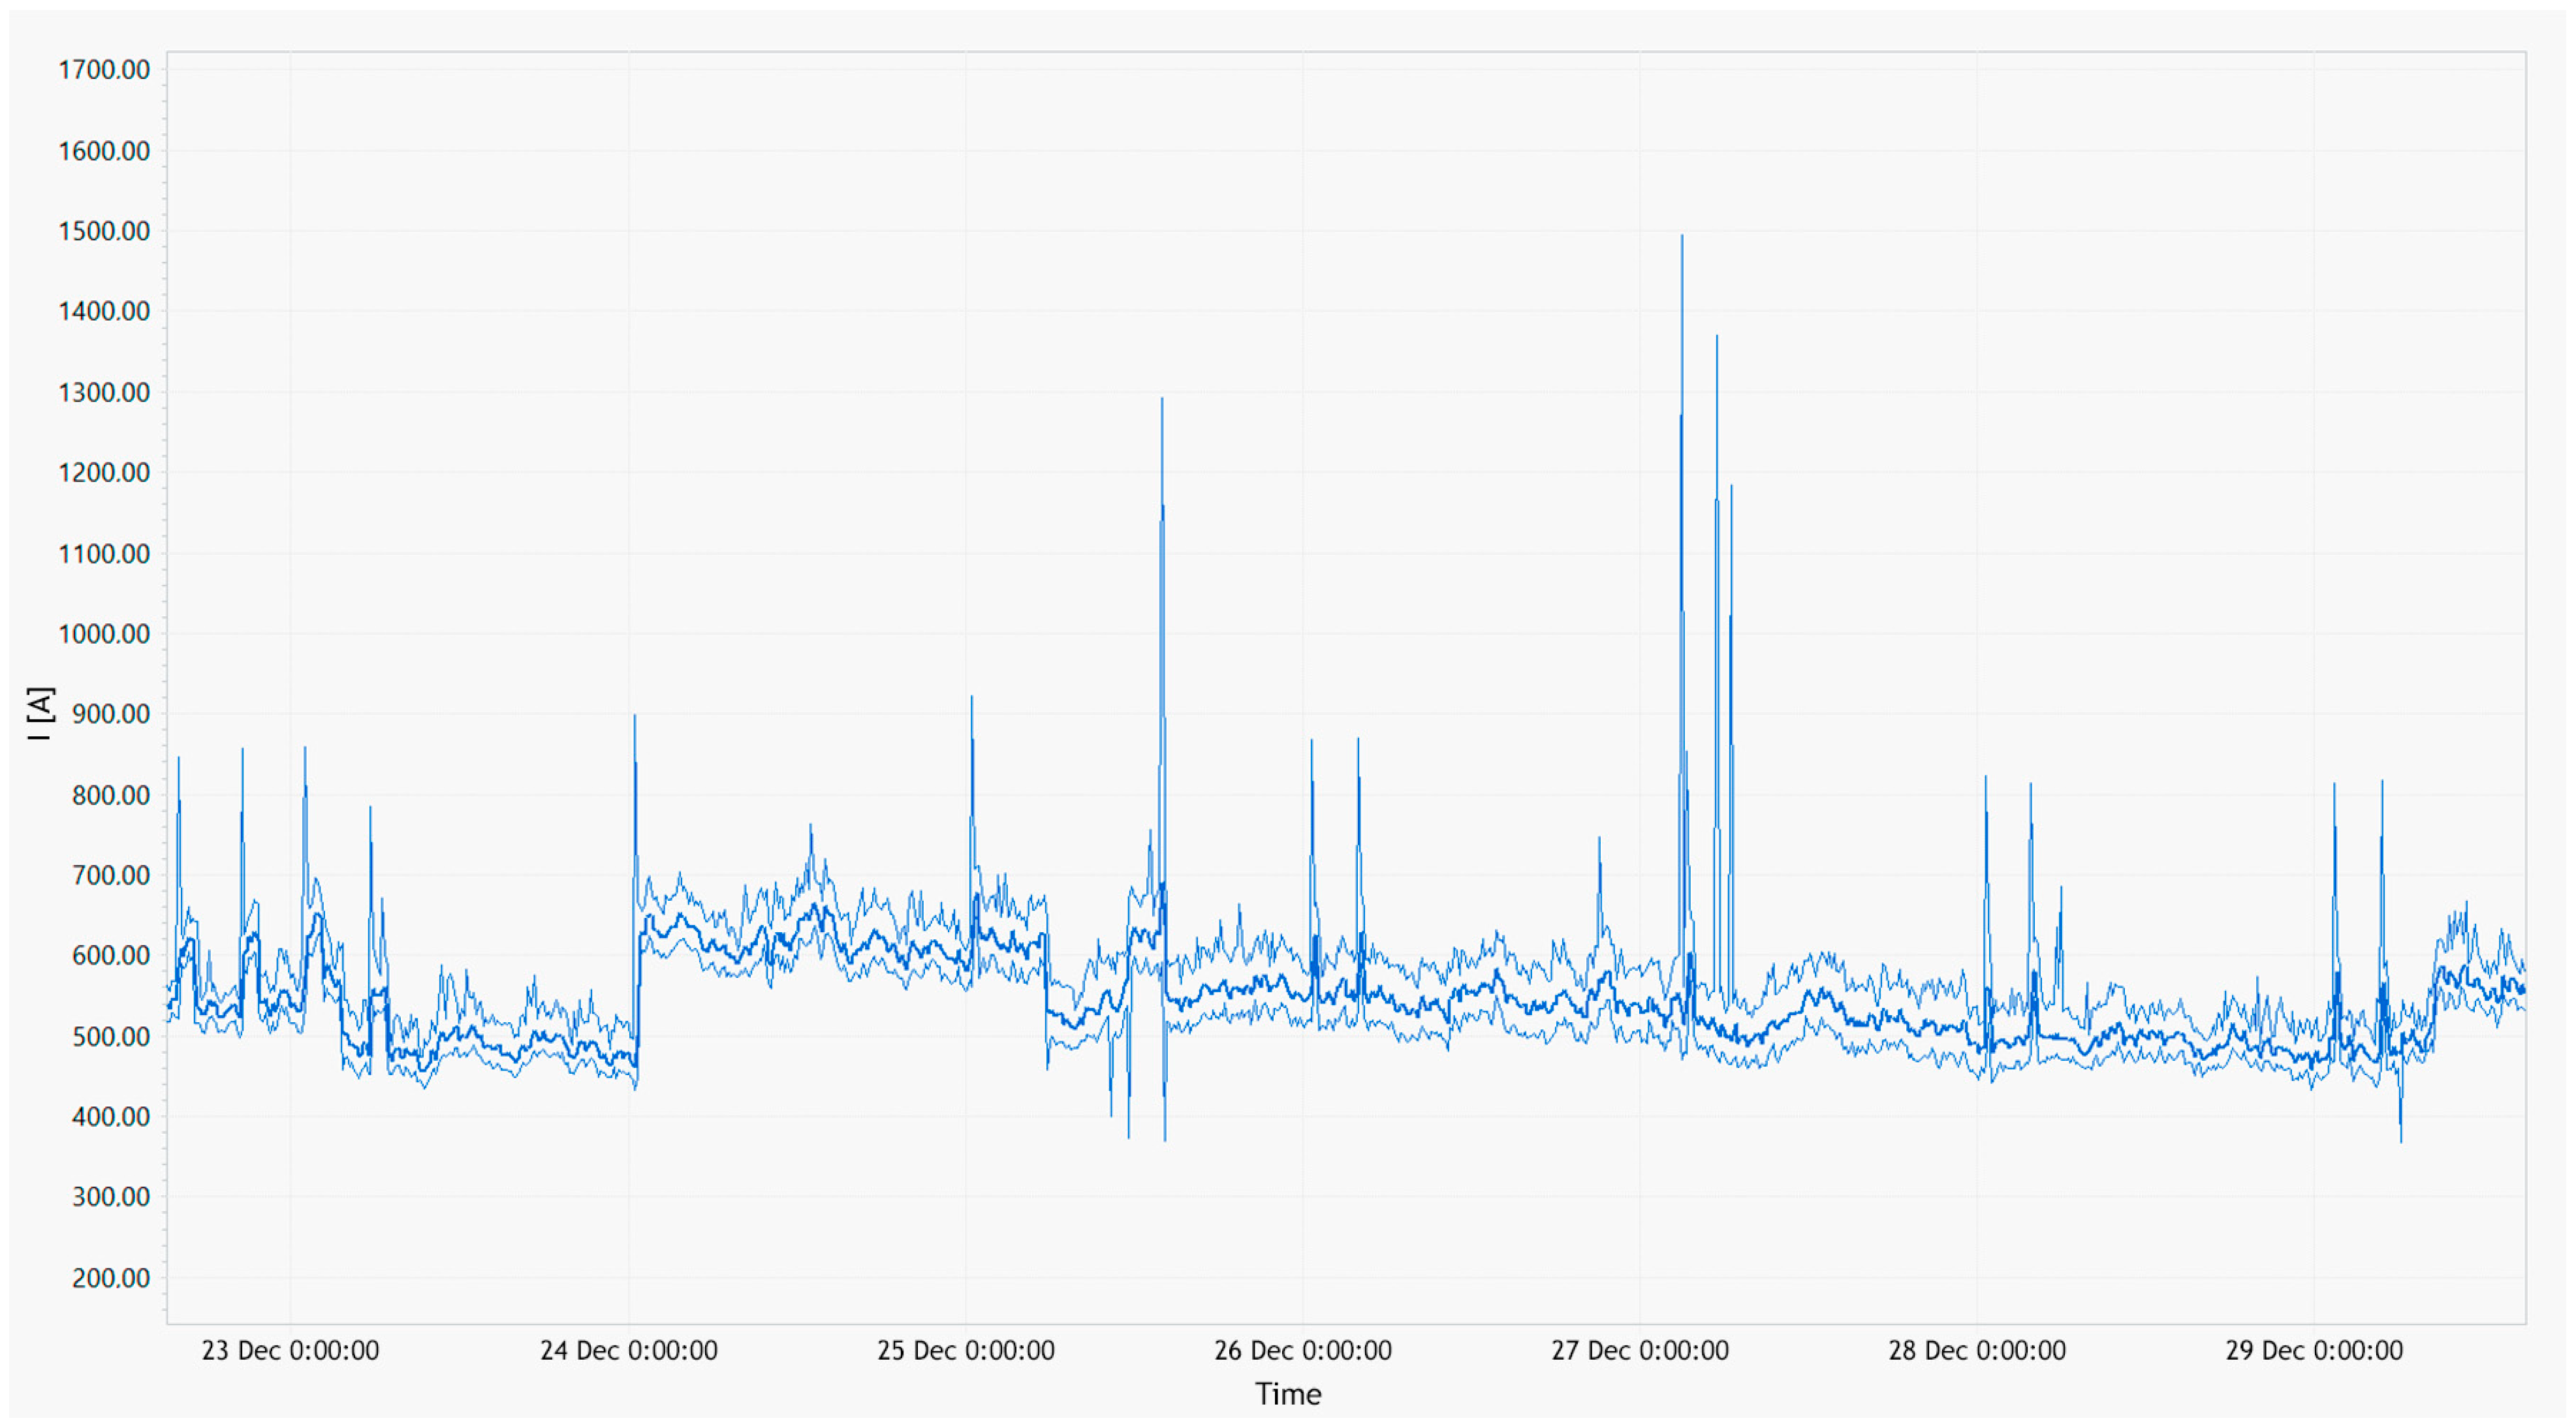
Figure 8 presents the oscillogram of I1 current recorded over a 7-day period. It can be observed that sharp current surges in the range of 500 to 1500 A are present. This confirms the occurrence of inrush currents and, consequently, electromagnetic distortions in the power system.
Seventeen voltage sags were recorded. In three-phase power supply systems, the initiation of a voltage sag is defined as the instant when the voltage in at least one phase falls below the predefined sag initiation threshold, whereas the termination is defined as the instant when the voltages in all phases exceed the sag recovery threshold.
Voltage sags generally occur as a result of faults in electrical networks or consumer installations, as well as under large load connection conditions. Such events cannot be effectively concealed by extending the sampling interval, as they are recorded situationally and therefore appear in reports, irrespective of the sampling settings. By analyzing the sag initiation time, its duration, and the location where the event was recorded in correlation with operational logs, the origin of these disturbances can be identified. All voltage sags have an adverse impact on sensitive equipment and ultimately lead to equipment malfunction or failure.
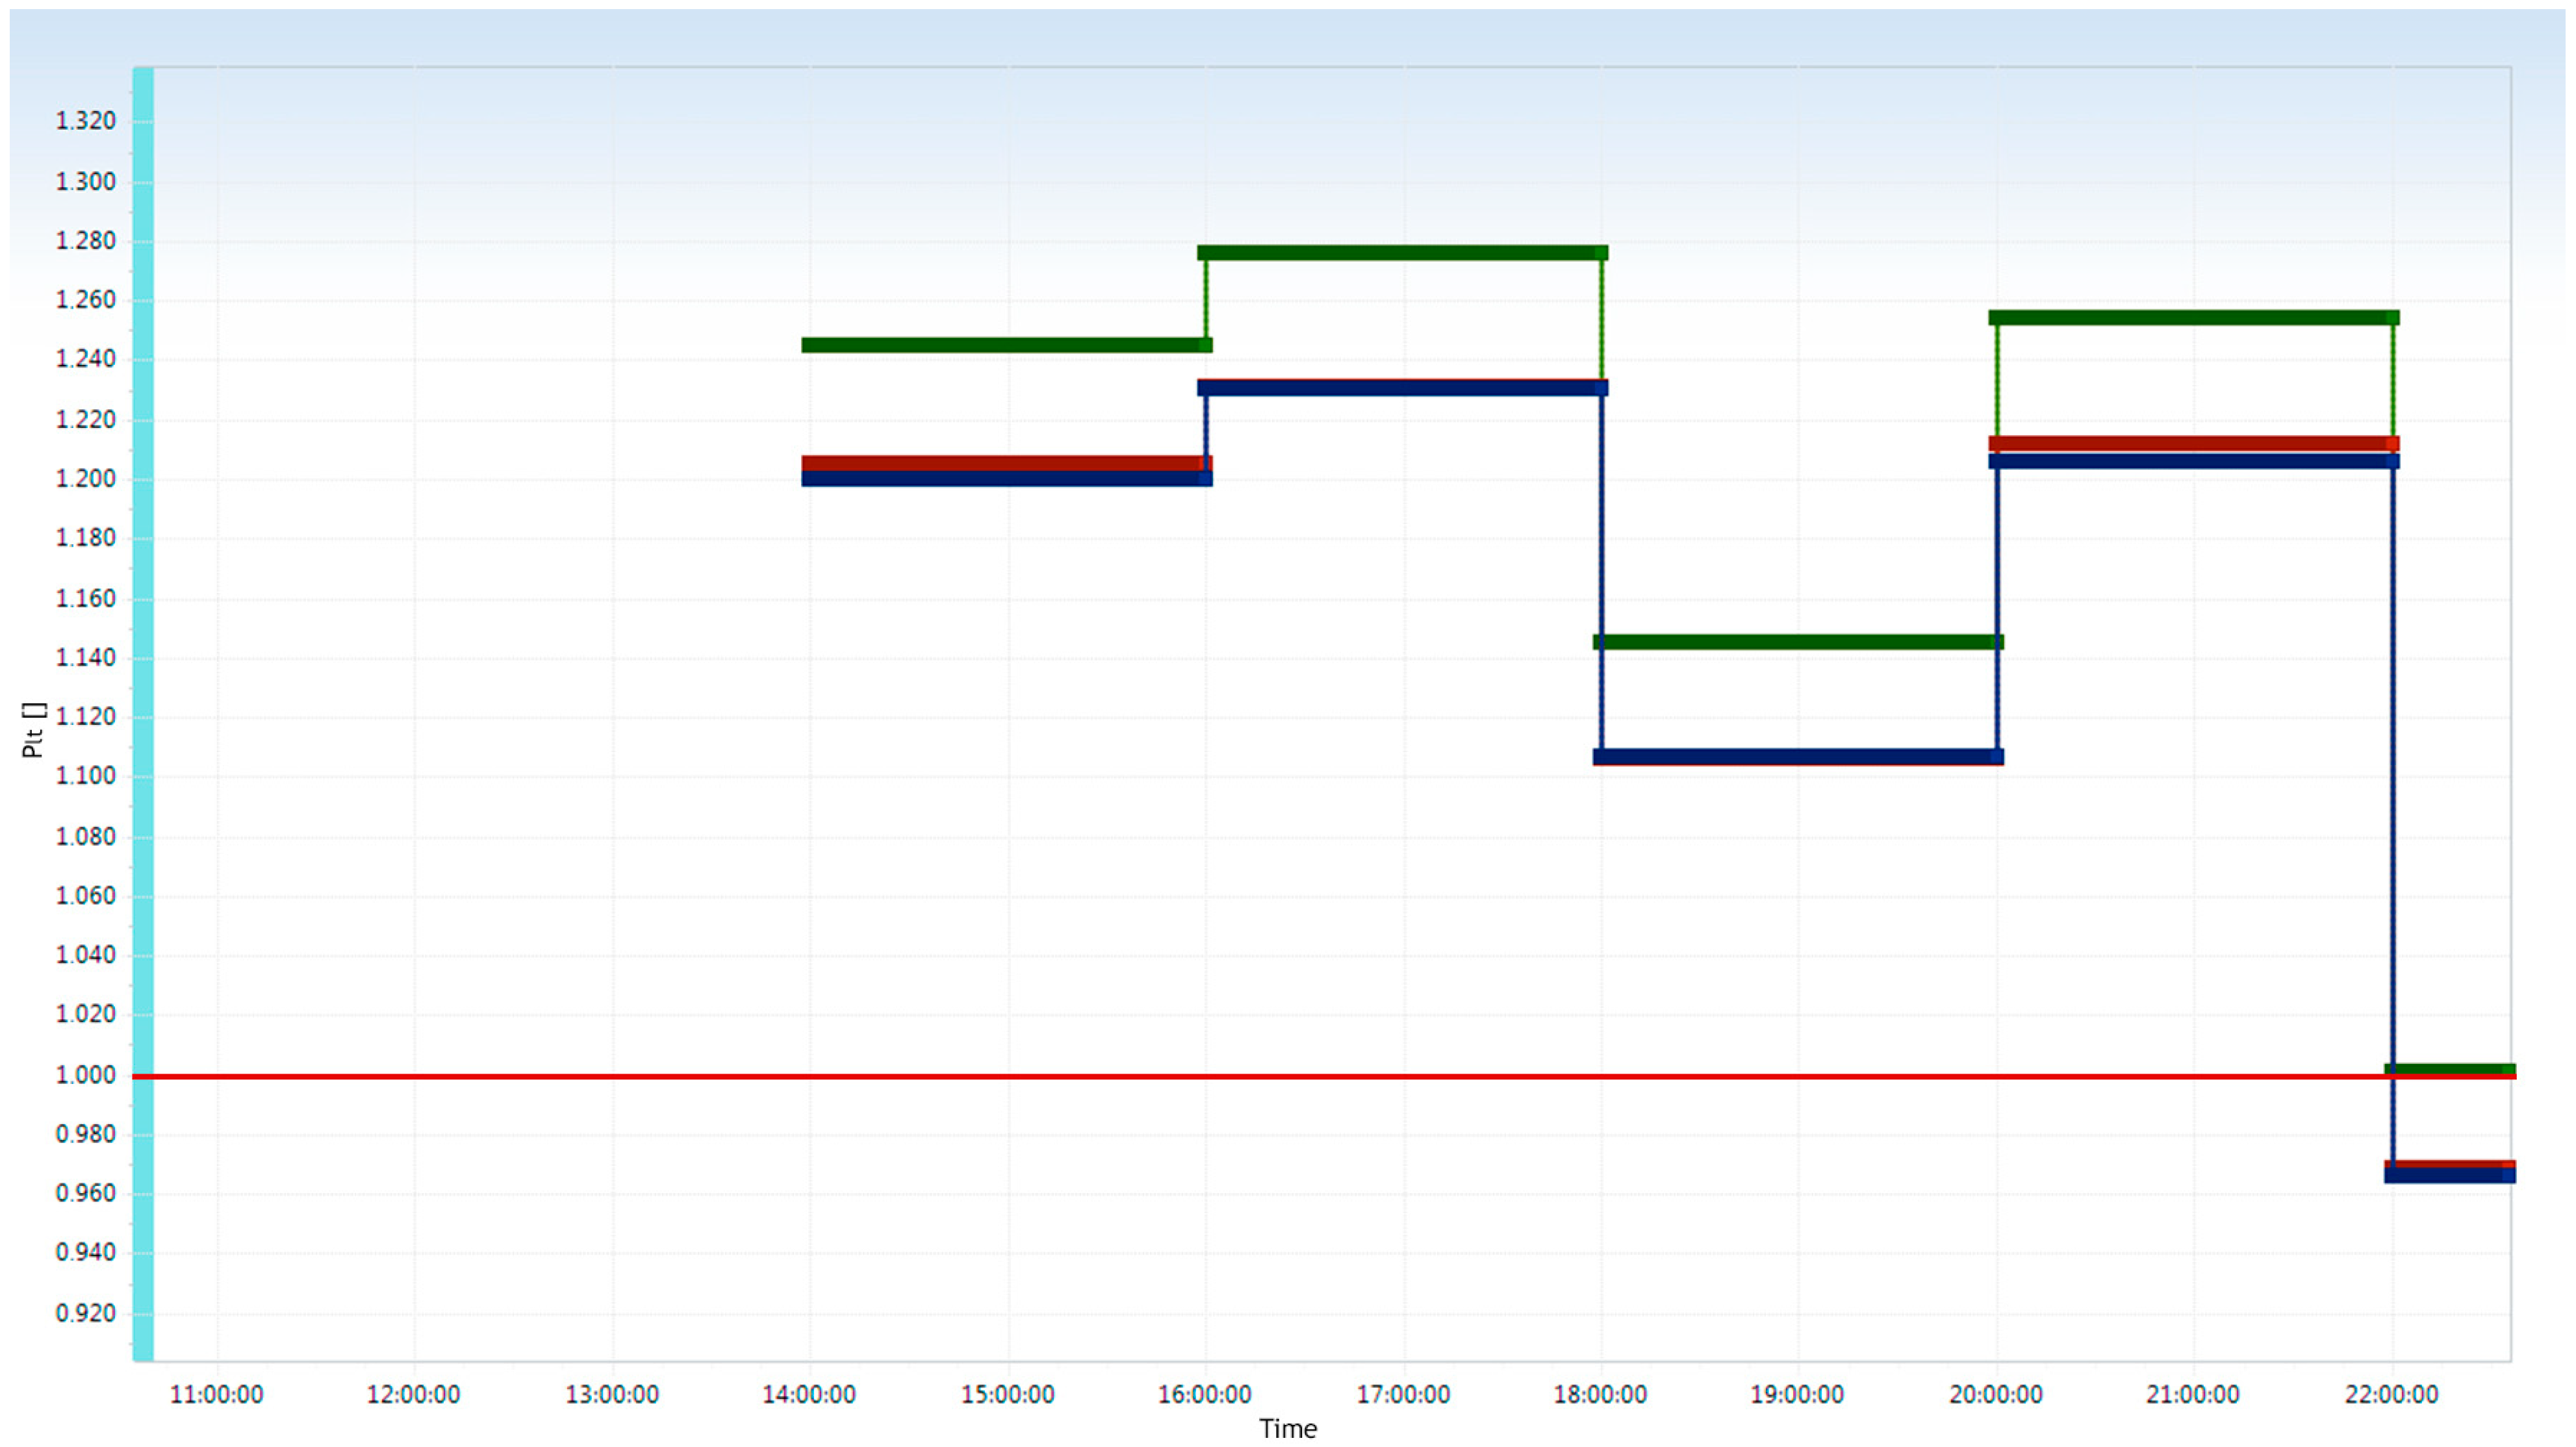
Figure 9 shows short-term flicker severity values (green dots) and its threshold (red line) that corresponds to 1.38 pu, while Figure 10 shows long-term flicker severity values and its threshold (red line) that corresponds to 1.00 pu. As can be seen, the values of both short-term and long-term flicker severity exceed the permissible limits.
The cause may be related either to variations in voltage amplitude (which, according to the protocol, remain within acceptable limits) or to the fact that this visual sensitivity is strongly dependent on the frequency of the disturbing processes, reaching its peak at approximately 7–10 Hz.

3.2.2. Results Obtained Using the 1 s Data Aggregation Method

With the instrument memory limited by its built-in capacity, only 12 h of data recording were allowed to be stored. No options for expanding the PQ analyzer memory are provided.
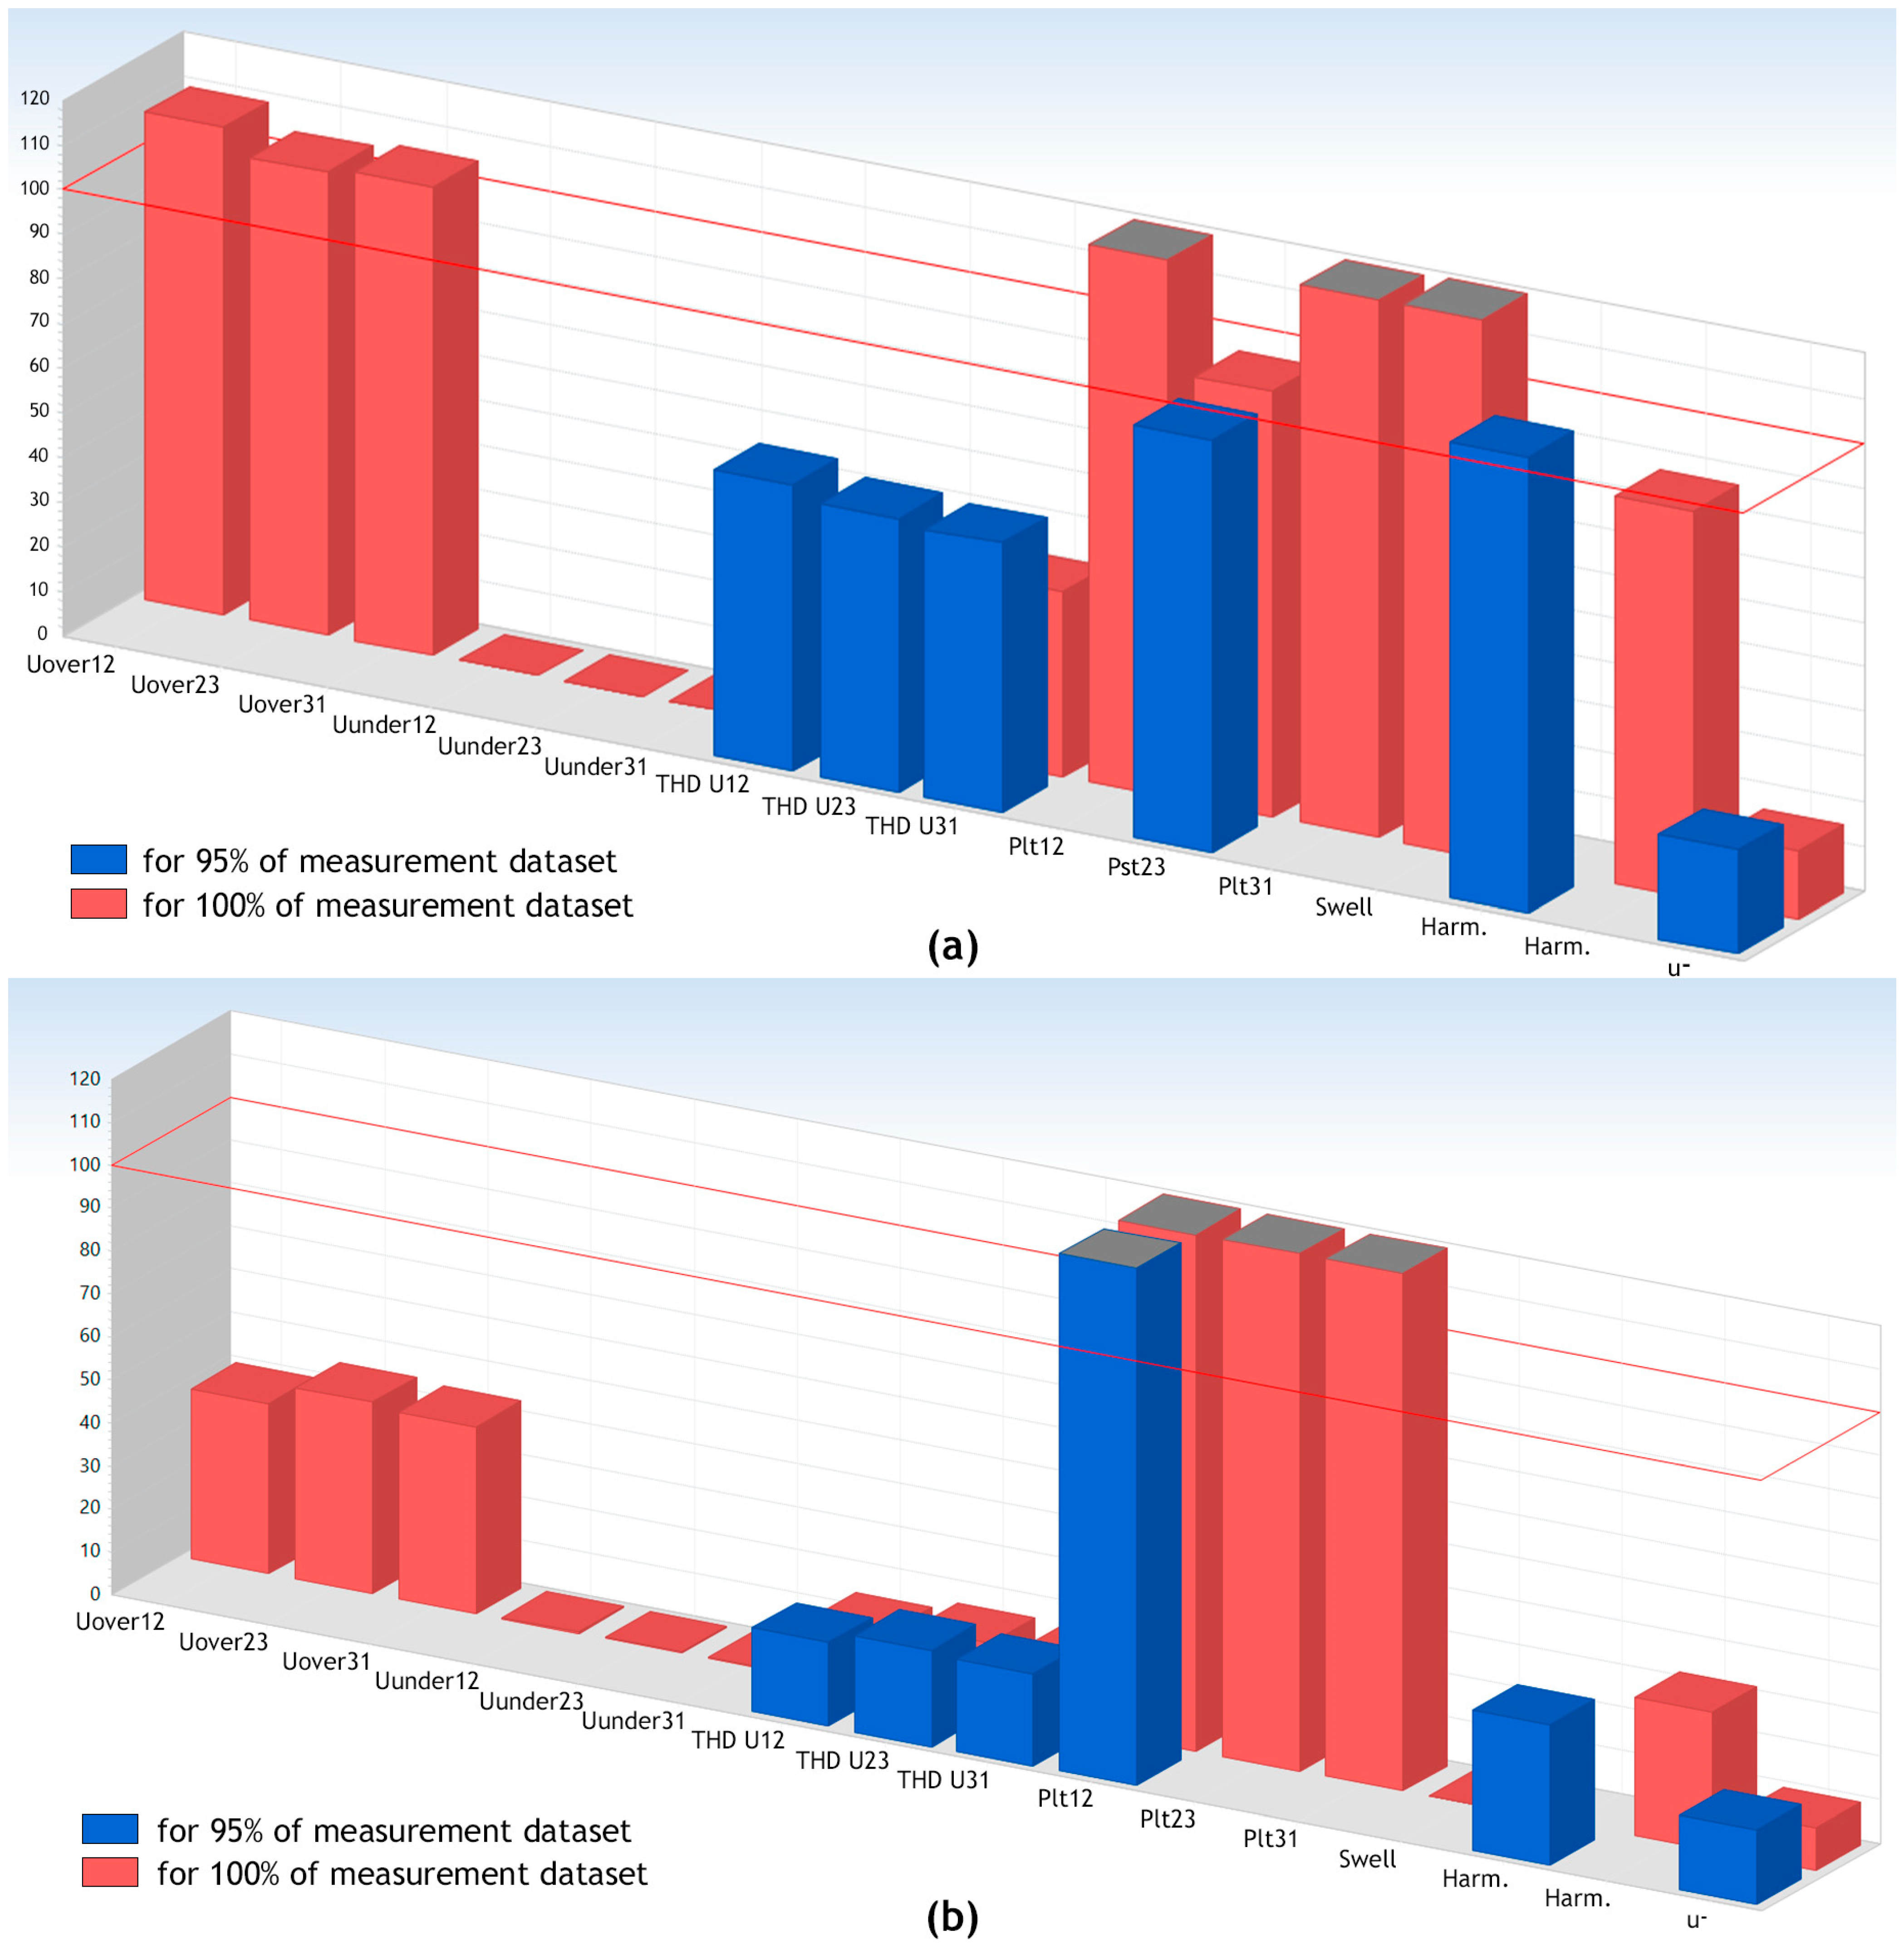
Figure 11 provides a direct comparison of PQI non-compliance with the GOST 32144-2013 [22] standard requirements when employing different data aggregation intervals. As can be seen from Figure 11a, the application of the 1s data aggregation method enables the revelation of eight PQIs exceeding the permissible level (red line), including phase-to-phase voltage over-deviations (Uover12, Uover23, Uover31), voltage swells, harmonic distortions, etc. It should be emphasized that when using the 10 min data aggregation method, some of these distortions are not captured in the summarized measurement report (Figure 11b).
More than 350 overvoltage events were recorded. The average event duration was 17–18 s, with prolonged overvoltages lasting up to 24 min also observed.
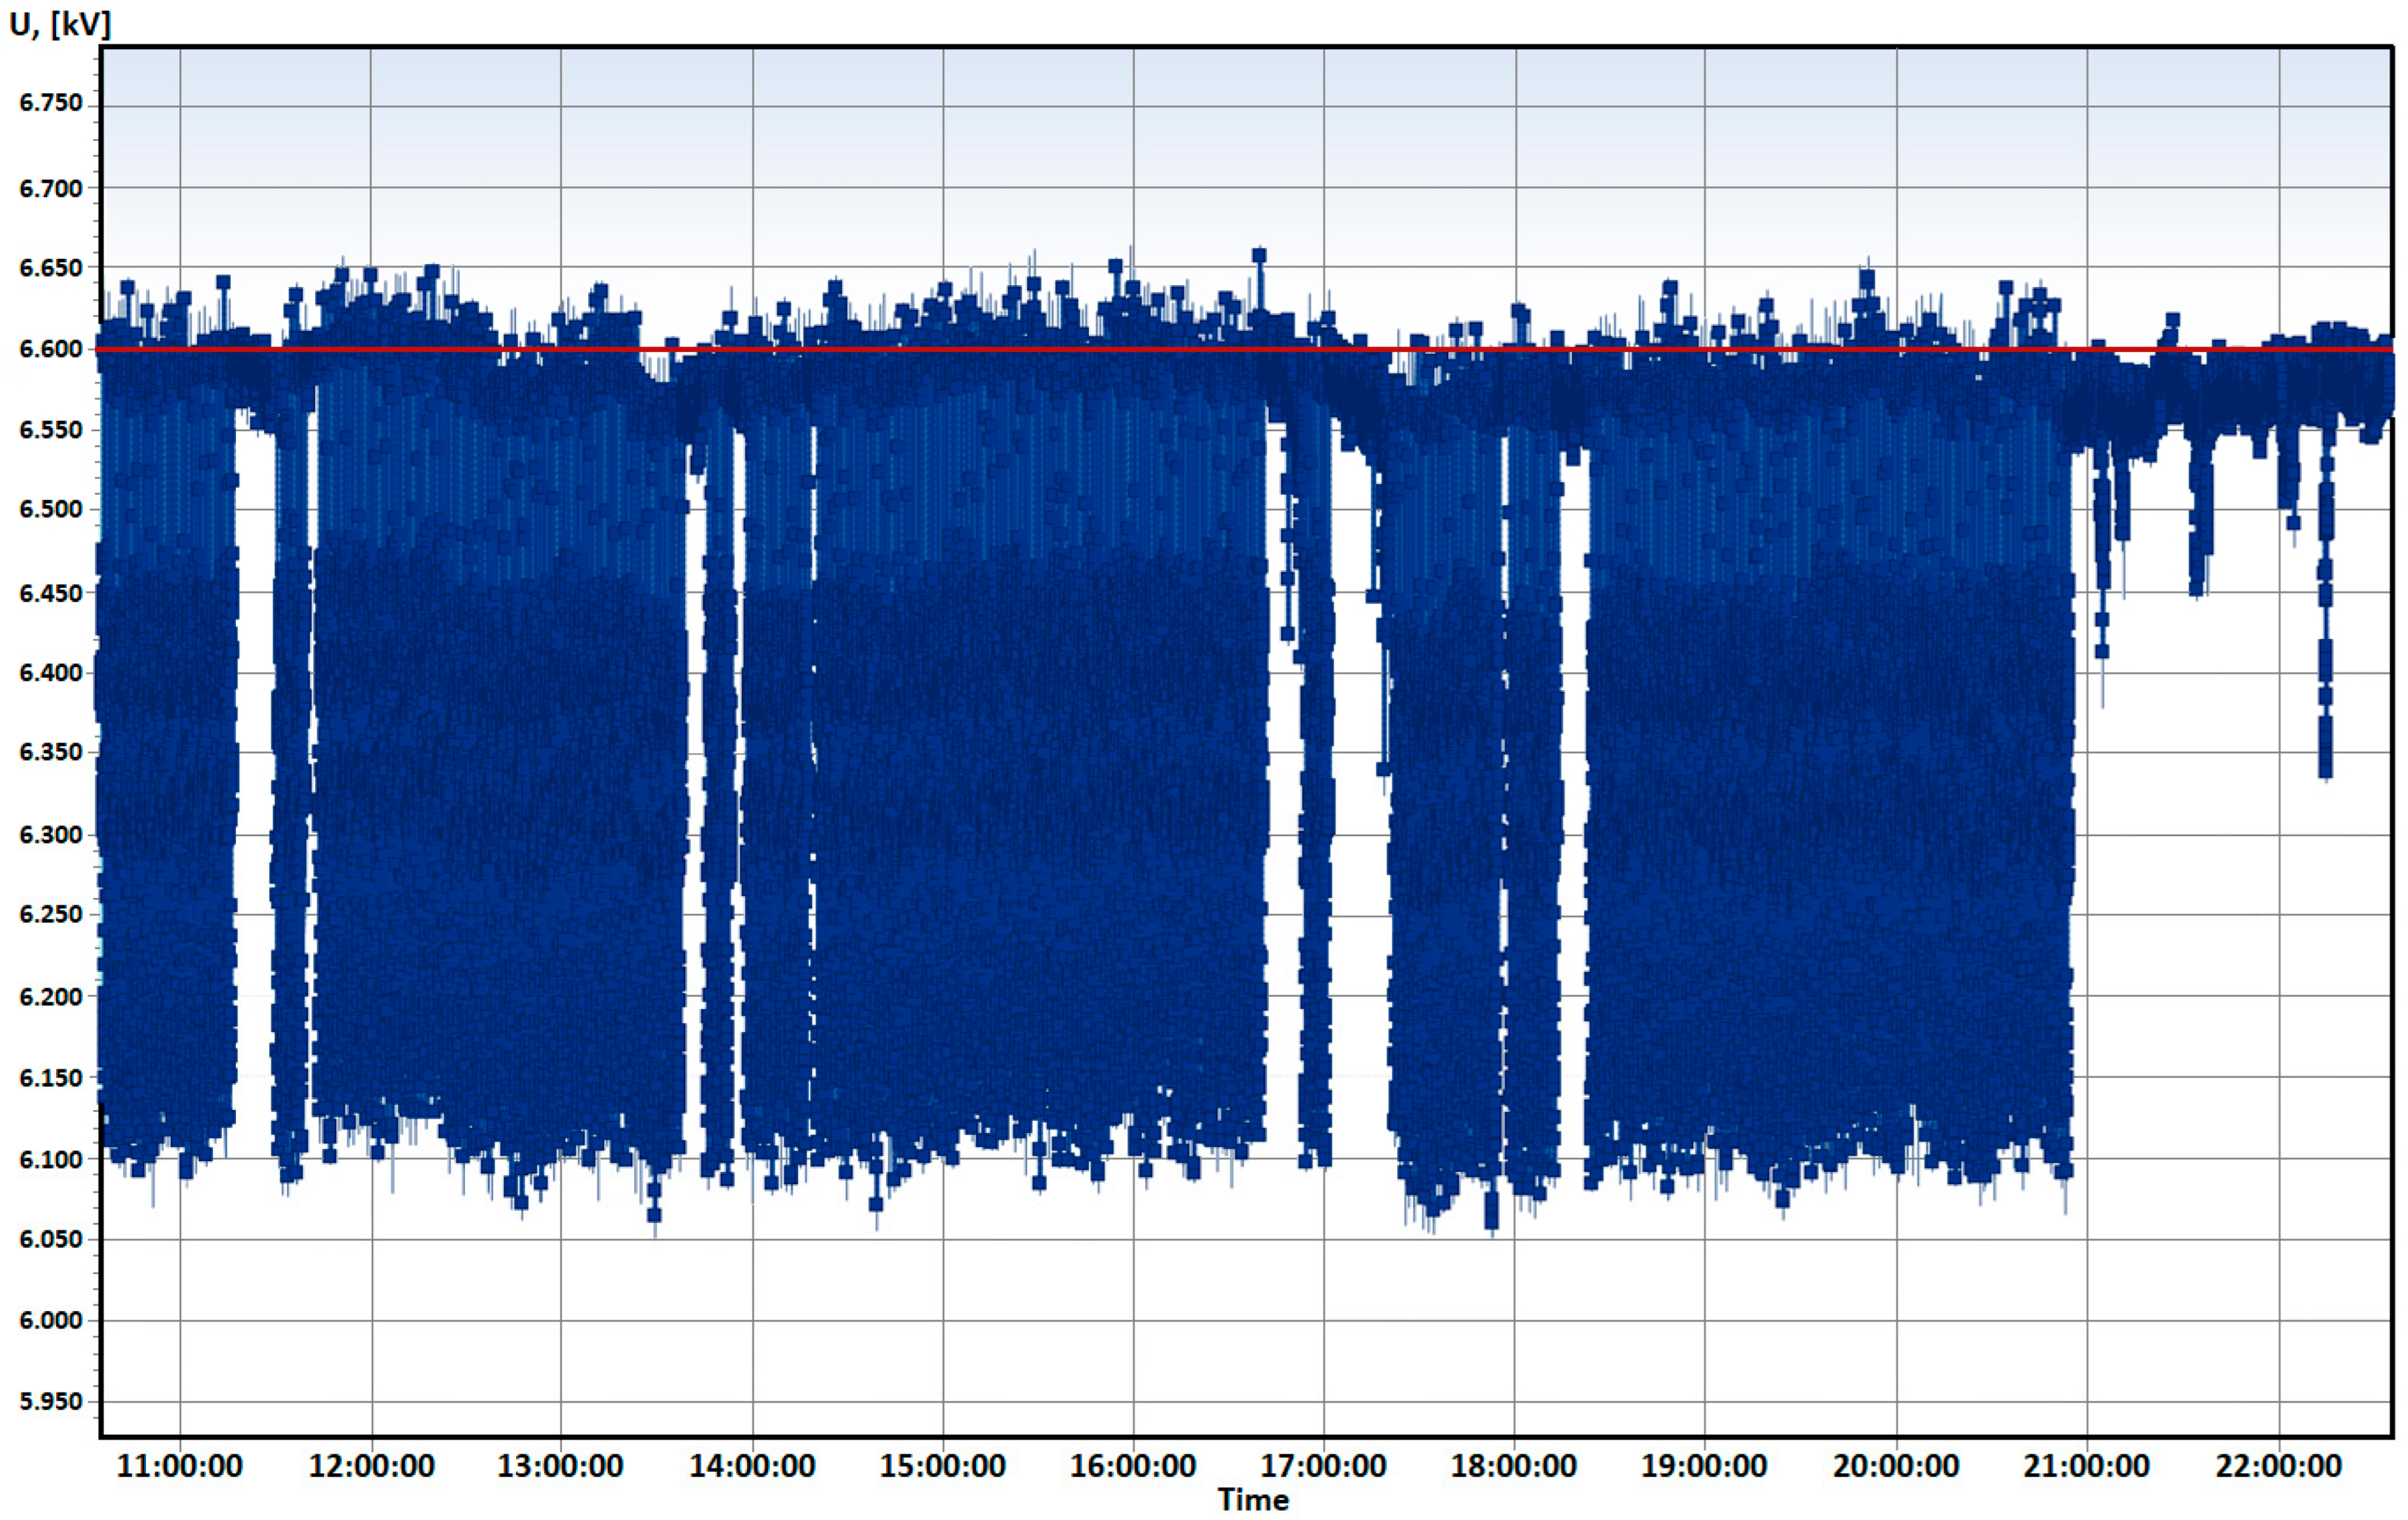
When conducting measurement using 1 s aggregation interval, the voltage level was captured more accurately compared to the use of 10 min aggregation interval. Figure 12 shows the variation in U12 voltage (blue dots) over a 12 h period and the voltage over-deviation threshold (red line that corresponds to +10% Unom). The dots above the red line are the voltage values exceeding the permissible level. The oscillogram demonstrates that the magnitude of voltage oscillations decreases significantly after 21:00. This reduction coincides with the end of the work shift at the enterprise, at which point the mine hoist ceases operation, thereby reducing its impact on the power system.

3.2.3. Identification of the PQ Distortion Origin

The PQ disturbances observed were considered to be caused by the electromagnetic influence of high-power mining installations (hoists, motors, etc.). Mine hoists are characterized by severe operation mode resulting from frequent starts and stops, rotation direction changes, and speed variations. Such equipment uses motor drives controlled by automation. In the case of hoists, automation controls rotation speed, pressure, armature, and excitation current, and other parameters.
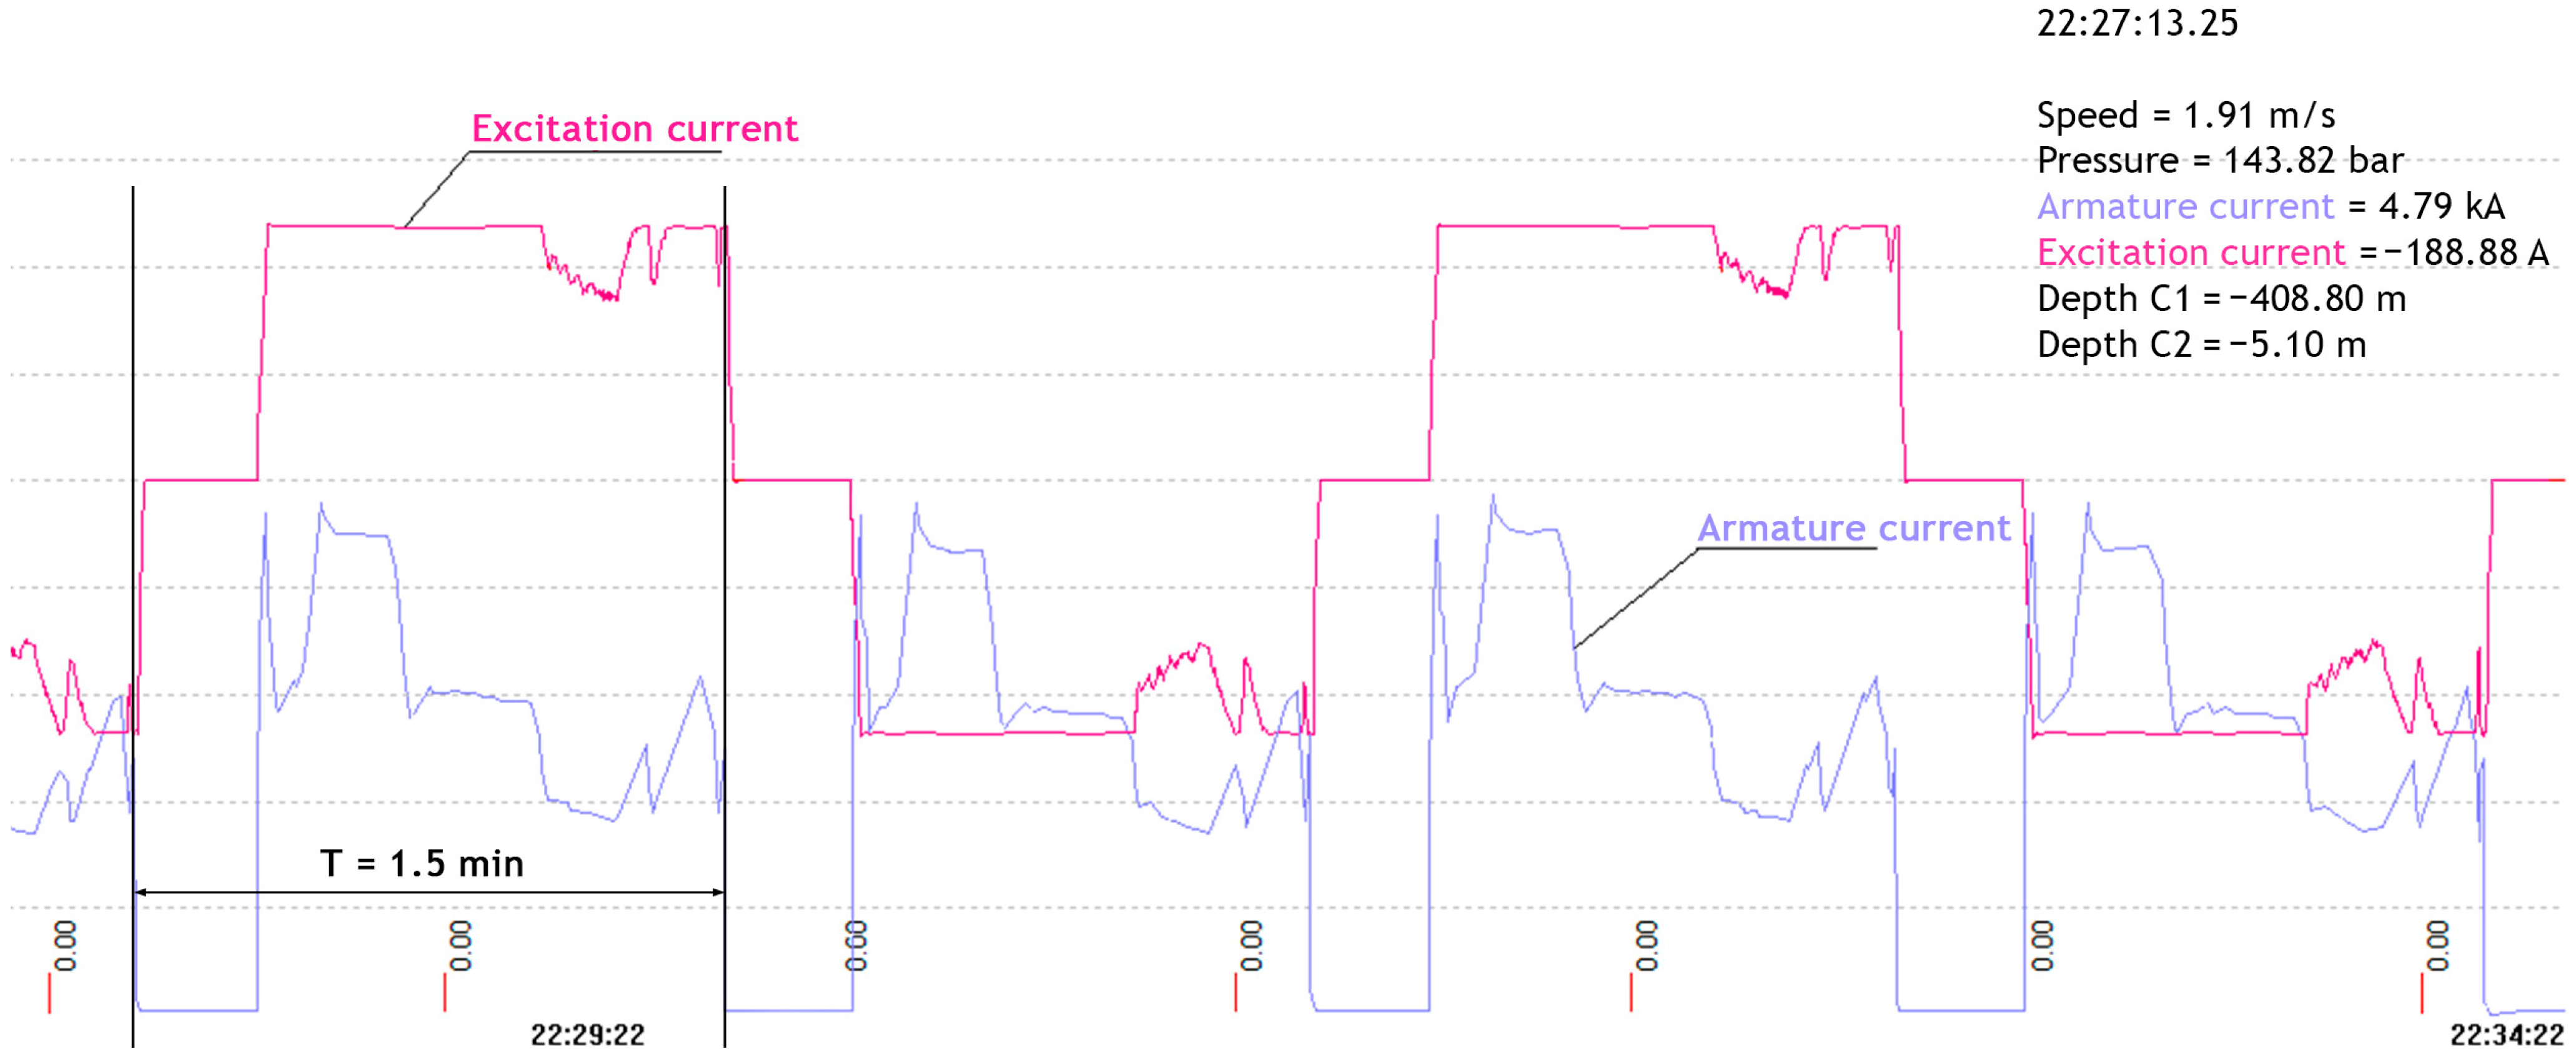
Electrical parameters of the mine hoist were also obtained. Figure 13 shows oscillograms of armature current and excitation current.
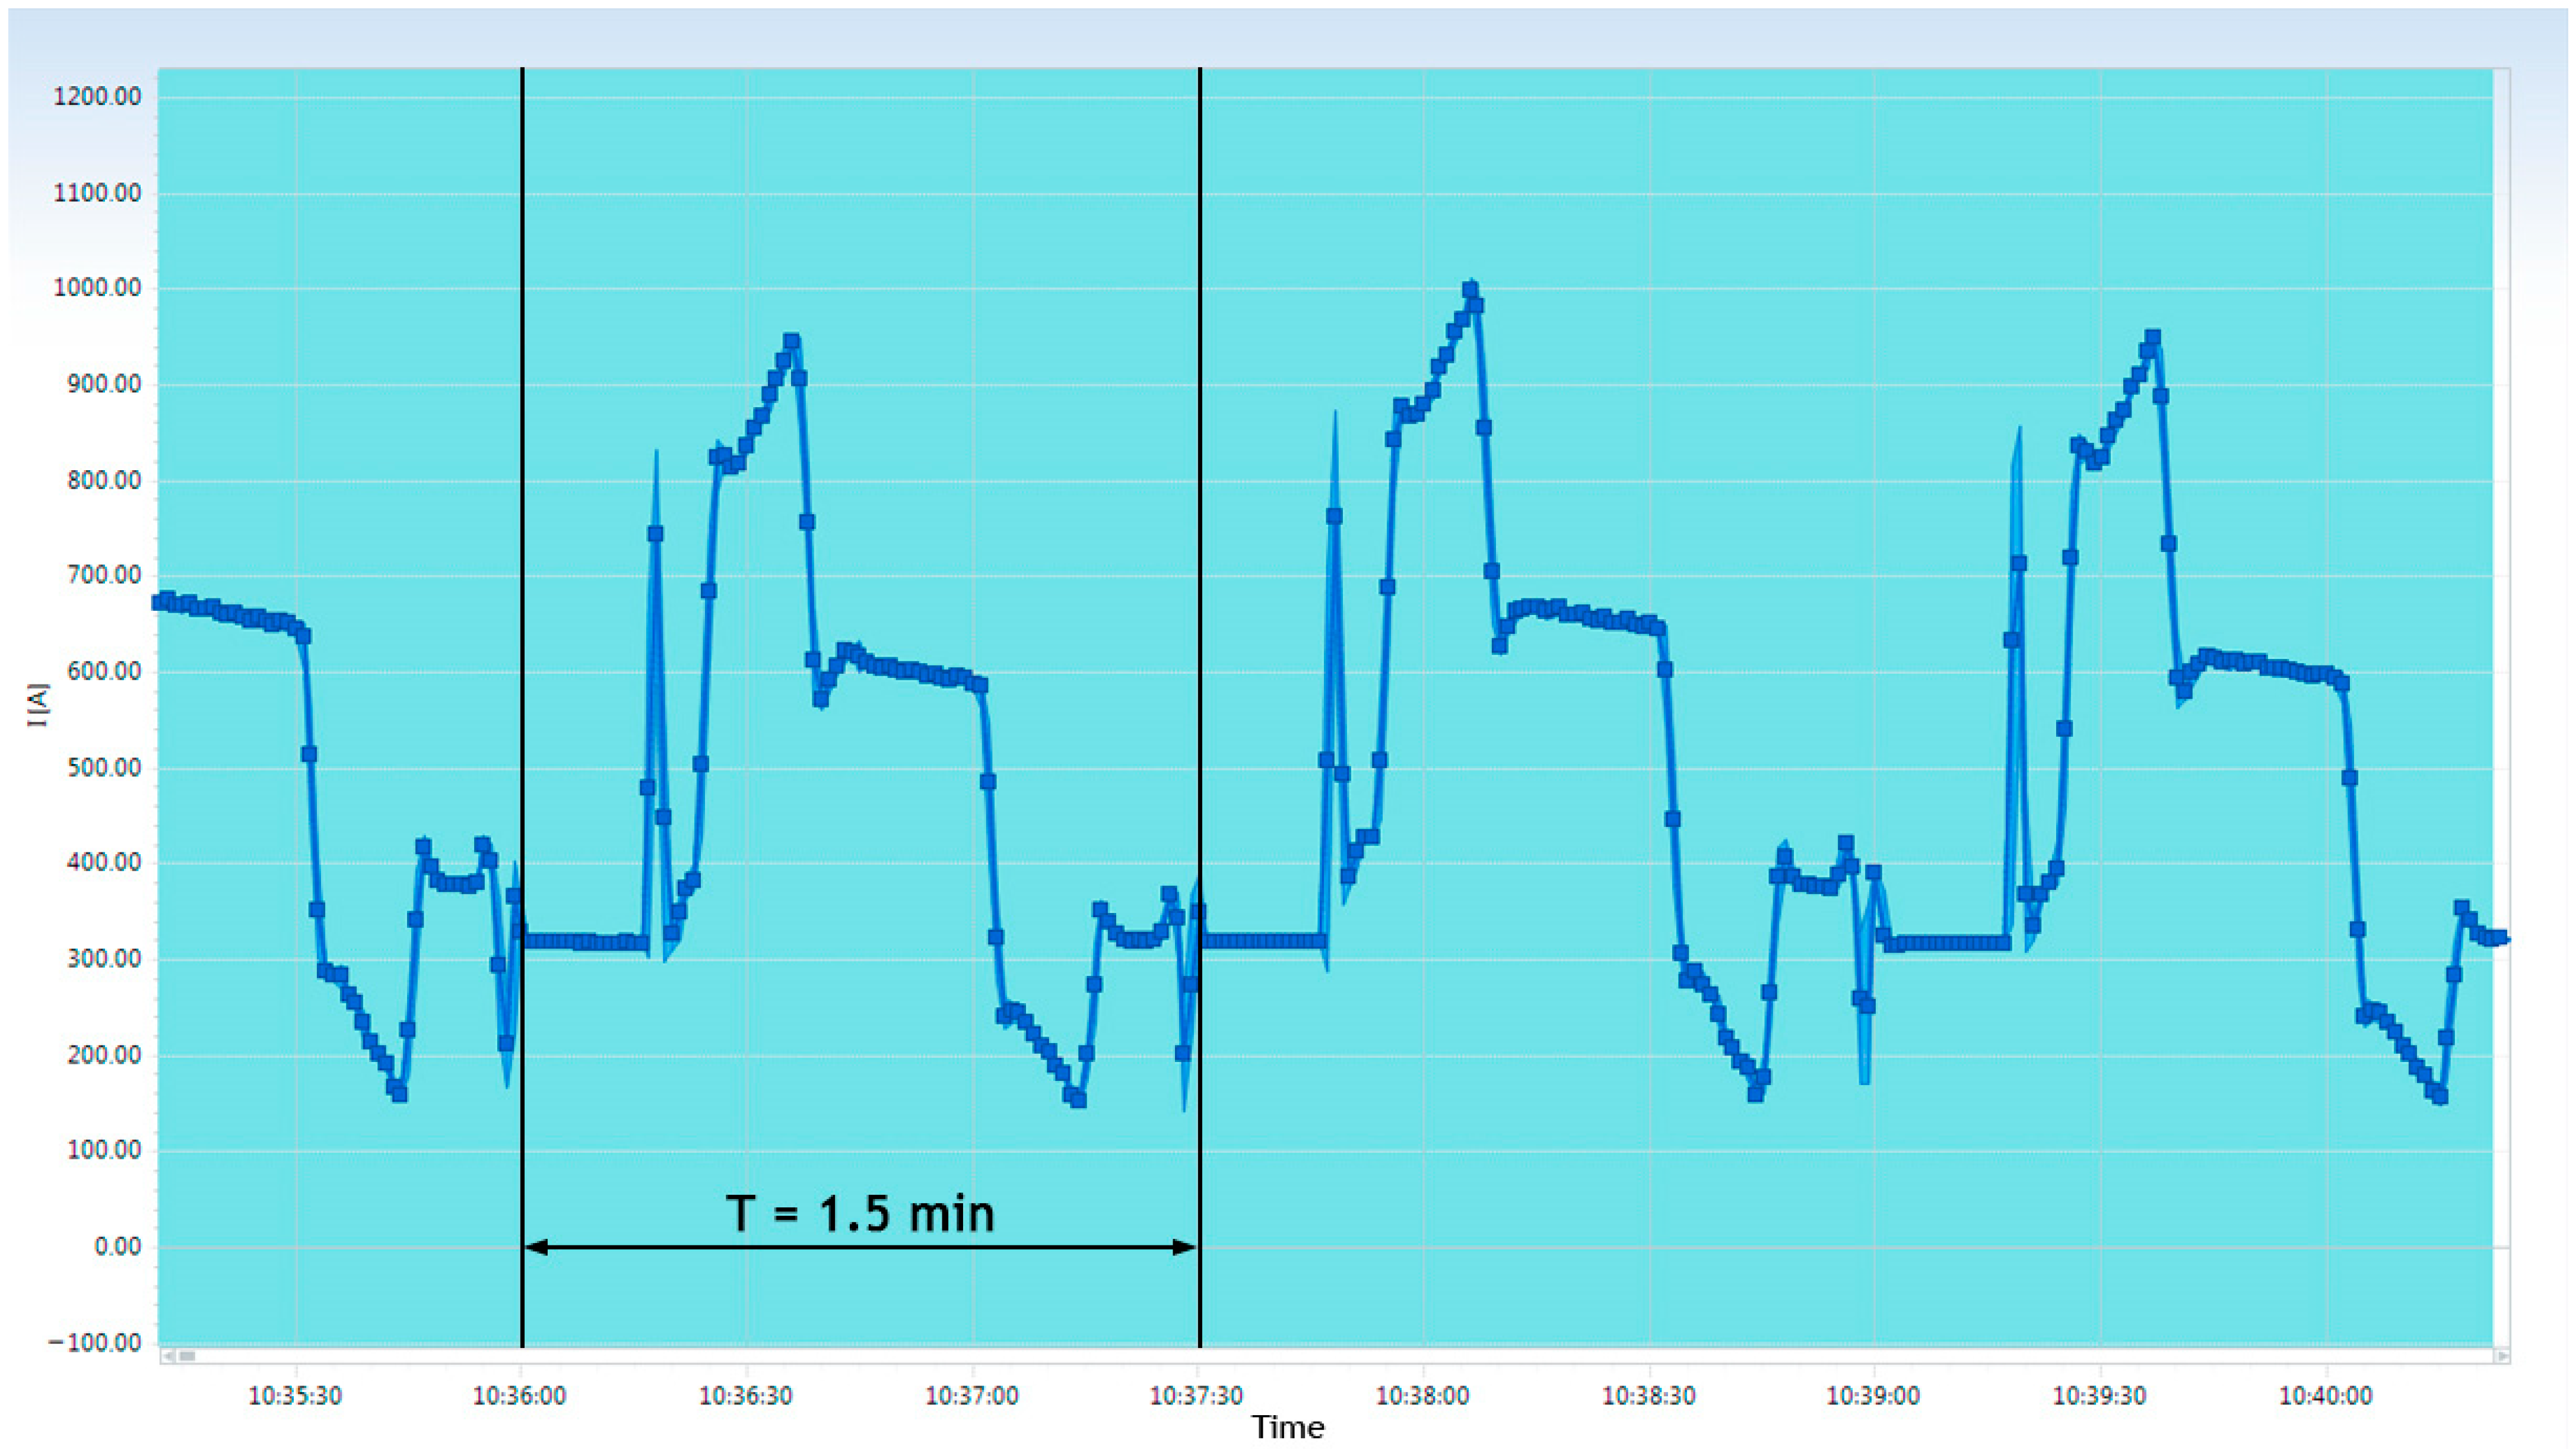
The period (T) of excitation current is 3 min. The armature current period is 1.5 min, which is equal to period of the current measured on bus 4 (Figure 14).
It should be noted that the current waveform (Figure 14) shows fluctuations from 150 A to 1050 A. The current change of almost 500 A within 1 s strongly affects electrical equipment deterioration.
The current oscillograms depicted in Figure 13 and Figure 14 repeat the same pattern (mine hoist operation mode is cyclic) in terms of period and amplitude, but the waveforms are different, which can be explained by the influence of other low-power specific equipment of the mining facility.
Mining industry facilities are powered by medium- and low-voltage substations on 6/10 kV side, and the main electric load consists of DC drive motors. Operation of such motors is controlled by microprocessor technology that is both a consumer of reactive power and a source of harmonic distortions.
Single rapid voltage changes are generally caused by sharp electric load changes, switching processes, or faults. To solve this problem, thyristor voltage regulators (TVR) [30,31,32,33] that are still not sufficiently popular and studied are applied. However, to assess the influence of TVR employment on PQ within this case study, the simulation of the power system behavior needs to be performed.
Based on PQI data aggregated at 10 min and 1 min intervals, only the approximate state of PQ in a power system can be assessed. As noted earlier, 10 min aggregation intervals are extremely uninformative and approximate, which should be noted in the standards regulating PQI measurement or completely excluded from regulations, because measurement conducted using aggregation time intervals over 60 s technically cannot affirm whether PQ is compliant or non-compliant with the standard requirements. However, the measurement is sufficient for industrial facilities and supervisory authorities since these allow EMC problems in power systems to be legally concealed.

4. Conclusions

The main sources of electromagnetic disturbances observed on the site of the mining facility under study are high-power electrical installations of the mine, including DC and AC motors that are characterized by frequent starts and stops, rotation direction, and speed variations. The frequency of current surge occurrence is associated with the operation of mine hoists that impact the power system behavior, accelerate electrical equipment deterioration, and reduce its lifespan.
Conducting PQI measurement using 10 and 1 min data aggregation methods is insufficient to identify the origin of PQ distortions, as this only enables the capture of steady voltage deviations and complete grid failures. Low time resolution allows imperceptible and fast processes to be lost or blurred in a final report, reducing the information content and accuracy of PQ analysis. It is important to take this into account, as it is precisely these short-term events that negatively impact the operation of sensitive equipment and lead to power system failures. Employing data aggregation intervals of less than 1 min enables us to localize the disturbance source and select efficient mitigation techniques.
The significant shortcomings of the existing PQ standards and the instruments, therefore, result from the lack of a comprehensive approach to time dynamics, limited spectral coverage, and low accuracy in recording short-term distortions.
Therefore, the research has confirmed the inadequacy of the existing methods of measuring PQI and data processing, proposing improvement of methods and tools for PQ monitoring to increase the reliability of industrial facilities.

Author Contributions

Conceptualization, A.S.K., V.V.Y. and E.I.G.; methodology, A.S.K. and V.V.Y.; formal analysis, V.V.Y.; investigation, A.S.K. and V.V.Y.; writing—original draft preparation, A.S.K. and V.V.Y.; writing—review and editing, E.I.G.; visualization, E.I.G.; project administration, A.S.K. All authors have read and agreed to the published version of the manuscript.

Funding

This research was funded by the Russian Science Foundation, grant number 24-29-20051.

Institutional Review Board Statement

Not applicable.

Informed Consent Statement

Not applicable.

Data Availability Statement

The datasets analyzed in this study are not publicly available due to non-disclosure agreement.

Conflicts of Interest

The authors declare no conflicts of interest. The funders had no role in the design of the study; in the collection, analyses, or interpretation of data; in the writing of the manuscript; or in the decision to publish the results.

Abbreviations

The following abbreviations are used in this manuscript:
EMCElectromagnetic compatibility
PQPower quality
PQIPower quality indices
RMSRoot mean square
THDTotal harmonic distortion
TVRThyristor voltage regulator

Appendix A

Table A1. Technical characteristics of the Metrel MI 2892 PQ analyzer.
FunctionMeasurement RangeResolutionMeasurement Error
Voltage measurement50…1000 V (L-N);
50…1730 V (L-L)
10 mV in range of 50…1000 V (L-N);
100 mV in the range of 50…1730 V (L-L)
±0.1%
Current measurementMaximum up to 12 kA (depending on clamps used)Depends on clamps usedDepends on clamps used
Frequency measurement42.5…57.5 Hz (when fnom = 50 Hz);
51…69 Hz (when fnom = 60 Hz);
335…465 Hz (when fnom = 400 Hz)
1 mHz;
10 mHz in range of 335…465 Hz (when fnom = 400 Hz)
±10 mHz;
±100 mHz in range of 335…465 Hz (when fnom = 400 Hz)
Measurement of zero and negative phase sequence components0.0…17.0%0.10%±1%
Measurement of voltage sag or voltage swell magnitude10…150% Unom10 mV±0.2% Unom
Measurement of residual voltage during interruption0…10% Unom10 mV±0.2% Unom
Measurement of power and power factorClass 1 according to [34]
Energy measurementClass 1 according to [35]
Measurement of harmonics (up to 50 order)0…20% UnomClass 1 according to [36]
Measurement of voltage interharmonics0…20% UnomClass 1 according to [36]
Display4.3 in, color TFT (480 × 272)
Data transferUSB, RS232, Ethernet
General characteristics
Supply220 V/50 Hz or 6 AA batteries
Overvoltage classCAT IV/600 V, CAT III/1000 V
Measurements230 × 140 × 80 mm
Mass1.1 kg
Table A2. Technical characteristics of the Resurs-UF2M recorder.
Parameter MeasuredMeasurement RangeLimits of Permissible Errors:
Absolute Error Δ;
Relative Error δ, %;
Reference Error γ, %
Note
RMS voltage U, VFrom 0.01Unom±0.1 (γ)γ relative to Unom
Unom = 57,735/100 V
Frequency f, Hz42.5…57.5±0.01 (Δ)
Negative phase sequence component of the supply voltage K2U, %0…20±0.15 (Δ)
Zero phase sequence component of the supply voltage K0U, %0…20±0.15 (Δ)
Voltage THD KU, %0.5…30±0.05 (Δ)
±5 (δ)
KU < Unom/U(1)
KU ≥ Unom/U(1)
Individual voltage harmonic coefficient KU(n), %0.1…30±0.05 (Δ)
±5 (δ)
KU(n) < Unom/U(1)
KU(n) ≥ Unom/U(1)
Voltage sag duration Δts, s0.01…60±0.02 (Δ)
Voltage sag depth δUsw, %10…100±0.2 (Δ)
Voltage swell duration Δtsw, s0.01…60±0.02 (Δ)
Voltage swell coefficient KswU1.1…2±0.002 (Δ)
Short-term flicker severity Pst0.2…10±5 (δ)
Phase difference ϕU−180°…180°±0.1° (Δ)0.8Unom ≤ U ≤ 1.2Unom
RMS current I, A(0.01…1.2)Inom±0.2 (δ)0.05Inom ≤ I ≤ 1.2Inom
Current THD KI, %ot 1 дo 100±0.15 (Δ)
±5 (δ)
KI < 3
KI ≥ 3
Individual current harmonic coefficient KI(n), %ot 0.2 дo 50±0.15 (Δ)
±5 (δ)
KI(n) < 3
KI(n) ≥ 3
Phase angle ϕUI±180°±0.1° (Δ)
Active power P, W±0.2 (γ)γ relative to S
Reactive power Q, var±0.5 (γ)γ relative to S
Apparent power S, VA±0.5 (δ)
Active energy WP±0.2 (δ)
Reactive energy WQ±0.5 (δ)
Time interval (clock movement), s/day±1Without time synchronization device (GPSF receiver)
Current time in the national coordinated time scale of the Russian Federation UTC (SU)±0.02 sWhen working with a time synchronization device (GPSF receiver)
General characteristics
Supply85…265 V/45…55 Hz
Measurements136 × 294 × 250 mm
Mass3 kg

References

  1. Zhezhelenko, I.V.; Sayenko, Y.L.; Gorpinich, A.V. Electromagnetic Compatibility in the Industrial Electric Power Supply Systems. In Proceedings of the 10th International Conference on Electrical Power Quality and Utilisation, Lodz, Poland, 15–17 September 2009; IEEE: Piscataway, NJ, USA, 2009. [Google Scholar] [CrossRef]
  2. Salor, Ö.; Gültekin, B.; Buhan, S.; Boyrazoǧlu, B.; Inan, T.; Atalik, T.; Açik, A.; Terciyanli, A.; Ünsar, Ö.; Altintaş, E.; et al. Electrical Power Quality of Iron and Steel Industry in Turkey. In Proceedings of the IEEE Industry Applications Society 42nd Annual Meeting, New Orleans, LA, USA, 23–27 September 2007; IEEE: Piscataway, NJ, USA, 2007; pp. 404–423. [Google Scholar] [CrossRef]
  3. Nikolaev, A.A.; Bulanov, M.V.; Antropova, L.I. Ways to Ensure Electromagnetic Compatibility of Powerful Frequency Converters in Internal Power Supply Systems of Industrial Enterprises in the Presence of Resonance Phenomena. In Proceedings of the 2019 International Conference on Industrial Engineering, Applications and Manufacturing (ICIEAM), Sochi, Russia, 25–29 March 2019; IEEE: Piscataway, NJ, USA, 2019. [Google Scholar] [CrossRef]
  4. Kuznetsov, V.; Tryputen, N.; Kuznetsova, Y. Evaluating the Effect of Electric Power Quality upon the Efficiency of Electric Power & Consumption. In Proceedings of the IEEE 2nd Ukraine Conference on Electrical and Computer Engineering (UKRCON), Lviv, Ukraine, 2–6 July 2019; IEEE: Piscataway, NJ, USA, 2019; pp. 556–561. [Google Scholar] [CrossRef]
  5. Dheepanchakkravarthy, A.; Selvan, M.P.; Moorthi, S. Alleviation of Power Quality Issues Caused by Electric Arc Furnace Load in Power Distribution System Using 3-Phase Four-Leg DSTATCOM. J. Inst. Eng. Ser. B 2019, 100, 9–22. [Google Scholar] [CrossRef]
  6. Sreewirote, B.; Ngaopitakkul, A. Power Quality Analysis on Arc Furnace Capacitor Bank System in Thailand. IOP Conf. Ser. Earth Environ. Sci. 2020, 541, 012010. [Google Scholar] [CrossRef]
  7. Martinez, R.; Castro, P.; Arroyo, A.; Manana, M.; Galan, N.; Moreno, F.S.; Bustamante, S.; Laso, A. Techniques to Locate the Origin of Power Quality Disturbances in a Power System: A Review. Sustainability 2022, 14, 7428. [Google Scholar] [CrossRef]
  8. Sukanth, T.; Jayanthu, S.; Jayalaxmi, A. Mitigation of Power Quality Problem in Underground Mine Using Different Control Strategies. In Proceedings of the IEEE Region 10 Humanitarian Technology Conference (R10-HTC), Agra, India, 21–23 December 2016; IEEE: Piscataway, NJ, USA, 2016. [Google Scholar] [CrossRef]
  9. Yaghoobi, J.; Abdullah, A.; Kumar, D.; Zare, F.; Soltani, H. Power Quality Issues of Distorted and Weak Distribution Networks in Mining Industry: A Review. IEEE Access 2019, 7, 162500–162518. [Google Scholar] [CrossRef]
  10. Nepsha, F.; Belyaevsky, R.; Efremenko, V.; Varnavskiy, K. Modern Problems of Increasing Coal Mines Power Supply Efficiency. In Proceedings of the IVth International Innovative Mining Symposium, Kemerovo, Russia, 15–16 October 2019; p. 03026. [Google Scholar] [CrossRef]
  11. Pichuev, A.; Schevyrev, Y.; Zaugolnikova, E. Ensuring Quality of Electricity in Gold Mines and Mills. In Proceedings of the 2020 International Conference on Industrial Engineering, Applications and Manufacturing (ICIEAM), Sochi, Russia, 18–22 May 2020; IEEE: Piscataway, NJ, USA, 2020. [Google Scholar] [CrossRef]
  12. Bebikhov, Y.V.; Egorov, A.N.; Semenov, A.S. How Higher Harmonics Affect the Electrical Facilities in Mining Power Systems. In Proceedings of the 2020 International Conference on Industrial Engineering, Applications and Manufacturing (ICIEAM), Sochi, Russia, 18–22 May 2020; IEEE: Piscataway, NJ, USA, 2020. [Google Scholar] [CrossRef]
  13. Do, N.Y.; Ngo, X.C.; Nguyen, T.H. Effect of Power Quality on the Performance of Explosion-Proof Transformers in Mining in Vietnam. J. Polish Miner. Eng. Soc. 2023, 2, 65–69. [Google Scholar] [CrossRef]
  14. Sychev, Y.A.; Zimin, R.Y. Improving the Quality of Electricity in the Power Supply Systems of the Mineral Resource Complex with Hybrid Filter-Compensating Devices. J. Min. Inst. 2021, 247, 132–140. [Google Scholar] [CrossRef]
  15. Plashchansky, L.A.; Reshetnyak, S.N.; Reshetnyak, M.Y. Improvement of the Electric Energy Quality in Underground Electric Networks in Highly Productive Coal Mines. Min. Sci. Technol. 2022, 7, 66–77. [Google Scholar] [CrossRef]
  16. Semenov, A.S. Analyzing Impacts of Higher Harmonics on Electricity Quality Parameters at Mining Facilities. In Proceedings of the 2024 International Conference on Industrial Engineering, Applications and Manufacturing (ICIEAM), Sochi, Russia, 20–24 May 2024; IEEE: Piscataway, NJ, USA, 2024; pp. 321–325. [Google Scholar] [CrossRef]
  17. Siostrzonek, T.; Wójcik, J.; Dutka, M.; Siostrzonek, W. Impact of Power Quality on the Efficiency of the Mining Process. Energies 2024, 17, 5675. [Google Scholar] [CrossRef]
  18. Sinchuk, O.; Filipp, Y.; Somochkyn, A.; Strzelecki, R.; Baranovska, M. Methods of Improving Power Indices of Electric Drive Active Rectifiers for Mine Hoists. In Proceedings of the 2nd International Conference on Sustainable Futures: Environmental, Technological, Social and Economic Matters (ICSF 2021), Kryvyi Rih, Ukraine, 19–21 May 2021; p. 05014. [Google Scholar] [CrossRef]
  19. Hyla, M. Higher Harmonics Filtration in the Power Supply System of Thyristor Hoisting Machine of Shaft Transport in a Mining Plant. Przegląd Elektrotechniczny 2022, 98, 43–48. [Google Scholar] [CrossRef]
  20. Siostrzonek, T. The Hoisting Machines as Source of Higher Harmonics in Underground Mines. In Power Quality and Harmonics Management in Modern Power Systems; Rawa, M., Ali, Z.M., Abdel Aleem, S.H.E., Eds.; IntechOpen: London, UK, 2024; pp. 1–25. [Google Scholar] [CrossRef]
  21. Hyla, M.; Latko, A. Advanced Static Var Generator in the Reactive Power Automatic Compensation System of an Underground Mine with a Thyristor Hoisting Machine. Energies 2024, 17, 3628. [Google Scholar] [CrossRef]
  22. GOST 32144-2013; Electric Energy. Electromagnetic Compatibility of Technical Means. Standards of Power Quality in General-Purpose Power Supply Systems. Standartinform: Moscow, Russia, 2014.
  23. GOST 33073-2014; Electric Energy. Electromagnetic Compatibility of Technical Equipment. Control and Monitoring of Power Quality in General-Purpose Power Supply Systems. Standartinform: Moscow, Russia, 2015.
  24. GOST 30804.4.30-2013 (IEC 61000-4-30:2008); Electric Energy. Electromagnetic Compatibility of Technical Equipment. Power Quality Measurement Methods. Standartinform: Moscow, Russia, 2014.
  25. EN 50160:2010; Voltage Characteristics of Electricity Supplied by Public Electricity Networks. CENELEC: Brussels, Belgium, 2010.
  26. GOST R 54149-2010; Electric Energy. Electromagnetic Compatibility of Technical Equipment. Power Quality Limits in the Public Power Supply Systems. Standartinform: Moscow, Russia, 2012.
  27. GOST IEC 61000-4-30-2017; Electromagnetic Compatibility (EMC). Part 4-30. Testing and Measurement Techniques. Power Quality Measurement Methods. Standartinform: Moscow, Russia, 2020.
  28. Ded, A.V.; Maltsev, V.N.; Sikorski, S.P. Comparative Analysis of the Specifications on the Power Quality of the European Union and the Russian Federation. IOP Conf. Ser. J. Phys. Conf. Ser. 2018, 998, 012007. [Google Scholar] [CrossRef]
  29. Koptyaev, I.V.; Konareva, A.E. Comparative Analysis of the Standartized Parameters of the Characteristics of the Countries of the EU, the USA and Russia. Mirovaya Nauka 2022, 2, 58–63. [Google Scholar]
  30. Panfilov, D.I.; Petrov, M.I.; Astashev, M.G. Application of AC Voltage Regulators for Asynchronous Motors Connection to the Power Supply. In Proceedings of the 26th International Workshop on Electric Drives: Improvement in Efficiency of Electric Drives (IWED), Moscow, Russia, 30 January–2 February 2019. [Google Scholar] [CrossRef]
  31. Sosnina, E.; Sevostyanov, A.; Kryukov, E.; Bedretdinov, R. Thyristor Voltage Regulator Experimental Research. E3S Web Conf. 2020, 209, 07020. [Google Scholar] [CrossRef]
  32. Kralin, A.A.; Bedretdinov, R.S.; Kryukov, E.V.; Pronina, O.A. Research of Thyristor Voltage Regulator Effect on Power Flows Control in Distribution Electric Networks. IOP Conf. Ser. Mater. Sci. Eng. 2020, 791, 012031. [Google Scholar] [CrossRef]
  33. Rashitov, P.A.; Astashev, M.G.; Panfilov, D.I.; Rozhkov, A.N.; Petrov, M.I. Thyristor AC Voltage Regulators to Improve the Quality of Electrical Energy in 0.4-KV Distribution Networks. Russ. Electr. Eng. 2022, 93, 458–466. [Google Scholar] [CrossRef]
  34. GOST IEC 61557-12-2015; Low-Voltage Electrical Distribution Networks with Voltages up to 1000 V AC and 1500 V DC. Electrical Safety. Equipment for Testing, Measuring, or Monitoring Protective Equipment. Part 12. Gosstandart: Minsk, Belarus, 2016.
  35. GOST 31819.21-2012; Electricity Metering Equipment (a. c). Particular Requirements. Part 21. Static Meters for Active Energy (Classes 1 and 2). Standartinform: Moscow, Russia, 2013.
  36. GOST 30804.4.7-2013; Electromagnetic Compatibility of Technical Equipment. General Guide on Harmonics and Interharmonics Measurement and Instrumentation for Power Supply Systems and Equipment Connected Thereto. Standartinform: Moscow, Russia, 2014.
Figure 1. Single-line diagram of the substation (SS-1) under study. Switched off feeders are marked in red.
Applsci 15 11355 g001
Figure 2. Diagram of Metrel MI2892 PQ analyser connection to the enterprise power system.
Applsci 15 11355 g002
Figure 3. Comparison of maximum values of individual harmonic voltages KU(n) (for 100% of measurement datasets) in percent of the fundamental voltage measured by Resurs-UF2M recorder and Metrel MI2892 PQ analyser.
Applsci 15 11355 g003
Figure 4. Voltage values recorded within 1 h: (a) values aggregated at 1 s intervals; (b) values aggregated at 10 min intervals.
Applsci 15 11355 g004
Figure 5. Current values recorded within 1 h: (a) values aggregated at 1 s intervals; (b) values aggregated at 10 min intervals.
Applsci 15 11355 g005
Figure 6. Voltage waveforms captured: U12 is marked in blue, U23 is marked in red, U31 is marked in green.
Applsci 15 11355 g006
Figure 7. Current waveforms captured: I1 is marked in blue, I2 is marked in red, I3 is marked in green.
Applsci 15 11355 g007
Figure 8. Oscillogram of I1 current: the thickest curve shows the aggregated values included in the final report, the curve above represents the maximum values recorded, the one below corresponds to the minimum values.
Applsci 15 11355 g008
Figure 9. Short-term flicker severity (Pst) values recorded. Red line is short-term flicker severity threshold.
Applsci 15 11355 g009
Figure 10. Long-term flicker severity (Plt) values recorded: Plt12 is marked in blue, Plt23 is marked in red, Plt31 is marked in green. Red line is long-term flicker severity threshold.
Applsci 15 11355 g010
Figure 11. Histogram of PQI exceeding the permissible limits: (a) values based on data aggregated at 1 s intervals; (b) values based on data aggregated at 10 min intervals. The PQI permissible level is shown as red line.
Applsci 15 11355 g011
Figure 12. Variation in U12 voltage over a 12 h period. Red line is the voltage over-deviation threshold.
Applsci 15 11355 g012
Figure 13. Hoist electrical parameters recorded. Sampling: 5 min.
Applsci 15 11355 g013
Figure 14. Oscillogram of the current measured on bus 4 with 1 s aggregation interval.
Applsci 15 11355 g014
Table 1. PQI measurement methods applied (for a 50 Hz system).
PQIInstrument
Resurs-UF2MMetrel MI2892
Basic IntervalAggregation IntervalBasic IntervalAggregation Interval
Frequency variations200 ms20 s10 sNot applicable
Voltage variations200 ms1 min200 ms10 min
Negative and zero phase sequence components of the supply voltage200 ms3 s200 ms10 min
Total harmonic distortion (THD)200 ms3 s200 ms10 min
Individual harmonic
voltages (for orders up to 40)
200 ms3 s200 ms10 min
Short-term flicker severity10 minNot applicable10 minNot applicable
Long-term flicker severity10 min2 h10 min 2 h
Table 2. The PQI permissible levels according to GOST 32144-2013 [22].
PQIPermissible Level
For 95% of Measurement DatasetFor 100% of Measurement Dataset
Frequency variations±0.2 Hz 1
±1.0 Hz 2
±0.4 Hz 1
±5.0 Hz 2
Voltage variations10%
Short-term flicker severity1.38 pu
Long-term flicker severity1.00 pu
Individual harmonic voltages (for orders up to 40)Table 3Table 3
Total harmonic distortion (THD)5% 38% 3
Negative phase sequence component of the supply voltage2%4%
Zero phase sequence component of the supply voltage2%4%
1 For systems with synchronous connection to an interconnected system. 2 For systems with no synchronous connection to an interconnected system. 3 For 6–25 kV power systems.
Table 3. The permissible levels of individual harmonic voltages in 6–25 kV power systems for 95% (KU(n)(95%)) and for 100% (KU(n)(100%)) of measurement dataset according to GOST 32144-2013 [22].
Harmonic Order (n)KU(n)(95%), %KU(n)(100%), %Harmonic Order (n)KU(n)(95%), %KU(n)(100%), %
21.502.25220.200.30
33.004.50231.001.50
40.701.05240.200.30
54.006.00251.001.50
60.300.45260.200.30
73.004.50270.200.30
80.300.45280.200.30
91.001.50291.001.50
100.300.45300.200.30
112.003.00311.001.50
120.200.30320.200.30
132.003.00330.200.30
140.200.30340.200.30
150.300.45351.001.50
160.200.30360.200.30
171.502.25371.001.50
180.200.30380.200.30
191.001.50390.200.30
200.200.30400.200.30
210.200.30
Disclaimer/Publisher’s Note: The statements, opinions and data contained in all publications are solely those of the individual author(s) and contributor(s) and not of MDPI and/or the editor(s). MDPI and/or the editor(s) disclaim responsibility for any injury to people or property resulting from any ideas, methods, instructions or products referred to in the content.