Article

Application of Vertical Seismic Profiling to Improve Seismic Interpretation of the Rotliegend Formation in Western Poland

Oil and Gas Institute—National Research Institute, 25A Lubicz Str., 31-503 Cracow, Poland
*
Author to whom correspondence should be addressed.
Appl. Sci. 2025, 15(21), 11339; https://doi.org/10.3390/app152111339
Submission received: 12 September 2025 / Revised: 18 October 2025 / Accepted: 20 October 2025 / Published: 22 October 2025

Abstract

Exploration for hydrocarbon reservoirs is currently focused on increasingly difficult targets and geological structures, thus stimulating a growing requirement for new measurement methods and techniques that can provide more detailed information about lithology and reservoir parameter distribution in the vicinity of the target zone. This publication presents a method for increasing the resolution of the recorded surface seismic wavefield in the vicinity of example borehole Well-1 (western Poland) for reservoir horizons of the Rotliegend and Zechstein formations. The main stage of the research was the introduction of frequencies from vertical seismic profiling (VSP) into seismic traces. The shape filter deconvolution procedure was applied based on the operator calculated from VSP data, which was applied to seismic profiles extracted from 3D data. The procedure applied allowed for the reconstruction of higher-frequency spectrum necessary for a detailed imaging of the geological framework of the analyzed reservoir formations. In the next stage, seismic inversion calculations were conducted, both on VSP data (corridor stack and VSP-CDP transformation) and on surface seismic time sections. The results obtained as an acoustic impedance distribution enabled a more comprehensive structural interpretation and detailed analysis of the variability of reservoir properties in the analyzed well area.

1. Introduction

The origins of the reflection seismic method date back to the 1920s [1,2,3]. Initial two-dimensional (2D) seismic surveys provided primarily structural information about geological formations but progressively evolved into an effective method for imaging and interpreting subsurface geological frameworks. Significant advancements in seismic reflection methodology continued throughout the 1980s [4,5,6], during which three-dimensional (3D) seismic technology was introduced, enabling spatial and more detailed structural and lithological imaging of rock formations.
In the early 1950s, the borehole seismic method—vertical seismic profiling (VSP)—was developed, based on recording seismic wavefields generated at the surface and detected within boreholes [7]. E.I. Galperin is recognized as a pioneer of the VSP method. The application of this technique in the former Soviet Union during the 1960s for hydrocarbon exploration and field evaluation significantly advanced its development. Unlike 2D and 3D surface seismic methods, where surface receivers record only upgoing wave events, the VSP method (utilizing sensors positioned along the well profile) enables in situ recording of both downgoing and upgoing wave events, capturing both primary and multiple seismic reflections [8,9]. This VSP wavefield recording approach substantially reduces the distance between reflecting horizons and receivers compared to conventional surface seismic methods. Consequently, the resulting seismic records are less ambiguous, and phenomena such as waveform distortions in the Fresnel zone, absorption, and spherical divergence effects—which are crucial in reconstructing true amplitudes—are minimized [7,9,10].
Vertical seismic profiling is a useful measuring technique that enables the generation of information about rock properties (such as velocity, impedance, attenuation, anisotropy) at depth, providing detailed seismic imaging of geological structures. These measurements provide insight into seismic wave propagation as well as greatly support the processing and interpretation phases of surface seismic data, based on phase and AVO analysis [11,12].
Several authors emphasize the insufficient utilization of well seismic data (VSP) in geological interpretation in comparison to the information potential offered by recorded VSP data [8,13,14]. However, from the numerous publications discussing the possibilities of applying zero-offset and offset VSP measurements, special focus should be placed on works discussing such issues as precise, trend-directed recognition of physical and petrophysical parameters (considering anisotropy) in the near-well zone and adjacent areas; the possibility of constructing detailed models of interval velocities; verification of geological and facies interpretations; and elimination of artifacts on seismic and geological sections [15,16,17,18,19]. A further important issue is the crucial role of high frequencies in the surface seismic trace spectrum for obtaining high-resolution seismic imaging. These frequencies are significantly absorbed during the propagation of the elastic wave in geological media [20].
This article presents the application of vertical seismic profiling to increase the precision of geological interpretation in the near-well zone, as well as to improve the resolution of selected seismic profiles with the shape filter deconvolution procedure, based on the example of Rotliegend formations underlying the Zechstein complex in the western part of Poland. One important issue in this area is the poor seismic imaging below the Zechstein base due to strong acoustic impedance and velocity contrasts with surrounding strata, which makes it difficult to identify seismic reflections corresponding to underlying formations, e.g., refs. [21,22,23]. The absorption of seismic wave energy by thicker Zechstein evaporite deposits lying above in the geological profile causes the Rotliegend and Lower Carboniferous formations to be characterized by low amplitude values and poor seismic evidence.
Implementation of additional information contained in the VSP wavefield during seismic data processing effectively enables the reconstruction of lost high-frequency bandwidth. In some cases, this may be necessary for a thorough description and reconstruction of the geological framework of the analyzed lithostratigraphic formations [24,25,26]. The implementation of additional information included in the VSP wavefield into surface seismic data enabled the reconstruction of higher frequencies necessary for more detailed reconstruction of the geological structure. The seismic inversion method is a key tool for reliably characterizing the physical properties of rock formations. The results obtained in the form of acoustic impedance, calculated on selected seismic sections and VSP processing sections, supplied additional information about the distribution and diversity of petrophysical parameters, as well as enabled the analysis of facial, lithological, and reservoir changes in the Rotliegend and Zechstein formations.

2. Geological Background

The research area is located in western Poland (Figure 1A), within the Lower Permian depression known as the Poznań Trough, which is situated on the northern side of the Wolsztyn Uplift (Figure 1B). A major part of the Rotliegend and Zechstein Basins developed in the overburden of the Variscan orogenic zone (Figure 1B), together with its foreland [27,28,29].
The oldest basement unit is formed by the East European Precambrian Craton (often referred to as Baltica), extending into the eastern part of Poland [31,32,33,34,35]. The Caledonian and Variscan fold-and-thrust belts (Figure 1B), adjacent to the southwest of the Craton, form the so-called West European Paleozoic Platform [36,37,38].
The oldest strata identified in wells in the study area are Carboniferous siliciclastic sediments [39,40,41], showing significant tectonic engagement and represented by gray sandstones and brown-red claystones and mudstones. Lower Permian formations of the Rotliegend occur higher up in the profile and can be divided into two complexes. The lower complex includes a series of volcanic rocks (mainly lava, ignimbrites, and tuffs) together with conglomerates of alluvial fans and fine-grained sediments [42,43]. The upper complex is represented by sediments of different depositional environments, such as clastic playa sediments, lithologically diverse series of alluvial and fluvial sediments, and aeolian sandstones [30,43,44,45,46] (Figure 1C). The profiles of wells located in the research area and its vicinity are dominated by formations classified within the eolian complex, located within the so-called Eastern Erg [44,45] (Figure 1C). The thickness of Rotliegend formations recorded in wells from the study area and its vicinity ranges from 450 to over 700 m.
The next complex in the profile of the analyzed region is composed of Upper Permian (Zechstein) formations. Fundamental feature of Zechstein lithostratigraphy in the European Sedimentary Basin is the cyclicity of evaporite sedimentation [47,48,49,50,51,52]. All four main cyclothems distinguished according to the Richter-Bernburg classification scheme [53] (i.e., PZ1, PZ2, PZ3, and PZ4) are present in the research area. Older sedimentation cycles (PZ1 to PZ3) are carbonate–evaporite in character, while the youngest cycle is rather clastic–evaporite. Changes in the thickness and lithological composition of sediments in each cycle are closely related to the ratio of accumulation rate to subsidence [47]. The four evaporite cyclothems mentioned above are composed of clastic, carbonate, and sulfate formations, as well as rock salt and potassium–magnesium salts. The thickness of the Zechstein formations in the discussed area ranges from 480 to approx. 900 m.
The Triassic profile is dominated by clastic sediments, mostly fine-grained, with carbonate rocks (limestones, dolomites, and marls) appearing only in the middle part of the profile, and locally with thin interbeds of evaporite rocks [54]. The Lower Jurassic deposits in their typical development consist mainly of a series of fine- and medium-grained sandstones with intercalations of mudstones and claystones [55]. The Middle Jurassic complex is also dominated by fine-grained sediments, mainly mudstones and claystones, while the Upper Jurassic profile contains carbonate rocks, mostly limestones and marls, with mudstone intercalations in its lowermost part. The Cretaceous deposits are absent in the study area. The total thickness of the Mesozoic deposits ranges from approx. 2500 to 2800 m. The geological profile in the study area ends with Cenozoic deposits, represented mainly by fine clastic sediments with sand and brown-coal intercalations up to 170 m thick.
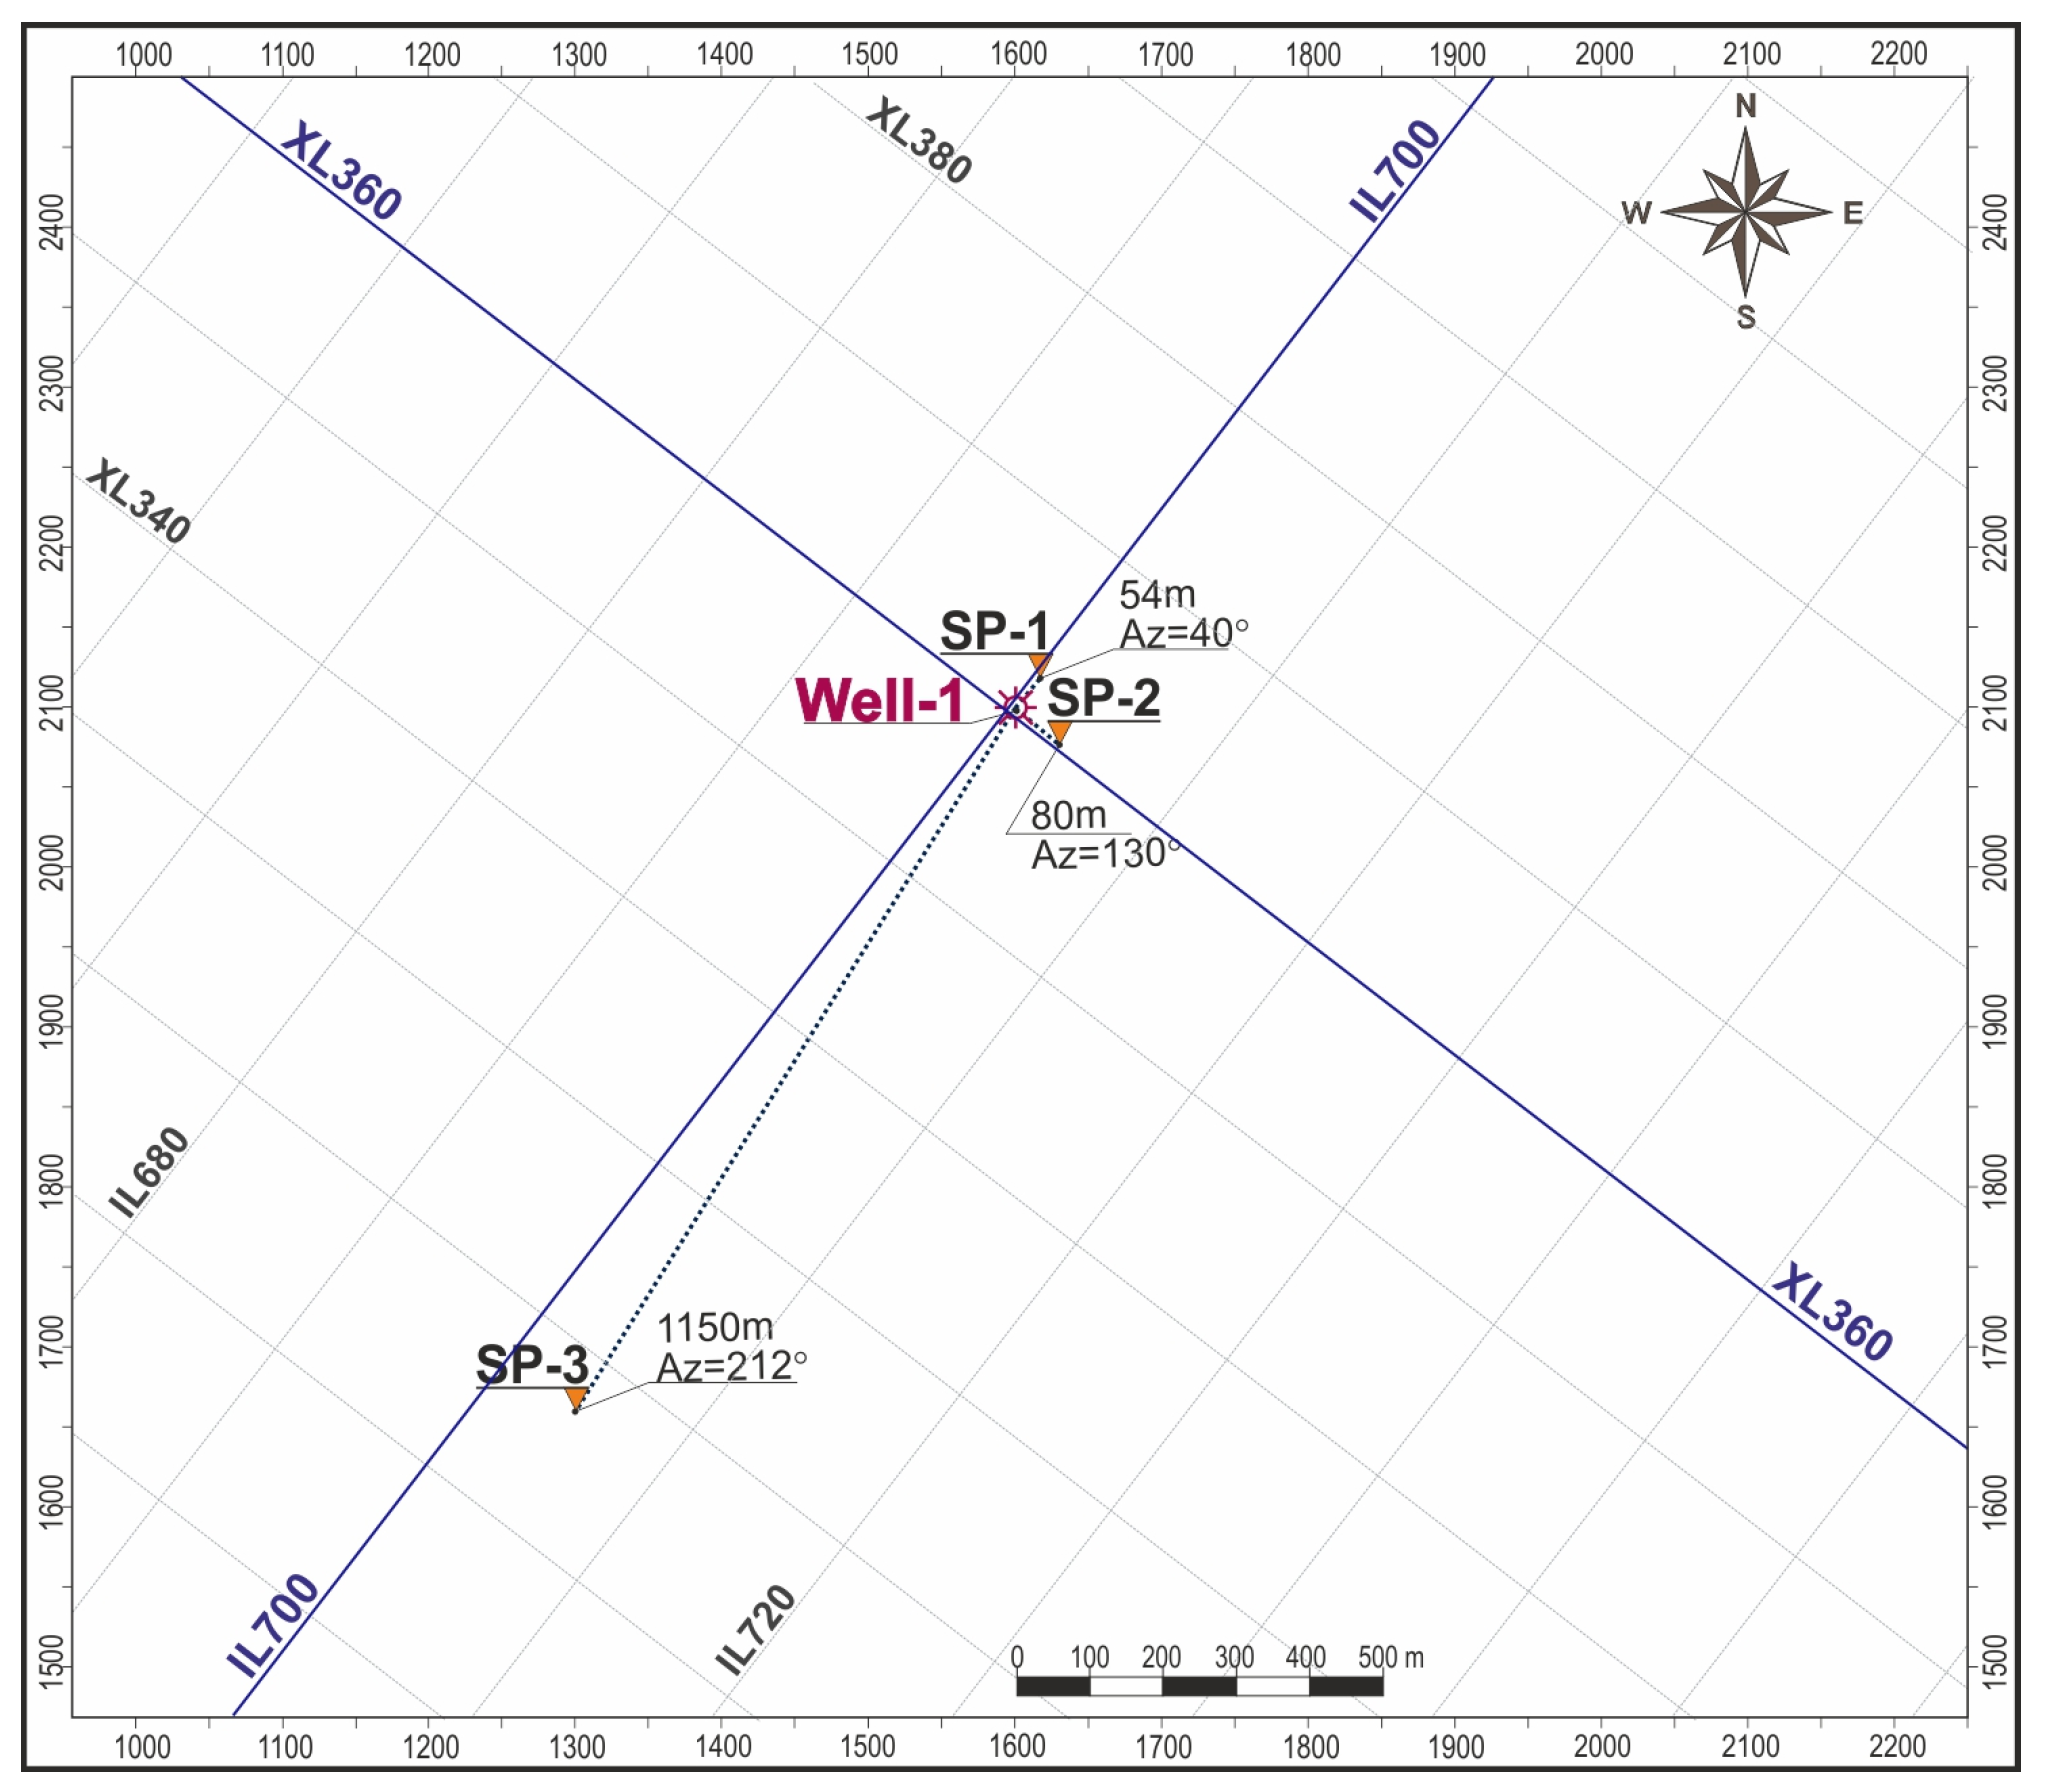
The Rotliegend and Main Dolomite Formations are considered to be the most prospective for hydrocarbon exploration in the Polish part of the Permian Basin [46,56,57,58]. Drilling of the well discussed in this article (alternatively named Well-1) (Figure 2) was completed in Lower Permian (Rotliegend) deposits, at a depth of 3701 m. Analysis of drill cores indicates that the top series of Rotliegend formations in the study area is represented by an eolian facies, and this is compatible with the assumptions and previous facies interpretations for this region, e.g., [27]. Within this series, fine- and medium-grained dune sandstones with cross-bedding as well as medium-grained inter-dune sandstones with horizontal and low-angle cross-bedding were found. These deposits are characterized by very good reservoir properties, with porosity ranging from several percent to approx. 25% and permeability from several dozen to over 100 mD. These properties are probably the result of the good preservation of the original pore space configuration and minor changes caused by diagenetic processes [30,46,59,60,61]. The carbonate series of the Main Dolomite member (Ca2) of the PZ2 cyclothem in Well-1 is mainly represented by micritic dolomites, locally with macrofauna remains, which in some parts of the profile have the character of carbonate mud flows or granular flows. These dolomites are generally characterized by parallel lamination and, less frequently, by wavy lamination. The reservoir properties of this member are generally poor, as the porosity is several percent and the permeability does not exceed 1 mD.

3. Materials and Methods

3.1. Seismic Data

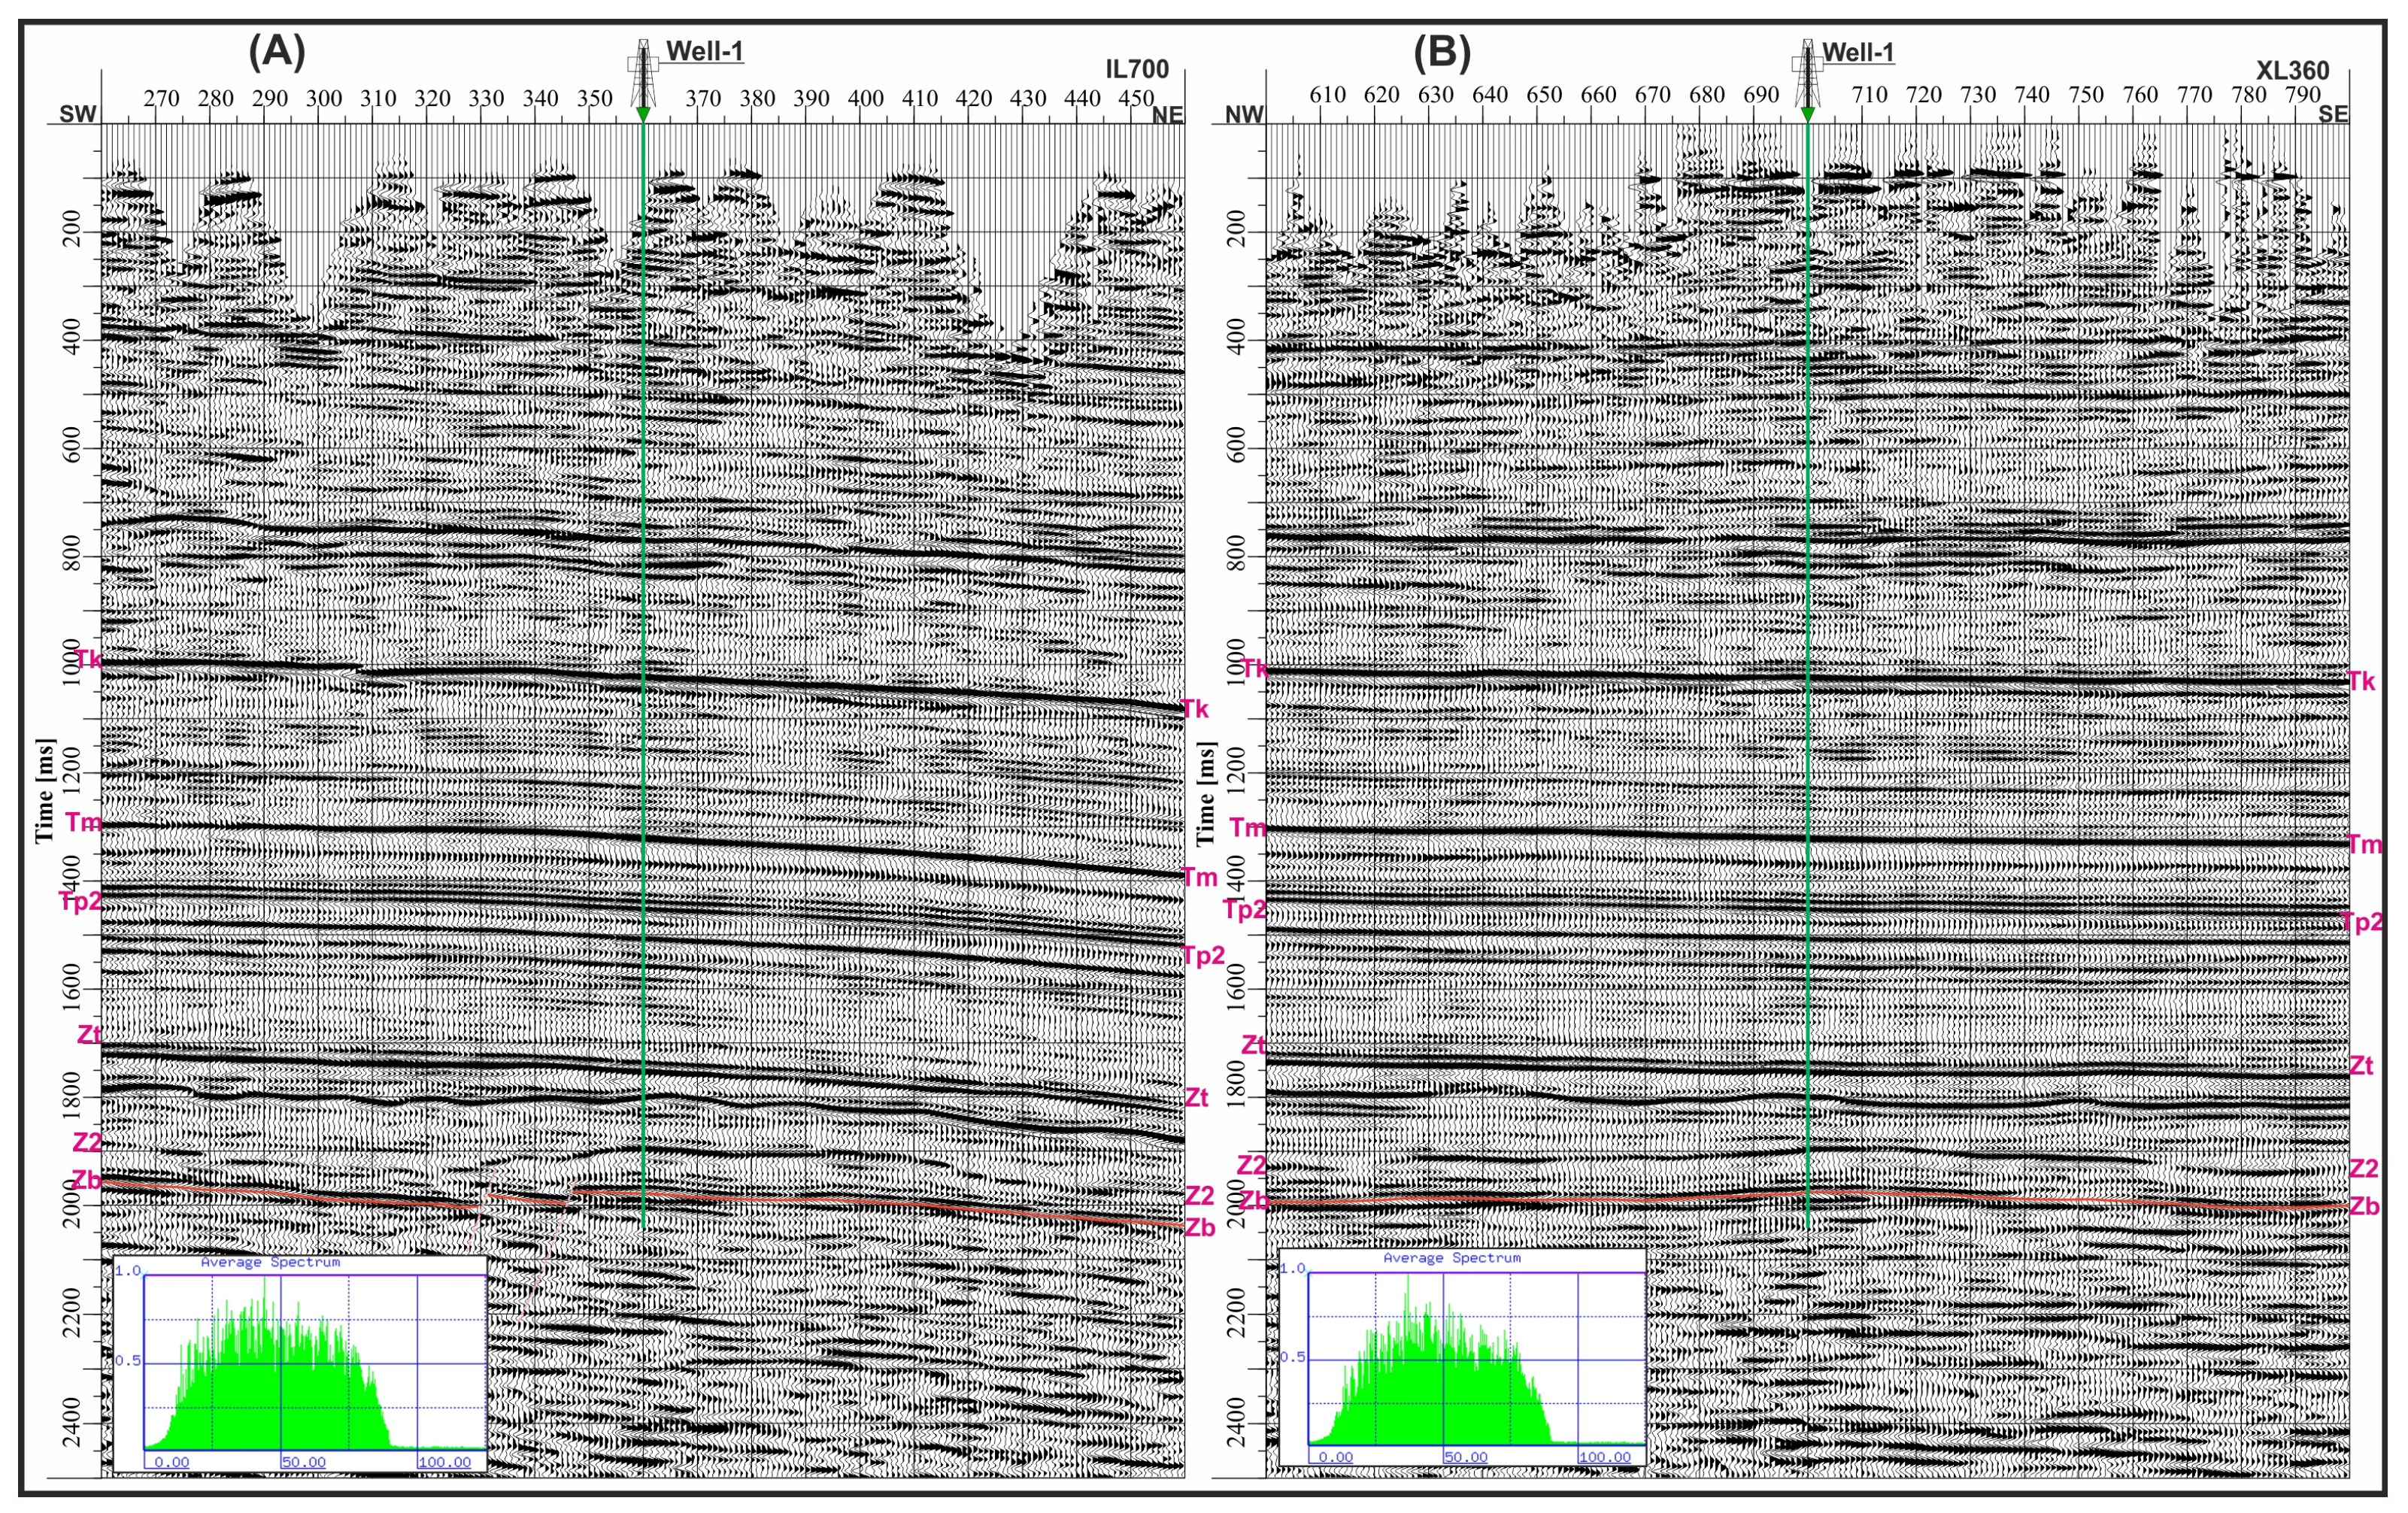
The research was conducted using 3D seismic volume in the depth migration version. Two cross-sections (IL700 and XL360—Figure 3) traversing the Well-1 were selected for detailed analysis. The acquisition and processing of 3D seismic data was performed by Geofizyka Toruń SA (Poland).
The seismic horizons were marked with symbols on the seismic sections (Figure 3); they were defined based on geological data from deep wells located within the research area and VSP cross-plots integrating well and seismic data:
  • Tk—top of the gypsum–anhydrite level within the Keuper profile: positive amplitude,
  • Tm—top of the high-velocity Muschelkalk carbonate level: positive amplitude,
  • Tp2—contact between the Roethian anhydrite level and the Middle Buntsandstein claystone layer: negative amplitude,
  • Zt—top of the Youngest Halite (Na4) corresponding to the top of Zechstein cyclothems sedimentation: negative amplitude,
  • Z2—top of the Basal Anhydrite (A2): positive amplitude,
  • Zb—base of the Zechstein: negative amplitude.
The waveforms of selected seismic sections (Figure 3), extracted from the 3D surface seismic, are characterized by a regular elementary signal shape and a wide amplitude spectrum range, resulting in good resolution and reflections dynamics. In the Zechstein formations, the seismic reflection pattern is continuous and flat-parallel, whereas below the Zechstein base (Zb seismic horizon), a decrease in continuity and resolution of the seismic image can be observed.

3.2. VSP Data

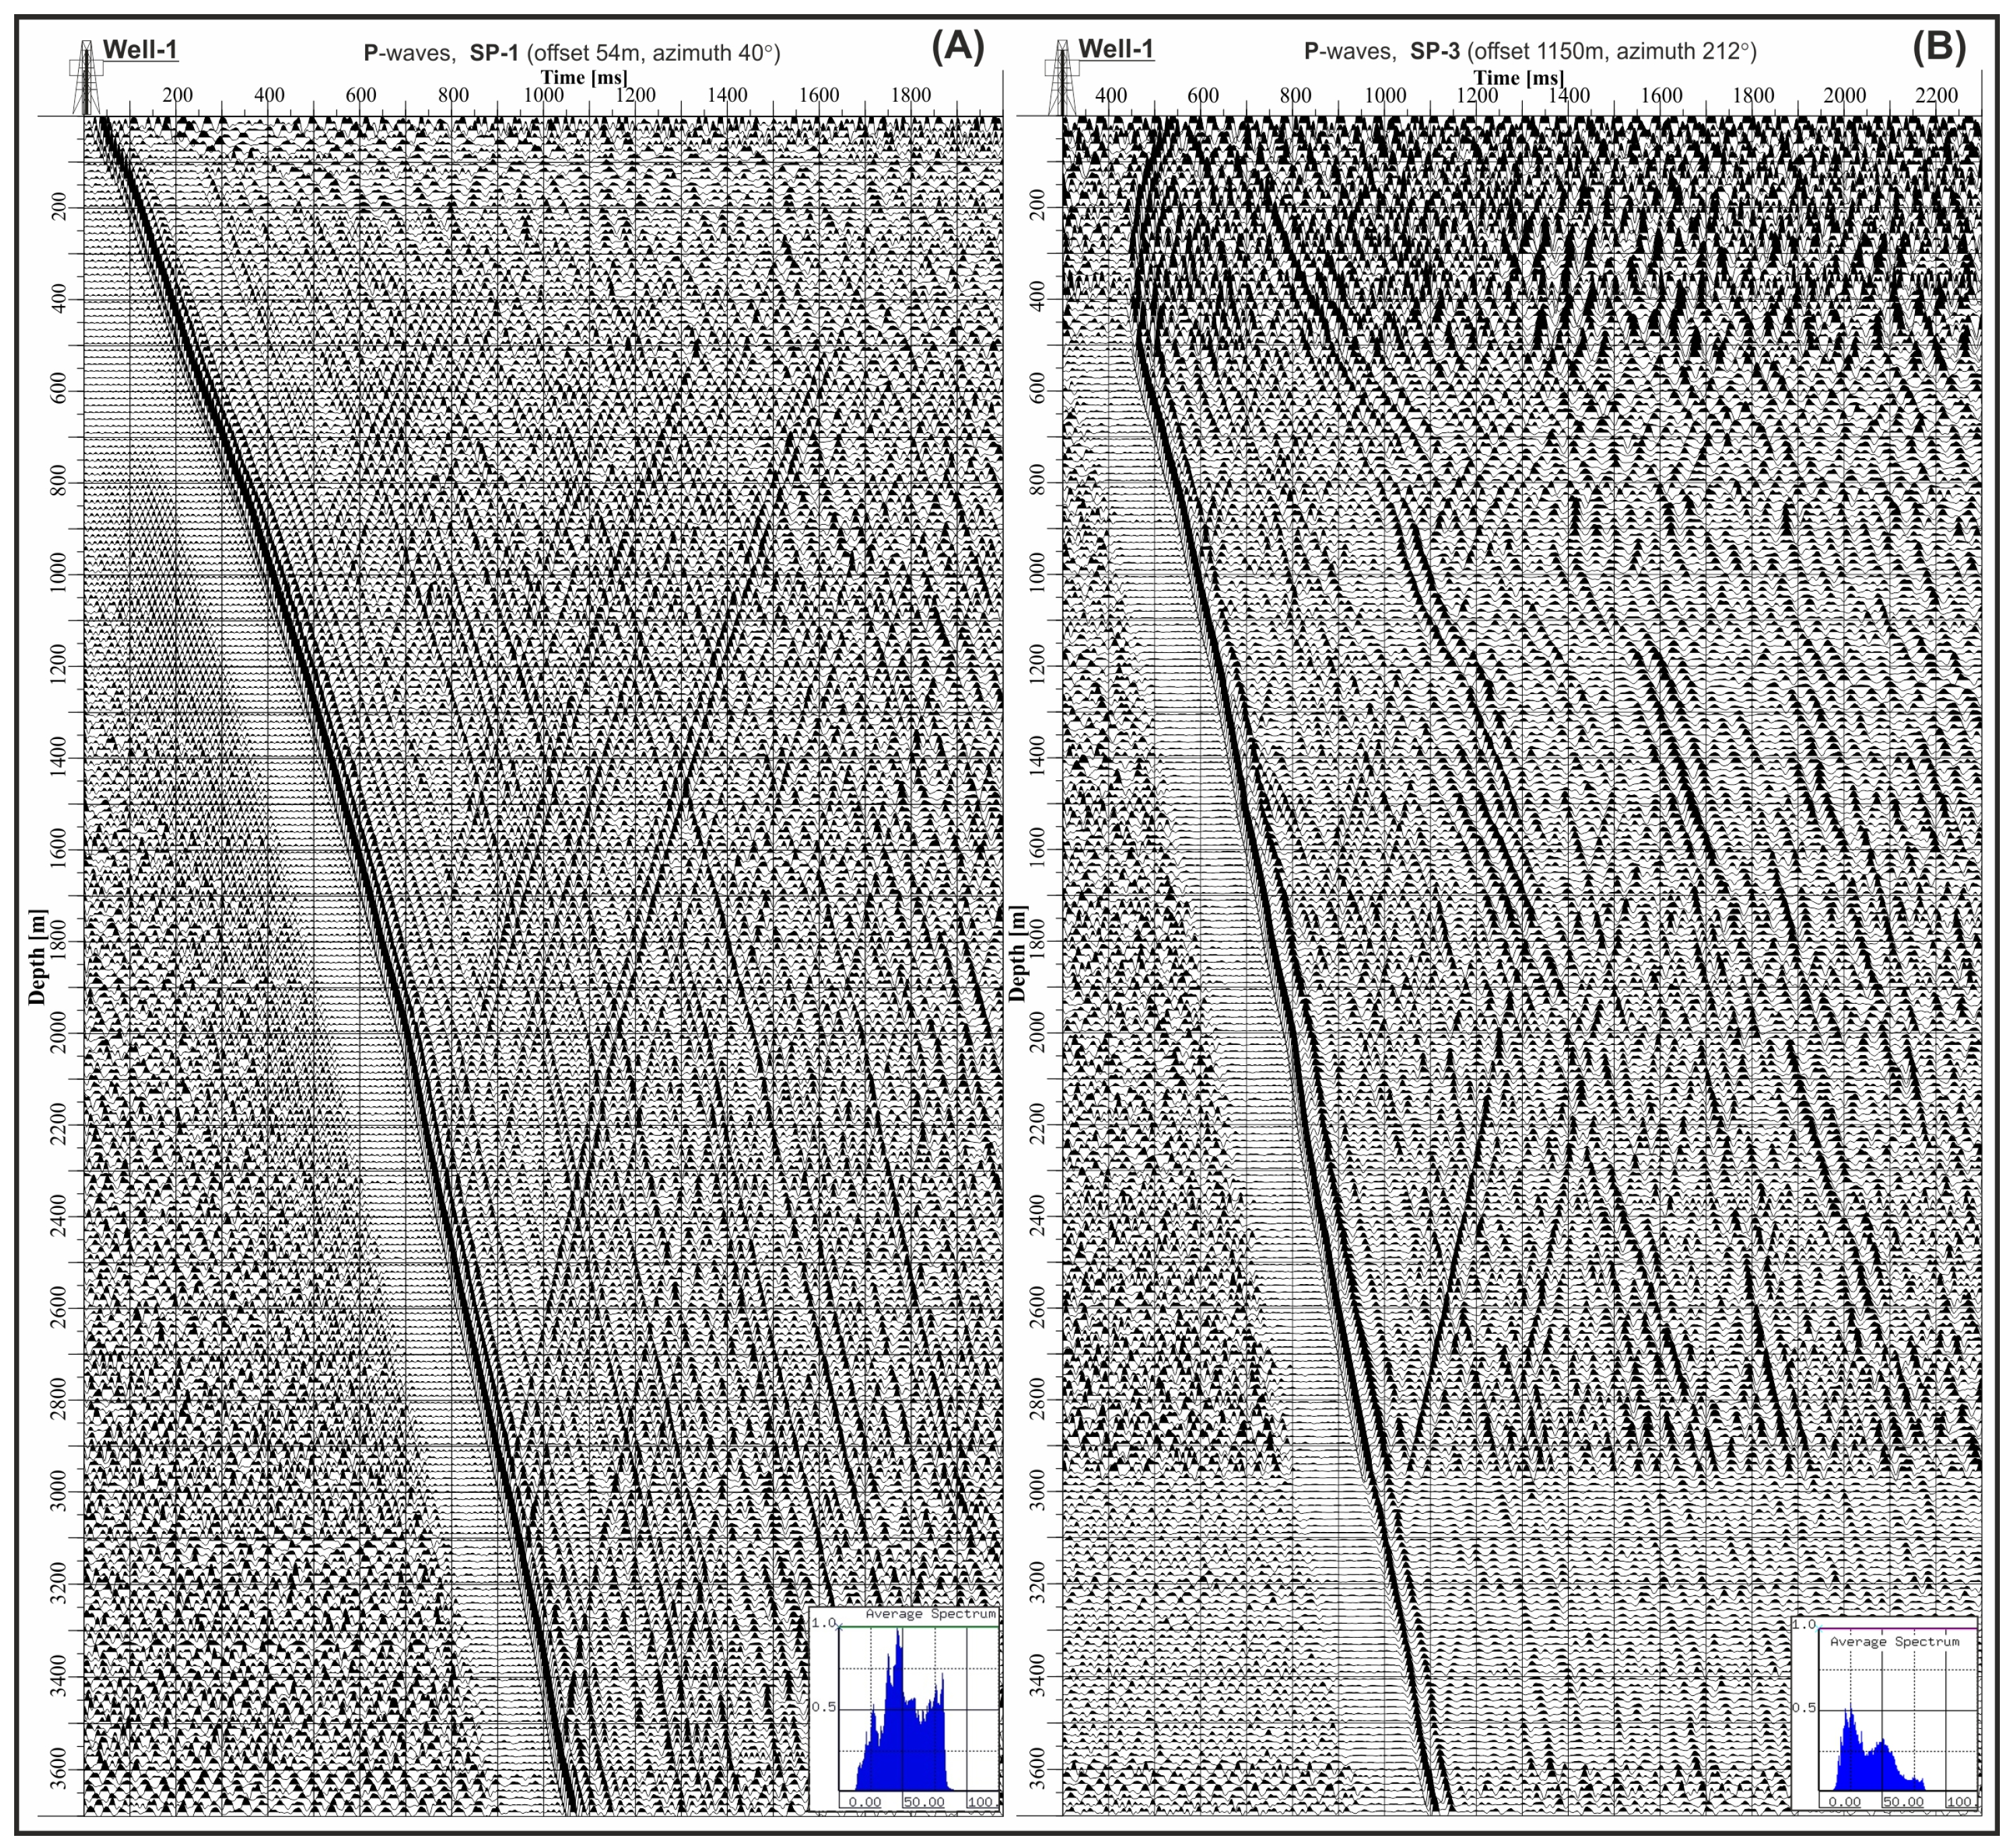
VSP measurements in Well-1 were conducted using a vibratory source with a sweep frequency range of 12–84 Hz and a receiver displacement step in the well of 15 m. The acquisition and preprocessing of VSP survey data were provided by Geofizyka Toruń but the standard processing was performed at the Oil and Gas Institute–National Research Institute using the Univers system by Geovers Ltd., Moscow, Russia. VSP data processing was performed for three shot points (SP)—two zero-offset points (SP1—offset 54 m, azimuth 40°; SP2—offset 80 m, azimuth 130°) and one offset point SP3 (offset 1150 m, azimuth 212°) (Figure 4). The recorded VSP waveforms are characterized by high quality. The upper spectral range for each shot point (SP) reaches approx. 85 Hz. The SP wavefield analysis (Figure 4) indicates that the best signal-to-noise ratio (S/N) occurs in the 40 Hz range. Downgoing and upgoing waves are clearly detected on the SP-1 and SP-3 wavefields, and converted waves are also detected on the SP-3 wavefield. On these amplitude spectra, a high-frequency cutoff at 85 Hz can be observed, which is most evident on the SP-1 wavefield, which is probably related to the application of a limited upper sweep range during acquisition of VSP.
As a result of zero-offset VSP processing, a field of upgoing waves and a corridor stack are obtained, providing information about the physical properties of the near-well zone as well as allowing the correlation of surface seismic in the time domain with well logs in the depth domain, usually presented in the form of composite plots [62,63,64,65,66]. The frequency range contained in the corridor stack is a source of useful in situ information that can be applied to the deconvolution procedure used on the selected seismic sections. Due to its measurement methodology, the VSP method provides higher and more accurate seismic resolution than surface seismic. This higher resolution is manifested in the form of an expanded frequency spectrum of the wavefield. Higher frequencies, which experience stronger attenuation during wave propagation through the geological medium in surface seismic acquisition, can be supplemented with frequencies recorded using the VSP method [12,22,67].
The determination of appropriate azimuths for offset shot points is very important during planning of VSP 3C measurements, considering the main directions of structural, lithological, or facial changes in interesting geological formations. The image obtained based on VSP measurements is generally characterized by considerably higher resolution than the image obtained as a result of surface seismic data processing. With increasing distance between the shot point and the well, the range of reliable tracking of changes within formations of interest also increases. The recorded wavefield, after preprocessing, elimination of interfering waves, extracting upgoing waves, and deconvolution, is transformed into a surface seismic pattern (distance—time 2T).

3.3. Shape Filter Deconvolution Method

The critical factor responsible for resolution is the length of the observed seismic wave. The length of the wave λ is defined by two parameters: propagation velocity V [m/s] and frequency f (1/T) [Hz] (λ = VT, λ = V/f, T—dominant vibration period). The frequency of the propagating wave depends significantly on the acquisition parameters, while the propagation velocity is a physical parameter of the geological medium [23]. Seismic velocity increases with depth; thus, deeper rock formations are usually older and more diagenized. The dominant frequency of the seismic signal decreases with depth because higher frequencies are absorbed with greater intensity. The length of a wave increases with depth because the velocity (V) increases and the frequency (f) decreases. As a result of the influence of phenomena accompanying the propagation of elastic waves, such as absorption, attenuation, and radial divergence, we obtain a wavefield usually in the frequency range of 15–75 Hz. The reconstruction of high frequencies in the seismic trace spectrum is crucial because this part of the spectrum is more absorbed during the propagation of elastic waves [20]. The implementation of additional information contained in the VSP wavefield into surface seismic data allows for the reconstruction of high frequencies, which are essential for describing the geological structure in detail [21,67]. The spectrum of higher-frequency extension on seismic sections depends on the VSP amplitude spectrum range used, which is determined by the sweep length used during the VSP acquisition as well as the advancement of VSP data processing procedures.
Following the determination of the optimal amplitude spectrum range and the application of the convolution procedure, a wavefield enhanced with the frequency spectrum from the VSP data is generated on the seismic sections. This procedure results in a seismic record that is formed by the frequency spectrum of the calculated operators. The final seismic section after applying this procedure should have a zero-phase wavefield with an extended amplitude spectrum.
The shape filter deconvolution procedure implemented in the Univers system can be described in the time and frequency domains as follows:
  • in time domain:
Φ C C f = Φ C V
f = Φ C V Φ C C
  • in frequency domain:
( ( C ( ω ) C * ( ω ) ) f = C ( ω ) V * ( ω ) )
f = V * ( ω ) C * ( ω )
where
f—deconvolution operator,
C(ω)—seismic trace spectrum,
C(ω)—instantaneous seismic trace spectrum,
V(ω)—instantaneous VSP primary reflection trace spectrum,
ΦCC—autocorrelation of seismic trace,
ΦCV—cross-correlation of seismic trace with VSP primary reflection trace.
The deconvolution operator is extracted from the VSP primary reflection trace (corridor stack). The operator extraction interval is determined based on an analysis of the signal shape of the seismic record from the corridor stack and the seismic section, their frequency range, and the interval of occurrence of the geological formations that are the target of detailed interpretation. The deconvolution operator length is analyzed and optimally selected based on the correlation match between the corridor stack and the resulting wavefield after deconvolution. Given our wide experience in calculating deconvolution operators, we can conclude that the adopted operator length of 120 ms is optimal.
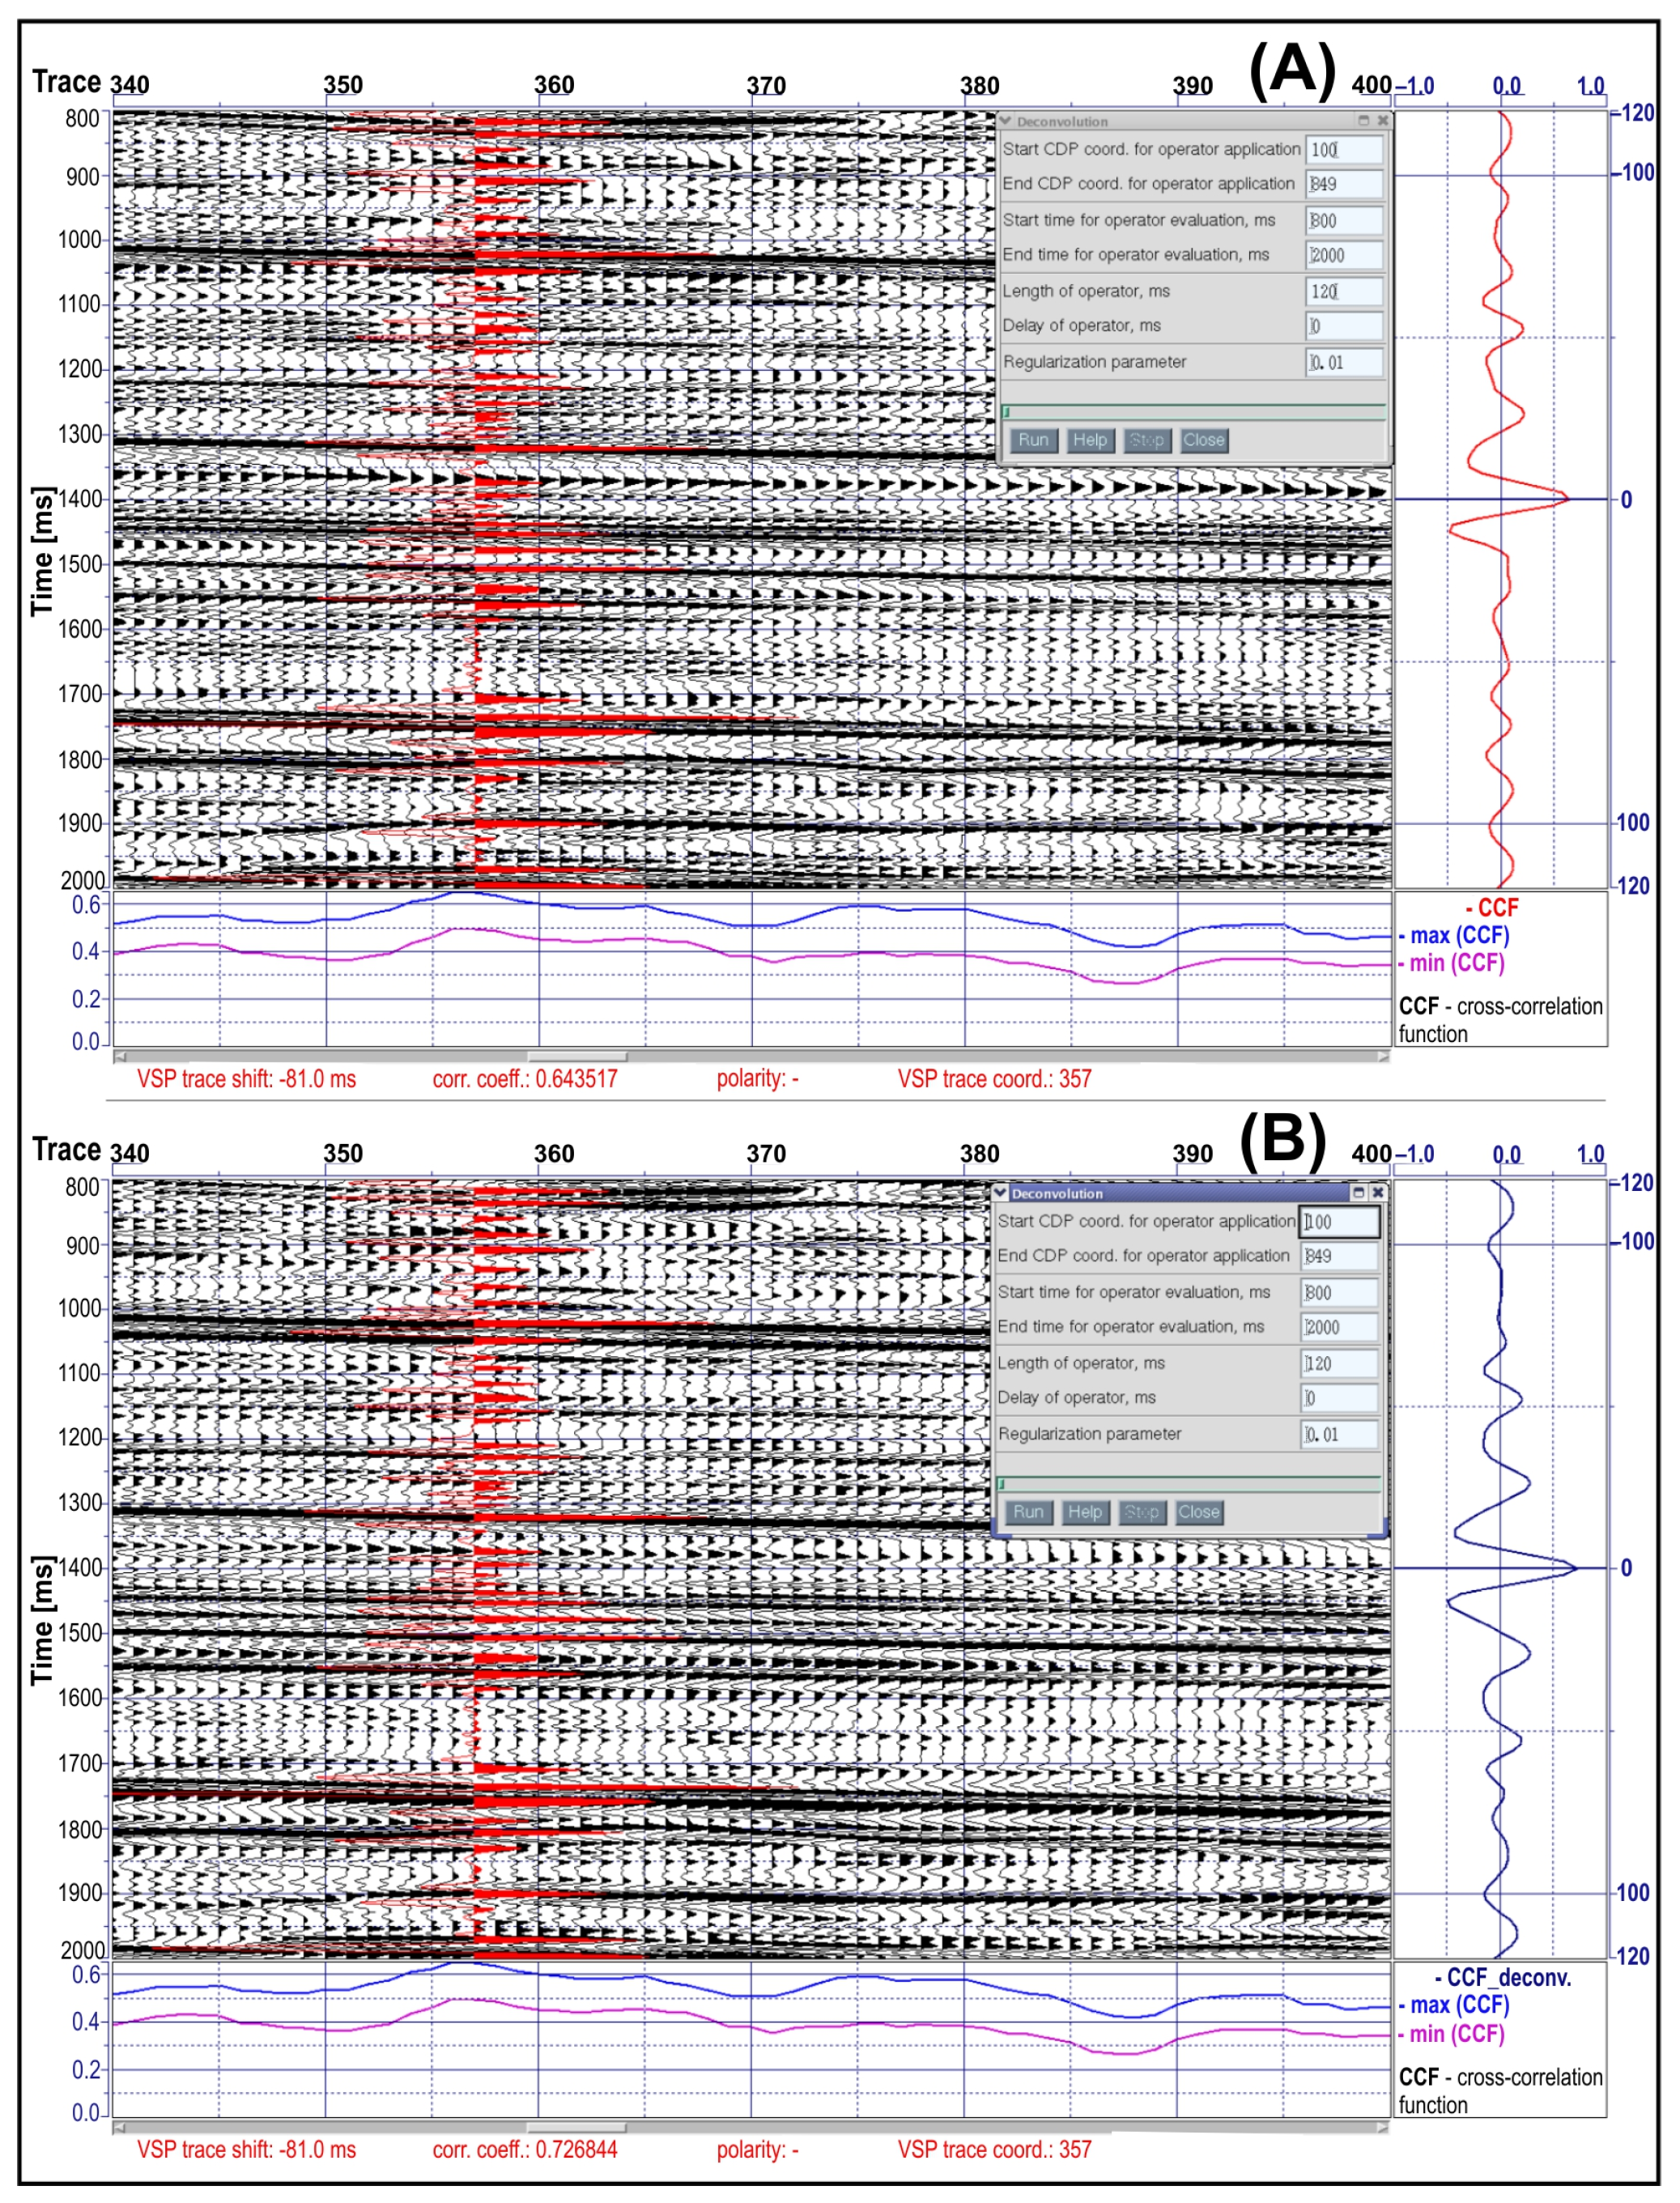
Calculations of higher frequencies on the seismic trace spectrum were conducted on selected IL700 and XL360 seismic sections (traversing Well-1) using shape filter deconvolution calculated in Geovers’ Univers system (Figure 5). Based on the analysis of the VSP upgoing wavefield and the resulting form of the corridor stack, an elementary signal was defined, which was taken as the deconvolution operator. The length of the deconvolution operator was taken as 120 ms. This operator was applied to selected seismic sections to obtain a seismic record enriched with the frequency spectrum derived from VSP data and zero-phase correlation of seismic traces (Figure 6).

3.4. Seismic Inversion Method

The correctness of the reconstruction of the geological framework, especially its structural and lithofacial diversity, depends crucially on the seismic wavefield resolution, and hence on its spectral characteristics. The spectral characteristics significantly determine the results of seismic inversion, which can be successfully used for detailed reservoir analysis [68,69]. Seismic inversion is a useful geophysical tool for estimating the physical parameters of a geological medium from seismic data as impedance changes, which are the product of density and propagation velocity. This enables the conversion of seismic reflection amplitudes into physical rock parameters and, consequently, a quantitative description of the reservoir. However, in simplified terms, it can be understood as the determination of well acoustic impedance for each seismic trace. The propagation velocity of seismic waves is one of the parameters that most reliably describes the physical properties of a geological medium [70,71,72,73].
In the present study, the acoustic impedance distribution was determined for the corridor stack corresponding to zero-offset shot point SP-1, the VSP-CMP transformation for shot point SP-3, and analyzed seismic sections. A deterministic seismic inversion method, known as recursive inversion, was applied for the calculations. This method, based on the classical deconvolution model [74,75,76,77], involves the sequential calculation of acoustic impedance in successive layers. The impedance value for a particular layer is determined directly from the impedance value of the overlying layer, according to the equation:
Z i + 1 = Z i 1 + C i 1 C i = Z 0 j = 0 i 1 + C i 1 C i
where
Zi—impedance of the i-th layer (previous),
Zi+1—impedance and +1 layer (next),
Z0—impedance of the first layer (starting),
Ci—reflection coefficient between the i-th layer and the next layer (i + 1).
The initial impedance model (low-frequency model) is calculated based on well data: sonic (DT), density (RHOB), and interval velocity obtained from zero-offset VSP measurements. This robust starting model is crucial for recursive inversion, which is a very useful method for relatively quickly determining relative changes in impedance distribution in a geological medium. The resolution of this method depends on the signal shape and the amplitude–frequency range included in the seismic traces. Generally, the results obtained using the described inversion method feature the same frequency range as the input seismic data.

4. Results

Based on the research conducted, the resulting seismic sections were obtained in both the version after the deconvolution procedure using the operator calculated from VSP data and in the acoustic impedance version.
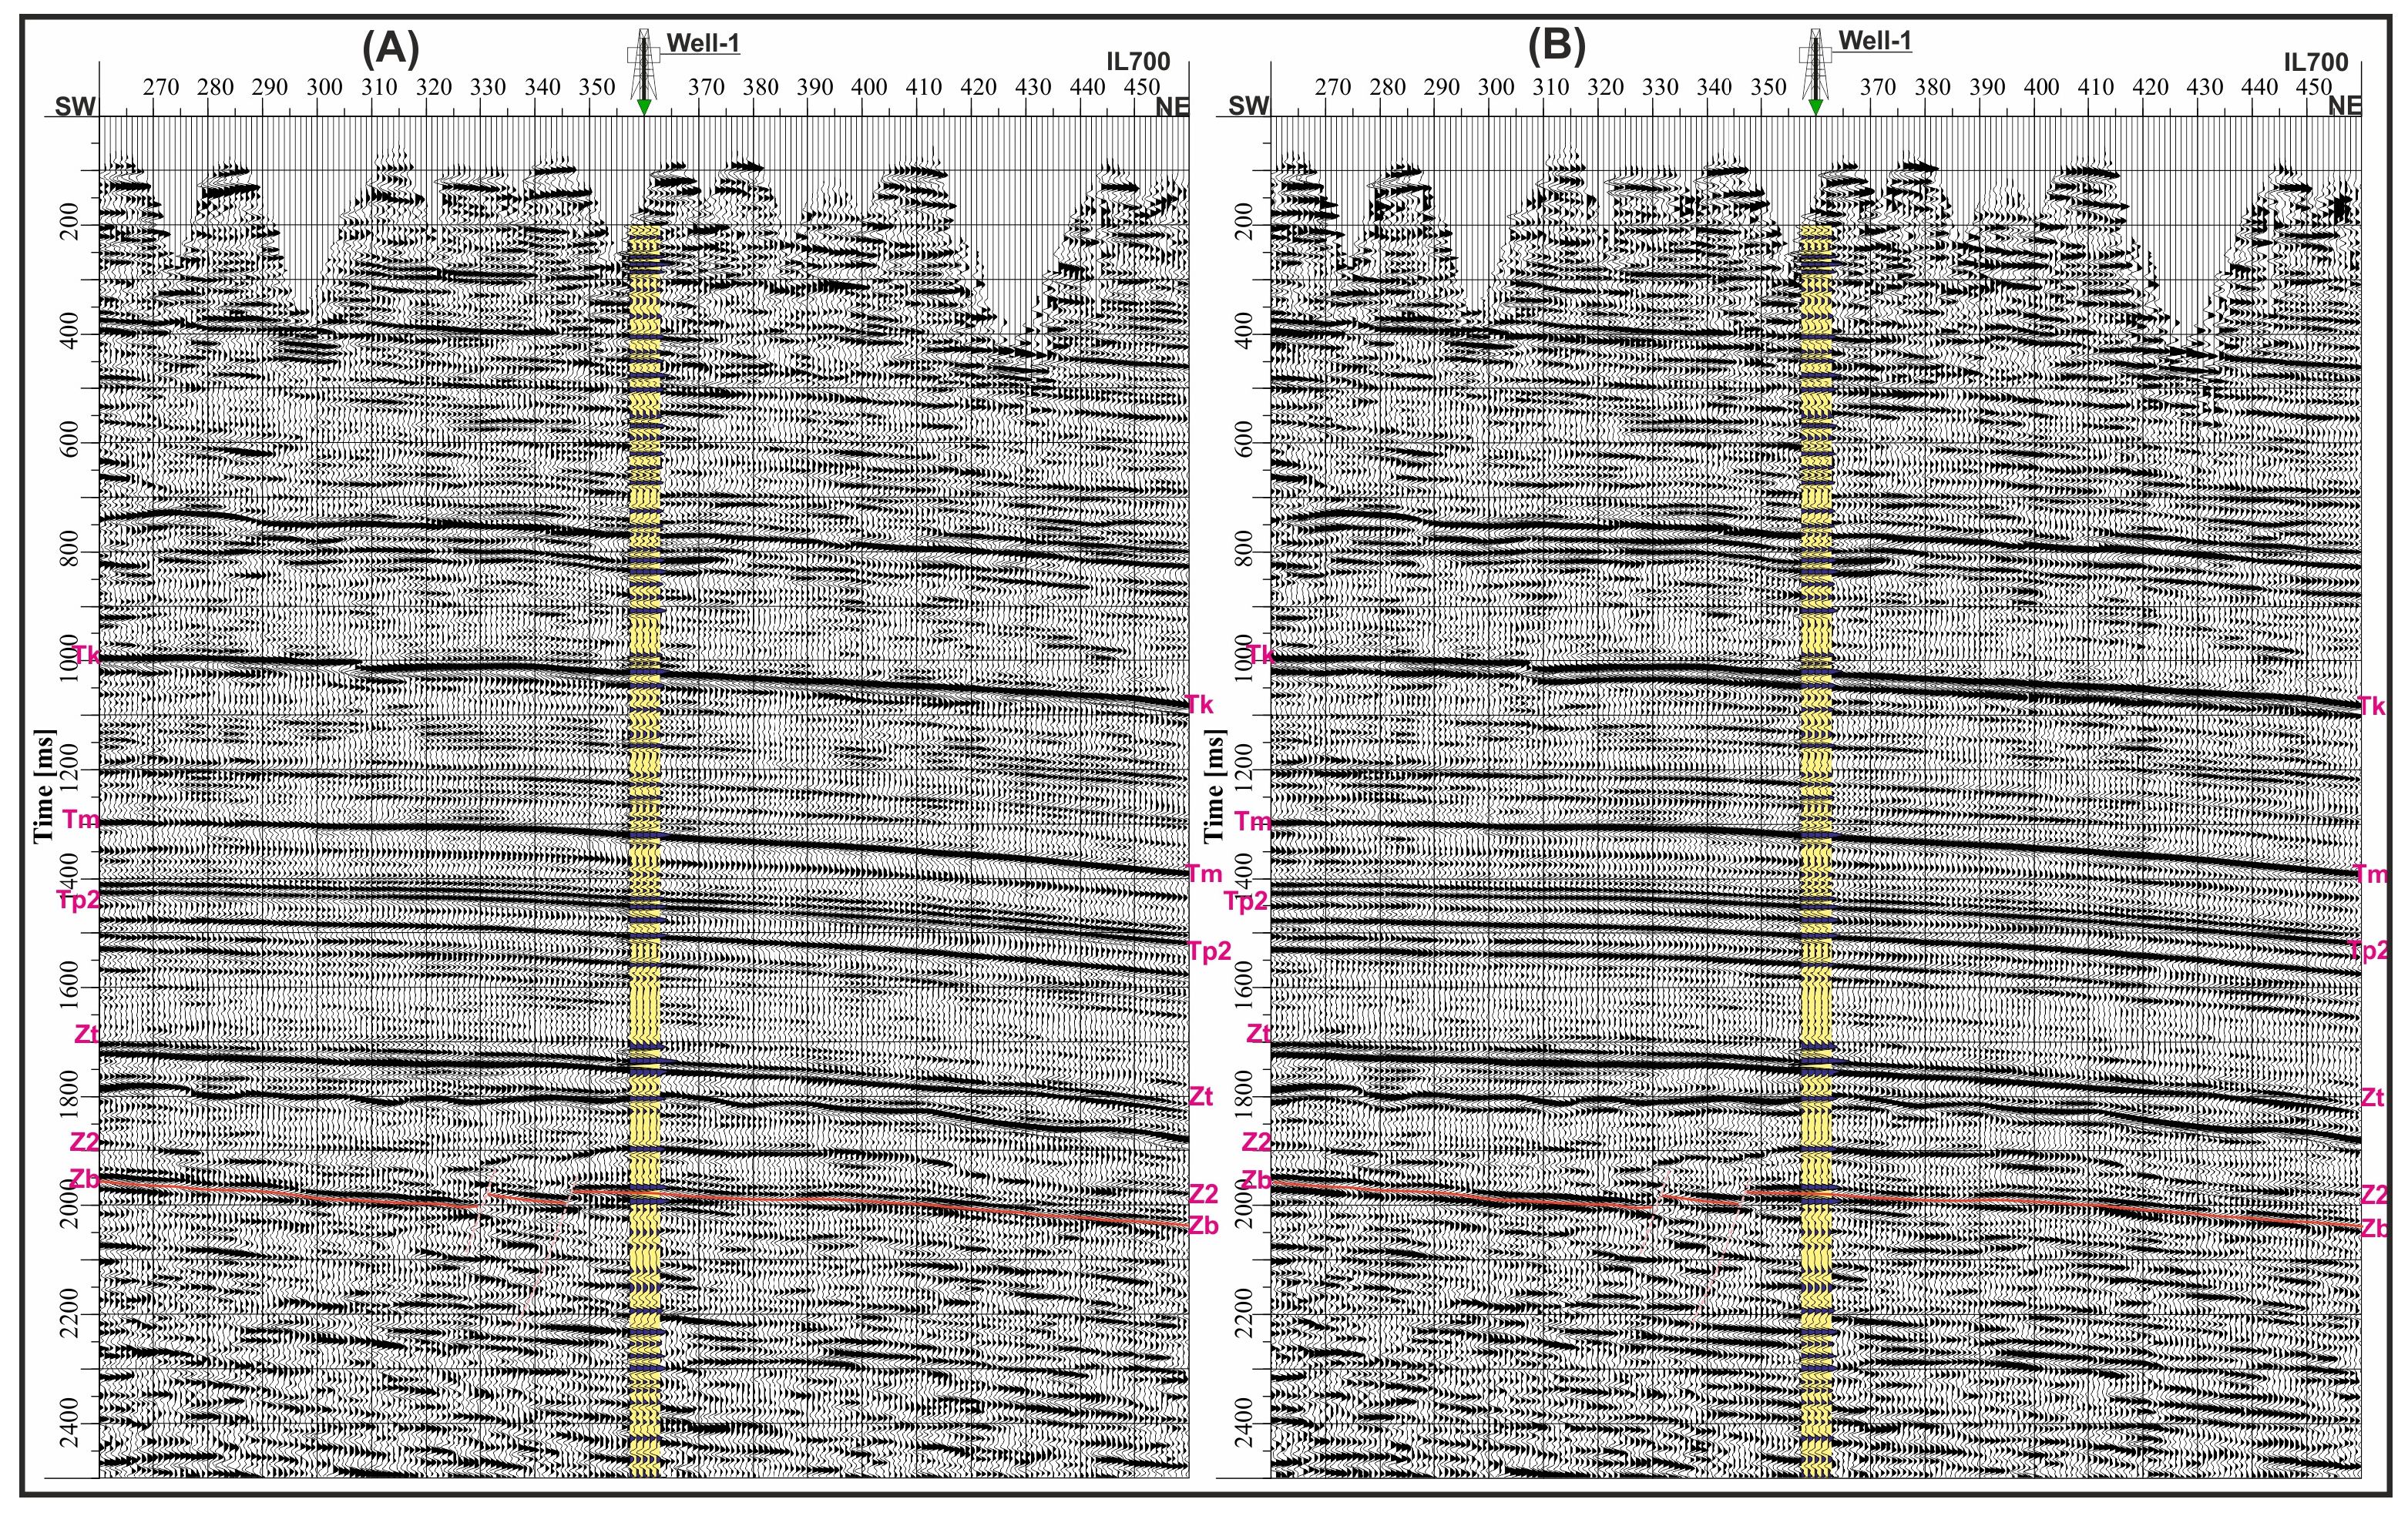
A comparison of the wavefield records between the versions before and after the application of deconvolution procedure reveals greater dynamics and continuity of seismic reflection within the time interval corresponding to the analyzed Zechstein and Rotliegend formations (Figure 7). Furthermore, the deconvolution procedure used enabled the obtaining of a symmetrical zero-phase signal for all seismic traces (Figure 5). The procedure also resulted in an increase in the correlation coefficient of the VSP corridor stack with seismic traces in the Well-1 area (Figure 8).
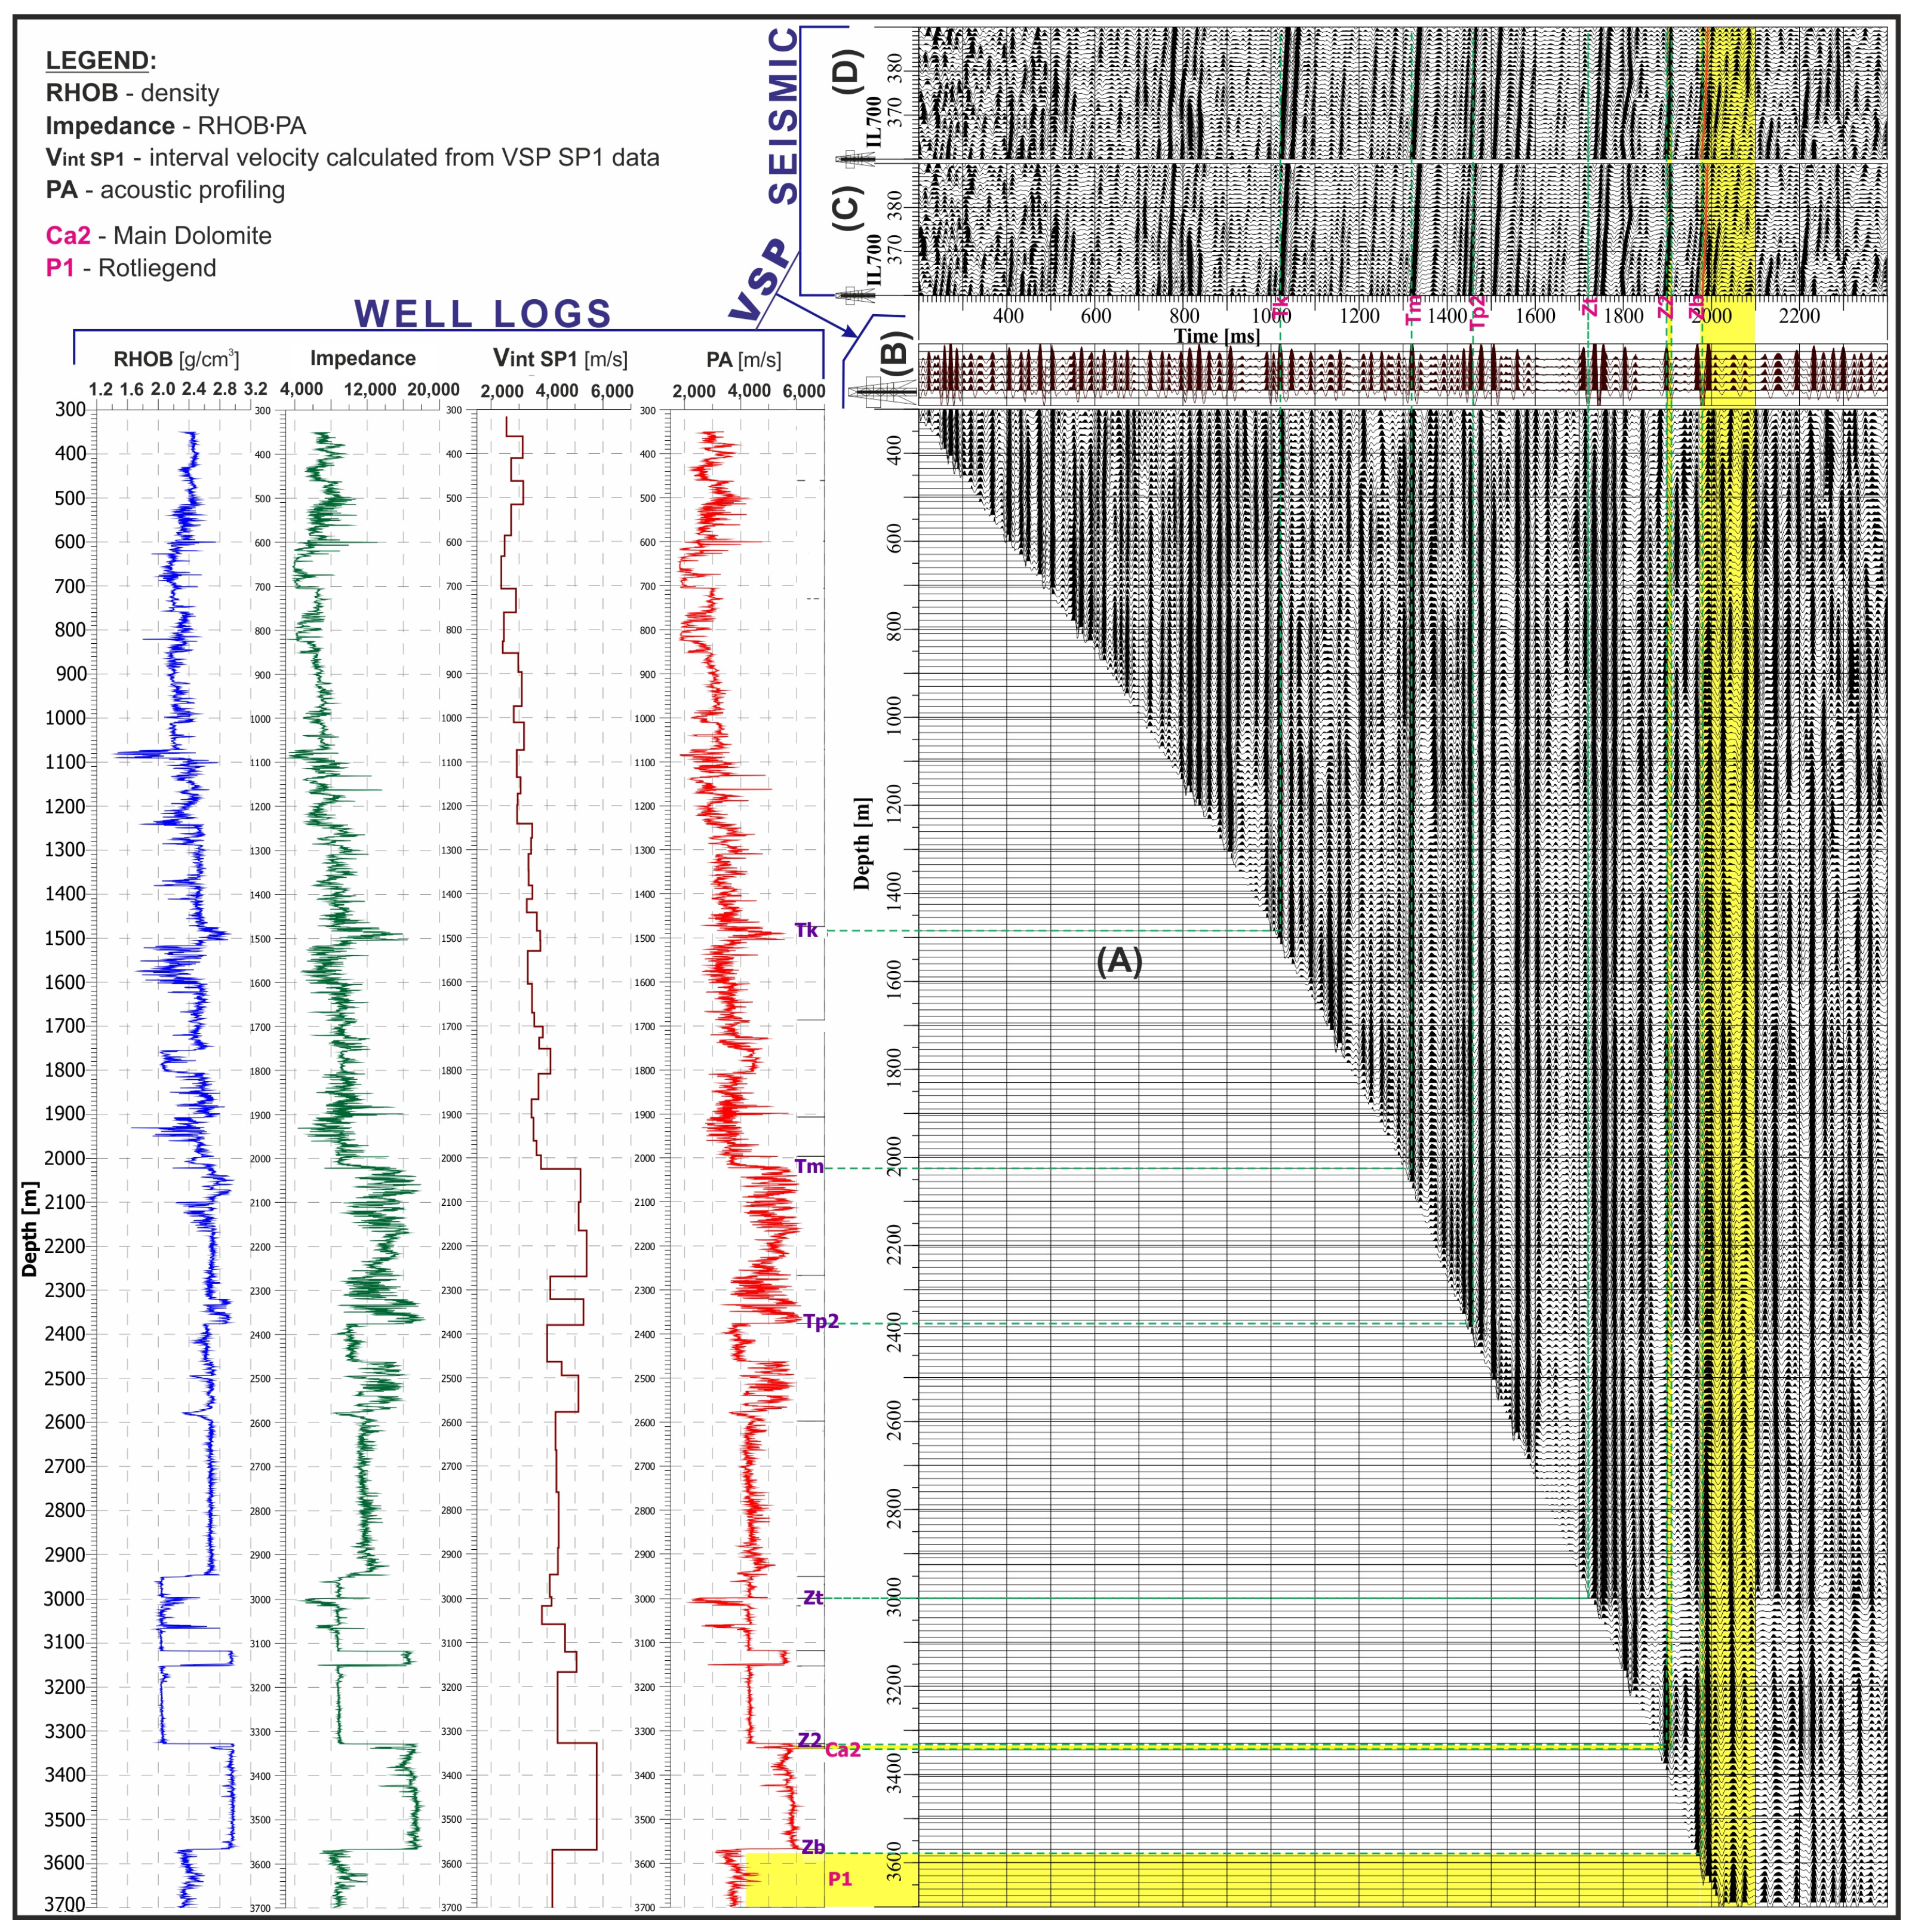
Figure 8 shows the integrated results for Well-1 (composite plot) of vertical seismic profiling (zero-offset VSP), including well data, VSP primary reflection, corridor stack, and a fragment of seismic section IL700 (version before and after deconvolution procedure). This composite plot supports the integration of data recorded in the depth domain (well logs, VSP data) and the time domain (3D seismic survey). Moreover, the composite plot shows the correlation of selected interpreted seismic horizons (Tk, Tm, Tp2, Zt, Z2, and Zb—dashed lines). Two intervals highlighted in yellow cover the levels of reservoir rocks, with the lower one (P1) located in the topmost part of the Rotliegend formation profile, and the upper one (Ca2) corresponding to the carbonate unit of the Main Dolomite of the Zechstein. The integrated visualization of well logs, VSP, and seismic sections presented on the composite plot allows for a comprehensive analysis of all available data with the goal of more detailed recognition of distinct prospective and reservoir horizons. Another significant benefit of this method is that it enables precise identification of seismic reflections corresponding to geological formations located below the bottom of the well, as well as providing information on their structural framework (Figure 9).
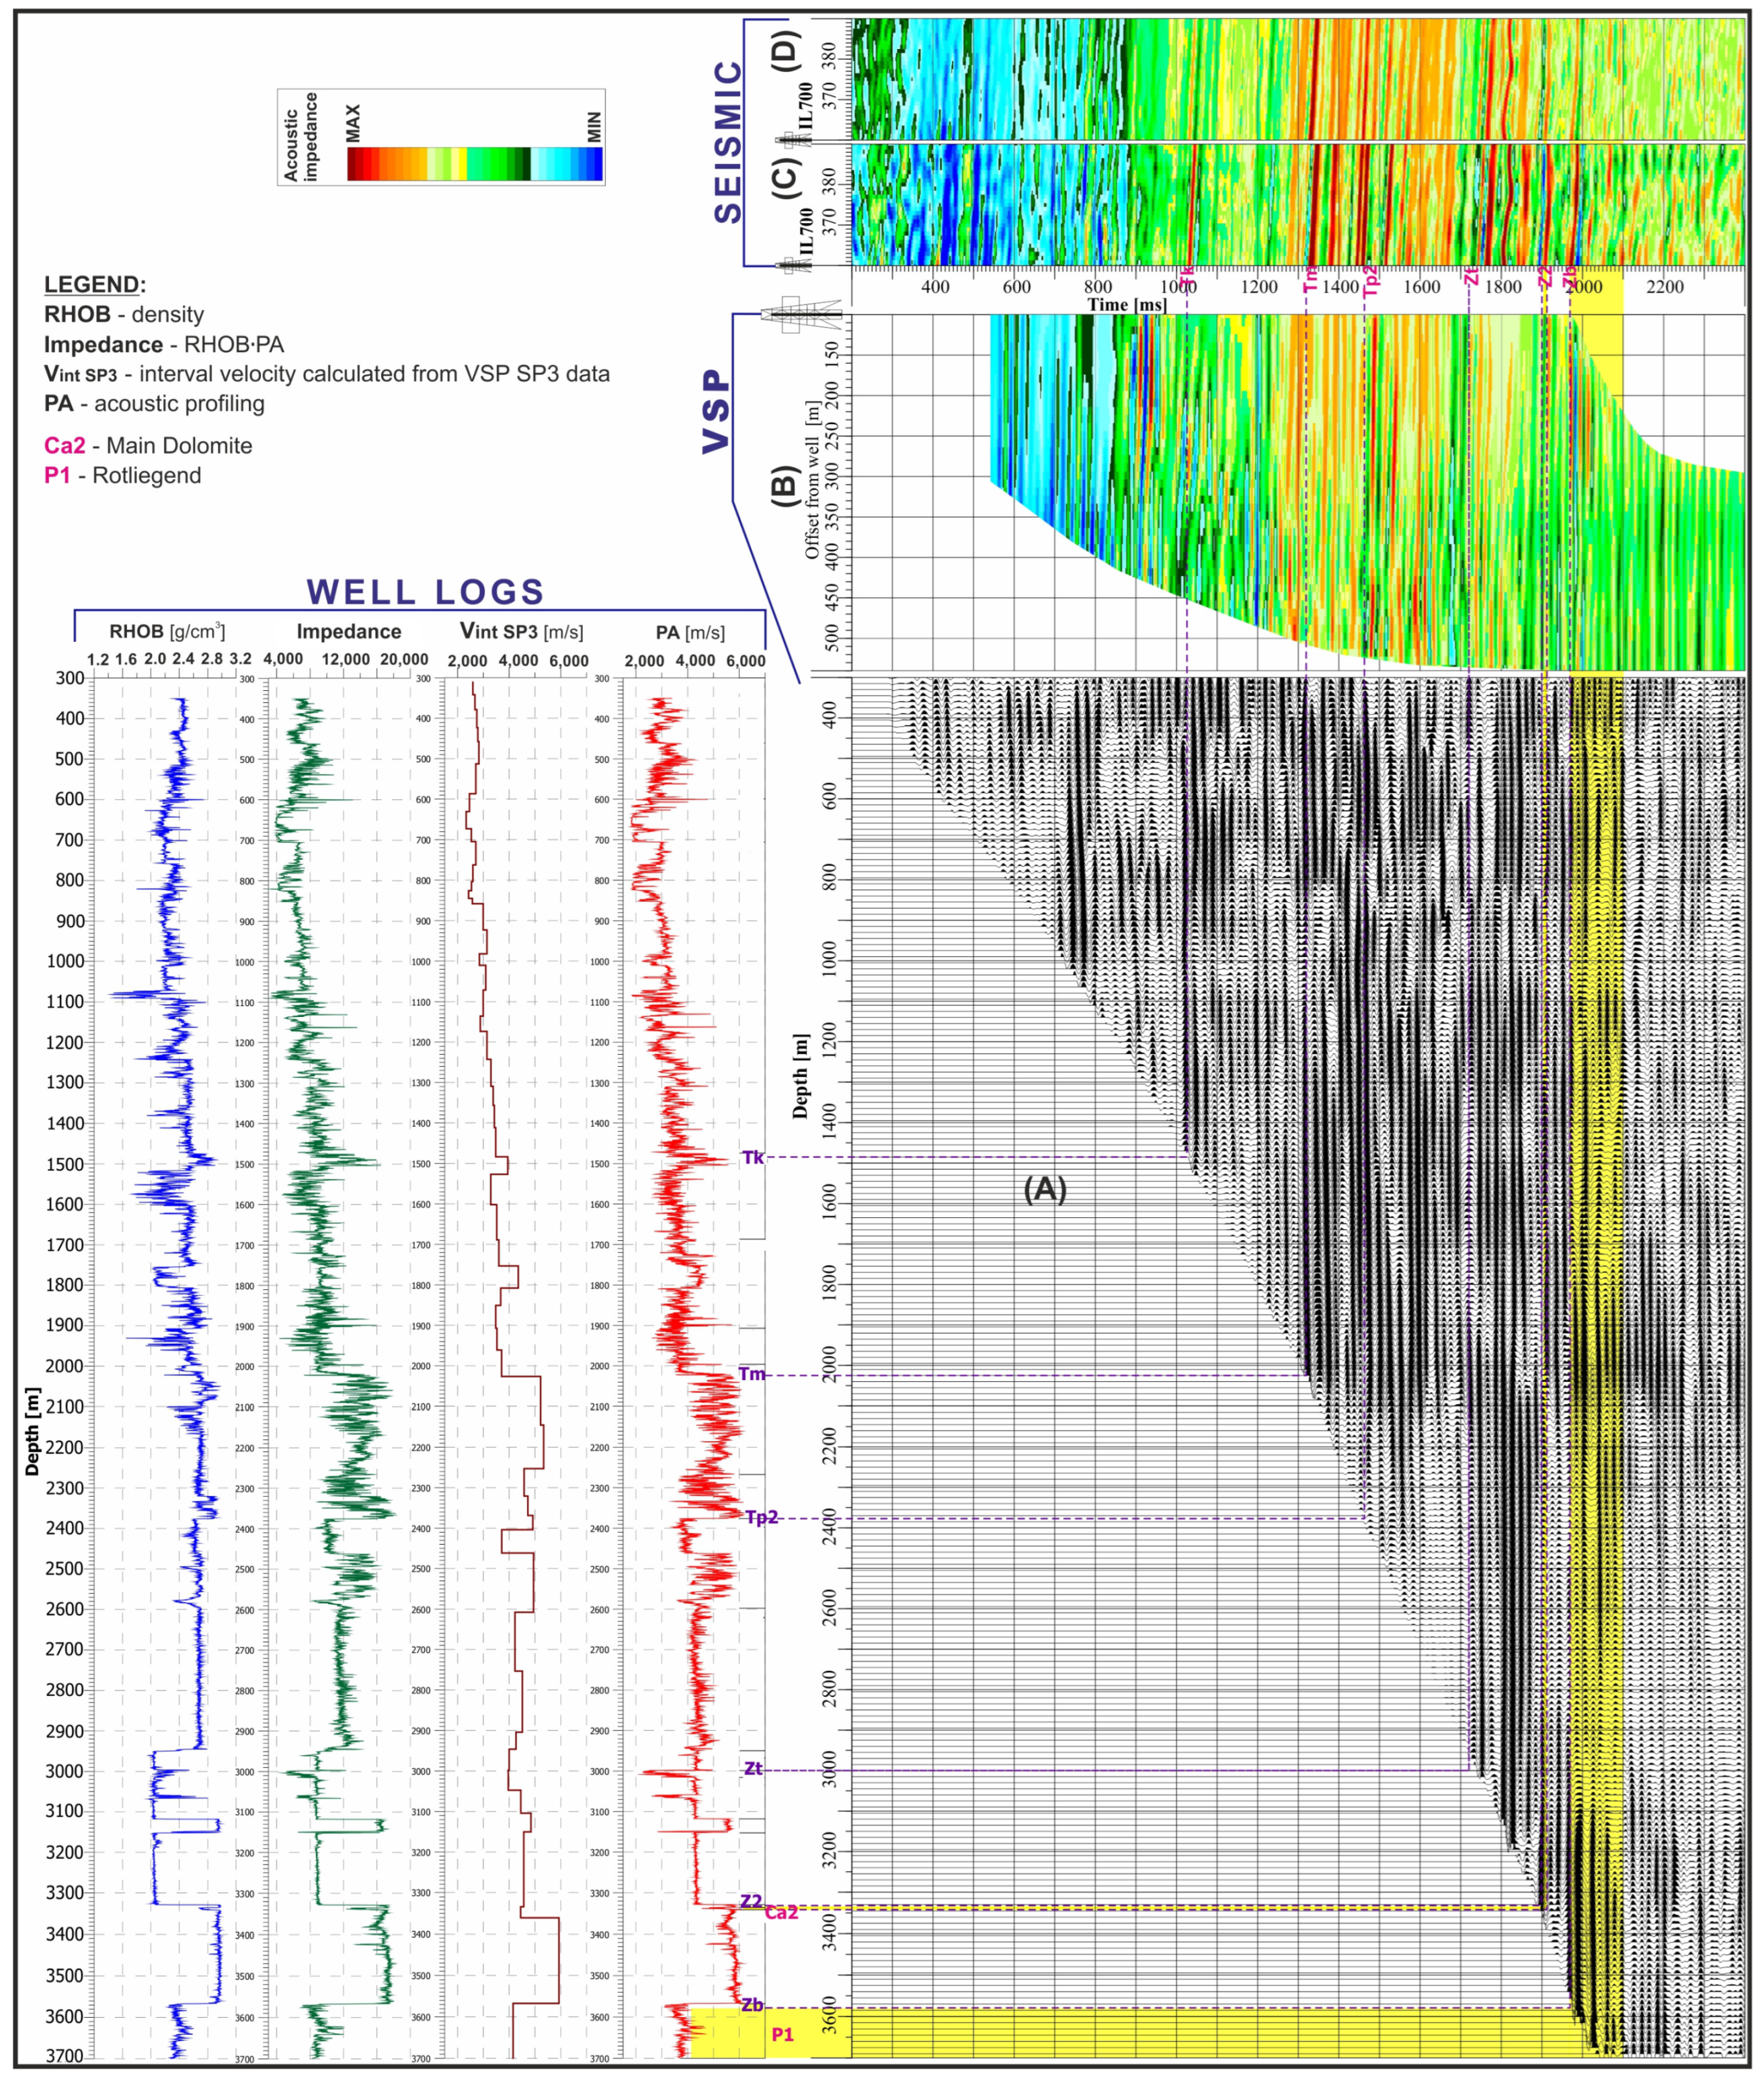
Figure 9 presents the VSP-CMP transformation, which shows the correlation of the main seismic reflections compared to the IL700 seismic section (in the version before and after the deconvolution procedure). Furthermore, the wave image on this transformation is characterized by higher resolution, both vertically and horizontally, which facilitates more precise tracking of seismic reflections in the near-well zone. In the interval between the interpreted Z2 horizon and the bottom of the Ca2 lithological member in the VSP-CMP transformation, a decreased amplitude value is observed, which may indicate poorer reservoir properties. This is confirmed by well data, as the porosity is several percent and the permeability does not exceed 1 mD. In the interval between the interpreted horizon Zb (the base of Zechstein) and the bottom of the well, dynamic variability of contrasting amplitude values can be observed, which may indicate good reservoir properties within the uppermost part of the Rotliegend formation profile. This is confirmed by very good reservoir properties, with porosity ranging from several percent to approx. 25% and permeability from several dozen to over 100 mD, as well as the flow of hydrocarbons obtained from the topmost part of the Rotliegend formation.
In the next stage of the research, deterministic seismic inversion calculations were performed on the VSP output and the analyzed seismic profiles. These calculations were performed using in-house software developed by the Oil and Gas Institute–National Research Institute. Acoustic impedance analysis was performed on both VSP and seismic data, before the deconvolution procedure and on the version after applying the deconvolution operator using Formula (5).
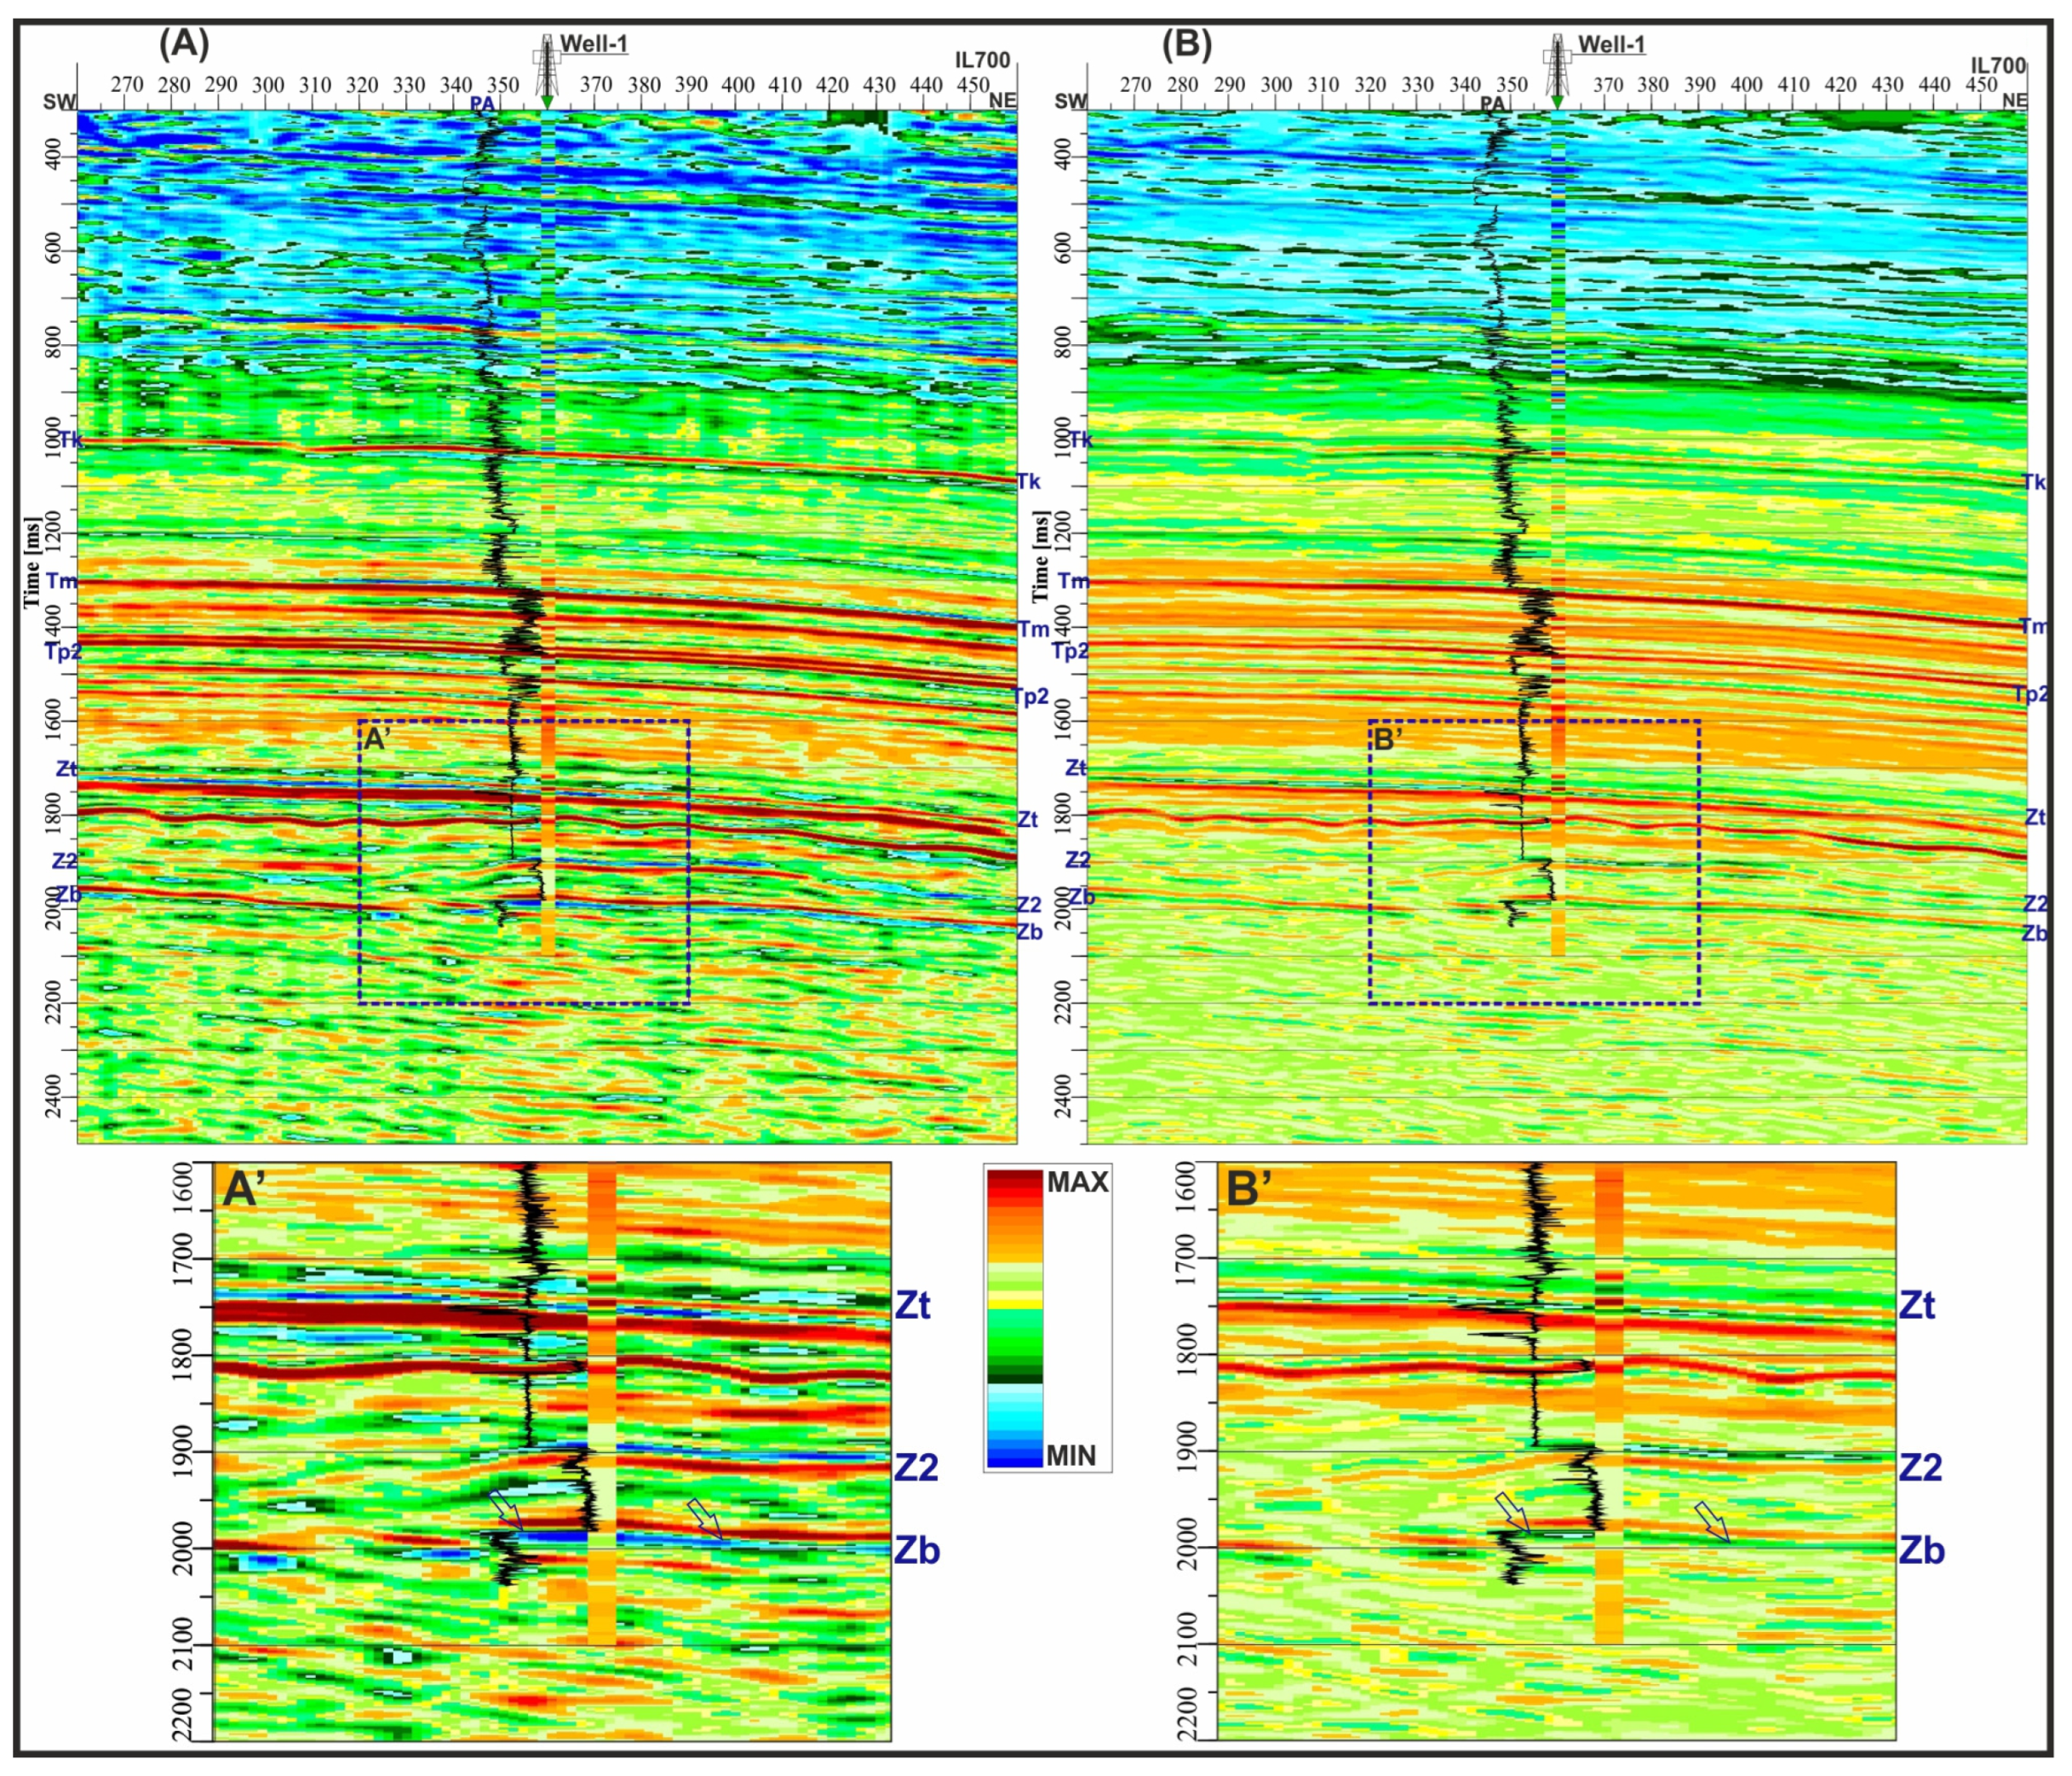
The paper presents the results of seismic inversion in the form of acoustic impedance distributions for the IL700 seismic section. The results reveal that the calculated acoustic impedance, both in the corridor stack and in the VSP-CMP transformation, for the analyzed time intervals is characterized by higher vertical resolution compared to seismic sections (Figure 10 and Figure 11). This refers to both seismic versions before and after the deconvolution procedure (Figure 12).
It should be noted that the applied deconvolution procedure caused some changes in the shape of the seismic signal and the frequency spectrum range for surface seismic; therefore, the final acoustic impedance values obtained for both versions of the seismic image (before and after the deconvolution procedure) are not consistent.
The acoustic impedance image obtained for the Rotliegend formations reveals a zone with varying impedance values, located in the upper part of the formation (indicated by arrows in Figure 12), which can be interpreted as the zone with better reservoir parameters. On the VSP-CMP transformation (Figure 11B), the range of distribution of this zone in relation to the interpreted well can be determined in detail.
Regarding the Zechstein formations, the distribution of acoustic impedance values within individual cyclothems and associated lithological units (anhydrites, salts, carbonates) in the seismic version after the deconvolution procedure is considerably more harmonized and structured (Figure 12), which seems to better reflect the periodic nature of sedimentation as well as the formation of reservoir parameters within these formations.

5. Discussion

The clastic sediments of Rotliegend and carbonate deposits of Main Dolomite in the Polish part of the Permian Basin are considered to be the most prospective reservoir formations regarding hydrocarbon exploration [56,78,79]. These formations also have significant reservoir potential in other areas of the European Permian Basin, e.g., [80,81,82]. Although numerous natural gas and oil fields have already been discovered in these horizons, and some of them are being exploited to this day, there is still a high probability of discovering new hydrocarbon reserves, including especially natural gas deposits in the sandstone reservoir of Rotliegend. However, Rotliegend reservoir rocks are very difficult for more detailed recognition, both structural and facial, due to high variability of reservoir parameters [43,57,83], large burial depths, and often poor seismic imaging below the Zechstein base [24,25,26]. Focusing exploration activities on increasingly more difficult targets and geological structures results in an increasing need for more pointed, and relatively inexpensive, measurement methods that can provide more detailed information on lithology and reservoir parameter distribution in the vicinity of target zones.
The results of applying vertical seismic profiling (VSP) to interpret the Zechstein and Rotliegend formations provided additional information on the variability of reservoir parameters in these formations. The primary aim of this research was to determine the possibility of increasing the precision of identifying reservoir series in Permian formations.
In the first stage, VSP data for shot points SP-1 and SP-3 were processed, and the results obtained were used to calculate the deconvolution operator, which then was applied to seismic traces in order to expand the frequency spectrum on seismic sections traversing Well-1. In the next stage, seismic inversion calculations were performed on the obtained results (both VSP and surface seismic). The resulting seismic sections and VSP-CDP transformations obtained from both stages were the basis for a comprehensive analysis and interpretation of the Rotliegend and Main Dolomite reservoir series. This resulted in a significant improvement in seismic image resolution and consequently enabled a more detailed interpretation of the analyzed formations.
The results obtained in this work are consistent with the findings described in several publications, including the publications of Tabakov [64], Haldorsen et al. [12], or de Freslon et al. [84]. However, in this study, shape filter deconvolution was additionally applied to seismic data, taking into account the specific conditions related to the Polish Permian basin.
An example of using VSP measurements is presented by Henninges et al. [85]. The authors applied a novel method of distributed acoustic sensing (DAS) to gain more detailed information on the structural setting and geometry of the geothermal reservoir, which comprised volcanic rocks and sediments of Early Permian age. The aims of the VSP survey were precise well-to-seismic tie (to bottom-well depth of 4200 m) and imaging of structural elements within the reservoir interval of the Rotliegend formation in the well vicinity with higher resolution in three dimensions. The imaging of structures in the target reservoir interval was a special task because the Lower Permian sediments are overlain by the 1400 m thick Upper Permian Zechstein salt complex.
Another example of VSP measurements used for high-resolution imaging of a carbonate reservoir is presented in the work of Mullen et al. [86]. The studies were conducted because of an incompatibility between existing seismic and geological interpretations. Optimized P-impedance form VSP, high-resolution images obtained, and additional information from the VSP provided a crucial structural update to the interpretation and helped to better understand issues related to the depositional model.
The effectiveness of integrating VSP data (i.e., corridor sums for PP and PS waves and VSP-CMP transformations) with the results of seismic inversion performed on 3D seismic data was confirmed by De Freslon et al. [84] while studying reservoir parameter prediction in the Carboniferous and Devonian formations of the Machukhske gas field in the Dnieper–Donetsk basin. Their approach emphasized the important role of VSP in the process of calibrating a priori velocity models, which significantly reduced the uncertainty of seismic inversion below the bottom depth of the well.
In our project, VSP data were also used to obtain a reliable distribution of velocity and acoustic impedance values, especially for Rotliegend formations, which are characterized by high heterogeneity resulting from diagenetic processes. The improved resolution of impedance contrast achieved through VSP-based deconvolution confirms the findings of other authors, including Haldorsen et al. [12], de Freslon et al. [84], and Henninges et al. [85], that VSP data provide essential information about high frequencies that are often missing in surface seismic data sets. More generally, the results of this study demonstrate the complementary nature of VSP and surface seismic data in characterizing reservoir series. The integration of different impedance versions obtained from VSP data with seismic inversion calculated on surface seismic data provides a reliable framework for reducing geological risk in hydrocarbon exploration and production, as indicated by the results of both this study and earlier publications [79,87,88]. However, this is important in Rotliegend sandstones, in which the reservoir quality is determined by cementation, other diagenetic processes, and the effects of tectonic processes. These results are important not only for hydrocarbon exploration purposes, but also for other fields of application, such as geothermal energy and carbon dioxide sequestration, where accurate imaging of the subsurface structure is crucial. Despite these achievements, there are certain limitations resulting from, for example, limited data availability, the acquisition parameters used, the quality of the data obtained, and the VSP processing procedures used.
Another promising direction is the incorporation of machine learning techniques into the optimization of VSP deconvolution processes, which should potentially increase the efficiency and precision of acoustic impedance calculations. Currently, machine learning is successfully used for VSP data processing, specifically for the precise selection of downgoing and upgoing waves as well as longitudinal and transverse waves [89,90,91].

6. Conclusions

The results obtained, resulting in improved seismic data resolution using shape filter deconvolution, confirm the validity of this method for advancing procedures of reflecting the geological structure of rock formations.
The resulting seismic field obtained after applying deconvolution has significantly improved dynamics and continuity of reflections, and better vertical resolution, with the deconvolution outcome depending on the frequency range used in the calculated deconvolution operator from VSP measurements. The additional benefit of applying the shape filter deconvolution procedure to migrated seismic sections is obtaining a wavefield with a zero-phase signal.
The effect of improved seismic record resolution after deconvolution is also observed on acoustic impedance sections in the time domain obtained by applying seismic inversion. The results obtained as acoustic impedance distribution are characterized by higher vertical and horizontal resolution, and thus more precise imaging of structural changes and reservoir parameter variability related mainly to lithological and facial changes, as well as to the history of diagenetic processes.
The application of VSP measurements in the Rotliegend complex confirmed its potential as an additional geophysical method for identifying reservoir formations. Resulting from the optimization of impedance procedures and improved deconvolution techniques, VSP measurements can be helpful in the detailed seismic and geological interpretation of complicated reservoirs. Considering the relatively inexpensive cost of VSP measurements compared to standard seismic methods, future research should focus primarily on the more effective employment of advanced VSP acquisition and processing methods to expand the imaging potential of difficult-to-interpret rock formations (e.g., due to high variability of reservoir parameters or tectonic conditions), such as salt dome zones, aeolian, or fluvial formations.

Author Contributions

Conceptualization, R.B. and A.U.; methodology, R.B.; software, R.B.; validation, A.U. and A.Ł.-B.; formal analysis, R.B.; investigation, R.B., A.U. and A.Ł.-B.; writing—original draft preparation, R.B. and A.U.; writing—review and editing, A.Ł.-B.; visualization, R.B. and A.U.; supervision, A.U. All authors have read and agreed to the published version of the manuscript.

Funding

This research was funded based on the statutory work—the work of the Oil and Gas Institute–National Research Institute (INiG–PIB) commissioned by the Ministry of Science and Higher Education; order number: 0032/KP/SR/2024; archive number: DK-4100-0018/2024.

Institutional Review Board Statement

Not applicable.

Informed Consent Statement

Not applicable.

Data Availability Statement

Original data are not shared (3rd Party Data). Data was obtained from ORLEN SA. Exploration & Production Branch PGNiG in Warsaw and the authors were not authorized to share source data.

Acknowledgments

Authors would like to acknowledge ORLEN SA. Exploration & Production Branch PGNiG in Warsaw for sharing the data for research purposes and thank them for the permission to publish the results.

Conflicts of Interest

The authors declare no conflicts of interest.

References

  1. Mitera, Z.A. Present status and future aspects of geophysical exploration in Poland. Geophysics 1939, 3, 225–233. [Google Scholar] [CrossRef]
  2. Trześniowski, Z. Seismic surveys in historical and contemporary aspect. Przegląd Geol. 1997, 45, 600–604. (In Polish) [Google Scholar]
  3. Dragoset, B. A historical reflection on reflections. Lead. Edge 2005, 24, 46–70. [Google Scholar] [CrossRef]
  4. Ashton, C.P.; Bacon, B.; Mann, A.; Moldoveanu, N.; Ireson, D.; Sinclair, T.; Redekop, G. 3D Seismic Survey Design. Oilfield Rev. 1994, 6, 19–32. [Google Scholar]
  5. Brown, A.R. Interpretation of Three-Dimensional Seismic Data, 5th ed.; AAPG: Tulsa, OK, USA; SEG: Houston, TX, USA, 1999; pp. 1–514. [Google Scholar]
  6. Vermeer, G. Understanding the fundamentals of 3D seismic survey design. First Break 2001, 19, 130–134. [Google Scholar] [CrossRef]
  7. Galperin, E.I. Vertical Seismic Profiling and Its Exploration Potential; D. Reidel Publishing Company: Dordrecht, The Netherlands, 2012; pp. 1–442. [Google Scholar] [CrossRef]
  8. Oristaglio, M.L. A guide to current uses of vertical seismic profiles. Geophysics 1985, 50, 2473–2479. [Google Scholar] [CrossRef]
  9. Blackburn, J.; Daniels, J.; Dingwall, S.; Hampden-Smith, G.; Leaney, S.; Calvez, J.L.; Nutt, L.; Menkiti, H.; Sanchez, A.; Schinelli, M. Borehole Seismic Surveys: Beyond the Vertical Profile. Oilfield Rev. 2007, 19, 20–35. [Google Scholar]
  10. Hardage, B.A. Vertical Seismic Profiling: Principles, 3rd ed.; Pergamon: Elmsford, NY, USA, 2000; Volume 14, pp. 1–552. [Google Scholar]
  11. Stewart, R. VSP: An In-Depth Seismic Understanding. CSEG Rec. 2001, 26, 79–83. [Google Scholar]
  12. Haldorsen, J.; Milenkovic, M. High-Resolution Processing of VSP Data. In Proceedings of the Fifth EAGE Workshop on Borehole Geophysics, The Hague, The Netherlands, 18–20 November 2019; Volume 2019, pp. 1–5. [Google Scholar] [CrossRef]
  13. Bulhões, F.C.; Melo, R.J.; Oliveira, R.L.; Diniz, G. Automated detection of faults and fractures in well seismic data in the Campos Basin. In Proceedings of the 17th International Congress of the Brazilian Geophysical Society, Rio de Janeiro, Brazil, 8–11 November 2021; pp. 1–6. [Google Scholar] [CrossRef]
  14. Maula, F.; Sakina, M.; Trihutomo, H. Integrated Formation Attenuation and Multiple Generator Identification from Multi-well VSP Data. In Proceedings of the 47th Annual Scientific Meeting of Himpunan Ahli Geofisika Indonesia, Malang, Indonesia, 10–13 October 2022; pp. 1–7. [Google Scholar]
  15. Gomez, G.; Planchart, C.; Chon, Y.; Massimo, A.; Gonzalez, G.; Sifontes, E.; Octavio, D. How integration of well log, core, borehole seismic and cross-well seismic data can offer a powerful tool in complex structural situations. First Break 2002, 20, 404–410. [Google Scholar]
  16. Payne, M.A.; Eriksen, E.A.; Rape, T.D. Considerations for high-resolution VSP imaging. Lead. Edge 1994, 13, 173–180. [Google Scholar] [CrossRef]
  17. Stewart, R.; Disiena, J. The values of VSP in interpretation. Lead. Edge 1989, 8, 16–23. [Google Scholar] [CrossRef]
  18. Wyatt, K.D.; Wyatt, S.B. The determination of subsurface structural information using a vertical seismic profile. In Proceedings of the 51st Annual International Meeting Society of Exploration Geophysicists, Tulsa, OK, USA, 11–15 October1981; Expanded Abstracts. pp. 1915–1949. [Google Scholar]
  19. Walia, R.; Brandt, K.; Duthie, R.; Whittaker, R.; Malterre, E.; Bell, P. New concepts for borehole and VSP data integration in seismic data processing. First Break 2005, 23, 83–87. [Google Scholar] [CrossRef]
  20. Castagna, J.P.; Sun, S.; Siegfried, R. Instantaneous spectra analysis: Detection of low-frequency shadows associated with hydrocarbons. Lead. Edge 2003, 22, 120–127. [Google Scholar] [CrossRef]
  21. Wroblewska, K.; Understanding the Mid North Sea High. GEOExPro. 2017. Available online: https://geoexpro.com/understanding-the-mid-north-sea-high (accessed on 5 September 2025).
  22. Bajewski, Ł.; Wilk, A.; Urbaniec, A.; Bartoń, R. Improving the imaging of under-Zechstein structures based on the reprocessing of 2D seismic in the West Pomerania region, Poland. Nafta-Gaz 2019, 75, 195–204, (In Polish with English Abstract). [Google Scholar] [CrossRef]
  23. Fairhead, J.D.; Marsden, D.; Azli, N.M.; Özsöz, I.; Maxwell, D.; Rose, O.; Green, C.M. Gravity imaging of sub-Zechstein geological structures in the UK sector of the North Sea using the gravity layer stripping method. Pet. Geosci. 2023, 29, petgeo2023-009. [Google Scholar] [CrossRef]
  24. Chopra, S.; Alexeev, V.; Sudhakar, V. High-frequency restoration of surface seismic data. Lead. Edge 2003, 22, 730–738. [Google Scholar] [CrossRef]
  25. Bartoń, R.; Jędrzejowska, H.; Żukowska, K. Application of Vertical Seismic Profiling for improvement of seismic surface data resolution. Case study from Carpathian Foreland in Poland. In Proceedings of the VII Annual International Conference and Exhibition—Galperin Readings, Moscow, Russia, 28–31 October 2007. [Google Scholar] [CrossRef]
  26. Bartoń, R. Quantitative and qualitative effects of increasing resolution of seismic sections in the geological interpretation of seismic data as a result of the measurements in regard to vertical seismic profiling. Pr. Nauk. INiG 2010, 169, 1–124, (In Polish with English Abstract). [Google Scholar]
  27. Karnkowski, P.H. Origin and evolution of the Polish Rotliegend Basin. Polish Geol. Inst. Sp. Pap. 1999, 3, 1–93. [Google Scholar]
  28. Van Uijen, W.M. Rotliegend Geology in the Southern Permian Basin: The Development of Synrift Sediments and Its Relation to Seismic Imaging; Utrecht University: Utrecht, The Netherlands, 2013. [Google Scholar]
  29. Oszczepalski, S.; Speczik, S.; Zieliński, K.; Chmielewski, A. The Kupferschiefer Deposits and Prospects in SW Poland: Past, Present and Future. Minerals 2019, 9, 592. [Google Scholar] [CrossRef]
  30. Kiersnowski, H.; Buniak, A. Sand sheets interaction with aeolian dune, alluvial and marginal playa beds in Late Permian Upper Rotliegend setting (western part of the Poznań Basin, Poland). Geol. Q. 2016, 60, 771–800. [Google Scholar] [CrossRef]
  31. Ryka, W. Precambrian evolution of the Polish part of the East-European Platform in Poland. Geol. Q. 1982, 26, 257–272, (In Polish with English Abstract). [Google Scholar]
  32. Dadlez, R. The Polish Basin—Relationship between the crystalline, consolidated and sedimentary crust. Geol. Q. 2006, 50, 43–58. [Google Scholar]
  33. Bogdanova, S.V.; Bingen, B.; Gorbatschev, R.; Kheraskova, T.N.; Kozlov, V.I.; Puchkov, V.N.; Volozh, Y.A. The East European Craton (Baltica) before and during the assembly of Rodinia. Precambrian Res. 2008, 60, 23–45. [Google Scholar] [CrossRef]
  34. Poprawa, P. Geological setting and Ediacaran–Palaeozoic evolution of the western slope of the East European Craton and adjacent regions. Ann. Soc. Geol. Pol. 2019, 89, 347–380. [Google Scholar] [CrossRef]
  35. Jóźwiak, W.; Nowożyński, K.; Mazur, S.; Jeż, M. Deep Electrical Resistivity Structure of the European Lithosphere in Poland Derived from 3-D Inversion of Magnetotelluric Data. Surv. Geophys. 2022, 43, 1563–1586. [Google Scholar] [CrossRef]
  36. Żelaźniewicz, A.; Aleksandrowski, P.; Buła, Z.; Karnkowski, P.H.; Konon, A.; Oszczypko, N.; Ślączka, A.; Żaba, J.; Żytko, K. Tectonic Subdivision of Poland; Komitet Nauk Geologicznych PAN: Wrocław, Poland, 2011; pp. 1–60. (In Polish) [Google Scholar]
  37. Narkiewicz, M.; Petecki, Z. Basement structure of the Paleozoic Platform in Poland. Geol. Q. 2017, 61, 502–520. [Google Scholar] [CrossRef]
  38. Nguyen, Q.; Malinowski, M.; Mazur, S.; Stovba, S.; Ponikowska, M.; Hübscher, C. Post-Caledonian tectonic evolution of the Precambrian and Paleozoic platform boundary zone offshore Poland based on the new and vintage multi-channel reflection seismic data. Solid Earth 2024, 15, 1029–1046. [Google Scholar] [CrossRef]
  39. Kłapciński, J.; Muszer, J. Age of pre-Permian rocks from chosen boreholes of eastern part of the Fore-Sudetic Monocline. Geol. Sudet. 1987, 22, 91–100, (In Polish with English Abstract). [Google Scholar]
  40. Wierzchowska-Kicułowa, K. Geological features of the Permian basement in the Fore-Sudetic area. Geol. Q. 1987, 31, 557–568, (In Polish with English Abstract). [Google Scholar]
  41. Górecka-Nowak, A. New interpretations of the Carboniferous stratigraphy of SW Poland based on miospore data. Bull. Geosci. 2008, 83, 101–116. [Google Scholar] [CrossRef]
  42. Maliszewska, A.; Kiersnowski, H.; Jackowicz, E. Volcanoclastic deposits of the Lower Rotliegend in the Wielkopolska region. Prace Państw. Inst. Geol. 2003, 179, 1–59, (In Polish with English Abstract). [Google Scholar]
  43. Maliszewska, A.; Jackowicz, E.; Kuberska, M.; Kiersnowski, H. Lower Permian (Rotliegend) rocks of Western Poland—A petrographic monograph. Prace Państw. Inst. Geol. 2016, 204, 6–115, (In Polish with English Abstract). [Google Scholar]
  44. Kiersnowski, H. Depositional development of the Polish Upper Rotliegend Basin and evolution of its sediment source areas. Geol. Q. 1997, 41, 433–456. [Google Scholar]
  45. Kiersnowski, H. Late Permian aeolian sand seas from the Polish Upper Rotliegend Basin in the context of palaeoclimatic periodicity. Geol. Soc. Sp. Publ. 2013, 376, 431–456. [Google Scholar] [CrossRef]
  46. Buniak, A.; Kuberska, M.; Kiersnowski, H. Petrographical-petrophysical characteristics of the Rotliegend eolian sandstones of the Siekierki–Winna Góra Zone (the Poznań region) in the aspect of search for gas trapped in deposits. Przegląd Geol. 2009, 57, 328–334, (In Polish with English Abstract). [Google Scholar]
  47. Wagner, R.; Piątkowski, T.S.; Peryt, T.M. Polish Zechstein Basin. Przegląd Geol. 1978, 26, 673–686, (In Polish with English Abstract). [Google Scholar]
  48. Wagner, R. The evolution of the Zechstein Basin in Poland. Geol. Q. 1988, 32, 33–52, (In Polish with English Abstract). [Google Scholar]
  49. Tucker, M.E. Sequence stratigraphy of carbonate-evaporite basins, models and application to the Upper Permian (Zechstein) of northeast England and adjoining North Sea. J. Geol. Soc. 1991, 148, 1019–1036. [Google Scholar] [CrossRef]
  50. Kiersnowski, H.; Paul, J.; Peryt, T.M.; Smith, D.B. Facies, Paleogeography, and Sedimentary History of the Southern Permian Basin in Europe. In The Permian of Northern Pangea; Scholle, P.A., Peryt., T.M., Ulmer-Scholle, D.S., Eds.; Springer: Berlin/Heidelberg, Germany, 1995. [Google Scholar] [CrossRef]
  51. Wagner, R.; Peryt, T.M. Possibility of sequence stratigraphic subdivison of the Zechstein in the Polish Basin. Geol. Q. 1997, 41, 457–474. [Google Scholar]
  52. Becker, F.; Bechstädt, T. Sequence stratigraphy of a carbonate-evaporite succession (Zechstein 1, Hessian Basin, Germany). Sedimentology 2006, 53, 1083–1120. [Google Scholar] [CrossRef]
  53. Richter-Bernburg, G. Stratigraphische Gliederung des deutschen Zachsteins. Z. Deutsch. Geol. Ges. 1955, 105, 843–854. [Google Scholar]
  54. Gajewska, I. Middle Triassic (Muschelkalk–Lower Keuper). In The Epicontinental Permian and Mesozoic in Poland; Marek, S., Pajchlowa, M., Ulmer-Scholle, D.S., Eds.; Prace Panstwowego Instytutu Geologicznego: Warsaw, Poland, 1997; Volume 153, pp. 144–150. (In Polish) [Google Scholar]
  55. Pieńkowski, G. The epicontinental Lower Jurassic of Poland. Pol. Geol. Inst. Sp. Papers 2004, 12, 5–154. [Google Scholar]
  56. Karnkowski, P.H. Permian Basin as a main exploration target in Poland. Przegląd Geol. 2007, 55, 1003–1015. [Google Scholar]
  57. Papiernik, B.; Doligez, B.; Klimkowski, Ł. Structural and Parametric Models of the Załecze and Zuchlów Gas Field Region, Fore-Sudetic Monocline, Poland—An Example of a General Static Modeling Workflow in Mature Petroleum Areas for CCS, EGR or EOR Purposes. Oil Gas Sci. Technol. Rev. IFP Energ. Nouv. 2015, 70, 635–654. [Google Scholar] [CrossRef]
  58. Zając, A.; Maćkowski, T. Reservoir interpretation of Rotliegend seismic reflections in the central part of the Mid-Polish Trough. Mar. Pet. Geol. 2018, 89, 300–312. [Google Scholar] [CrossRef]
  59. Dohnalik, M.; Zalewska, J. Correlation of results of laboratory tests obtained by X-ray microtomography, nuclear magnetic resonance and mercury porosimetry. Nafta-Gaz 2013, 69, 735–743. (In Polish) [Google Scholar]
  60. Dubiel, A.; Rybicki, C.; Zubrzycki, A.; Maruta, M. Applicability of DST results to the evaluation of changes of geologic conditions of Rotliegend series in the Polish Lowland. AGH Drill. Oil Gas 2015, 32, 77–88. [Google Scholar] [CrossRef]
  61. Dohnalik, M.; Ziemianin, K. Characteristics of Rotliegend sediments in view of X-ray microtomohraphy and optical microscopy investigations. Nafta-Gaz 2020, 76, 765–773, (In Polish with English Abstract). [Google Scholar] [CrossRef]
  62. Hope, R.; Ireson, D.; Leaney, S.; Meyer, J.; Tittle, W.; Willis, M. Seismic Integration to Reduce Risk. Oilfield Rev. 1998, 10, 2–15. [Google Scholar]
  63. Gulati, J.S.; Stewart, R.R.; Parkin, J.M. Analyzing three-component 3D vertical seismic profiling data. Geophysics 2004, 69, 386–392. [Google Scholar] [CrossRef]
  64. Tabakov, A.A.; Ferentsi, V.N. Principles and Techniques of VSP Data Processing. In Proceedings of the 9th Simposio Bolivariano—Exploracion Petrolera en las Cuencas Subandinas, Cartagena, Colombia, 24–27 September 2006]; p. cp-111-00006. [Google Scholar] [CrossRef]
  65. Bartoń, R. Role of VSP measurement in investigation of anisotropy of geological medium. In Proceedings of the XI Annual International Conference and Exhibition—Galperin Readings, Moscow, Russia, 24–28 October 2011; pp. 1–5. [Google Scholar]
  66. Bartoń, R. Determination of directional velocity changes of transverse waves in near-wellbore zone based on VSP 3C. Nafta-Gaz 2014, 70, 483–492, (In Polish with English Abstract). [Google Scholar]
  67. Bartoń, R. Application of the shape filter deconvolution to improve the resolution of seismic data. Nafta-Gaz 2014, 70, 861–867, (In Polish with English abstract). [Google Scholar]
  68. Jędrzejowska-Tyczkowska, H.; Żukowska, K. Increasing resolution of seismic section to enhance of quantitative estimates reliability of physical parameters of a medium. Nafta-Gaz 1999, 55, 334–346, (In Polish with English Abstract). [Google Scholar]
  69. Pendrel, J. Seismic Inversion—A Critical Toll in Reservoir Characterization. Scand. Oil-Gas Mag. 2006, 34, 19–22. [Google Scholar]
  70. Russell, B.H. Introduction to Seismic Inversion Methods; Society of Exploration Geophysicists: Houston, TX, USA, 1988; pp. 1–178. [Google Scholar] [CrossRef]
  71. Helland-Hansen, D.; Magnus, I.; Edvardsen, A.; Hansen, E. Seismic Inversion for Reservoir Characterization and Well Planning in the Snorre Field. Lead. Edge 1997, 16, 269–274. [Google Scholar] [CrossRef]
  72. Veeken, P.C.H.; Silva, M. Seismic inversion methods and some of their constraints. First Break 2004, 22, 15–38. [Google Scholar]
  73. Jędrzejowska-Zwinczak, H. Seismic inversion of longitudinal, shear and converted waves for selected problem of reservoir interpretation. Pr. Nauk. INiG 2009, 160, 1–85, (In Polish with English Abstract). [Google Scholar]
  74. Cooke, D.A.; Schneider, W.A. Generalized linear inversion of reflection seismic data. Geophysics 1983, 48, 665–675. [Google Scholar] [CrossRef]
  75. Hendrick, N.; Hearn, S. Evaluation of Seismic Trace Inversion Techniques. Explor. Geophys. 1993, 24, 549–559. [Google Scholar] [CrossRef]
  76. Wang, J.; Liu, Y.; Sun, Z.; Tian, H.; Su, H.; Zhao, Q.; Liu, Y. Acoustic impedance inversion of zero-offset VSP data. Appl. Geophys. 2009, 6, 150–158. [Google Scholar] [CrossRef]
  77. Bartoń, R. Calculation of seismic inversion on VSP-CDP azimuthal transformations of longitudinal and transverse waves. Nafta-Gaz 2015, 71, 711–719, (In Polish with English Abstract). [Google Scholar] [CrossRef]
  78. Jaworowski, K.; Mikołajewski, Z. Oil- and gas-bearing sediments of the Main Dolomite (Ca2) in the Miedzychód region: A depositional model and the problem of the boundary between the second and third depositional sequences in the Polish Zechstein Basin. Przegląd Geol. 2007, 55, 1017–1024. [Google Scholar]
  79. Maćkowski, T.; Kwolek, K.; Górecki, W. The potential for locating hydrocarbon traps in the Rotliegend formation, based on the results of experimental seismic surveys. Geol. Geophys. Environ. 2017, 43, 191–199. [Google Scholar] [CrossRef]
  80. Van Hulten, F.F.N. Geological factors effecting compartmentalization of Rotliegend gas fields in the Netherlands. Geol. Soc. 2010, 347, 301–315. [Google Scholar] [CrossRef]
  81. Bensea, F.A.; Jähne-Klingberga, F. Storage potentials in the deeper subsurface of the Central German North Sea. Energy Procedia 2017, 114, 4595–4622. [Google Scholar] [CrossRef]
  82. Sorento, T.; Stemmerik, L.; Olaussen, S. Upper Permian carbonates at the northern edge of the Zechstein basin, Utsira High, Norwegian North Sea. Mar. Pet. Geol. 2018, 89, 635–652. [Google Scholar] [CrossRef]
  83. Poszytek, A. Reservoir properties of the Upper Rotliegend and the Weissliegend sandstones (Permian) in the Zielona Góra Basin (western Poland). Geol. Q. 2014, 58, 193–206. [Google Scholar] [CrossRef]
  84. De Freslon, N.; Cuilhe, L.; Yareshchenko, S.; Solodkyi, Y.; Gafych, I.; Rudling, C.; Lucet, N.; Desgoutte, N.; Machault, V. Integration of VSP in the process of surface seismic data inversion. First Break 2021, 39, 35–44. [Google Scholar] [CrossRef]
  85. Henninges, J.; Martuganova, E.; Stiller, M.; Norden, B.; Krawczyk, C.M. Wireline distributed acoustic sensing allows 4.2 km deep vertical seismic profiling of the Rotliegend 150 °C geothermal reservoir in the North German Basin. Solid Earth 2021, 12, 521–537. [Google Scholar] [CrossRef]
  86. Mullen, R.; Barry, B.; Rudling, C.; Bailey, J.; Solodkyi, Y.; Yareshchenko, S.; Gafych, I.; Wills, W. Collaborative VSP acquisition to optimize imaging for field development. First Break 2021, 39, 45–51. [Google Scholar] [CrossRef]
  87. Egorov, A.; Pevzner, R.; Bóna, A.; Glubokovskikh, S.; Puzyrev, V.; Tertyshnikov, K.; Gurevich, B. Time-lapse full waveform inversion of vertical seismic profile data: Workflow and application to the CO2CRC Otway project. Geophys. Res. Lett. 2017, 44, 7211–7218. [Google Scholar] [CrossRef]
  88. Wang, Y.; Lawton, D.C. Time-Lapse Impedance Variations Using DAS VSP Data During CO2 Injection at the CMC Newell County Facility, Alberta, Canada; SEG Technical Program Expanded Abstracts; SEG: Houston, TX, USA, 2023; pp. 1750–1754. [Google Scholar] [CrossRef]
  89. Cao, D.; Jia, Y.; Cuia, R. VSP Wavefiled Separation Using GAN Base on Asymmetric Convolution Blocks; SEG Technical Program Expanded Abstracts; SEG: Houston, TX, USA, 2021; pp. 3530–3535. [Google Scholar] [CrossRef]
  90. Yinling Guo, Y.; Peng, S.; Du, W.; Li, D. Denoising and wavefield separation method for DAS VSP via deep learning. J. Appl. Geophys. 2023, 210, 104946. [Google Scholar] [CrossRef]
  91. Xiaobin Li, X.; Qi, Q.; Li, L.; Duan, P.; Li, L.; Meng, J.; Zheng, M. A big data-driven deep-learning method for seismic wavefield separation of vertical seismic profile data. Geophysics 2025, 90, 439–454. [Google Scholar] [CrossRef]
Figure 1. Location of the study area: (A) in the generalized outline of the Central Europe region; (B) against the background of the primary tectonic units of the Permian basement (after Karnkowski [27], modified); (C) against the background of Upper Rotliegend main sedimentary paleoenvironments (after Kiersnowski and Buniak [30], modified).
Applsci 15 11339 g001
Figure 2. Localization of the well and VSP survey against the background of the 3D seismic survey.
Applsci 15 11339 g002
Figure 3. Seismic sections IL700 (A) and XL360 (B) in the time domain with computed amplitude spectra; green line–well trajectory, red line–base of Zechstein.
Applsci 15 11339 g003
Figure 4. VSP data of Z component for shot point SP-1 (A) and SP-3 (B) recorded in Well-1 with computed amplitude spectra.
Applsci 15 11339 g004
Figure 5. Example of deconvolution procedure on IL700 seismic section in Univers program with cross-correlation of VSP trace (red color): (A) version before deconvolution, (B) version after deconvolution.
Applsci 15 11339 g005
Figure 6. Comparison of calculated amplitude-frequency spectra: (A) for the IL700 section, (B) for the corridor stack of VSP SP1, (C) for the IL700 section after application of the deconvolution procedure.
Applsci 15 11339 g006
Figure 7. Seismic section IL700: (A) before application of the deconvolution, (B) after application of the deconvolution, with VSP corridor stack matching in Well-1 position (highlighted in yellow); red lines–base of Zechstein.
Applsci 15 11339 g007
Figure 8. Composite plot of well logs with VSP upgoing wavefield for SP-1 (A), corridor stack of VSP SP-1 (B), fragment of the IL700 seismic section before deconvolution (C), and fragment of the IL700 seismic section after deconvolution (D).
Applsci 15 11339 g008
Figure 9. Composite plot of well logs with VSP upgoing wavefield for SP-3 (A), VSP-CDP SP-3 (B), fragment of the IL700 seismic section before deconvolution (C), and fragment of the IL700 seismic section after deconvolution (D).
Applsci 15 11339 g009
Figure 10. Composite plot of well logs with VSP upgoing wavefield for SP-1 (A), acoustic impedance of VSP corridor stack for SP-1 (B), fragment of the IL700 acoustic impedance section before deconvolution (C), and fragment of the IL700 acoustic impedance section after deconvolution (D).
Applsci 15 11339 g010
Figure 11. Composite plot of well logs with VSP upgoing wavefield for SP-3 (A), acoustic impedance of VSP-CDP for SP-3 (B), fragment of the IL700 acoustic impedance section before deconvolution (C), and fragment of the IL700 acoustic impedance section after deconvolution (D).
Applsci 15 11339 g011
Figure 12. Acoustic impedances calculated on the IL700 seismic section with acoustic impedance of corridor stack matching in Well-1 position: (A,A’)—before application of the deconvolution, (B,B’)—after application of the deconvolution; PA—acoustic log; the arrows indicate the interval of low impedance values corresponding to the reservoir level.
Applsci 15 11339 g012
Disclaimer/Publisher’s Note: The statements, opinions and data contained in all publications are solely those of the individual author(s) and contributor(s) and not of MDPI and/or the editor(s). MDPI and/or the editor(s) disclaim responsibility for any injury to people or property resulting from any ideas, methods, instructions or products referred to in the content.