Article

Pre-Processing Ensemble Modeling Based on Faster Covariate Selection Calibration for Near-Infrared Spectroscopy

1
Department of Power Supply and Consumption Technology, Beijing Railway Electrification College, Beijing 102202, China
2
College of Electrical and Electronic Engineering, Wenzhou University, Wenzhou 325000, China
3
School of Robot Engineering, Wenzhou University of Technology, Wenzhou 325000, China
*
Author to whom correspondence should be addressed.
Appl. Sci. 2025, 15(21), 11325; https://doi.org/10.3390/app152111325
Submission received: 10 July 2025 / Revised: 21 September 2025 / Accepted: 24 September 2025 / Published: 22 October 2025

Abstract

Ensemble techniques are crucial for preprocessing near-infrared (NIR) data, yet effectively integrating information from multiple preprocessing methods remains challenging. While multi-block approaches have been introduced to optimize preprocessing selection, they face issues such as block order dependency, slow optimization, and limited interpretability. This study proposes PFCOVSC—a fast, order-independent, and interpretable ensemble preprocessing strategy integrating multi-block fusion and variable selection. The method combines diverse preprocessed data into a unified matrix and employs the efficient fCovsel technique to select informative variables and construct an ensemble model. Evaluated against SPORT and PROSAC on three public datasets, PFCOVSC substantially reduced prediction root mean squared error (RMSE) on wheat and meat datasets by 17%, 13% and 49%, 20%, respectively, while performing comparably on tablet data. The method also demonstrated advantages in computational speed and model interpretability, offering a promising new direction for preprocessing ensemble strategies.

1. Introduction

Near-infrared (NIR) spectroscopy, an analytical technique based on the electromagnetic spectrum, primarily measures the absorption of vibrational overtones from hydrogen-containing X-H groups (e.g., C–H, N–H, O–H) within the sample. By analyzing the absorption and scattering of light at specific wavelengths, NIR spectroscopy provides insights into sample composition and molecular structure [1]. Owing to its capacity for quantifying physical and chemical parameters and enabling quality assessments, NIR spectroscopy is extensively applied across agricultural, industrial, and pharmaceutical sectors. It is particularly effective for analyzing hydrogen-containing organic substances, including agricultural products, petrochemicals, and pharmaceuticals [2,3,4].
A critical aspect of NIR spectral analysis involves selecting appropriate chemometric methods to establish robust calibration models post-spectra acquisition [5]. However, spectral signals from complex samples are frequently corrupted by stray light, noise, baseline drift, and other artifacts, adversely affecting modeling outcomes [6]. Consequently, preprocessing is essential to mitigate these artifacts prior to applying chemometric or deep learning modeling techniques [7]. Common NIR preprocessing techniques encompass 1st derivatives, 2nd derivatives [8], normalization, Standard Normal Variate (SNV) transformation [9], Multiplicative Scatter Correction (MSC) [10], and smoothing methods such as Savitzky–Golay (S-G) filtering [11]. Derivative processing removes instrumental background or baseline drift influences. Scattering effects arising from particle size variations and distribution inhomogeneity are countered by MSC and SNV. S-G smoothing enhances the signal-to-noise ratio and suppresses random noise, while standardization minimizes adverse effects from significant scale differences.
Given the limitations of individual techniques and the complexity of spectral artifacts, a single preprocessing method often fails to fully eliminate interferences; employing combinations of methods frequently proves more effective [12]. For instance, derivative processing can expose potential spectral peaks, while subsequent smoothing reduces noise. However, the vast array of available preprocessing methods makes identifying optimal combinations a significant challenge [13]. Recognizing these choices and challenges, researchers have proposed various approaches, such as an orthogonal partial least squares (OPLS)-based framework for evaluating individual preprocessing techniques and their combinations [14]. Similarly, Design of Experiments (DoE) methods treating preprocessing types as factors have been explored [15], though they cannot readily evaluate multiple methods within a single category. More recently, grid search strategies thoroughly evaluating all possible preprocessing combinations to identify the optimal approach have been proposed [16,17]. While these strategies determine the most suitable method or combination for a dataset, they primarily focus on selection rather than leveraging the complementary information inherent in multiple preprocessed datasets.
Often, different preprocessing methods generate complementary information suitable for collaborative modeling [2,8], highlighting the need for preprocessing ensembles as emphasized in recent studies [18,19,20]. Preprocessing ensemble modeling diverges from merely concatenating different data blocks; instead, it aims to construct more efficient and robust models by fusing complementary insights derived from various preprocessing streams. For example, Stacked Preprocessing Ensemble (Stacked) integrates partial least squares (PLS) models built from differently preprocessed data using Monte Carlo cross-validation (MCCV) stacked regression [12]. However, the computational burden of training and optimizing numerous models can be prohibitive [21]. Complementarity-based strategies like Sequential and Orthogonalized PLS (SO-PLS) for multi-block data (SPORT) have been introduced [8]. Yet, SPORT suffers from dependence on block order, resulting in unstable outcomes if the sequence changes. Furthermore, the computational demands of SPORT’s global exploration become formidable with large-scale data blocks [21]. An efficient alternative, Pre-processing ensembles using Response-Oriented Sequential Alternating Calibration (PROSAC), applies a “winner-takes-all” rule to select blocks with maximal covariance to the response [22]. While PROSAC handles large blocks well, block-based filtering is susceptible to selecting erroneous “fake winners” due to invalid information within blocks, and redundant information across blocks can interfere with outcomes [23].
A key challenge in multi-block ensemble modeling lies in the abundance of redundant or invalid information. Consequently, variable selection is vital for effectively extracting valid signals. Traditional variable selection approaches include wrapper, filter, and embedded methods. Among these, embedded methods, which integrate variable selection with model building, are advantageous as they identify predictive subsets rich in informative variables [24]. Covariance Selection (CovSel) exemplifies this approach, iteratively selecting variables via covariance maximization and orthogonalization [25]. However, CovSel’s computational efficiency diminishes significantly with large datasets due to the costly prediction matrix deflation step therein. To address this, a faster CovSel variant (fCovsel) was proposed, replacing prediction matrix deflation with response deflation and Gram-Schmidt (G-S) reorthogonalization of scores [26]. This modification substantially reduces computational overhead, rendering fCovsel highly efficient for multi-block data scenarios.
This paper presents PFCOVSC (Preprocessing ensembles with Faster Covariate’s Selection Calibration), a novel ensemble preprocessing method designed to efficiently extract informative variables from multi-block preprocessed data, building robust models agnostic to preprocessing order and scale. PFCOVSC enables precise information extraction at the variable level, enhancing prediction accuracy. To validate its performance, PFCOVSC was applied to three distinct NIR datasets and benchmarked against single-block PLS models using individual preprocessing techniques. Comparative evaluations with similar ensemble methods demonstrate its advantages in predictive performance, immunity to block order effects, model interpretability, and computational efficiency, particularly when processing large numbers of blocks.

2. Material and Methods

2.1. Datasets

Three publicly available near-infrared spectroscopy datasets were employed to evaluate the predictive accuracy of quantitative analysis models using the PFCOVSC strategy:
  • Wheat data [27]: Near-infrared transmission spectra of wheat seeds were measured at 100 wavelengths and used to calibrate protein content. The dataset contains a calibration set of 415 samples and a test set of 108 samples.
  • Meat data [28]: Near-infrared transmission spectroscopy at 100 wavelengths was measured on fine meat slices and used to calibrate fat content. The dataset contains a calibration set of 172 samples and a test set of 43 samples.
  • Tablet data [29]: Tablet data were collected from the NIR spectra of 310 tablets with a spectral range of 7400~10,507 cm−1, and the relative active substance containing API (% w/w) of the tablet was determined. The data were divided into a training set of 210 samples and a test set of 100 samples by the Duplex algorithm.

2.2. Data Preparation

The raw NIR dataset ( X ) used for predictive modeling consists of size n × p , where n is the total number of samples and p is the spectral variable. The response ( Y ) consists of size n × k , where n is the total number of samples and k is the response. To use the multi-block ensemble approach, the NIR data can be pre-processed differently, resulting in multi-block datasets. For example, if the NIR spectrum ( X ) is pre-processed using ten different pre-processing methods to form ten spectral data blocks, and finally the multiple data blocks are fused and stitched together to form a new feature matrix X i.e., X = [ X 1 ; X 2 ; X 3 ; X 4 ; X 5 ; X 6 ; X 7 ; X 8 ; X 9 ; X 10 ] , where X 1 X 10 are different pre-processing forms (single blocks) of the same spectrum ( X ). In this paper, to demonstrate the potential of the PFCOVSC, 10 different pre-processing data blocks were used: raw data, SNV, MSC, SG smooth, 1st derivative, 2nd derivative, 1st derivative + SNV, 2nd derivative + SNV, 1st derivative + SNV + MSC, 2nd derivative + SNV + MSC fusion were used to extract the valid information. The derivatives are computed using the Savitzky–Golay algorithm with a second-order polynomial and a window size of 15. We selected these 10 preprocessing methods (and their combinations) based on established standards and common practices in the field of near-infrared spectroscopy. These techniques are widely recognized for correcting the most prevalent and impactful physical and chemical interferences in NIR spectra.

2.3. Our Method

The PFCOVSC strategy proposed in this paper is founded on the fCovsel algorithm. fCovsel is a global variable selection technique in the field of chemometrics, typically employed to extract variables exhibiting high covariance with the response variable [26]. In early CovSel algorithms, a crucial step involved computing the covariance through the deflation of the prediction matrix, rendering it a time-consuming process. fCovsel replaces the costly prediction matrix deflation step with a faster Gram-Schmidt step (computation of the deflation of the response and re-orthogonalization of the scores). In cross-validation or multi-block variable screening scenarios, where a large number of variable combinations often need to be explored for model optimization, the speed advantage of fCovsel is self-evident.
The PFCOVSC strategy is structured into three main steps: the first step involves employing the multi-block data fusion technique, which integrates multi-block data processed by various pre-processing methods into a new fusion matrix. The size of this matrix becomes substantial with the inclusion of multi-block data, housing both the valid information produced by each pre-processing method and a significant amount of repetitive or invalid data. The second step involves variable selection by integrating the fCovsel algorithm. It rapidly and continuously extracts variables with high covariance with the response variable from the fusion matrix to create a “feature matrix”. The “feature matrix” is constructed by extracting potentially valid information from each pre-processing method within the preceding large fusion matrix, thereby forming a subset of highly predictive variables. The third step involves utilizing this new “feature matrix” to construct and calibrate the model. The specific steps are described in Algorithm 1 and Figure 1.
The PFCOVSC strategy breaks away from previous methods of applying multi-block data to extract effective complementary information on a block-by-block basis (e.g., strategies such as SPORT, PROTO, PROSAC, etc.) by refining it down to the individual variables and using them as a unit to find information-rich subsets of highly predictive variables. The advantages of this approach are twofold: first, there is no need to consider the cumbersome combination order problem in previous pre-processing optimization. Secondly, by focusing on a per-variable basis, potentially effective information can be extracted more efficiently.
In previous multi-block strategies, effective components are extracted through sequential orthogonal processing or covariance calculation on a block-by-block basis. However, despite containing some complementary information, the pre-processing of each block still retains variables containing redundant and irrelevant information, which unfortunately tend to account for a high percentage of such variables in a block, leading to bias in the selection of blocks by the optimization algorithm. Moreover, the PFCOVSC strategy is faster as it searches for variables based on fCovsel. The fCovsel method efficiently extracts variables by replacing the step of calculating the deflation of the prediction matrix, which incurs significant computational overhead. This advantage is particularly evident in multi-block data scenarios when the number and size of blocks increase. In addition, since fCovsel is a special case of PLS, almost all extensions possible for PLS can be directly applied to fCovSel. Explanatory parameters such as scores and loadings in PLS can also be used to interpret fCovsel, making PFCOVSC highly interpretable [29].
Algorithm 1: Pseudo-code for the PFCOVSC strategy
Input: k  ( n × p ) matrix blocks X 1 , , X K processed by different pre-processing methods, response variable y ( n × 1 ), number of feature variables m.
Output: Feature matrix after fCovsel filtering: S ( n × m ) , rmsec, rmsep after model calibration.
 1:   Initialization: S = {Ø}, The i th selected feature variable: s i (i ≤ m), Parameter:  j = 1
 2:   Construct the n × q fusion matrix: F = X 1 , , X K
 3:   for i < m do
 4:   for j < q do
 5:    s i = a r g   max F j ( F j T y y T F j F j 2 ) ( F j : the j th column of F)
 6:   end for
 7:   if i > 1: s i = s i T 1   t o   i 1 T 1   t o   i 1 T s i (G-S orthogonalization)
 8:    t i = s i s i
 9:    y i + 1 = y i t i t i T y i
 10:   S s i
 11:   end for
 12:    S = s 1 , , s m
 13:   Cross-validation of S to find the optimal number of latent variables and modeling.
 14:   end
Note: All matrices are in bold uppercase.; All vectors are in bold lowercase; constants are in lowercase.
In this paper, to optimize the number of latent variables modeled in each dataset, leave-one-out cross-validation was integrated with PFCOVSC. During the process, the optimal number of latent variables for the final PFCOVSC model was determined by exploring a range of latent variables from 1 to 20 through cross-validation. In addition, according to the number of variables in the dataset, 40 variables from the fCovsel algorithm were initially selected to form a “feature matrix”. Although spectral samples are often characterized by a larger number of variables than samples, most of the variables are potentially redundant or invalid information. 40 variables are sufficient to reflect most of the valid information of the spectral data, and cross-validation is needed in the final PLS modeling step to further find the optimal number of potential variables.
The model performance was assessed using the Root Mean Square Error of Calibration (RMSEC) and the Root Mean Square Error of Prediction (RMSEP). RMSEC, derived from the calibration set, measures how well the model fits the data used to build it. RMSEP, derived from an independent test set, is a more critical metric that evaluates the model’s ability to predict new, unseen samples. The calculations for both are:
RMSE = 1 n i = 1 n y i     y ^ i 2
where y i and y ^ i are the measured and predicted values, respectively, and n is the sample number in the set. Lower values of RMSEC and RMSEP signify better model performance.
All of the computation was carried out on an Intel® Core™ i7-9700 @3.0 GHz CPU and 8 GB memory computer with the Windows 10 system. The faster covariate selection (fCovsel) algorithm was implemented according to the method proposed by Mishra [26], and the MATLAB 2022a code can be found at the associated repository. All calculations discussed in this paper were performed in MATLAB (The Mathworks Inc., Natick, MA, USA).

3. Results and Discussions

3.1. Comparison of PFCOVSC and Single Block Pre-Processing

3.1.1. PFCOVSC and Single Block Pre-Processing

Table 1 presents the results of PLS modeling for the wheat, meat, and tablet datasets using a single preprocessing data block. In the wheat dataset modeling, the preprocessing combination of “2nd derivative + Standard Normal Variate (SNV) + Multiplicative Scatter Correction (MSC)” exhibited superior performance. Compared with the modeling results of the original data block, this combination reduced the Root Mean Square Error of Calibration (RMSEC) by 15% and the Root Mean Square Error of Prediction (RMSEP) by 35%. Additionally, data in Table 1 shows that the PFCOVSC strategy proposed in this study achieved a more significant optimization effect on the wheat dataset: compared with the original data block, it decreased RMSEC and RMSEP by 20% and 50%, respectively, which is clearly superior to the modeling results of the aforementioned single preprocessing block. In the meat dataset modeling, single-block preprocessing schemes have already demonstrated high effectiveness, among which combinations such as “2nd derivative + SNV” and “2nd derivative + SNV + MSC” performed particularly well. Compared with the original data modeling, both combinations reduced RMSEC and RMSEP by more than 50%. Even so, the PFCOVSC strategy still showed notable advantages: compared with the single SNV preprocessing block, the strategy reduced RMSEC and RMSEP by 57% and 59%, respectively; while compared with the more effective “2nd derivative + SNV” combination, it further decreased RMSEC and RMSEP by 9% and 13%. In the tablet dataset modeling, although the performance differences among different single preprocessing blocks were minimal, the modeling performance of the PFCOVSC strategy consistently remained at a more optimal level.
As illustrated in Table 1, several key observations can be drawn regarding the performance of preprocessing methods in spectral data modeling. First, among the extensive array of preprocessing methods tested, only a limited number exhibit practical effectiveness. Second, the selection of suitable preprocessing methods is highly dependent on the characteristics of the specific spectral dataset—no universal preprocessing approach is applicable across all data types. Furthermore, for all three datasets under investigation, the modeling results derived from combined preprocessing strategies (multi-method preprocessing blocks) are significantly superior to those obtained using single preprocessing methods. This phenomenon can be attributed to the complementary nature of information captured by different preprocessing techniques: each method targets distinct types of noise, baseline drift, or spectral distortion (e.g., SNV mitigates scattering effects, while derivatives enhance spectral resolution). When these methods are integrated into a preprocessing ensemble for modeling, the synergistic utilization of their complementary advantages helps to reduce interference more comprehensively and retain valuable spectral information more effectively—ultimately leading to the development of more robust and reliable predictive models.
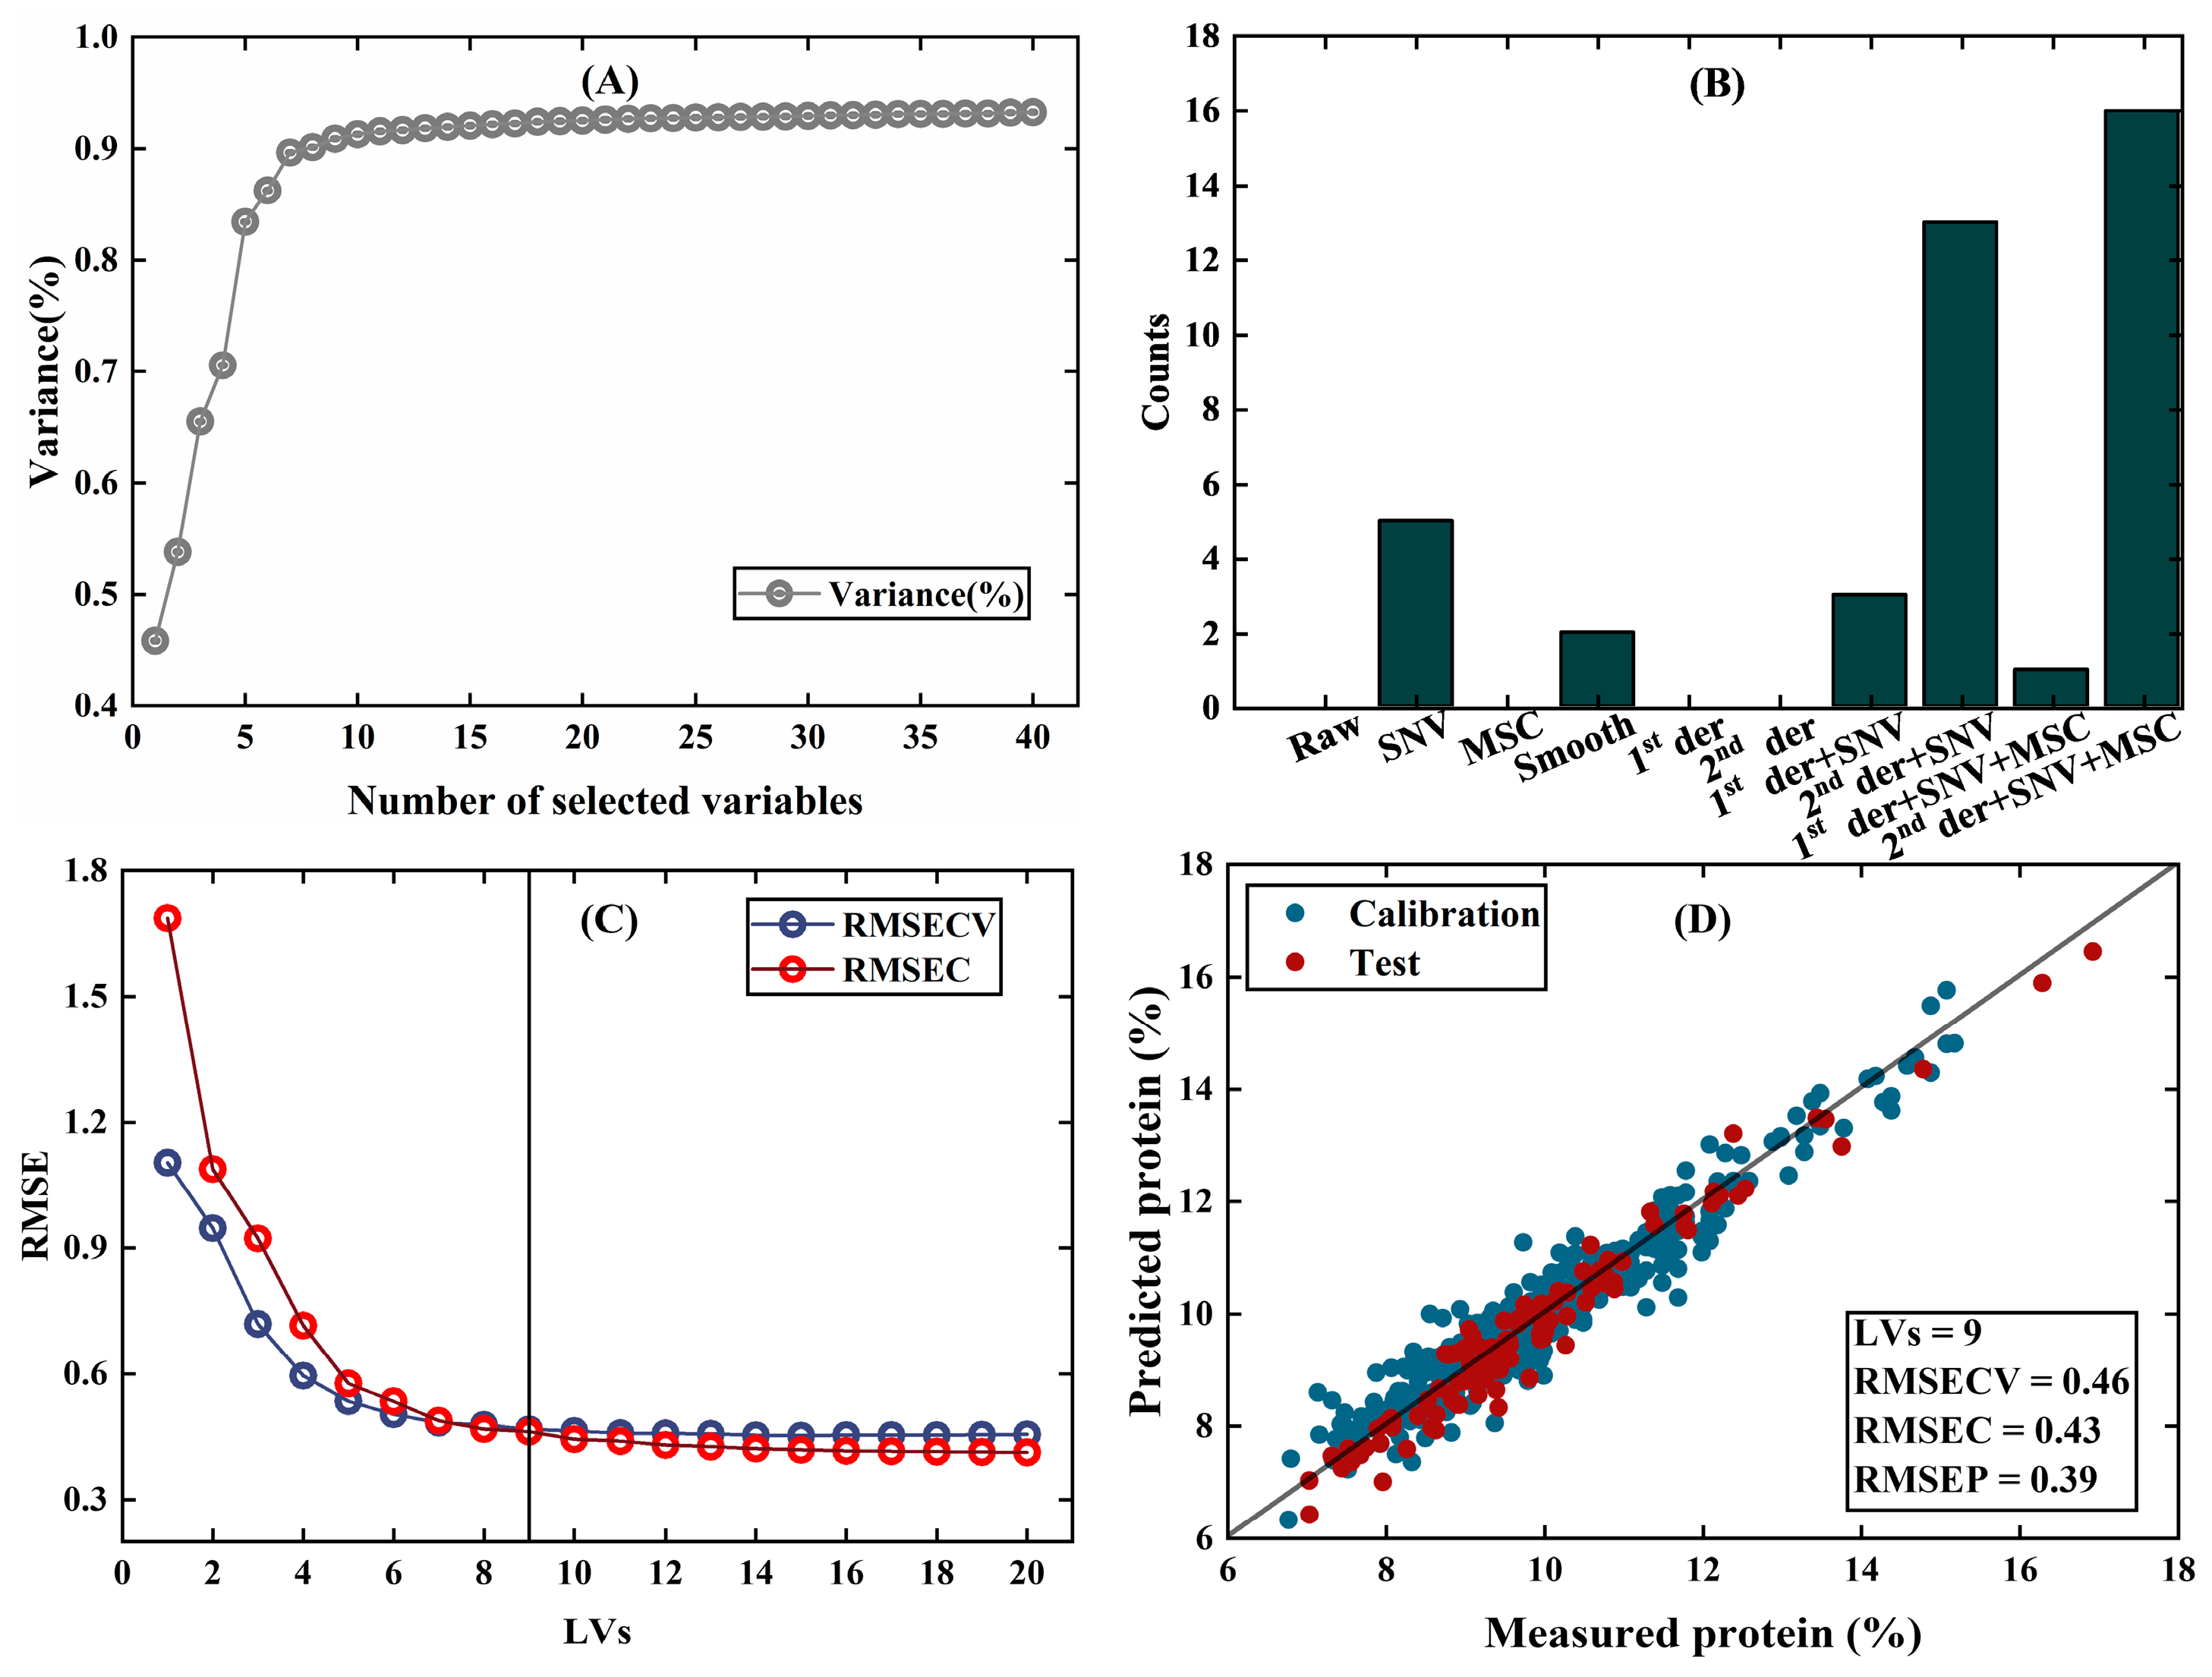
Figure 2 presents the performance of the PFCOVSC modeling approach applied to the wheat dataset. Among the ten pre-processing blocks, the combination of 2nd derivative + SNV + MSC was selected most frequently—16 times in total—indicating that it provided the most valuable information and played a crucial role in constructing the pre-processing ensemble model for the wheat data. Notably, this finding is consistent with the results from the single-block pre-processing comparison.
However, the PFCOVSC strategy for pre-processing ensemble modeling achieved superior results in both RMSEC and RMSEP compared to the best individual pre-processing block (2nd derivative + SNV + MSC), even though the latter itself integrates multiple pre-processing techniques. These outcomes highlight two key advantages: on one hand, they demonstrate the benefit of ensemble modeling in effectively integrating complementary information from various pre-processing methods, thereby enhancing model robustness; on the other hand, they confirm the reliability of the PFCOVSC strategy in leveraging feature information extracted from each pre-processing method via the fCovsel algorithm.
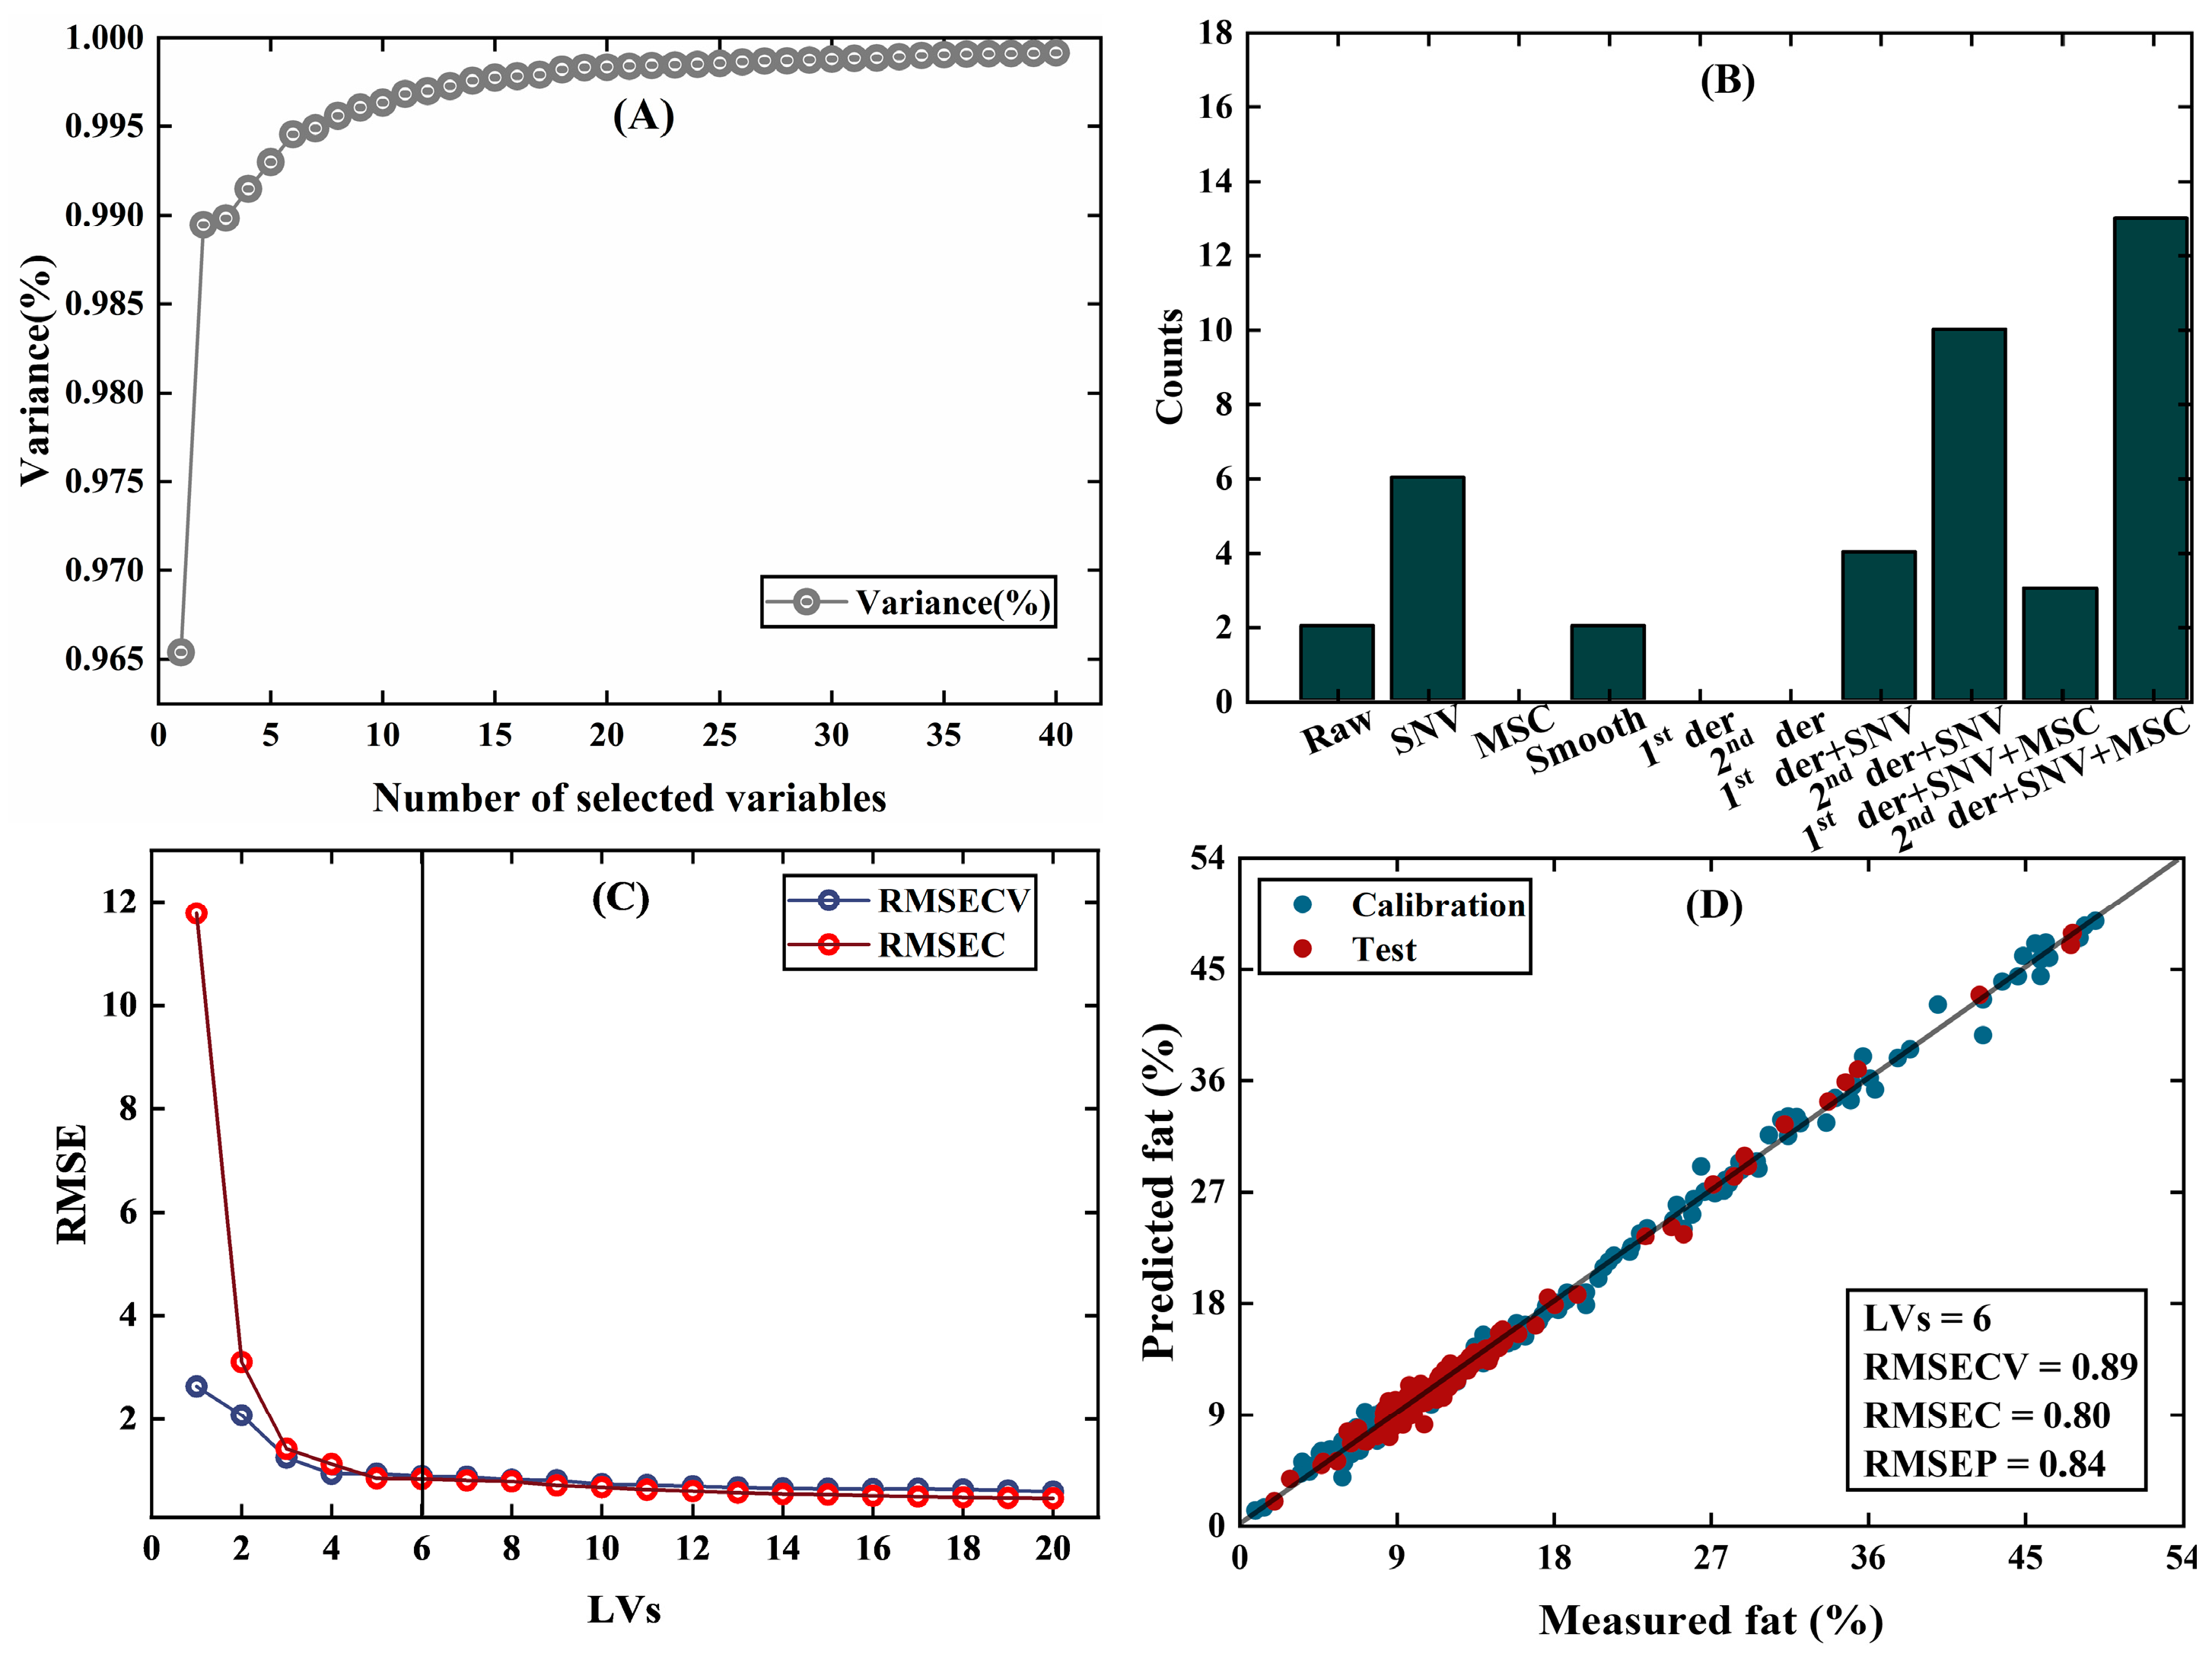
Figure 3 illustrates the performance of the PFCOVSC modeling method on the meat dataset. Compared to the best single-block pre-processing approach (2nd derivatives + SNV + MSC), the PFCOVSC strategy achieved a 10% reduction in RMSEP and decreased the number of latent variables from 9 to 6. These results clearly demonstrate the advantages of the PFCOVSC pre-processing ensemble strategy, which not only improves modeling accuracy but also reduces model complexity by requiring fewer latent variables.
Figure 4 demonstrates the performance of the PFCOVSC modeling approach on the tablet dataset. The key advantage of this strategy lies in its efficiency: it reduces computational time by developing a single PFCOVSC model, eliminating the need to construct multiple single-block PLS models to identify the optimal pre-processing method. Moreover, the PFCOVSC strategy selected only 4 out of the 10 available pre-processing blocks for this dataset. The most frequently chosen blocks were 2nd derivative + SNV + MSC and 2nd derivative + SNV, both of which also performed prominently in the single-block pre-processing evaluations—a trend consistent with the previous two datasets. These findings indicate that the PFCOVSC strategy effectively identifies optimal pre-processing ensembles while extracting meaningful information from individual blocks, demonstrating its value as a robust ensemble modeling tool.

3.1.2. PFCOVSC and Single Block Pre-Processing After fCovsel

Variable selection serves as a reliable approach to extract meaningful information from data and is commonly applied after pre-processing to enhance both the accuracy and interpretability of models. The fCovsel method, employed in the PFCOVSC strategy proposed in this study, is a global variable selection technique. Unlike typical applications where it operates on single datasets, here fCovsel is used to extract information from the multi-block pre-processing ensemble matrices. These large-scale fused matrices incorporate complementary information derived from diverse pre-processing techniques. After variable selection via fCovsel, a model with improved accuracy can be obtained.
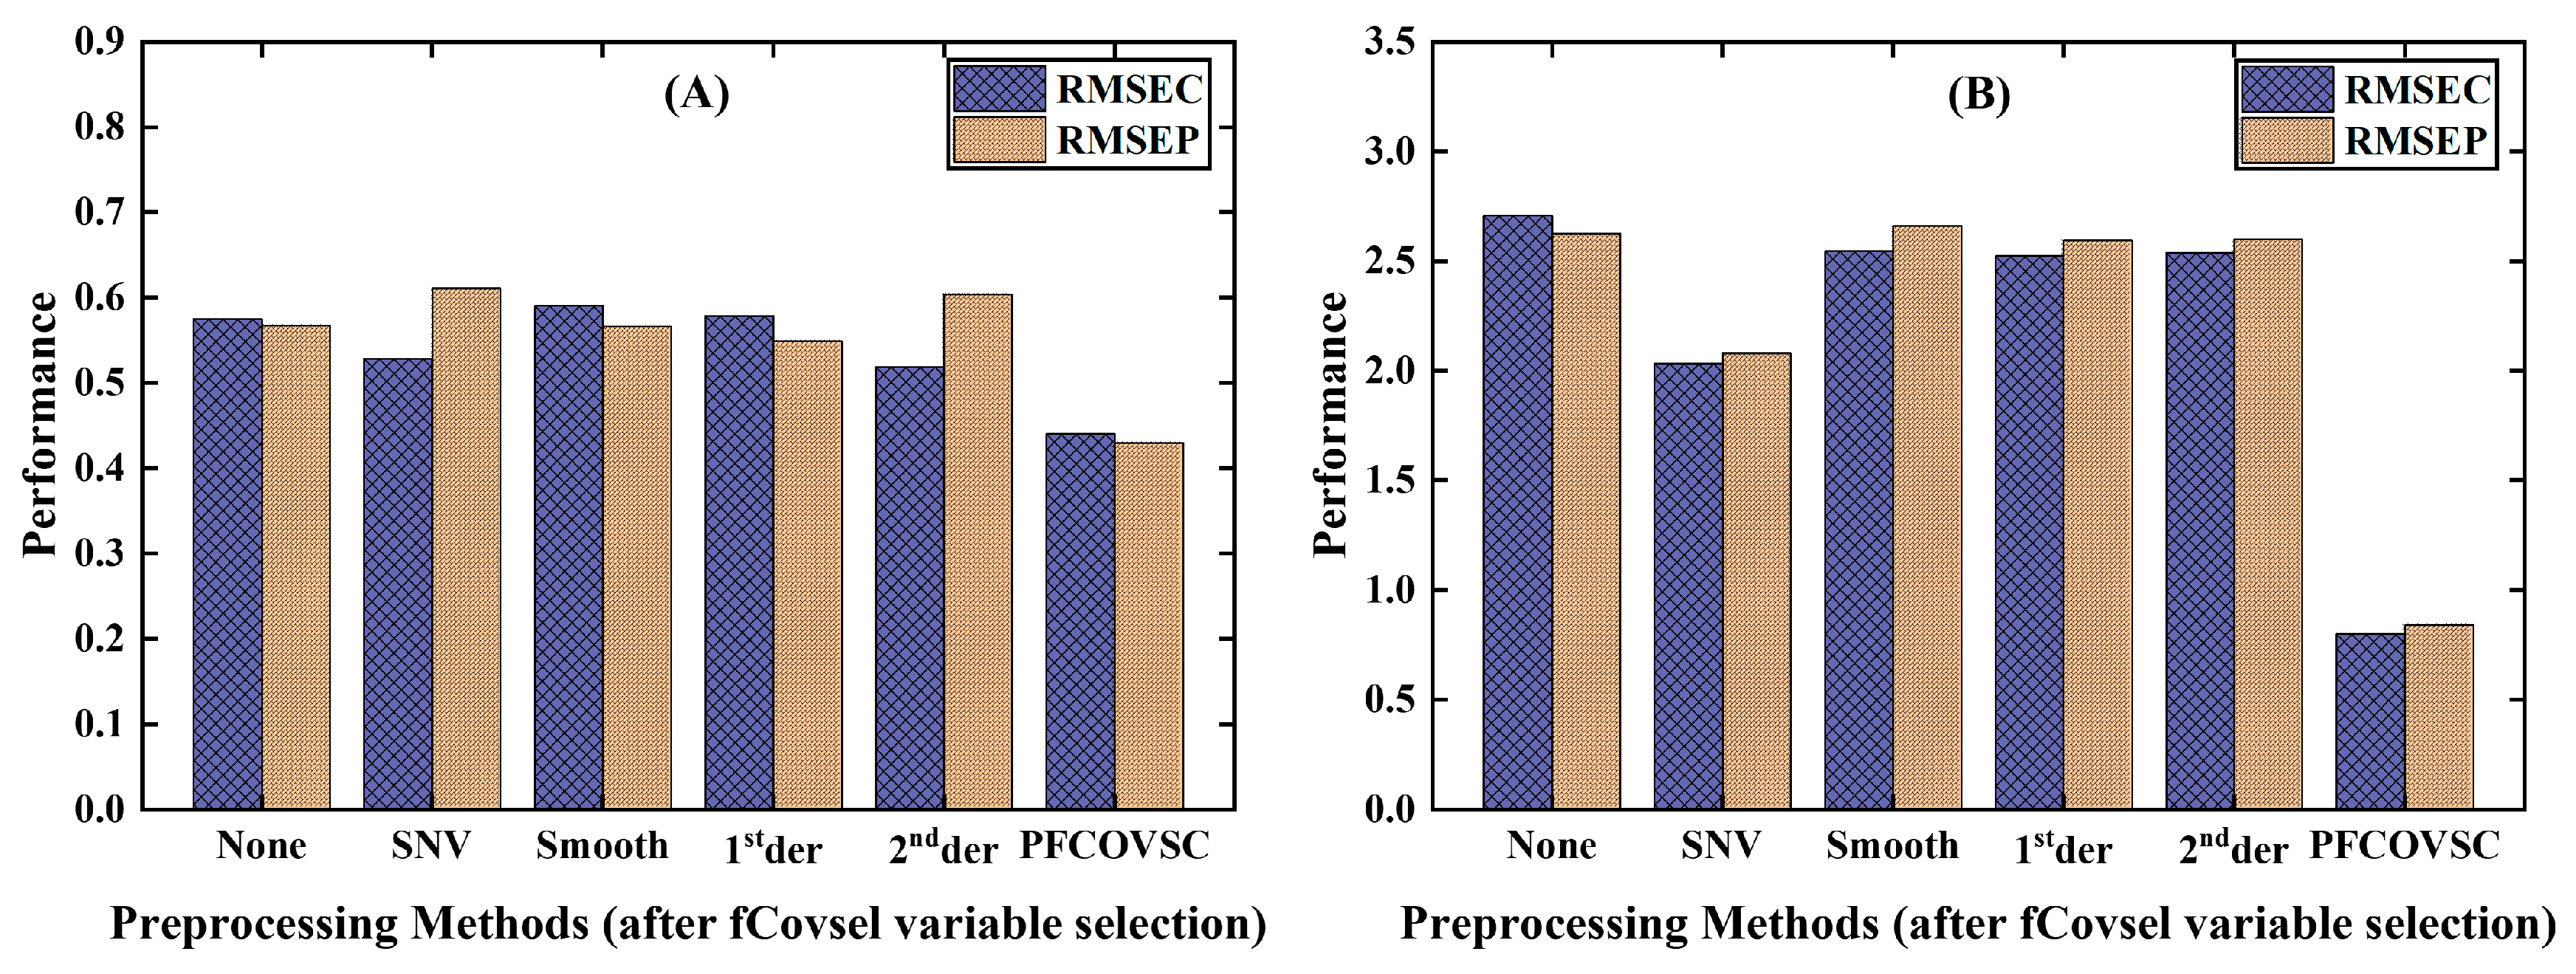
Figure 5 displays the histograms of RMSEC and RMSEP for the wheat and meat datasets, each modeled using fCovsel variable selection after a single pre-processing method. The results reveal that although fCovsel can extract certain useful information, its effectiveness is limited by the inherent constraints of single pre-processing methods. Consequently, it fails to significantly enhance the predictive performance of the models. In contrast, the PFCOVSC strategy achieved superior models and prediction accuracy on both datasets, underscoring the advantage of the integrated approach.
Ultimately, both pre-processing method selection and subsequent variable selection aim to eliminate irrelevant information and extract complementary features for building robust models. The strategy proposed in this work successfully combines pre-processing ensembles and variable selection to effectively extract useful information and improve model performance. This approach may offer a promising direction for the field of spectral pre-processing.

3.2. Comparison of PFCOVSC with SPORT and PROSAC

3.2.1. Prediction Performance

The performance of the PFCOVSC strategy was compared with two commonly used multi-block integration methods, SPORT and PROSAC. As summarized in Table 2, PFCOVSC exhibits several advantages across all three datasets.
On the wheat dataset, PFCOVSC reduced RMSEC and RMSEP by 9% and 17%, respectively, compared to the SPORT strategy. More notably, on the meat dataset, it achieved reductions of 47% in RMSEC and 49% in RMSEP. These improvements are consistent with expectations, as the SPORT strategy relies heavily on the sequential arrangement and fusion of pre-processing blocks—making its performance sensitive to the order and type of blocks used [22]. In contrast, the PFCOVSC strategy removes redundant and irrelevant information through variable-level extraction, leading to more accurate and stable modeling.
On the tablet dataset, both strategies showed comparable modeling performance. A key advantage of PFCOVSC here is its order-independence—it does not require pre-processing blocks to be arranged in a specific sequence. This significantly simplifies the modeling process by eliminating the need for users to manually optimize the order or combination of pre-processing blocks, thereby enhancing practicality and efficiency in ensemble pre-processing applications.
Compared to the PROSAC strategy, the PFCOVSC approach reduced RMSEC and RMSEP by 7% and 13%, respectively, on the wheat dataset. For the meat dataset, both RMSEC and RMSEP were lowered by approximately 20%. Similarly, on the tablet dataset, PFCOVSC achieved reductions of around 3% in both RMSEC and RMSEP. Overall, the proposed strategy demonstrated better modeling performance than PROSAC across all three datasets.
This superior performance can be attributed to the fundamental difference in how the two strategies extract information. PROSAC operates on a block-by-block basis under a “winner-takes-all” principle, where individual blocks compete to contribute information. However, this approach is susceptible to interference from redundant or invalid information within pre-processing blocks, which can lead to the selection of suboptimal or “false-winning” blocks and thus introduce bias into the model.
In contrast, the PFCOVSC strategy uses variables as the basic unit for information extraction. It integrates information across multiple pre-processing blocks at the variable level, enabling a more equitable and accurate competition for meaningful information. This results in the selection of more relevant features and contributes to the development of a more robust and reliable model.

3.2.2. Computational Time

The SPORT strategy requires exploring all combinations of potential variables across different data blocks before selecting the most informative one, a process that often demands substantial computational time and resources. In contrast, the PFCOVSC strategy efficiently extracts meaningful information from pre-processing methods using the fCovsel algorithm. By eliminating the need for prediction matrix deflation during iteration, fCovsel rapidly selects variables with high covariance to the response variable—significantly speeding up variable selection compared to conventional methods. This efficiency allows the PFCOVSC pre-processing ensemble strategy to optimize models quickly.
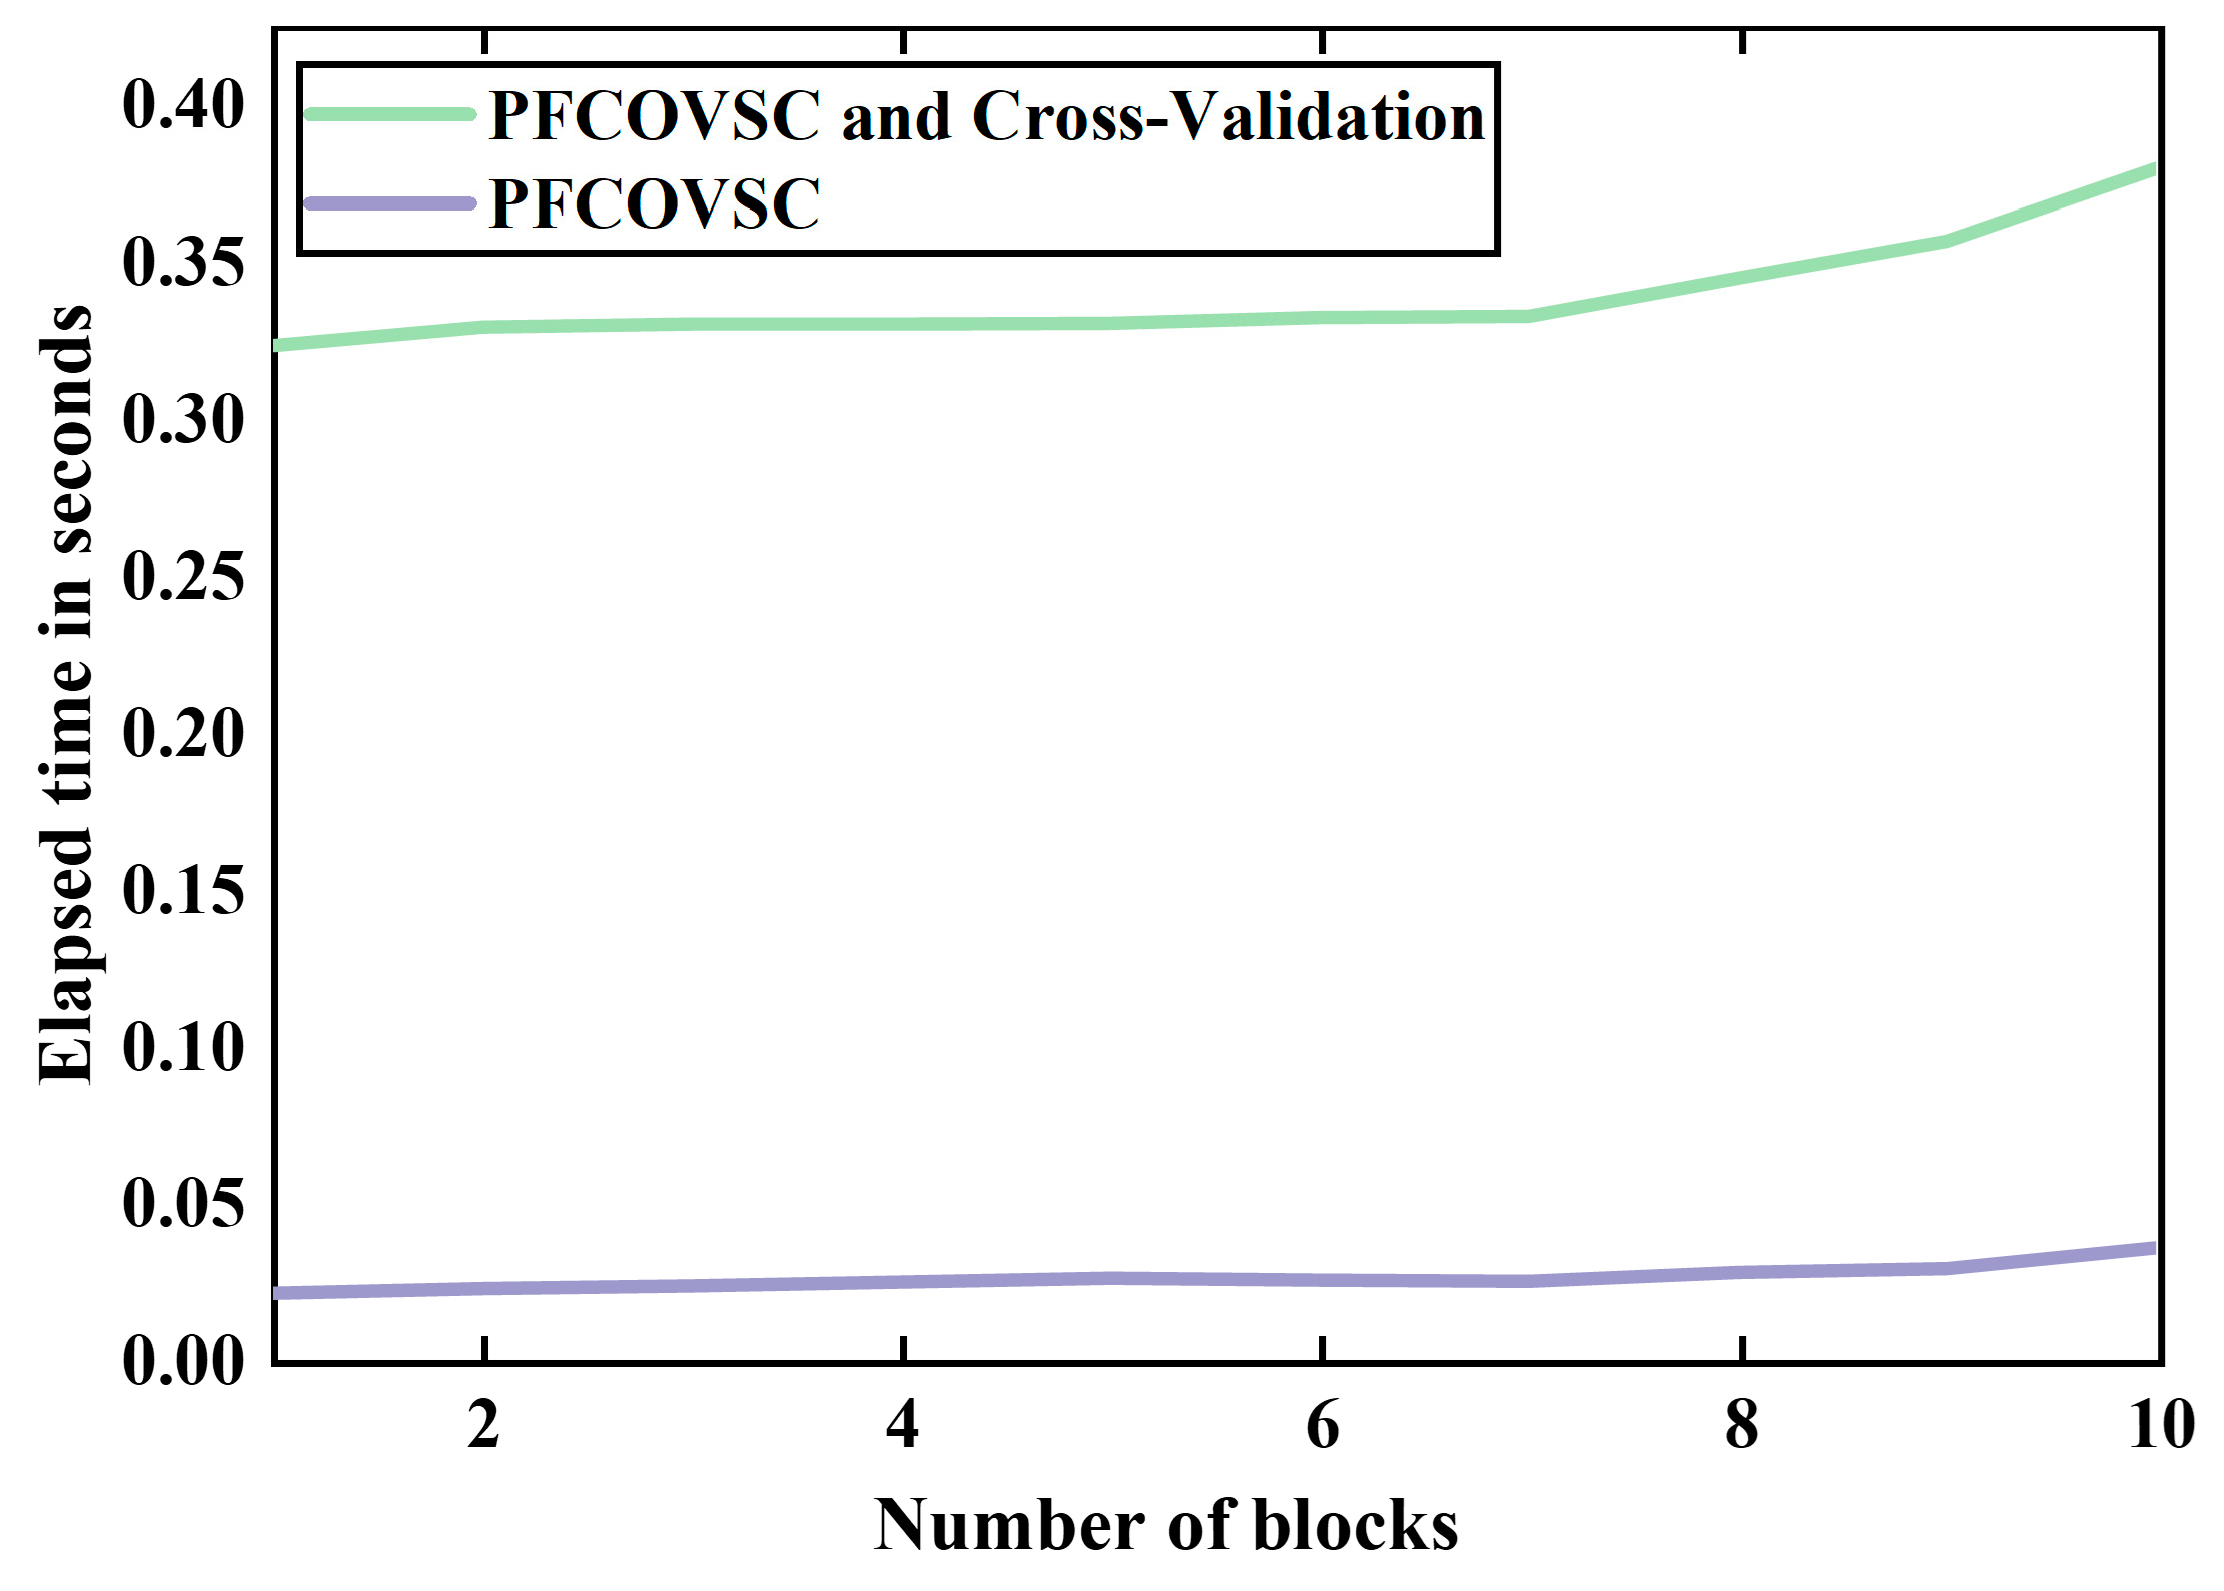
Figure 6 shows the computation time required by the PFCOVSC strategy for different numbers of pre-processing blocks. For instance, on the wheat dataset—where each pre-processing block has dimensions of 415 × 100—modeling time using PFCOVSC remained below 0.05 s even as the number of data blocks increased. Most of the time was consumed by the subsequent cross-validation step; nonetheless, the total time required for both modeling and validation stayed within 0.5 s. This computational efficiency makes PFCOVSC highly suitable for pre-processing ensemble applications—especially in multi-block scenarios—where strategies like SPORT often face high time and resource demands.

3.2.3. Model Interpretability

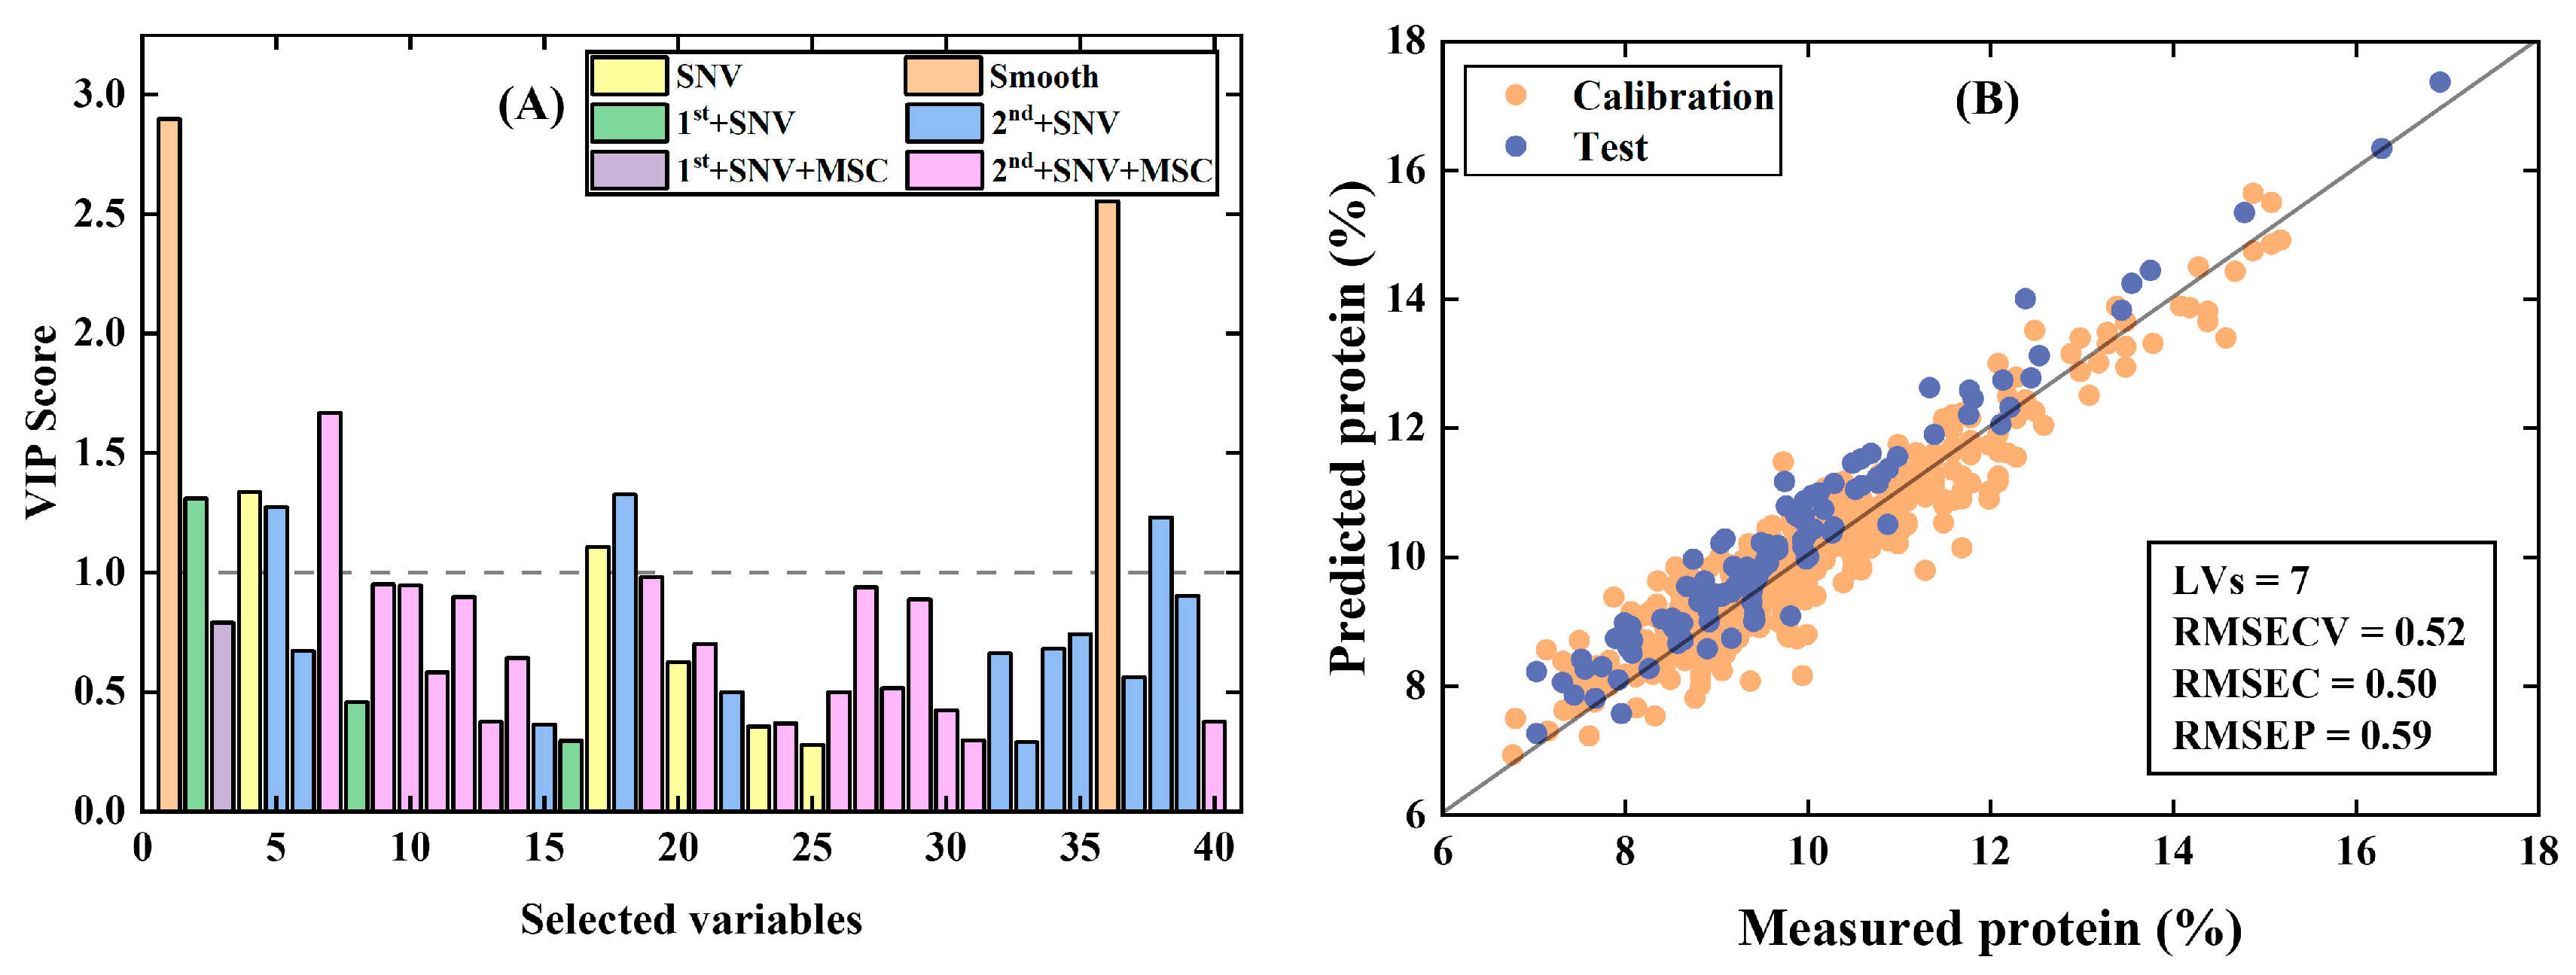
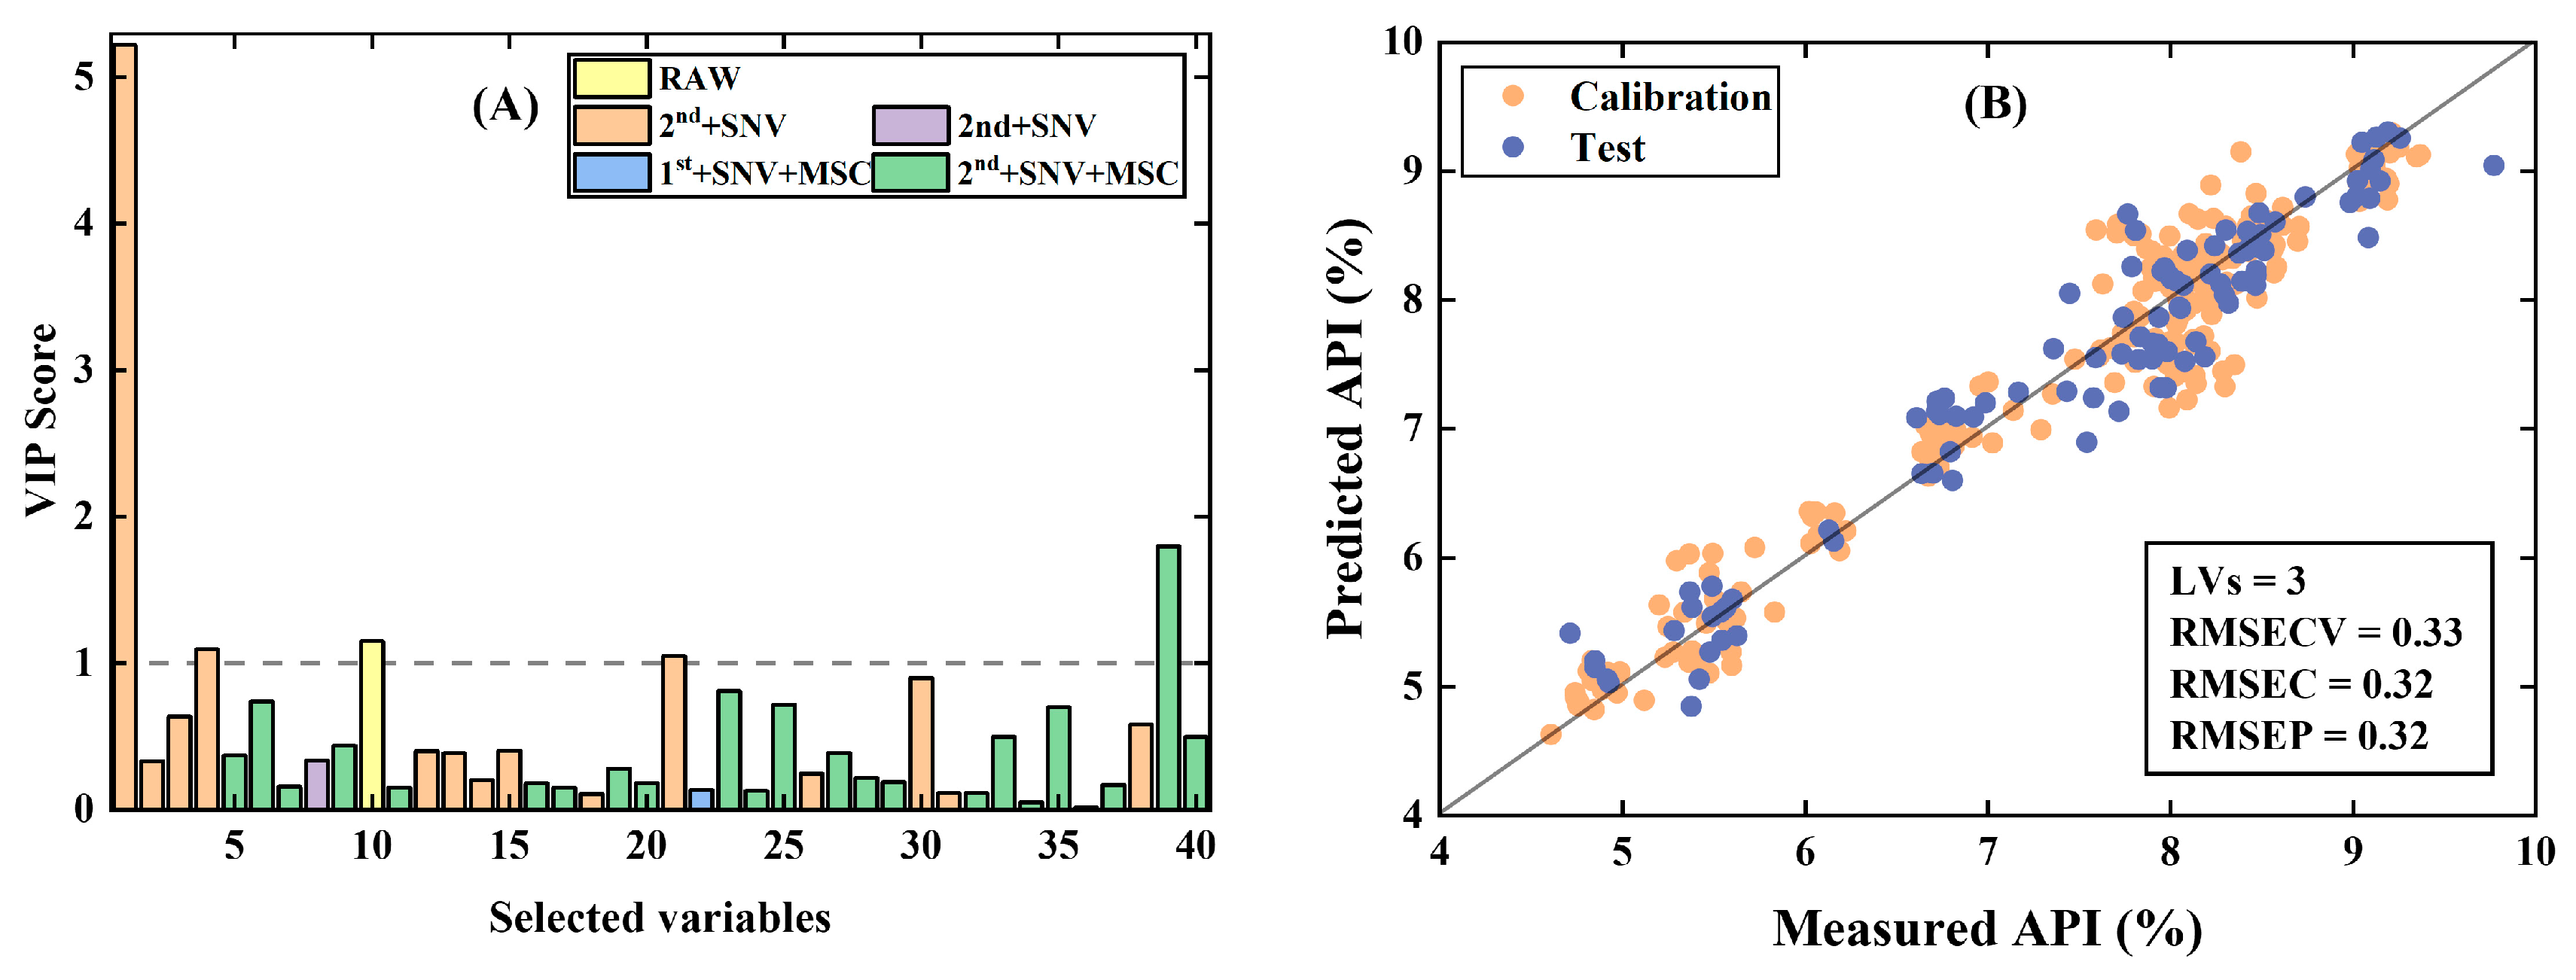
To further investigate the interpretability of the variables—which are distributed across various pre-processing blocks yet contain substantial and meaningful information—the variables selected based on VIP scores were used to rebuild PLS models and evaluated on the three datasets [30]. The results are presented in Figure 7, Figure 8 and Figure 9, respectively.
The findings reveal that models constructed using these few feature variables still outperform those built with strategies such as SPORT and PROSAC on both the meat and tablet datasets—approaches compared earlier in the study. Notably, their performance is even comparable to that of the proposed PFCOVSC strategy, although slightly lower on the wheat dataset, where significantly fewer latent variables were used.
It is important to emphasize that the PFCOVSC strategy offers superior interpretability compared to methods like SPORT or PROSAC. By integrating the fCovsel algorithm with VIP indicators, PFCOVSC identifies a small subset of variables that encapsulate nearly all relevant feature information across pre-processing methods—a capability not provided by other techniques. This enables clear and efficient model interpretation with minimal variables.
Moreover, the above results demonstrate that among a large number of pre-processing data blocks, only a small number of individual methods or their combinations actually contribute meaningfully to model performance. More importantly, even within these useful pre-processing blocks, only certain variables carry relevant information and play a significant role in modeling.
In comparison, the PFCOVSC strategy proposed in this study extracts useful information through variable selection performed after multi-block fusion. This allows the method to build a high-performance quantitative model using a greatly reduced number of variables.

4. Conclusions

In this study, we propose PFCOVSC, a multi-block analysis method designed for pre-processing ensemble modeling of near-infrared spectral data. The approach involves fusing multiple single-block pre-processing techniques into a combined matrix, from which informative variables are selected using the fCovsel algorithm. This effectively integrates multi-block pre-processing information within an ensemble framework.
Tests on three real NIR datasets demonstrated that the PFCOVSC strategy achieved superior performance in pre-processing ensemble modeling, yielding lower RMSE values and requiring fewer latent variables. Notably, while conventional pre-processing optimization typically requires training multiple models—one for each pre-processing method—PFCOVSC accomplishes this in a single run, significantly reducing computational time. Moreover, rather than seeking one optimal pre-processing block, PFCOVSC focuses on extracting meaningful information across different pre-processing methods, highlighting a key advantage of ensemble modeling.
When compared to common ensemble strategies such as SPORT and PROSAC, PFCOVSC exhibited the best modeling performance. In terms of computational efficiency, the entire process—including cross-validation—for handling 10 pre-processing blocks was completed in just 0.4 s, underscoring its speed advantage for multi-block data analysis.
Regarding interpretability, PFCOVSC identifies influential variables using VIP scores, and results show that models based on these selected variables not only maintain high accuracy but also outperform those from SPORT and PROSAC across all datasets. This indicates a strong advantage in model interpretability: the entire model can be explained using only a handful of variables, each easily traceable to its original pre-processing block. These findings highlight the potential of PFCOVSC to facilitate more efficient and interpretable modeling in spectral analysis.

Author Contributions

Conceptualization, Z.X. and X.C.; Methodology, G.H., Z.X. and X.W.; Software, Y.Z. and L.Y.; Validation, G.H., Z.X. and Y.W.; Formal Analysis, Y.W. and W.S.; Investigation, L.Z. and Z.X.; Resources, X.C. and Y.Z.; Data Management, S.A. and Z.X.; Writing—Y.Z., Y.W., and Z.X.; Writing—Review and Editing, Y.Z., Y.W., and Z.X.; Visualization, Y.Z.; Supervision, X.C.; Project management, X.C. and Y.W.; Funding acquisition, L.Z. and X.C. All authors have read and agreed to the published version of the manuscript.

Funding

National Natural Science Foundation of China (62275199); Wenzhou University of Technology School Science and Technology Project (ky202422). Scientific Research Fund of Zhejiang Provincial Education Department (Y202454261).

Data Availability Statement

Data is contained within the article: The original contributions presented in this study are included in the article. Further inquiries can be directed to the corresponding author.

Conflicts of Interest

Data underlying the results presented in this paper are not publicly available at this time but may be obtained from the authors upon reasonable request.

References

  1. Rinnan, Å.; Van Den Berg, F.; Engelsen, S.B. Review of the most common pre-processing techniques for near-infrared spectra. Trac-Trends Anal. Chem. 2009, 28, 1201–1222. [Google Scholar] [CrossRef]
  2. Mishra, P.; Verkleij, T.; Klont, R. Improved prediction of minced pork meat chemical properties with near-infrared spectroscopy by a fusion of scatter-correction techniques. Infrared Phys. Technol. 2021, 113, 4. [Google Scholar] [CrossRef]
  3. Mishra, P.; Lohumi, S.; Khan, H.A.; Nordon, A. Close-range hyperspectral imaging of whole plants for digital phenotyping: Recent applications and illumination correction approaches. Comput. Electron. Agric. 2020, 178, 11. [Google Scholar] [CrossRef]
  4. Amigo, J.M.; Babamoradi, H.; Elcoroaristizabal, S. Hyperspectral image analysis. A tutorial. Anal. Chim. Acta 2015, 896, 34–51. [Google Scholar] [CrossRef]
  5. Bro, R. Multivariate calibration: What is in chemometrics for the analytical chemist? Anal. Chim. Acta 2003, 500, 185–194. [Google Scholar] [CrossRef]
  6. Saeys, W.; Do Trong, N.N.; Van Beers, R.; Nicolaï, B.M. Multivariate calibration of spectroscopic sensors for postharvest quality evaluation: A review. Postharvest Biol. Technol. 2019, 158, 110981. [Google Scholar] [CrossRef]
  7. van den Berg, R.A.; Hoefsloot, H.C.J.; Westerhuis, J.A.; Smilde, A.K.; Van Der Werf, M.J. Centering, scaling, and transformations: Improving the biological information content of metabolomics data. Bmc Genom. 2006, 7, 15. [Google Scholar] [CrossRef]
  8. Roger, J.M.; Biancolillo, A.; Marini, F. Sequential preprocessing through ORThogonalization (SPORT) and its application to near infrared spectroscopy. Chemom. Intell. Lab. Syst. 2020, 199, 4. [Google Scholar] [CrossRef]
  9. Barnes, R.J.; Dhanoa, M.S.; Lister, S.J. Standard Normal Variate Transformation and De-Trending of Near-Infrared Diffuse Reflectance Spectra. Appl. Spectrosc. 1989, 43, 772–777. [Google Scholar] [CrossRef]
  10. Isaksson, T.; Næs, T. The Effect of Multiplicative Scatter Correction (MSC) and Linearity Improvement in NIR Spectroscopy. Appl. Spectrosc. 1988, 42, 1273–1284. [Google Scholar] [CrossRef]
  11. Steinier, J.; Termonia, Y.; Deltour, J. Smoothing and differentiation of data by simplified least square procedure. Anal. Chem. 1972, 44, 1906–1909. [Google Scholar] [CrossRef]
  12. Xu, L.; Zhou, Y.-P.; Tang, L.-J.; Wu, H.-L.; Jiang, J.-H.; Shen, G.-L.; Yu, R.-Q. Ensemble preprocessing of near-infrared (NIR) spectra for multivariate calibration. Anal. Chim. Acta 2008, 616, 138–143. [Google Scholar] [CrossRef] [PubMed]
  13. Engel, J.; Gerretzen, J.; Szymańska, E.; Jansen, J.J.; Downey, G.; Blanchet, L.; Buydens, L.M.C. Breaking with trends in pre-processing? Trends Anal. Chem. 2013, 50, 96–106. [Google Scholar] [CrossRef]
  14. Gabrielsson, J.; Jonsson, H.; Airiau, C.; Schmidt, B.; Escott, R.; Trygg, J. OPLS methodology for analysis of pre-processing effects on spectroscopic data. Chemom. Intell. Lab. Syst. 2006, 84, 153–158. [Google Scholar] [CrossRef]
  15. Gerretzen, J.; Szymańska, E.; Jansen, J.J.; Bart, J.; van Manen, H.-J.; Heuvel, E.R.v.D.; Buydens, L.M.C. Simple and Effective Way for Data Preprocessing Selection Based on Design of Experiments. Anal. Chem. 2015, 87, 12096–12103. [Google Scholar] [CrossRef]
  16. Torniainen, J.; Afara, I.O.; Prakash, M.; Sarin, J.K.; Stenroth, L.; Töyräs, J. Open-source python module for automated preprocessing of near infrared spectroscopic data. Anal. Chim. Acta 2020, 1108, 1–9. [Google Scholar] [CrossRef]
  17. Martyna, A.; Menżyk, A.; Damin, A.; Michalska, A.; Martra, G.; Alladio, E.; Zadora, G. Improving discrimination of Raman spectra by optimising preprocessing strategies on the basis of the ability to refine the relationship between variance components. Chemom. Intell. Lab. Syst. 2020, 202, 16. [Google Scholar] [CrossRef]
  18. Mishra, P.; Roger, J.M.; Rutledge, D.N.; Woltering, E. SPORT pre-processing can improve near-infrared quality prediction models for fresh fruits and agro-materials. Postharvest Biol. Technol. 2020, 168, 10. [Google Scholar] [CrossRef]
  19. Mishra, P.; Nordon, A.; Roger, J.M. Improved prediction of tablet properties with near-infrared spectroscopy by a fusion of scatter correction techniques. J. Pharm. Biomed. Anal. 2021, 192, 4. [Google Scholar] [CrossRef]
  20. Mishra, P.; Roger, J.M.; Rutledge, D.N. A short note on achieving similar performance to deep learning with practical chemometrics. Chemom. Intell. Lab. Syst. 2021, 214, 6. [Google Scholar] [CrossRef]
  21. Mishra, P.; Biancolillo, A.; Roger, J.M.; Marini, F.; Rutledge, D.N. New data preprocessing trends based on ensemble of multiple preprocessing techniques. Trac-Trends Anal. Chem. 2020, 132, 12. [Google Scholar] [CrossRef]
  22. Mishra, P.; Roger, J.M.; Marini, F.; Biancolillo, A.; Rutledge, D.N. Pre-processing ensembles with response oriented sequential alternation calibration (PROSAC): A step towards ending the pre-processing search and optimization quest for near-infrared spectral modelling. Chemom. Intell. Lab. Syst. 2022, 222, 10. [Google Scholar] [CrossRef]
  23. Mishra, P.; Roger, J.-M.; Jouan-Rimbaud-Bouveresse, D.; Biancolillo, A.; Marini, F.; Nordon, A.; Rutledge, D.N. Recent trends in multi-block data analysis in chemometrics for multi- source data integration. Trac-Trends Anal. Chem. 2021, 137, 15. [Google Scholar] [CrossRef]
  24. Roger, J.M.; Palagos, B.; Bertrand, D.; Fernandez-Ahumada, E. CovSel: Variable selection for highly multivariate and multi-response calibration Application to IR spectroscopy. Chemom. Intell. Lab. Syst. 2011, 106, 216–223. [Google Scholar] [CrossRef]
  25. Mishra, P.; Metz, M.; Marini, F.; Biancolillo, A.; Rutledge, D.N. Response oriented covariates selection (ROCS) for fast block order- and scale-independent variable selection in multi-block scenarios. Chemom. Intell. Lab. Syst. 2022, 224, 9. [Google Scholar] [CrossRef]
  26. Mishra, P. A brief note on a new faster covariate’s selection (fCovSel) algorithm. J. Chemom. 2022, 36, e3397. [Google Scholar] [CrossRef]
  27. Nielsen, J.P.; Pedersen, D.K.; Munck, L. Development of nondestructive screening methods for single kernel characterization of wheat. Cereal Chem. 2003, 80, 274–280. [Google Scholar] [CrossRef]
  28. Borggaard, C.; Thodberg, H.H. Optimal minimal neural interpretation of spectra. Anal. Chem. 1992, 64, 545–551. [Google Scholar] [CrossRef]
  29. Dyrby, M.; Engelsen, S.B.; Nørgaard, L.; Bruhn, M.; Lundsberg-Nielsen, L. Chemometric Quantitation of the Active Substance (Containing C≡N) in a Pharmaceutical Tablet Using Near-Infrared (NIR) Transmittance and NIR FT-Raman Spectra. Appl. Spectrosc. 2002, 56, 579–585. [Google Scholar] [CrossRef]
  30. Tran, T.N.; Afanador, N.L.; Buydens, L.M.C.; Blanchet, L. Interpretation of variable importance in Partial Least Squares with Significance Multivariate Correlation (sMC). Chemom. Intell. Lab. Syst. 2014, 138, 153–160. [Google Scholar] [CrossRef]
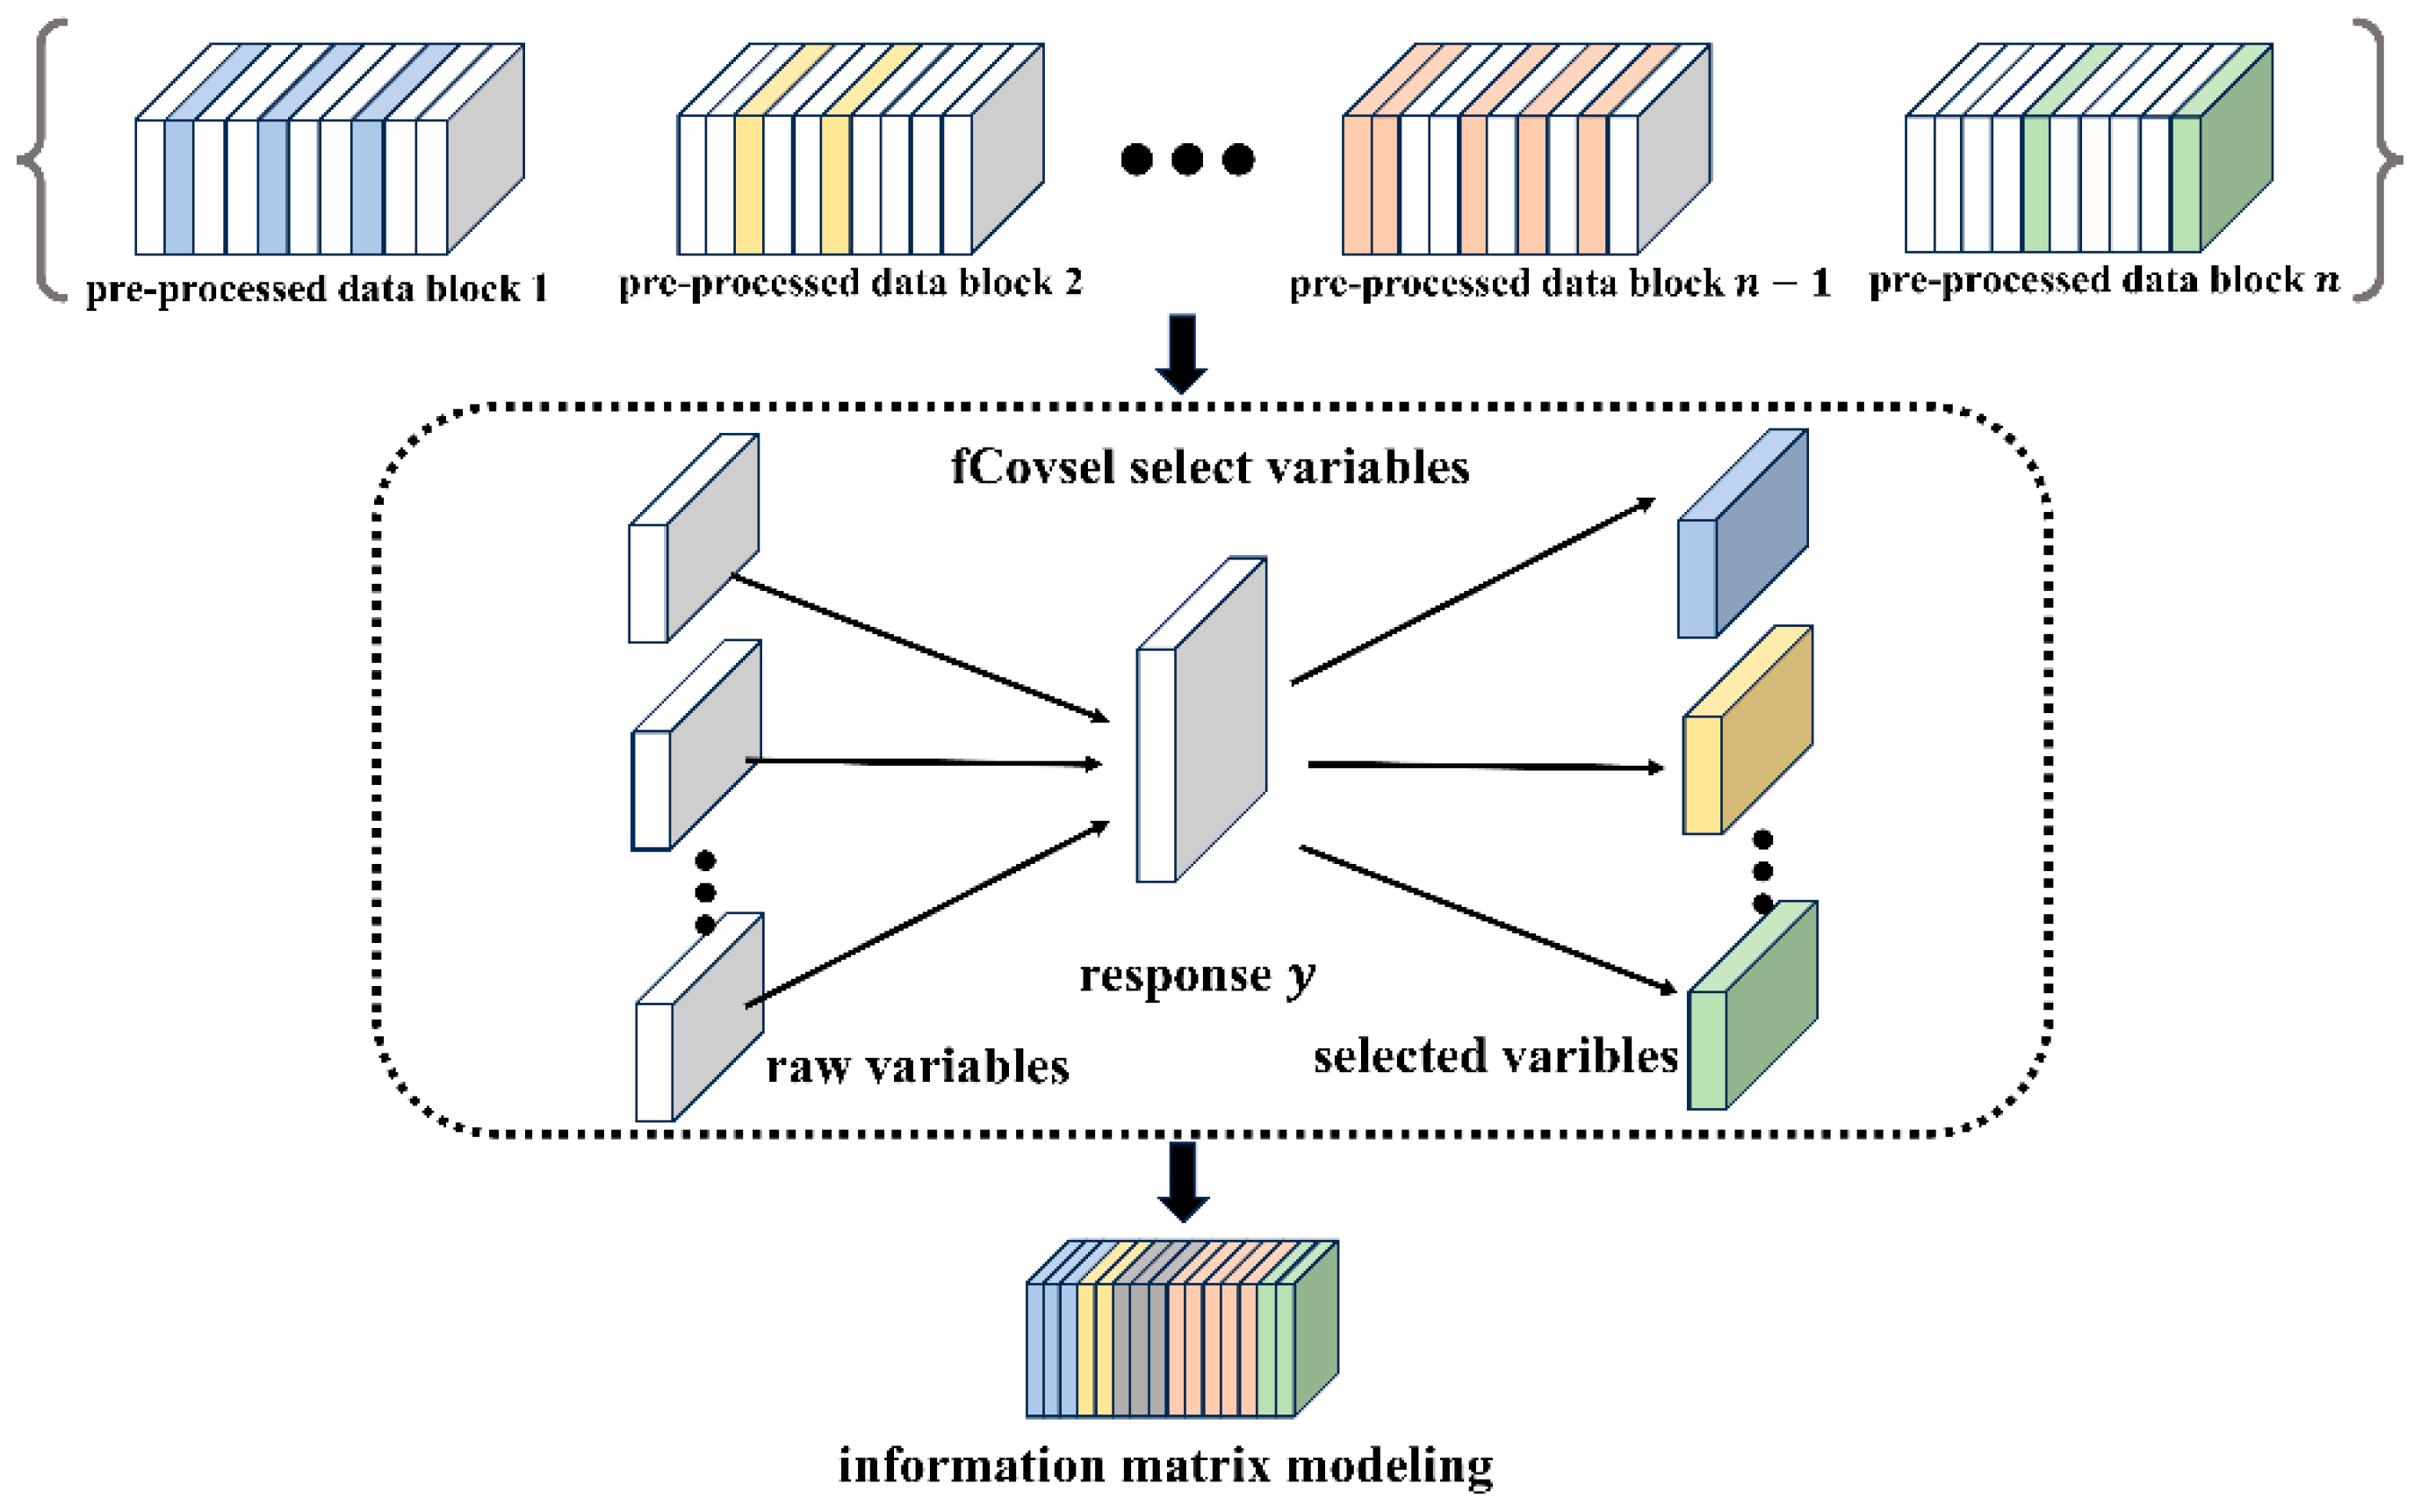
Figure 1. Flowchart of PFCOVSC strategy.
Applsci 15 11325 g001
Figure 2. Performance of PFCOVSC modeling on the wheat dataset: (A) 40 variables initially selected by PFCOVSC, (B) Number of variables selected by PFCOVSC for each pre-processing block, (C) PLS cross-validation plot and (D) Plot of PFCOVSC prediction results.
Applsci 15 11325 g002
Figure 3. Performance of PFCOVSC modeling on the meat dataset: (A) 40 variables initially selected by PFCOVSC, (B) Number of variables selected by PFCOVSC for each pre-processing block, (C) PLS cross-validation plot and (D) Plot of PFCOVSC prediction results.
Applsci 15 11325 g003
Figure 4. Performance of PFCOVSC modeling on the tablet dataset: (A) 40 variables initially selected by PFCOVSC, (B) Number of variables selected by PFCOVSC for each pre-processing block, (C) PLS cross-validation plot and (D) Plot of PFCOVSC prediction results.
Applsci 15 11325 g004
Figure 5. (A,B) show the results of wheat and meat data after a single pre-processing method using fCovsel variable selection modeling compared to the PFCOVSC strategy, respectively.
Applsci 15 11325 g005
Figure 6. Variation in the time taken to model the PFCOVSC pre-processing ensembles strategy as the number of pre-processing data blocks increases.
Applsci 15 11325 g006
Figure 7. For the wheat dataset: (A) VIP scores of each variable after modeling with the PFCOVSC strategy; (B) results of PLS modeling for variables with VIP indexes higher than 1.
Applsci 15 11325 g007
Figure 8. For the meat dataset: (A) VIP scores for each variable after modeling with the PFCOVSC strategy; (B) Results of PLS modeling for variables with VIP indexes higher than 1.
Applsci 15 11325 g008
Figure 9. On the tablet dataset: (A) VIP scores for each variable after modeling the PFCOVSC strategy; (B) Results of PLS modeling for variables with VIP indexes higher than 1.
Applsci 15 11325 g009
Table 1. PLS modeling results for the three datasets in a single pre-processing data block and PFCOVSC.
Pre-TreatmentWheatMeatTablet
LVsRMSECRMSEPLVsRMSECRMSEPLVsRMSECRMSEP
-100.540.78122.022.0350.340.38
SNV100.520.6851.882.0540.360.40
MSC90.540.8652.192.2640.320.33
SG-15-2-0110.520.7662.922.8150.340.38
SG-15-2-1
(1st der)
70.620.7492.552.6440.330.36
SG-15-2-2
(2nd der)
80.510.74142.072.2430.340.37
1st der + SNV80.480.5861.441.6520.330.33
2nd der + SNV50.470.5140.880.9730.310.32
1st der + SNV + MSC70.480.6172.843.2830.310.32
2nd der + SNV + MSC50.460.5190.800.9320.310.32
PFCOVSC90.430.3960.800.8430.310.33
Table 2. Modeling results of the three datasets on the three multi-block strategies.
StrategyWheatMeatTablets
LVsRMSECRMSEPLVsRMSECRMSEPLVsRMSECRMSEP
SPORT [a]-0.470.47-1.501.65-0.270.33
PROSAC50.460.4530.991.0340.320.34
PFCOVSC90.430.3960.800.8430.310.33
[a] Results from the Ref. [8].
Disclaimer/Publisher’s Note: The statements, opinions and data contained in all publications are solely those of the individual author(s) and contributor(s) and not of MDPI and/or the editor(s). MDPI and/or the editor(s) disclaim responsibility for any injury to people or property resulting from any ideas, methods, instructions or products referred to in the content.