Segmentation Algorithms in Fundus Images: A Review of Digital Image Analysis Techniques
Abstract
1. Introduction
2. Materials and Methods
2.1. Research Motivation
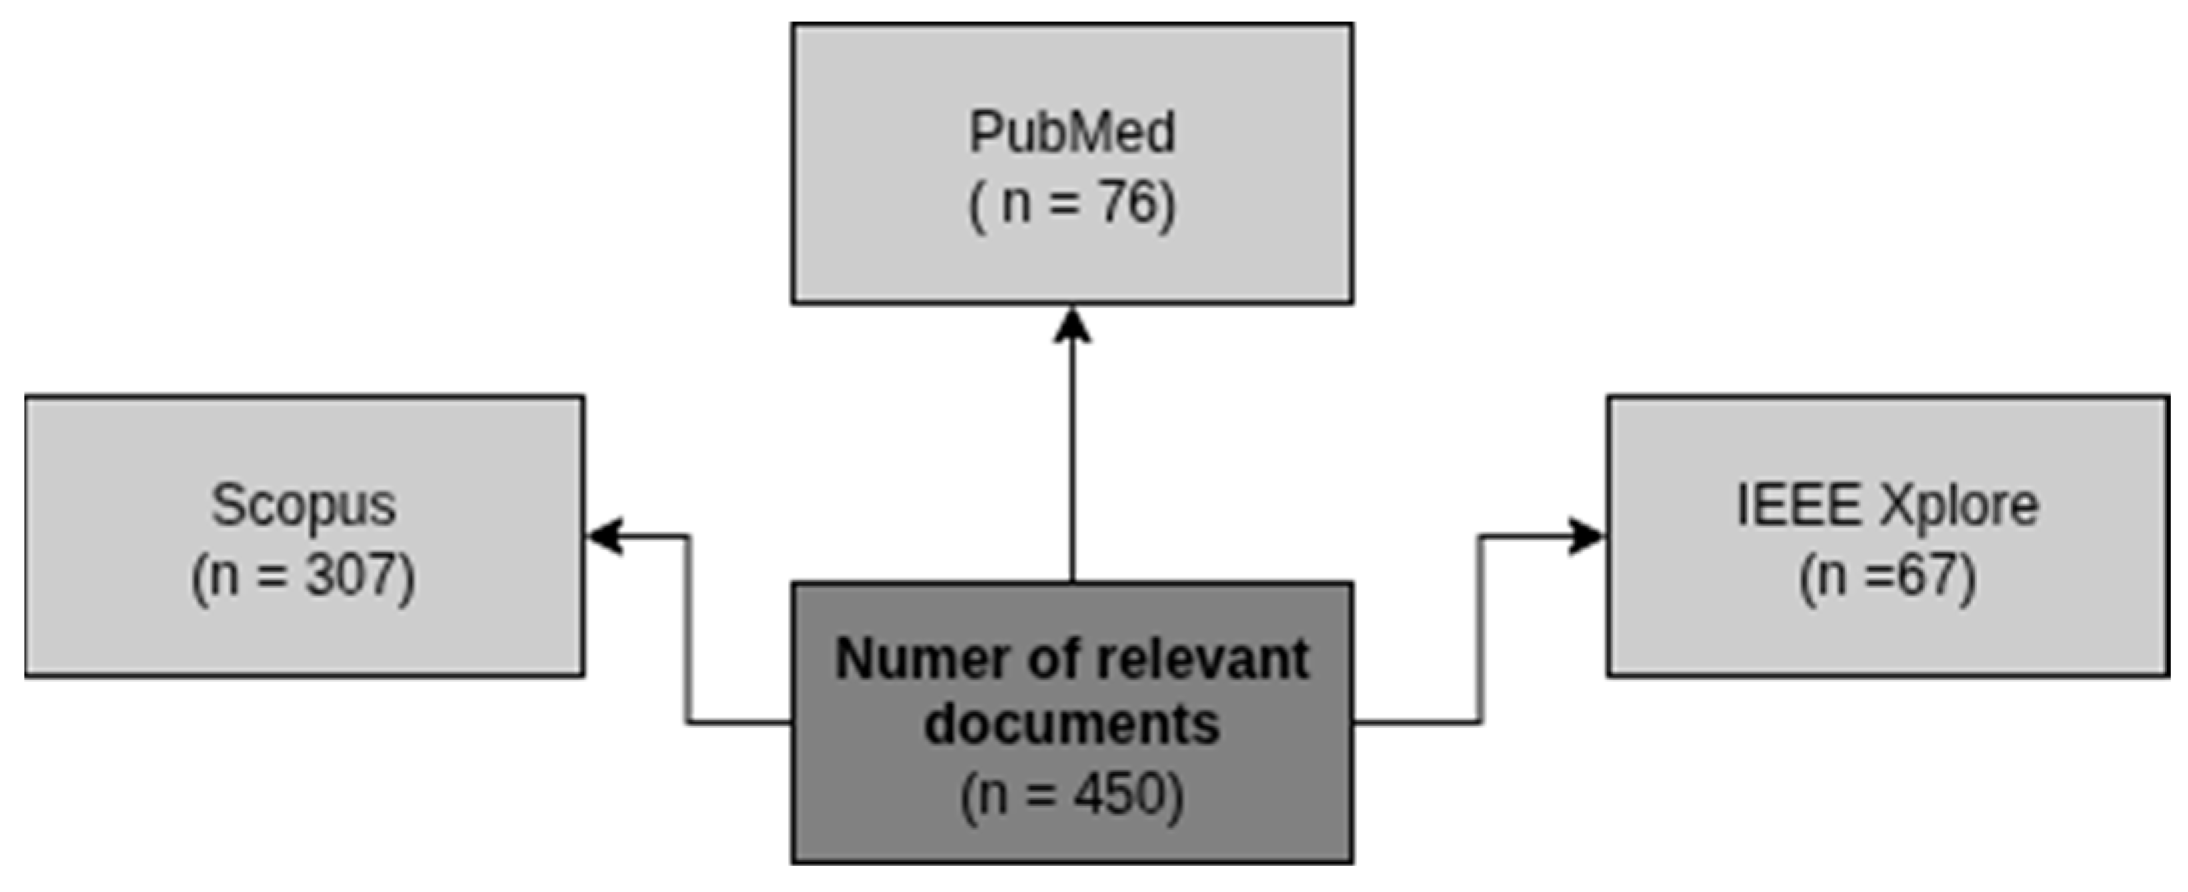
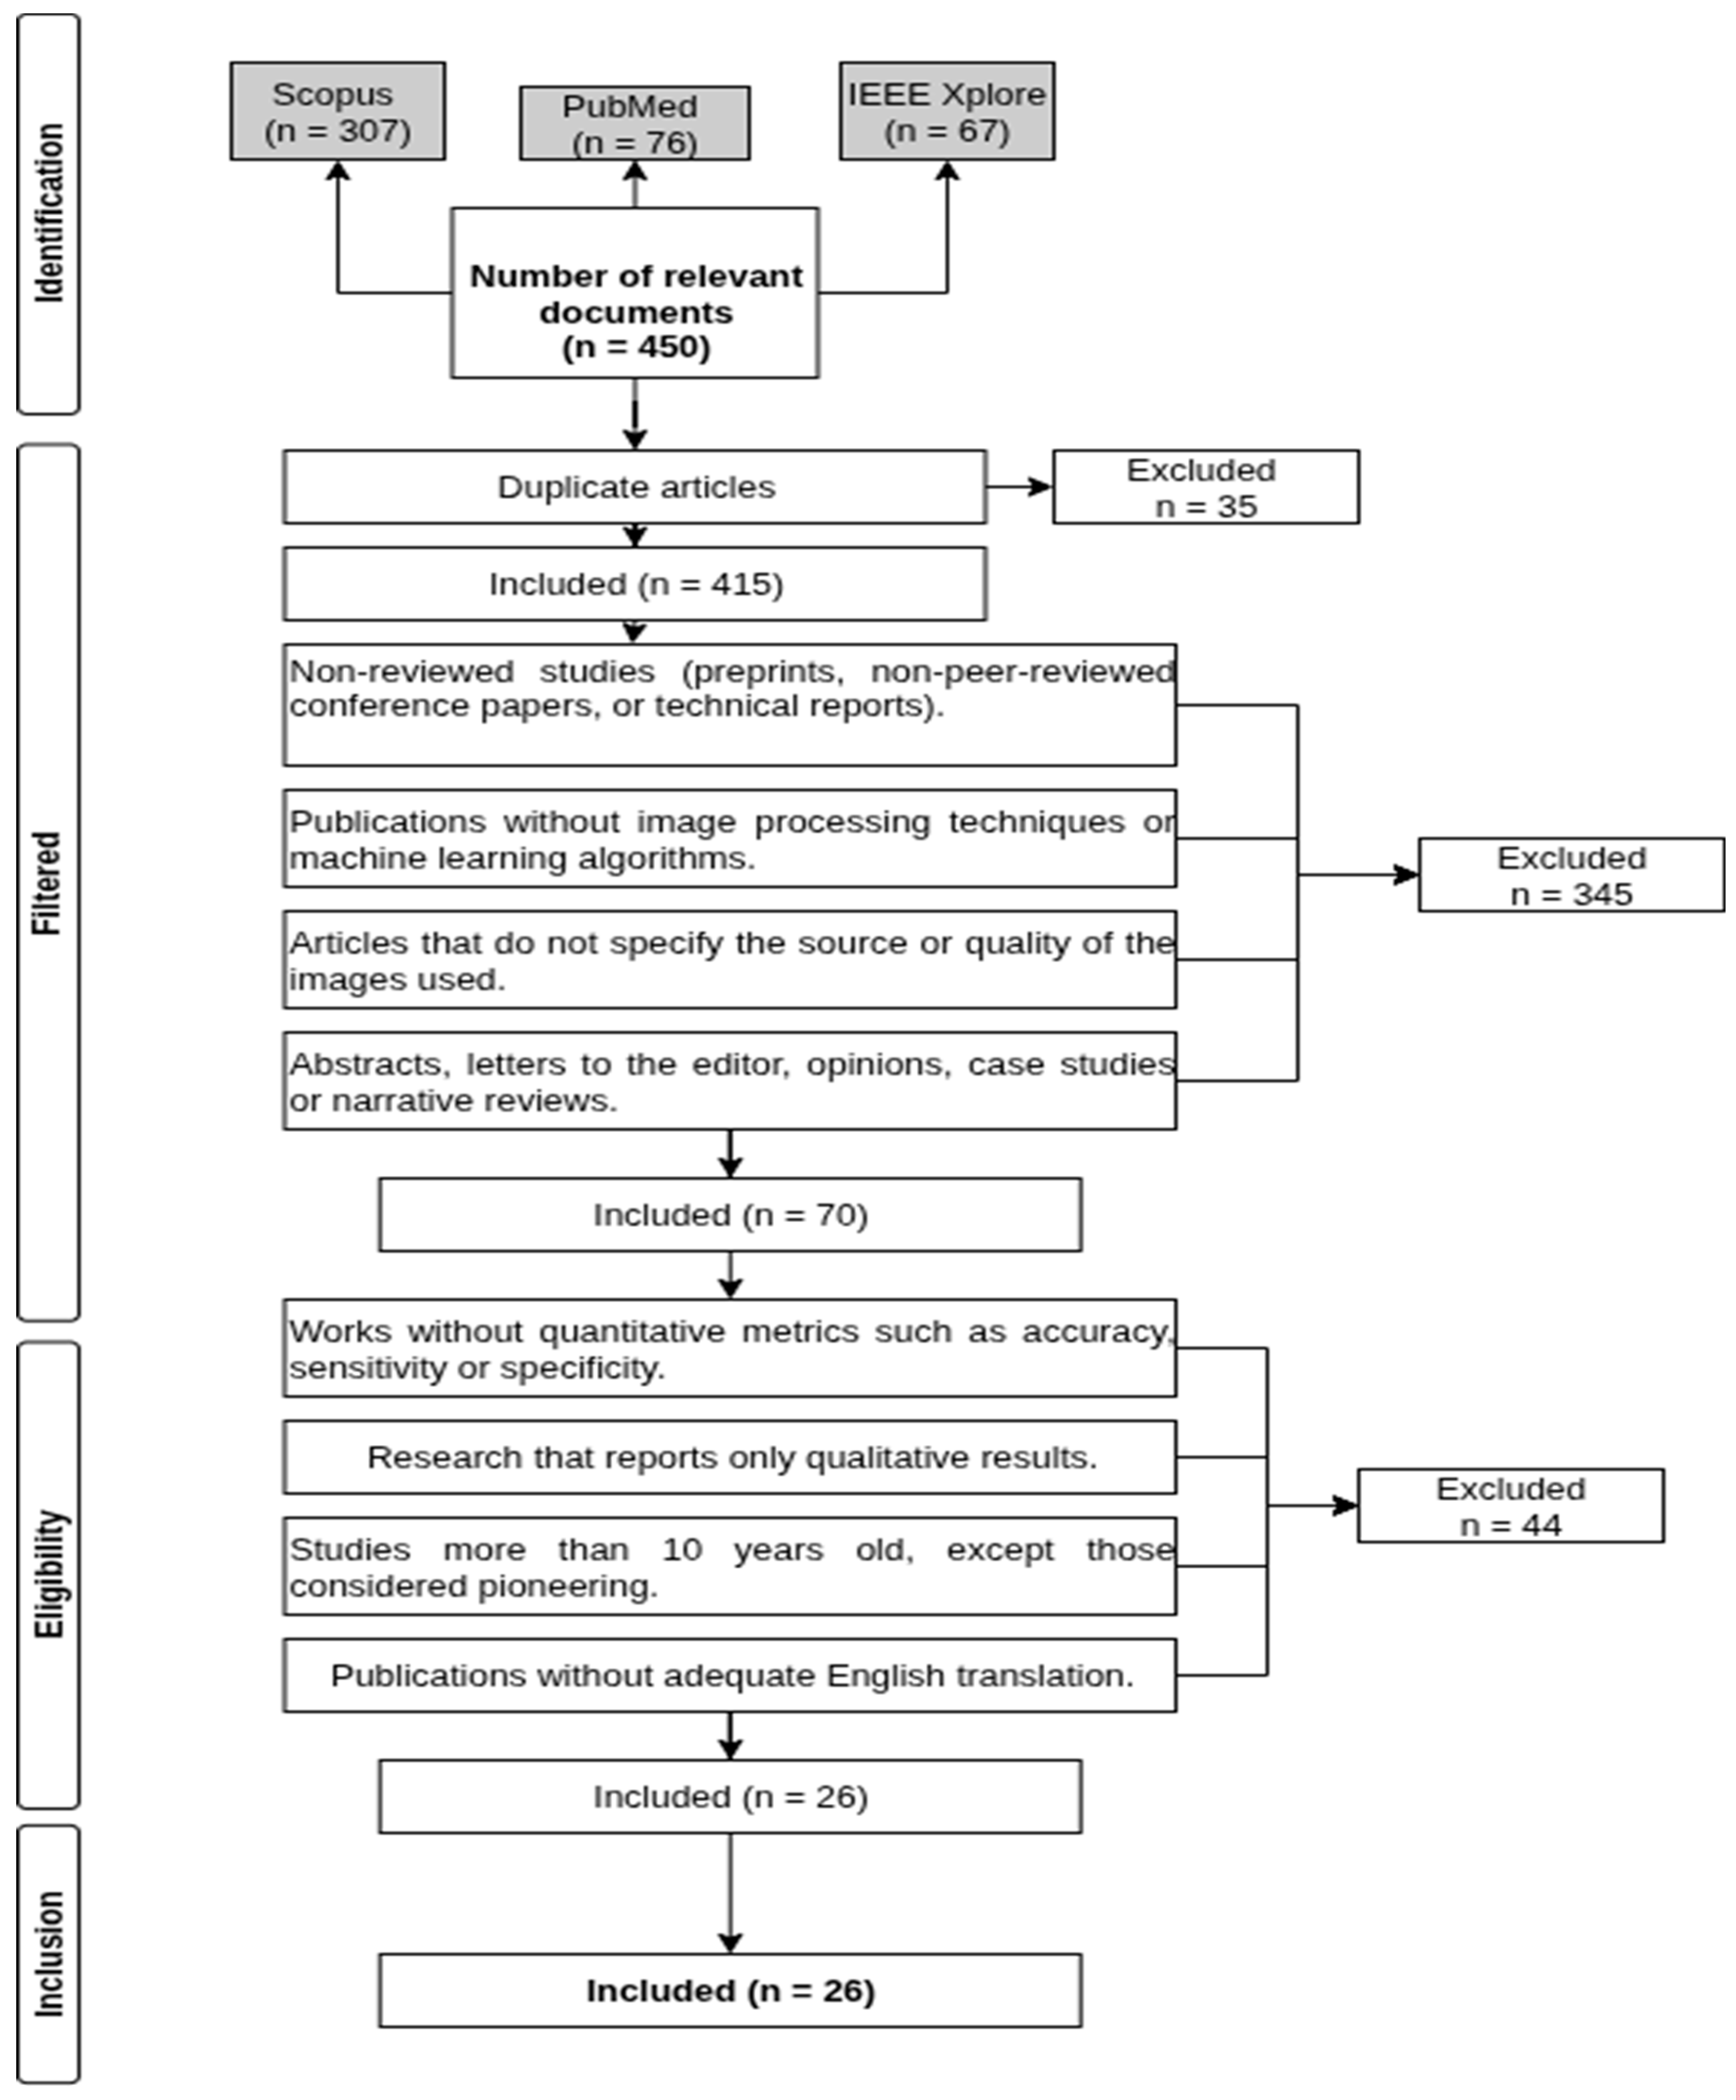
2.2. Data Sources and Search Strategies
2.3. Identified Studies
2.4. Selection Criteria
- Non-peer-reviewed studies (preprints, non-reviewed conference papers, or technical reports).
- Publications that do not include image processing techniques or machine learning algorithms.
- Articles that do not specify the source or quality of the images used.
- Abstracts, letters to the editor, opinion pieces, case studies, or narrative reviews.
- Studies lacking quantitative metrics such as accuracy, sensitivity, specificity, or AUC-ROC.
- Research reporting only qualitative results.
- Studies older than 10 years, except for those considered pioneering works.
- Publications without an adequate English translation.
2.5. Studio Selection
2.6. Quality Assessment
2.7. Synthesis of Findings or Data Synthesis
3. Results
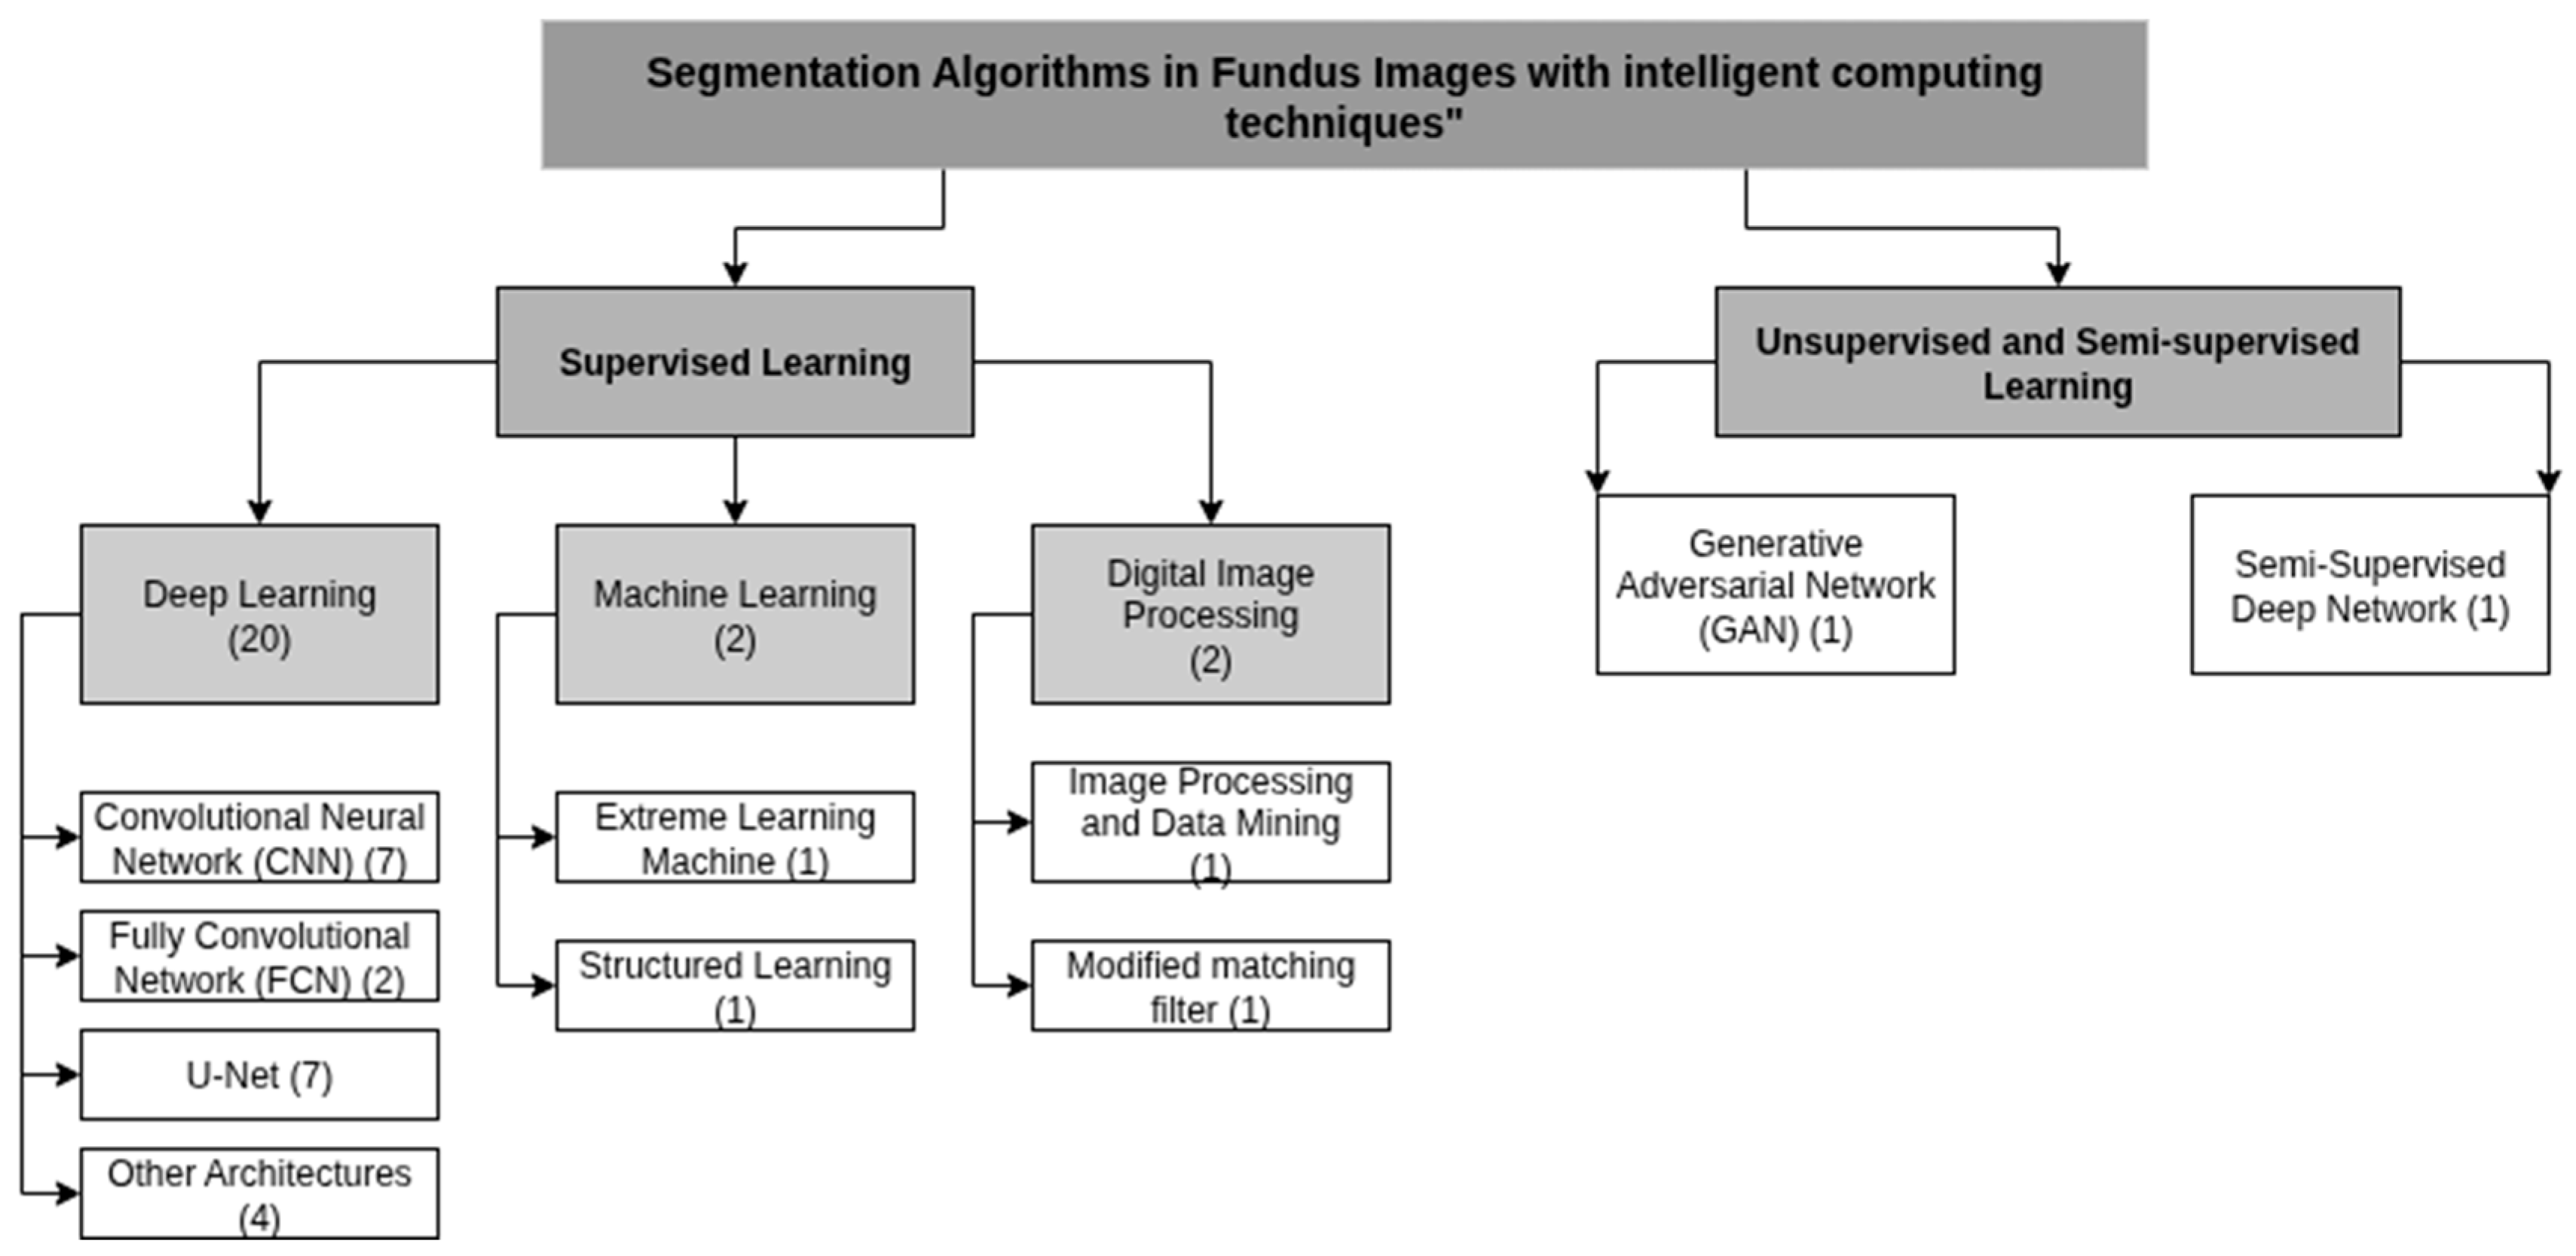
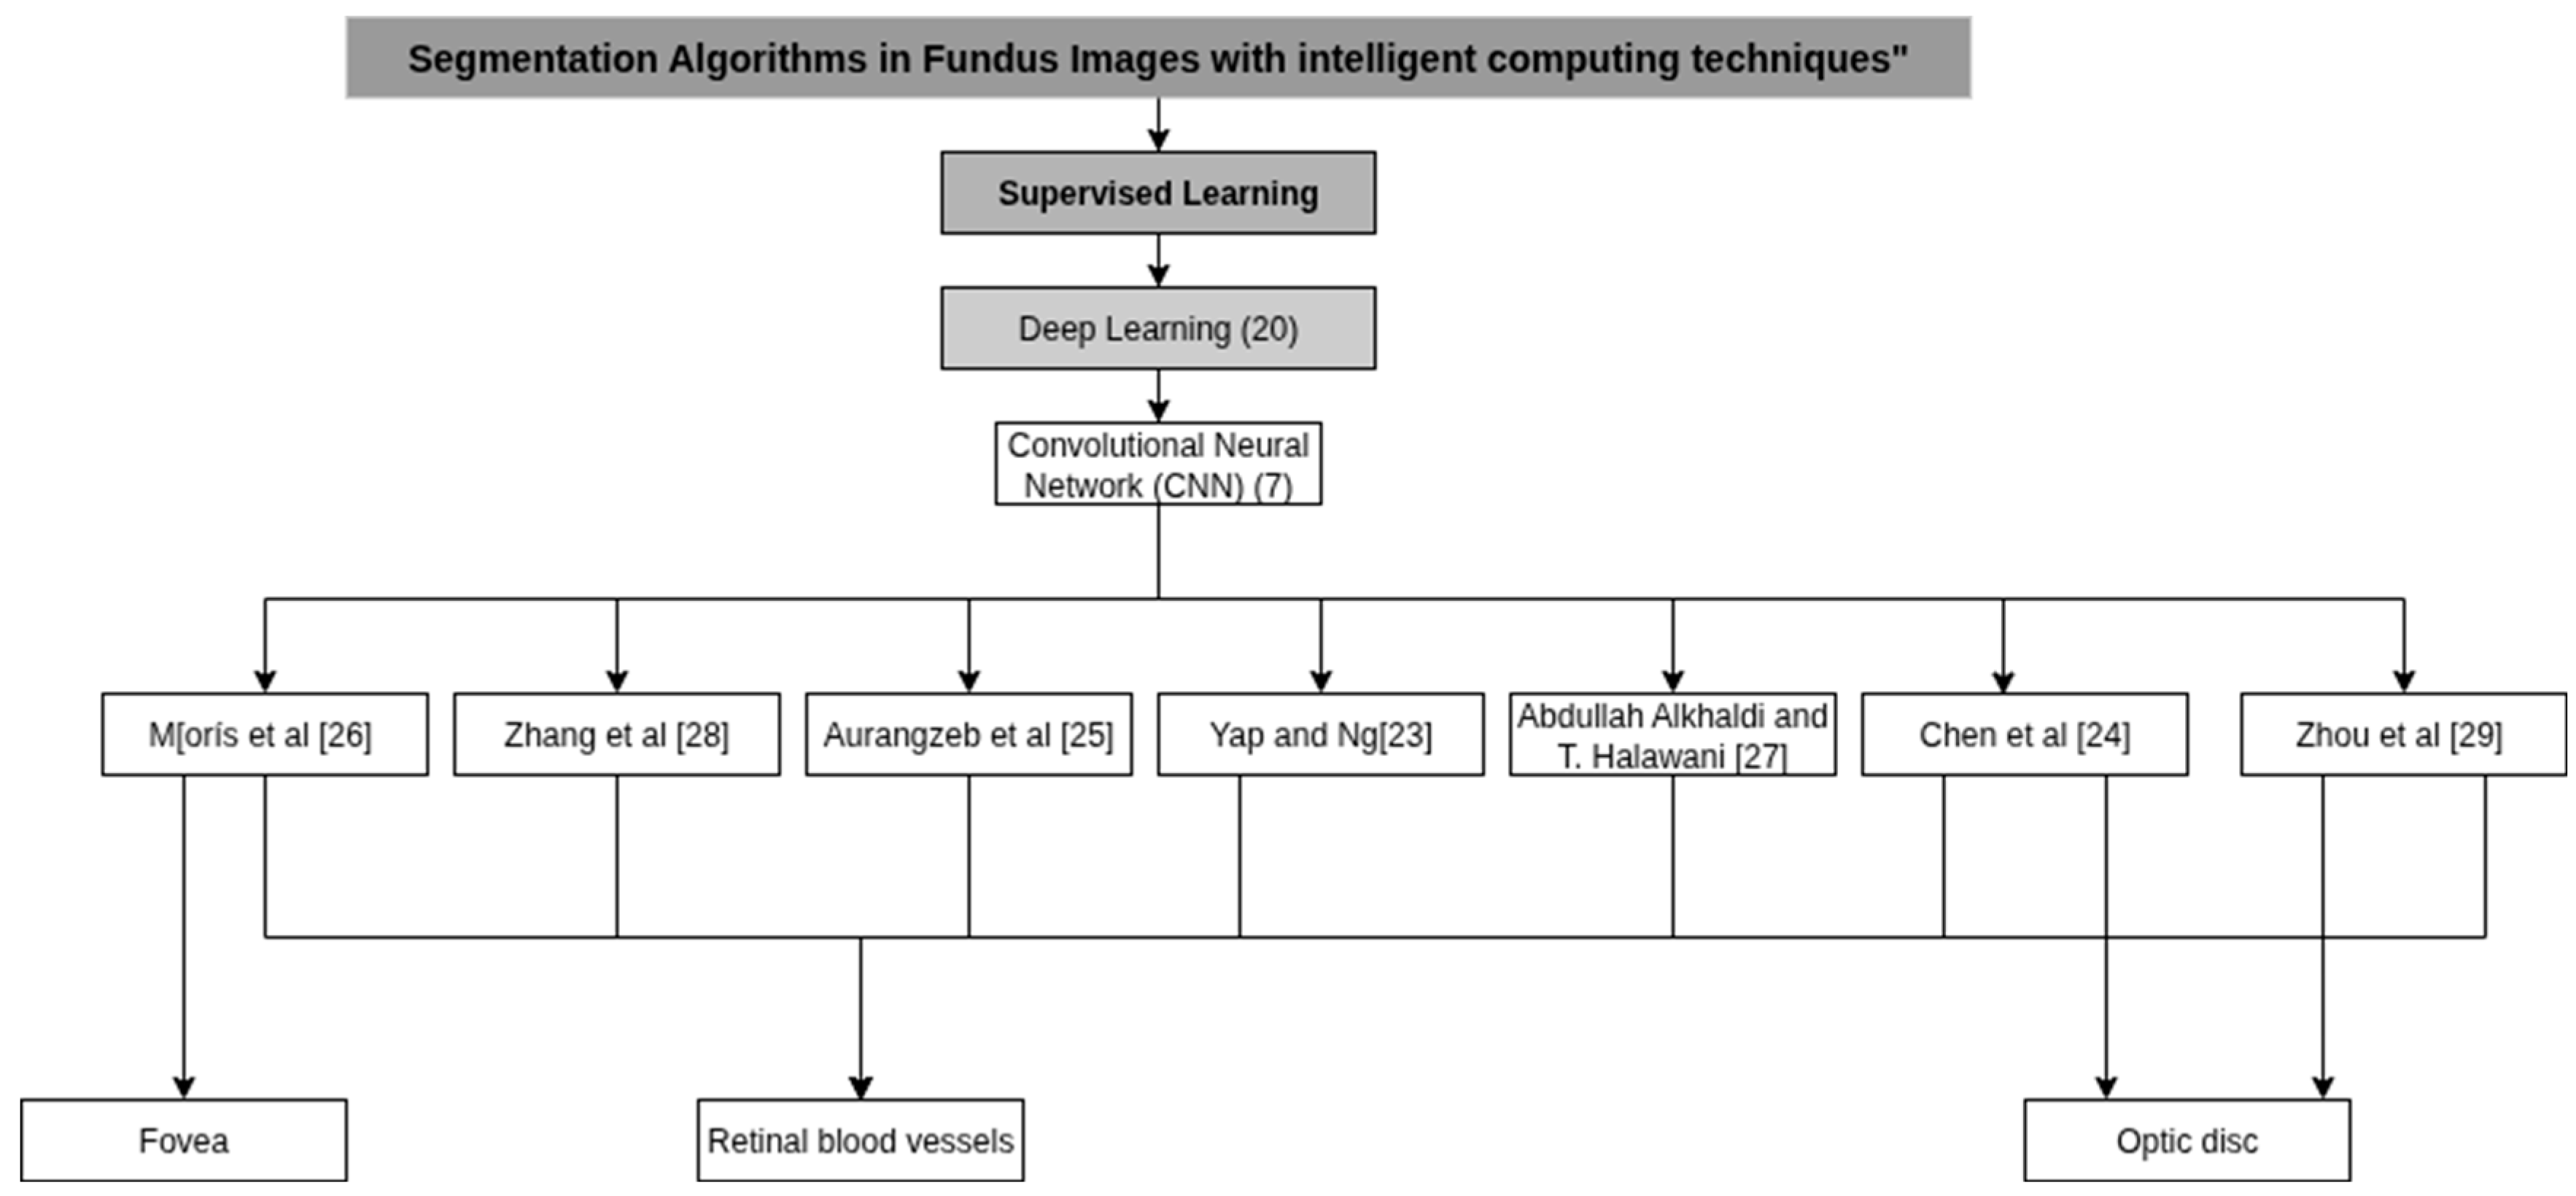
3.1. Deep Learning Algorithms Architecture
3.2. Machine Learning Architecture
3.3. Digital Image Processing
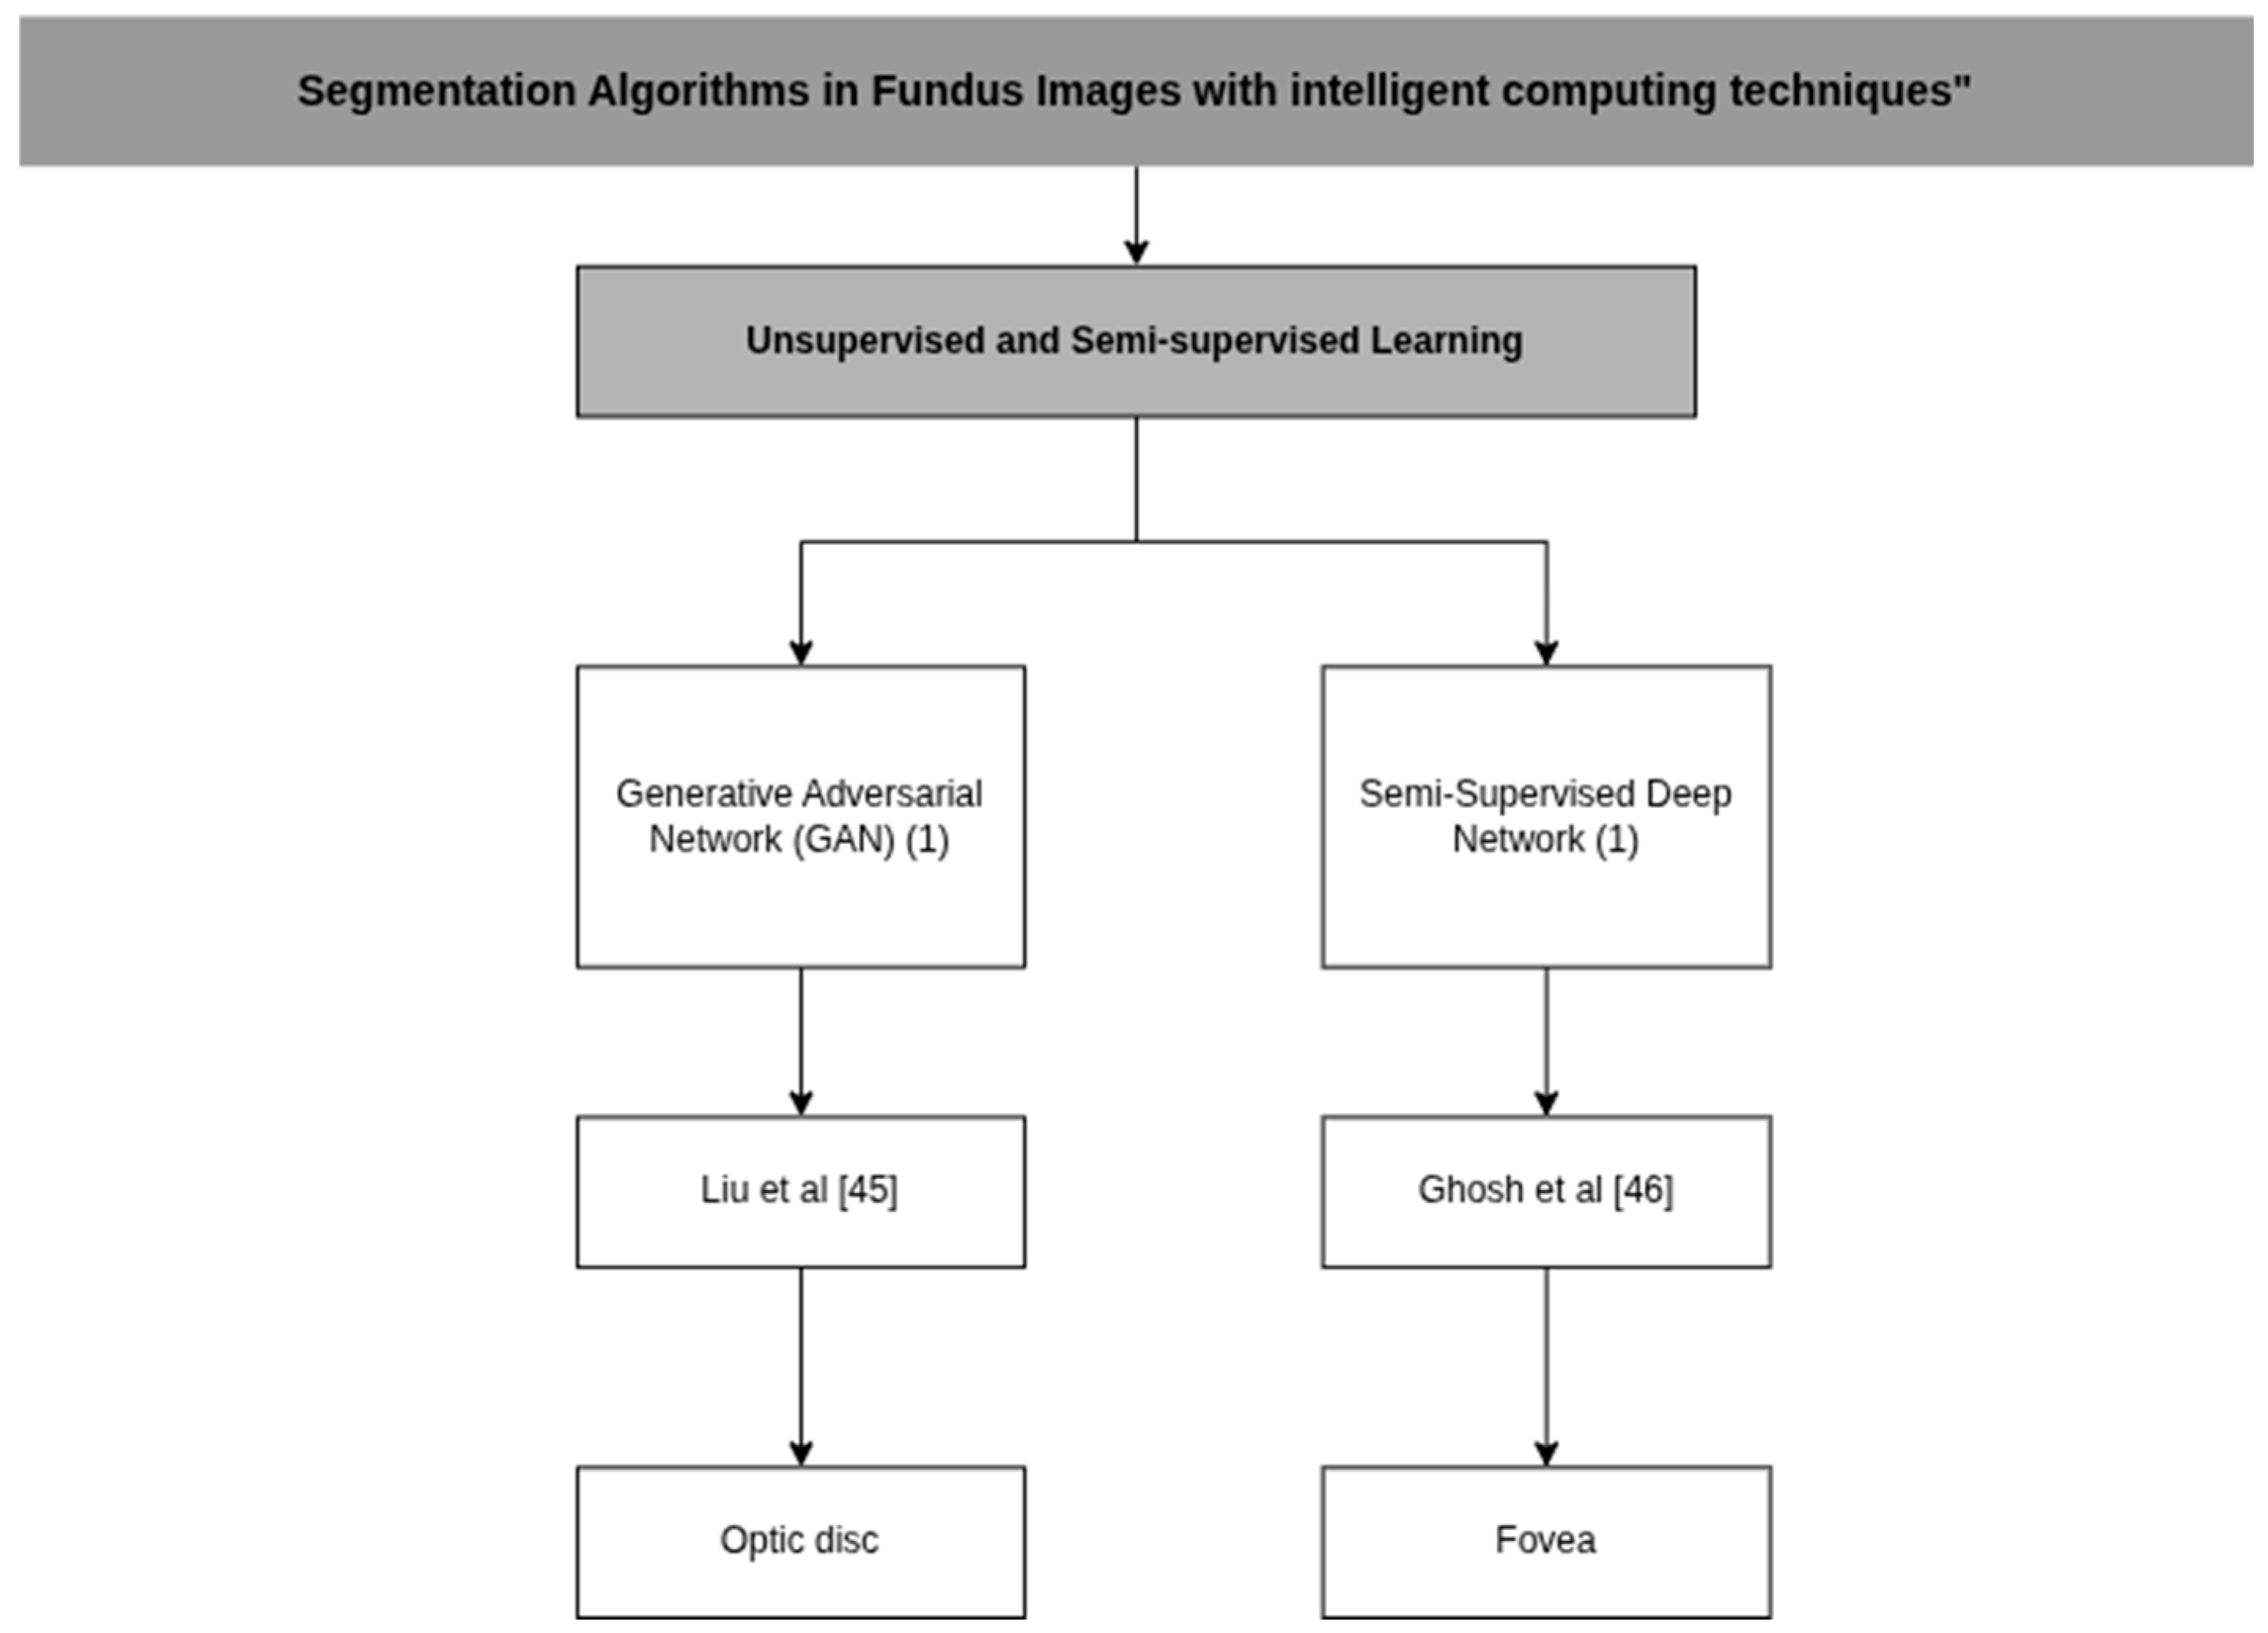
3.4. Unsupervised and Semi-Supervised Learning
4. Discussion
5. Conclusions
Author Contributions
Funding
Conflicts of Interest
Abbreviations
| ADAM | Adaptive Moment Estimation |
| CAM | Class Activation Maps |
| CNNs | Convolutional Neural Networks |
| cGANs | Conditional Adversarial Generative Networks |
| CLAHE | Contrast Limited Adaptive Histogram Equalization |
| SDC | Deformable Convolution |
| DNNs | Deep Neural Networks |
| DAM | Dual Attention Modules |
| ISAM | Enhanced Spatial Attention Module |
| ELM | Extreme Learning Machine |
| FFM | Feature Fusion Module |
| FCNs | Fully Convolutional Networks |
| GANs | Generative Adversarial Networks |
| GPU | Graphics Processing Unit |
| ICAVE | Improved Conditional Variational Auto Encoder |
| KNN | K-nearest Neighbors |
| LAM | Light Attention Modules |
| M2FL | Multi-Scale and Multi-Directional Learning Module |
| ORB | Oriented FAST and Rotated BRIE |
| OD | Optic Disc |
| PCA | Principal Component Analysis |
| ROI | Regions of Interest Extraction |
| SCC | Self-Calibrated Convolutions |
| SLIC | Simple Linear Iterative Clustering |
| ASM | Spatial Attention Module |
| SVM | Support Vector Machine |
| WLRR | Weighted Low-rank Matrix Recovery |
| WT | Whitening Transform |
Appendix A
| Cluster | References | Title | Main Findings/Contribution | Reason for Exclusion |
|---|---|---|---|---|
| Pathology-Oriented (Classification/Diagnosis) | Sivapriya et al. [54] | Automated diagnostic classification of diabetic retinopathy with microvascular structure of fundus images using deep learning method | Used ResEAD2Net with segmentation only as preprocessing; final goal DR classification. | Focus on classification/diagnosis, not segmentation. |
| Oguz et al. [8] | A CNN-based hybrid model to detect glaucoma disease | CNN + ML hybrid for glaucoma detection. | Classification focus, not anatomical segmentation. | |
| Pathan et al. [9] | An automated classification framework for glaucoma detection in fundus images using ensemble of dynamic selection methods | Combined image processing + classifiers for glaucoma detection. | Excluded for diagnostic focus. | |
| Sankari et al. [55] | Automated Detection of Retinopathy of Prematurity Using Quantum Machine Learning and Deep Learning Techniques | Hybrid CNN + QSVM model for pathology detection. | Classification oriented, outside segmentation scope. | |
| Ejaz et al. [56] | A deep learning framework for the early detection of multi-retinal diseases | CNN for detecting multiple retinal diseases. | Focused on disease detection, not segmentation of healthy structures. | |
| Diener et al. [57] | Automated Classification of Physiologic, Glaucomatous, and Glaucoma-Suspected Optic Discs Using Machine Learning | Classified optic discs (healthy, glaucoma, suspected). | Diagnostic objective; not segmentation. | |
| Muangnak et al. [58] | A Comparison of Texture-based Diabetic Retinopathy Classification Using Diverse Fundus Image Color Models | Texture-based classification of DR using multiple color models. | Classification only; not segmentation | |
| Wu et al. [59] | Deep Learning Detection of Early Retinal Peripheral Degeneration From Ultra-Widefield Fundus Photographs | Two-stage DL framework for peripheral degeneration detection. | Pathology-focused (screening/diagnosis). | |
| Dasari et al. [60] | An efficient machine learning approach for classification of diabetic retinopathy stages | Extracted features + SVM to classify DR stages. | Classification of DR severity; not segmentation. | |
| Gupta et al. [61] | Comparative study of different machine learning models for automatic diabetic retinopathy detection using fundus image | Compared ML models for DR detection. | Pathology detection focus. | |
| Rachapudi et al. [62] | Diabetic retinopathy detection by optimized deep learning model | Optimized DL model for DR diagnosis. | Diagnostic/DR focus. | |
| Sanghavy and Kurhekar [63] | An efficient framework for optic disk segmentation and classification of Glaucoma on fundus images | CNN with SLIC and graph cut segmentation. | Motivated by glaucoma detection. | |
| Yi et al. [64] | Compound Scaling Encoder–Decoder (CoSED) Network for Diabetic Retinopathy Related Bio-Marker Detection | Encoder–decoder with attention blocks. | Focused on diabetic retinopathy. | |
| Methodological Misalignment (Not Pixel-Level Segmentation) | Sun et al. [10] | Optic Disc Segmentation from Retinal Fundus Images via Deep Object Detection Networks | Faster R-CNN bounding-box to ellipse OD segmentation. | Treated as object detection, not pixel-level segmentation. |
| Zhang et al. [11] | Deep encoder–decoder neural networks for retinal blood vessels dense prediction | Encoder–decoder U-Net predicting vessel density maps. | Output was density prediction, not anatomical segmentation. | |
| Irshad et al. [65] | A new approach for retinal vessel differentiation using binary particle swarm optimization | Feature optimization for artery/vein classification. | Focused on classification, not segmentation. | |
| Liu et al. [66] | Wave-Net: A lightweight deep network for retinal vessel segmentation from fundus images | Wave-Net is a U-Net variant with detail enhancement and multi-scale fusion for precise retinal vessel segmentation. | Lacks significant methodological novelty. | |
| Raza et al. [67] | DAVS-NET: Dense Aggregation Vessel Segmentation Network for retinal vasculature detection in fundus images | Encoder–decoder with dense aggregation. | Lacks significant methodological novelty. | |
| Li et al. [68] | Accurate Retinal Vessel Segmentation in Color Fundus Images via Fully Attention-Based Networks | U-Net with dual attention modules. | Lacked clinical applicability discussion. | |
| Weak/Alternative Supervision Approaches | Xiong et al. [12] | Weak label based Bayesian U-Net for optic disc segmentation in fundus images | Bayesian U-Net with “weak labels.” | Relied on non-standard labels outside review scope. |
| Lu and Chen [69] | Weakly Supervised and Semi-Supervised Semantic Segmentation for Optic Disc of Fundus Image | Semi/weak supervision to reduce manual annotation. | Annotation methodology focus, not segmentation performance. | |
| Shao et al. [13] | Retina-TransNet: A Gradient-Guided Few-Shot Retinal Vessel Segmentation Net | Proposed few-shot 2Unet + GVF loss. | Excluded for few-shot premise, not general segmentation. | |
| Kadambi et al. [70] | WGAN domain adaptation for the joint optic disc-and-cup segmentation in fundus images | Domain adaptation with Wasserstein GAN. | Focused on domain transfer, not segmentation method. | |
| Artery/Vein Classification Instead of Segmentation | Hu et al. [14] | Multi-Scale Interactive Network With Artery/Vein Discriminator for Retinal Vessel Classification | Multi-scale network for artery/vein discrimination. | Task = classification, not anatomical segmentation. |
| Chowdhury et al. [15] | MSGANet-RAV: A multiscale guided attention network for artery-vein segmentation and classification from optic disc and retinal images | Deep learning network to classify arteries vs. veins. | Substructure classification focus. | |
| Hemelings et al. [71] | Artery-vein segmentation in fundus images using a fully convolutional network | FCN (U-Net) for artery/vein discrimination. | Emphasis on classification of vessel type. | |
| Glaucoma-Specific OD/OC Segmentation | Lui et al. [72] | Combined Optic Disc and Optic Cup Segmentation Network Based on Adversarial Learning | Polar transformation + adversarial learning for OD/OC. | Segmentation done for glaucoma diagnosis. |
| Elmannai et al. [17] | An Improved Deep Learning Framework for Automated Optic Disc Localization and Glaucoma Detection | Mask-RCNN for OD segmentation to detect glaucoma. | Pathology-focused | |
| Fu et al. [73] | Joint Optic Disc and Cup Segmentation Based on Multi-Label Deep Network and Polar Transformation | Multi-label U-Net for OD/OC segmentation. | Intrinsically pathology-driven (glaucoma). | |
| Joint optic disk and cup segmentation for glaucoma screening using a region-based deep learning network | Region-based CNN for OD/OC segmentation. | Motivated by glaucoma detection. | ||
| Ávila et al. [74] | Superpixel-Based Optic Nerve Head Segmentation Method of Fundus Images for Glaucoma Assessment | Superpixel clustering for ONH segmentation. | Goal: glaucoma evaluation. | |
| Gibbon et al. [75] | PallorMetrics: Software for Automatically Quantifying Optic Disc Pallor in Fundus Photographs, and Associations With Peripapillary RNFL Thickness | Quantified optic disc pallor for disease association. | Clinical pallor quantification, not segmentation. | |
| Zhao et al. [76] | Weakly Supervised Simultaneous Evidence Identification and Segmentation for Automated Glaucoma Diagnosis | Weakly Supervised Multi-Task Learning method (WSMTL) | Motivated by glaucoma detection. | |
| Outdated/Traditional Methods | Balasubramanian and N.P. [18] | ANN Classification and Modified Otsu Labeling on Retinal Blood Vessels | Pixel clustering + modified Otsu labeling. | Traditional/obsolete approach. |
| Suhasini and Chari [19] | Retinal Blood Vessel Segmentation through Morphology Cascaded Features and Supervised Learning | Multi-step morphological feature extraction. | Outdated methodology. | |
| Adapa et al. [77] | A supervised blood vessel segmentation technique for digital Fundus images using Zernike Moment based features | Zernike moments + ANN classifier. | Limited scope, no DL methods | |
| Srinidhi et al. [78] | A visual attention guided unsupervised feature learning for robust vessel delineation in retinal images | VA-UFL unsupervised attention model. | Not representative of modern DL segmentation | |
| Fernandez-Granero et al. [79] | Automatic tool for optic disc and cup detection on retinal fundus images | Color-gradient-based pixel classifier using CIE94 in CIE Lab space. | Classical methods with no improvement over DL. | |
| Specialized/Narrow Scope Tasks | Rehman et al. [20] | Microscopic retinal blood vessels detection and segmentation using support vector machine and K-nearest neighbors | SVM/KNN on pixel features, green channel. | Focused on pathology datasets, narrow scope. |
| Saeed [21] | A Machine Learning based Approach for Segmenting Retinal Nerve Images using Artificial Neural Networks | BPNN for retinal nerve segmentation. | Focus on nerves, not standard anatomical targets. | |
| Mathews et al. [80] | EfficientNet for retinal blood vessel segmentation | U-Net with EfficientNet backbone; LinkNet decoder. | Too narrow/specific architecture. |
| Article | Model | Preprocessing (P) Classifiers (C) Image Descriptors (D) | Computational Resource |
|---|---|---|---|
| Yap and Ng [23] | CAMContrast | P: Normalization of Heat Maps, oppression of Backgrounds and Negative Activations C: Heatmap generation via Class Activation Maps (CAM) D: Features Based on Density, Shape and Topological | Two NVIDIA V100 GPUs, each with 16 GB of memory |
| Chen et al. [24] | Shape Regularization Extractor (WT-PSE) | P: Whitening Transform (WT) C: Wasserstein’s Distance Guided Knowledge Distillation D: Features Based Shape | PyTorch and is trained on an NVIDIA 3090 GPU |
| Aurangzeb et al. [25] | ColonSegNet V2 | P: CLAHE (Contrast Limited Adaptive Histogram Equalization) C: Support Vector Machine (SVM) and Naïve Bayes D: Features Based in Morphology | N/A |
| Morís et al. [26] | Context Encoder | P: PW-CE (Patch-Wise), GM-CE (CB) (Checkerboard) and GM-CE (CS) (Center-Surround) C: U-Net, encoder–decoder with jump connections D: ORB (Oriented FAST and Rotated BRIEF) | N/A |
| Abdullah Alkhaldi and T. Halawani [27] | GOFED-RBVSC (Grasshopper Optimization with Fuzzy Edge Detection based Retinal Blood Vessel Segmentation and Classification) | P: CLAHE (Contrast Limited Adaptive Histogram Equalization) C: ICAVE (Improved Conditional Variational Auto Encoder) | N/A |
| Zhang et al. [28] | Multi-Scale Feature Fusion | P: B-COSFIRE filter C: Support Vector Machine (SVM) D: Multi-scale and line intensity features | N/A |
| Zhou et al. [29] | AutoMorph | P: Thresholding C: EfficientNet-B4 D: Tortuosity, Fractal dimension, Vascular density and Cup caliber | N/A |
| Article | Database | Algorithm Metrics | Clinical Metric |
|---|---|---|---|
| Yap and Ng [23] | OIA-ODIR | IDRiD-seg avg. AUC-PR: 66.9 ± 1.18 REFUGE-seg avg. F1-score: 91.66 ± 0.06 Vessel-seg F1-score: 80.82 ± 0.05 | N/A |
| Chen et al. [24] | FUNDUS | N/A | Optical Cup (OC) Segmentation Dice Similarity Coefficient (DSC):83.11 Average Surface Distance (ASD): 13.04 Optical Disk (OD) Segmentation Dice Similarity Coefficient (DSC):93.08 Average Surface Distance (ASD): 10.47 |
| Aurangzeb et al. [25] | DRIVE | Sensitivity:83.9% Specificity:97.9% Accuracy: 96.6% | N/A |
| Morís et al. [26] | CHASE_DB | Sensitivity:86.5% Specificity:97.9% Accuracy: 97.1% | N/A |
| STARE | Sensitivity:86.7% Specificity:98.1% Accuracy: 97.2% | N/A | |
| DRIVE | AUC-ROC:97.94% AUC-PR: 91.17% | N/A | |
| Abdullah Alkhaldi and T. Halawani [27] | Kaggle dataset | Sensitivity:76.15% Specificity:97.31% Accuracy: 97.92% | N/A |
| Zhang et al. [28] | DRIVE | Sensitivity:70.88% Specificity: 99.% Presicion: 86.56% Accuracy: 96.66% | N/A |
| STARE | Sensitivity:61.89% Specificity:99.08% Presicion: 87.82% Accuracy: 94.94% | N/A | |
| Zhou et al. [29] | EyePACS-Q (Image Quality Grading) | Sensitivity: 85% Specificity: 93% Presicion: 87% Accuracy:92% F1-Score: 86% AUC-ROC: 97% | N/A |
| IOSTAR-AV (Artery/Vein segmentation) | Sensitivity: 64% Specificity: 98% | N/A |
| Article | Model | Preprocessing (P) Classifiers (C) Image Descriptors (D) | Computational Resource |
|---|---|---|---|
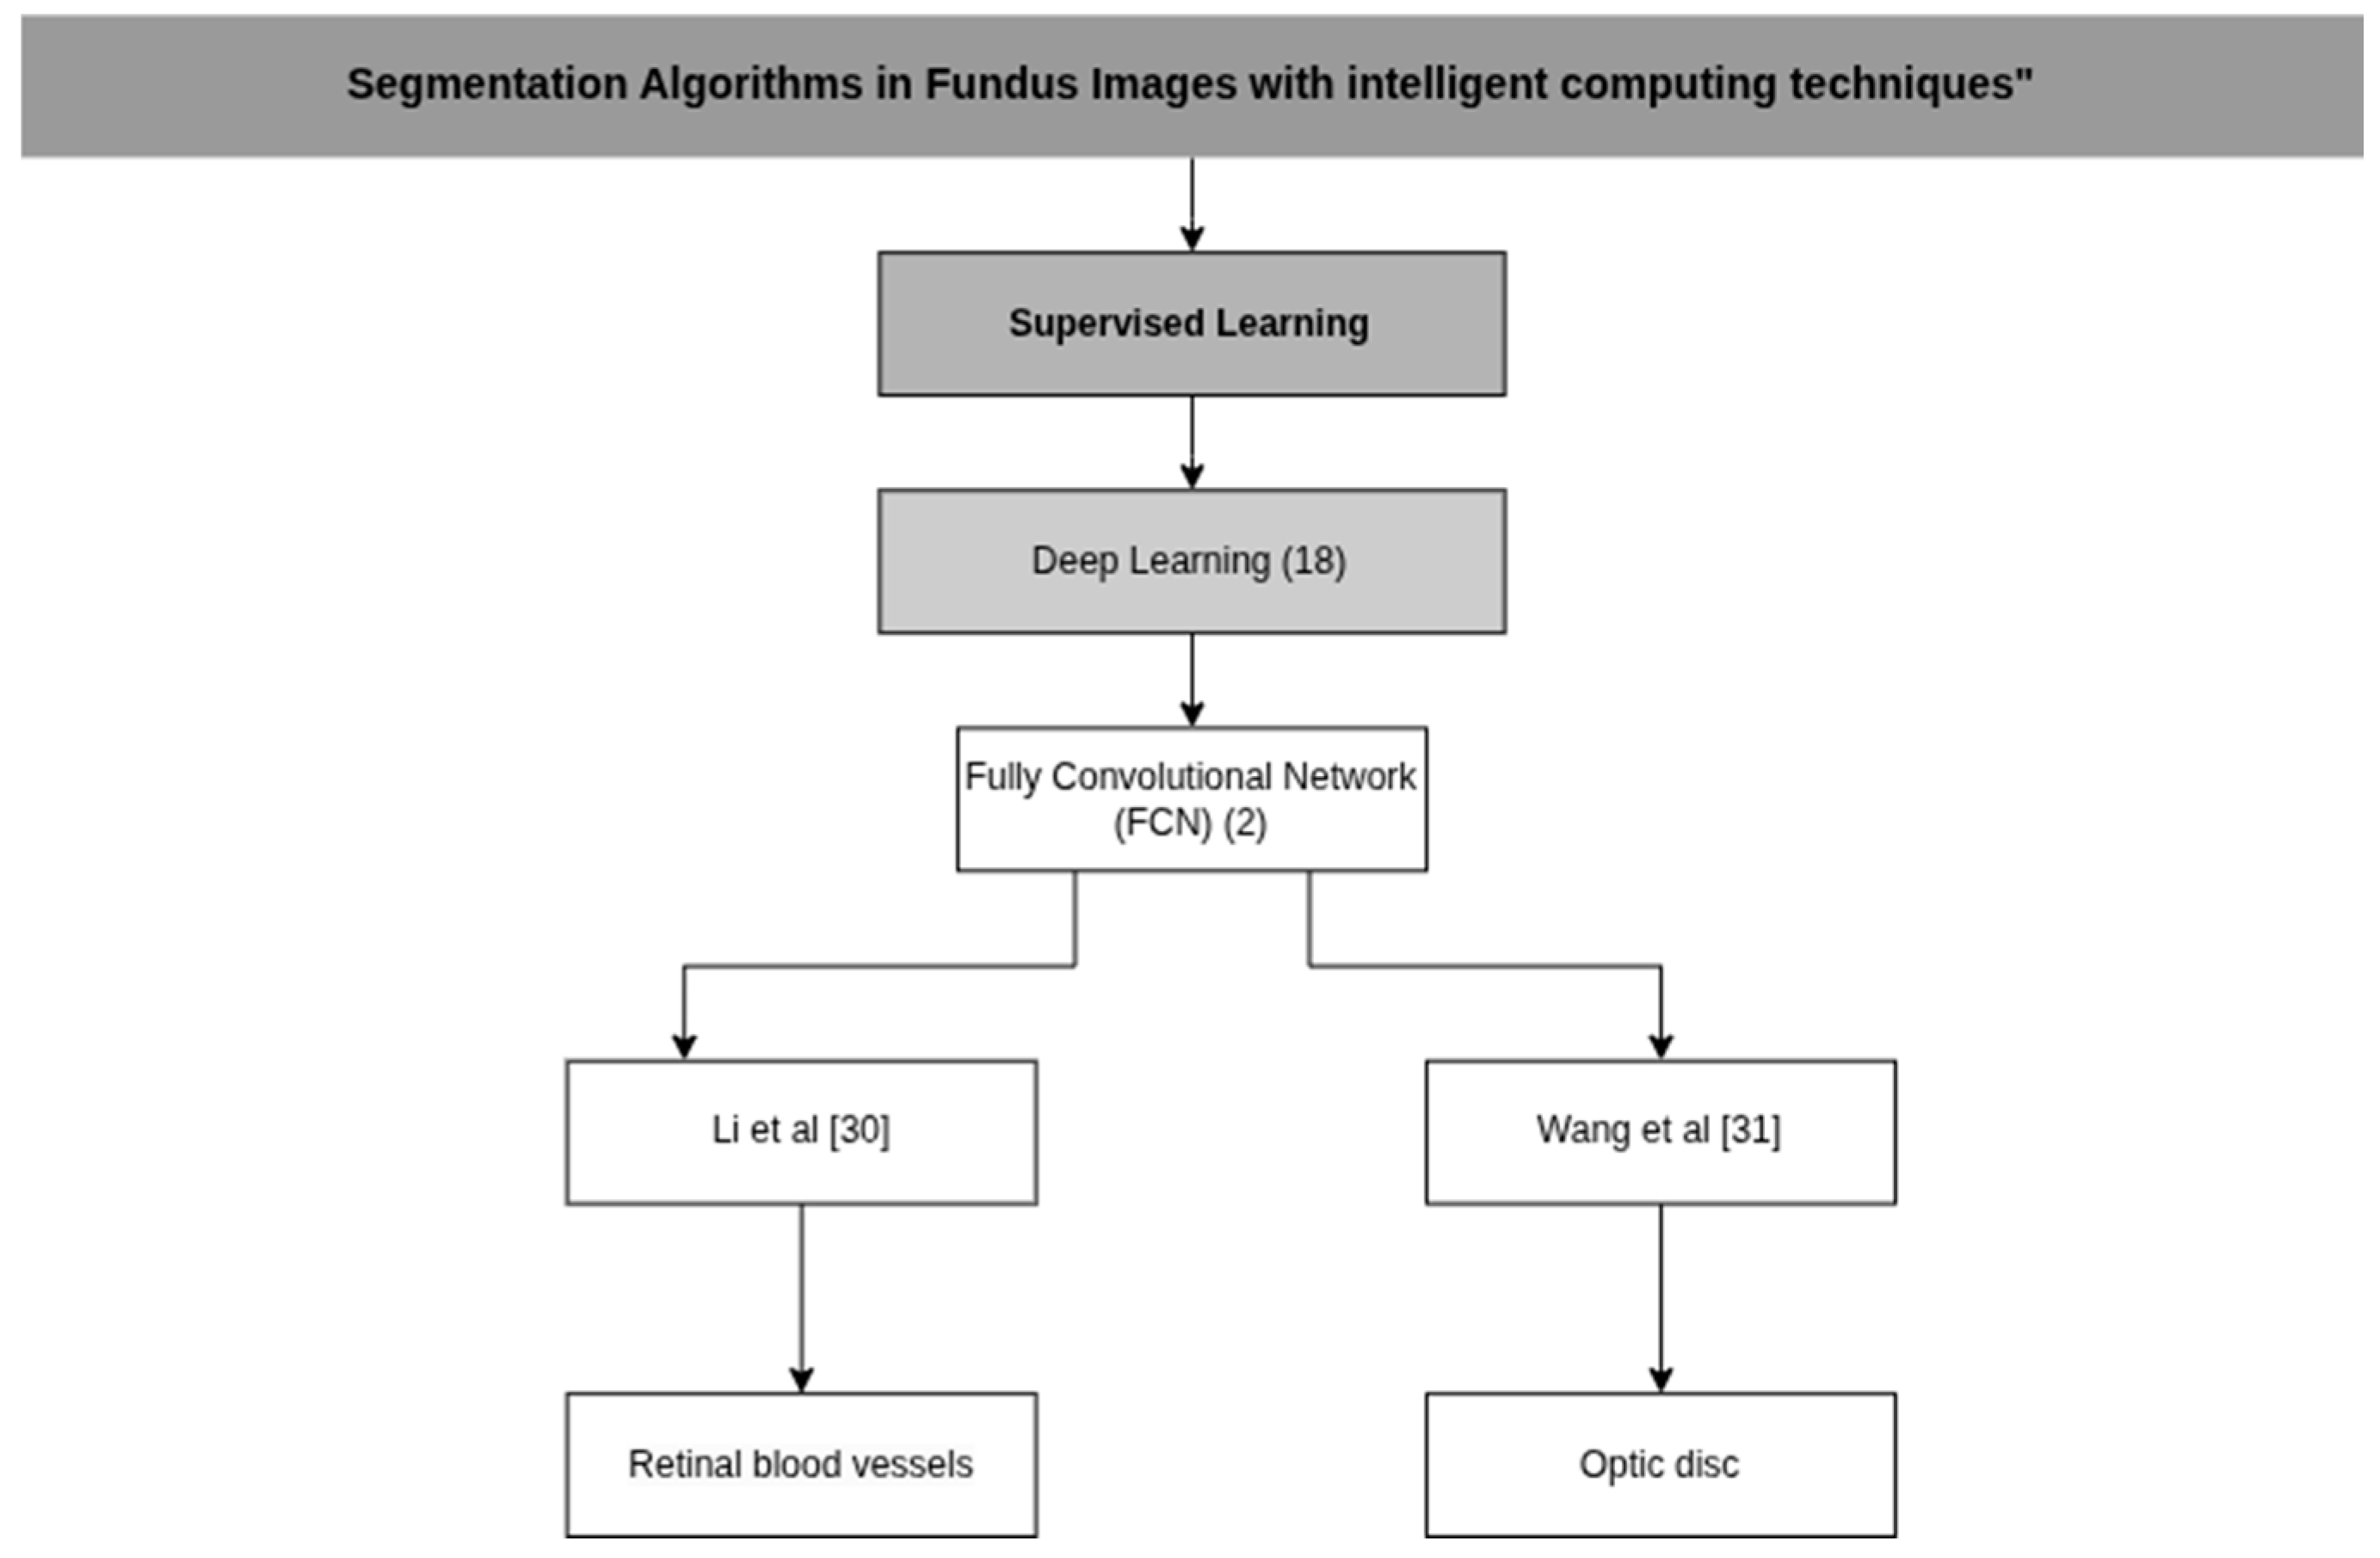
| Li et al. [30] | Fully Convolutional Neural Network (FCN) with dual-source fusion approach. | P: Channel extraction (RGB) and histogram equalization D: Non-manual heuristic feature set | An E5-2609 CPU, 8 GB of RAM, a Quadro K620 GPU and the Ubuntu 16 operating system. |
| Wang et al. [31] | Fully convolutional neural network (FCN) combined with a weighted low-rank matrix recovery (WLRR) model. | P: Channel extraction (RGB), Gabor filters and Simple Linear Iterative Clustering (SLIC) D: Color, edge and texture features | An Intel Xeon CPU and an NVIDIA Quadro P400 GPU, with a CPU clock speed of 4 G Hz and 32 GB of RAM. |
| Article | Database | Algorithm Metrics | Clinical Metrics |
|---|---|---|---|
| Li et al. [30] | Tongren Hospital patients | Sensitivity: 72.15% Specificity: 95.76% Accuracy: 92.10% | Extraction performance precision Sensitivity: 76.21% Specificity: 95.14% Accuracy: 94.91% |
| Wang et al. [31] | DRISHTI-GS. | IoU: 91.8% Precision: 93.8% Recall: 96.8% F1 Score: 95.5% MAE: 7.2% | N/A |
| Article | Model | Preprocessing (P) Classifiers (C) Image Descriptors (D) | Computational Resource |
|---|---|---|---|
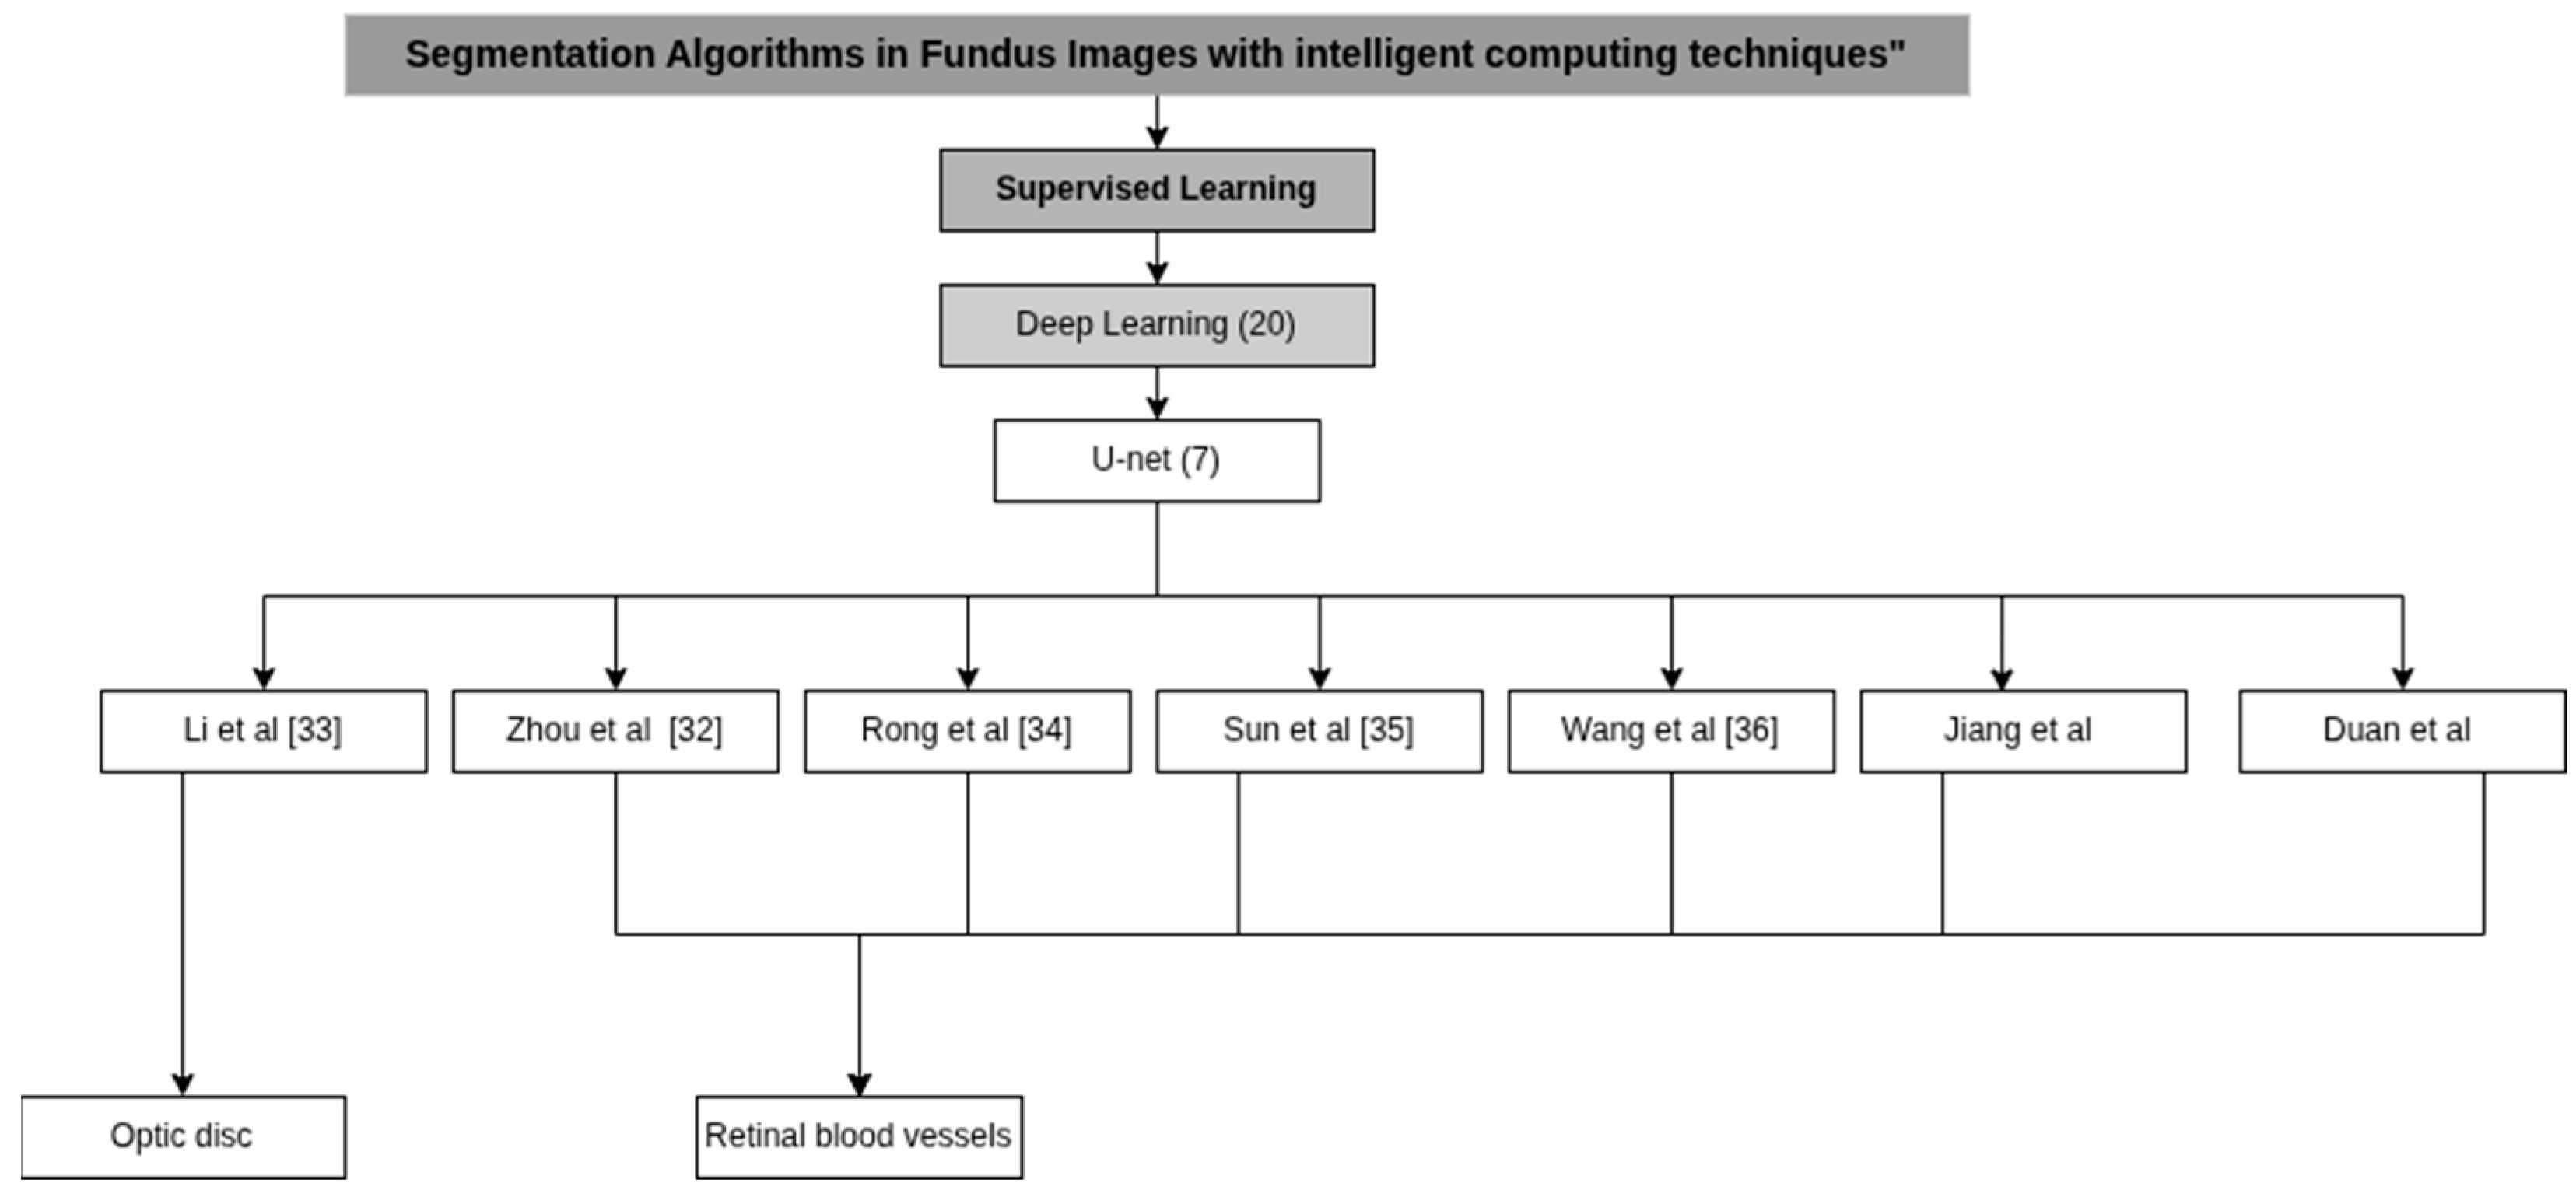
| Zhou et al. [32] | U-Net BF-Net | C: Linear discriminant analysis (LDA), k-nearest neighbors (kNN) and random forest D: Features Based on Density, Shape, Topological and Heuristics | Pytorch 1.9 and running on a Tesla T4 GPU (16 GB) |
| Li et al. [33] | Hybrid network based on CNN and Transformer | P: Regions of Interest Extraction (ROI) C: ResNet-18 network | 2 NVIDIA 2080 Ti GPUs |
| Rong et al. [34] | self-calibrated convolutions (SCC) | C: Improved Spatial Attention Module (ISAM) D: Hierarchical Features | NIVIDIA TITAN Xp GPU with 12 GB |
| Sun et al. [35] | SDAU-Net | P: Red-green channel fusion, histogram equalization and CLAHE (Contrast Limited Adaptive Histogram Equalization) D: Serial Deformable Convolutions (SDC), Light Attention Modules (LAM) and Dual Attention Modules (DAM) | Tensorflow and Keras, on an Intel Xeone5-2678 V3 CPU and an NVIDIA GeForce RTX 2080 Ti GPU. |
| Wang et al. [36] | Context Spatial U-Net | P: CLAHE (Contrast Limited Adaptive Histogram Equalization) C: Spatial Attention Module (SAM) and a Feature Fusion Module (FFM) D: ORB (Oriented FAST and Rotated BRIEF) | Pytorch on an Ubuntu 16.04 (64-bit) platform equipped with an NVIDIA GTX 2080 Ti GPU. |
| Jirang et al. [47] | lightweight UNet | P: CLAHE (Contrast Limited Adaptive Histogram Equalization) C: Feature selection transformer block (FSTB) | GPU NVIDIA GeForce RTX 3090 with 24 GB of memory. |
| Duan et al. [48] | DAF-UNet | P: CLAHE (Contrast Limited Adaptive Histogram Equalization) C: Deformable convolution module (DC) | N/A |
| Article | Database | Algorithm Metrics | Clinical Metrics |
|---|---|---|---|
| Zhou et al. [32] | DRIVE-AV | U-Net Sensitivity: 71.37 ± 0.75% F1-score: 73.22 ± 0.98% IOU: 58.25 ± 1.21% MSE: 2.85 ± 0.01% Betti error: 7.92 ± 1.02% BF-Net Sensitivity: 72.91 ± 1.27% F1-score: 73.04 ± 0.58% IOU: 57.99 ± 0.70% MSE: 2.93 ± 0.06% Betti error: 7.75 ± 1.21% | Intraclass compression coefficient (ICC) U-Net Fractal dimension: 0.78 (0.45–0.92) Vessel density: 0.72 (0.36–0.93) BF-Net Fractal dimension: 0.84(0.64–0.92) Vessel density: 0.78(0.56–0.92) |
| LES-AV | U-Net Sensitivity: 62.21 ± 2.14% F1-score: 65.93 ± 1.32% IOU: 50.66 ±1.51% MSE: 2.61 ± 0.25% Betti error: 4.76 ± 1.15% BF-Net Sensitivity: 67.06 ± 1.76% F1-score: 69.87 ± 1.56% IOU: 54.98 ± 1.61% MSE: 2.32 ± 0.10% Betti error: 3.04 ± 0.66% | Intraclass compression coefficient (ICC) U-Net Fractal dimension: 0.72 (0.33–0.94) Vessel density: 0.71 (0.32–0.90) BF-Net Fractal dimension: 0.92 (0.83–0.97) Vessel density: 0.95 (0.88–0.98) | |
| HRF-AV | U-Net Sensitivity: 69.41 ± 1.75% F1-score: 72.17± 0.66% IOU: 57.74 ±0.73% MSE: 1.91 ± 0.02% Betti error: 6.61 ± 0.52% BF-Net Sensitivity 67.61 ± 2.48% F1-score: 71.19 ± 0.58% IOU: 56.48 ± 0.73% MSE: 1.96 ± 0.03% Betti error: 6.82 ± 1.16% | Intraclass compression coefficient (ICC) U-Net Fractal dimension: 0.72 (0.33–0.94) Vessel density: 0.71 (0.32–0.90) BF-Net Fractal dimension: 0.86 (0.71–0.96) Vessel density: 0.91 (0.82–0.96) | |
| Li et al. [33] | REFUGE | CDR: 0.9639 RADR: 0.9639 | CD cup: 0.9006 DC disc: 0.9613 CDR: 0.0337 |
| Drishti-GS | CDR: 0.9286 RADR: 0.9286 | CD cup: 0.9025 DC disc: 0.9727 CDR: 0.0428 | |
| RIM-ONE-r3 | CDR: 0.8125 RADR: 0.7500 | CD cup: 0.8618 DC disc: 0.9690 CDR: 0.0315 | |
| Rong et al. [34] | DRIVE-AV | Sensitivity: 80.36% Specificity: 98.40% Accuracy: 96.80% F1-Score: 81.38% AUC-ROC: 98.40% | N/A |
| CHASE DB1 | Sensitivity: 81.18% Specificity: 98.67% Accuracy: 97.56% F1-Score: 80.68% AUC-ROC: 98.88% | N/A | |
| Sun et al. [35] | DRIVE | Sensitivity: 79.55% Specificity: 98.48% Accuracy: 96.82% AUC-ROC: 98.34% | N/A |
| CHASE DB1 | Sensitivity: 83.21% Specificity: 98.25% Accuracy: 97.32% AUC-ROC: 98.58% | N/A | |
| STARE | Sensitivity: 89.73% Specificity: 99.03% Accuracy: 98.33% AUC-ROC: 99.63% | N/A | |
| Wang et al. [36] | DRIVE-AV | Sensitivity: 80.71% Specificity: 97.82% Accuracy: 95.65% F1-Score: 82.51% AUC-ROC: 98.01% | N/A |
| Jiang et al. [47] | CHASE DB1 | Sensitivity: 80.71% Specificity: 98.78% Accuracy: 97.65% F1-Score: 81.26% IOU: 69.47% MIOU: 82.94% | N/A |
| STARE | Sensitivity: 81.85% Specificity: 98.97% Accuracy: 97.64% F1-Score: 83.83% IOU: 72.38% MIOU: 84.93% | N/A | |
| DRIVE-AV | Sensitivity: 78.56% Specificity: 98.76% Accuracy: 96.96% F1-Score: 81.85% IOU: 69.311% MIOU: 83.02% | N/A | |
| Duan et al. [48] | CHASE DB1 | Specificity: 98.71% Accuracy: 96.22% Dice Similarity Coefficient:82.27% | |
| DRIVE-AV | Specificity: 98.21% Accuracy: 95.92% Dice Similarity Coefficient: 82.98% | N/A |
| Article | Model | Preprocessing (P) Classifiers (C) Image Descriptors (D) | Computational Resource |
|---|---|---|---|
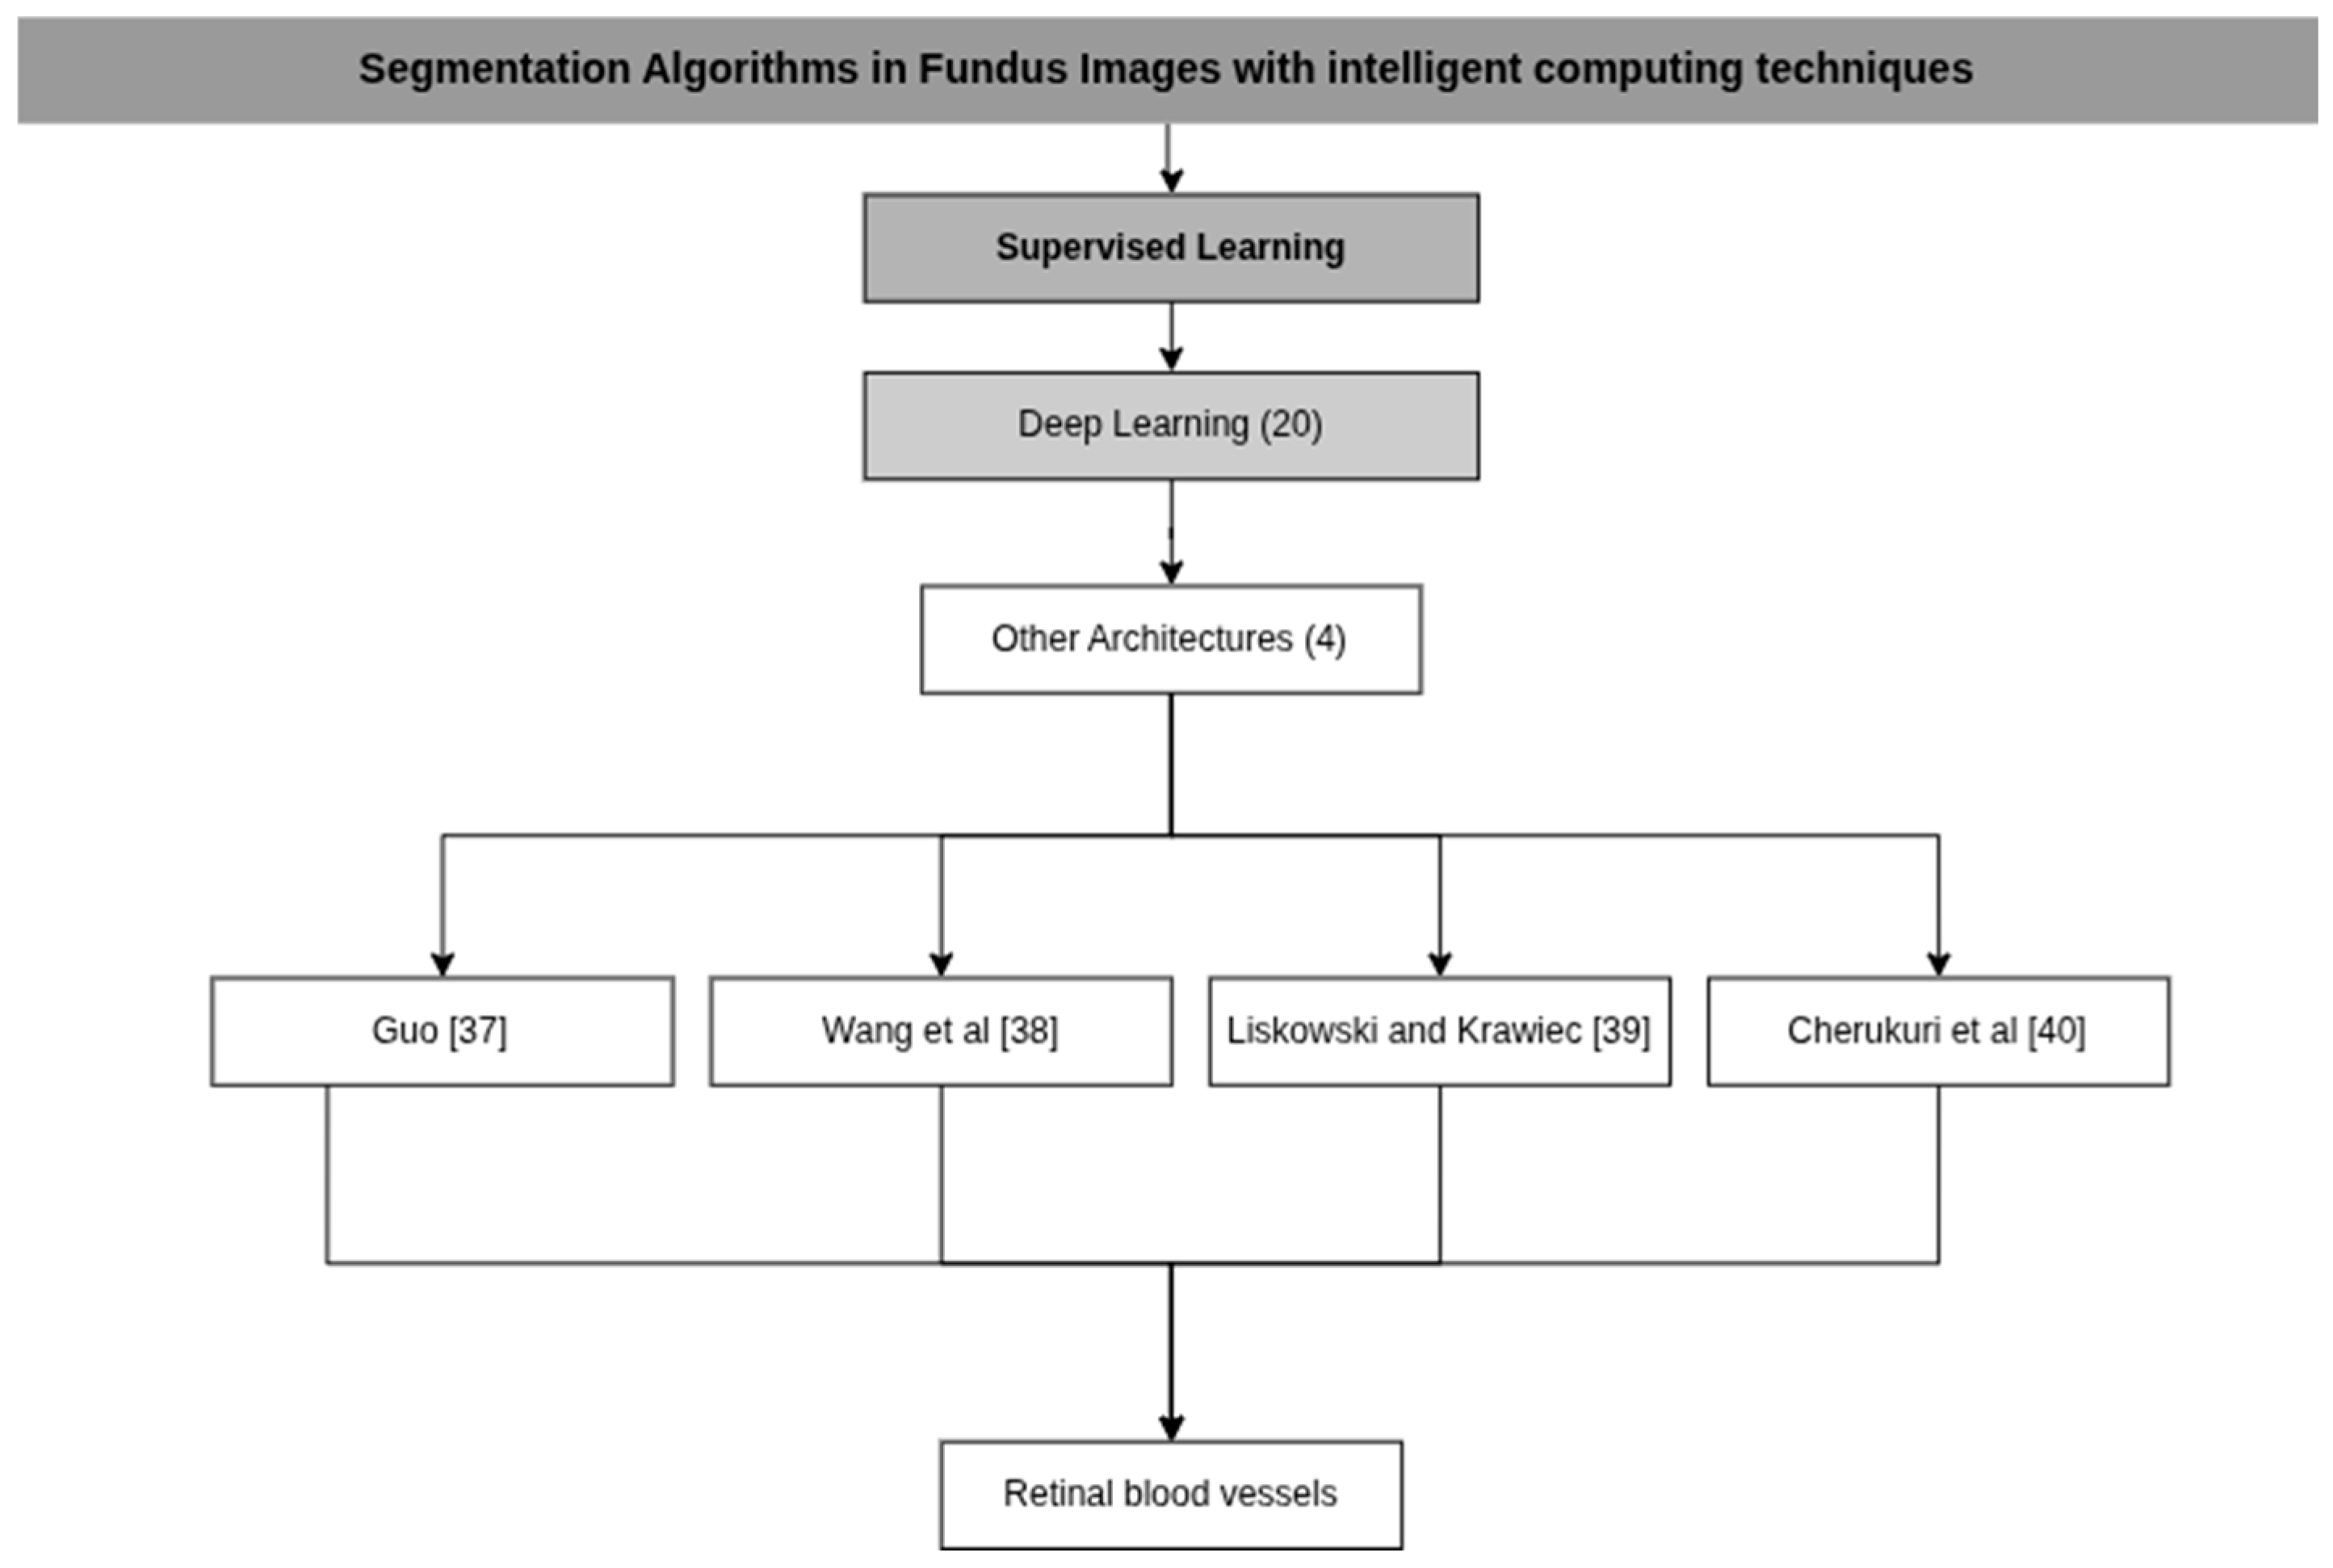
| Guo [37] | CSGNet | P: Normalization and data augmentation C: Multi-Scale and Multi-Directional Learning Module (M2FL) D: Strip Convolutions and Dilated Convolutions | NVIDIA RTX 3090 GPU |
| Wang et al. [38] | HAnet | P: Contrast-limited histogram adaptive equalization method and gamma adjustment (gamma = 1.2) C: An encoder network to extract features and a decoder network that maps those features D: Color intensity, Response to wavelet filters, Edge and line answers D: Hierarchical Features | PyTorch, A single NVIDIA GeForce Titan X GPU |
| Liskowski and Krawiec [39] | Deep Neural Networks (DNN) | P: Zero Phase Component Whitening (ZCA Whitening) and data augmentation C: CNNs are used to classify pixels and predict multiple pixels simultaneously D: Automatically learned and extracted using convolutional layers Features | Intel Core i7 processors and cards NVIDIA GTX Titan and Tesla K20c graphics |
| Cherukuri et al. [40] | Multi-Scale Regularized Deep Network for Vessel Segmentation (MSR-DNVS) | P: Zero Phase Component Whitening (ZCA Whitening) and data augmentation C: Convolutional Neural Network (CNN) in a representation layer, a task layer and convolutional filters at different scales D: Curvilinear geometric features and filters for retinal blood vessels | NVIDIA Titan X GPU (12 GB) using the TensorFlow package |
| Article | Database | Algorithm Metrics | Clinical Metrics |
|---|---|---|---|
| Guo [37] | DRIVE-AV | Sensitivity: 0.7984 ± 0.0029 Specificity: 0.9875 ± 0.0003 Accuracy: 0.9709 ± 0.0000 F1-Score: 0.8312 ± 0.0004 AUC-ROC: 0.9881 ± 0.0002 | N/A |
| CHASE DB1 | Sensitivity: 0.7945 ± 0.0026 Specificity: 0.9902 ± 0.0001 Accuracy: 0.9779 ± 0.0001 F1-Score: 0.9923 ± 0.0001 AUC-ROC: 0.8246 ± 0.0009 | N/A | |
| STARE | Sensitivity: 0.8298 ± 0.0031 Specificity: 0.9855 ± 0.0007 Accuracy: 0.9692 ± 0.0005 F1-Score: 0.8493 ± 0.0002 AUC-ROC: 0.9895 ± 0.0006 | N/A | |
| HRF | Sensitivity: 0.7828 ± 0.0028 Specificity: 0.9839 ± 0.0004 Accuracy: 0.9659 ± 0.0002 F1-Score: 0.9905 ± 0.0003 AUC-ROC: 0.8332 ± 0.0021 | N/A | |
| Wang et al. [38] | DRIVE-AV | Sensitivity: 79.91% Specificity: 98.13% Accuracy: 95.81% F1-Score: 82.93% AUC-ROC: 98.23% | N/A |
| CHASE DB1 | Sensitivity: 82.39% Specificity: 98.13% Accuracy: 96.70% F1-Score: 81.91% AUC-ROC: 98.71% | N/A | |
| STARE | Sensitivity: 81.86% Specificity: 98.44% Accuracy: 96.73% F1-Score: 83.79% AUC-ROC: 98.81% | N/A | |
| HRF | Sensitivity: 78.03% Specificity: 98.43% Accuracy: 96.54% F1-Score: 80.74% AUC-ROC: 98.54% | N/A | |
| Liskowski and Krawiec [39] | DRIVE-AV | Sensitivity: 78.11% Specificity: 98.07% Accuracy: 95.35% AUC-ROC: 97.90% Kappa: 79.10% | N/A |
| STARE | Sensitivity: 85.54% Specificity: 98.62% Accuracy: 97.29% AUC-ROC: 99.28% Kappa: 85.07% | N/A | |
| Cherukuri et al. [40] | DRIVE-AV | F1-Score: 80.87% Accuracy: 96.95% AUC-ROC: 98.13% | N/A |
| Article | Model | Preprocessing (P) Classifiers (C) Image Descriptors (D) | Computational Resource |
|---|---|---|---|
| Zhu et al. [41] | Extreme Learning Machine (ELM) | P: Channel extraction (RGB), Bottom-hat transformation and Gaussian filters C: ELM D: Hessian Characteristics, Morphological Transformations, Phase Congruence and Vector Field Divergence | Intel i7-4790K CPU at 4.0 GHz and 32 GB of memory. |
| Fan et al. [42] | Structured Learning | P: Edge Detection, Thresholding and Circular Hough Transform C: Random Forest D: Color, Magnitude, Pairs and Vector Features | PC equipped with an Intel (R) Core (TM) i-5 4210 M processor at 2.60 GHz and 4 GB of RAM |
| Article | Model | Preprocessing (P) Classifiers (C) Image Descriptors (D) | Computational Resource |
|---|---|---|---|
| Zhu et al. [41] | DRIVE-AV | Accuracy: 96.07% Sensitivity: 71.40% Specificity: 98.68% | N/A |
| RIS | Accuracy: 96.28% Sensitivity: 72.05% Specificity: 97.66% | N/A | |
| Fan et al. [42] | MESSIDOR | N/A C: Random Forest D: Color, Magnitude, Pairs and Vector Features | AOL: 0.8636 (0.1268) S: 0.9196 (0.1019) Ac: 0.9770 (0.0284) TPF: 0.9212 (0.1213) FPF: 0.0106 (0.0129) |
| Article | Model | Preprocessing (P) Classifiers (C) Image Descriptors (D) | Computational Resource |
|---|---|---|---|
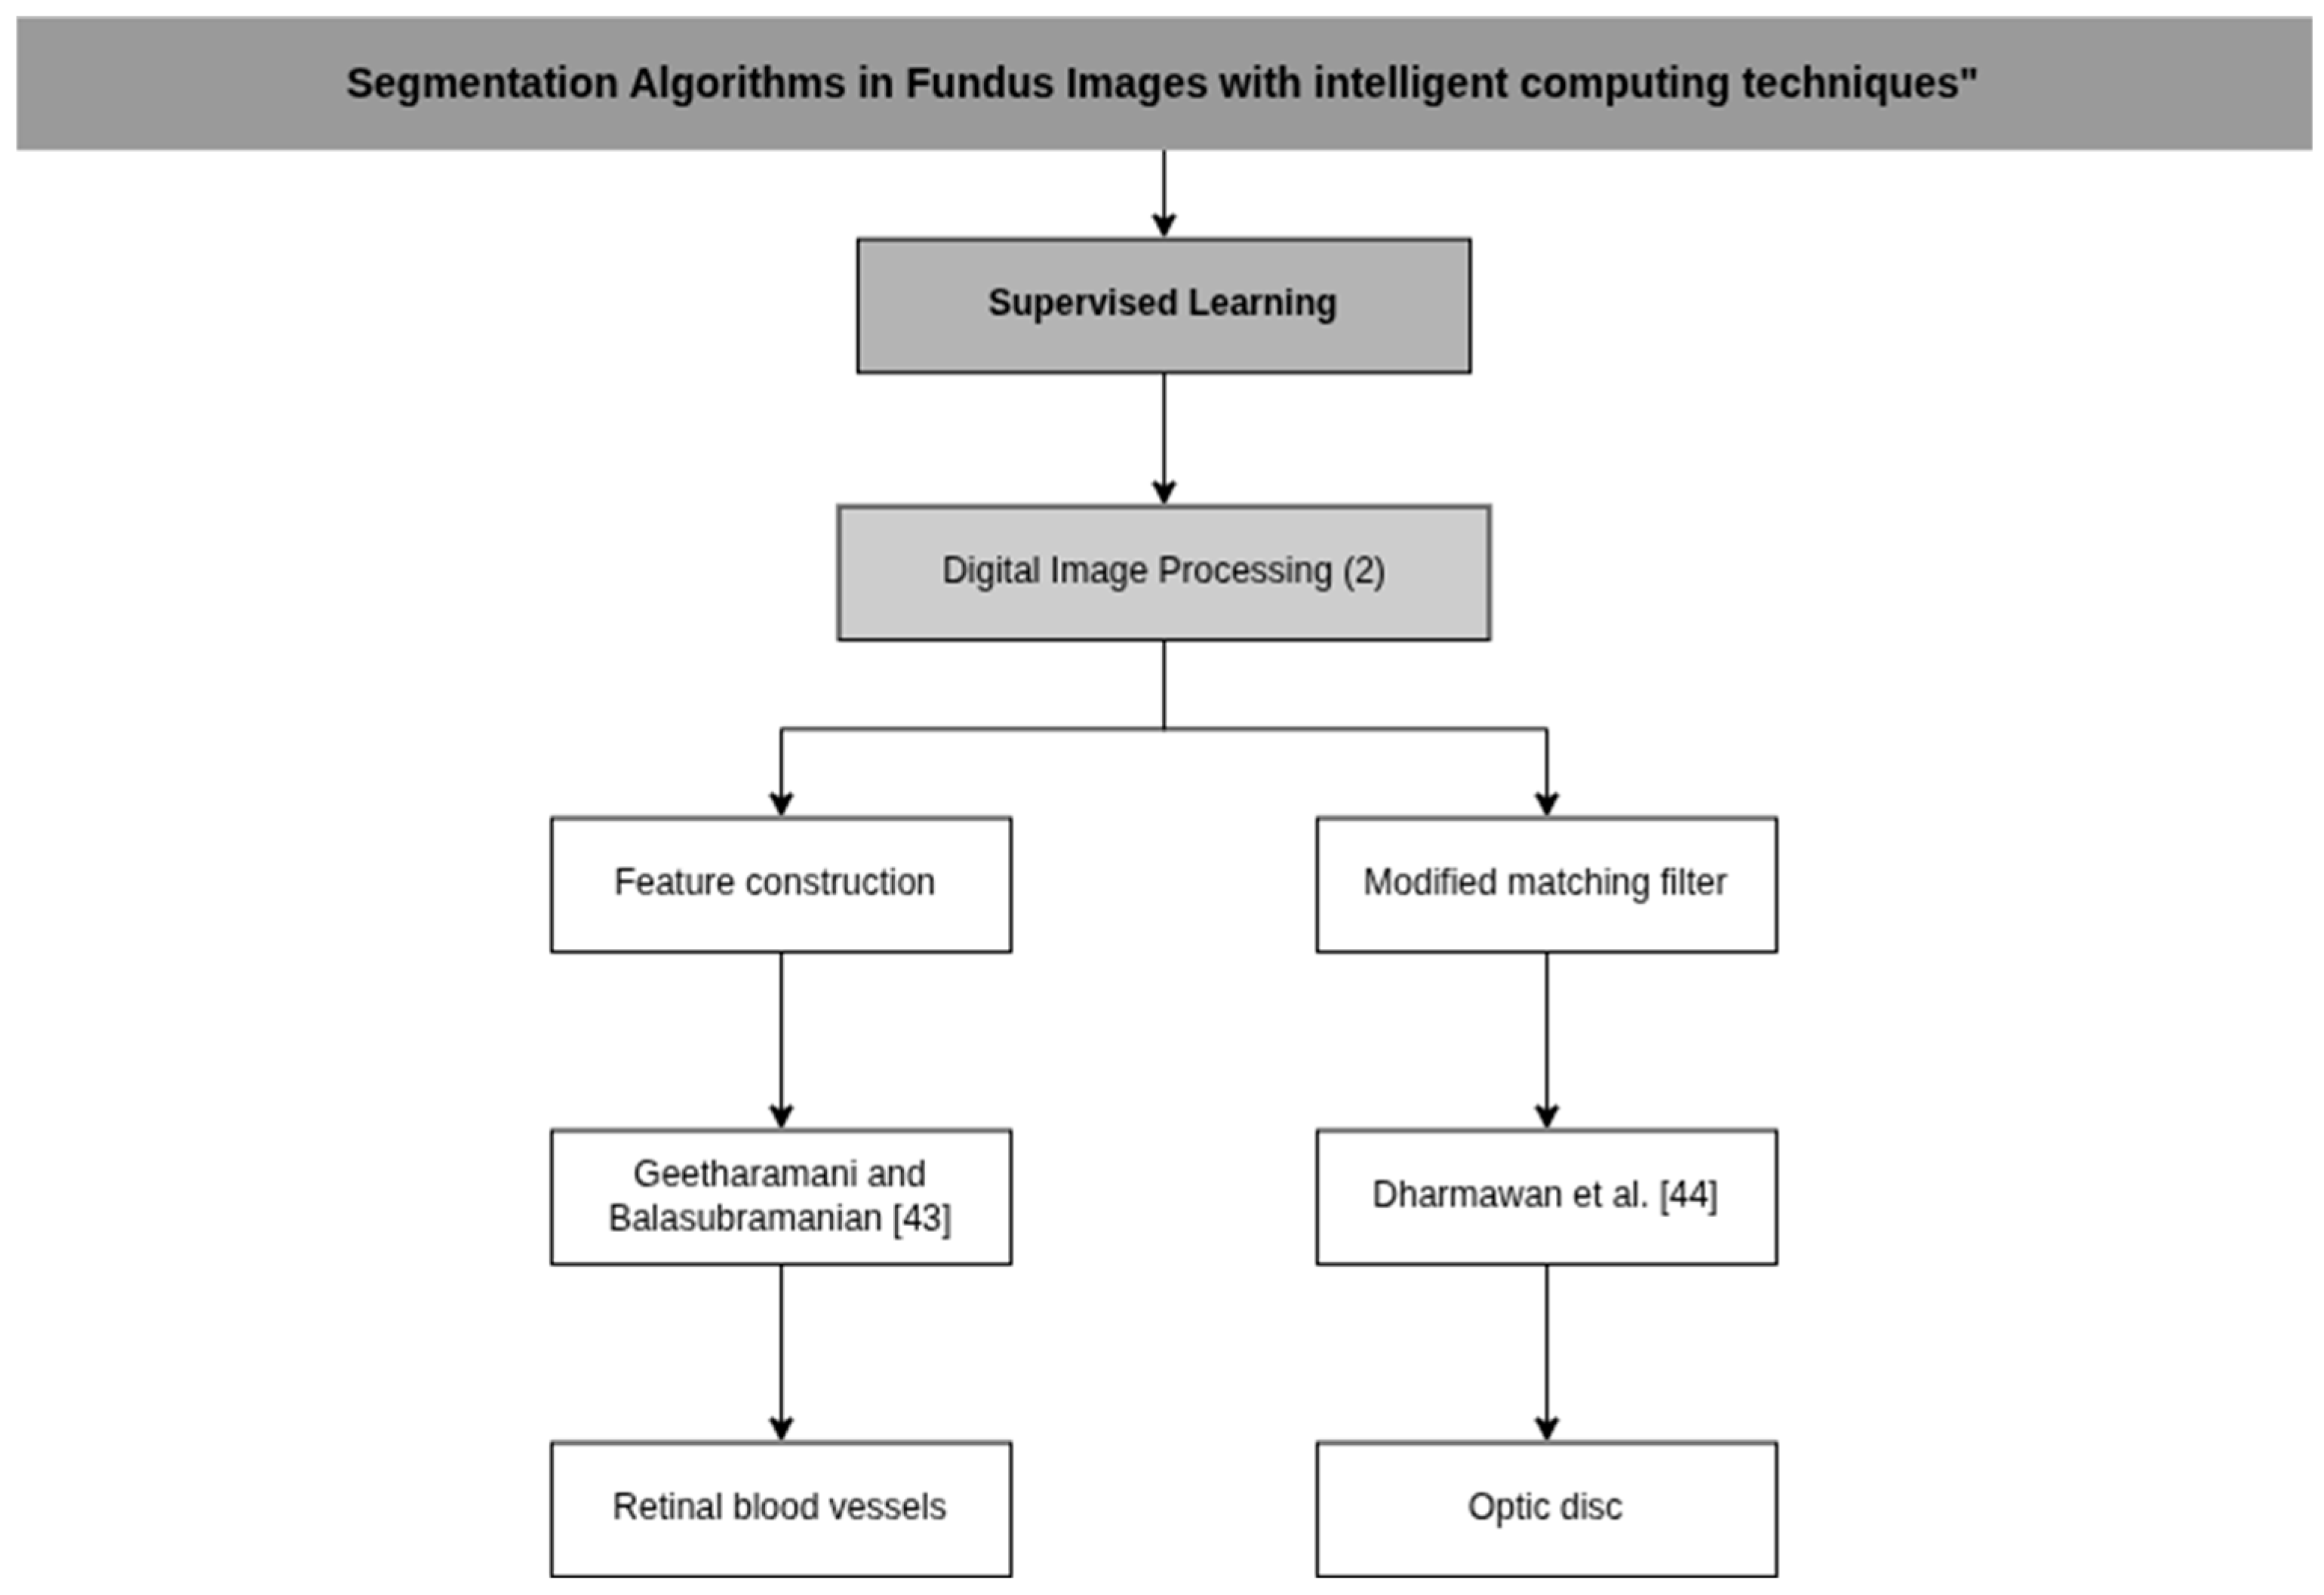
| Geetharamani and Balasubramanian [43] | Feature construction through principal component analysis | P: Color space conversion, channel extraction and Contrast enhancement using CLAHE C: K-Means, Naïve Bayes and C4.5 D: Principal Component Analysis (PCA), Gabor filtering and contrast enhancement technique | Intel i7-4790K CPU at 4.0 GHz and 32 GB of memory. |
| Dharmawan et al. [44] | Modified Dolph-Chebyshev matched filter | P: Regions of Interest Extraction (ROI) C: Template-based method, Vessel density-based method and Maximum entropy-based method | A computer with a 2.30 GHz Intel Core i5 processor and 4 GB of RAM. |
| Article | Database | Algorithm Metrics | Clinical Metrics |
|---|---|---|---|
| Geetharamani and Balasubramanian [43] | STARE | Accuracy: 95.20% Sensitivity: 71.34% Specificity: 81.46% | N/A |
| Dharmawan et al. [44] | DRIVE | N/A | AOL: 0.873 DC: 0.932 AC: 0.997 TPF: 0.914 TFF: 0.001 Sensitivity: 100% |
| Article | Model | Preprocessing (P) Classifiers (C) Image Descriptors (D) | Computational Resource |
|---|---|---|---|
| Ghosh et al. [45] | DeepLabv3+ | P: Gaussian Filtering, Binary Thresholding, Morphological Operations and Data Augmentation C: EfficientNet-B3 D: Binary Cross Entropy Loss (BCE), Tversky Index (TI) and Focal Tversky Loss (FTL) | N/A |
| Liu et al. [46] | Conditional Generative Adversarial Networks (cGANs) | P: Interest Segmentation and Resizing C: U-Net, M-Net, SegNet and cGANs | An GPU NVIDIA GTX 1080 Ti |
| Article | Database | Algorithm Metrics | Clinical Metrics |
|---|---|---|---|
| Ghosh et al. [45] | DRIVE, MESSIDOR, IDRiD, DIARETDB0, DIARETDB1 | DICE: 82.43% MIoU: 70.52% Sensitivity: 91.74% Specificity: 99.75% Accuracy: 99.57% | N/A |
| Liu et al. [46] | ORIGA | N/A | IoU od: 0.9420/0.0011 IoU oc: 0.7812 MIoU: 0.8460/0.0025 |
References
- Qin, Q.; Chen, Y. A review of retinal vessel segmentation for fundus image analysis. Eng. Appl. Artif. Intell. 2023, 128, 107454. [Google Scholar] [CrossRef]
- Chen, N.; Lv, X. Research on segmentation model of optic disc and optic cup in fundus. BMC Ophthalmol. 2024, 24, 273. [Google Scholar] [CrossRef]
- Huang, X.; Wang, H.; She, C.; Feng, J.; Liu, X.; Hu, X.; Chen, L.; Tao, Y. Artificial intelligence promotes the diagnosis and screening of diabetic retinopathy. Front. Endocrinol. 2022, 13, 946915. [Google Scholar] [CrossRef]
- Bansal, A.; Kubíček, J.; Penhaker, M.; Augustynek, M. A comprehensive review of optic disc segmentation methods in adult and pediatric retinal images: From conventional methods to artificial intelligence (CR-ODSeg-AP-CM2AI). Artif. Intell. Rev. 2025, 58, 121. [Google Scholar] [CrossRef]
- Page, M.J.; Moher, D.; Bossuyt, P.M.; Boutron, I.; Hoffmann, T.C.; Mulrow, C.D.; Shamseer, L.; Tetzlaff, J.M.; Akl, E.A.; Brennan, S.E.; et al. PRISMA 2020 explanation and elaboration: Updated guidance and exemplars for reporting systematic reviews. BMJ 2021, 372, n160. [Google Scholar] [CrossRef]
- Li, J.-P.O.; Liu, H.; Ting, D.S.J.; Jeon, S.; Chan, R.V.P.; Kim, J.E.; Sim, D.A.; Thomas, P.B.M.; Lin, H.; Chen, Y.; et al. Digital technology, tele-medicine and artificial intelligence in ophthalmology: A global perspective. Prog. Retin. Eye Res. 2021, 82, 100900. [Google Scholar] [CrossRef] [PubMed]
- PRISMA 2020 Flow Diagram. 2020. Available online: https://www.prisma-statement.org/prisma-2020-flow-diagram (accessed on 15 August 2025).
- Oguz, C.; Aydin, T.; Yaganoglu, M. A CNN-based hybrid model to detect glaucoma disease. Multimed. Tools Appl. 2023, 83, 17921–17939. [Google Scholar] [CrossRef]
- Pathan, S.; Kumar, P.; Pai, R.M.; Bhandary, S.V. An automated classification framework for glaucoma detection in fundus images using ensemble of dynamic selection methods. Prog. Artif. Intell. 2023, 12, 287–301. [Google Scholar] [CrossRef]
- Sun, X.; Xu, Y.; Zhao, W.; You, T.; Liu, J. Optic Disc Segmentation from Retinal Fundus Images via Deep Object Detection Networks. In Proceedings of the 2018 40th Annual International Conference of the IEEE Engineering in Medicine and Biology Society (EMBC), Honolulu, HI, USA, 18–21 July 2018; pp. 5954–5957. [Google Scholar] [CrossRef]
- Zhang, W.; Li, L.; Cheong, V.; Fu, B.; Aliasgari, M. Deep Encoder–Decoder Neural Networks for Retinal Blood Vessels Dense Prediction. Int. J. Comput. Intell. Syst. 2021, 14, 1078. [Google Scholar] [CrossRef]
- Xiong, H.; Liu, S.; Sharan, R.V.; Coiera, E.; Berkovsky, S. Weak label based Bayesian U-Net for optic disc segmentation in fundus images. Artif. Intell. Med. 2022, 126, 102261. [Google Scholar] [CrossRef]
- Shao, H.-C.; Chen, C.-Y.; Chang, M.-H.; Yu, C.-H.; Lin, C.-W.; Yang, J.-W. Retina-TransNet: A Gradient-Guided Few-Shot Retinal Vessel Segmentation Net. IEEE J. Biomed. Health Inform. 2023, 27, 4902–4913. [Google Scholar] [CrossRef]
- Hu, J.; Wang, H.; Wu, G.; Cao, Z.; Mou, L.; Zhao, Y.; Zhang, J. Multi-Scale Interactive Network With Artery/Vein Discriminator for Retinal Vessel Classification. IEEE J. Biomed. Health Inform. 2022, 26, 3896–3905. [Google Scholar] [CrossRef]
- Chowdhury, A.Z.M.E.; Mann, G.; Morgan, W.H.; Vukmirovic, A.; Mehnert, A.; Sohel, F. MSGANet-RAV: A multiscale guided attention network for artery-vein segmentation and classification from optic disc and retinal images. J. Optom. 2022, 15, S58–S69. [Google Scholar] [CrossRef] [PubMed]
- Li, F.; Xiang, W.; Zhang, L.; Pan, W.; Zhang, X.; Jiang, M.; Zou, H. Joint optic disk and cup segmentation for glaucoma screening using a region-based deep learning network. Eye 2023, 37, 1080–1087. [Google Scholar] [CrossRef] [PubMed]
- Elmannai, H.; Hamdi, M.; Meshoul, S.; Alhussan, A.A.; Ayadi, M.; Ksibi, A. An Improved Deep Learning Framework for Automated Optic Disc Localization and Glaucoma Detection. Comput. Model. Eng. Sci. 2024, 140, 1429–1457. [Google Scholar] [CrossRef]
- Balasubramanian, K.; NP, A. ANN Classification and Modified Otsu Labeling on Retinal Blood Vessels. Curr. Signal Transduct. Ther. 2021, 16, 82–90. [Google Scholar] [CrossRef]
- Devi, Y.A.S.; Kamsali, M.C. Retinal Blood Vessel Segmentation through Morphology Cascaded Features and Supervised Learning. J. Sci. Ind. Res. 2024, 83, 264–273. [Google Scholar] [CrossRef]
- Rehman, A.; Harouni, M.; Karimi, M.; Saba, T.; Bahaj, S.A.; Awan, M.J. Microscopic retinal blood vessels detection and segmentation using support vector machine and K-nearest neighbors. Microsc. Res. Tech. 2022, 85, 1899–1914. [Google Scholar] [CrossRef]
- Saeed, A.N. A Machine Learning based Approach for Segmenting Retinal Nerve Images using Artificial Neural Networks. Eng. Technol. Appl. Sci. Res. 2020, 10, 5986–5991. [Google Scholar] [CrossRef]
- Kitchenham, B.; Mendes, E.; Travassos, G. A Systematic Review of Cross-vs. Within-Company Cost Estimation Studies. In Proceedings of the Evaluation and Assessment in Software Engineering (EASE), Keele, UK, 10–11 April 2006. [Google Scholar]
- Yap, B.P.; Ng, B.K. Coarse-to-fine visual representation learning for medical images via class activation maps. Comput. Biol. Med. 2024, 171, 108203. [Google Scholar] [CrossRef]
- Chen, K.; Qin, T.; Lee, V.H.-F.; Yan, H.; Li, H. Learning Robust Shape Regularization for Generalizable Medical Image Segmentation. IEEE Trans. Med. Imaging 2024, 43, 2693–2706. [Google Scholar] [CrossRef]
- Aurangzeb, K.; Alharthi, R.S.; Haider, S.I.; Alhussein, M. Systematic Development of AI-Enabled Diagnostic Systems for Glaucoma and Diabetic Retinopathy. IEEE Access 2023, 11, 105069–105081. [Google Scholar] [CrossRef]
- Morís, D.I.; Hervella, Á.S.; Rouco, J.; Novo, J.; Ortega, M. Context encoder transfer learning approaches for retinal image analysis. Comput. Biol. Med. 2023, 152, 106451. [Google Scholar] [CrossRef]
- Abdullah Alkhaldi, N.; Halawani, H.T. Intelligent Machine Learning Enabled Retinal Blood Vessel Segmentation and Classification. Comput. Mater. Contin. 2023, 74, 399–414. [Google Scholar] [CrossRef]
- Zhang, T.; Wei, L.; Chen, N.; Li, J. Learning based multi-scale feature fusion for retinal blood vessels segmentation. J. Algorithms Comput. Technol. 2022, 16, 174830262110653. [Google Scholar] [CrossRef]
- Zhou, Y.; Wagner, S.K.; Chia, M.A.; Zhao, A.; Woodward-Court, P.; Xu, M.; Struyven, R.; Alexander, D.C.; Keane, P.A. AutoMorph: Automated Retinal Vascular Morphology Quantification Via a Deep Learning Pipeline. Transl. Vis. Sci. Technol. 2022, 11, 12. [Google Scholar] [CrossRef]
- Li, J.; Hu, Q.; Imran, A.; Zhang, L.; Yang, J.; Wang, Q. Vessel Recognition of Retinal Fundus Images Based on Fully Convolutional Network. In Proceedings of the 2018 IEEE 42nd Annual Computer Software and Applications Conference (COMPSAC), Tokyo, Japan, 23–27 July 2018; pp. 413–418. [Google Scholar] [CrossRef]
- Wang, S.; Yu, X.; Jia, W.; Chi, J.; Lv, P.; Wang, J.; Wu, C. Optic disc detection based on fully convolutional network and weighted matrix recovery model. Med. Biol. Eng. Comput. 2023, 61, 3319–3333. [Google Scholar] [CrossRef]
- Zhou, Y.; Xu, M.; Hu, Y.; Blumberg, S.B.; Zhao, A.; Wagner, S.K.; Keane, P.A.; Alexander, D.C. CF-Loss: Clinically-relevant feature optimised loss function for retinal multi-class vessel segmentation and vascular feature measurement. Med. Image Anal. 2024, 93, 103098. [Google Scholar] [CrossRef] [PubMed]
- Li, Z.; Zhao, C.; Han, Z.; Hong, C. TUNet and domain adaptation based learning for joint optic disc and cup segmentation. Comput. Biol. Med. 2023, 163, 107209. [Google Scholar] [CrossRef] [PubMed]
- Rong, Y.; Xiong, Y.; Li, C.; Chen, Y.; Wei, P.; Wei, C.; Fan, Z. Segmentation of retinal vessels in fundus images based on U-Net with self-calibrated convolutions and spatial attention modules. Med. Biol. Eng. Comput. 2023, 61, 1745–1755. [Google Scholar] [CrossRef]
- Sun, K.; Chen, Y.; Chao, Y.; Geng, J.; Chen, Y. A retinal vessel segmentation method based improved U-Net model. Biomed. Signal Process. Control 2023, 82, 104574. [Google Scholar] [CrossRef]
- Wang, B.; Wang, S.; Qiu, S.; Wei, W.; Wang, H.; He, H. CSU-Net: A Context Spatial U-Net for Accurate Blood Vessel Segmentation in Fundus Images. IEEE J. Biomed. Health Inform. 2021, 25, 1128–1138. [Google Scholar] [CrossRef] [PubMed]
- Guo, S. CSGNet: Cascade semantic guided net for retinal vessel segmentation. Biomed. Signal Process. Control 2022, 78, 103930. [Google Scholar] [CrossRef]
- Wang, D.; Haytham, A.; Pottenburgh, J.; Saeedi, O.; Tao, Y. Hard Attention Net for Automatic Retinal Vessel Segmentation. IEEE J. Biomed. Health Inform. 2020, 24, 3384–3396. [Google Scholar] [CrossRef] [PubMed]
- Liskowski, P.; Krawiec, K. Segmenting Retinal Blood Vessels with<?Pub _newline ?>Deep Neural Networks. IEEE Trans. Med. Imaging 2016, 35, 2369–2380. [Google Scholar] [CrossRef]
- Cherukuri, V.; Vijay Kumar, B.G.; Bala, R.; Monga, V. Multi-Scale Regularized Deep Network for Retinal Vessel Segmentation. In Proceedings of the 2019 IEEE International Conference on Image Processing (ICIP), Taipei, Taiwan, 22–25 September 2019; pp. 824–828. [Google Scholar] [CrossRef]
- Zhu, C.; Zou, B.; Zhao, R.; Cui, J.; Duan, X.; Chen, Z.; Liang, Y. Retinal vessel segmentation in colour fundus images using Extreme Learning Machine. Comput. Med. Imaging Graph. 2017, 55, 68–77. [Google Scholar] [CrossRef]
- Fan, Z.; Rong, Y.; Cai, X.; Lu, J.; Li, W.; Lin, H.; Chen, X. Optic Disk Detection in Fundus Image Based on Structured Learning. IEEE J. Biomed. Health Inform. 2018, 22, 224–234. [Google Scholar] [CrossRef]
- Geetharamani, R.; Balasubramanian, L. Automatic segmentation of blood vessels from retinal fundus images through image processing and data mining techniques. Sadhana 2015, 40, 1715–1736. [Google Scholar] [CrossRef]
- Dharmawan, D.A.; Ng, B.P.; Rahardja, S. A new optic disc segmentation method using a modified Dolph-Chebyshev matched filter. Biomed. Signal Process. Control 2020, 59, 101932. [Google Scholar] [CrossRef]
- Ghosh, A.; Khose, S.; Kamath, Y.S.; Kuzhuppilly, N.I.R.; Harish Kumar, J.R. Fovea Segmentation Using Semi-Supervised Learning. In Proceedings of the 2023 IEEE 20th India Council International Conference (INDICON), Hyderabad, India, 14–17 December 2023; pp. 590–595. [Google Scholar] [CrossRef]
- Liu, S.; Hong, J.; Lu, X.; Jia, X.; Lin, Z.; Zhou, Y.; Liu, Y.; Zhang, H. Joint optic disc and cup segmentation using semi-supervised conditional GANs. Comput. Biol. Med. 2019, 115, 103485. [Google Scholar] [CrossRef]
- Jiang, L.; Li, W.; Xiong, Z.; Yuan, G.; Huang, C.; Xu, W.; Zhou, L.; Qu, C.; Wang, Z.; Tong, Y. Retinal Vessel Segmentation Based on Self-Attention Feature Selection. Electronics 2024, 13, 3514. [Google Scholar] [CrossRef]
- Duan, Y.; Yang, R.; Zhao, M.; Qi, M.; Peng, S.-L. DAF-UNet: Deformable U-Net with Atrous-Convolution Feature Pyramid for Retinal Vessel Segmentation. Mathematics 2025, 13, 1454. [Google Scholar] [CrossRef]
- DRIVE 2004. Available online: https://www.kaggle.com/datasets/zionfuo/drive2004 (accessed on 15 October 2025).
- STARE Dataset. Available online: https://www.kaggle.com/datasets/vidheeshnacode/stare-dataset (accessed on 15 October 2025).
- CHASEDB1. Available online: https://www.kaggle.com/datasets/khoongweihao/chasedb1 (accessed on 15 October 2025).
- Odstrcilik, J.; Kolar, R.; Budai, A.; Hornegger, J.; Jan, J.; Gazarek, J.; Kubena, T.; Cernosek, P.; Svoboda, O.; Angelopoulou, E. Retinal vessel segmentation by improved matched filtering: Evaluation on a new high-resolution fundus image database. IET Image Process. 2013, 7, 373–383. [Google Scholar] [CrossRef]
- Maffre Gervais Gauthier, G.P.; Lay, B.; Roger, J.; Elie, D.; Foltete, M.; Donjon, A.; Hugo. Messidor, ADCIS. 2025. Available online: https://www.adcis.net/en/third-party/messidor/ (accessed on 15 October 2025).
- Sivapriya, G.; Manjula Devi, R.; Keerthika, P.; Praveen, V. Automated diagnostic classification of diabetic retinopathy with microvascular structure of fundus images using deep learning method. Biomed. Signal Process. Control 2024, 88, 105616. [Google Scholar] [CrossRef]
- Sankari, V.M.R.; Umapathy, U.; Alasmari, S.; Aslam, S.M. Automated Detection of Retinopathy of Prematurity Using Quantum Machine Learning and Deep Learning Techniques. IEEE Access 2023, 11, 94306–94321. [Google Scholar] [CrossRef]
- Ejaz, S.; Baig, R.; Ashraf, Z.; Alnfiai, M.M.; Alnahari, M.M.; Alotaibi, R.M. A deep learning framework for the early detection of multi-retinal diseases. PLoS ONE 2024, 19, e0307317. [Google Scholar] [CrossRef] [PubMed]
- Diener, R.; Renz, A.W.; Eckhard, F.; Segbert, H.; Eter, N.; Malcherek, A.; Biermann, J. Automated Classification of Physiologic, Glaucomatous, and Glaucoma-Suspected Optic Discs Using Machine Learning. Diagnostics 2024, 14, 1073. [Google Scholar] [CrossRef]
- Muangnak, N.; Sriman, B.; Ghosh, S.; Su, C. A Comparison of Texture-Based Diabetic Retinopathy Classification Using Diverse Fundus Image Color Models. ICIC Exp. Lett. Part B Appl. 2024, 5, 505–513. [Google Scholar] [CrossRef]
- Wu, T.; Ju, L.; Fu, X.; Wang, B.; Ge, Z.; Liu, Y. Deep Learning Detection of Early Retinal Peripheral Degeneration From Ultra-Widefield Fundus Photographs of Asymptomatic Young Adult (17–19 Years) Candidates to Airforce Cadets. Transl. Vis. Sci. Technol. 2024, 13, 1. [Google Scholar] [CrossRef]
- Dasari, S.; Poonguzhali, B.; Rayudu, M.S. An efficient machine learning approach for classification of diabetic retinopathy stages. Indones. J. Electr. Eng. Comput. Sci. 2023, 30, 81. [Google Scholar] [CrossRef]
- Gupta, S.; Thakur, S.; Gupta, A. Comparative study of different machine learning models for automatic diabetic retinopathy detection using fundus image. Multimed. Tools Appl. 2023, 83, 34291–34322. [Google Scholar] [CrossRef]
- Rachapudi, V.; Rao, K.S.; Rao, T.S.M.; Dileep, P.; Deepika Roy, T.L. Diabetic retinopathy detection by optimized deep learning model. Multimed. Tools Appl. 2023, 82, 27949–27971. [Google Scholar] [CrossRef]
- Sanghavi, J.; Kurhekar, M. An efficient framework for optic disk segmentation and classification of Glaucoma on fundus images. Biomed. Signal Process. Control 2024, 89, 105770. [Google Scholar] [CrossRef]
- Yi, D.; Baltov, P.; Hua, Y.; Philip, S.; Sharma, P.K. Compound Scaling Encoder-Decoder (CoSED) Network for Diabetic Retinopathy Related Bio-Marker Detection. IEEE J. Biomed. Health Inform. 2024, 28, 1959–1970. [Google Scholar] [CrossRef]
- Irshad, S.; Yin, X.; Zhang, Y. A new approach for retinal vessel differentiation using binary particle swarm optimization. Comput. Methods Biomech. Biomed. Eng. Imaging Vis. 2021, 9, 510–522. [Google Scholar] [CrossRef]
- Liu, Y.; Shen, J.; Yang, L.; Yu, H.; Bian, G. Wave-Net: A lightweight deep network for retinal vessel segmentation from fundus images. Comput. Biol. Med. 2023, 152, 106341. [Google Scholar] [CrossRef]
- Raza, M.; Naveed, K.; Akram, A.; Salem, N.; Afaq, A.; Madni, H.A.; Khan, M.A.U.; Din, M.-Z. DAVS-NET: Dense Aggregation Vessel Segmentation Network for retinal vasculature detection in fundus images. PLoS ONE 2021, 16, e0261698. [Google Scholar] [CrossRef] [PubMed]
- Li, K.; Qi, X.; Luo, Y.; Yao, Z.; Zhou, X.; Sun, M. Accurate Retinal Vessel Segmentation in Color Fundus Images via Fully Attention-Based Networks. IEEE J. Biomed. Health Inform. 2021, 25, 2071–2081. [Google Scholar] [CrossRef] [PubMed]
- Lu, Z.; Chen, D. Weakly Supervised and Semi-Supervised Semantic Segmentation for Optic Disc of Fundus Image. Symmetry 2020, 12, 145. [Google Scholar] [CrossRef]
- Kadambi, S.; Wang, Z.; Xing, E. WGAN domain adaptation for the joint optic disc-and-cup segmentation in fundus images. Int. J. Comput. Assist. Radiol. Surg. 2020, 15, 1205–1213. [Google Scholar] [CrossRef]
- Hemelings, R.; Elen, B.; Stalmans, I.; Van Keer, K.; De Boever, P.; Blaschko, M.B. Artery–vein segmentation in fundus images using a fully convolutional network. Comput. Med. Imaging Graph. 2019, 76, 101636. [Google Scholar] [CrossRef] [PubMed]
- Liu, Y.; Wu, J.; Zhu, Y.; Zhou, X. Combined Optic Disc and Optic Cup Segmentation Network Based on Adversarial Learning. IEEE Access 2024, 12, 104898–104908. [Google Scholar] [CrossRef]
- Fu, H.; Cheng, J.; Xu, Y.; Wong, D.W.K.; Liu, J.; Cao, X. Joint Optic Disc and Cup Segmentation Based on Multi-Label Deep Network and Polar Transformation. IEEE Trans. Med. Imaging 2018, 37, 1597–1605. [Google Scholar] [CrossRef]
- Ávila, F.J.; Bueno, J.M.; Remón, L. Superpixel-Based Optic Nerve Head Segmentation Method of Fundus Images for Glaucoma Assessment. Diagnostics 2022, 12, 3210. [Google Scholar] [CrossRef] [PubMed]
- Gibbon, S.; Muniz-Terrera, G.; Yii, F.S.L.; Hamid, C.; Cox, S.; Maccormick, I.J.C.; Tatham, A.J.; Ritchie, C.; Trucco, E.; Dhillon, B.; et al. PallorMetrics: Software for Automatically Quantifying Optic Disc Pallor in Fundus Photographs, and Associations with Peripapillary RNFL Thickness. Transl. Vis. Sci. Technol. 2024, 13, 20. [Google Scholar] [CrossRef]
- Zhao, R.; Liao, W.; Zou, B.; Chen, Z.; Li, S. Weakly-Supervised Simultaneous Evidence Identification and Segmentation for Automated Glaucoma Diagnosis. Proc. AAAI Conf. Artif. Intell. 2019, 33, 809–816. [Google Scholar] [CrossRef]
- Adapa, D.; Raj, A.N.J.; Alisetti, S.N.; Zhuang, Z.; K, G.; Naik, G. A supervised blood vessel segmentation technique for digital Fundus images using Zernike Moment based features. PLoS ONE 2020, 15, e0229831. [Google Scholar] [CrossRef]
- Srinidhi, C.L.; Aparna, P.; Rajan, J. A visual attention guided unsupervised feature learning for robust vessel delineation in retinal images. Biomed. Signal Process. Control 2018, 44, 110–126. [Google Scholar] [CrossRef]
- Fernandez-Granero, M.A.; Vega, A.S.; García, A.I.; Sanchez-Morillo, D.; Jiménez, S.; Alemany, P.; Fondón, I. Automatic Tool for Optic Disc and Cup Detection on Retinal Fundus Images. In Advances in Computational Intelligence 10305; Rojas, I., Joya, G., Catala, A., Eds.; In Lecture Notes in Computer Science 10305; Springer International Publishing: Cham, Switzerland, 2017; pp. 246–256. [Google Scholar] [CrossRef]
- Mathews, M.R.; Anzar, S.M.; Krishnan, R.K.; Panthakkan, A. EfficientNet for retinal blood vessel segmentation. In Proceedings of the 2020 3rd International Conference on Signal Processing and Information Security (ICSPIS), DUBAI, United Arab Emirates, 25–26 November 2020; pp. 1–4. [Google Scholar] [CrossRef]

| Research Question | Motivation |
|---|---|
| Which are the most effective preprocessing methods for digital fundus images to enhance their quality and facilitate the segmentation of anatomical structures? | To identify preprocessing techniques that reduce noise, enhance image quality, and enable more precise and efficient segmentation. |
| How does the performance of machine learning-based algorithms compare to traditional segmentation methods in terms of accuracy and computational efficiency? | Analyze the impact of machine learning on segmentation, exploring whether its improvements in accuracy justify its computational cost compared to traditional methods. |
| What machine learning methods have been used for the segmentation of anatomical structures in digital fundus images and what are the results reported in terms of accuracy and computational efficiency? | Research and contrast the most commonly used machine learning methods for the segmentation of structures such as the optic nerve, vascular arcades, and the fovea, evaluating their performance in terms of accuracy and computational resources |
| What is the impact of computational cost when developing a segmentation algorithm for low-cost clinical applications? | To analyze the feasibility of implementing segmentation algorithms in resource-limited settings, seeking solutions that balance computational efficiency and clinical accessibility. |
| Descriptor | Category | Synonym |
|---|---|---|
| Machine learning | Independent variable | Deep learning, supervised learning, AI |
| Segmentation | Independent variable | Image processing, region identification |
| Fundus photography | Dependent variable | Retinal imaging, eye fundus photography |
| Image segmentation | Dependent variable | Image analysis |
| Ophthalmology | Dependent variable | Anatomical structure |
| Database | Search Query |
|---|---|
| SCOPUS | (TITLE-ABS-KEY (machine AND learning) AND TITLE-ABS-KEY (segmentation) AND TITLE-ABS-KEY (fundus AND image)) AND PUBYEAR > 2013 AND PUBYEAR < 2025 AND (LIMIT-TO (EXACTKEYWORD, “Image Segmentation”) OR LIMIT-TO (EXACTKEYWORD, “Ophthalmology”) OR LIMIT-TO (EXACTKEYWORD, “Eye Fundus”) OR LIMIT-TO (EXACTKEYWORD, “Machine Learning”) OR LIMIT-TO (EXACTKEYWORD, “Algorithm”)) AND ( LIMIT-TO (DOCTYPE, “ar”)) AND (LIMIT-TO (LANGUAGE, “English”)) |
| PUBMED | “machine learning and segmentation and fundus photography and image segmentation and Ophthalmology” |
| IEEE XPLORE | “machine learning and segmentation and fundus image and image segmentation and Ophthalmology” |
| Cluster | Representative References | Main Contribution | Reason for Exclusion |
|---|---|---|---|
| Pathology-oriented (diagnosis) | A CNN-based hybrid model to detect glaucoma disease [8], Automated classification framework for glaucoma detection [9] | Models for disease diagnosis | Focused on pathology classification rather than segmentation |
| Methodological misalignment | Optic Disc Segmentation via Deep Object Detection Networks [10], Deep encoder–decoder neural networks for retinal blood vessels dense prediction [11] | Bounding box detection or dense prediction approaches | Did not perform pixel-level anatomical segmentation |
| Weak/alternative supervision | Weak label based Bayesian U-Net for optic disc segmentation [12], Retina-TransNet: A Gradient-Guided Few-Shot Retinal Vessel Segmentation Net [13] | Semi/weakly supervised or few-shot segmentation methods | Methodology focused on label generation or few-shot premise, not general segmentation performance |
| Artery/vein classification in pathology | Multi-Scale Interactive Network With Artery/Vein Discriminator for Retinal Vessel Classification [14], MSGANet-RAV: A multiscale guided attention network for artery-vein segmentation and classification from optic disc and retinal images [15] | Discrimination between arteries and veins | Task was classification of vessel type, not segmentation |
| Glaucoma-specific segmentation | Joint OD/CS for glaucoma screening using a region-based deep learning network [16], An Improved Deep Learning Framework for Automated Optic Disc Localization and Glaucoma Detection [17] | Segmentation of OD/OC structures for CDR estimation | Intrinsically motivated by glaucoma diagnosis |
| Traditional methods | ANN Classification and Modified Otsu Labeling on Retinal Blood Vessels [18], Retinal Blood Vessel Segmentation through Morphology Cascaded Features and Supervised Learning [19] | Classical feature extraction and thresholding techniques | Considered outperformed when compared to current Deep Learning based methods |
| Narrow works | Microscopic retinal blood vessels detection and segmentation using support vector machine and K-nearest neighbors [20], A Machine Learning based Approach for Segmenting Retinal Nerve Images using Artificial Neural Networks [21] | Methods targeting specific structures or pathological datasets | Too narrow to generalize to segmentation of healthy anatomical regions |
| Retracted works | Three works retracted found | ||
| Quality Criterion (QA) | Criterion |
|---|---|
| QA1 | Does the article clearly define the diagnostic problem? |
| QA2 | Does the article explain the architecture of the intelligent computing techniques model used? |
| QA3 | Does the article specify the dataset used and its origin? |
| QA4 | Does the article describe standard metrics to evaluate the model? |
| QA5 | Do the conclusions reflect the obtained results and trier objectives? |
| QA6 | Does the study provide validated clinical evidence on the effectiveness of the model? |
| Article | QA1 | QA2 | QA3 | QA4 | QA5 | QA6 | Score |
|---|---|---|---|---|---|---|---|
| Yap and Ng [23] | 2 | 3 | 3 | 2 | 2 | 1 | 13 |
| Chen et al. [24] | 2 | 3 | 1 | 1 | 2 | 2 | 11 |
| Aurangzeb et al. [25] | 2 | 3 | 2 | 2 | 2 | 2 | 13 |
| Morís et al. [26] | 3 | 3 | 3 | 2 | 2 | 2 | 15 |
| Abdullah Alkhaldi and T. Halawani [27] | 2 | 3 | 1 | 2 | 2 | 1 | 12 |
| Zhang et al. [28] | 2 | 3 | 3 | 2 | 2 | 1 | 13 |
| Zhou et al. [29] | 3 | 3 | 3 | 2 | 2 | 1 | 14 |
| Li et al. [30] | 2 | 2 | 2 | 3 | 3 | 2 | 14 |
| Wang et al. [31] | 3 | 2 | 2 | 2 | 3 | 1 | 13 |
| Zhou et al. [32] | 3 | 3 | 3 | 3 | 2 | 3 | 17 |
| Li et al. [33] | 3 | 3 | 3 | 3 | 2 | 3 | 17 |
| Rong et al. [34] | 3 | 3 | 3 | 3 | 2 | 2 | 16 |
| Sun et al. [35] | 3 | 3 | 3 | 2 | 2 | 2 | 15 |
| Wang et al. [36] | 3 | 3 | 3 | 3 | 2 | 3 | 17 |
| Guo [37] | 2 | 3 | 3 | 2 | 3 | 2 | 15 |
| Wang et al. [38] | 2 | 3 | 3 | 2 | 2 | 1 | 13 |
| Liskowski and Krawiec [39] | 3 | 3 | 3 | 2 | 2 | 1 | 14 |
| Cherukuri et al. [40] | 3 | 3 | 2 | 2 | 2 | 1 | 13 |
| Zhu et al. [41] | 2 | 3 | 3 | 2 | 2 | 1 | 13 |
| Fan et al. [42] | 3 | 3 | 3 | 2 | 2 | 1 | 14 |
| Geetharamani and Balasubramanian [43] | 3 | 3 | 2 | 2 | 2 | 1 | 13 |
| Dharmawan et al. [44] | 3 | 3 | 2 | 2 | 2 | 2 | 14 |
| Ghosh et al. [45] | 3 | 3 | 3 | 2 | 2 | 1 | 14 |
| Liu et al. [46] | 3 | 3 | 2 | 2 | 2 | 1 | 13 |
| Jiang et al. [47] | 2 | 3 | 3 | 3 | 2 | 3 | 16 |
| Duan et al. [48] | 3 | 2 | 3 | 3 | 2 | 3 | 16 |
| Dataset | Nº of Images | Approx. Resolution |
|---|---|---|
| DRIVE (Digital Retinal Images for Vessel Extraction) [49] | 40 images (20 train, 20 test) | 565 × 584 px |
| STARE (STructured Analysis of the Retina) [50] | 20 images | 700 × 605 px |
| CHASE_DB1 (Child Heart and Health Study in England) [51] | 28 images | 999 × 960 px |
| HRF (High Resolution Fundus) [52] | 45 images (15 healthy, 15 glaucomatous, 15 diabetic) | 3504 × 2336 px |
| MESSIDOR [53] | 1200 images | 1440 × 960 px |
Disclaimer/Publisher’s Note: The statements, opinions and data contained in all publications are solely those of the individual author(s) and contributor(s) and not of MDPI and/or the editor(s). MDPI and/or the editor(s) disclaim responsibility for any injury to people or property resulting from any ideas, methods, instructions or products referred to in the content. |
© 2025 by the authors. Licensee MDPI, Basel, Switzerland. This article is an open access article distributed under the terms and conditions of the Creative Commons Attribution (CC BY) license (https://creativecommons.org/licenses/by/4.0/).
Share and Cite
Zazueta, L.J.G.; Covarrubias, B.L.L.; Cota, C.X.N.; Briseño, M.V.; Hipólito, J.I.N.; Rodríguez, G.J.A. Segmentation Algorithms in Fundus Images: A Review of Digital Image Analysis Techniques. Appl. Sci. 2025, 15, 11324. https://doi.org/10.3390/app152111324
Zazueta LJG, Covarrubias BLL, Cota CXN, Briseño MV, Hipólito JIN, Rodríguez GJA. Segmentation Algorithms in Fundus Images: A Review of Digital Image Analysis Techniques. Applied Sciences. 2025; 15(21):11324. https://doi.org/10.3390/app152111324
Chicago/Turabian StyleZazueta, Laura Johana González, Betsaida Lariza López Covarrubias, Christian Xavier Navarro Cota, Mabel Vázquez Briseño, Juan Iván Nieto Hipólito, and Gener José Avilés Rodríguez. 2025. "Segmentation Algorithms in Fundus Images: A Review of Digital Image Analysis Techniques" Applied Sciences 15, no. 21: 11324. https://doi.org/10.3390/app152111324
APA StyleZazueta, L. J. G., Covarrubias, B. L. L., Cota, C. X. N., Briseño, M. V., Hipólito, J. I. N., & Rodríguez, G. J. A. (2025). Segmentation Algorithms in Fundus Images: A Review of Digital Image Analysis Techniques. Applied Sciences, 15(21), 11324. https://doi.org/10.3390/app152111324


