Abstract
This paper presents the development of a modular and low-cost IoT (Internet of Things) system for remote monitoring of essential parameters during wine fermentation, designed for small and medium-sized wineries—Winnie. The system combines distributed embedded sensing units with centralized colorimetric analysis and real-time data transmission to a remote server. Barrel-mounted devices measure wine and cellar parameters (temperature, humidity, and CO2 concentration), while a central hub performs colorimetric SO2 analysis using an RGB color sensor and automated fluid handling. Communication between the Barrel and Hub device relies on the RS-485 protocol, providing robustness in harsh winery conditions. All measurements are securely transferred via Wi-Fi. A hash-based integrity check ensures continuous and reliable data collection. The modular design, simple installation, and user-friendly web interface make the system accessible to winemakers. This technology provides a scalable method for digitalizing conventional winemaking processes by reducing the cost and complexity of wine quality monitoring.
1. Introduction
Wine, like many traditional fermented foods, is often produced through spontaneous fermentation, driven by naturally occurring yeasts found on grape skins and in the surrounding environment. The process is also strongly influenced by external factors such as temperature and humidity [1,2]. The winemaking process, from harvesting and pressing to fermentation, aging, and bottling, represents a complex interaction of biochemical reactions and human expertise [3]. During fermentation, yeast converts sugars in the must into ethanol, carbon dioxide CO2, and secondary metabolites that define the wine’s aroma and flavor. Monitoring changes in must density, which gradually decreases as sugars are consumed, provides valuable insight into fermentation dynamics [4]. Among the parameters affecting fermentation, temperature and specific gravity are particularly important, because temperature affects yeast activity and fermentation kinetics, while specific gravity reflects sugar content and potential alcohol [5]. To maintain quality and consistency, winemakers must continuously monitor these parameters throughout the production process. Low-cost, modular measurement systems provide an effective way to achieve accurate, real-time control. This approach makes advanced monitoring accessible to wineries of all sizes.
The modular wine monitoring system, Winnie, was developed as an affordable and reliable solution for tracking key winemaking parameters. By using sensors and a remote control system, it continuously monitors temperature and sulfur dioxide SO2, enabling early detection of changes. The system combines a cost-effective and modular design that allows easy customization and integration of various sensors. Data are transferred in real time to a remote server, and the software provides intuitive visualization and control. The system’s automated, sensor-based approach reduces the need for manual sampling and laboratory analysis, improving efficiency and lowering costs. Despite its benefits, the system has certain limitations. Sensor accuracy may be affected by environmental noise or insufficient calibration, and some parameters still require occasional manual validation.
Early research laid the theoretical foundation for understanding fermentation dynamics. Authors in [6] gave an in-depth review of fermentation kinetics, describing sugar consumption and ethanol production during yeast metabolism. One of the earliest examples of laboratory automation is described in [7], where the authors developed a flow-injection analysis platform capable of measuring pH, SO2, and alcohol content. These studies represent the beginning of automated and semi-automated wine measurement systems.
The wine industry is increasingly embracing digital transformation to enhance monitoring and control of fermentation processes. Recent advancements demonstrate the importance of fast, automated, and non-invasive systems that provide real-time data while reducing manual labor. In [8], authors reviewed Brix measurement technologies, illustrating the transition from traditional manual methods to optical biosensor-based monitoring systems, which supports more accurate and frequent analysis.
Despite these advancements, challenges such as system complexity, high initial costs, and integration difficulties, especially in small wineries, remain significant barriers. Studies in [9,10,11] emphasize the importance of sensing technologies, automation, and artificial intelligence (AI) for maintaining wine quality and sustainability. Portable and small sensor instruments have made it possible to monitor wineries on site. Compact gas analyzers designed to detect fermentation-related volatile compounds were introduced in [12,13], while robust IoT (Internet of Things) sensor networks capable of operating in humid, variable conditions were presented in [14,15,16].
Reliable communication is essential for winery environments. Industrial protocols such as Recommended Standard 485 (RS-485) ensure noise-resistant transmission across multiple sensor nodes, supporting long-distance and multi-parameter monitoring of temperature, humidity, and CO2 [15,17]. This modular and scalable architecture allows seamless integration of new technologies into existing winery infrastructure without disrupting ongoing operations.
In parallel, spectroscopic techniques have gained attention for rapid and non-invasive wine composition analyses. Near-InfraRed (NIR), Mid-InfraRed (MIR), and Fourier-transform infrared (FTIR) spectroscopy provide detailed compositional data, while machine learning algorithms improve spoilage detection, product authentication, and origin classification [18,19]. Electrochemical sensor systems combined with AI algorithms have been used for wine authentication and adulteration detection [20]. The monitoring of SO2, a key preservative in winemaking, has evolved from traditional methods like the Ripper method to enhanced spectrophotometric approaches, such as the P-rosaniline method [21,22]. Although spectroscopy and AI-driven systems deliver high analytical accuracy, their cost and complexity limit their adoption in small-scale wineries [23].
Machine learning (ML) has become a central tool for improving wine quality assessment and fermentation control. Ref. [24] applied ML models using chemical and physical parameters to predict wine quality with high accuracy, while [25] reviewed AI applications across winemaking, emphasizing their role in intelligent decision-making. Predictive models like Support Vector Machine (SVM), XGBoost, and gradient boosting have been used to forecast wine quality, fermentation stage, and spoilage risk [26,27,28,29]. Ref. [30] showed improved classification accuracy through ML analyses of chemical and sensory data, and [31] highlighted AI applications in yield and disease prediction. Advanced Artificial Neural Network (ANN) predictive control models can estimate fermentation rates from temperature and gas production data [32], while biosensor IoT platforms enable real-time sugar and ethanol monitoring [33]. These data-driven approaches enhance process optimization by identifying irregularities and preventing fermentation failures [34].
In addition to the digital transformation in the wine industry, this paper presents the Winnie system. The main contributions of this work are the design and implementation of a modular and remotely accessible system for monitoring key parameters during wine fermentation. The proposed system, focused on cost-effective embedded technology and centralized colorimetric analysis, facilitates real-time data collection from multiple barrels through a shared analysis unit. Integrating local sensing with distributed RS-485 communication and centralized sample processing enables scalable implementation and reduces operating costs. In contrast to current systems that are expensive or restricted to laboratory settings, the proposed system provides web-based scheduling, wireless data transmission, and automatic colorimetric analysis of free sulfur dioxide. These contributions aim to improve digital traceability and process control in traditional wine production for small and medium-sized wineries.
The rest of this paper is organized as follows. Related work is presented in Section 2. The proposed measurement system is explained in Section 3. The results and evaluation of the system are provided in Section 4. Section 5 provides a discussion along with suggestions for future work. Finally, Section 6 concludes this paper with final remarks.
2. Related Work
The literature surrounding low-cost modular wine measurement systems has evolved significantly over the past decade, reflecting the industry’s growing need for efficient and innovative analytical techniques. In this review, we explore key contributions from various studies that highlight advancements in wine analysis and measurement technologies.
Table 1 presents an overview of selected wine monitoring systems from the literature, comparing them based on measured parameters, advantages (pros), and limitations (cons). The table includes representative works that illustrate the diversity of approaches in terms of sensor integration, system architecture, and application scope.

Table 1.
The literature overview of wine monitoring systems. Systems are compared based on the measured parameters, advantages, and disadvantages (- feature not present; ✓ feature present).
The “Year” column in Table 1 refers to the year in which each referenced study was published, indicating the chronological development of wine monitoring technologies. The most commonly measured parameters include temperature, pH, and humidity, reflecting their important roles in fermentation monitoring. The system proposed in this work extends previous efforts by focusing on cost-effectiveness and accessibility while maintaining support for key parameters like temperature, CO2, and SO2 with real-time wireless data transmission. Compared to commercial systems or high-end research prototypes, the solution aims to bridge the gap between accuracy and scalability, making it more suitable for small wineries and on-site applications.
Many authors have tried to automate measurements during the wine production process to minimize the possibility of any error. There are different IoT sensor-based, real-time, and data-driven solutions for measuring crucial parameters during the production process. Most solutions are specific to fermentation, the main phase in the production chain. Furthermore, the implementation of automated systems requires a basic level of technical knowledge, which could present a barrier for small-scale wine producers without prior experience in embedded systems or data analysis. Ref. [36] presents a fully automated amperometric biosensor system based on flow injection analysis for real-time monitoring of winemaking processes, measuring glucose, ethanol, lactic acid, and phenol concentrations without human intervention. The system has a central manager unit coordinating multiple local measurement units, each embedding enzyme-based screen-printed electrodes and microcontroller-driven signal conditioning for online sample analysis. Automated sample handling uses precision pumps and selector valves to control dilution and injection into the FIA circuit, ensuring consistent measurement repeatability and extended input ranges. Experimental trials on model solutions and actual fermentations demonstrated high agreement with standard laboratory methods, low uncertainty (0.4–2%), and reduced measurement time and operator involvement.
The development of IoT technologies has enabled the transition from standalone measurement platforms to distributed, network-connected systems for monitoring wineries while reducing the need for continuous on-site operator attendance. The research presented in [55] provides an automated system for real-time monitoring of glucose and phenolic compound concentrations during both white and red wine fermentation. It integrates a potentiostat with screen-printed electrodes and sampling-conditioning modules controlled by dedicated software. Experimental results indicate that glucose levels drop more rapidly in response to temperature peaks associated with the fermentation process. The remote monitoring IoT capability reduces the need for continuous on-site operator attendance. Authors in [50] used a network of temperature and humidity sensors in aging cellars to prove that long-term monitoring can help maintain wine quality. A modular sensor unit developed in [52] was designed for integration with individual wine barrels, allowing the detailed and localized monitoring of environmental and process conditions during aging or fermentation. This method showed how easy it was to implement within the current cellar infrastructure. Additionally, the authors of [53] concentrated their work on improving system scalability by developing networked sensor architectures that could be expanded across multiple tanks or locations without requiring significant hardware or communication protocol changes. Study [47] presents a wireless sensor system for continuous monitoring of environmental conditions in wineries, focusing on temperature, humidity, CO2, volatile organic compounds, and airborne particles. The system enables real-time data access through web-based graphical displays, supporting facility managers in making informed decisions about ventilation, safety, and operational efficiency. It has been deployed across five facilities, demonstrating how fermentation processes significantly impact indoor air quality, particularly through CO2 emissions, and how buildings manage these changes. The design emphasizes low energy consumption, ease of installation, and robust wireless communication, offering a practical solution for optimizing the design and operation of fermented food production environments. On the other hand, paper [37] introduces a novel wireless sensor node architecture mounted on the bung of oak barrels to monitor fermentation conditions: temperature, CO2, pH, and volatile acidity. By integrating sensors into the bung instead of the barrel body, the system offers low-power, push-button-activated measurements and reliable wireless communication, even in cave-like environments. Periodic and on-demand sensing modes enable seamless data collection and automatic transmission to an external server, facilitating efficient, portable monitoring during wine aging. Research [42] presents a low-cost (27 AUD) IoT wireless sensor network embedded in the barrel bung for simultaneous monitoring of wine temperature and ullage during fermentation and maturation stages. The system uses a low-power FM radio to transmit temperature readings and ullage measurements via an infrared distance sensor. Temperature tracking across multiple barrels eliminates the need for manual measurements and reduces contamination risks by keeping barrels closed. Ullage monitoring provided early warnings for topping and allowed winemakers to maintain optimal storage conditions, with software alerts triggered when parameters deviated from predefined thresholds. The study in [40] introduces WineDuino, an open-source, affordable IoT system intended for the real-time surveillance of winemaking processes, particularly during the aging of wine in barrels. Nodes integrated into silicone barrel bungs measure enological parameters, including temperature and pH, supporting the decision-making process during wine production.
Automated titration systems using embedded microcontrollers and optical sensors perform free SO2 iodometric titrations with real-time RGB detection, enabling small and medium wineries to monitor SO2 levels on site [69]. Authors in [69] used the TCS34725 RGB color sensor to detect a color change in a wine sample after adding a certain amount of reagents to enable SO2 measurement. On the other hand, the modified Ripper method with potentiometric detection is used in [57] to overcome endpoint visualization in colored wines by measuring electrical potential, yielding a detection limit of mg/L without significant bias versus automatic titrators. Authors in [67] utilized a fast photometric method based on the reaction of SO2 with a certain reagent. They achieved quantification limits of 2 mg/L and linearity on a sequential analyzer. This approach delivers precision comparable to official methods [67]. Emerging IoT-enabled systems integrate these sensors for cloud-based quality control and traceability. Overall, advanced titrimetric, photometric, potentiometric, and spectroscopic tools have modernized SO2 measurement in wine and must, improving speed, cost-effectiveness, and analytical robustness [57,67,69].
Study [65] presents a reconfigurable integrated electronic tongue combining a miniaturized sensor array with ML models for rapid analysis of fruit juices and wines. It demonstrates high classification accuracy in identifying different juices and bottled Italian wines based on their chemical and sensory profiles. The system’s portability and cloud-enabled data processing make it a promising tool for product authentication, quality control, and sensory evaluation in beverage analysis. On the other hand, authors in [56] introduced a portable electronic nose system using six metal-oxide sensors and a Deep MLP (Multilayer Perceptron) classifier, a form of Deep Neural Network (DNN), to detect wine spoilage by acetic acid in just 2.7 s with 97.7% accuracy, vastly outperforming traditional methods. The compact, real-time system enables fast, user-friendly quality monitoring in commercial wineries without complex preprocessing or specialist staff.
Vibrational spectroscopy techniques such as near-infrared (NIR), mid-infrared (MIR), and Raman spectroscopy have been widely applied in the wine industry for rapid and non-destructive analysis. These methods enable monitoring of grape growth, fermentation, and final wine quality with high accuracy. They offer promising alternatives to traditional analytical techniques, improving efficiency and sustainability in wine production [48]. In [64], NIR spectroscopy is used to determine problems with wines. Authors presented a low-cost electronic nose combined with ML models to identify twelve common wine faults in red and white wines. The models achieved high classification accuracy (92–97%), demonstrating the ability for rapid, predictive, and objective wine quality assessment during production. Authors in [39] developed a fiber optic probe that was used as part of the auto-calibration Fourier transform Raman spectroscopy system for real-time monitoring of key components, including sugar, ethanol, and glycerol, during wine fermentation. The probe was sealed with NIR-transparent glass and dipped into the wine fermentation vessel to directly collect Raman spectra for analysis. The system uses a dual optical path to correct for variations in temperature and laser performance, enabling precise, in situ chemical analysis. Their chemometric models showed excellent correlation with HPLC (High-Performance Liquid Chromatography) reference measurements, proving the method’s effectiveness for continuous fermentation monitoring [39]. Authors in [35] used infrared transmission spectroscopy to perform multi-parameter analysis of wine components: sugar, alcohol, and acids, enabling non-contact and rapid measurements. An approach suggested by [59,61] employed a pressure sensor array strategically placed at various depths within fermentation tanks to track density variations, thus estimating sugar consumption and alcohol production. This system had ML models that could guess what stage of fermentation was going on. In [51], an IoT fermentation control system for temperature and sugar level monitoring was introduced. However, it lacked integration with chemical analysis methods, limiting its ability to provide a full picture of the fermentation process. Furthermore, authors of [63] developed an in-line Brix monitoring solution based on differential pressure sensing, specifically designed for continuous application in small-scale wineries.
Recent advances in optoelectronic sensor technology have demonstrated the significant potential of LED-based systems as cost-effective alternatives to expensive analytical instrumentation in wine production monitoring. The integration of low-cost LED-based sensing platforms has yielded versatile, high-performance tools for multiple stages of wine production monitoring [38,41,43,44,46,67]. Research in [38] details a refractive index sensor employing a 655 nm laser diode and position-sensitive detector with a sensitivity of RIU at a cost one to two orders of magnitude lower than standard refractometers. Authors in [43] demonstrate that visible-wavelength LEDs (420, 520, 620 nm) can replicate spectrophotometric color analysis with absorbance resolutions of 1.0–2.4 AU, while [44,46] introduce NIR LED systems (1.20, 1.30, 1.72 m) for real-time ethanol monitoring with v/v and capital costs reduced by 95%. Reference [41] expands capability through a multi-wavelength UV/visible LED sensor for in-line color and total phenolics measurement (). Article [67] validates an automated LED-photometric assay for SO2 determination, underscoring the broad applicability of affordable LED photonics in oenological analysis.
Several low-cost methods for Brix monitoring are presented in the literature. The use of an analog refractometer together with a digital image acquisition system is presented in [60] for decentralized and remote information gathering. On the other hand, research [62] utilized image processing methods to determine the amount of present sugar and ethanol. The approach in [62] utilizes an ESP-32 CAM module and a 3D-printed mount to enable camera focus and a controlled lighting environment. Another cost-effective and innovative solution is buoyancy-based liquid density estimation, where a submerged object is connected to a load cell [66]. Fluctuations in buoyancy force indicate changes in sugar concentration, enabling non-invasive and continuous Brix monitoring. Even though these systems are innovative, they frequently have limitations, including the requirement for human interaction, limited coverage of parameters, and a lack of integration with chemical or optical analysis, or limited ability to adapt to small-scale, completely automated environments.
Despite improvements in low-cost devices and digitalization approaches, challenges remain in overcoming measurement precision, hardware robustness, and affordability. Many systems continue to experience high costs, restricted modularity, or a lack of validation across different production areas, limiting their wider implementation. In addition, several commercial systems have been introduced, including modular fermentation analyzers [49] and Hanna Instruments’ wine testing equipment [54]. These solutions offer high precision and reliability, with features like automatic temperature compensation and direct measurement of alcohol, sugar, pH, and total acidity. The system presented in [49] supports structured data export using REST APIs and interfaces with laboratory information systems through platforms like AP Connect or DAVIS 5. Such functionality makes it easy to share data in formats like JSON [54] allows data transfer through USB or RS232 using PC-compatible software for data visualization and archiving. However, despite their robustness and laboratory-grade accuracy, such systems often come with high costs, require trained personnel, and are typically optimized for lab-based workflows, limiting their suitability for in situ or small-scale winery integration.
3. Wine Measurement System Development
The development of wine measurement systems has advanced rapidly to meet the growing demand for precise, real-time monitoring of essential parameters during the winemaking process. These cost-effective technologies enable winemakers to optimize production, ensuring consistent quality and efficiency throughout fermentation and beyond. Traditional methods, including hydrometers and handheld refractometers, while still widely used, rely on manual sampling and subjective interpretation, which can introduce human error and reduce measurement frequency and consistency. To overcome these limitations, modern solutions increasingly incorporate embedded systems, IoT technologies, and smart sensors enabling real-time monitoring. Within this context, the goal of our research and development process was to design and construct an integrated, low-cost measurement device capable of simultaneously monitoring multiple essential parameters in wine production. Specifically, the system focuses on measuring ambient temperature, air CO2 concentration, wine SO2 content, temperature, and color. To achieve this, we systematically developed and tested several modular components, each tailored to a specific measurement task, and gradually integrated them into a unified, multifunctional device optimized for use in winery environments. The system architecture consists of two key physical units: the Barrel Device and the Hub Device. The Barrel Device is installed directly at each wine barrel and is responsible for temperature measurements, gas concentration measurements, and wine sample handling. It integrates a peristaltic pump, a servo-operated valve, and associated sensors. The Hub Device works as a central processing and communication unit. It performs colorimetric analysis of SO2, executes user commands through a web interface, and transmits data to a remote server. This modular, distributed architecture enables accurate measurements, stable operation, and effective scalability for use over numerous barrels.
3.1. Winnie Development Board
The internal hardware architecture of the measurement system is shown in Figure 1. The system is centered around an ESP32 microcontroller [70], which manages sensing, actuation, and communication tasks. The main control board integrates memory modules (EEPROM [71] and PSRAM [72]), a real-time clock (DS3231 [73]), and multiple digital interfaces, including UART, I2C, and RS-485 via RJ45. Peripheral expansion is enabled through a dedicated expansion port, connecting to external modules, motor drivers (DRV8837 [74] for DC motors and A4988 [75] for stepper motors), as well as input devices like buttons and Hall-effect sensors. Environmental sensing is handled by components including the BME680 [76] (for temperature, humidity, and pressure) and the DS18B20 [77] digital temperature sensor, while wine color analysis is conducted using the TCS34725 [78] RGB sensor. Actuation components, including a peristaltic pump and servo-operated three-way valve, are driven by their corresponding motor controllers (DRV8837 and MG996R [79]). This modular structure enables flexible integration of sensing and actuation units while ensuring compatibility with the system’s RS-485-based communication protocol and low-power operation requirements.
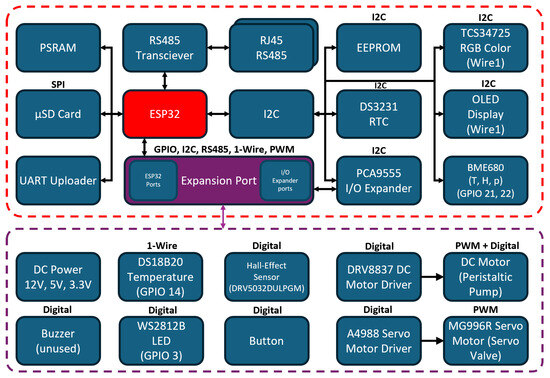
Figure 1.
System architecture is divided into two boards that communicate via a shared expansion port: the main board (red outline) with the ESP32 and core peripherals and the expansion board (purple outline) for motor control and additional sensors.
The custom-designed hardware architecture of the wine measurement system is implemented through two dedicated printed circuit boards (PCBs): the Main Board and the Expansion Board, as shown in Figure 2. The Main Board, cf. Figure 2a,b, integrates core processing and communication components including the ESP32 microcontroller, EEPROM and PSRAM memory, microSD slot, RS-485 transceiver, and UART and I2C (Inter-Integrated Circuit) expansion interfaces. It is the central processing unit that runs measurement algorithms, manages communication between clients and servers, communicates with peripheral modules, and handles system scheduling. The Expansion Board, cf. Figure 2c,d, extends the system’s functionality by providing dedicated motor driver circuits (for stepper and DC motors), servo connectors, and additional sensor inputs. This modular separation improves reliability and allows for scalable hardware configurations tailored to specific measurement tasks, including fluid control and fluid routing and valve control in SO2 analysis.
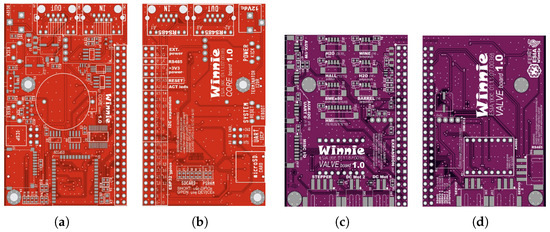
Figure 2.
Winnie control boards: Main board top (a) and bottom (b); Expansion board top (c) and bottom (d).
The ESP32 microcontroller uses over ten I/O channels to control sensors and actuators distributed across the Main and Expansion Boards. Communication with the server is achieved via Wi-Fi, while reliable communication between other devices is ensured using RS-485. Environmental and temperature sensors communicate via I2C, while the DS18B20 temperature sensor uses the 1-Wire interface (GPIO14). Motor drivers and actuators are controlled through digital and Pulse Width Modulation (PWM) pins. The modular board architecture simplifies integration of components like temperature, gas, and color sensors, as well as pumps and valves, enabling efficient adaptation to various measurement tasks, including SO2 analysis.
3.2. DC Motor Peristaltic Pump
A peristaltic pump, ref. [80] powered by a DC motor, was used to move wine samples from the barrel to the analysis unit. Since the fluid only comes into contact with the inside surface of the tubing, this type of pump is suitable for handling liquids in applications involving food, as it prevents contamination and ensures cleanliness. The ESP32 microcontroller is connected to a DRV8837 motor driver, which controls the pump. Digital signals control activation and speed, providing reliable and consistent sample delivery. The peristaltic pump’s size and operation principle make it simple to install and incorporate into the modular system. During each measurement cycle, it consistently moves the necessary amount of wine through the tubing without needing calibration or maintenance.
3.3. Servo Motor Three-Way Valve
A servo-operated (MG996R) three-way valve [81] was used to control fluid flow in the system. The valve provides three flow paths: wine sampling, water rinsing between measurements, and a closed position. The servo is driven by PWM signals generated by the ESP32 microcontroller. A custom 3D-printed holder, shown in Figure 3, secures the servo and valve, ensuring stable integration into the tubing network and reliable operation during measurement, cleaning, and idle cycles.
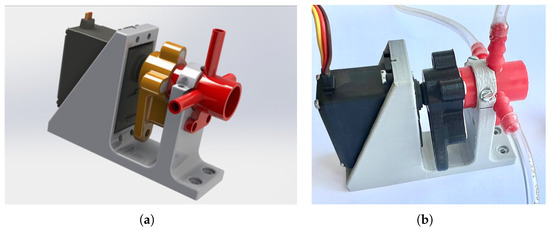
Figure 3.
Servo-operated three-way valve module: 3D model (a); real-world instance (b).
The valve has three defined positions, each corresponding to a specific output fluid. PWM signals from the ESP32 control the servo rotation angle, which in turn determines the valve position. This arrangement provides precise and repeatable control over fluid routing. Table 2 lists the valve positions, servo angles, and their functions, ensuring correct sampling, tube rinsing, and waste handling during the measurement process.
Table 2.
Valve positions and functions.
3.4. Wine Monitoring System
The overall operation and interaction between the Barrel Device and the Hub Device are schematically illustrated in Figure 4. The left portion of the diagram shows the structure and workflow of the Barrel Device. A peristaltic pump (located at the bottom right) draws wine samples from the barrel, while a servo-controlled three-way valve (center right) directs the fluid toward the measurement area. During this process, integrated sensors collect real-time data for analysis. All components are coordinated by an ESP32 microcontroller that executes measurement logic and communicates with the central Hub. The right side of Figure 4 outlines the Hub Device’s role in coordinating measurement events. Based on the user request received from the server, the Hub forwards commands over the RS-485 bus to the appropriate Barrel Device. After the Barrel Device completes its task of delivering a wine sample and performing local measurements of wine and the environment’s temperature and CO2 level, the Hub device performs a colorimetric analysis using an RGB color sensor. Once the analysis is completed, the results are transmitted via Wi-Fi to a remote server for visualization and logging. To ensure data reliability, the Hub also stores measurement results locally in case of network interruptions, enabling delayed synchronization when the connection is re-established. This structure supports remote supervision, synchronized multi-device operation, and minimal user intervention.
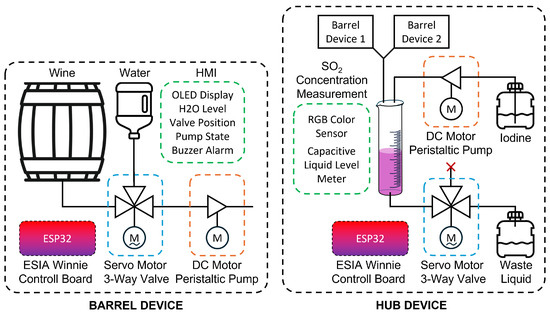
Figure 4.
Barrel and Hub Device.
To ensure that critical measurement data are reliably collected and stored, the wine monitoring system transmits all sensor readings directly to a remote server right after acquisition. The transmission procedure starts after the end of a predefined measurement cycle. At this stage, the device gathers the sensor data into a structured format and prepares an HTTPS (HyperText Transfer Protocol (Secure)) POST request to a specific endpoint. This method allows for continuous monitoring, even when there is limited physical access to the measurement device. Given hardware constraints and the need to maintain responsiveness, HTTPS communication was not implemented. To eliminate the risk related to unencrypted communications, a security layer is implemented at the application level. Each outgoing packet includes an MD5 (Message-Digest Algorithm 5) hash of the data generated using a secure hashing algorithm. This hash acts as a digital fingerprint, enabling the server to authenticate and ensure the integrity of the received data. Upon reception, the server recalculates the hash and compares it to the given version. If the two match, the data are considered valid and stored in the database. If not, the transmission is flagged as invalid and discarded. This verification mechanism ensures that only valid data are processed. It protects against spoofing, data injection, or accidental corruption during transmission. The communication logic has fail-safes for connectivity problems. If the server does not respond or rejects the data, the device retains the measurement in local memory and attempts retransmission in the next measurement cycle. This method, illustrated in Figure 5, helps prevent data loss during temporary interruptions or unstable network conditions. The system establishes a strong, secure, and resilient communication pipeline through the integration of real-time transmission, data hashing, and server-side validation. These features are essential for long-term wine monitoring applications, where data integrity and availability are as important as measurement accuracy.
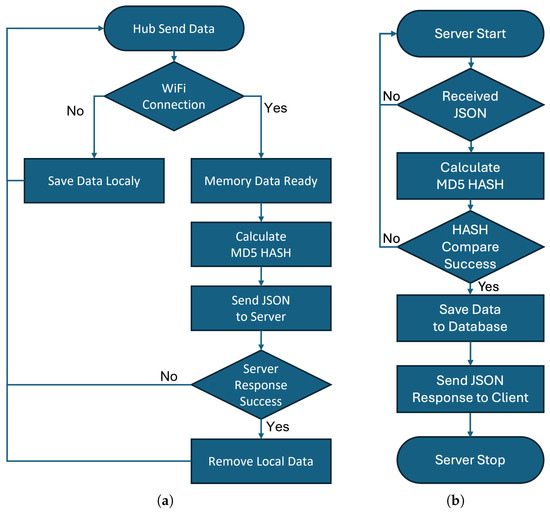
Figure 5.
Algorithm for sending wine parameters from the client device (a) to the server database (b).
An overview of the monitored parameters, their corresponding devices, and the specific sensing methods implemented within the system is provided in Table 3. This classification highlights the modular distribution of sensing responsibilities between the Barrel Device and the Hub Device, with temperature and gas measurements performed locally at each barrel and colorimetric analysis, including SO2 determination, centralized within the Hub.
Table 3.
Overview of measured parameters and corresponding devices.
The modular design allows each Barrel Device to operate autonomously and to be added or removed as needed without hardware modification. Each Barrel Device handles specific sensing tasks (e.g., temperature, gas concentration) and communicates via RS-485 with a central Hub, which coordinates colorimetric measurements and data transmission. This architecture enables scalable deployment depending on the number of barrels and production size. A simplified overview of the modular system layout is shown in Figure 6.
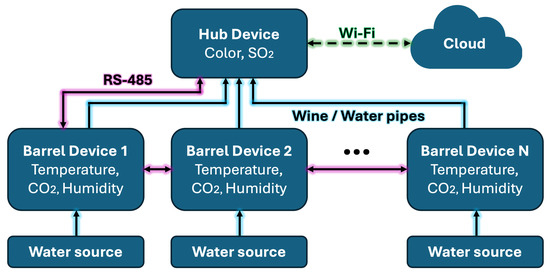
Figure 6.
Modular system architecture.
The complete measurement system, showing internal electronic connections and final device housing, is presented in Figure 7. The left image illustrates the assembly of individual Barrel Devices with control boards, peristaltic pumps, servo valves, and sensor modules during the prototyping phase. The right side shows the final integration of the prototype devices into custom enclosures.
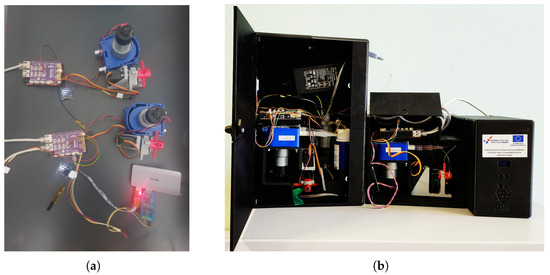
Figure 7.
The Barrel Device prototype (a) and the enclosed Winnie system (b) feature a central Hub Device and two connected Barrel Devices.
The final deployment of the system in a real winery environment is shown in Figure 8. For testing, smaller wine barrels were used, each filled with real wine to mimic real production conditions. Two Barrel Devices are connected to these barrels, extracting samples through food-grade tubing and autonomously performing measurements of temperature and gas concentration. The Barrel Devices operate under the supervision of the central Hub Device, which coordinates tasks, performs SO2 and color measurements, and communicates measurement data to a remote server via Wi-Fi. This setup validates the system’s functionality, robustness, and practical applicability in realistic winery scenarios. The devices communicate through an RS-485 network, ensuring reliable data transmission between Barrel and Hub Devices even under high humidity conditions typical for wine cellars. Environmental and wine temperature parameters are measured using I2C and 1-Wire interfaces, while actuators are driven via digital and PWM signals. The Hub coordinates data processing and communication with the remote server via Wi-Fi. Table 4 summarizes the sensors, actuators, and communication interfaces implemented in the system.
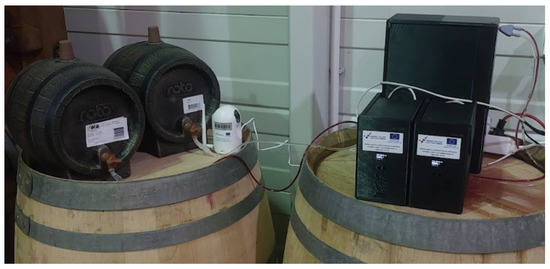
Figure 8.
Winnie system deployed in a winery.
Table 4.
Specifications of sensors and communication interfaces used in the system.
3.5. ESIA Web User Interface
The wine monitoring system includes a web-based interface, called ESIA (Expert System for Intelligent Agriculture), which enables winemakers to access, review, and manage data remotely. All sensor measurements are transmitted to a remote server after each measurement cycle. The server aggregates the data and presents them through a clear and structured web interface. Users can view historical trends, monitor real-time measurements, and track production stages, including harvest, fermentation, maturation, and bottling. Figure 9 shows an example of the web interface used for managing wine production steps. Each step is organized by stage and timestamped with detailed metadata such as vessel ID, quantity, and type of intervention. The intuitive layout allows winemakers to oversee the entire process remotely and make informed decisions. To ensure secure communication between measurement devices and the server, the system implements data validation at the application layer. Each data packet includes an MD5 hash used to verify authenticity and ensure data integrity. In case of network loss, the device buffers data and retransmits them in the next cycle. This ensures continuous data logging even in unstable network environments.
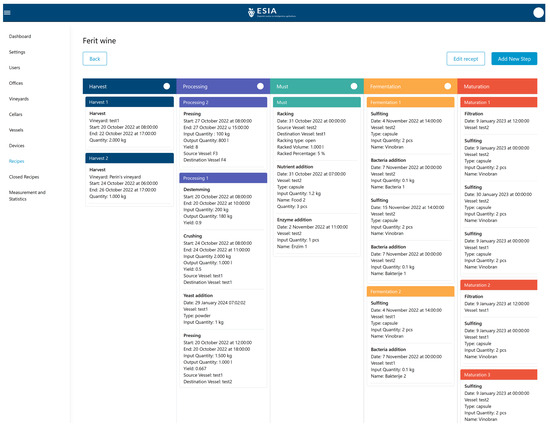
Figure 9.
ESIA web user interface.
4. Experimental Testing
To validate the performance of the proposed modular wine measurement system, a series of controlled experiments were conducted. The main goal was to test the accuracy of the sensors, the speed of the system’s response, and the reliability of communication and data collection in real-world situations. Based on system testing, temperature and CO2 sensors exhibited response times of approximately 2–3 s. The entire titration process for automated SO2 analysis, which included dosing the reagents, mixing them, and detecting the color, took less than 2 min per sample. The experiments were carried out using both synthetic model solutions and in a winery environment using actual wine musts at different fermentation stages.
Initial tests focused on the fluid flow system used for SO2 sampling. The relationship between pump voltage and flow rate was established by measuring the time required to displace 500 mL and 1000 mL of water at various input voltages. Table 5 shows that the flow rate increased proportionally with voltage, reaching a maximum of 2.72 mL/s at 24 V. These results provided the necessary calibration for determining the sampling volume and timing when operating the colorimetric SO2 module.
Table 5.
Water flow of the peristaltic pump at different supply voltages.
Further tests evaluated flow control via PWM modulation. Table 6 presents measured flow rates at duty cycles ranging from 50% to 100% using a constant supply voltage of 12 V. The data confirmed that PWM regulation provides fine-grained control of the flow, ensuring repeatable and precise dosing, an essential requirement for colorimetric SO2 detection.
Table 6.
Water flow at different PWM duty cycles using a 12 V amplitude.
To further assess flow consistency and control precision, a basic statistical analysis of the results was performed. The analysis confirmed a strong linear relationship between the pump flow rate and both the supply voltage and the PWM duty cycle. In voltage-controlled operation, the correlation coefficients exceeded r = 0.999, while for PWM control they were above r = 0.97, indicating stable and predictable flow behavior. Moreover, the close agreement between the 500 mL and 1000 mL measurements () demonstrates high repeatability and reliability of the peristaltic pump, confirming its suitability for precise and automated reagent dosing in the SO2 analysis module.
To complement the optical measurements and provide quantitative validation of fermentation dynamics, the concentration of free sulfur dioxide (SO2) was measured using an automated colorimetric titration system. The system uses a TCS34725 RGB color sensor [78] to detect changes in solution color and a commercial iodine-based SO2 reagent designed for oenological analysis, where 1 mL of reagent corresponds to 10 mg/L of free SO2. In each measurement cycle, a 3.5 mL wine sample is automatically drawn from the barrel to the measurement point, where the SO2 reagent is incrementally added by an automated dosing unit in steps of 125 L per cycle. After each addition, the system waits a predefined delay period and then performs a color measurement using the TCS34725 sensor. The titration continues until the change in RGB values goes over a set limit, which marks the end of the reaction. Based on the number of additions required to reach the endpoint, the system calculates the corresponding SO2 concentration. The entire procedure is implemented via a control algorithm optimized for embedded platforms, allowing precise, repeatable, and operator-independent measurements. Figure 10 provides a visual representation of the automated titration algorithm.
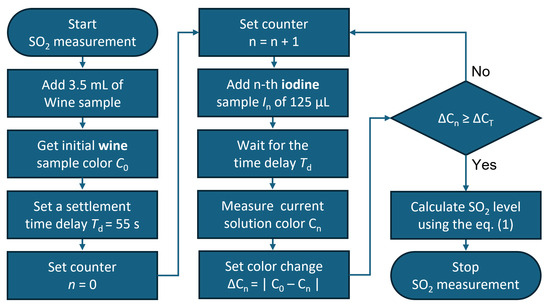
Figure 10.
Flowchart of the automated SO2 titration procedure used to determine free sulfur dioxide concentration in wine samples.
To evaluate the short-term environmental conditions relevant to wine fermentation and storage, temperature and CO2 concentration were continuously monitored over a one-hour period, with measurements taken approximately every 3 min. Figure 11 shows the recorded values. Figure 11a displays the temperature trend, starting at around 24.3 °C and gradually decreasing to approximately 23.5 °C, with slight variations near the end of the interval. Overall the temperature remained relatively stable throughout the measurement period. Figure 11b shows the CO2 concentration fluctuating between 724 ppm and 1286 ppm, with a noticeable spike around 13:30, likely indicating reduced air exchange. Descriptive statistics for the measured data, provided in Table 7 confirm these observations. The temperature ranged from 23.54 °C to 24.32 °C, with a mean value of 23.71 °C and a standard deviation of 0.2 °C, indicating very low variability. The CO2 concentration ranged from 724 ppm to 1286 ppm, with an average of 827.12 ppm and a standard deviation of 117.21 ppm. These results indicate stable thermal conditions and moderate CO2 fluctuations within safe operating ranges, confirming suitable environmental control for fermentation monitoring.
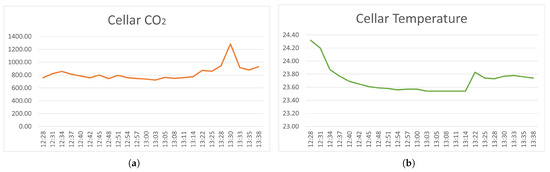
Figure 11.
Temperature (a) and CO2 (b) concentration measured in the wine cellar over one-hour period.
Table 7.
Descriptive statistics of temperature and CO2 concentration values in the wine cellar.
The device’s RS-485 communication network was also tested for stability and resilience. Multiple sensor nodes were deployed over distances exceeding 20 m under high humidity conditions typical of winery cellars. Data transmission remained fully reliable, with no packet loss observed during a continuous 72 h monitoring session. All collected data were first stored locally in the memory of the Hub device and subsequently transmitted to the remote server for further processing and storage.
To enable automated endpoint detection during titration, a TCS34725 RGB color sensor was used to monitor the visual color change that occurs when the SO2 reagent is added to wine samples. The sensor operates under fixed lighting conditions and measures light intensity in the red, green, blue, and clear (RGBC) channels. The output includes both directly transmitted and scattered light, which may vary depending on the turbidity and color of the solution. Because wine is an optically complex medium, particularly red wine with high pigment content, scattering and absorption can significantly affect the measured RGB values. To reduce these optical artifacts and isolate changes caused specifically by reagent-induced reactions, the raw RGB signals were normalized against the clear channel (C), allowing the system to focus on reagent-induced color changes. Figure 12 illustrates the evolution of raw and normalized RGBC readings and standard deviation for both white and red wine samples. In white wine, the signals remained stable with low variability and a clear inflection point at the titration endpoint. In red wine, higher variability was observed due to pigment absorption, but normalization effectively compensated for these effects, enabling reliable endpoint detection. The horizontal axis in all subfigures is labeled as “Sample index,” representing the sequential number of color measurements captured during the titration process. Each index corresponds to one sensor reading.
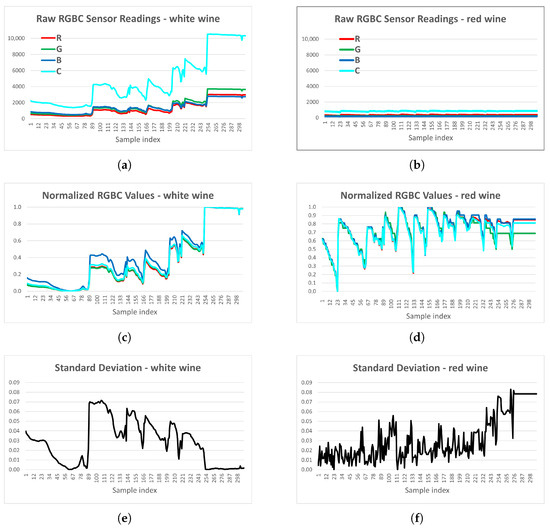
Figure 12.
Color measurements during automated SO2 titration in white and red wine samples. Figures (a,b) show raw RGBC readings captured by the TCS34725 sensor during incremental addition of iodine-based SO2 reagent. Figures (c,d) present the corresponding normalized values, while Figures (e,f) illustrate the evolution of standard deviation across RGBC channels.
The experimental results confirmed that the system provides stable and accurate readings across all monitored parameters. The integration of flow control, gas sensing, and digital communication proved effective, supporting the system’s suitability for continuous, modular wine monitoring in practical oenology applications.
Compared with commercial systems such as Hanna Instruments’ HI901W titrator [54] and Anton Paar’s Lyza 5000 Wine analyzer [49], the developed system provides significantly lower costs while maintaining the ability to monitor key wine parameters. Thanks to its low-cost design, the system offers an affordable alternative to traditional laboratory equipment, making it particularly suitable for small and medium-sized wineries. The cost structure of the core components, presented in Table 8, demonstrates that the entire system can be assembled for under 170 EUR using accessible parts. Although it may not achieve the analytical precision of spectroscopy-based instruments, its modularity, real-time data transmission, and remote access capabilities offer significant advantages in flexibility and ease of use. Table 9 presents a comparison of the costs between selected commercial wine analysis devices and the proposed low-cost system, highlighting its affordability and potential for wider adoption in smaller winery operations.
Table 8.
Approximate cost of core components used in the proposed prototype system.
Table 9.
Cost comparison of wine analysis systems.
5. Discussion and Future Work
In this work, a low-cost, modular system named Winnie was designed, implemented, and tested for monitoring key parameters of wine fermentation and aging in a winery environment. The system supports real-time data acquisition and remote access through a web interface and includes dedicated subsystems for measuring wine temperature, ambient temperature, CO2 concentration, SO2 content, and wine color. By combining custom-designed hardware with commercially available components, the system achieves a cost-effective and flexible solution.
One of Winnie’s most significant advantages is its affordability. Compared with high-end laboratory instrumentation, the overall cost is substantially reduced through the use of accessible components, including ESP32 microcontrollers, peristaltic pumps, RGB sensors, and standard gas sensors. Another major strength of the system lies in its modular architecture. Each Barrel Device operates independently and communicates with the central Hub over an RS-485 bus, enabling straightforward scalability. New devices can be added by assigning unique addresses, without requiring extensive hardware or software reconfiguration. The combination of modularity and affordability makes the system particularly attractive for small and medium-sized wineries seeking digitalization without major investments.
Data management represented another key focus during system development. As soon as the measurements are taken, they are sent to a remote server, where they are stored for later viewing and analysis. To overcome the limitations of embedded systems lacking HTTPS support, a lightweight hashing mechanism was implemented to ensure data integrity. This ensures secure communication and reliable data logging, even in the event of connectivity issues or local hardware failures.
The system was successfully validated under realistic winery conditions, including real wine fermentation experiments. The SO2 measurement module showed that a colorimetric method combined with RGB sensing can be used to find the endpoint during iodine-based titration. Although less precise than laboratory methods, this technique provides real-time feedback suitable for process control in small-scale production environments.
As the system continuously collects a wide range of time-series data from different stages of fermentation and aging, it opens possibilities for applying data-driven models, such as deep neural networks, to assist in quality prediction, anomaly detection, or process optimization. However, a major limitation in this domain is the long timescale of wine production, which limits the availability of large, well-labeled datasets. Furthermore, the limited number of failed or undesirable cases reduces the system’s exposure to negative training examples, which are essential for robust model generalization. Future research may address this issue through domain adaptation, synthetic data generation, or transfer learning techniques suited for low-data settings.
Despite its advantages, the system has several limitations that need to be addressed to ensure reliable long-term operation in actual winery conditions. Sensor accuracy and long-term stability can be affected by environmental conditions, gradual sensor degradation, and mechanical wear of pumps and valves. Moreover, although the system enables continuous data collection, it currently lacks intelligent features for automated decision-making or anomaly detection.
Future development efforts will focus on expanding the system’s analytical capabilities. One area of particular interest is the development of non-invasive or low-cost methods for measuring sugar and alcohol concentration during fermentation. Several concepts have been reported in the literature, including image-based refractometry [62] and buoyancy-based sugar concentration estimation using load cells [66]. These approaches could potentially be adapted for integration with the existing modular architecture, providing additional insight into fermentation kinetics without increasing system complexity or cost. In addition, the integration of embedded ML models will be explored to support anomaly detection, fermentation progress estimation, and automated operator alerts. These upgrades aim to make the system more intelligent and autonomous, reducing the need for constant supervision while maintaining flexibility and low cost. Real deployment introduces challenges such as total system cost, data reliability, and mechanical maintenance. Each module is inexpensive individually, but scaling to dozens of barrels raises investment and maintenance requirements.
6. Conclusions
The presented modular wine monitoring system, Winnie, provides a practical, scalable, and affordable solution designed to meet the needs of small and medium-sized wineries. By combining low-cost sensors, open-source microcontrollers, and custom software, the system bridges traditional manual methods with advanced laboratory instrumentation. Its modular architecture allows easy customization based on specific monitoring requirements, covering both cellar and wine parameters such as temperature, CO2, SO2, and color, thereby supporting various stages of the wine production process.
Compared with existing systems, Winnie reduces operational expenses and manual labor through automation while maintaining sufficient measurement accuracy for process optimization. Through real-time monitoring, data validation, and remote access via a web interface, winemakers can make timely, informed decisions, ensuring early detection of process deviations and reducing the risk of spoilage or quality loss. The system’s reliability was validated through long-term field testing in cellar environments, confirming stable sensor performance and robust communication under conditions of high humidity and temperature fluctuations.
The system also supports the automation of more complex measurements that typically require laboratory procedures, such as colorimetric titration for SO2 analysis. By integrating a color sensor, automated iodine-based SO2 reagent dosing, and embedded control logic, the system enables repeatable measurements with minimal human intervention. This enhances overall process efficiency and extends monitoring functionality to small-scale production environments. The main limitations include lower precision compared with laboratory-grade instruments and the need for regular maintenance of pumps, valves, and reagents.
In addition to providing real-time measurements, the system lays the foundation for data-centric approaches to winemaking. The continuous acquisition of environmental and chemical parameters generates a valuable dataset that can be leveraged to train neural networks for predictive modeling of fermentation kinetics and wine quality. Nonetheless, due to the inherently slow progression of wine production and the lack of labeled failure cases, the available data are often insufficient for training supervised learning models at scale. Future work will focus on integrating low-cost methods for sugar and alcohol monitoring and applying ML models for predictive fermentation control, despite the challenge of limited labeled data.
Author Contributions
Conceptualization, I.K. and I.A.; methodology, I.A. and T.M.; software, I.K. and T.M.; validation, I.K. and T.K.; formal analysis, I.A.; investigation, I.K.; resources, T.K.; data curation, I.K. and T.M.; writing—original draft preparation, I.K. and I.A.; writing—review and editing, T.M. and T.K.; visualization, I.A.; supervision, I.A.; project administration, I.A.; funding acquisition, I.A. All authors have read and agreed to the published version of the manuscript.
Funding
This research was funded by the project Development of an expert system for food production and processing management (ESIA-Expert System for Intelligent Agriculture KK.01.1.1.07.0036) through the European Regional Development Fund as part of the Operational Programme for Competitiveness and Cohesion (OPCC) 2014–2020.
Data Availability Statement
Data are available on request due to restrictions. The measurements were conducted in a private winery, and the owners did not provide consent for the public sharing of the collected data.
Conflicts of Interest
The authors declare no conflicts of interest. The funders had no role in the design of the study; in the collection, analyses, or interpretation of data; in the writing of the manuscript; or in the decision to publish the results.
References
- Fleet, G.H. Wine yeasts for the future. FEMS Yeast Res. 2008, 8, 979–995. [Google Scholar] [CrossRef]
- Bokulich, N.A.; Collins, T.S.; Masarweh, C.; Allen, G.; Heymann, H.; Ebeler, S.E.; Mills, D.A. Associations among Wine Grape Microbiome, Metabolome, and Fermentation Behavior Suggest Microbial Contribution to Regional Wine Characteristics. mBio 2016, 7, 16. [Google Scholar] [CrossRef] [PubMed]
- Jackson, R. Wine Science: Principles and Applications, 5th ed.; Food Science and Technology, Academic Press: Cambridge, MA, USA, 2020. [Google Scholar]
- Mills, D.A.; Phister, T.; Neeley, E.; Johannsen, E. Wine Fermentation. In Molecular Techniques in the Microbial Ecology of Fermented Foods; Springer: New York, NY, USA, 2008; Chapter 6; pp. 162–192. [Google Scholar] [CrossRef]
- Shi, C.; Cheng, M.; Yang, X.; Lu, Y.; Yin, H.; Zeng, Y.; Wang, R.; Jiang, Y.; Yang, W.; Wang, J.; et al. Probiotic Lactobacillus rhamnosus GG Promotes Mouse Gut Microbiota Diversity and T Cell Differentiation. Front. Microbiol. 2020, 11, 607735. [Google Scholar] [CrossRef] [PubMed]
- Bisson, L.; Waterhouse, A.; Ebeler, S.; Walker, M.A.; Lapsley, J. The present and future of the international wine industry. Nature 2002, 418, 696–699. [Google Scholar] [CrossRef] [PubMed]
- Cuadrado, M.; Luque de Castro, M.; Gomez-Nieto, M. Automation of flow injection methods in the winery industry through a computer program based on a multilayer model. In EFTA 2003, Proceedings of the 2003 IEEE Conference on Emerging Technologies and Factory Automation, Proceedings (Cat. No.03TH8696), Lisbon, Portugal, 16–19 September 2003; IEEE: Piscataway, NJ, USA, 2003; Volume 2, pp. 530–536. [Google Scholar] [CrossRef]
- Jaywant, S.A.; Singh, H.; Arif, K.M. Sensors and Instruments for Brix Measurement: A Review. Sensors 2022, 22, 2290. [Google Scholar] [CrossRef]
- Pascoal, D.; Silva, N.; Adão, T.; Lopes, R.D.; Peres, E.; Morais, R. A technical survey on practical applications and guidelines for IoT sensors in precision agriculture and viticulture. Sci. Rep. 2024, 14, 29793. [Google Scholar] [CrossRef]
- Tardaguila, J.; Stoll, M.; Gutiérrez, S.; Proffitt, T.; Diago, M.P. Smart applications and digital technologies in viticulture: A review. Smart Agric. Technol. 2021, 1, 100005. [Google Scholar] [CrossRef]
- Domínguez-Renedo, O.; Navarro-Cuñado, A.M.; Meléndez-Álvarez, M.E.; Alonso-Lomillo, M.A. Current state of electrochemical sensors in wine analysis for early diagnosis. TrAC Trends Anal. Chem. 2023, 168, 117349. [Google Scholar] [CrossRef]
- Coppey, F.; Bécue, A.; Sacré, P.Y.; Ziemons, E.M.; Hubert, P.; Esseiva, P. Providing illicit drugs results in five seconds using ultra-portable NIR technology: An opportunity for forensic laboratories to cope with the trend toward the decentralization of forensic capabilities. Forensic Sci. Int. 2020, 317, 110498. [Google Scholar] [CrossRef]
- Coppey, F.; Schelling, C.; Veuthey, J.L.; Esseiva, P. Cloud-Enabled Handheld NIR Spectroscopy: A Transformative Approach for Real-Time Forensic Analysis of Cannabis Specimens. Helv. Chim. Acta 2023, 106, e202300052. [Google Scholar] [CrossRef]
- Kovačević, I.; Orić, M.; Tolić, I.H.; Nyarko, E.K. Predicting the Specific Gravity of Must During Fermentation Using Machine Learning Models. In 32nd International Conference on Organization and Technology of Maintenance (OTO 2023); Springer: Cham, Switzerland, 2024; pp. 351–363. [Google Scholar]
- Kovačević, I.; Matić, T.; Keser, T.; Miling, R. RS485 Network Design and Maintenance in Food Processing Industry: A Winery Application. In 32nd International Conference on Organization and Technology of Maintenance (OTO 2023); Springer: Cham, Switzerland, 2024; pp. 134–142. [Google Scholar]
- Rimac-Drlje, S.; Rupčić, S.; Keser, T.; Aleksi, I.; Kovačević, I.; Miling, R.; Mandrić, V. Propagation of Radio Waves in Wine Cellars. In Proceedings of the 2023 30th International Conference on Systems, Signals and Image Processing (IWSSIP), Ohrid, North Macedonia, 27–29 June 2023; pp. 1–5. [Google Scholar] [CrossRef]
- Kovačević, I.; Keser, T.; Miling, R. Winery Monitoring System: A Semi-automated Solutions for Product Quality Maintenance and Production Assistance. In 30th International Conference on Organization and Technology of Maintenance (OTO 2021); Springer: Cham, Switzerland, 2022; pp. 414–424. [Google Scholar]
- Thanasi, V.; Catarino, S.; Ricardo-da-Silva, J. Fourier transform infrared spectroscopy in monitoring the wine production. Ciência Téc. Vitiv. 2022, 37, 79–99. [Google Scholar] [CrossRef]
- Yao, J.; Tran, S.N.; Nguyen, H.; Sawyer, S.; Longo, R. Wine Characterisation with Spectral Information and Predictive Artificial Intelligence. In Neural Information Processing; Springer: Singapore, 2023; pp. 247–259. [Google Scholar]
- Vasilescu, A.; Fanjul-Bolado, P.; Titoiu, A.M.; Porumb, R.; Epure, P. Progress in Electrochemical (Bio)Sensors for Monitoring Wine Production. Chemosensors 2019, 7, 66. [Google Scholar] [CrossRef]
- Gallego-Martínez, J.J.; Cañete-Carmona, E.; Gersnoviez, A.; Brox, M.; Sánchez-Gil, J.J.; Martín-Fernández, C.; Moreno, J. Devices for monitoring oenological processes: A review. Measurement 2024, 235, 114922. [Google Scholar] [CrossRef]
- Vahl, J.M.; Converse, J.E.; Collaborators:. Ripper Procedure for Determining Sulfur Dioxide in Wine: Collaborative Study. J. Assoc. Off. Anal. Chem. 2020, 63, 194–199. [Google Scholar] [CrossRef]
- Hosnedlova, B.; Sochor, J.; Baron, M.; Bjørklund, G.; and, R.K. Application of nanotechnology based-biosensors in analysis of wine compounds and control of wine quality and safety: A critical review. Crit. Rev. Food Sci. Nutr. 2020, 60, 3271–3289. [Google Scholar] [CrossRef]
- Gupta, Y.; Saraswat, A. Wine Quality Prediction Based on Machine Learning Techniques. In Flexible Electronics for Electric Vehicles; Springer: Singapore, 2023; pp. 623–627. [Google Scholar]
- Izquierdo-Bueno, I.; Moraga, J.; Cantoral, J.M.; Carbú, M.; Garrido, C.; González-Rodríguez, V.E. Smart Viniculture: Applying Artificial Intelligence for Improved Winemaking and Risk Management. Appl. Sci. 2024, 14, 10277. [Google Scholar] [CrossRef]
- Dahal, K.; Dahal, J.; Banjade, H.; Gaire, S. Prediction of Wine Quality Using Machine Learning Algorithms. Open J. Stat. 2021, 11, 278–289. [Google Scholar] [CrossRef]
- Jindal, A.; Singh Gill, K. From Vineyard Data to Flavour Profiles: Machine Learning Predicts Wine Quality. In Proceedings of the 2024 12th International Conference on Internet of Everything, Microwave, Embedded, Communication and Networks (IEMECON), Rajasthan, India, 24–26 October 2024; pp. 1–6. [Google Scholar] [CrossRef]
- John, A.; Damodar, N.; Mohith, N.; Vijayan, B. Understanding Red Wine Quality with Feature Importance in Machine Learning and Explainable AI. In Proceedings of the 2024 15th International Conference on Computing Communication and Networking Technologies (ICCCNT), Mandi, India, 18–22 June 2024; pp. 1–6. [Google Scholar] [CrossRef]
- Gupta, Y. Selection of important features and predicting wine quality using machine learning techniques. Procedia Comput. Sci. 2018, 125, 305–312. [Google Scholar] [CrossRef]
- Florea, A.; Sipos, A.; Stoisor, M.C. Applying AI Tools for Modeling, Predicting and Managing the White Wine Fermentation Process. Fermentation 2022, 8, 137. [Google Scholar] [CrossRef]
- Newlands, N.K. Artificial Intelligence and Big Data Analytics in Vineyards: A Review; IntechOpen: Rijeka, Croatia, 2021; Chapter 4. [Google Scholar] [CrossRef]
- Adahvili, N.; Zhizhilashvili, N.; Tricase, C. The Integration of the Internet of Things, Artificial Intelligence, and Blockchain Technology for Advancing the Wine Supply Chain. Computers 2024, 13, 72. [Google Scholar] [CrossRef]
- Anami, B.S.; Mainalli, K.; Kallur, S.; Patil, V. A Machine Learning Based Approach for Wine Quality Prediction. In Proceedings of the 2022 2nd Asian Conference on Innovation in Technology (ASIANCON), Ravet, India, 26–28 August 2022; pp. 1–6. [Google Scholar] [CrossRef]
- Kovačević, I.; Orić, M.; Tolić, I.H.; Nyarko, E.K. Modelling the Fermentation Process in Winemaking using Temperature and Specific Gravity. In Proceedings of the 34th Central European Conference on Information and Intelligent Systems (CECIIS 2023), Dubrovnik, Croatia, 20–22 September 2023; pp. 347–352. [Google Scholar]
- Picque, D.; Perret, B.; Cleran, Y.; Corrieu, G. On-line ethanol estimation and prediction: Application to the production of low alcohol wines. Process Biochem. 1991, 26, 173–178. [Google Scholar] [CrossRef]
- Albanese, D.; Liguori, C.; Paciello, V.; Pietrosanto, A. Winemaking Process Monitoring Based on a Biosensor Automatic System. IEEE Trans. Instrum. Meas. 2011, 60, 1909–1916. [Google Scholar] [CrossRef]
- Kim, B.W.; Kang, S.; Bang, H. A new method for winery environment monitoring using wireless sensor networks. In Proceedings of the 2012 7th International Conference on Computing and Convergence Technology (ICCCT), Seoul, Republic of Korea, 3–5 December 2012; pp. 98–101. [Google Scholar]
- Jiménez-Márquez, F.; Vázquez, J.; Úbeda, J.; Sánchez-Rojas, J. Low-cost and portable refractive optoelectronic device for measuring wine fermentation kinetics. Sens. Actuators B Chem. 2013, 178, 316–323. [Google Scholar] [CrossRef]
- Wang, Q.; Li, Z.; Ma, Z.; Liang, L. Real time monitoring of multiple components in wine fermentation using an on-line auto-calibration Raman spectroscopy. Sens. Actuators B Chem. 2014, 202, 426–432. [Google Scholar] [CrossRef]
- Di Gennaro, S.F.; Matese, A.; Mancin, M.; Primicerio, J.; Palliotti, A. An Open-Source and Low-Cost Monitoring System for Precision Enology. Sensors 2014, 14, 23388–23397. [Google Scholar] [CrossRef] [PubMed]
- Shrake, N.L.; Amirtharajah, R.; Brenneman, C.; Boulton, R.; Knoesen, A. In-Line Measurement of Color and Total Phenolics during Red Wine Fermentations Using a Light-Emitting Diode Sensor. Am. J. Enol. Vitic. 2014, 65, 463–470. [Google Scholar] [CrossRef]
- Zhang, W.; Skouroumounis, G.K.; Monro, T.M.; Taylor, D. Distributed Wireless Monitoring System for Ullage and Temperature in Wine Barrels. Sensors 2015, 15, 19495–19506. [Google Scholar] [CrossRef]
- Jiménez-Márquez, F.; Vázquez, J.; Sánchez-Rojas, J. Optoelectronic sensor device for monitoring the maceration of red wine: Design issues and validation. Measurement 2015, 63, 128–136. [Google Scholar] [CrossRef]
- Jiménez-Márquez, F.; Vázquez, J.; Úbeda, J.; Rodríguez-Rey, J.; Sánchez-Rojas, J.L. Optoelectronic sensor device for monitoring ethanol concentration in winemaking applications. In Proceedings of the Smart Sensors, Actuators, and MEMS VII; and Cyber Physical Systems. Int. Soc. Opt. Photonics, SPIE 2015, 9517, 95171P. [Google Scholar] [CrossRef]
- Tomtsis, D.; Kontogiannis, S.; Kokkonis, G.; Zinas, N. IoT Architecture for Monitoring Wine Fermentation Process of Debina Variety Semi-Sparkling Wine. In Proceedings of the SouthEast European Design Automation, Computer Engineering, Computer Networks and Social Media Conference, SEEDA-CECNSM ’16, Kastoria, Greece, 25–27 September 2016; Association for Computing Machinery: New York, NY, USA, 2016; pp. 42–47. [Google Scholar] [CrossRef]
- Jiménez-Márquez, F.; Vázquez, J.; Úbeda, J.; Rodríguez-Rey, J.; Sánchez-Rojas, J.L. Optoelectronic sensor for measuring ethanol content during grape must fermentation using NIR spectroscopy. Microsyst. Technol. 2016, 22, 1799–1809. [Google Scholar] [CrossRef]
- Madrid, N.; Boulton, R.; Knoesen, A. Remote monitoring of winery and creamery environments with a wireless sensor system. Build. Environ. 2017, 119, 128–139. [Google Scholar] [CrossRef]
- dos Santos, C.A.T.; Páscoa, R.N.; Lopes, J.A. A review on the application of vibrational spectroscopy in the wine industry: From soil to bottle. TrAC Trends Anal. Chem. 2017, 88, 100–118. [Google Scholar] [CrossRef]
- Anton Paar GmbH. Wine Analysis Solutions–Anton Paar. 2018. Available online: https://www.anton-paar.com/?eID=documentsDownload&document=62924&L=0 (accessed on 13 October 2025).
- Morais, R.; Peres, E.; Boaventura-Cunha, J.; Mendes, J.; Cosme, F.; Nunes, F.M. Distributed monitoring system for precision enology of the Tawny Port wine aging process. Comput. Electron. Agric. 2018, 145, 92–104. [Google Scholar] [CrossRef]
- Masetti, G.; Marazzi, F.; Di Cecilia, L.; Rovati, L. IOT-Based Measurement System for Wine Industry. In Proceedings of the 2018 Workshop on Metrology for Industry 4.0 and IoT, Brescia, Italy, 16–18 April 2018; pp. 163–168. [Google Scholar] [CrossRef]
- Angelkov, D.; Martinovska Bande, C. Sensor Module for Monitoring Wine Fermentation Process. In Applied Physics, System Science and Computers; Springer: Cham, Switzerland, 2018; pp. 253–262. [Google Scholar]
- Cañete, E.; Chen, J.; Martín, C.; Rubio, B. Smart Winery: A Real-Time Monitoring System for Structural Health and Ullage in Fino Style Wine Casks. Sensors 2018, 18, 803. [Google Scholar] [CrossRef] [PubMed]
- Hanna Instruments. Wine Analysis Instruments–Hanna Instruments. 2019. Available online: https://www.documentation.hannainst.com/manuals/download/295 (accessed on 13 October 2025).
- Epure, P.; Ursutiu, D.; Samoila, C. Remote Monitoring and Control of Winemaking Parameters. In Proceedings of the 2019 5th Experiment International Conference (exp.at’19), Funchal, Portugal, 12–14 June 2019; pp. 214–219. [Google Scholar] [CrossRef]
- Rodriguez Gamboa, J.C.; Albarracin E, E.S.; da Silva, A.J.; L. de Andrade Lima, L.; E. Ferreira, T.A. Wine quality rapid detection using a compact electronic nose system: Application focused on spoilage thresholds by acetic acid. LWT 2019, 108, 377–384. [Google Scholar] [CrossRef]
- Moya, H.; Santana, W. Determination of Free SO2 in Wines Using a Modified Ripper Method with Potentiometric Detection a Comparative Study with an Automatic Titrator. Can. J. Biomed. Res. Technol. 2019, 2, 5. [Google Scholar]
- Cañete-Carmona, E.; Gallego-Martínez, J.J.; Martín, C.; Brox, M.; Luna-Rodríguez, J.J.; Moreno, J. A Low-Cost IoT Device to Monitor in Real-Time Wine Alcoholic Fermentation Evolution Through CO2 Emissions. IEEE Sens. J. 2020, 20, 6692–6700. [Google Scholar] [CrossRef]
- Nelson, J.; Andoh, C.; Comia, A.; Echeveria, L.; Hopkins, J.; Maniti, M.; Pierce, T. Wireless Sensor Network with Mesh Topology for Carbon Dioxide Monitoring in a Winery. In Proceedings of the 2021 IEEE Topical Conference on Wireless Sensors and Sensor Networks (WiSNeT), San Diego, CA, USA, 17–20 January 2021; pp. 30–33. [Google Scholar] [CrossRef]
- Willa, V.; Nyambo, D. Brix and Alcohol Content Monitoring using Wireless Sensor Network. Int. J. Adv. Sci. Res. Eng. 2021, 7. [Google Scholar] [CrossRef]
- Nelson, J.; Boulton, R.; Knoesen, A. Automated Density Measurement with Real-Time Predictive Modeling of Wine Fermentations. IEEE Trans. Instrum. Meas. 2022, 71, 1–7. [Google Scholar] [CrossRef]
- Kubat, T.; Kovačević, I.; Aleksi, I.; Matić, T. Sugar/ethanol level measurement in liquids using analog refractometer and digital image processing. In Proceedings of the 2022 International Symposium ELMAR, Zadar, Croatia, 12–14 September 2022; pp. 153–157. [Google Scholar] [CrossRef]
- Jaywant, S.A.; Singh, H.; Arif, K.M. Low-Cost Sensor for Continuous Measurement of Brix in Liquids. Sensors 2022, 22, 9169. [Google Scholar] [CrossRef]
- Gonzalez Viejo, C.; Fuentes, S. Digital Assessment and Classification of Wine Faults Using a Low-Cost Electronic Nose, Near-Infrared Spectroscopy and Machine Learning Modelling. Sensors 2022, 22, 2303. [Google Scholar] [CrossRef]
- Gabrieli, G.; Muszynski, M.; Ruch, P.W. A reconfigurable integrated electronic tongue and its use in accelerated analysis of juices and wines. In Proceedings of the 2022 IEEE International Symposium on Olfaction and Electronic Nose (ISOEN), Aveiro, Portugal, 29 May–1 June 2022; IEEE: New York, NY, USA, 2022; pp. 1–3. [Google Scholar] [CrossRef]
- Kaučić, L.; Kovačević, I.; Aleksi, I.; Keser, T.; Zidar, J.; Rimac-Drlje, S. A low-cost buoyant force measurement device for monitoring sugar concentration in water solution. In Proceedings of the 2023 3rd International Conference on Electrical, Computer, Communications and Mechatronics Engineering (ICECCME), Online part, 20–21 July 2023; pp. 1–6. [Google Scholar] [CrossRef]
- Campo-Martínez, J.F.; Enseñat-Berea, M.L.; Fernández-Paz, J.; González-Castro, M.J. Validation of a fast automated photometric method for the analysis of sulfur dioxide in wines. Eur. Food Res. Technol. 2024, 250, 1611–1618. [Google Scholar] [CrossRef]
- Pastore, A.; Badocco, D.; Cappellin, L.; Tubiana, M.; Pastore, P. Real-time monitoring of the pH of white wine and beer with colorimetric sensor arrays (CSAs). Food Chem. 2024, 452, 139513. [Google Scholar] [CrossRef]
- Keser, T.; Miling, R.; Miličević, D.; Blažević, D. Automated Titration of SO2 in the Winery Environment: Conceptual Design and Proof of Concept. In 32nd International Conference on Organization and Technology of Maintenance (OTO 2023); Springer: Cham, Switzerland, 2024; pp. 122–133. [Google Scholar]
- Espressif Systems. ESP32-C3-DevKitC-02 User Guide. 2024. Available online: https://docs.espressif.com/projects/esp-idf/en/v5.2/esp32c3/hw-reference/esp32c3/user-guide-devkitc-02.html (accessed on 25 July 2025).
- Belling. EEPROM BL24C32A 32Kbits (4,096×8). 2016. Available online: https://lcsc.com/datasheet/lcsc_datasheet_2410121545_BL-BL24C32A-SFRC_C177775.pdf (accessed on 25 July 2025).
- Integrated Silicon Solution. PSRAM 8Mbit SOIC8. 2024. Available online: https://hr.mouser.com/datasheet/2/198/66_67WVS1M8ALL_BLL-2933416.pdf (accessed on 25 July 2025).
- Analog Devices. DS3231 Extremely Accurate I2C-Integrated RTC with Temperature-Compensated Crystal Oscillator (TCXO). 2015. Available online: https://www.analog.com/media/en/technical-documentation/data-sheets/ds3231.pdf (accessed on 25 July 2025).
- Texas Instruments. DRV8837 Low-Voltage H-Bridge Driver. 2021. Available online: www.ti.com/lit/ds/symlink/drv8837.pdf?ts=1753413727278 (accessed on 25 July 2025).
- ALLEGRO microsystems. DMOS Microstepping Driver with Translator and Overcurrent Protection. 2022. Available online: https://hr.mouser.com/datasheet/2/1115/A4988_Datasheet-3081910.pdf (accessed on 25 July 2025).
- Bosch Sensortec. BME680 Low Power Gas, Pressure, Temperature and Humidity Sensor. 2019. Available online: https://hr.mouser.com/datasheet/2/783/BST_BME680_DS001-1509608.pdf (accessed on 25 July 2025).
- Maxim integrated. DS18B20 Programmable Resolution 1-Wire Digital Thermometer. 2019. Available online: https://hr.mouser.com/datasheet/2/609/DS18B20-3468014.pdf (accessed on 25 July 2025).
- Texas Advanced Optoelectronic Solutions Inc. TCS34725 COLOR LIGHT-TO-DIGITAL CONVERTER with IR FILTER. 2012. Available online: https://cdn-shop.adafruit.com/datasheets/TCS34725.pdf (accessed on 25 July 2025).
- Tower Pro. MGR996R High Torque Metal Gear Dual Ball Bearing Servo. 2022. Available online: https://components101.com/sites/default/files/component_datasheet/MG996R%20Datasheet.pdf (accessed on 25 July 2025).
- Verderflex. M025 Peristaltic Pump. 2022. Available online: www.drftwn.com//wp-content/uploads/2018/02/C.02-M025.pdf (accessed on 25 July 2025).
- Bürkle GmbH. Three-Way Valves. 2025. Available online: https://www.burkle-inc.com/en_US/three-way-valves#similar (accessed on 25 July 2025).


Disclaimer/Publisher’s Note: The statements, opinions and data contained in all publications are solely those of the individual author(s) and contributor(s) and not of MDPI and/or the editor(s). MDPI and/or the editor(s) disclaim responsibility for any injury to people or property resulting from any ideas, methods, instructions or products referred to in the content. |
© 2025 by the authors. Licensee MDPI, Basel, Switzerland. This article is an open access article distributed under the terms and conditions of the Creative Commons Attribution (CC BY) license (https://creativecommons.org/licenses/by/4.0/).