Article

Analysis of Dimensionless Numbers for Graphite Purification in the Electromagnetic Induction Furnaces

1
Yunnan Province Key Laboratory of Clean Energy and Energy Storage Technology, Faculty of Metallurgical and Energy Engineering, Kunming University of Science and Technology, Kunming 650093, China
2
State Key Laboratory of Complex Nonferrous Metal Resources Clean Utilization, Faculty of Metallurgical and Energy Engineering, Kunming University of Science and Technology, Kunming 650093, China
*
Author to whom correspondence should be addressed.
Appl. Sci. 2025, 15(20), 11294; https://doi.org/10.3390/app152011294
Submission received: 13 September 2025 / Revised: 13 October 2025 / Accepted: 20 October 2025 / Published: 21 October 2025

Abstract

Due to its high-temperature resistance, high thermal conductivity, electrical conductivity, excellent chemical stability, and outstanding mechanical and electrochemical properties, graphite has been widely applied in various fields. However, the current production process of high-purity graphite is faced with issues such as high energy consumption and insufficient reduction degree. This study utilized COMSOL Multiphysics 6.0 to couple the electromagnetic field, temperature field, velocity field, and flow field during the purification process of graphite. The dimensionless analysis method is adopted to investigate the influence of parameters such as current intensity, magnetic field frequency and concentration on the reduction degree of graphite feedstock, and the energy consumption in the furnace. Through numerical simulation, the interaction mechanism among various parameters under different parameter combinations is compared and analyzed, and the temperature change and fluid motion state of graphite feedstock during the electromagnetic induction heating process are predicted. When the current is 500 A, the average temperature inside the furnace gradually rises with the increase in the magnetic field frequency. This is because the energy input from induction coil and the energy output due to radiative heat loss gradually reach a dynamic equilibrium state. Furthermore, the average temperature inside the furnace continuously increases with the enhancement of the current, and for every increase of 50 A, the average temperature rises by approximately 200 K. Additionally, through dimensionless analysis, the optimal operating conditions for this induction furnace were determined to be a current intensity of 600 A and a magnetic field frequency of 14 kHz. Under these conditions, the reduction degree of the material reaches 99.69%, which achieves efficient purification and economical energy consumption. This study provides a theoretical basis for the optimization of operating parameters in graphite purification process, which is of great significance for improving production efficiency, reducing energy consumption, and promoting the application of high-purity graphite.

1. Introduction

Graphite, characterized by its remarkable thermal and electrical conductivity, chemical stability, and electrochemical performance, is recognized as strategic inorganic non-metallic mineral resource with considerable development potential in the 21st century [1]. Graphite products, such as nuclear graphite, high-purity graphite, and graphene, play a pivotal role in emerging strategic industries including nuclear energy, new energy, energy storage, and aerospace. The initial demand for high-purity graphite is driven by the need for graphite electrodes in the steelmaking process [2,3]. However, with the rapid advancement of automotive electrification, there has been a continuous increase in the demand for artificial graphite anode materials. This growing requirement has emerged as the principal driving force behind the development of the high-purity graphite industry.
The operational process of a graphitization furnace primarily comprises the following two stages: heating and cooling. During the heating stage, electricity is supplied to elevate the temperature within the furnace, thus facilitating a series of physical and chemical transformations in the graphite feedstock which could be converted into high-purity graphite [4]. Then, in the cooling stage, both the temperature of furnace and the material decrease progressively. In the heating stage, it necessitates the maintenance of a stable and continuous high-temperature environment to satisfy the requirements for graphite purification process, which leads to significant energy consumption (averaging between 5.5 and 12 MW·h per ton of product) [5]. The optimized design and operation of graphitization furnace are essential for enhancing energy efficiency and reducing operational costs. Vedin et al. [6] enhances insulation layer materials on the side walls of graphitization furnace by employing a mixture comprising coke powder, oil coke, and anthracite. This composite material exhibits excellent thermal and electrical insulation properties that effectively minimize heat loss from the furnace, thereby contributing to reduced overall energy consumption. Naderipour et al. [7] introduces a fuzzy logic control strategy aimed at optimizing voltage distribution within graphitization furnace. They successfully validate this approach as effective in lowering energy consumption.
Electromagnetic induction heating technology has been extensively applicated in metal metallurgy. The heating principle involves generating eddy currents within the metal through electromagnetic induction, which produces Joule heat and facilitates the rapid heating of metal [8]. When high-frequency alternating current flows through the induction coil, a strong alternating magnetic field is established. As the metal intersects with this magnetic field, it induces a substantial number of eddy currents internally, thereby efficiently converting electrical energy into thermal energy and achieving rapid heating along with effective smelting. Kang et al. [9] proposed an electrified catalytic induction heating system. It can leverage the electromagnetic induction heating properties of catalytic composite materials to transfer heat to liquid-phase reaction systems, which significantly enhances the reaction efficiency. Compared to traditional heating methods, this approach increased the reaction rate by 16.4 times. Zhang et al. [10] employes electromagnetic induction heating to activate Co-supported nanoparticle catalysts, and successfully enables rapid cold start for ammonia decomposition reactions. This catalytic system exhibited remarkable catalytic activity alongside good long-term stability. By integrating it with a hydrogen fuel cell system, they are able to complete the reaction start-up process within just 10 s. Alexander et al. [11] utilize electromagnetic induction heating technology in conjunction with the self-heating effect of ferromagnetic catalyst particles to promote catalytic reactions. This method significantly enhances reaction activity at Pt/Fe3O4 interface and facilitates the oxidation process of adsorbed carbonyl species.
Dimensionless numbers are obtained by combining physical quantities with units into a ratio, where the units of each physical quantity in the ratio cancel each other out, resulting in a pure numerical value [12]. In the context of multi-physical field coupling studies, employing dimensionless numbers to analyze the interaction characteristics among parameters facilitates a comprehensive evaluation of the influence from multiple factors to various targets. This approach not only clarifies the interaction relationships among different factors but also effectively reveals the essential features of the problem, thereby simplifying both modeling and analysis processes. Amirhossein et al. [13] conducted a systematic investigation into the phase separation behavior of gas–water upward flow in large-diameter vertical pipes, which focuses on the geometric structure of the pipes and the thermophysical properties of the fluids. They established a correlation between the Froude number and the dimensionless slippage parameter (Froude–Slippage method) and clarify criteria for identifying different flow patterns along with their transition boundary conditions. Zhang et al. [14] developed a quantitative correlation model linking induction heat source parameters to key dimensionless variables based on π theorem principles, which address the thermo-mechanical coupling effects experienced by ship hull plates during induction heating forming processes. This work provides theoretical support for precise control and optimal design within ship structural formation. Marzouk et al. [15] explore the influence of nanofluid mass concentration on heat transfer and flow characteristics. Their finding indicates that as Reynolds number increases, friction coefficients decrease. Furthermore, both increasing Reynolds numbers and nanofluid mass concentrations could enhance Nusselt numbers, thus significantly improving overall heat transfer performance within the system. Lv et al. [16,17] constructed a real-time coupling model that integrates magnetohydrodynamic equations with multi-physics field control equations to analyze kinetic behaviors at the two-phase melt interface during carbon-thermal reduction reactions. They also established a quantitative relationship between dimensionless parameters, reduction degree, and energy consumption indicators, thereby providing a foundation for assessing energy efficiency and optimizing reaction processes. Chen et al. [18] investigated the flow characteristics of TiAl alloy during the melting and directional solidification processes within a square electromagnetic cold crucible. By analyzing four key dimensionless parameters, they determined that turbulent kinetic energy is primarily influenced by both the turbulent length scale and the flow velocity.
In this paper, by using the dimensional analysis method of fluid mechanics, heat and mass transfer in different physical fields, the influence of parameters such as current intensity, magnetic field frequency and concentration on the reduction degree of purification for graphite feedstock, and the energy consumption in the furnace as well as the heat transfer characteristics in the furnace, are analyzed. In addition, the relevant parameters are optimized through numerical simulation methods, and the optimal operating parameters under this model are obtained. Moreover, the results and methods obtained through numerical simulation can improve the heat and mass transfer in the furnace, which provides a theoretical basis for the optimization of operating parameters in electromagnetic induction furnace.

2. Mathematical Models

2.1. Physical Models

The impurities, such as iron, aluminum, and other elements presented in graphite feedstock, could also react with chlorine gas to form halides. In the electromagnetic induction furnace, graphite feedstock and chlorine gas react at an elevated temperature, thereby forming halides [19]. The iron chloride, aluminum chloride, and other halides are transformed to gas state at high temperature and are discharged from the top of the electromagnetic induction furnace, thus purifying the graphite feedstock [20]. The purification of graphite feedstock in the furnace is categorized into two distinct stages. The initial stage involves the presence of graphite feedstock containing impurities in an electromagnetic induction furnace, where the gradual heating process takes place, and the subsequent stage entails the presence of halides vaporization in a chlorine atmosphere [21]. The graphite feedstock in the electromagnetic induction furnace is rapidly heated by electromagnetic induction, and the gas in the furnace generates eddy currents and the upper part of the graphite feedstock reacts under the effect of high temperature. The present study focuses on the impact of varying chlorine concentrations and furnace temperatures on the purification efficiency of graphite feedstock. Numerical simulations are employed to investigate the removal rate of impurities in graphite feedstock under different conditions.
The physical model is composed of cylindrical graphite crucibles and copper coils with circulating cooling water. In Figure 1a, h1 represents the initial height of the graphite feedstock and h2 is the initial height of the gas section. An infinite element domain is set at the outer edge of the air domain of the physical model to simulate the magnetic insulation boundary of the electromagnetic field in the actual situation and avoid the influence of the boundary effect on the accuracy of the numerical calculation. The gas region is set as a transport of diluted species (TDS) to represent the reaction process between chlorine gas and the graphite feedstock. Due to the slow flow velocity within the gas region, the gas flow in the gas region is set as laminar flow. The model is simplified and computational efficiency is enhanced by the following assumptions.
(1)
The graphite crucible is assumed to be in an ideal concentric position with the coil.
(2)
The graphite feedstock is assumed to be static under the action of air flow.
(3)
Heat transfer in the air domain outside the furnace is neglected.
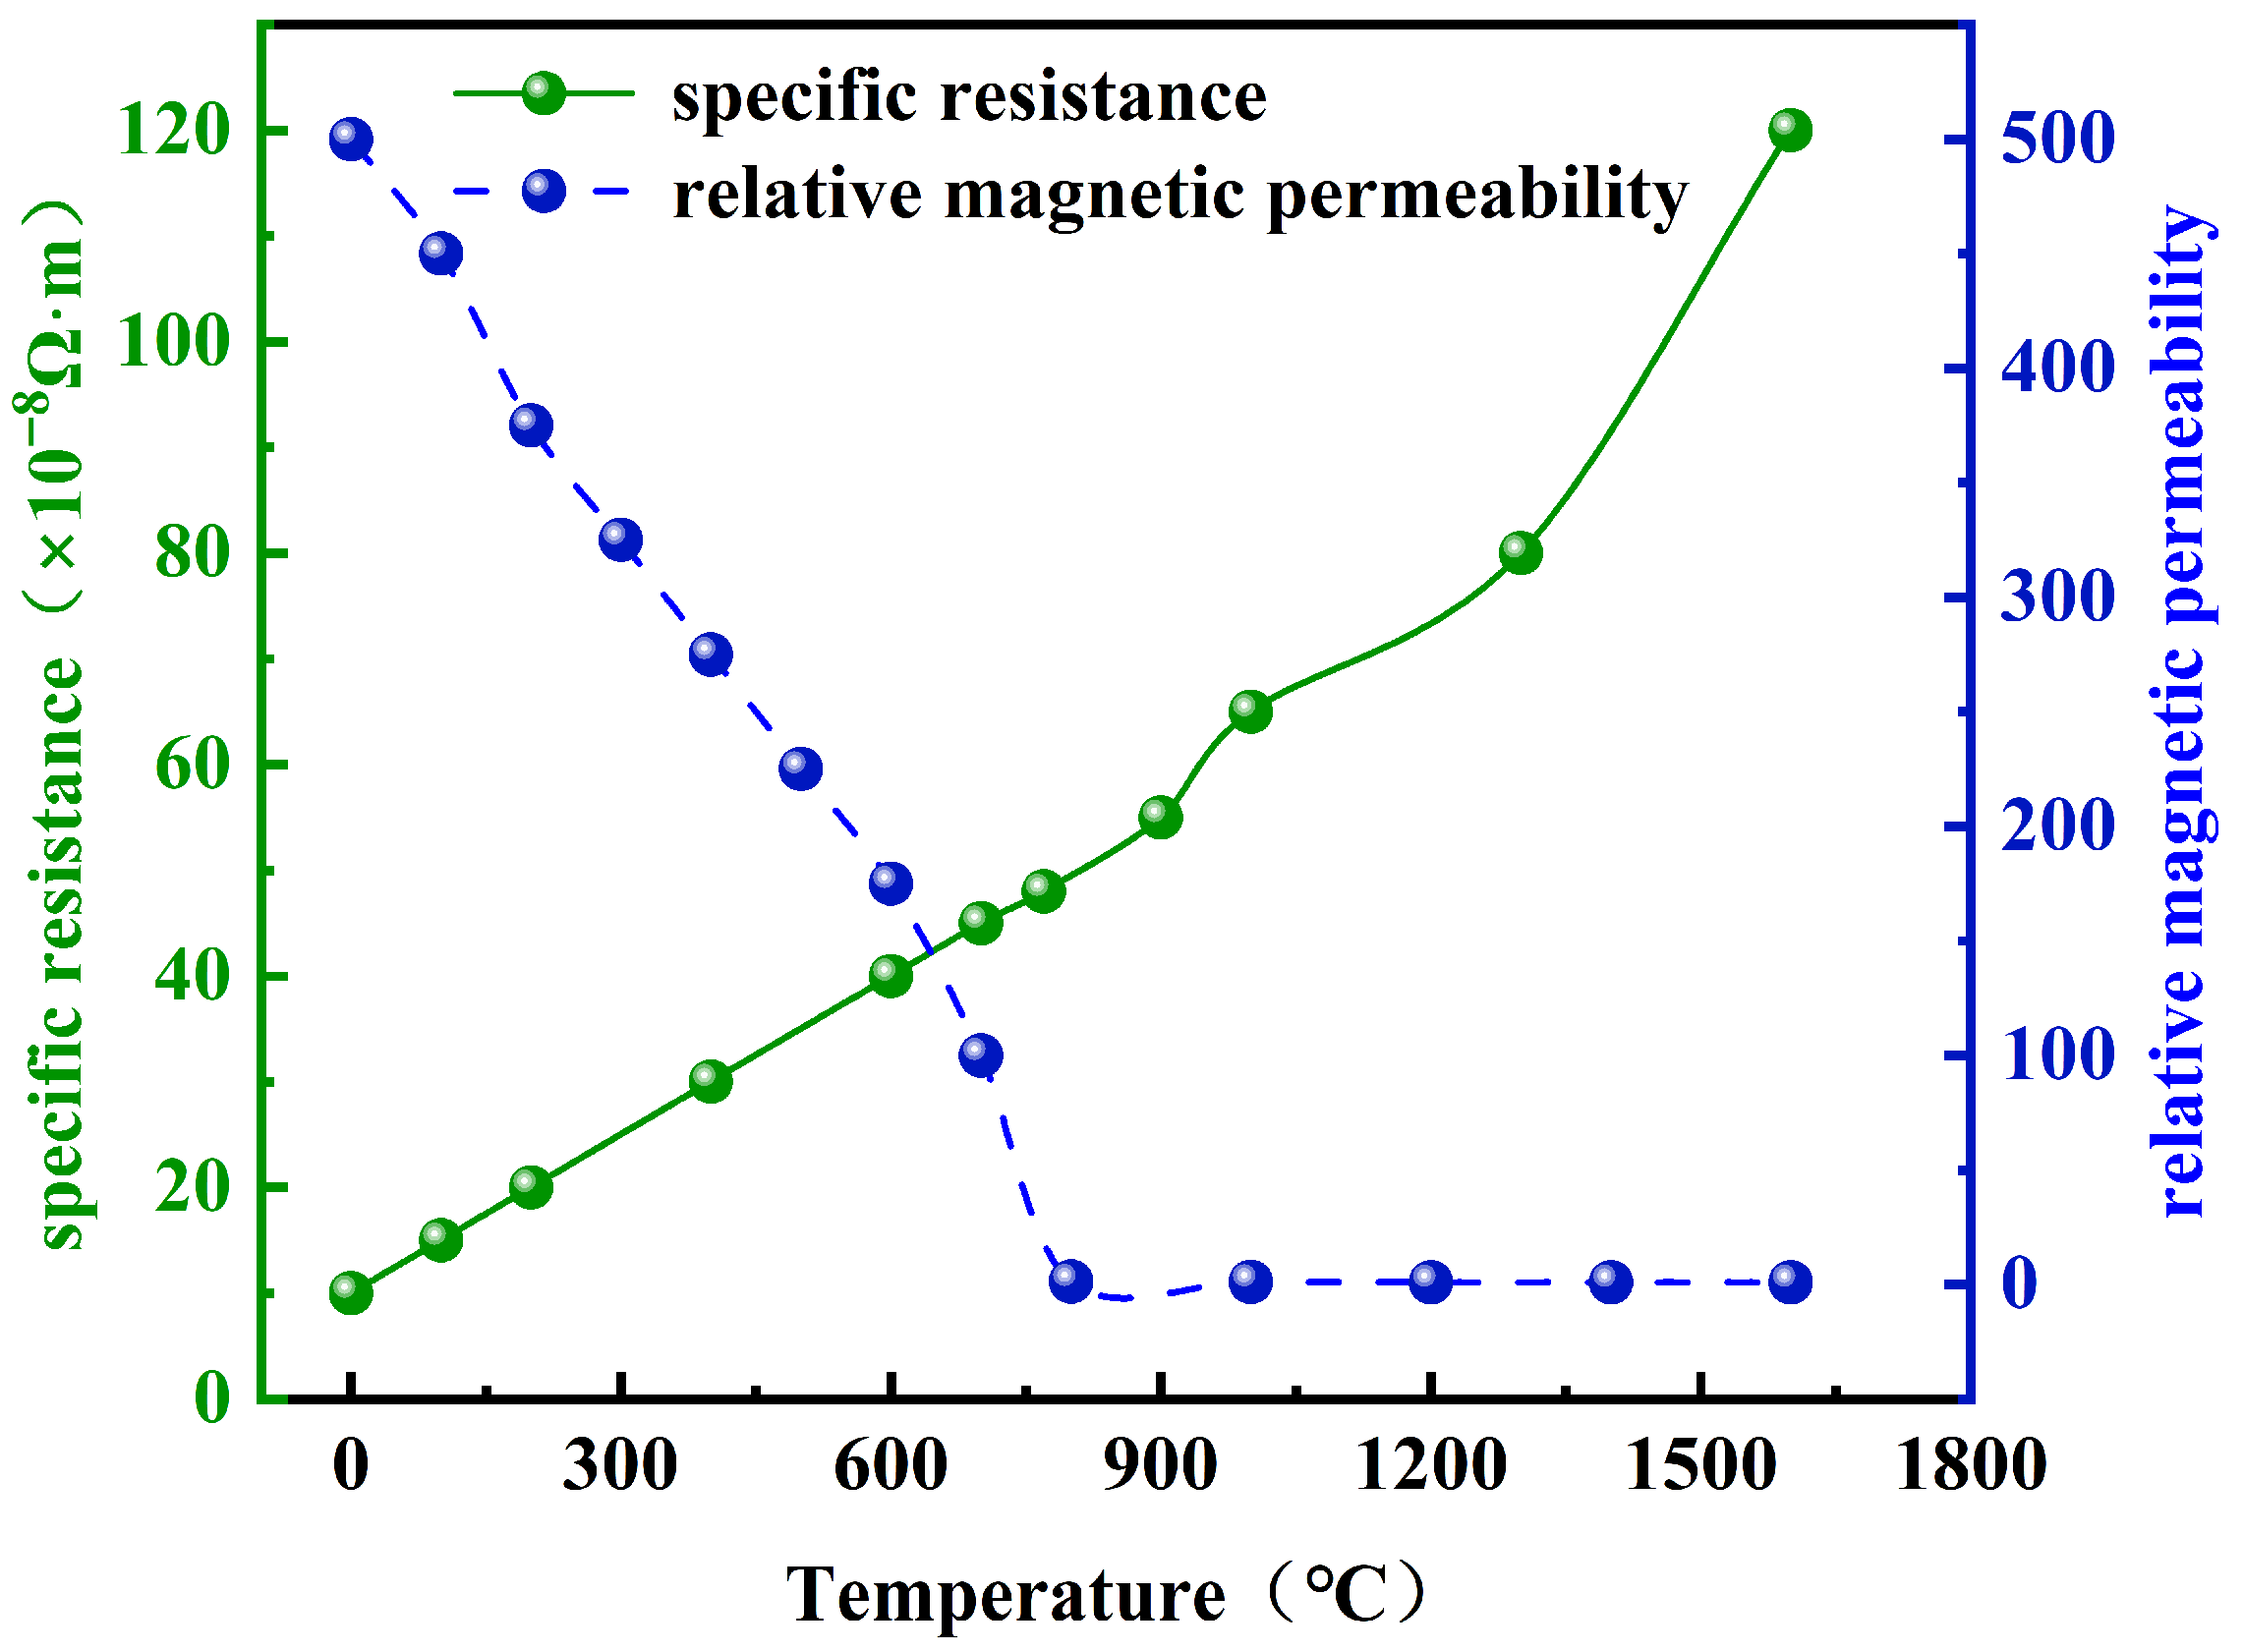
In Figure 2, the resistivity of pure iron at 20 °C is approximately 9.71 × 10⁻⁸ Ω·m within the temperature range of 0 °C to 700 °C. Its resistivity increases approximately linearly with temperature, at a rate of about 5 × 10⁻⁹ Ω·m/°C [22]. The graphite feedstock under scrutiny in this study is principally graphite feedstock that has undergone high-temperature graphitizing, which is characterized by the presence of elemental impurities, such as iron, aluminum, and boron, predominantly in the form of oxides. The major constituents of graphite feedstock are enumerated in Table 1 below.
The physical properties in this model are shown in Table 2 below.
The boundary conditions of the model are delineated in Table 3. The initial temperatures of the graphite crucible, graphite feedstock, air domain, and environment are set to 293.15 K. The initial flow velocity in the gas region is 0 m/s, and the initial pressure inside is 1 standard atmospheric pressure. The axial tangential and normal magnetic fluxes are set to 0, and the boundaries between the graphite feedstock and the inner wall of the graphite crucible, the graphite feedstock and the air domain, or the outer wall of the graphite crucible and the outside air are in the continuous magnetic field. The boundary between the graphite feedstock and the air domain is the boundary of radiation heat transfer, and its control equation is as follows.

2.2. Electromagnetic Field

The induced current generated by the induction coil forms an alternating magnetic field inside the induction furnace, which interacts with the crucible and the graphite feedstock to generate heat. The electromagnetic field inside the induction furnace is solved by the finite element method based on Maxwell’s equations (Equations (1)–(4)) [23,24].
Gauss’s law for electric fields:
C E · d l = S B t · d S
where E is the electric field intensity, V/m; B is the magnetic flux density, T; S is the surface bounded by the closed loop C, and t is the time, s.
Gauss’s law for magnetic fields:
C B · d S = 0
Ampere’s law:
C H · d l = S ( J + D t ) · d S
C D · d S = S ρ · d V
where D is the electric strength, C/m2; H is the magnetic field strength, A/m2, ρ is the density of electric charge, kg/m3, and J is the current density, A/m2.

2.3. Temperature Field

When analyzing the electromagnetic–thermal coupling problem in time-harmonic electromagnetic fields, both the electric field intensity E and the current density J are expressed in complex forms that vary sinusoidally or cosinusoidally with time. The actual physical quantities are obtained by taking the real part Re(z) of these complex expressions, which enables accurate characterization of their time-varying behavior. In the process of induction heating, multi-physical field coupling is involved. Under the interaction between the electromagnetic field and the thermal field, Joule heat and magnetic losses are regarded as heat sources. Thus, the governing equation of the temperature field for this system is Equation (5) [25,26].
ρ C P T t + ρ C P u · T · ( k T ) = Q
Q = Q r h + Q m l
Q r h = 1 2 R e z ( J · E )
Q r h = 1 2 R e z ( i ω B · H )
where Q is the heat source term, W/m3; Qrh is the induced joule heat, W/m3; Qml is the magnetic dissipation heat, W/m3; ω is the angular frequency, rad/s, and Re(z) is the real part in the formula of the time-harmonic electromagnetic field.

2.4. Dimensionless Analysis

To investigate the synergistic influence mechanisms of key parameters on heat and mass transfer, as well as reaction processes during induction heating. It conducts a dimensional analysis of the relevant governing equations. By integrating the dimensionless characteristic parameters of the electromagnetic field, flow field, temperature field, and concentration field, we systematically analyze the relationships among electromagnetic force, heat and mass transfer rates, the reduction rate Rr of graphite feedstock within the furnace, and energy consumption Qf in this physical system. The operating parameters under various working conditions are shown in Table 4.
The dimensionlessness of flow field [18]:
B t = 1 μ σ 2 B + ε ω 2 σ B
B = B B 0 ,   ω = ω ω 0 ,   μ = μ μ 0 ,   ε = ε ε 0
B t = 1 L U σ μ 0 2 B μ + ε ω 2 ( L 2 ω 0 2 ε 0 μ 0 ) L U σ μ 0 B
Re = ρ U L / μ
where U is the characteristic velocity, m/s; L is the characteristic length, m; μ is the viscosity, Pa⋅s; ε is the emissivity of the material; σ is the electrical conductivity, S/m; and Re is the Reynolds number.
The dimensionless of temperature field [27]:
Q = ρ C p T t + ρ C p u · T · ( k T )
ρ = ρ ρ 0 ,   c p = c p c p 0 ,   T = T T 0 ,   t = t U L 0 ,   u = u U
Q = ρ c p T t + ρ c p u · T · ( k c p 0 ρ 0 U L 0 · T )
Pr = C p μ / k
Q = ρ c p T t + ρ c p u · T · ( 1 Re · Pr · T )
where Pr is the Prandtl number; k is the thermal conductivity, W/(m·K), T is the temperature, K; T′ is the dimensionless characteristic length, and Cp is the specific heat, J/(kg·K).
The dimensionless of concentration field [28]:
c x t ( D c x ) + u · c x = R x
P e = U L / D
c x t ( 1 P e c x ) + u · c x = R x
where Pe is the Peclet number; cx is the concentration of component x, mol/m3; Rx is the reaction source term, mol/(m3·s).

3. Model Verification

3.1. Mesh Independence Verification

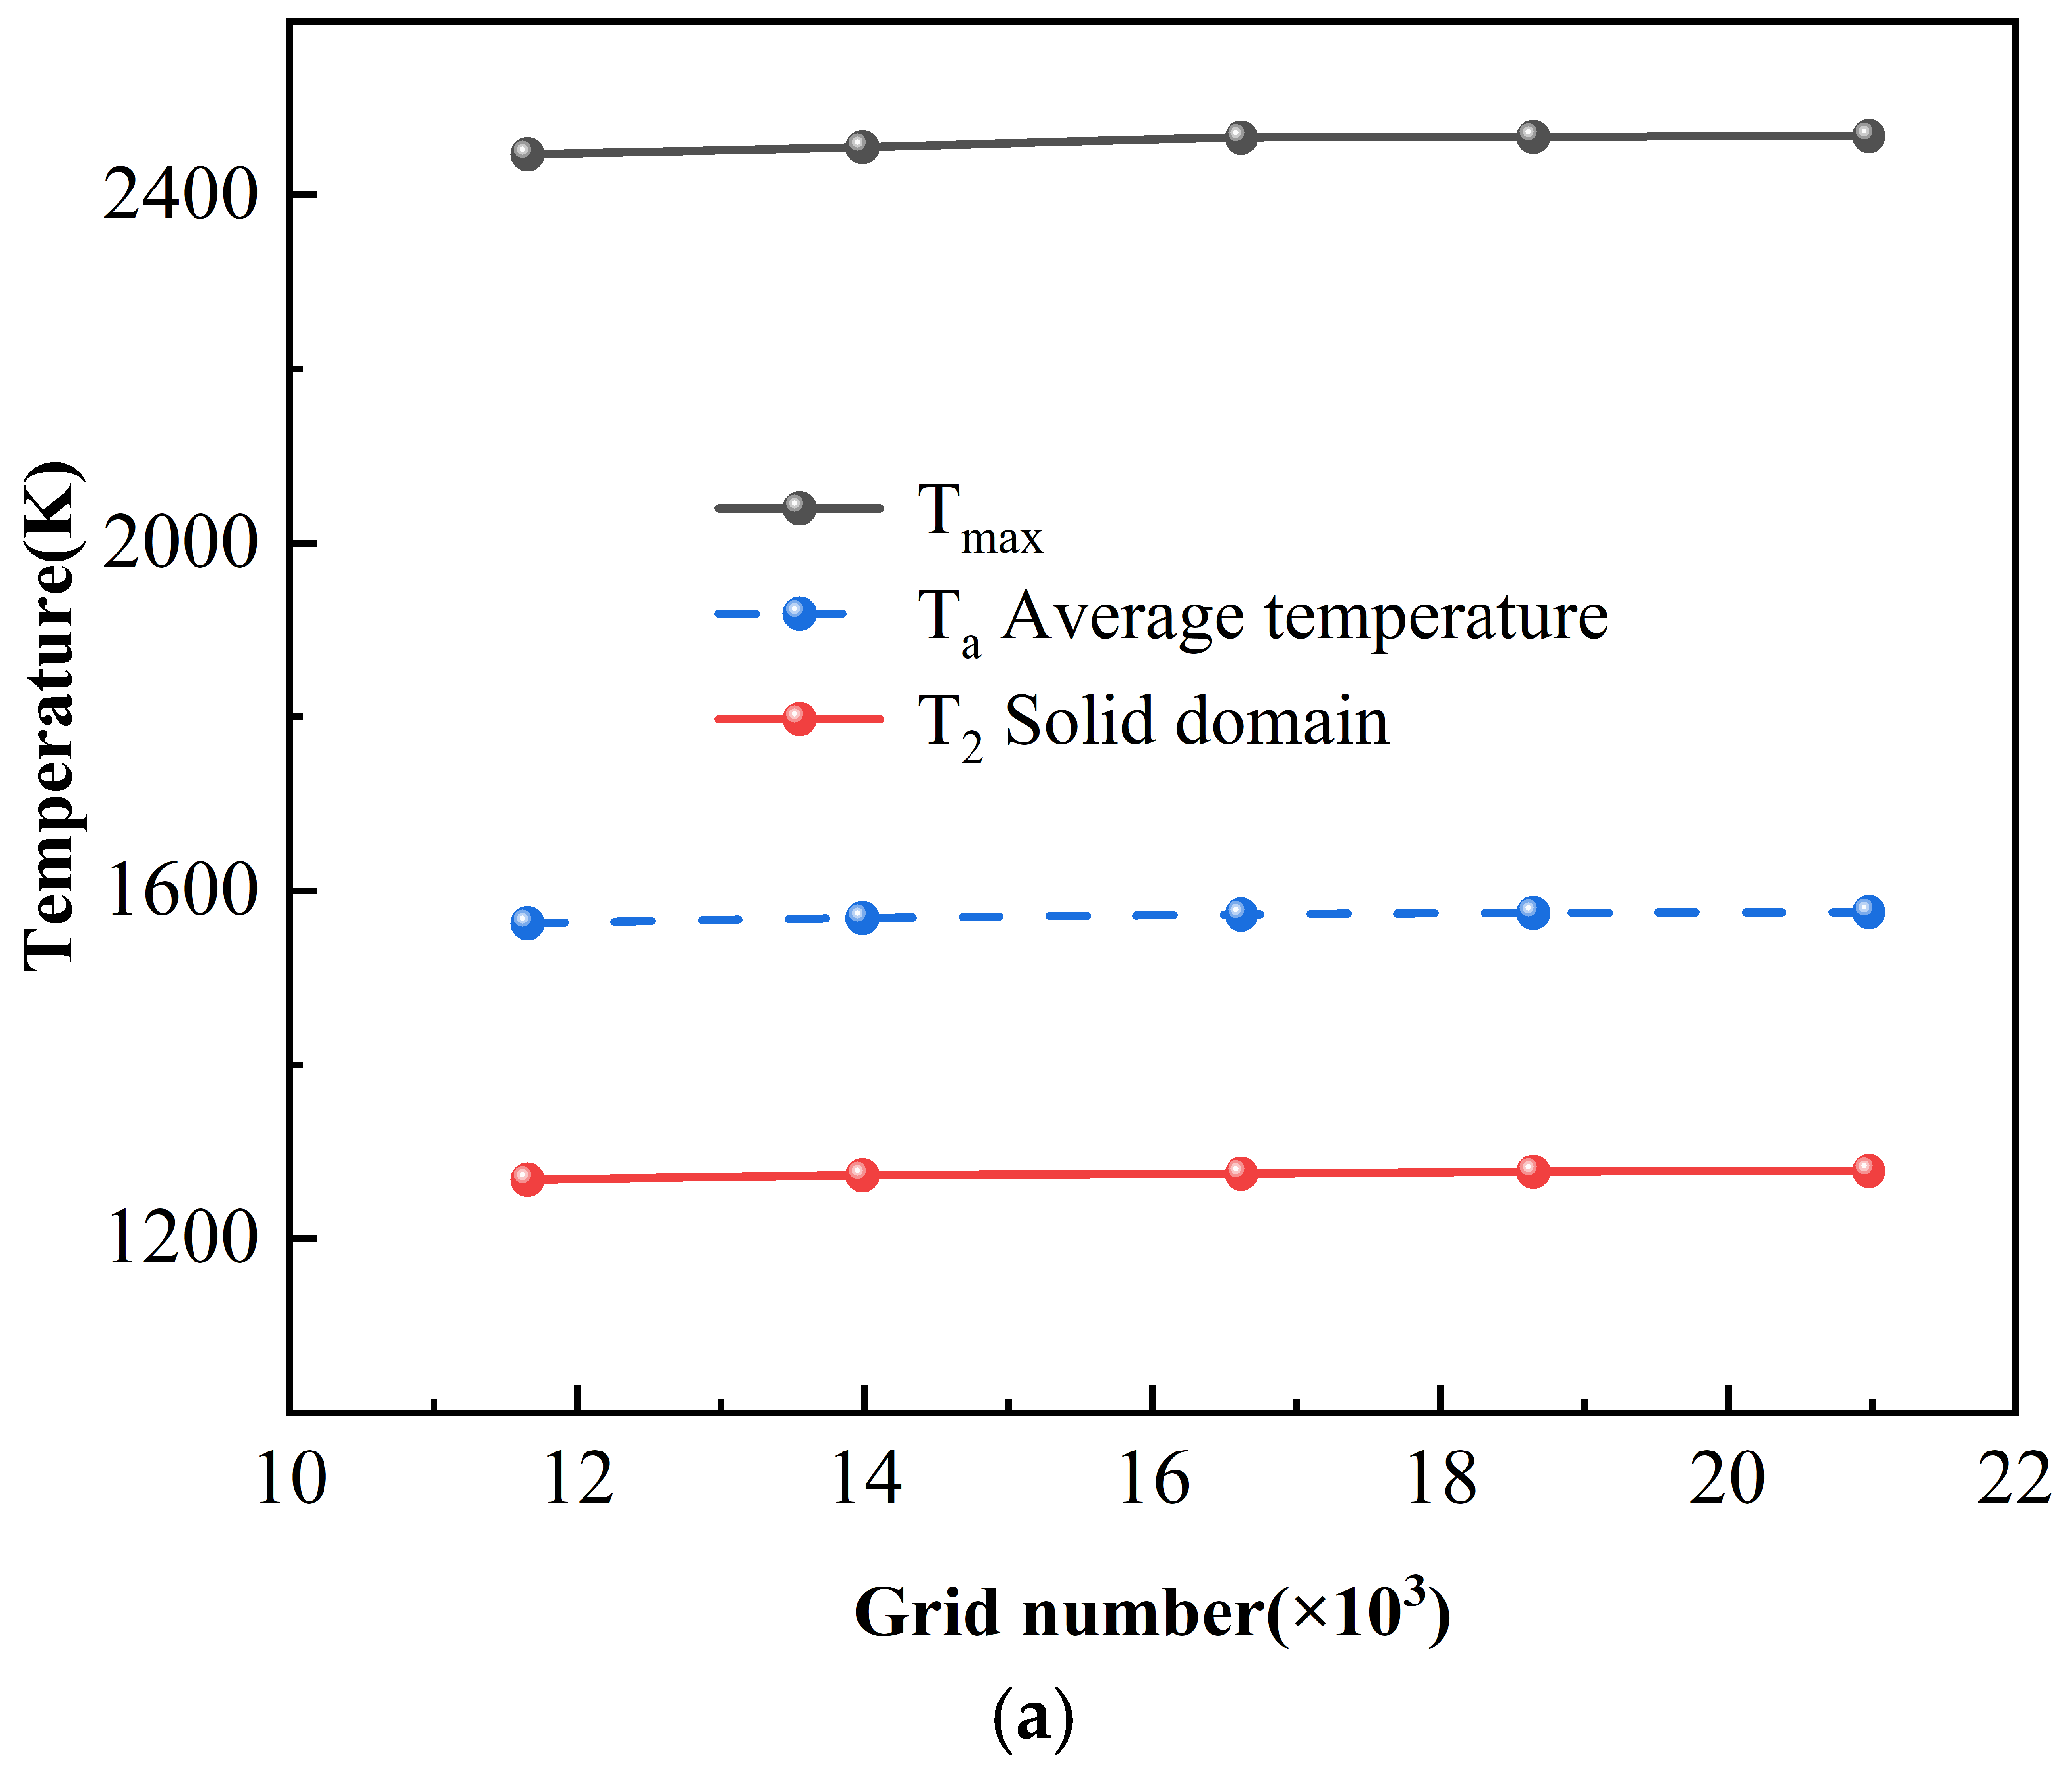
Local mesh refinement is carried out for the high-temperature solid region inside the furnace, the boundary region of the induction furnace wall, and the induction coil region. Finally, five different mesh numbers were selected to analyze the variation laws of physical quantities inside the induction furnace. The five types of mesh are named as the coarse mesh (mesh number: 11.656 × 10³), the relatively coarse mesh (mesh number: 13.987 × 10³), the medium mesh (mesh number: 16.618 × 10³), the relatively fine mesh (mesh number: 18.649 × 10³), and the fine mesh (mesh number: 20.980 × 10³). After heating for 500 s under the same conditions of a current intensity of 650 A and a magnetic field frequency of 14 kHz, the maximum temperature Tmax, the center temperature T2 of the solid domain, and the average temperature Ta inside the induction furnace are compared and analyzed through different mesh numbers to verify the mesh independence of the induction furnace model. As shown in Figure 3a, it can be seen that when the mesh number increases from 11.656 × 10³ to 13.987 × 10³, the temperature T2 in the air domain will decrease to a certain extent. At this time, the temperature error between the coarse mesh and the relatively coarse mesh in the air domain reaches 13 K, and the relative error is approximately 1.02%.
In numerical simulation calculations, the computational accuracy of the model is considered first, and then the model and the computational time of the numerical model should be simplified as much as possible [29]. This can greatly reduce the use of computing resources and the waste of computing time, thereby improving computational efficiency. Combined with the results in Figure 3b, the mesh division scheme with a relatively coarse grid number of 13.987 × 10³ can be set as the mesh quantity for each working condition in the subsequent simulation.

3.2. Verification of the Simulation

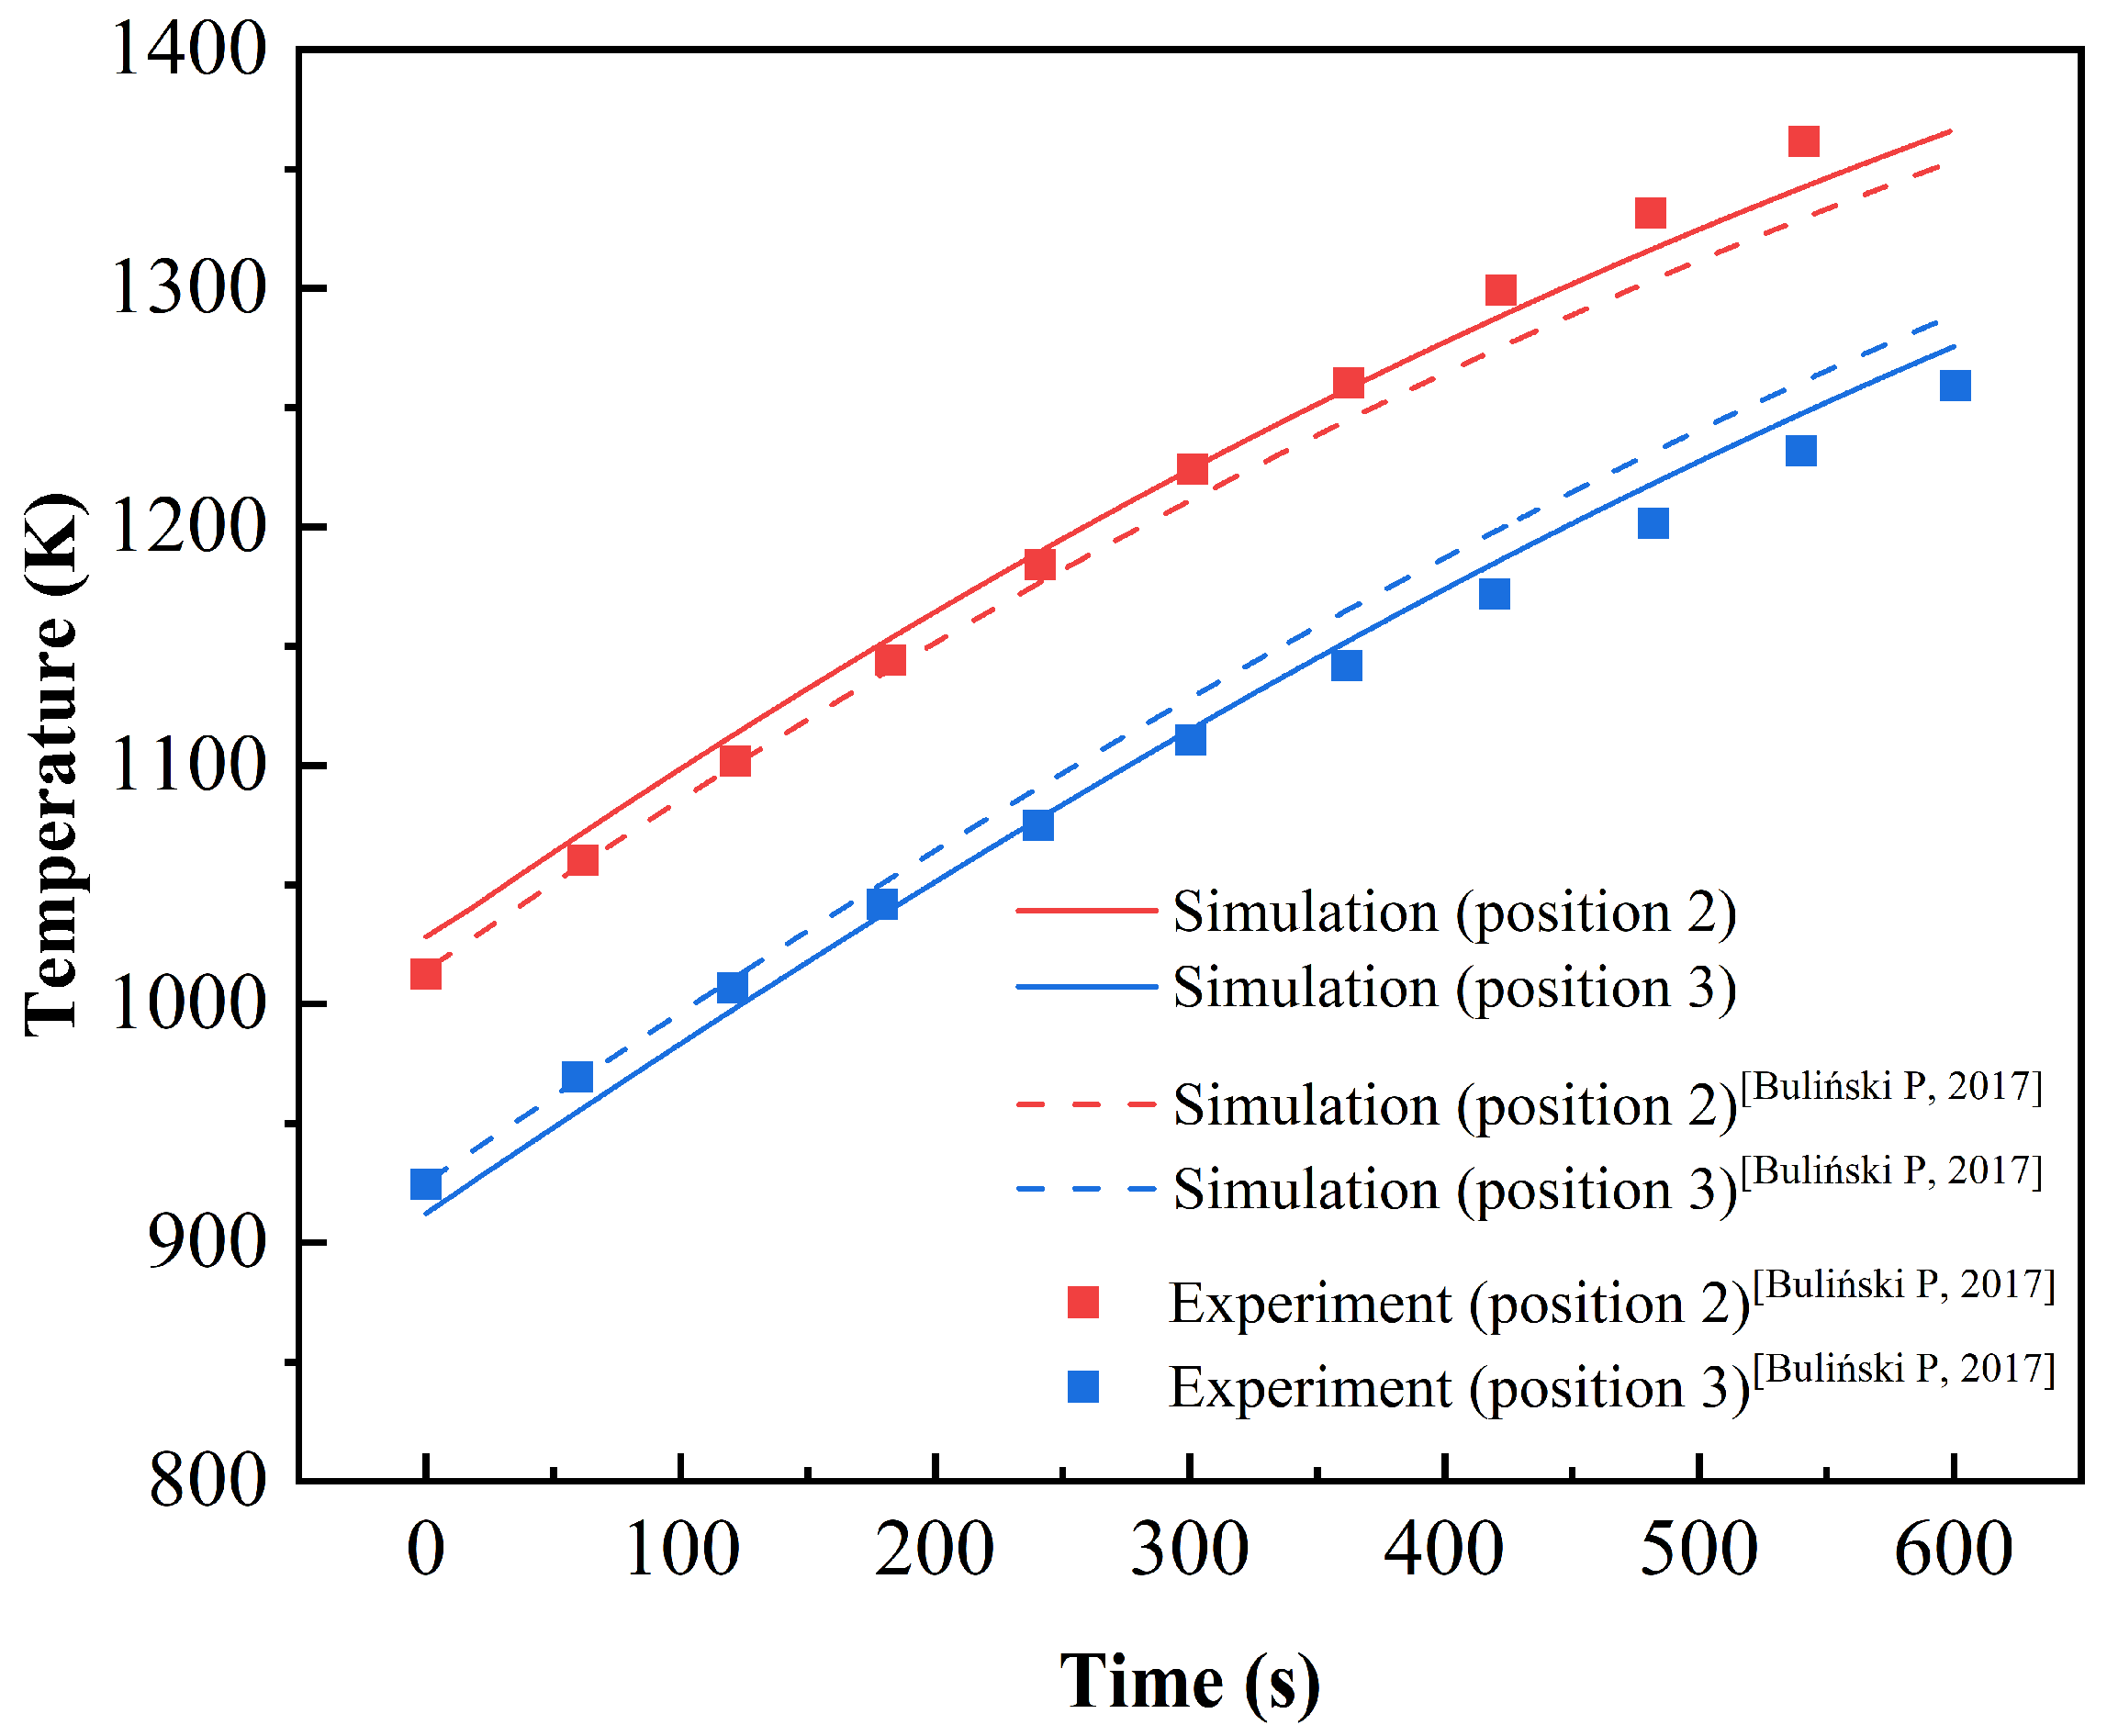
To verify the accuracy and feasibility of the numerical simulation results, the simulation results of the induction heating furnace in reference are reproduced, and a detailed comparison and analysis are conducted between the experimental results and the numerical simulation results in the reference [30]. By comparing and analyzing the experimental measurement values of the temperature inside the induction furnace with the numerical simulation results, the effectiveness and accuracy of the numerical simulation method in predicting the temperature distribution of the induction furnace are verified.
The comparison and analysis of the experimental measurement data and the numerical simulation results are shown in Figure 4. It indicates a good agreement result. Specifically, the temperature variation curves at two characteristic positions obtained from the numerical simulation show a high consistency in the heating trend and key time points. Compared with the curves obtained using the same numerical simulation method in the reference, the simulation curves in this study maintain a consistent overall trend, and the maximum relative error is controlled within 2%. It suggests that the reliability of the numerical model and calculation method is high. Further analysis reveals that the differences between the experimental temperature data and the simulation curves mainly occur after 400 s. This phenomenon can be attributed to the interference of environmental factors during the experimental measurement process. It is due to that the heat exchange between the experimental device and the external environment, the measurement temperature points are affected by the ambient temperature and experience heat dissipation losses, thus resulting in the measured temperature values being slightly lower than the simulation results. Despite these differences, the overall consistency between the experimental and simulation data still indicates that the numerical model established in this study can effectively reflect the heat transfer characteristics in the induction purification process.

4. Results and Discussion

4.1. Furnace Temperature Analysis

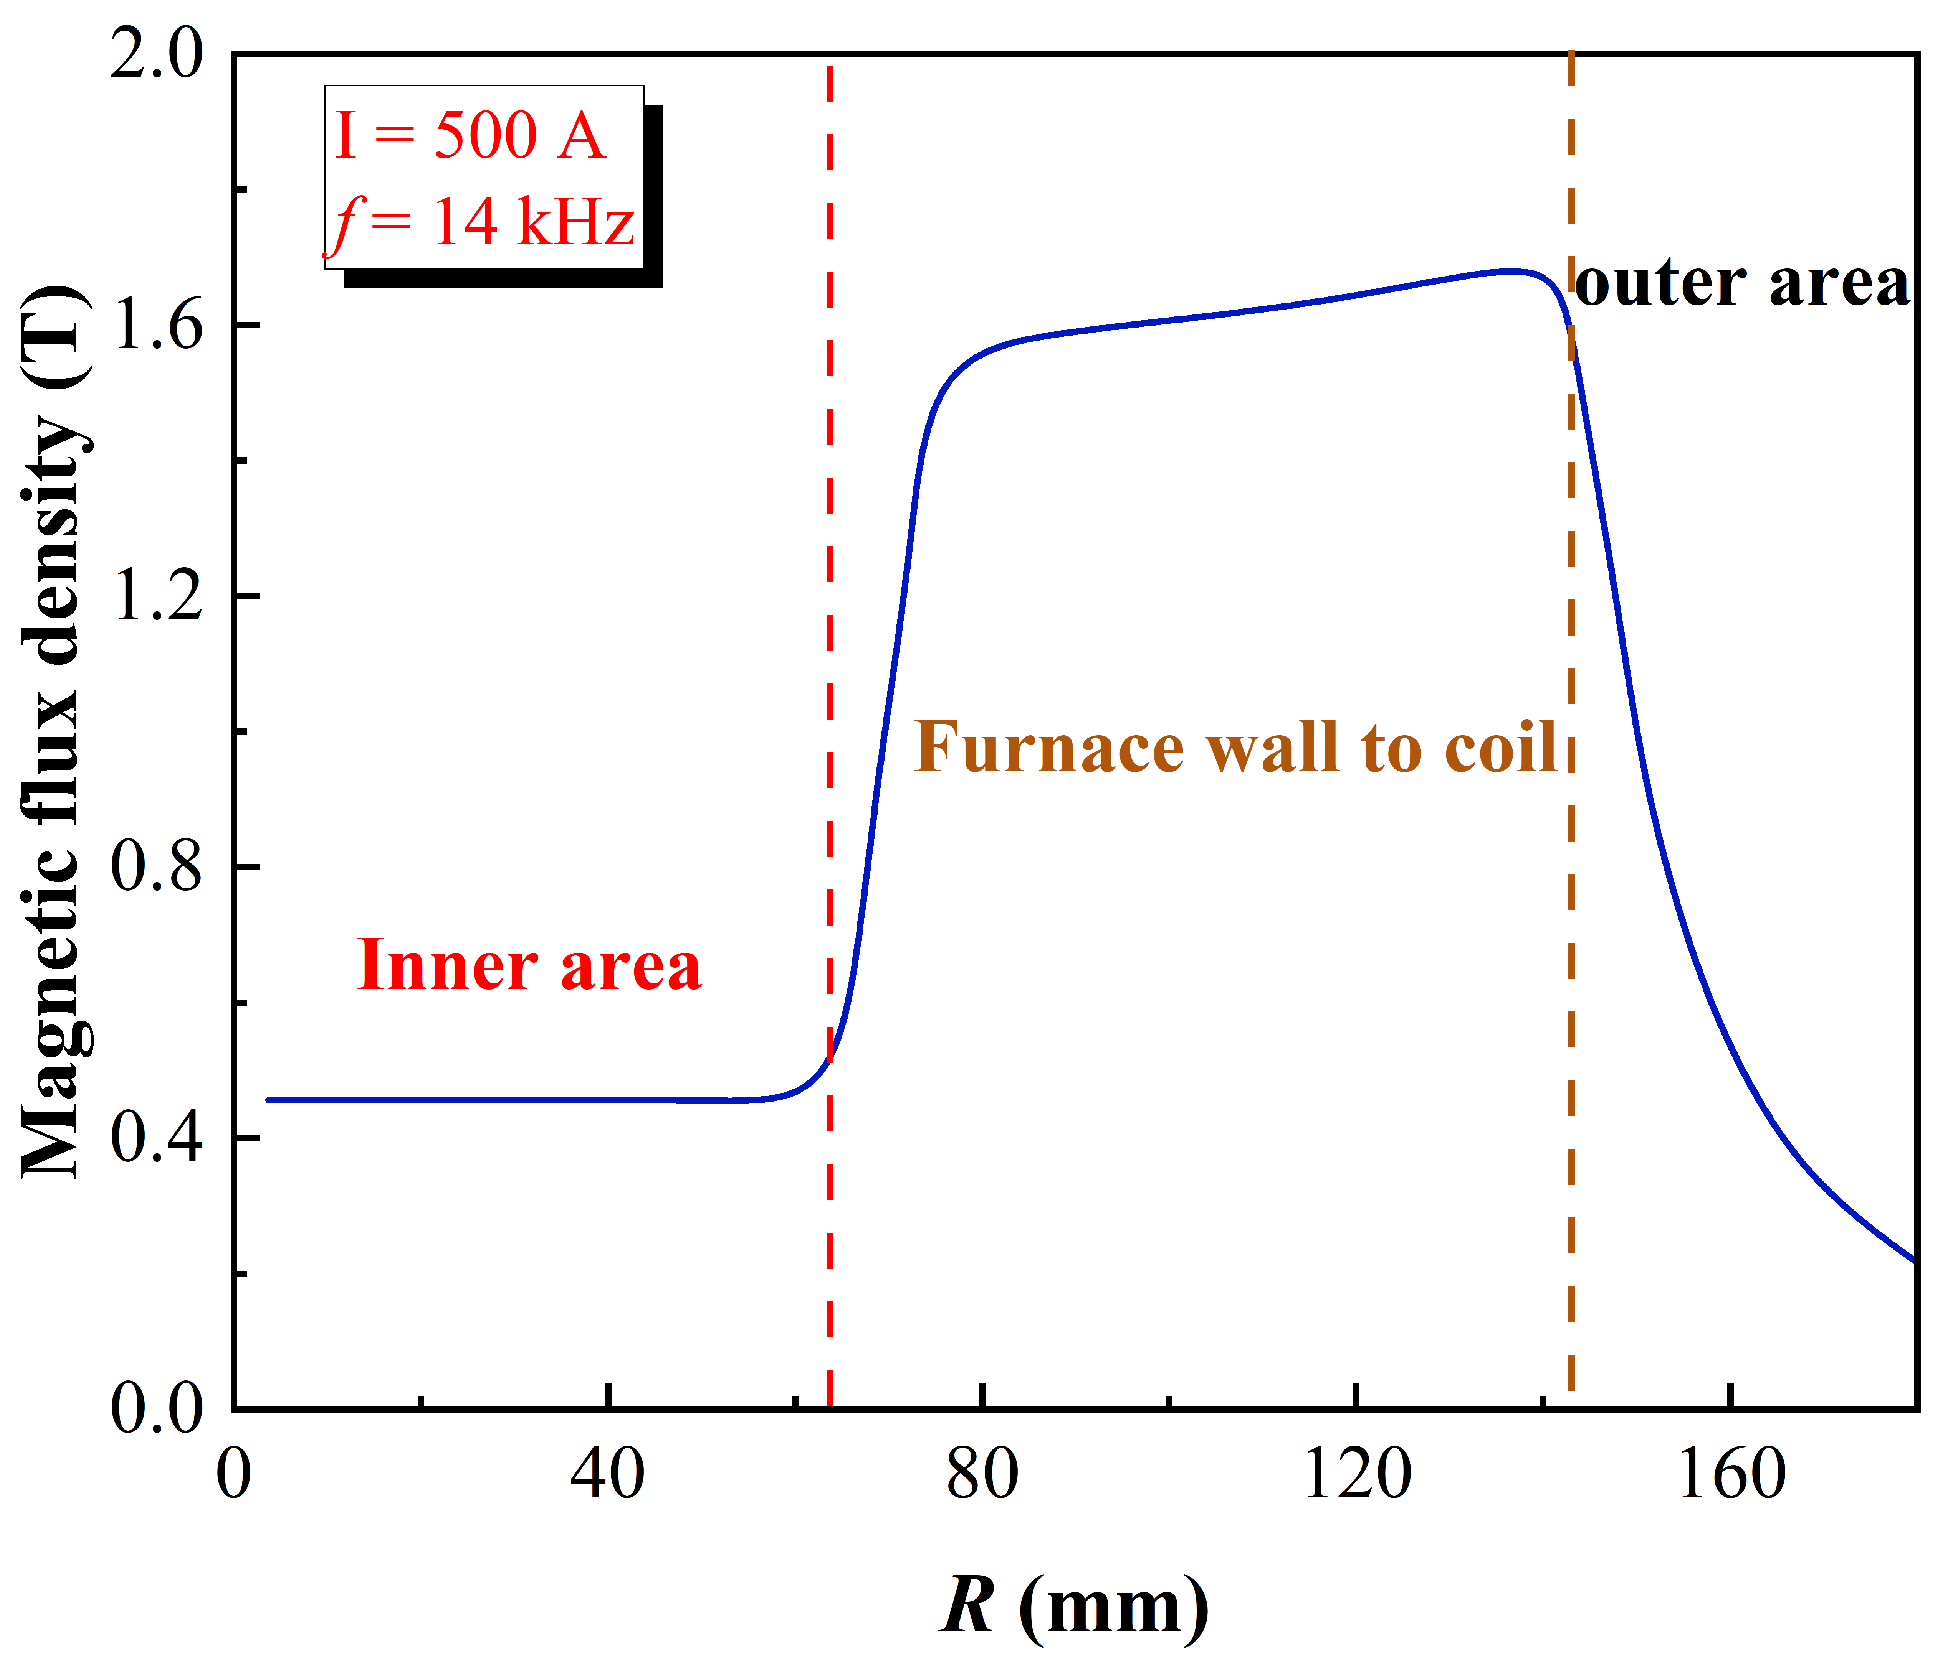
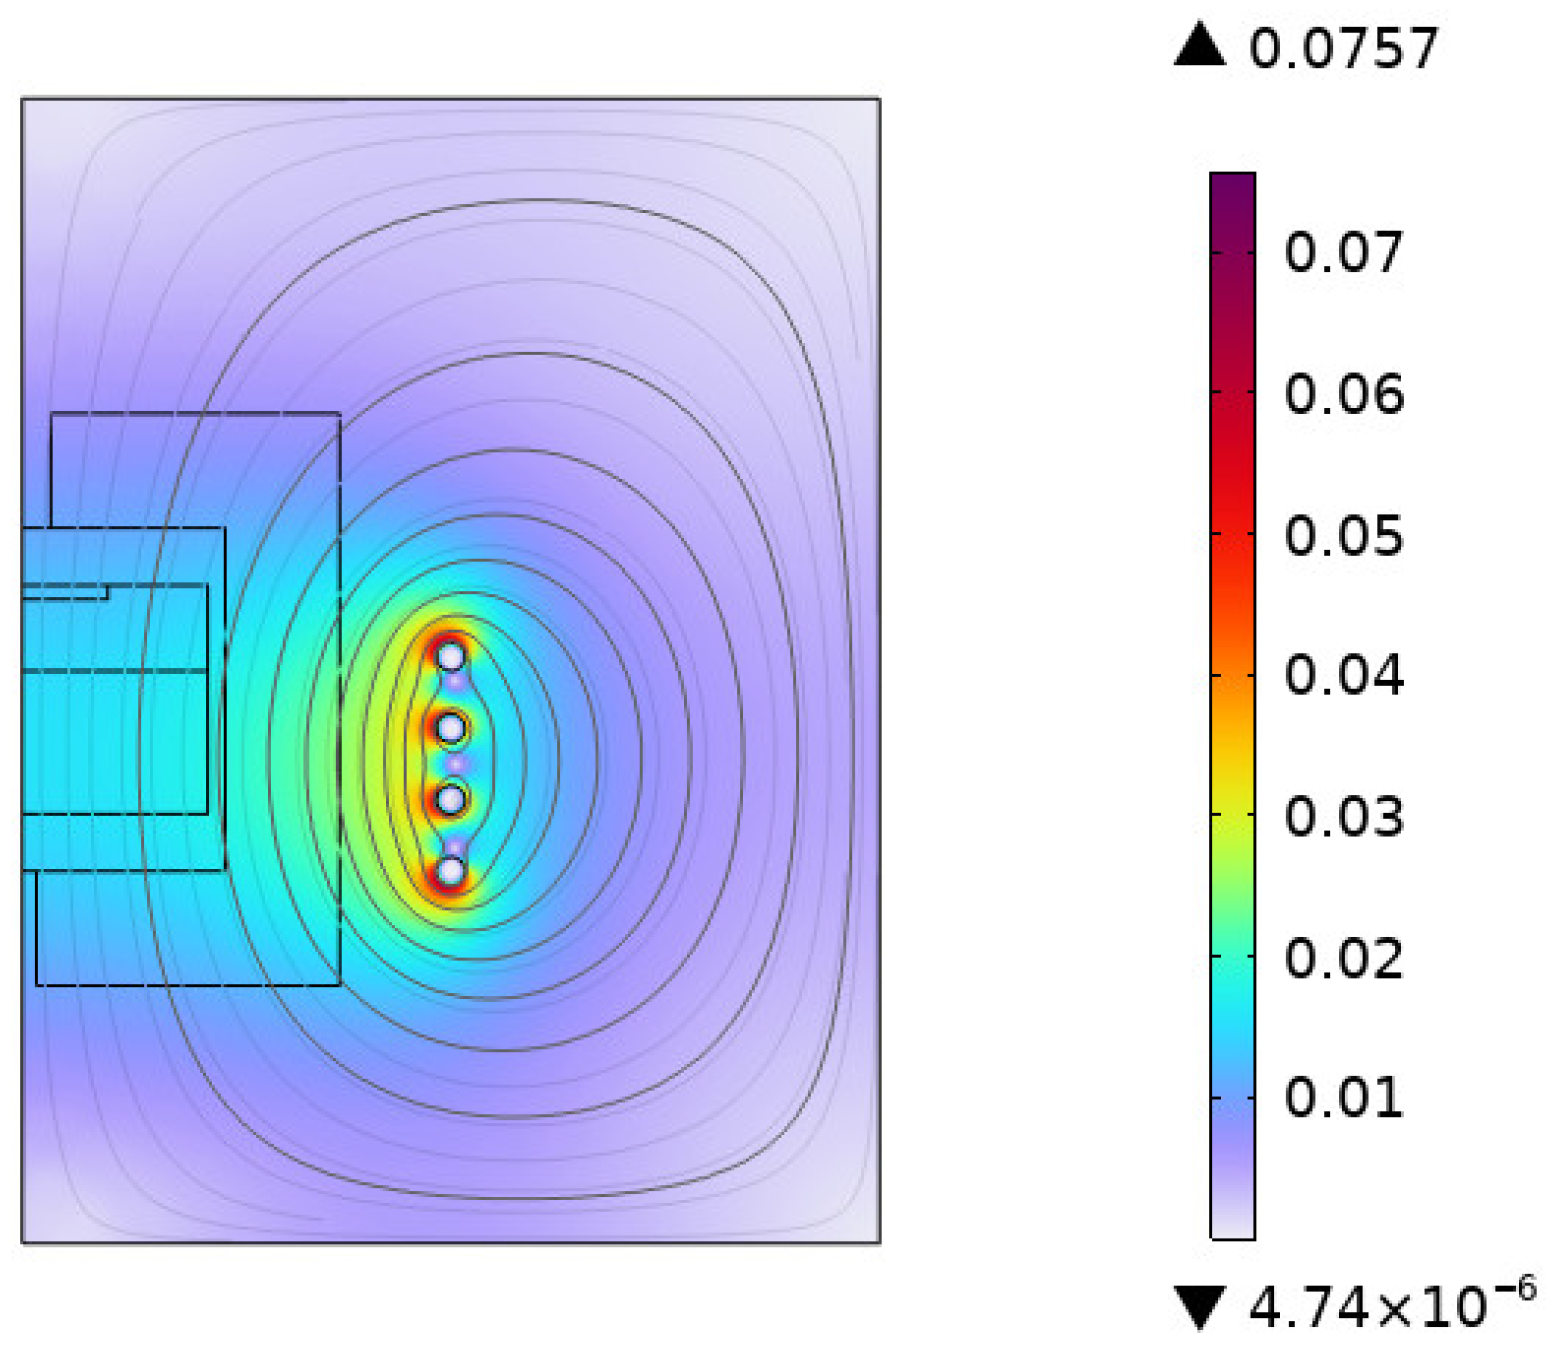
The transverse distribution characteristics of the magnetic field generated by the induction coil in the electromagnetic induction furnace are shown in Figure 5 and Figure 6. The area from 0 to 65 mm is the internal area of the induction furnace, and 65 mm to 81 mm is the furnace wall area, while 81 mm to 151 mm is the area from the induction coil to the furnace wall. Furthermore, beyond 151 mm is the air area outside the induction coil. Within the internal area of the induction furnace, the magnetic flux density shows a relatively stable distribution state, which maintains a value of approximately 0.45 T. It indicates that a relatively uniform magnetic field environment is formed in furnace. From the furnace wall to the induction coil area, the magnetic flux density significantly increases. In the transition area between the coil and the furnace wall, the magnetic flux density reaches about 1.60 T, where it forms a distinct magnetic field intensity gradient. In the area outside the induction coil, the magnetic flux density gradually decreases, with the magnetic field strength gradually reducing as the distance from the coil increases. It approaches zero in the area far from the coil. Due to the highly concentrated current density, the peak magnetic field intensity area in the entire system is formed on the surface and nearby area of the induction coil. In contrast, the internal space of the induction furnace has a uniform and gentle distribution of magnetic field intensity, due to the combined effect of electromagnetic shielding and magnetic field diffusion.
Figure 7 shows the dynamic variation in the internal temperature of the electromagnetic induction furnace. Based on the numerical simulation method, the spatiotemporal distribution characteristics of the temperature field inside the furnace are studied. The temperature inside the electromagnetic induction furnace exhibits typical non-uniform diffusion characteristics. The heat transfer process gradually expands from the furnace wall to the center area of the furnace. It is demonstrated that there is a significant coupling effect of heat conduction and convection. Specifically, the solid region, with its high thermal conductivity and electromagnetic induction heating characteristics, absorbs energy first and achieves a temperature increase. Then, the heat is transferred to the air region through heat conduction, convection, and other pathways. Further analysis of the temperature field distribution reveals that the temperature rise rate in the center area of the furnace and the upper air region is significantly lower than in other areas. This is because the center area is far from the heat source and is affected by the thermal shielding effect of the surrounding areas, which results in a delay in heat transfer. At the same time, due to the influence of natural convection, the heat diffusion in the upper air region is more dispersed, thereby slowing down the temperature rise rate of this area. At 30 s of induction heating, the average temperature inside the furnace reaches approximately 1430 K, which corresponds to the rapid heating period of the heating process.

4.2. Influence of Operating Parameters

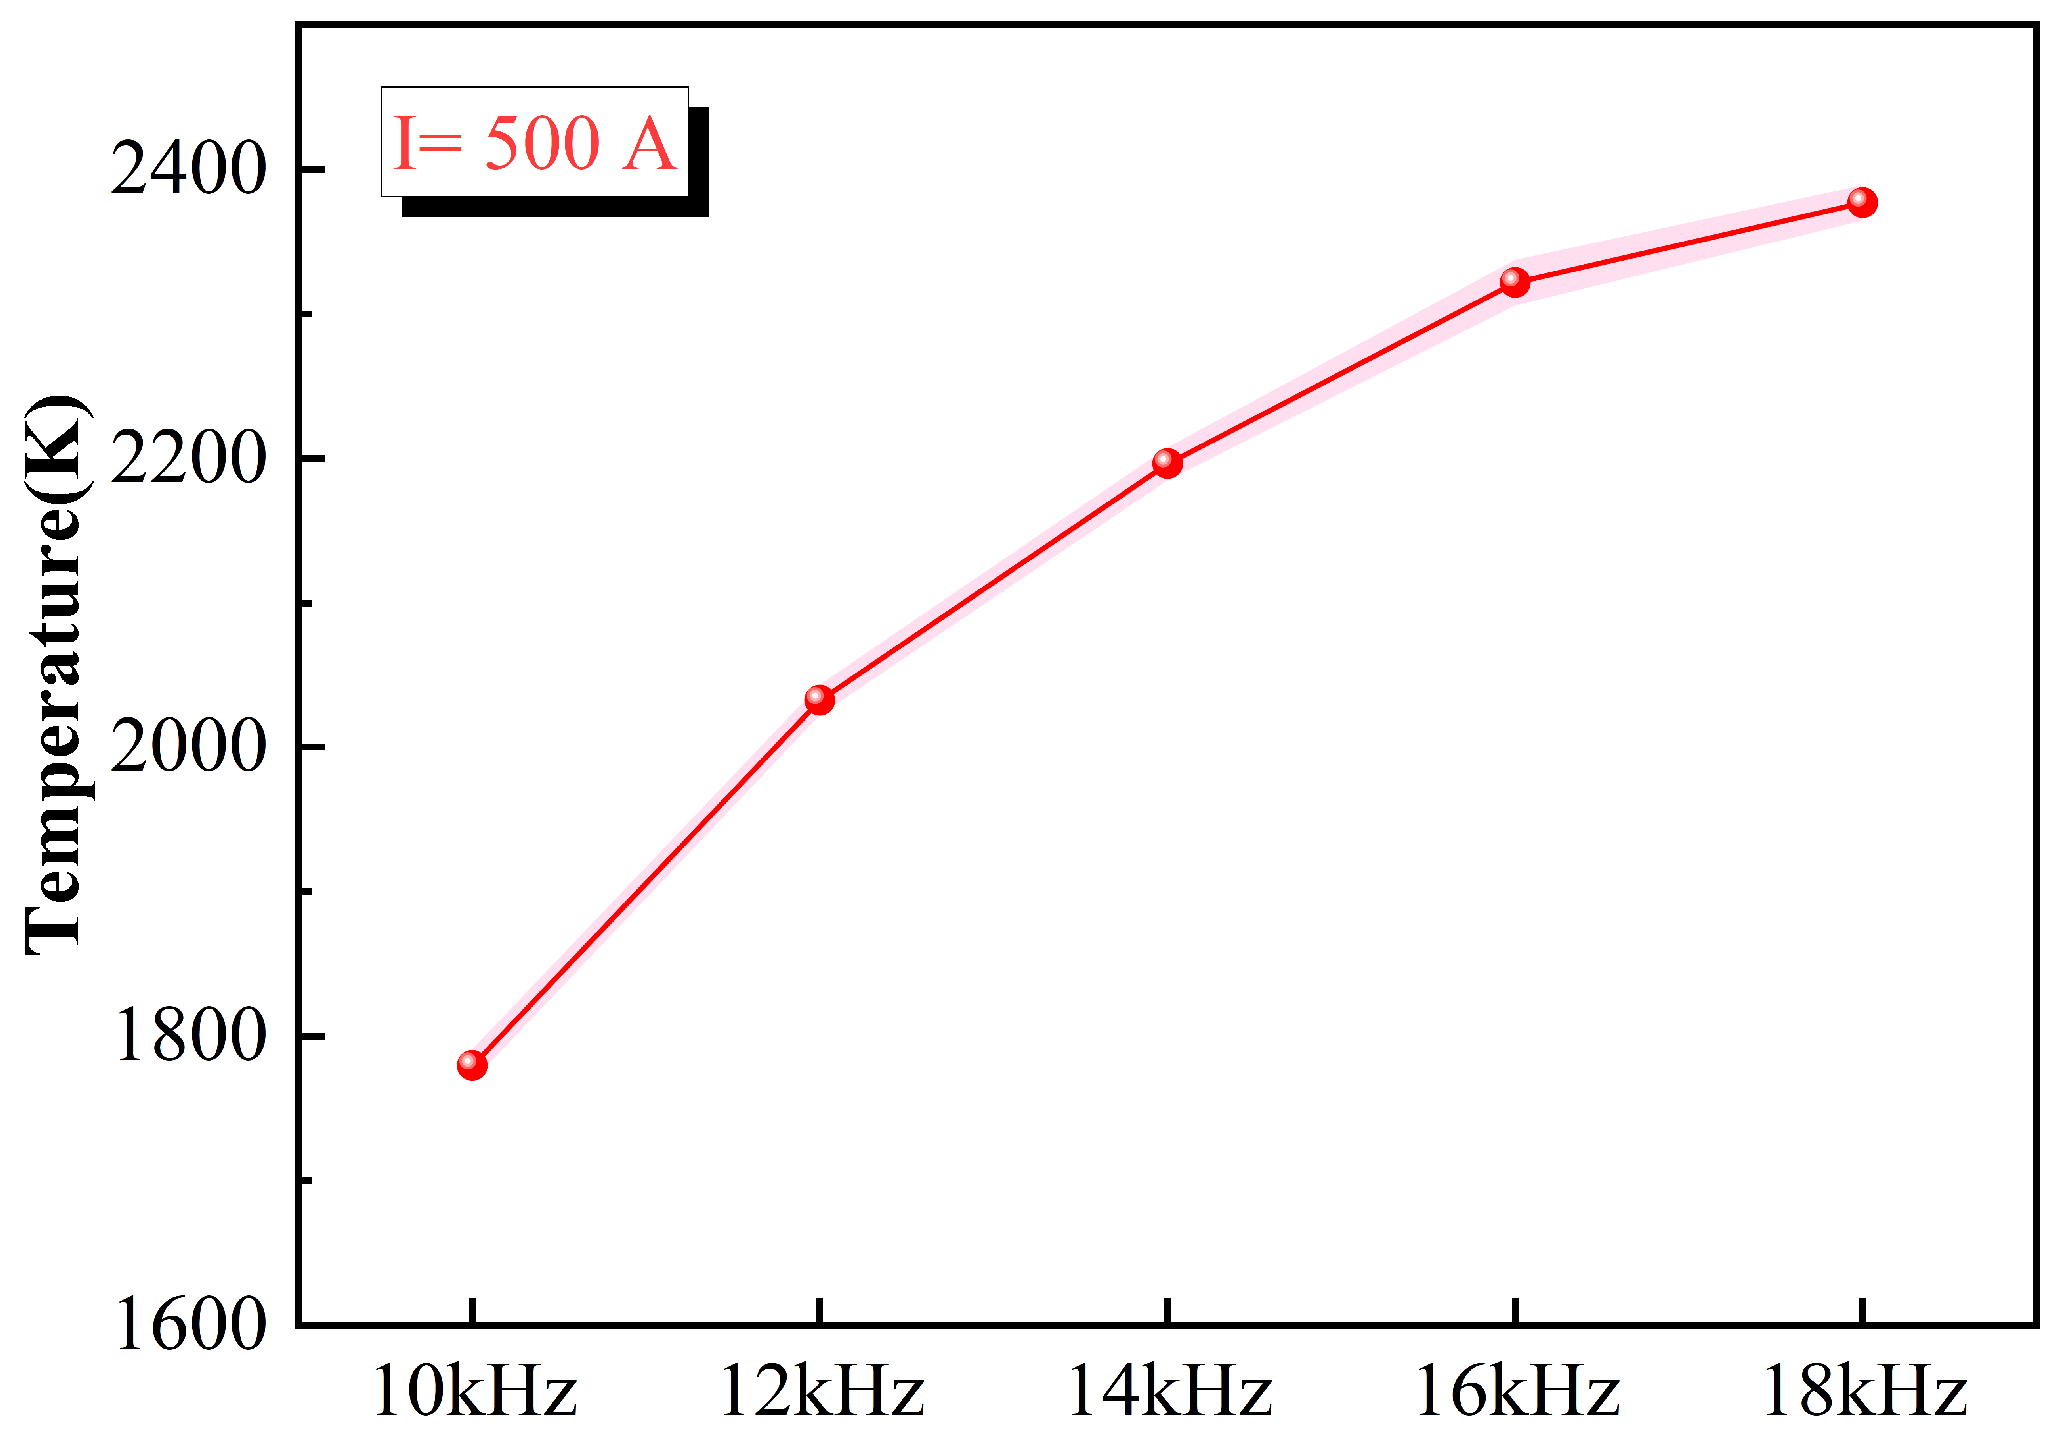
When the frequency of the magnetic field gradually increases from 10 kHz, a significant upward trend in temperature is observed within the furnace in Figure 8. In the electromagnetic induction furnace, as the magnetic field frequency successively reaches 10 kHz, 12 kHz, 14 kHz, 16 kHz, and 18 kHz, the average temperatures achieved are 2037 K, 2198 K, 2320 K, and 2373 K, respectively. With each increment of 2 kHz in magnetic field frequency, the degree of increase in average temperature inside the furnace is diminished. The corresponding percentage rises for each stage are recorded at 14.1%, 7.9%, 5.6%, and 2.3%. The phenomenon of diminishing temperature rise can primarily be attributed to the skin effect. The skin effect refers to the phenomenon that when alternating current passes through a conductor, the current density tends to concentrate on the surface of the conductor, while it significantly decreases inside [31]. During induction heating processes, this induced current predominantly accumulates on the material’s surface layer. As magnetic field frequency escalates, there is a continuous reduction in current penetration depth. Therefore, this leads to a gradual decrease in the internal volume of material that can be effectively heated, which constrains overall heating efficiency.
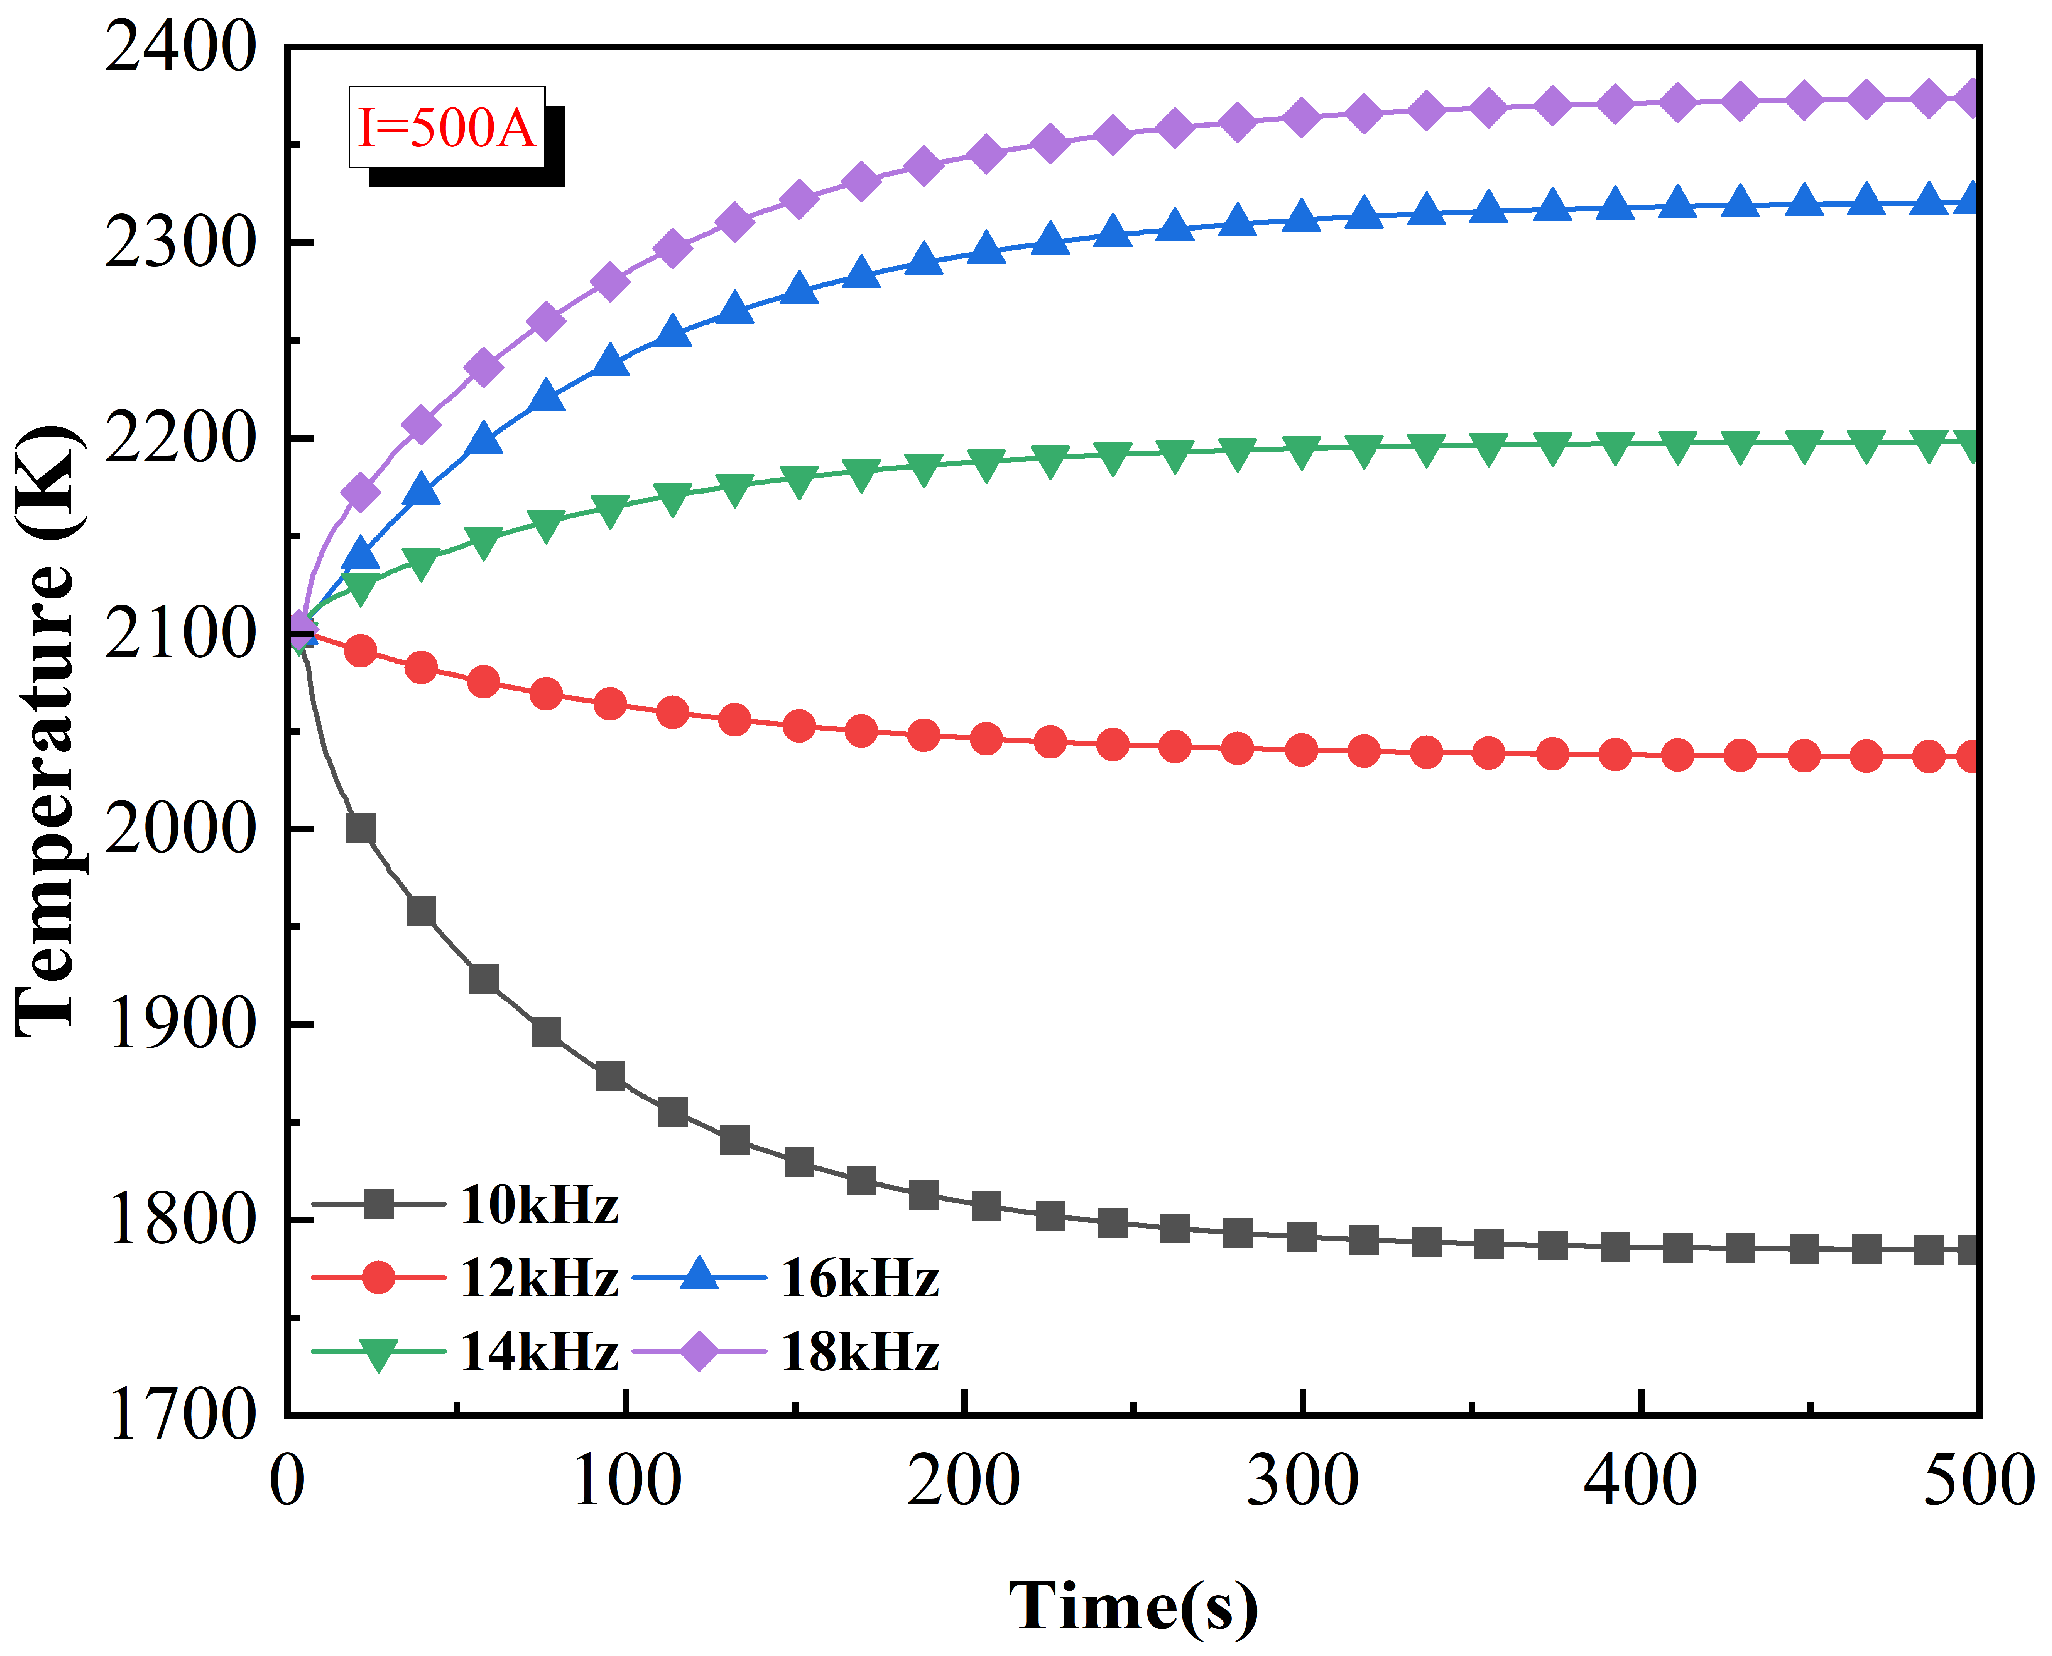
When the current condition is set at 500 A, the influence of different magnetic field frequencies on the average temperature inside the furnace is presented in Figure 9. During the induction heating process, the area close to the furnace wall heats up faster, presenting a temperature distribution trend that gradually increases from the furnace wall to the interior. This results in local velocity and pressure changes to promote the formation of eddy currents. This convective motion enhances the heating efficiency and impacts the temperature distribution on the surface of the object, thereby affecting the effectiveness and quality of the entire heating process.
When the magnetic field frequency is at 14 kHz, the effect of current intensity on the average temperature of graphite feedstock in the furnace during induction heating is demonstrated in Figure 10. In contrast, the reduction in current could result in diminished energy input, thus leading to diminished heating rates and slower rises in temperature. Conversely, larger currents result in greater energy input, a faster heating rate, and a more rapid temperature rise. It is evident from the figure that the temperature of graphite feedstock in the furnace increases with an increase in current intensity.
In Figure 11, when the current intensity is 450 A, 500 A, 550 A, 600 A, and 650 A, the average temperature of graphite feedstock (Tave) are 1603 K, 1800 K, 1996 K, 2204 K, and 2411 K, respectively. It can be seen that for every increase in the average current intensity of the furnace by 50 A, Tave rises by about 200 K. As the frequency increases, the current is primarily concentrated in a thin layer near the surface of the conductor, rather than being uniformly distributed over the entire conductor cross-section. This phenomenon, known as proximity effect, leads to an increase in resistance near the conductor surface, which in turn generates heat and heats up the conductor surface [32]. In the case of multiple conductors in close proximity, magnetic field coupling ensues, leading to the redistribution of current between the conductors. This results in an uneven distribution of current between adjacent conductors. The impact of the skin and proximity effects can be mitigated by means of coil design optimization, frequency adjustment, and other measures. These measures are instrumental in enhancing the heating efficiency and uniformity, thus ensuring optimal heating outcomes.

4.3. Influence of Dimensionless Numbers

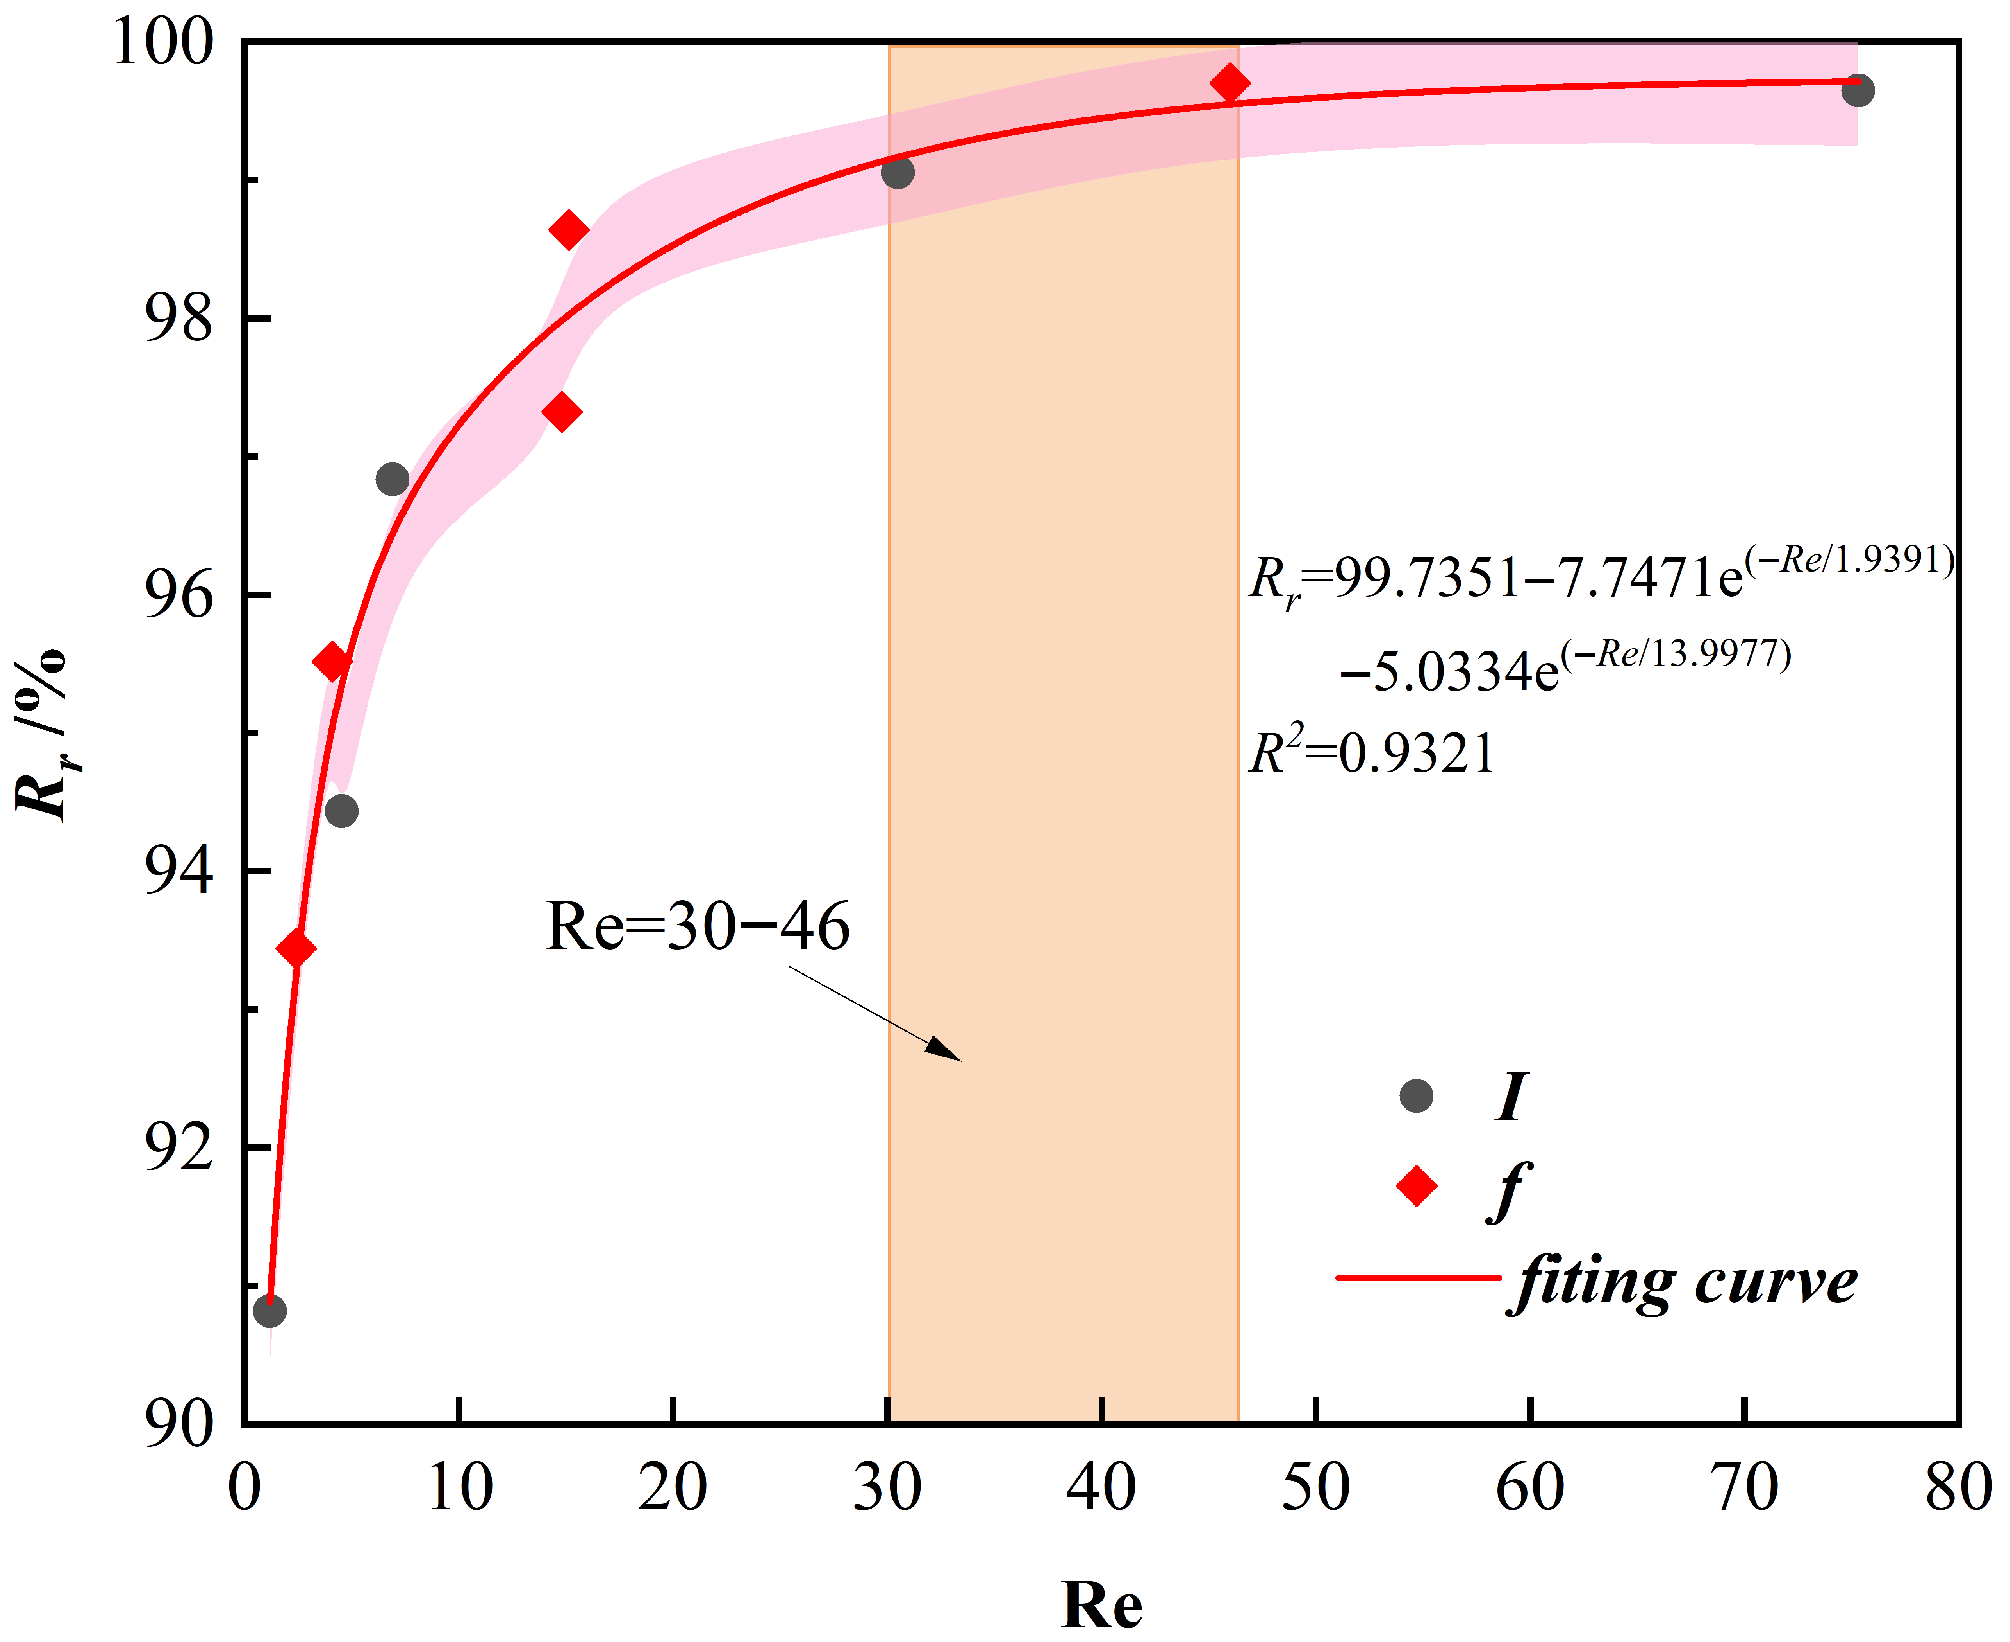
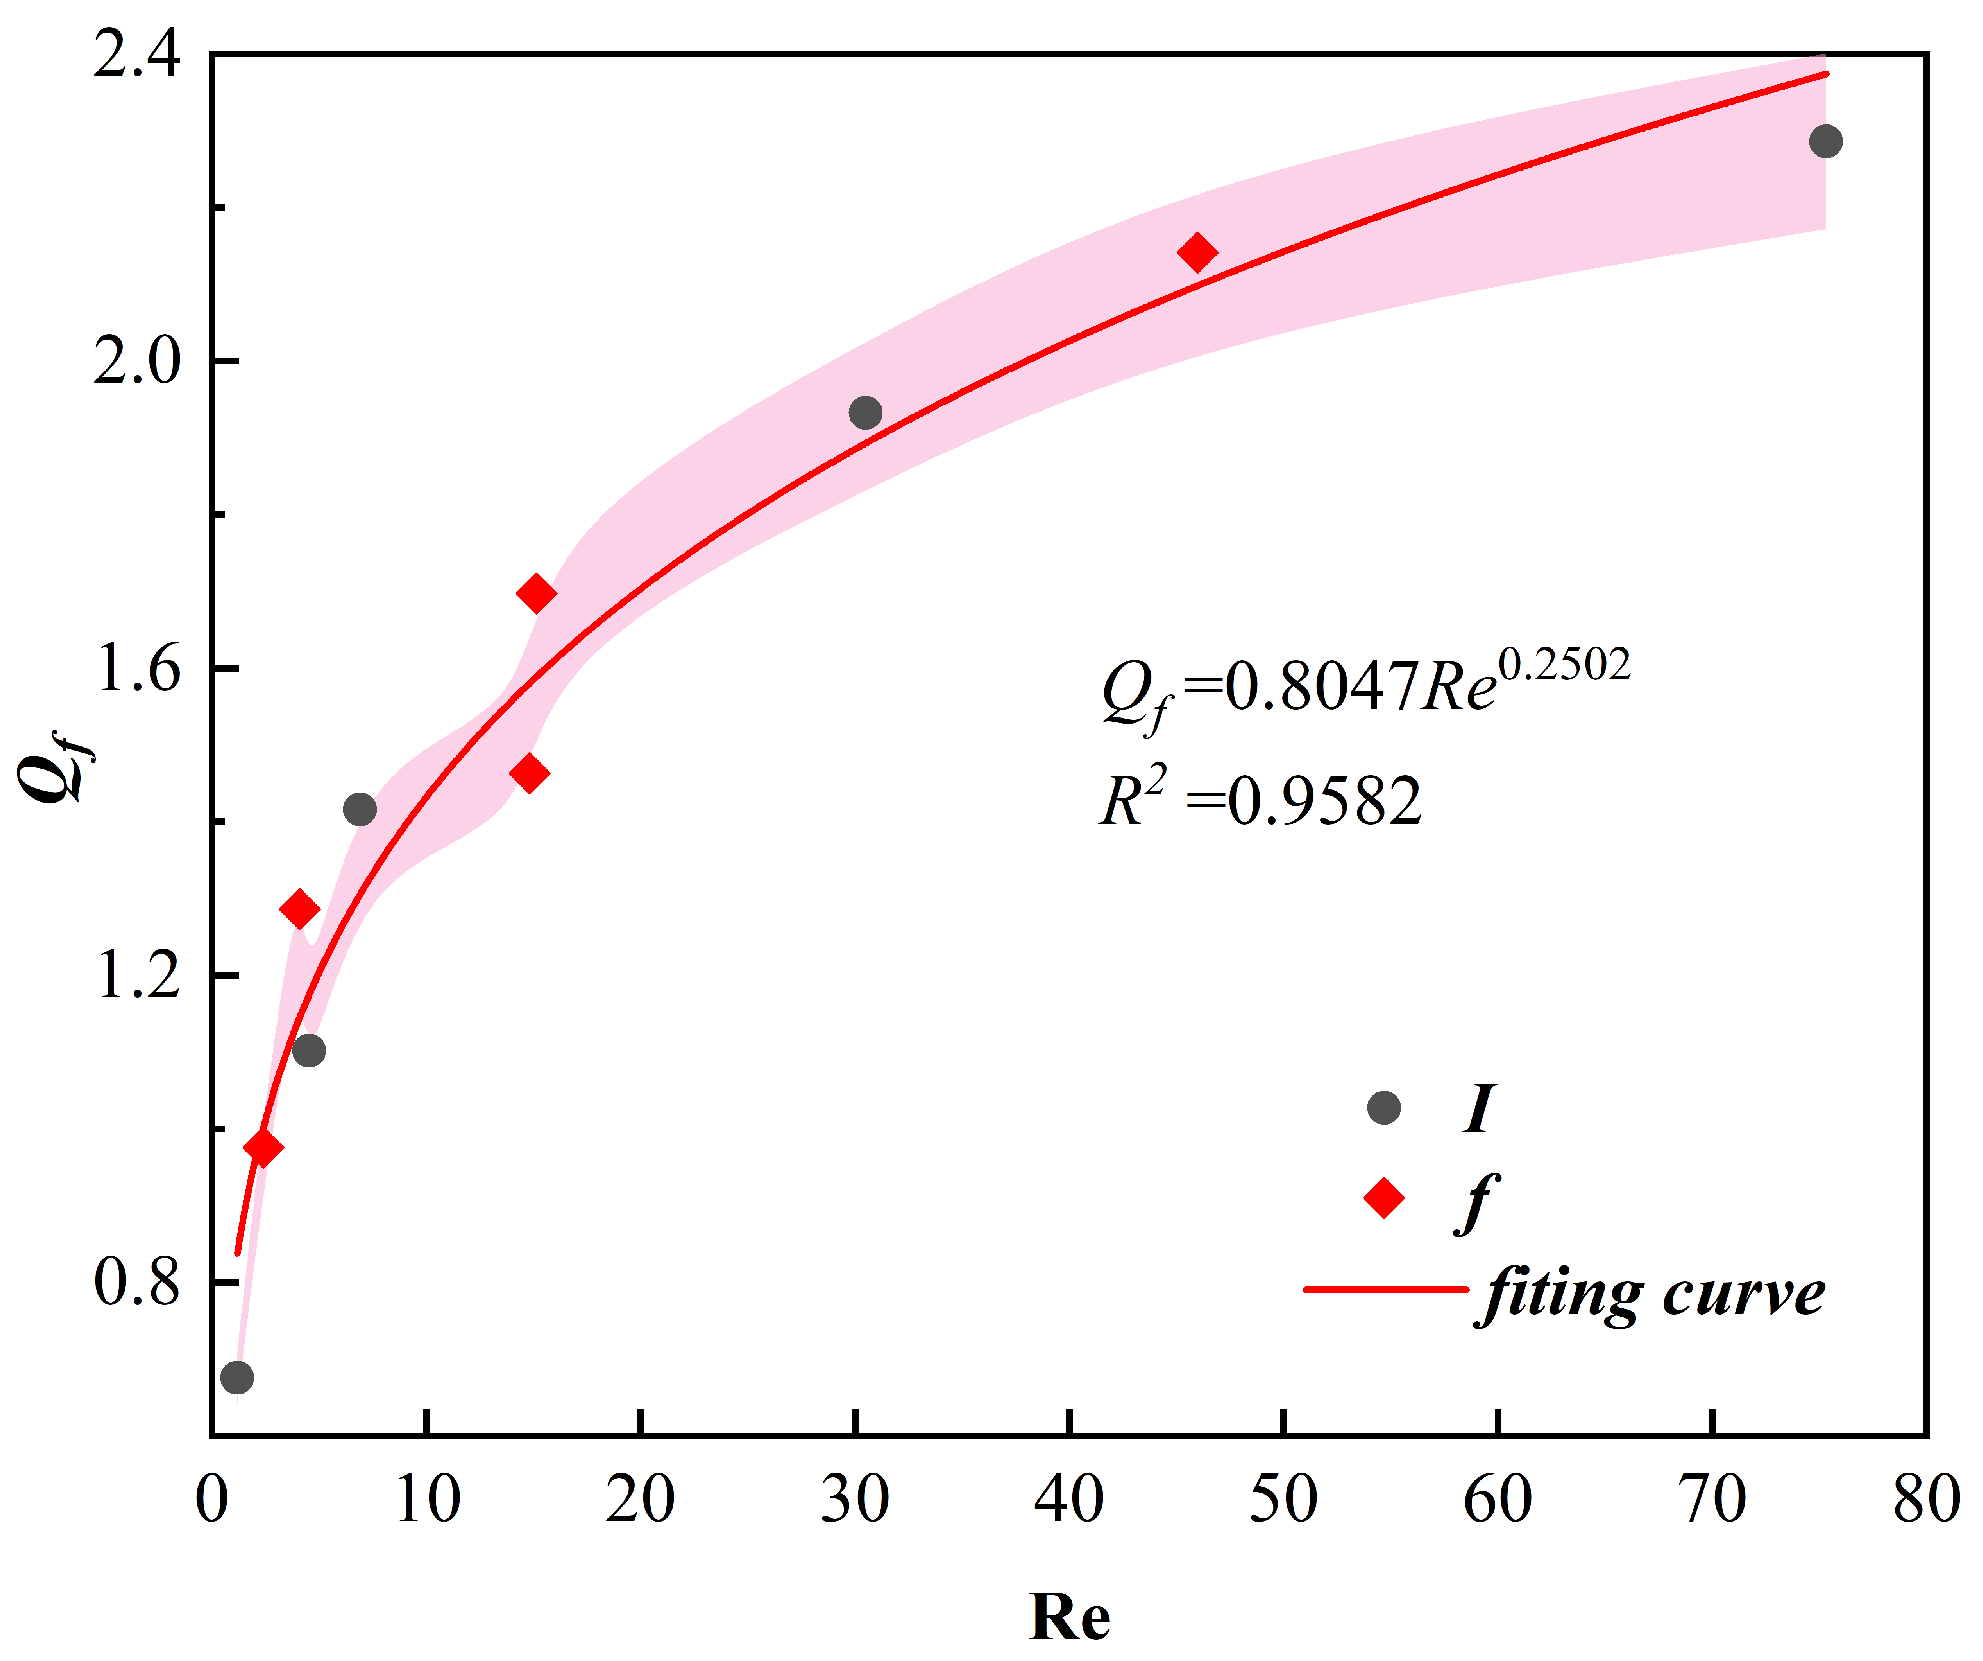
From Figure 12, we observed that the reduction degree exhibits a distinct trend. It increases rapidly and then gradually plateaus as the current and magnetic field in the induction furnace rise. From Figure 13, we noted that energy consumption rises continuously with the increase in current and magnetic field. By integrating the data from both figures and analyzing the underlying flow and heat transfer characteristics, we found that the transition region where the reduction degree growth rate slows but the energy consumption continues to rise corresponds to Re = 30 − 46. Within this range, the system achieves a high reduction rate while maintaining reasonable energy consumption. Thus, Re = 30 − 46 is defined as the optimal operating range, which could balance reduction efficiency and energy savings. However, as the value of Re continues to rise, although the fluid motion is further intensified, at the same time, the relative influence of viscous forces is also gradually revealed, which forms a kind of counterbalance effect. It makes the increase rate of the reduction degree in the furnace to slow down, and even saturated in some cases [33]. The power consumption of the furnace rises with the increase in Re. Although the reduction degree can be increased to a certain extent, the increasing current intensity and magnetic field frequency will lead to a sharp increase in energy consumption, which is not conducive to the long-term stable operation of the furnace.
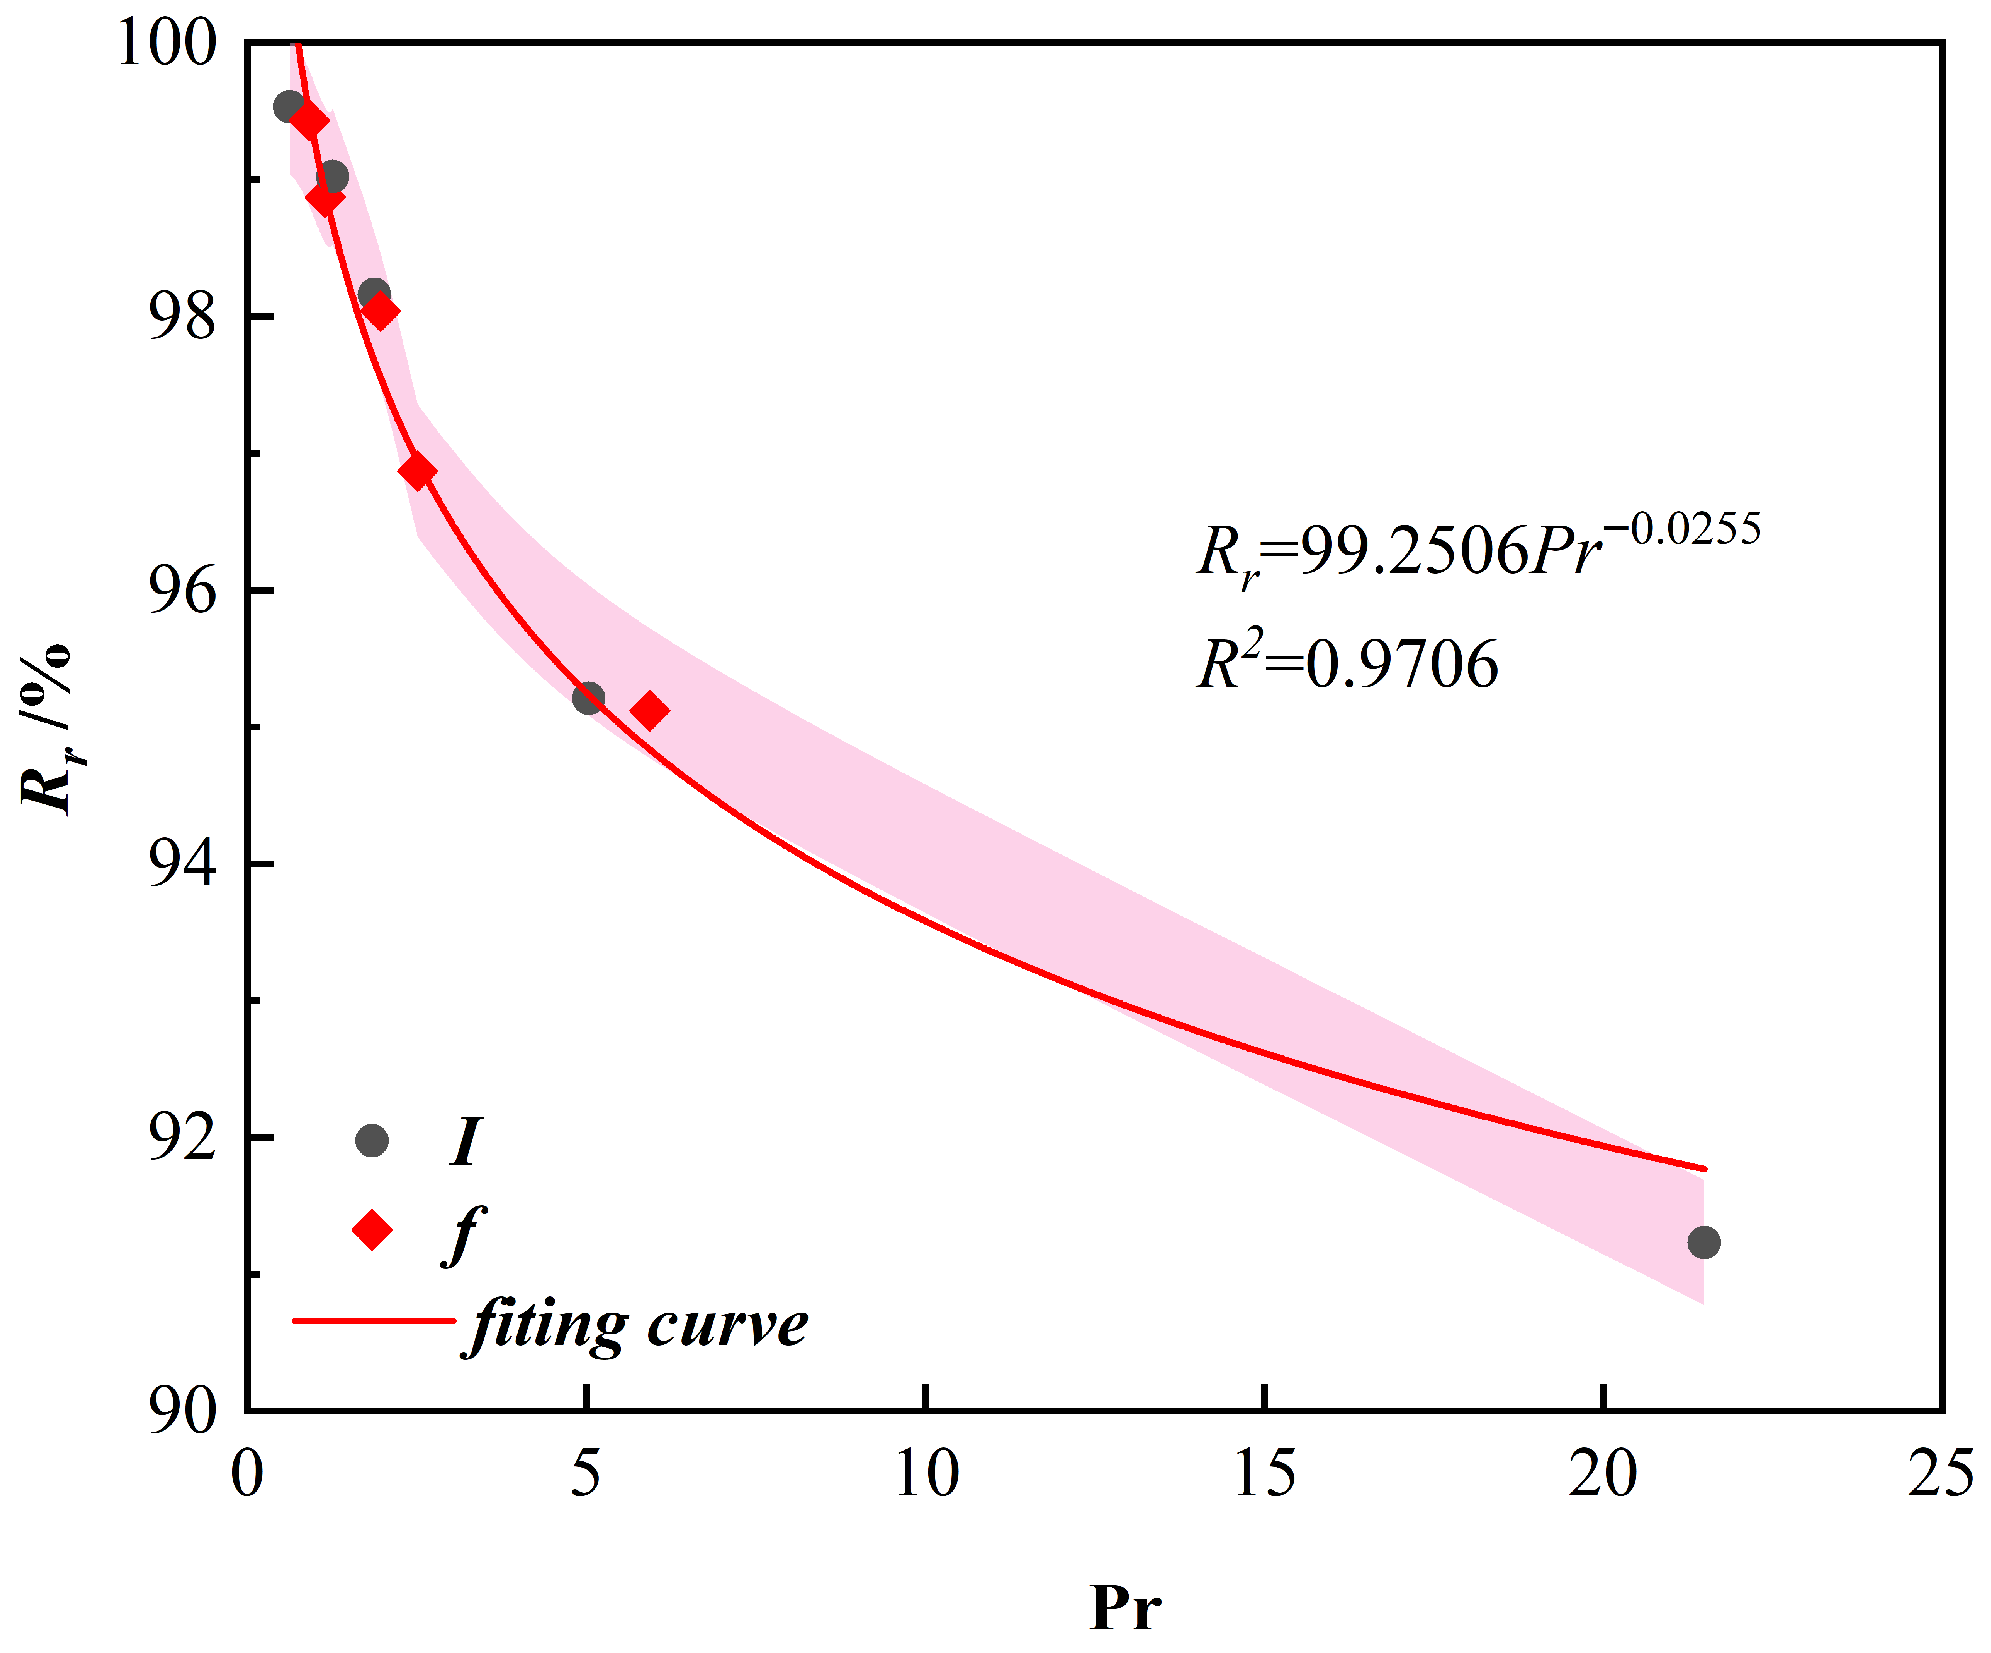
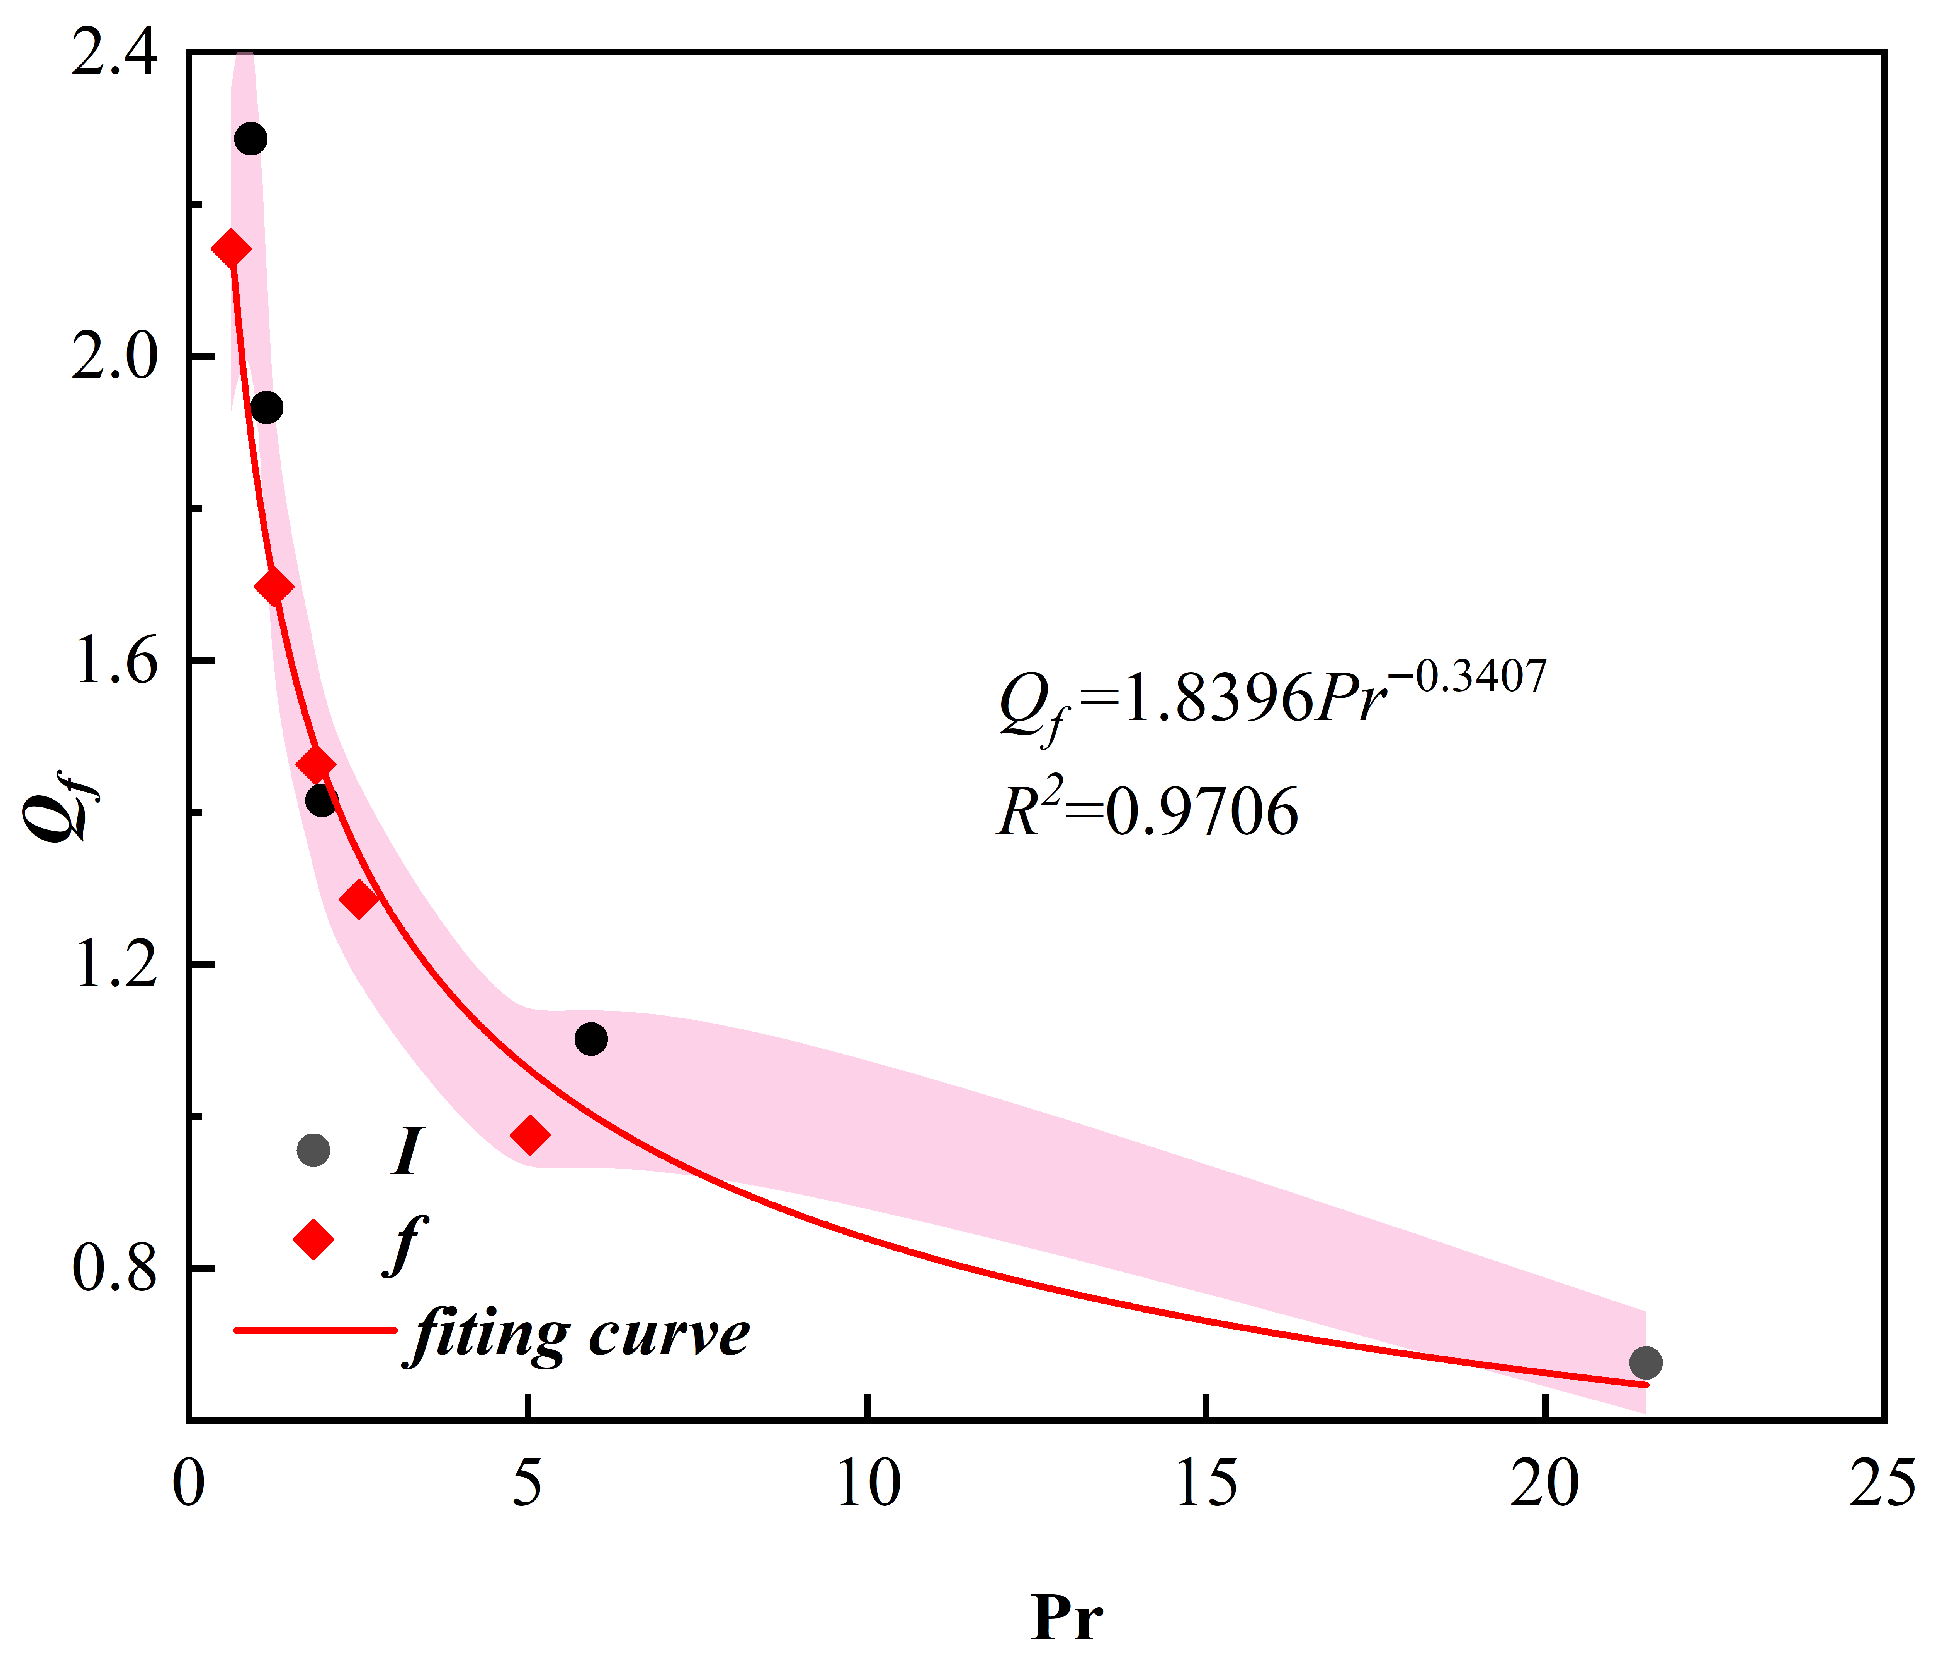
By comparing Figure 14 with Figure 15, it can be concluded that the heat transfer inside the furnace is mainly achieved through heat conduction between fluid units. Furthermore, it is evident that accelerating the flow of these fluids can lead to a substantial enhancement in heat transfer efficiency within the furnace. It is also illustrated that the momentum diffusion in the furnace is faster than the heat diffusion, and the thermal boundary layer of the fluid is thinner than the velocity boundary layer. The Pr value of the melt is determined exclusively by the physical properties of the substance [34].
The heat transfer efficiency of the melt is influenced by its viscosity, specific heat, and heat transfer coefficient. It is indicated that a melt with reduced viscosity, augmented specific heat, and elevated heat transfer coefficient exhibits enhanced heat transfer efficiency. As the Pr number decreases, the heat transfer efficiency in the furnace increases gradually, the reduction Rr in the furnace increases significantly, and the power consumption in the furnace decreases. It has been demonstrated that, in melts with high Pr values, the thermal boundary layer of the melt is considerably thicker than the velocity boundary layer during the heating process. This indicates that the diffusion rate of heat in the melt is significantly lower than the diffusion rate of momentum. Consequently, the primary factor influencing heat transfer in the furnace under these conditions is thermal conduction. When the Pr value decreases from 22 to 1, momentum-based heat and mass transfer dominates in the electromagnetic induction furnace, and the reduction degree of graphite feedstock increases from 91.23% to 99.43%. This is because the fluid with a low Prandtl number has a stronger convective effect, which can effectively promote the reduction reaction.
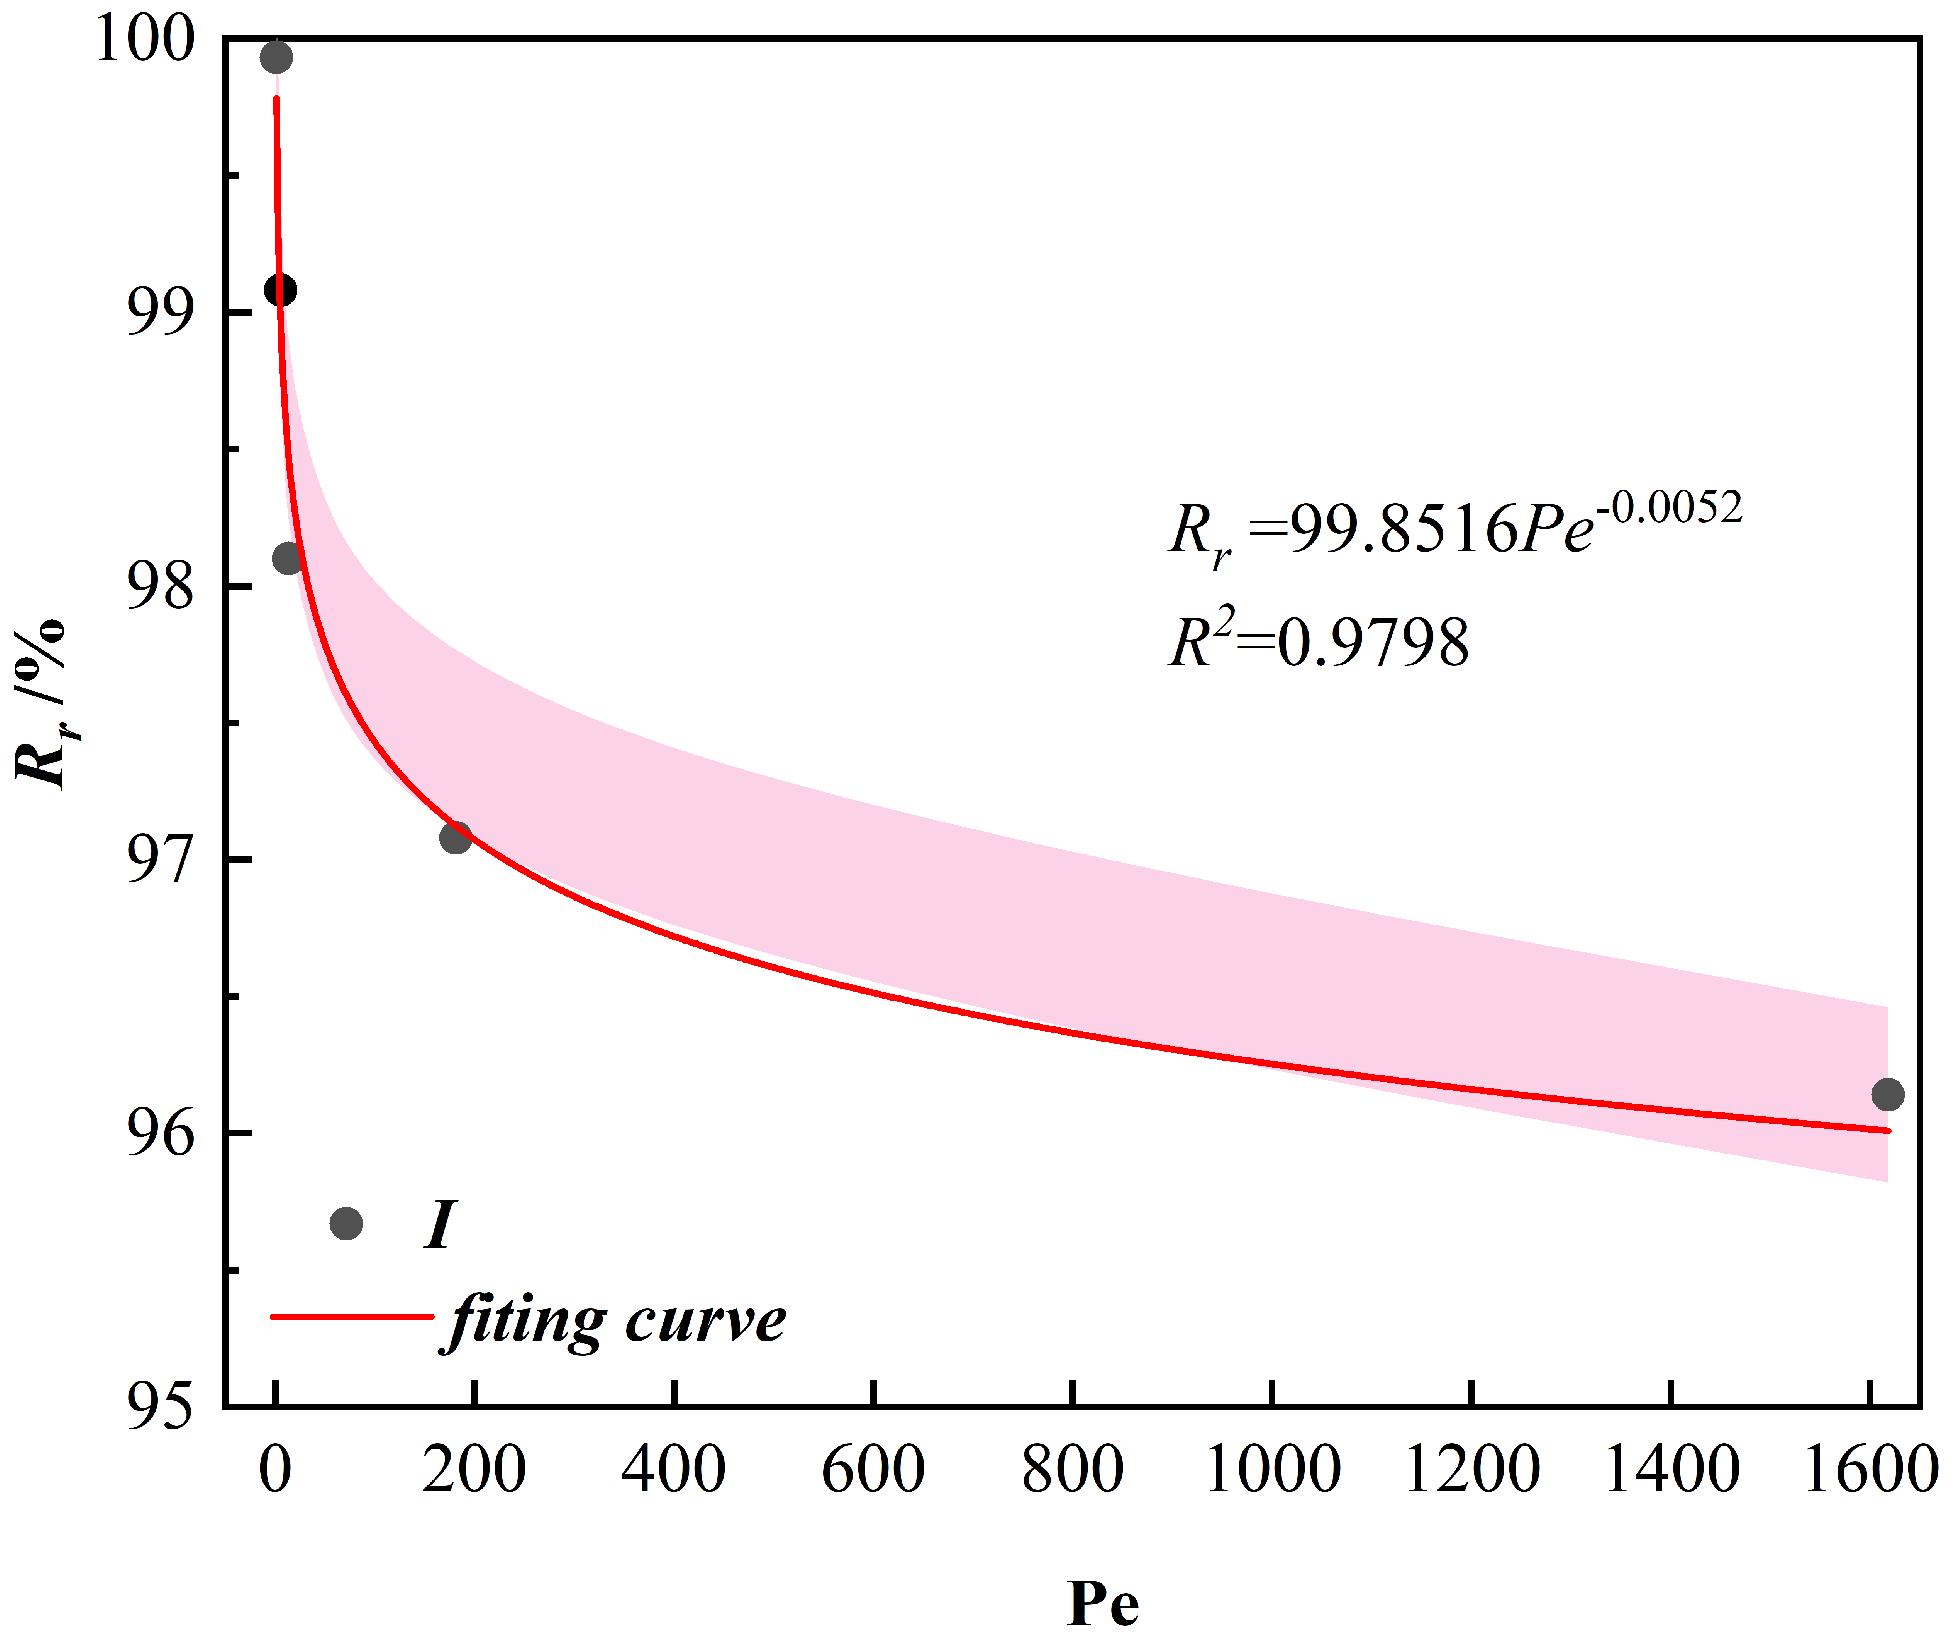
When the Pe number is much greater than one, it indicates that the convective heat transfer rate in the physical system is greater than the thermal diffusion rate. The property differences between the upper and lower layers of the fluid will become smaller and smaller, which causes the variables in each layer of the fluid to gradually unify [35]. Through the analysis of Figure 16, it can be seen that as the current intensity gradually increases, the reduction degree of graphite feedstock shows a significant nonlinear change. The change in current intensity will directly lead to different average temperatures in the electromagnetic induction furnace. Since temperature is the main factor affecting the reduction process, as the temperature rises, impurities continuously precipitate, which causes changes in the volume fraction of the gas, thereby continuously improving the purity of graphite feedstock. The heat and mass transfer mode in the electromagnetic induction furnace changes from fluid flow to free diffusion, while the concentration of the gas in the furnace reaches its peak at this time.

5. Conclusions

(1) The optimal operating condition for the induction furnace is determined as a current intensity of 600 A and a magnetic field frequency of 14 kHz. Under this condition, the reduction degree of the target material reaches 99.69%, while energy consumption is controlled at a reasonable level.
(2) The Reynolds number range of 30–46 is identified as the critical window for balancing heat transfer efficiency and fluid stability, which provides a theoretical reference for the parameter optimization of similar induction heating systems.
(3) When the Prandtl number value decreases from 22 to 1, the reduction degree of graphite increases from 91.23% to 99.43%. As the Pr number decreases, the thickness of the thermal boundary layer of the fluid relative to the velocity boundary layer significantly reduces, which enhances the temperature gradient in the near-wall region. It improves the convective heat transfer efficiency inside the electromagnetic induction furnace.
(4) When Pe > 1.6 × 10³, the convective heat transfer rate of the fluid plays a dominant role, which extends the migration path of impurities and leads to a negative correlation and a decreasing trend of the reduction degree of graphite (R2 = 0.973). When the internal temperature of the electromagnetic induction furnace rises to 1273 K, the impurities in the graphite feedstock undergo a phase change, and the Pe number drops to the order of 101.

Author Contributions

J.Z.: Writing—original draft, Methodology, Investigation, Conceptualization. F.L.: Visualization, Supervision, Resources, Project administration. S.W.: Supervision, Resources, Software, Project administration. All authors have read and agreed to the published version of the manuscript.

Funding

This research was funded by [the Yunnan Fundamental Research Projects, China] grant number [202401AS070111], [National Natural Science Foundation of China, China] grant number [52166013], [the Yunnan Major Scientific and Technological Projects, China] grant number [202302AF080005, 202302AG050011, 202302AQ370003], [the Yunnan Technology Talent and Platform Plan, China] grant number [202305AS350016], and [Yunnan Provincial Basic Research Program for Young Talents, China] grant number [2024J0058].

Data Availability Statement

The raw data supporting the conclusions of this article will be made available by the authors on request.

Acknowledgments

Thanks to the above projects for their support.

Conflicts of Interest

The authors declare no conflicts of interest.

References

  1. Jara, A.D.; Betemariam, A.; Woldetinsae, G.; Kim, J.Y. Purification, application and current market trend of natural graphite: A review. Int. J. Min. Sci. Technol. 2019, 29, 671–689. [Google Scholar] [CrossRef]
  2. Wang, J.-R.; Yang, D.-H.; Xu, Y.-J.; Hou, X.-L.; Ang, E.H.; Wang, D.-Z.; Zhang, L.; Zhu, Z.-D.; Feng, X.-Y.; Song, X.-H.; et al. Recent developments and the future of the recycling of spent graphite for energy storage applications. New Carbon Mater. 2023, 38, 787–803. [Google Scholar] [CrossRef]
  3. Wang, X.; Li, H.; Yao, H.; Chen, Z.; Guan, Q. Network feature and influence factors of global nature graphite trade competition. Resour. Policy 2019, 60, 153–161. [Google Scholar] [CrossRef]
  4. Gao, Y.; Zhang, J.; Jin, H.; Liang, G.; Ma, L.; Chen, Y.; Wang, C. Regenerating spent graphite from scrapped lithium-ion battery by high-temperature treatment. Carbon 2022, 189, 493–502. [Google Scholar] [CrossRef]
  5. Lan, Y.; Zhao, X.; Zhang, W.; Mu, L.; Wang, S. Investigation of the waste heat recovery and pollutant emission reduction potential in graphitization furnace. Energy 2022, 245, 123292. [Google Scholar] [CrossRef]
  6. Vedin, V.A.; Pirogov, V.I. Improving thermal insulation for graphitization furnaces. Refract. Ind. Ceram. 2008, 49, 416–417. [Google Scholar] [CrossRef]
  7. Naderipour, A.; Abdul-Malek, Z.; Heidari Gandoman, F.; Nowdeh, S.A.; Shiran, M.A.; Hadidian Moghaddam, M.J.; Davoodkhani, I.F. Optimal designing of static var compensator to improve voltage profile of power system using fuzzy logic control. Energy 2020, 192, 116665. [Google Scholar] [CrossRef]
  8. Luo, Y.; Wang, J.; Zhang, W.; Zhu, X.; Yan, X. Multi-physical field coupling and modeling for induction heating of porous sodium chloride. J. Energy Storage 2024, 85, 111009. [Google Scholar] [CrossRef]
  9. Kang, D.G.; Sung, K.; Yong, H.; Jeong, K.; Choi, M.; Kim, H.-T.; Kwon, S.; Kim, S.M.; Myung, J.S.; Kim, D.W.; et al. Electrified inductive heating for sustainable utilization of liquid hydrogenated organics. Joule 2024, 8, 2374–2392. [Google Scholar] [CrossRef]
  10. Zhang, R.; Liu, X.; Song, N.; He, J.; Cen, Z.; Li, C.; Wang, M.; Tang, H.; Liu, W.; Ren, X.; et al. Magnetic induction heating-driven rapid cold start of ammonia decomposition for hydrogen production. J. Am. Chem. Soc. 2024, 146, 28635–28641. [Google Scholar] [CrossRef]
  11. Adogwa, A.; Chukwu, E.; Malaj, A.; Punyapu, V.R.; Chamness, O.; Glisson, N.; Bruce, B.; Lee, S.; Zachman, M.J.; Bruce, D.A.; et al. Catalytic reaction triggered by magnetic induction heating mechanistically distinguishes itself from the standard thermal reaction. ACS Catal. 2024, 14, 4008–4017. [Google Scholar] [CrossRef]
  12. Asadi-Saghandi, H.; Karimi-Sabet, J.; Ghorbanian, S.; Moosavian, S.M.A. Dimensionless analysis on liquid–liquid two-phase flow patterns in a numbered-up microfluidic device. Chem. Eng. J. 2022, 429, 132428. [Google Scholar] [CrossRef]
  13. Amirsoleymani, A.; Ting, D.S.K.; Carriveau, R.; Brown, D.; McGillis, A. Two-phase flow pattern identification in CAES systems with dimensional analysis coupled with support vector machine. Int. J. Multiph. Flow 2023, 160, 104343. [Google Scholar] [CrossRef]
  14. Zhang, S.; Liu, C.; Wang, X.; Yang, Z. Nondimensional prediction of thermal forming behaviour for the ship hull plate fabricated by induction heating. Ships Offshore Struct. 2019, 14, 510–522. [Google Scholar] [CrossRef]
  15. Marzouk, S.A.; Aljabr, A.; Almehmadi, F.A.; Alqaed, S.; Sharaf, M.A. Numerical study of heat transfer, exergy efficiency, and friction factor with nanofluids in a plate heat exchanger. J. Therm. Anal. Calorim. 2023, 148, 11269–11281. [Google Scholar] [CrossRef]
  16. Lv, H.; Kang, L.; Wang, K.; Liu, Y. Parametric optimization of removing iron from solid waste melts based on analysis of real-time coupled two-phase interface in an induction heating furnace. Energy 2022, 261, 125195. [Google Scholar] [CrossRef]
  17. Lv, H.; Kang, L.; Liu, Y. Dimensional analysis and effects of dimensionless numbers on the iron removal process in electromagnetic induction heating furnaces. Int. J. Heat Mass Transf. 2024, 229, 125714. [Google Scholar] [CrossRef]
  18. Chen, R.; Yang, Y.; Wang, Q.; Ding, H.; Su, Y.; Guo, J. Dimensionless parameters controlling fluid flow in electromagnetic cold crucible. J. Mater. Process. Technol. 2018, 255, 242–251. [Google Scholar] [CrossRef]
  19. Li, B.; Wu, X.; Huang, D.; Ye, C.; Chen, X.; Cao, X.; Shen, K.; Liu, J. High-purity rayon-based carbon fiber felt prepared by halogen gas purification for superior thermal insulation and oxidation resistance. Carbon 2024, 224, 119056. [Google Scholar] [CrossRef]
  20. Magampa, P.P.; Manyala, N.; Focke, W.W. Properties of graphite composites based on natural and synthetic graphite powders and a phenolic novolac binder. J. Nucl. Mater. 2013, 436, 76–83. [Google Scholar] [CrossRef]
  21. Hu, X.-L.; Tang, X.; Zhou, Y.-B.; Dai, Y.; Huang, Q.-Z. A continuous high-temperature purification reactor for graphite using Freon-12. Carbon 2017, 114, 753–754. [Google Scholar] [CrossRef]
  22. Nikulin, I.L.; Perminov, A.V. Mathematical modelling of frequency and force impacts on averaged metal flows in alternating magnetic field. Int. J. Heat Mass Transf. 2019, 128, 1026–1032. [Google Scholar] [CrossRef]
  23. Liang, X.; Li, M.; Cheng, B.; Wu, F.; Luo, X. Effects of induction furnace conditions on lining refractory via multi-physics field simulation. Appl. Phys. A 2023, 129, 542. [Google Scholar] [CrossRef]
  24. Buliński, P.; Smolka, J.; Siwiec, G.; Blacha, L.; Golak, S.; Przyłucki, R.; Palacz, M.; Melka, B. Numerical examination of the evaporation process within a vacuum induction furnace with a comparison to experimental results. Appl. Therm. Eng. 2019, 150, 348–358. [Google Scholar] [CrossRef]
  25. Ren, L.; Zhang, K.; Wang, F.; Zhang, Y.; Yang, F.; Cheng, F. Microwave heating of coal slime based on multi-physics field simulations: Regulating waveguide port size and sample radius to improve microwave utilization efficiency. Chem. Eng. J. 2023, 470, 143975. [Google Scholar] [CrossRef]
  26. Wenzel, P.M.; Radgen, P.; Westermeyer, J. Comparing exergy analysis and physical optimum method regarding an induction furnace. Energies 2021, 14, 1621. [Google Scholar] [CrossRef]
  27. Wang, W.; Tuci, G.; Duong-Viet, C.; Liu, Y.; Rossin, A.; Luconi, L.; Nhut, J.-M.; Nguyen-Dinh, L.; Pham-Huu, C.; Giambastiani, G. Induction Heating: An Enabling Technology for the Heat Management in Catalytic Processes. ACS Catal. 2019, 9, 7921–7935. [Google Scholar] [CrossRef]
  28. Li, J.; Yang, B. Multi-scale CFD simulations of bubbling fluidized bed methanation process. Chem. Eng. J. 2019, 377, 119818. [Google Scholar] [CrossRef]
  29. Carretero, C.; Lucia, O.; Acero, J.; Burdio, J.M. Computational modeling of twopartly coupled coils supplied by a double half-bridge besonant inverter for induction heating appliances. IEEE Trans. Ind. Electron. 2013, 60, 3092–3105. [Google Scholar] [CrossRef]
  30. Buliński, P.; Smolka, J.; Golak, S.; Przyłucki, R.; Palacz, M.; Siwiec, G.; Lipart, J.; Białecki, R.; Blacha, L. Numerical and experimental investigation of heat transfer process in electromagnetically driven flow within a vacuum induction furnace. Appl. Therm. Eng. 2017, 124, 1003–1013. [Google Scholar] [CrossRef]
  31. Wang, T.; Bai, F.; Yao, P.; Li, X.; Nie, F.; Yuan, G.; Lei, D. Experimental study of electromagnetic induction heating ceramic particles device (EIHCPD). Energy Convers. Manag. 2025, 345, 120398. [Google Scholar] [CrossRef]
  32. Nian, S.-C.; Huang, M.-S.; Tsai, T.-H. Enhancement of induction heating efficiency on injection mold surface using a novel magnetic shielding method. Int. Commun. Heat Mass Transf. 2014, 50, 52–60. [Google Scholar] [CrossRef]
  33. Chemloul, N.-E.S. Dimensional Analysis: Rayleigh Method and Vaschy-Buckingham Method; ISTE Ltd. and John Wiley & Sons, Inc.: Hoboken, NJ, USA, 2020. [Google Scholar] [CrossRef]
  34. Guo, W.; Bai, S.; Ye, Y. Controllable fabrication and mechanical properties of C/C–SiC composites based on an electromagnetic induction heating reactive melt infiltration. J. Eur. Ceram. Soc. 2021, 41, 2347–2355. [Google Scholar] [CrossRef]
  35. Ridolfi, M.R.; Folgarait, P. Numerical modeling of secondary breakup in molten metals gas-atomization using dimensionless analysis. Int. J. Multiph. Flow 2020, 132, 103431. [Google Scholar] [CrossRef]
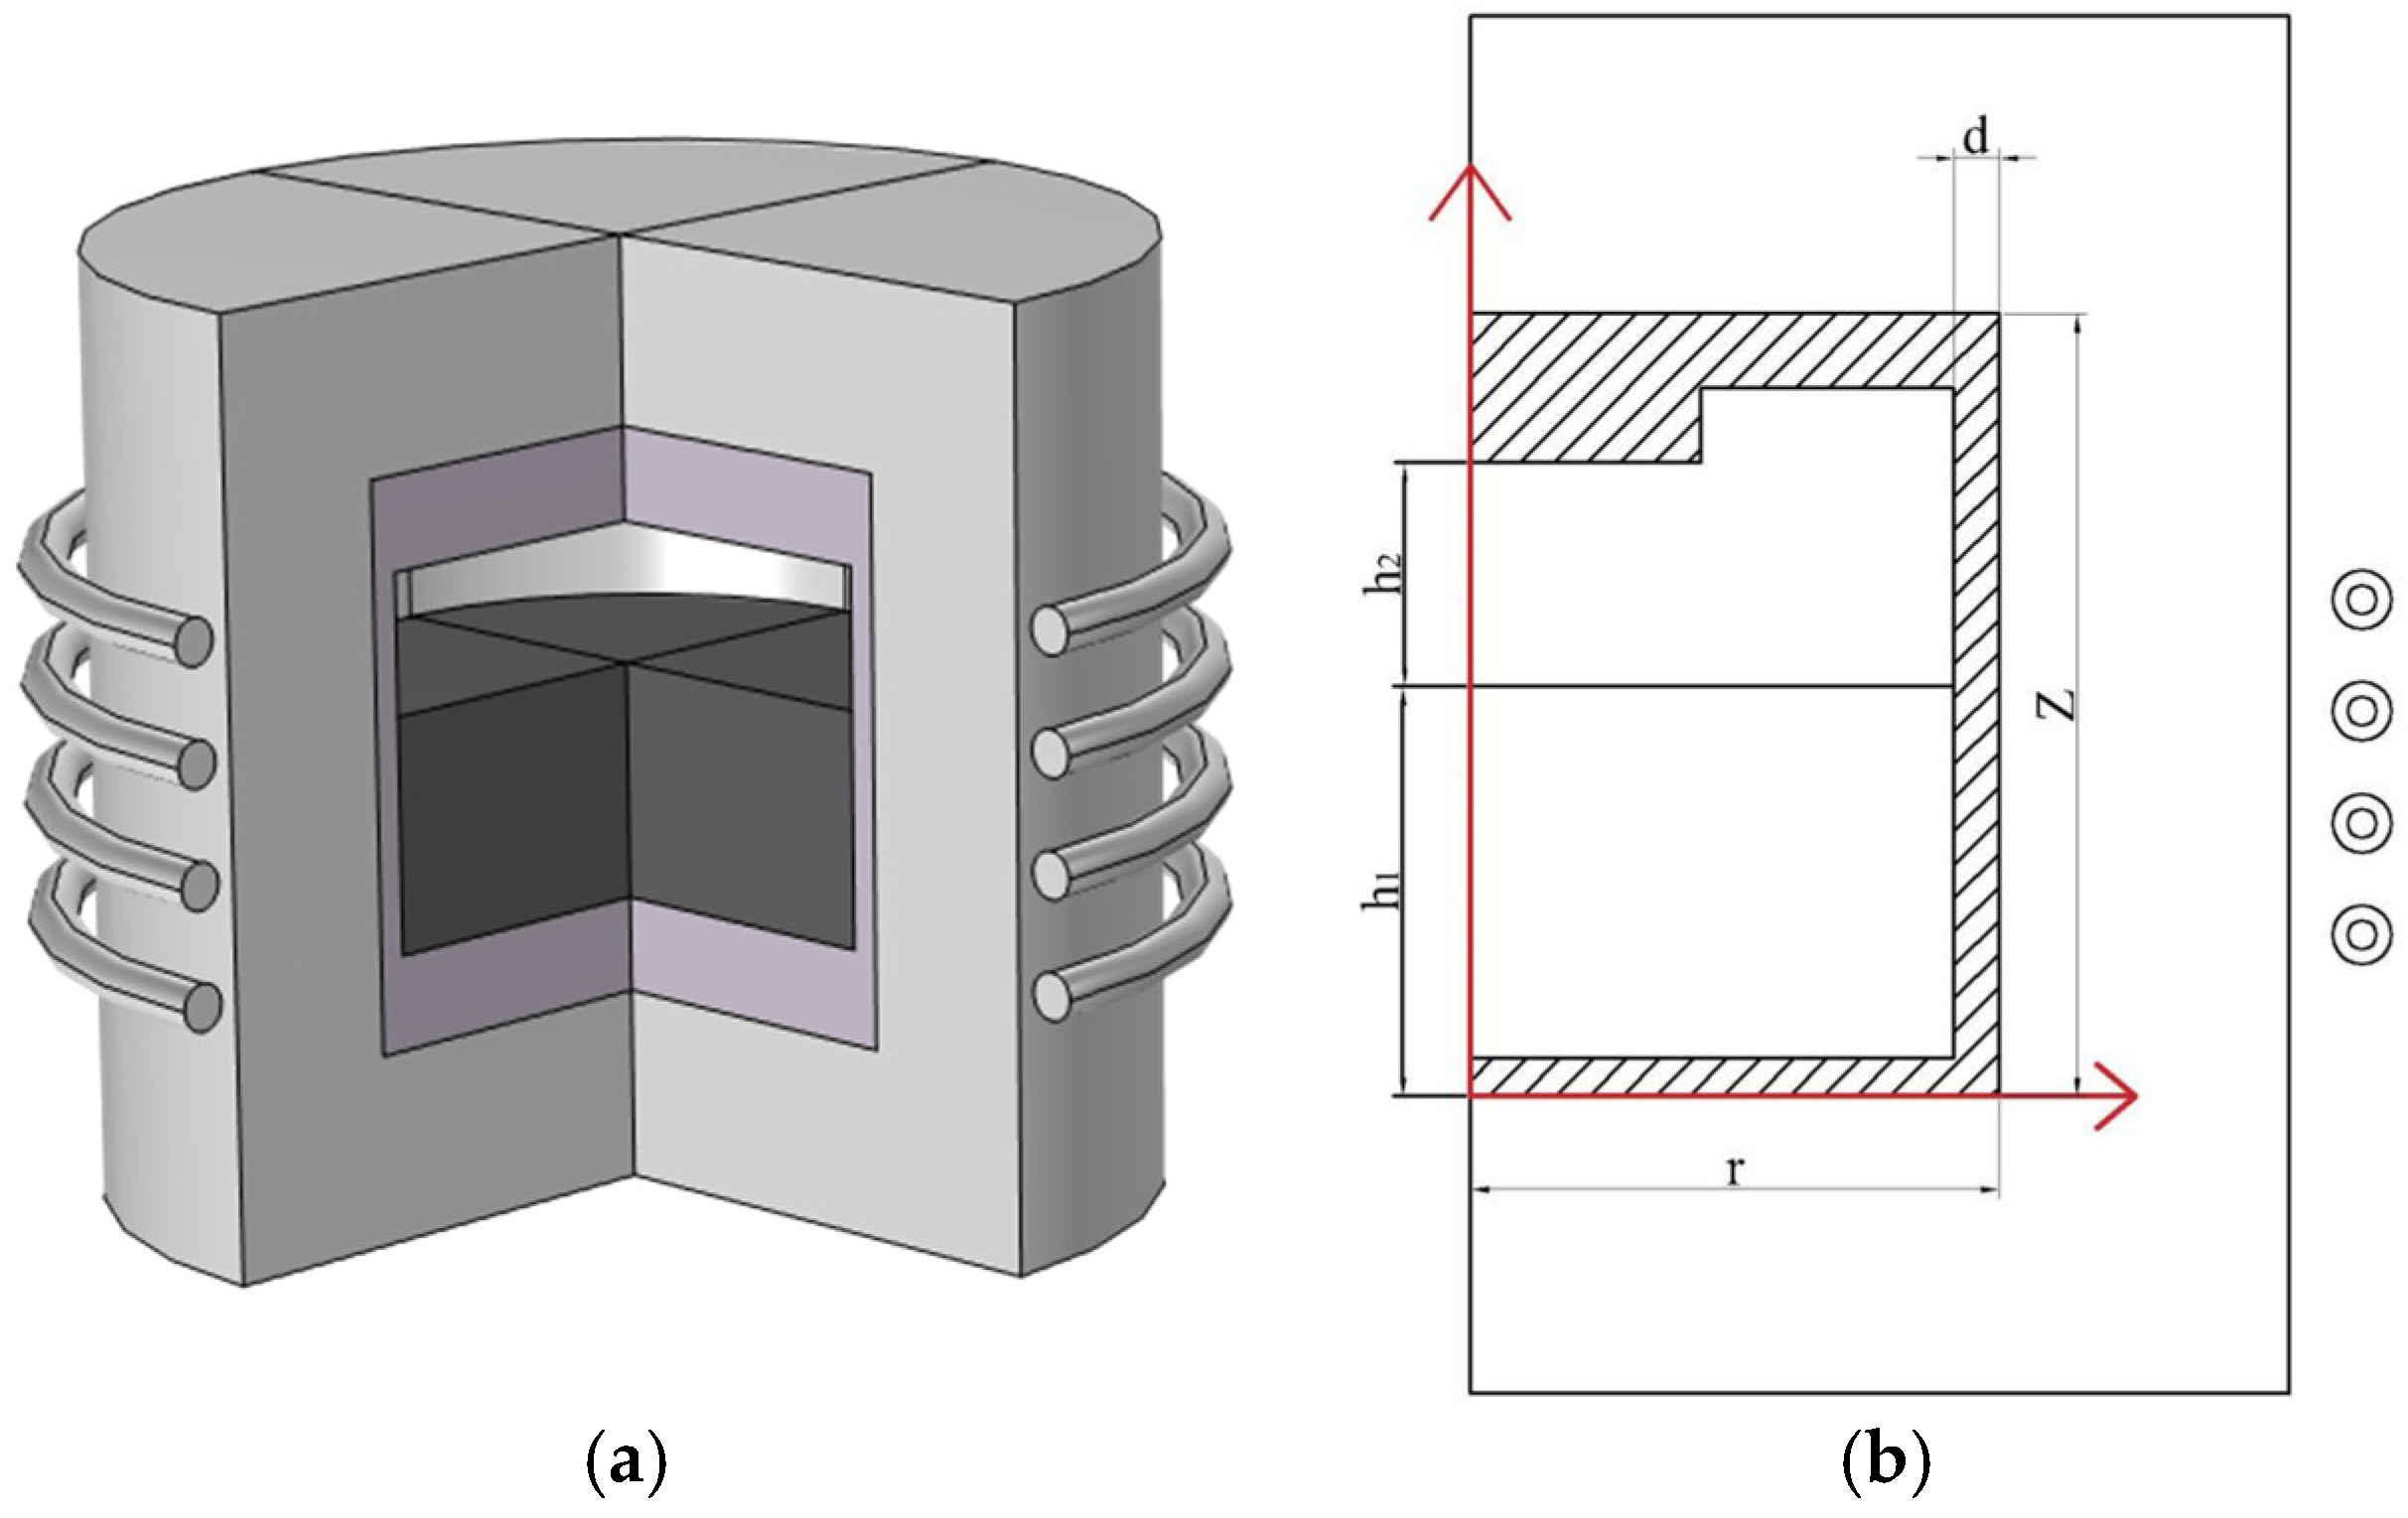
Figure 1. (a) 3D model of the electromagnetic induction furnace. (b) 2D rotationally symmetric model of the electromagnetic induction furnace.
Applsci 15 11294 g001
Figure 2. Resistivity and relative magnetic permeability versus temperature.
Applsci 15 11294 g002
Figure 3. (a) Variation in temperature in furnace with different number of grids (b) Magnetic flux density for different number of meshes.
Applsci 15 11294 g003aApplsci 15 11294 g003b
Figure 4. Feasibility validation of the numerical model [30].
Applsci 15 11294 g004
Figure 5. Transverse magnetic flux density.
Applsci 15 11294 g005
Figure 6. The magnetic flux density within the electromagnetic induction furnace.
Applsci 15 11294 g006
Figure 7. The variation in the temperature inside the furnace with the following time: (a). 1 s, (b). 5 s, (c). 10 s, (d). 20 s, (e). 25 s, (f). 30 s.
Applsci 15 11294 g007
Figure 8. Average temperature in the furnace for different magnetic field frequencies.
Applsci 15 11294 g008
Figure 9. Average temperature inside the furnace with time for different magnetic field frequencies.
Applsci 15 11294 g009
Figure 10. Average temperature in the furnace for different current intensities.
Applsci 15 11294 g010
Figure 11. Average temperature in furnace with time for different current intensities.
Applsci 15 11294 g011
Figure 12. Reynolds number (Re) versus reduction degree Rr in the furnace.
Applsci 15 11294 g012
Figure 13. Reynolds number (Re) versus power consumption Qf in the furnace.
Applsci 15 11294 g013
Figure 14. Prandtl number (Pr) versus reduction degree Rr in furnace.
Applsci 15 11294 g014
Figure 15. Prandtl number (Pr) versus power consumption Qf in the furnace.
Applsci 15 11294 g015
Figure 16. Peclet number (Pe) versus reduction degree Rr in the furnace.
Applsci 15 11294 g016
Table 1. Graphite feedstock composition.
ElementCFe2O3Al2O3MgOB2O3
Molar content/%97.12.30.320.240.04
Table 2. Physical properties of each material.
Physical PropertiesGraphite MaterialFurnace WallCoil
Relative magnetic permeability111
Conductivity (S/m)30001005998
Specific heat (J/(kg·K))710200385
Relative permittivity111
Density (kg/m3)19501208960
Heat conductivity (w/(m·k))1500.3400
Table 3. Boundary conditions in the model.
RegionCoordinatesElectromagneticFlowThermal
Axisr = 0 B r = 0 ∇u = 0∇T = 0
Infinite element domainr → ∞B = 0//
Inner wall of the furnacer = 65 n = ( B 1 B 2 ) u = 0 q = k T t
Outer wall of the furnacez = 80/
Thickness of furnace walld = 6 n = ( B 1 B 2 ) /
Gas domain/ n = ( B 3 B 2 ) /ε = 1
Table 4. Operating parameters.
ParametersSymbolicValue
Electric currentI (A)450500550600650
Magnetic frequencyF (kHz)1012141618
Disclaimer/Publisher’s Note: The statements, opinions and data contained in all publications are solely those of the individual author(s) and contributor(s) and not of MDPI and/or the editor(s). MDPI and/or the editor(s) disclaim responsibility for any injury to people or property resulting from any ideas, methods, instructions or products referred to in the content.