Article

Two Non-Learning Systems for Profile-Extraction in Images Acquired from a near Infrared Camera, Underwater Environment, and Low-Light Condition

1
Department of Engineering and Innovation Training Center, Nanjing Tech University Pujiang Institute, Nanjing 211200, China
2
School of Electrical and Automation Engineering, Nanjing Normal University, Nanjing 210046, China
*
Authors to whom correspondence should be addressed.
Appl. Sci. 2025, 15(20), 11289; https://doi.org/10.3390/app152011289
Submission received: 18 June 2025 / Revised: 7 October 2025 / Accepted: 15 October 2025 / Published: 21 October 2025

Abstract

The images acquired from near infrared cameras can contain thermal noise, which degrades the quality of the images. The quality of the images obtained from underwater environments suffer from the complex hydrological environment. All these issues make the profile-extraction in these images a difficult task. In this work, two non-learning systems are built for making filters by using wavelets transform combined with simple functions. They can be shown to extract profiles in the images acquired from the near infrared camera and underwater environment. Furthermore, they are useful for low-light image enhancement, edge/array detection, and image fusion. The increase in the measurement by entropy can be found by enhancing the scale of the filters. When processing the near infrared images, the values of running time, the memory usage, Signal-to-Noise Ratio (SNR), and Peak Signal-to-Noise Ratio (PSNR) are generally smaller in the operators of Canny, Roberts, Log, Sobel, and Prewitt than those in the Atanh filter and Sech filter. When processing the underwater images, the values of running time, the memory usage, SNR, and PSNR are generally smaller in Sobel operator than those in the Atanh filter and Sech filter. When processing the low-light images, it can be seen that the Atanh filter obtains the highest values of the running time and the memory usage compared to the filter based on the Retinex model, the Sech filter, and a matched filter. Our designed filters require little computational resources comparing to learning-based ones and hold the merits of being multifunctional, which may be useful for advanced imaging in the field of bio-medical engineering.

1. Introduction

In the era of rapid technological advancement, optical imaging has emerged as a crucial tool in the fields of life sciences and medicine, providing researchers with groundbreaking visual insights [1,2,3,4]. It is widely used in surgery [5,6,7,8,9]. Imaging technology combined with near infrared cameras involves labeling specific biological molecules or cellular structures, allowing them to emit light signals under a microscope, thereby offering an intuitive and high-resolution visualization of intricate biological processes within tissues, cells, and organisms [10,11,12,13,14]. However, the presence of biological fluids or chemical substances can significantly scatter or absorb the light. Moreover, the near infrared camera can hold thermal noise. The images obtained from the near infrared imaging generally contain a lot of noise due to the emission of auto-fluorescence, low contrast, and little imaging depth. All these issues lead to low-quality imaging. Consequently, the acquired images from the near infrared camera often lose details or key objects. It is difficult to detect the key profiles in those images. This technical problem makes image extraction in the images obtained from the near infrared camera a must.
As a way of obtaining information from the underwater environment, underwater imaging can be important. Due to the complicated underwater environment and the adsorption of water, light is scattered when it goes through the water. Moreover, underwater animals, rocks, organic chemicals, and suspended particles in water can impact the transmission of the light. This in total can seriously make the underwater images degraded. In addition, the inherent noise in the whole underwater environment can impact the underwater imaging [15,16,17]. All these factors make the extraction of the profiles in underwater imaging very difficult.
Low-light image enhancement (LLIE), a crucial task in computer vision and pattern recognition, is widely used to strengthen visibility across a wide range of application scenarios. Furthermore, LLIE can be used to solve the imaging issues of noise degradation, uneven illumination, and color distortion. In order to perform LLIE, researchers have employed image enhancement techniques, utilizing methods such as noise reduction and contrast enhancement to further improve the quality and resolution of images. This not only helps preserve important details but also has the potential to save time in image analysis and reduce medical expenses. Histogram equalization is a classical method employed to enhance the contrast of digital images. By adjusting the grayscale distribution of an image to achieve a uniform histogram, this technique improves contrast and enhances the visual appeal of the image. As a global processing technique, histogram equalization acts on the entire image, and under specific circumstances, it may lead to excessive amplification of image noise or the loss of details in particular areas. To address these issues, researchers have proposed numerous enhancement methods [18,19,20,21]. Bowen Ye et al. proposed a dual histogram equalization algorithm based on adaptive image correction to address the problems of image brightness shift, image over-enhancement, and gray-level merging associated with the traditional histogram equalization algorithm [18]. Majid Zarie et al. introduced triple clipped dynamic histogram equalization based on standard deviation, a robust contrast enhancement algorithm that aims to maximize average information content, control the enhancement ratio, preserve reasonable brightness, and generate clear images with natural enhancement [19]. An advanced framework of dynamic histogram equalization was stated using particle swarm optimization [20]. The method of fuzzy dissimilarity histogram equalization was used for enhancing infrared images [21].
The Retinex theory, proposed by scientist Edwin H. Land, plays an important role in the field of image processing, particularly in image enhancement. It provides a theoretical framework aimed at explaining how the human visual system adapts to varying lighting conditions. Researchers have developed numerous frameworks based on the Retinex theory for image enhancement [22,23,24,25,26,27]. Ying Sun et al. introduced a low-illumination image enhancement algorithm based on improved multi-scale Retinex. By duplicating the original image layer and utilizing the Artificial Bee Colony algorithm to optimize weighted fusion parameters, they effectively addressed the challenges of poor image quality and loss of detailed information during low-light image enhancement processing [22]. Dongmei Liu et al. proposed a novel synthesis level set method for robust image segmentation based on the combination of Retinex-corrected saliency region information and edge information. By introducing the Retinex theory to refine saliency information extraction, the corrected saliency information is embedded into the level set method, enhancing the prominence of foreground objects against the background [23]. Chaoran Wen et al. proposed an effective end-to-end network based on Retinex theory. This network decomposes the image in a data-driven manner, constructs global and local residual convolution blocks for denoising, and combines frequency information with spatial information to improve brightness and contrast [24]. Ke Chao et al. introduced a network called the Correcting Uneven Illumination Network, incorporating a sparse attention transformer and convolutional neural network to enhance low-light conditions. This is achieved by constraining highlight features for better extraction of low-light features in weakly illuminated environments [25]. Xiwen Liang et al. designed a novel Adaptive Frequency Decomposition Network to extract frequency information from coarse to fine. The Adaptive Frequency Decomposition (AFD) module is the core of AFDNet, which connects shallow features and deep features to extract low-frequency and high-frequency information for detail recovery and noise suppression. Through end-to-end training, both low-frequency and high-frequency information of the image are effectively recovered [26]. Yongqiang Chen et al. proposed a low-illumination image enhancement framework based on the Retinex model, which includes decomposition and enhancement networks corresponding to initialization, illumination map adjustment, and reflection map optimization. Their approach achieved a significant 9.16% increase in the PSNR compared to the classical Retinex-Net [27]. Low-weight Retinex frameworks were proposed to reduce computational cost and to obtain faster processing speed [28,29,30,31]. They showed the merits of improved generalization, where the lightweight models can be less prone to overfitting and generalize better to different low-light scenarios.
The algorithm based on the wavelet transform is one of the widely used techniques for image enhancement. By enhancing signals at different frequencies, details can be strengthened. However, it tends to amplify the noise in the image. The subsequent denoising operation may cause some details to be blurred. Fuzzy logic theory is widely used for building frameworks for image enhancement [32,33,34], where the output value can be obtained by using defuzzified processing.
These filters all require some mathematical functions to be constructed, more or less. They have enlightened us on setting up facile filters. We are inspired to work on filters via the selection of appropriate mathematical functions. The first step may be conducting a wavelet transform, which can generate a set of coefficients which are related with the frequency components. The second step is using these mathematical functions to keep the major frequency components of the input signal while at the same time deleting the useless frequency components. Here, these functions can be used to change the magnitude or the intensity of the coefficients. They can show a similar impact of data compression and denoising. Finally, an inverse wavelet transform can lead to the generation of output signals with clear features. The important thing that needs to be performed may be to test or build a new function or a combination of several functions. Several simple functions can be tested from the very beginning, including trigonometric functions, hyperbolic functions, summation, hypotenuse, etc. The specific type of the functions that will be used can be determined through tests and tracking of performance.
Image fusion is the process of combining information from multiple images to create a single, comprehensive representation. This technique aims to enhance the overall understanding of a scene by merging diverse data captured by different sensors or sources. The key steps in image fusion include acquiring multiple images, preprocessing to ensure consistency, aligning images spatially through registration, extracting relevant features, assigning weights to contribute to the final result, applying a fusion algorithm to intelligently combine information, and conducting post-processing for refinement.
Edge detection is a fundamental operation in image processing aimed at identifying the boundaries or contours of objects in an image. Typically, edges represent places in the image where there is a significant change in brightness or color, and these changes may correspond to the boundaries between objects or variations in the internal structure of objects. The Sobel operator, Prewitt operator, Canny operator, and Roberts operator are four common edge detection algorithms [35,36,37,38,39]. The Sobel operator is a convolution operator used for image edge detection, capable of detecting edges in both horizontal and vertical directions and featuring a smoothing effect. Similarly to Sobel, the Prewitt operator is a convolution operator used for image edge detection, possessing characteristics for detecting edges in both horizontal and vertical directions. The Canny operator is a multi-stage algorithm known for high-precision edge detection and effective noise suppression in images. The Roberts operator is a simple edge detection operator that detects edges by calculating pixel differences along diagonal directions.
Although the method of constructing filters based on the Retinex frameworks is effective for low-light image processing, it is mostly relying on network systems or deep learning. Large databases and high performance computers are generally required for obtaining satisfied features. This may be a problem in economically underdeveloped areas. Simple algorithms that can be run with limited computer resources or desktops are needed. Algorithms that can be flexible or multifunctional or modified to be used many situations are needed.
Herein, two filters are built using the inverse hyperbolic tangent function and the hyperbolic secant function. In the second section, the instruments used and the algorithms built are discussed. In the third section, their performances in profile extraction are proved through ordinary images and those images acquired from the near infrared camera and underwater environment. Furthermore, they were shown to be effective in enhancing low-light images, image fusion, and edge detection. In the fourth section, the main features and advantages of the filters, the limitation of the filters, and future work are addressed. In the final section, the conclusion is given. The major contribution of this work is providing two kinds of non-learning engineering systems for the profile extraction in the images obtained from the near infrared camera and underwater environment. They are expected to be integrated in advanced computer vision systems, where profile extraction of the images acquired from the near infrared camera, the underwater environment, and weak-light condition is required.

2. Materials and Methods

2.1. Instruments Used

A lab-built equipment was used for obtaining the near infrared images. A near infrared laser (Model: TR-A-IR10. Company: Shenzhen GainLaser, Shenzhen, China) whose emission wavelength is 1064 nm was used to irradiate samples. A near infrared camera (Model: 1080P. Company: Shenzhen Zhongwei Aoke, Shenzhen, China) was placed above the samples, where the near infrared images were captured. This near infrared camera is able to capture the image with 1 mm resolution. A cell phone (Model: iPhone Xs Max. Company: Apple, Cupertino, CA, USA) was used to capture the low-light images.
Some samples were placed at the bottom of a 20 L bucket, which was full of water. The cell phone was used to capture the images of those samples which were placed under the water. There images were used as the underwater images for processing. Here, several samples were used, including an iron bulk, an iron shovel, a glass bottle, a cup, and a plastic bottle. All the input images are in the jpg format. All the test images are raw images from the very beginning and no preprocessing was conducted, including normalization, scaling, etc.

2.2. Frameworks of the Algorithms

Two non-learning systems were constructed using Algorithms 1 and 2. The basic idea is to build a wavelet transform for acquiring some basic profiles of the images. Then, a combinational set of functions were used to amplify the main profiles as well as deleting noises. The outputting images would show the key profiles or the low-light features hiding in the background of the inputting images. The image fusion was completed using Algorithm 3. These frameworks are implemented in Matlab language. All the constants in the frameworks were set to be the value of 1 from the very beginning. These constants were optimized to be specific values when the images could show good quality and detailed features.
Distinctive features of the Atanh filter and Sech filter were greatly shown in the non-learning and engineering frameworks. The non-learning frameworks mean that only limited calculation power is required for running the systems. The engineering frameworks mean that they can be flexibly adjusted according to the input images.
Algorithm 1. Atanh filter.
(1)
A wavelet transform is used to decompose an image, which can generate detailed and approximate coefficients. The approximate coefficient that is the low-frequency section of the image is denoted with a symbol u. The approximate coefficient is generally associated with major features of the image.
(2)
u is transformed using the following equations:
r = log(u),
r1 = c1(csch(r))log(r) + c2(csch(c3r))log(c4r) + c5csch(c6r)log(c7r),
                  r2 = log(r),
r3 = atanh ((c8 sinh(r2 + c9))/r2),
r4 = r 3 n ,
where c1, c2, c3, c4, c5, c6, c7, c8, c9, and n are constants. This transition is introduced for selectively amplifying the approximate coefficient.
(3)
The size of the image is calculated as [N, M]. Several matrices are introduced, which are
h = [ a1, a2, a3, a4],
g = [a5, a6],
and delta = [a7, a8, a9].
Here, h, g, and delta are all spline-filter coefficients.
(4)
Several matrices are introduced. The values of their elements are calculated using the following equations:
a(1: N,1: M,1: a10 + 1) = 0,
dx(1: N, 1: M, 1: a10 + 1) = 0,
dy(1: N, 1: M, 1: a10 + 1) = 0,
d(1: N,1: M, 1: a10 + 1) = 0,
Here, several decomposition series are set to be zero.
(5)
  •    a(:, :, 1) = conv (h, h, u),
       dx(:, :, 1) = conv (delta, g, u),
       dy(:, :, 1) = conv (g, delta, u),
       x = dx(:, :, 1),
       y = dy(:, :, 1),
        d ( : , : , 1 ) = x 2 + y 2
    Here, a1, a2, a3, a4, a5, a6, a7, a8, a9, and a10 are constants. The symbol “conv” means carrying the calculation of the convolution. The convolution is generally introduced for obtaining the enhancing effect of the low-frequency sections. This is achieved by using a sliding window calculation, where a local weighted sum of image pixels is achieved.
(6)
The lengths of h, g, lh, and hg are defined, respectively. The signal is updated via the iteration:
for each iteration j = 1: a10 do
   lhj = 2j(lh−1) + 1;
      lgj = 2j(lg−1) + 1;
      hj(1: lhj) = 0;
      gj(1: lgj) = 0;
               for each iteration n1 = 1:lh do
                hj(2j(n1−1) + 1) = h(n1);
              end for
              for each iteration n1 = 1:lg do
              gj(2j(n1−1) + 1) = g(n1);
              end for
       a(:, :, j + 1) = conv(hj, hj, a(:, :, j));
       dx(:, :, j + 1) = conv(delta, gj, a(:, :, j));
       dy(:, :, j + 1) = conv(gj, delta, a(:, :, j));
       x = dx(:, :, j + 1);
       y = dy(:, :, j + 1);
       d ( : , : , j + 1 ) = x 2 + y 2
end for
       Here, the coefficients from 2 to j + 1 are decomposed.
(7)
 The acquired image is shown.
Algorithm 2. Sech filter.
(1)
A wavelet transform is used to decompose an image. The acquired frequency is denoted as u2, which is further transformed via the following equations:
u3 = d1sech(d2u2),
u4 = log(u3),
u 5 = u 4 m ,
where d1, d2, and m are constants. Here, u3, u4, and u5 are introduced for amplifying the value of u2.
(2)
The value of u5 is used to perform the inverse of the wavelet transform, which generates a new pixel value of u6. The size of u6 is calculated as [N1, M1]. A constant J is denoted. Several matrices are introduced:
h1 = [b1, b2, b3, b4],
g1 = [b5, b6],
delta1 = [b7, b8, b9],
where b1, b2, b3, b4, b5, b6, b7, b8, and b9 are constants. Here, h1, g1, and delta1 are all spline-filter coefficients.
(3)
It can be possible to set up several matrices where the values of the elements are specified. These matrices are shown as follows:
a1(1: N1, 1: M1, 1: J + 1) = 0;
dx1(1: N1, 1: M1,1: J + 1) = 0;
dy1(1: N1, 1:M1, 1: J + 1) = 0;
d1(1: N1, 1:M1, 1: J + 1) = 0;
a1(:, :, 1) = conv(h1, h1, u6);
dx1(:, :, 1) = conv(delta1, g1, u6); dy1(:,:,1) = conv(g1,delta1,u6);
x1 = dx1(:, :, 1);
y 1 = dy 1 ( : ,   : ,   1 ) ; d 1 ( : , : , 1 ) = x 1 2 + y 1 2
(4)
The lengths of h1 and g1 as well as lh2 and lg2 are calculated, respectively. It can be continued to process the pixel values of u6 via the following iteration:
     for each iteration j2 = 1:J do
          lhj2 = 2j2(lh2−1) + 1;
          lgj2 = 2j2(lg2−1) + 1;
            hj2(1: lhj2) = 0;
            gj2(1: lgj2) = 0;
                  for each iteration n2 = 1:lh2 do
                 hj2(2j2(n2−1) + 1) = h2(n2);
                  end for
                  for each iteration n2 = 1:lg2 do
                    gj2(2j2(n2−1) + 1) = g2(n2);
                 end for
            a2(:, :, j2 + 1) = conv(hj2, hj2, a2(:, :, j2));
            dx2(:, :, j2 + 1) = conv(delta2, gj2, a2(:, :, j2));
            dy2(:, :, j2 + 1) = conv(gj2, delta2, a2(:, :, j2));
            x2 = dx2(:, :, j2 + 1);
            y2 = dy2(:, :, j2 + 1);
            d 2 ( : , : , j 2 + 1 ) = x 2 2 + y 2 2
           end for
          Here, the coefficients from 2 to j2 + 1 are decomposed. The obtained image is shown using the output value of convolution.
Algorithm 3. Image fusion.
(1)
The 1st image was read, which was processed by the Atanh filter or the Sech filter. This would generate approximate coefficient value, which was notified as Ca1.
(2)
The 2nd image was read, which was decomposed by a wavelet. This would generate approximate value, which was notified as Ca2.
(3)
Ca1 and Ca2 were added, which would generate a combined coefficient, which was notified as Ca3. Ca3 was used for generating the output image.

3. Results

In the following, the performance of the filters were first evaluated by varying the parameters of the frameworks. Then their capability in processing the images acquired from the near infrared camera, underwater condition, and low-light illumination was explored.

3.1. Capability of Profile-Extraction

The capability of these filters for extracting the profiles was examined by inputting five images.
These images were randomly selected for study purposes. These images were captured in a residential community in Nanjing, China, which was called as Xinchengjinjun. The iPhone Xs Max was used to capture several plants in the residential community. As shown in Figure S1a (see Supplementary Materials), an input image named Leaf1 was used for testing the performance of the Atanh filter. Its profiles with respect to the input value of delta are shown in Figure S1b,c. The value of delta can be defined as [0, 0, v]. It can be seen that less details can be shown when v is increased. The images of Leaf2, Leaf3, Leaf4, and Leaf5 were tested (see Figures S2–S5), where they have shown a similar trend.
Figures S6–S10 show the performance of the Sech filter for processing the image with respect to the various values of delta1. Here, delta1 can be defined as [0, 0, v1]. It can be seen that less image details can be presented when v1 is increased. Figures S11–S15 exhibit the performance of the Atanh filter for processing the image with respect to the various values of h. h can be defined as [v2, v2, v2, v2]. It can be found that less image details can be shown when v2 is increased. Figures S16–S20 exhibit the impact of the Sech filter for obtaining the profiles with respect to the various values of h1. h1 was defined as [v3, v3, v3, v3]. It can be seen that less image details can be shown when v3 is increased. The impact of the Atanh filter for obtaining the profiles with respect to the various values of n is presented in Figures S21–S25. It can be found that when the value of n increased, the profiles of the images could be enhanced. Similarly, the impact of the Sech filter for obtaining the profiles with respect to the various values of m is presented in Figures S26–S30. It can be seen that when the value of m increases, the profiles of the images can be enhanced.
The values of “measurement by entropy (ME)” and “Michelson contrast” were used to evaluate the merit of image processing via these filters [40].
ME can be calculated via the value of q1 and q2.
Q i = 20 × l o g ( q 2 q 1 )
M E = i = 1 N Q i / n
Here, ME is acquired through the minimum (q1) and maximum (q2) values of the intensity in every block of the input image. The greater value of ME, the greater of the impact for the image enhancement as brought by the filters.
The running time, memory usage, Normalized Mean Square Error (NMSE), Signal-to-Noise Ratio (SNR), and Peak Signal-to-Noise Ratio (PSNR) were also used to evaluate the impact of the filters. Tables S1–S30 in the Supplementary Materials are presented to show the impact of the filters. They are introduced to show the impact of the parameters such as delta, delta1, h, h1, n, and m. It can be clearly seen that the increase in the m value can lead to the decline of the ME value. Another feature that can be found is that the increase in the n value can result in the increase in the ME value. For the other parameters, including the running time, memory usage, SNR, PSNR, and NMSE, no linear trend was observed.

3.2. Profile-Extraction of the Images Acquired from near Infrared Camera

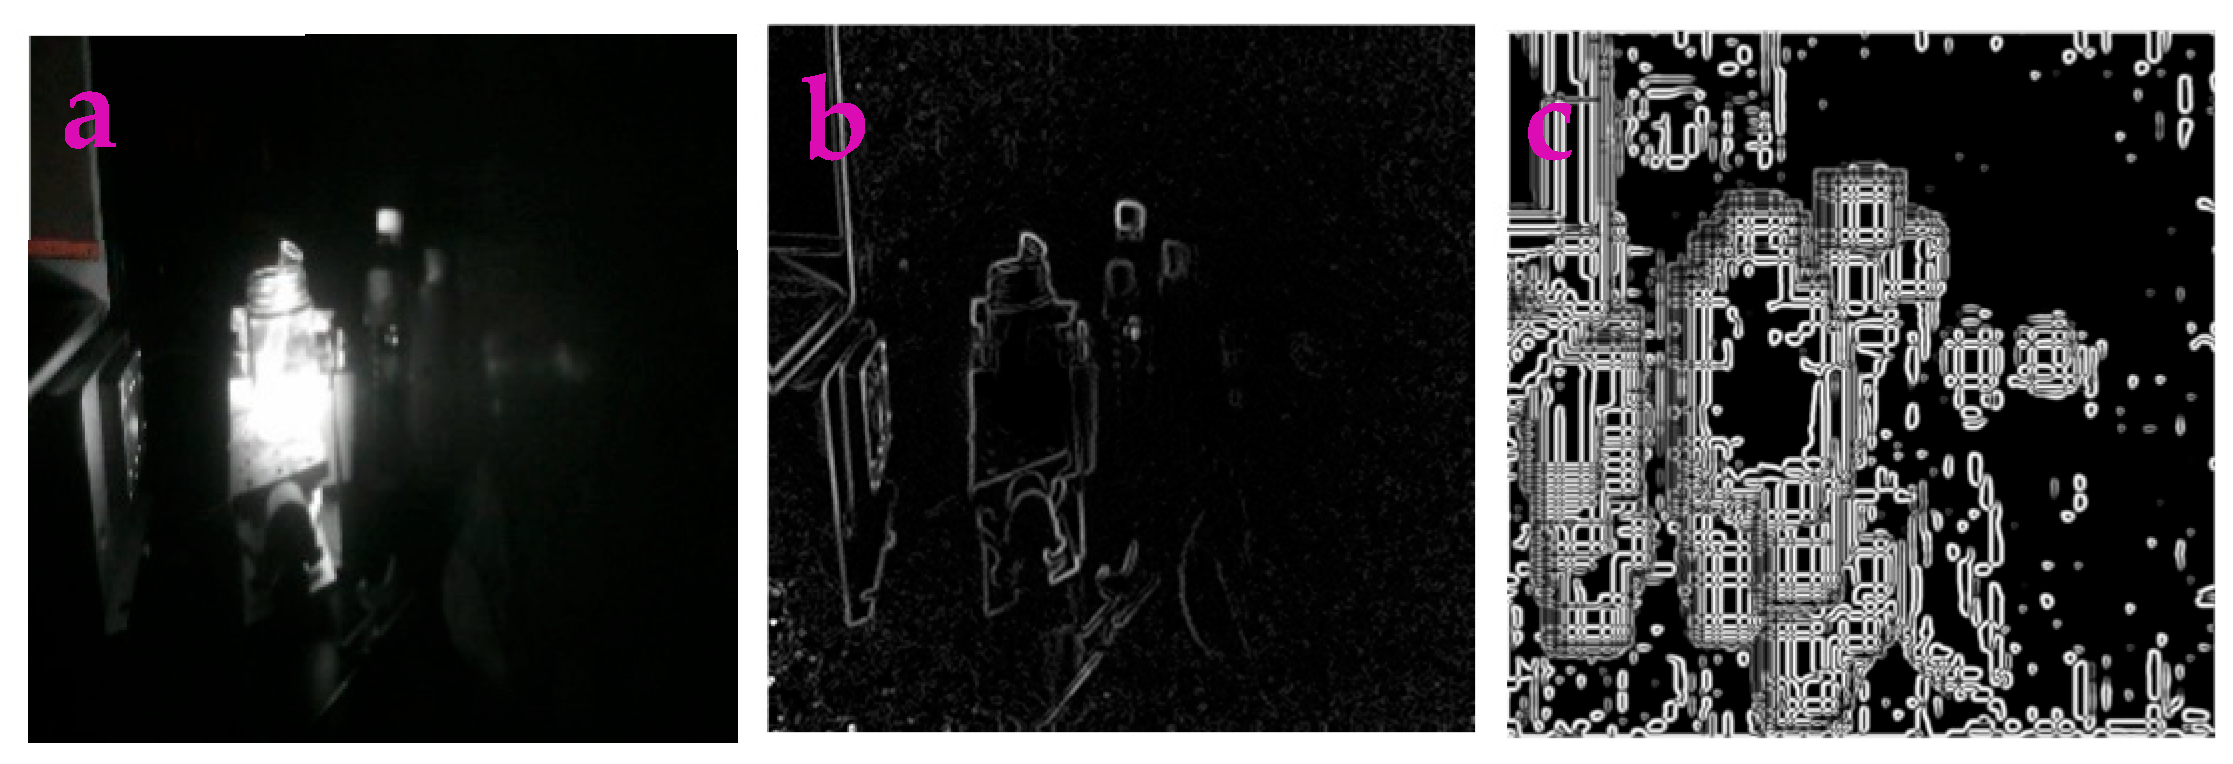
Figure 1a is an image called Bottle, taken from the near infrared camera. This image is very blurry, making it difficult to discern the outline of the image. After being processed by the Atanh and Sech filters, we can see the outline of the image clearly (Figure 1b,c). This suggests that our filter is effective at obtaining the profiles of the image acquired from the near infrared camera. Several operators including Canny, Roberts, Log, Sobel, and Prewitt are well-known for their abilities of acquiring profiles from the image. We also used them to process the image Bottle. As shown in Figure 2a–e, the use of Canny or Log may introduce unnecessary and noisy spots while the use of Roberts or Sobel or Prewitt may lead to missing the profile.
Table 1 shows the ME value as well as the running time for the image Bottle. It can be seen that the output images acquired from the Atanh filter holds the highest value, which showed that performance of the Atanh filter is better than that of the Sech filter and several operators. We received a zero value for the ME values (Table 1), which may be due to the reason that our computer is not good enough to obtain an ultra-small number that is close to zero.
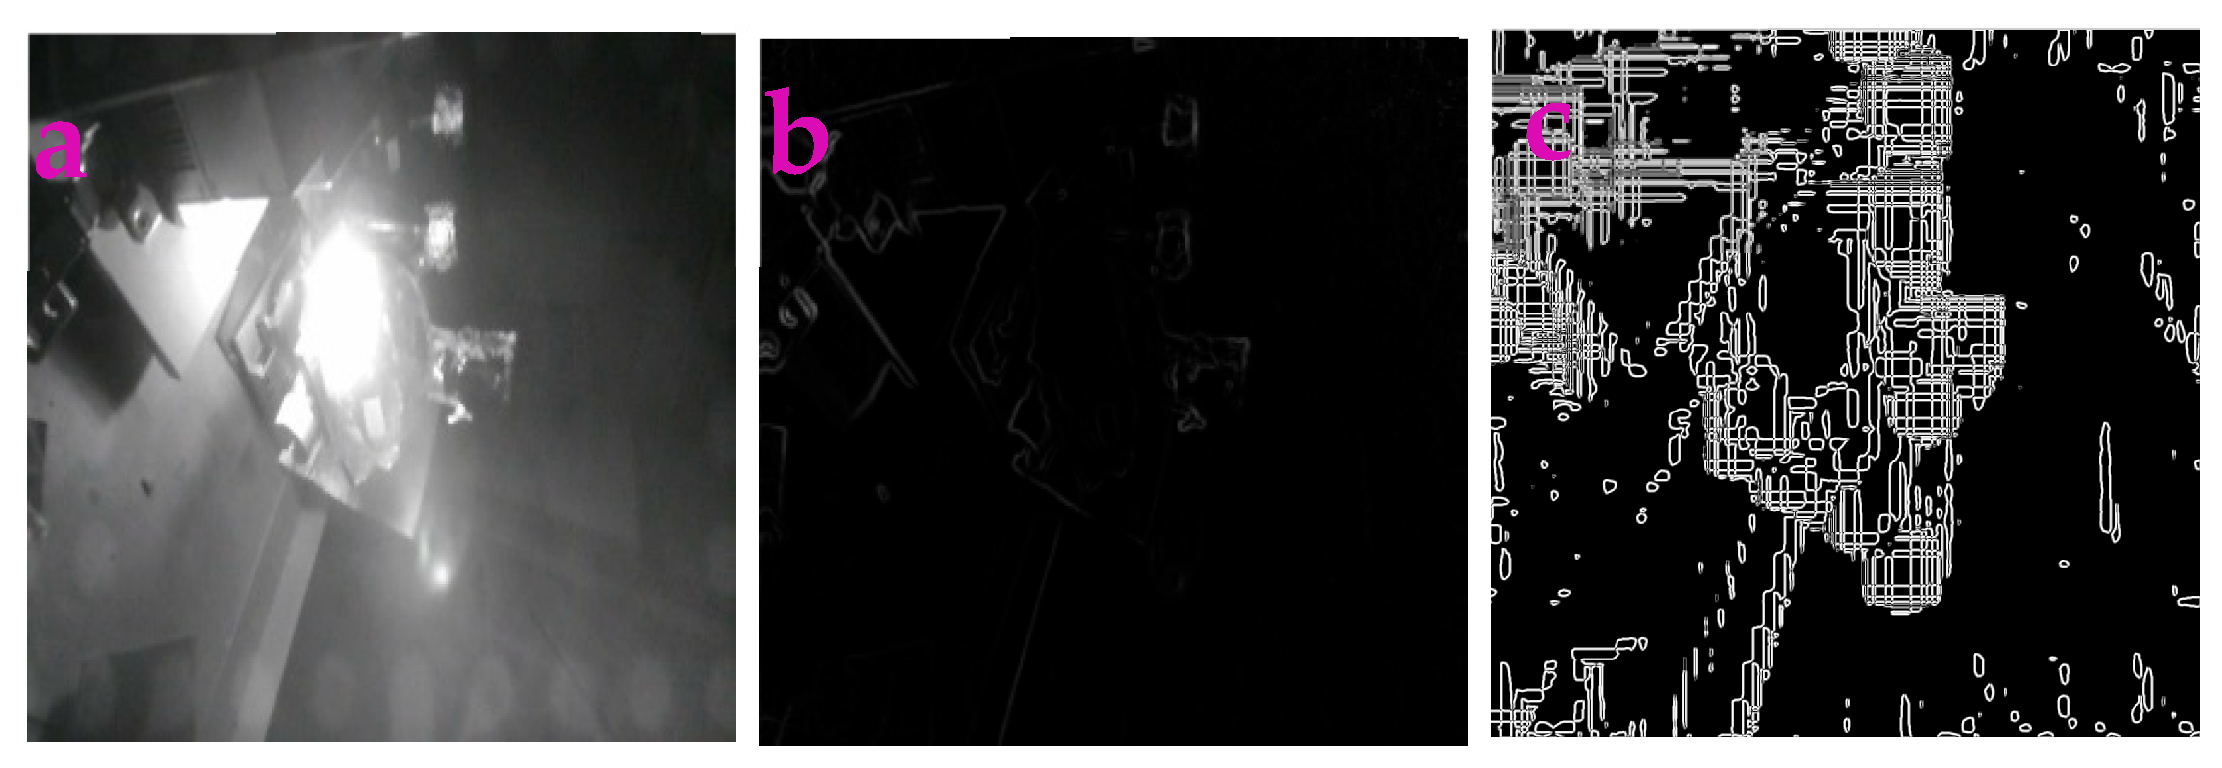
We used more images for processing. Figure 3a shows an image called as Nir34 acquired from the near infrared camera. If we used the Atanh filter and Sech filter for processing, we can acquire some key profiles (see Figure 3b,c). We also used several traditional operators for processing (see Figure 4a–e). Clearly, Canny operator shows much more key profiles compared to the Roberts operator or Log operator or Sobel operator or Prewitt operator. Figure 5, Figure 6, Figure 7, Figure 8, Figure 9 and Figure 10 compared the performance of the Atanh filter, the Sech filter, the Canny operator, the Roberts operator, the Log operator, the Sobel operator, and the Prewitt operator for processing the images of Nir35, Nir36, and Nir37. It is easy to find out the impact of using the Atanh filter and the Sech filter for processing other images acquired from the near infrared camera. It can be seen that our filters can obtain the main features of the images. When we use several traditional operators including Canny, Roberts, Log, Sobel, and Prewitt for processing, it can be seen that these operators can show certain disadvantages. Although the Canny operator can detect the key profiles of the images, it can be seen that Roberts operator or Log operator or Sobel operator or Prewitt operator can lose some profiles. Table 2, Table 3, Table 4 and Table 5 show the value of ME. It can be found that the processing acquired from the Atanh filter or Sech filter holds the non-zero value. It can be seen that performance of the Atanh or Sech filter is better than that of several operators. The only problem is that it may take more time to run the Atanh filter and Sech filter when comparing to the traditional operator (see Table 1, Table 2, Table 3, Table 4 and Table 5).
As presented in Table 1, Table 2, Table 3, Table 4 and Table 5, the values of running time, the memory usage, SNR, and PSNR are generally smaller in the operators of Canny, Roberts, Log, Sobel, and Prewitt than those in the Atanh filter and Sech filter. The NMSE value is smaller in the Atanh filter and Sech filter than that in the operators of Canny, Roberts, Log, Sobel, and Prewitt.

3.3. Application for Extracting the Profiles in Underwater Images

Figure 11a–e are the input underwater images. Figure 12a–e show the processed results using the Atanh filter. Figure 13a–e show the processed results using the Sech filter. A comparative study was performed using the Sobel operator (see Figure 14a–e). Clearly, those underwater images processed by the Atanh or Sech filter show many key features of the input images. However, those processed by the Sobel operator show a lot of noise from the water environment.
As shown in Table 6, Table 7 and Table 8, the values of running time, the memory usage, SNR, and PSNR are generally smaller in the Sobel operator than those in the Atanh filter and Sech filter. The NMSE value is smaller in the Atanh filter and Sech filter than that in the Sobel operator.

3.4. Enhancing Low-Light Images

Figure 15a is an image called Baggage taken from the weak-light condition. It is difficult to see the contour of this image. After it was processed by the filters (see Figure 15b,c), the clear outline and detailed features of this image could be seen. It can be seen that our filters are good for enhancing weak-light images. Figure 15d shows the processed image via a matched filter [41]. It can be seen that unnecessary spots are introduced in the image edge, which may create noise. Figure 15e shows the processed image via a filter based on Retinex theory [42]. It can be seen that the ME value of the Atanh filter is higher than that of the Sech filter or the matched filter or the filter based on Retinex theory (Table 9). This may indicate that the enhancement impact of the Atanh filter is better than that of the Sech filter for the image Baggage.
Figure 16, Figure 17, Figure 18 and Figure 19 show the professing of four weak-light images through the Atanh filter and the Sech filter. Clear edge and morphology can be seen after using the Atanh filter, the Sech filter, and the filter based on the Retinex theory. A lot of noise can be introduced when the matched filter is used. We calculated the ME value (see Table 9, Table 10, Table 11, Table 12 and Table 13). The Atanh filter shows higher value of MC. The matched filter shows a zero value of ME. It can be seen that it takes more time to run the Atanh filter or the Sech filter compared to the matched filter or the filter based on the Retinex theory (see Table 9, Table 10, Table 11, Table 12 and Table 13).
As shown in Table 9, Table 10, Table 11, Table 12 and Table 13, the values of the running time, memory usage, SNR, PSNR, and NMSE were evaluated. It can be seen that the Atanh filter obtains the highest values of the running time and the memory usage. The filter based on the Retinex model obtains the highest value of the PSNR.

3.5. Application for Image Fusion

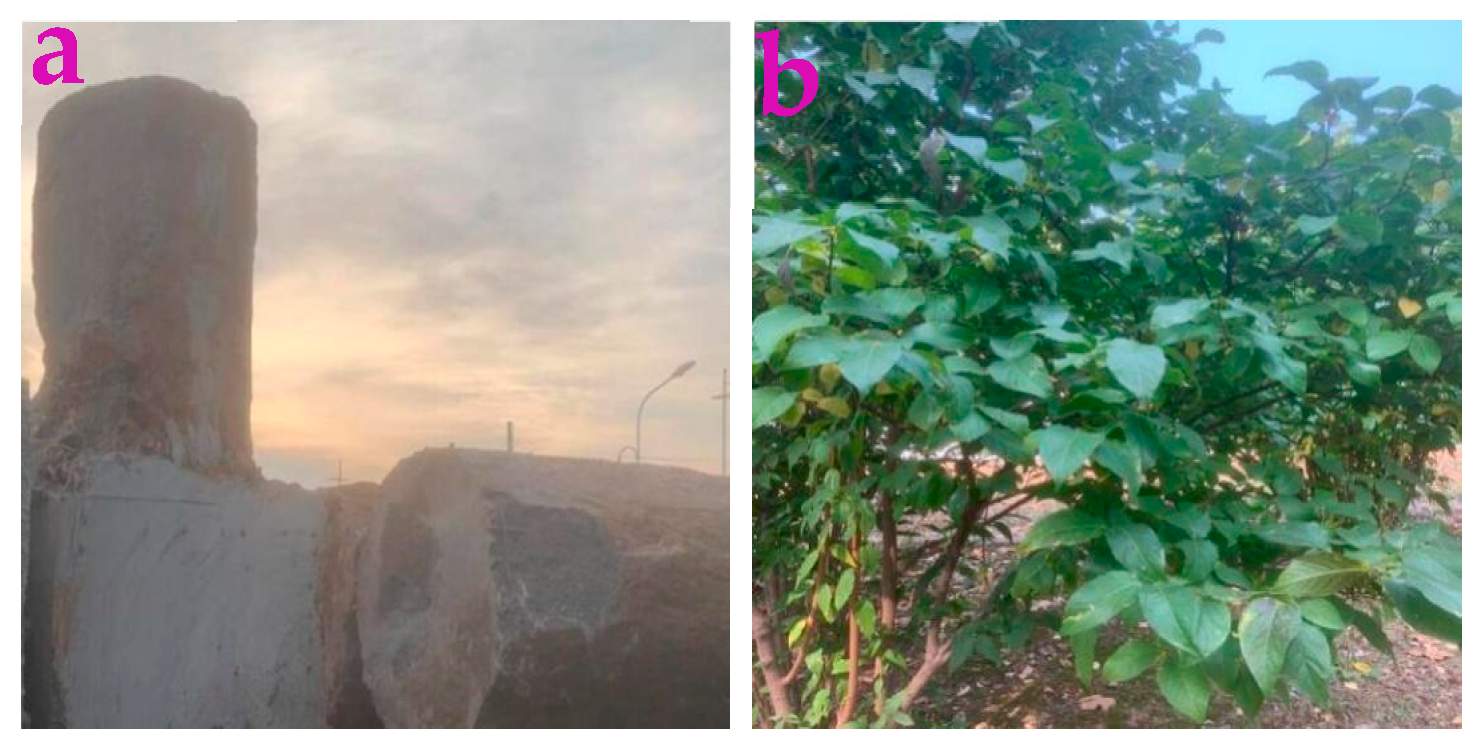
Figure 20a,b are called Stone and Wintersweet, respectively. The Atanh and the Sech filters were used to fuse these two images with different scales. The scales of the filters are controlled via the values of n and m. Algorithm 3 was applied to conduct image fusion. The image Stone was used as the first input image and the image Wintersweet was used as the second input image. Their impact on the image fusion with respect to different values of n and m is shown in Figure 21 and Figure 22.
The image Bottle (Figure 1a) and the image Wintersweet were applied to examine the impact of the m value in the image fusion. Here, the image Bottle was used as the first input image and the image Wintersweet was used as the second input image. It can be found that the fused images preserve the critical features of the original images. The different choice of the n or m value would lead to a different fusion impact. This may be useful in computer vision application where the changing visual effects are necessary.
The NMSE, SNR, and PSNR were used to evaluate the impact of the image fusion. As shown in Table 14 and Table 15, with the increased value of m, the images acquired can show higher values of the SNR or PSNR. The trend of NMSE with respect to the value of n or m is nonlinear. The trend of the SNR or PSNR with respect to the value of n is nonlinear.

3.6. Application for Detecting the Edge

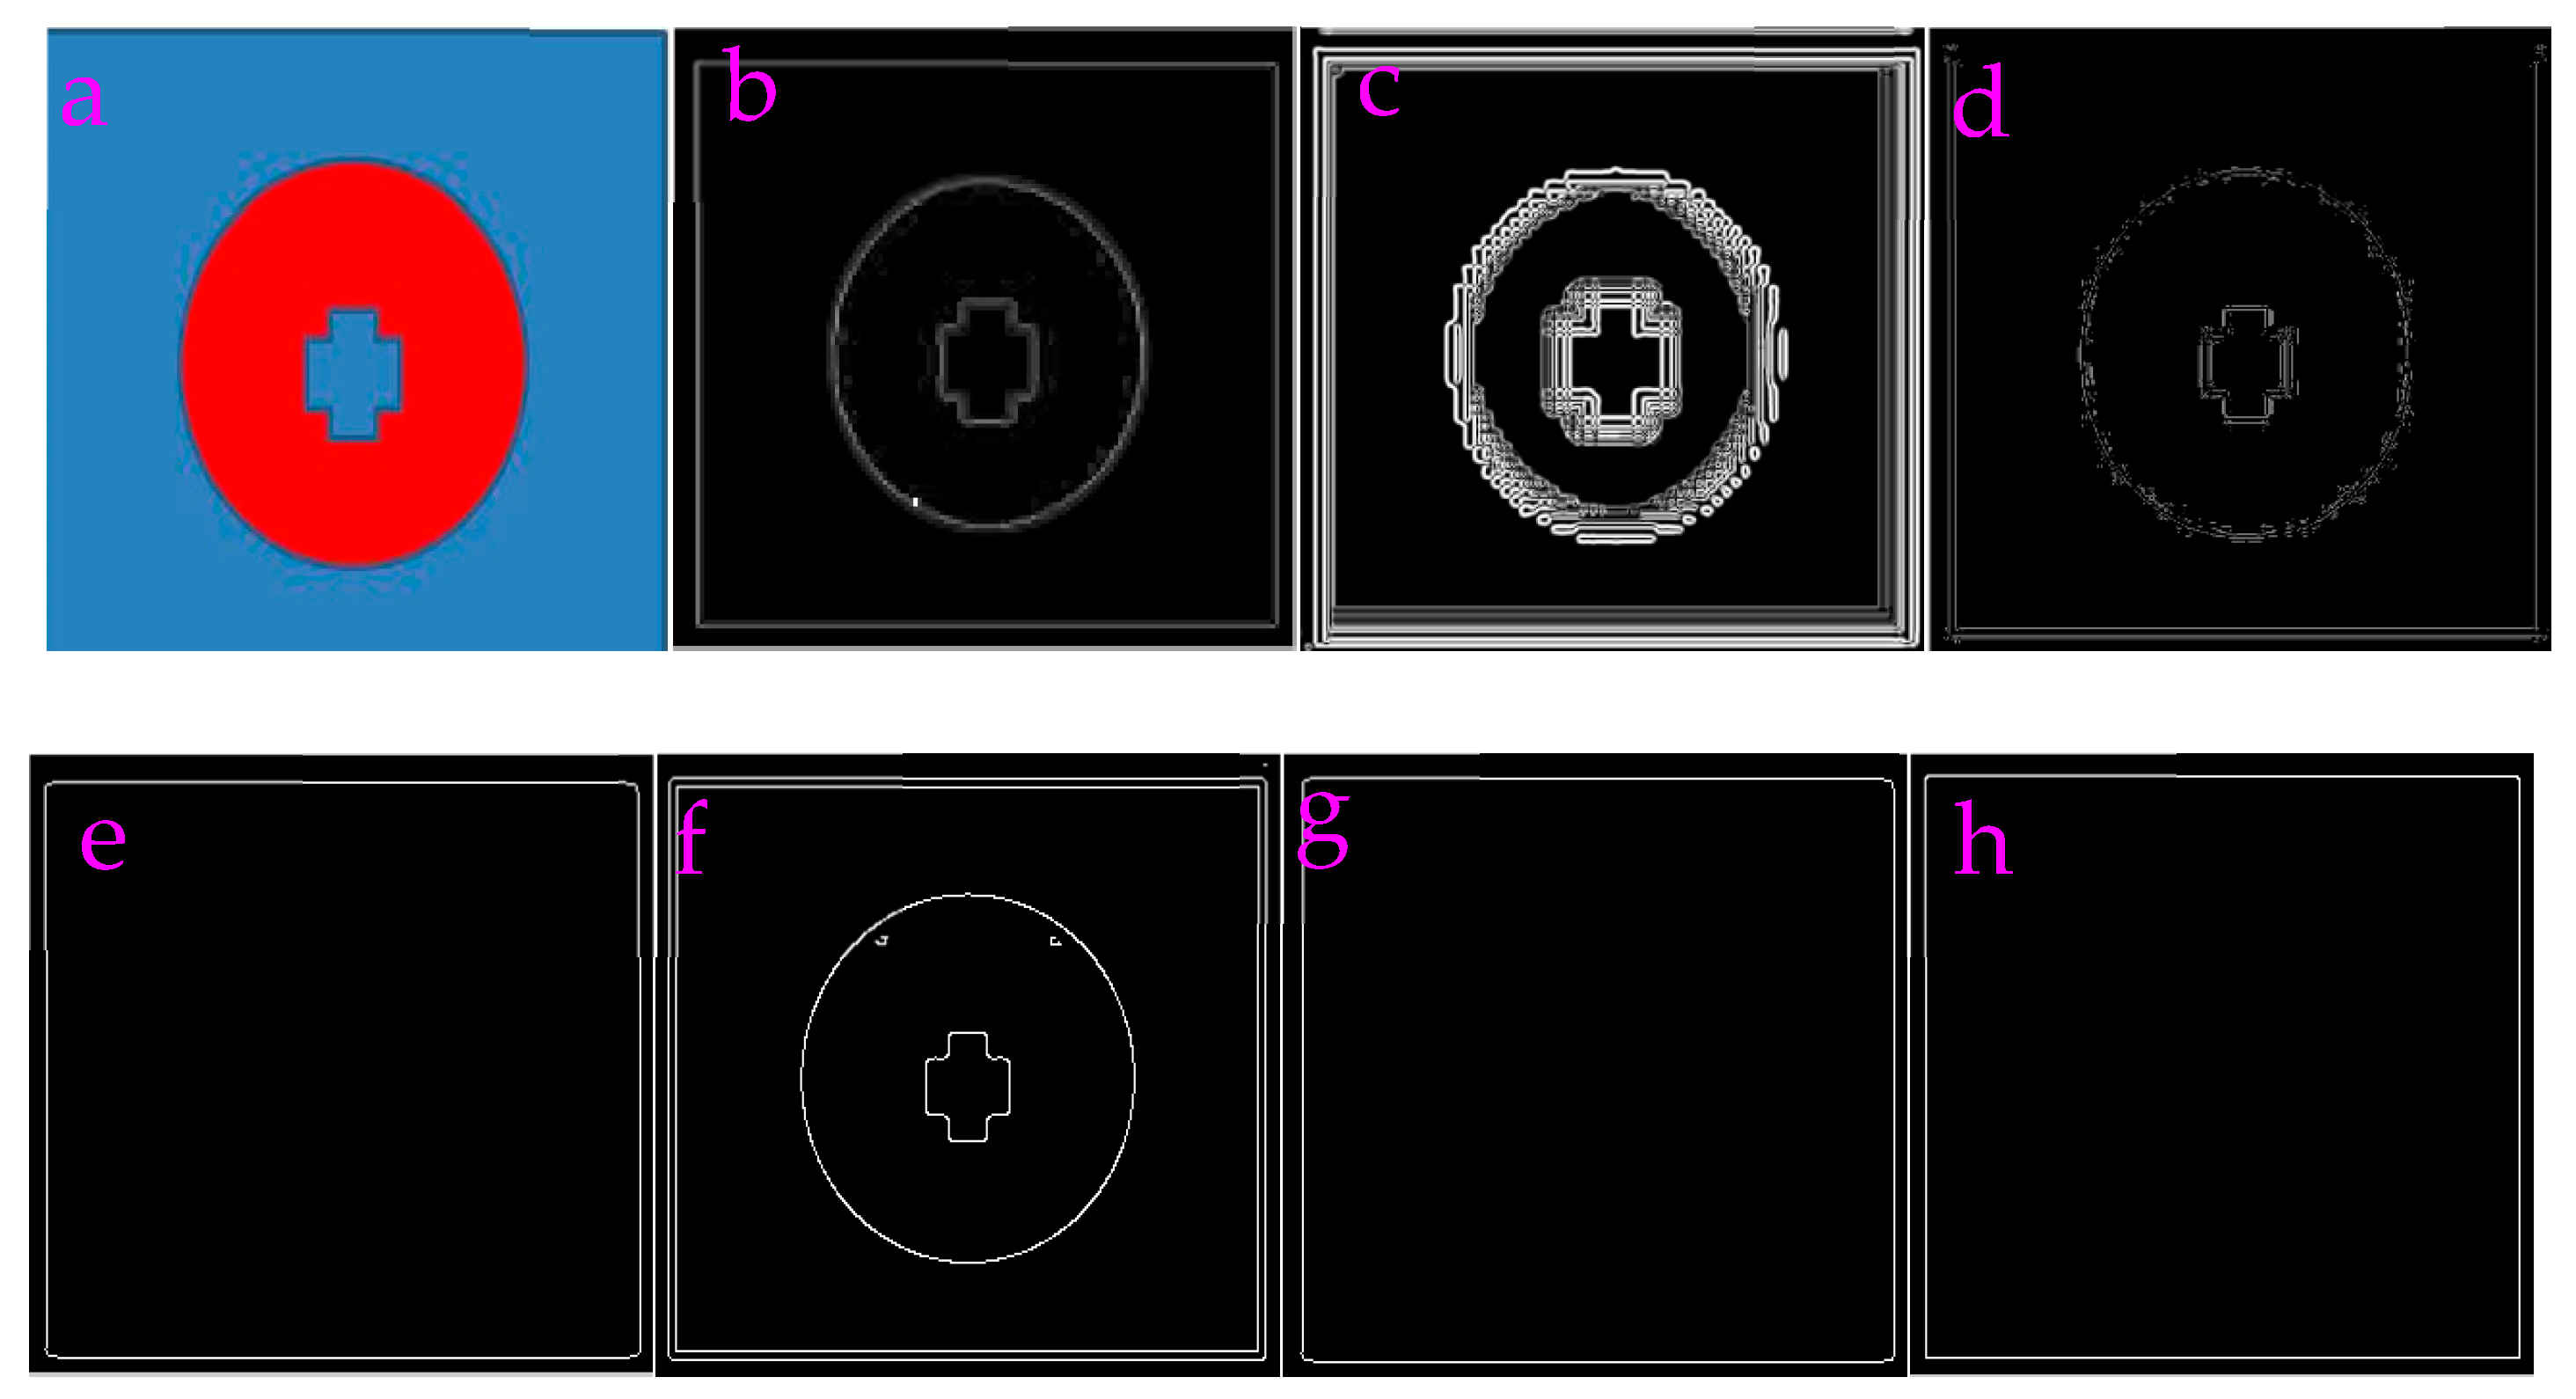
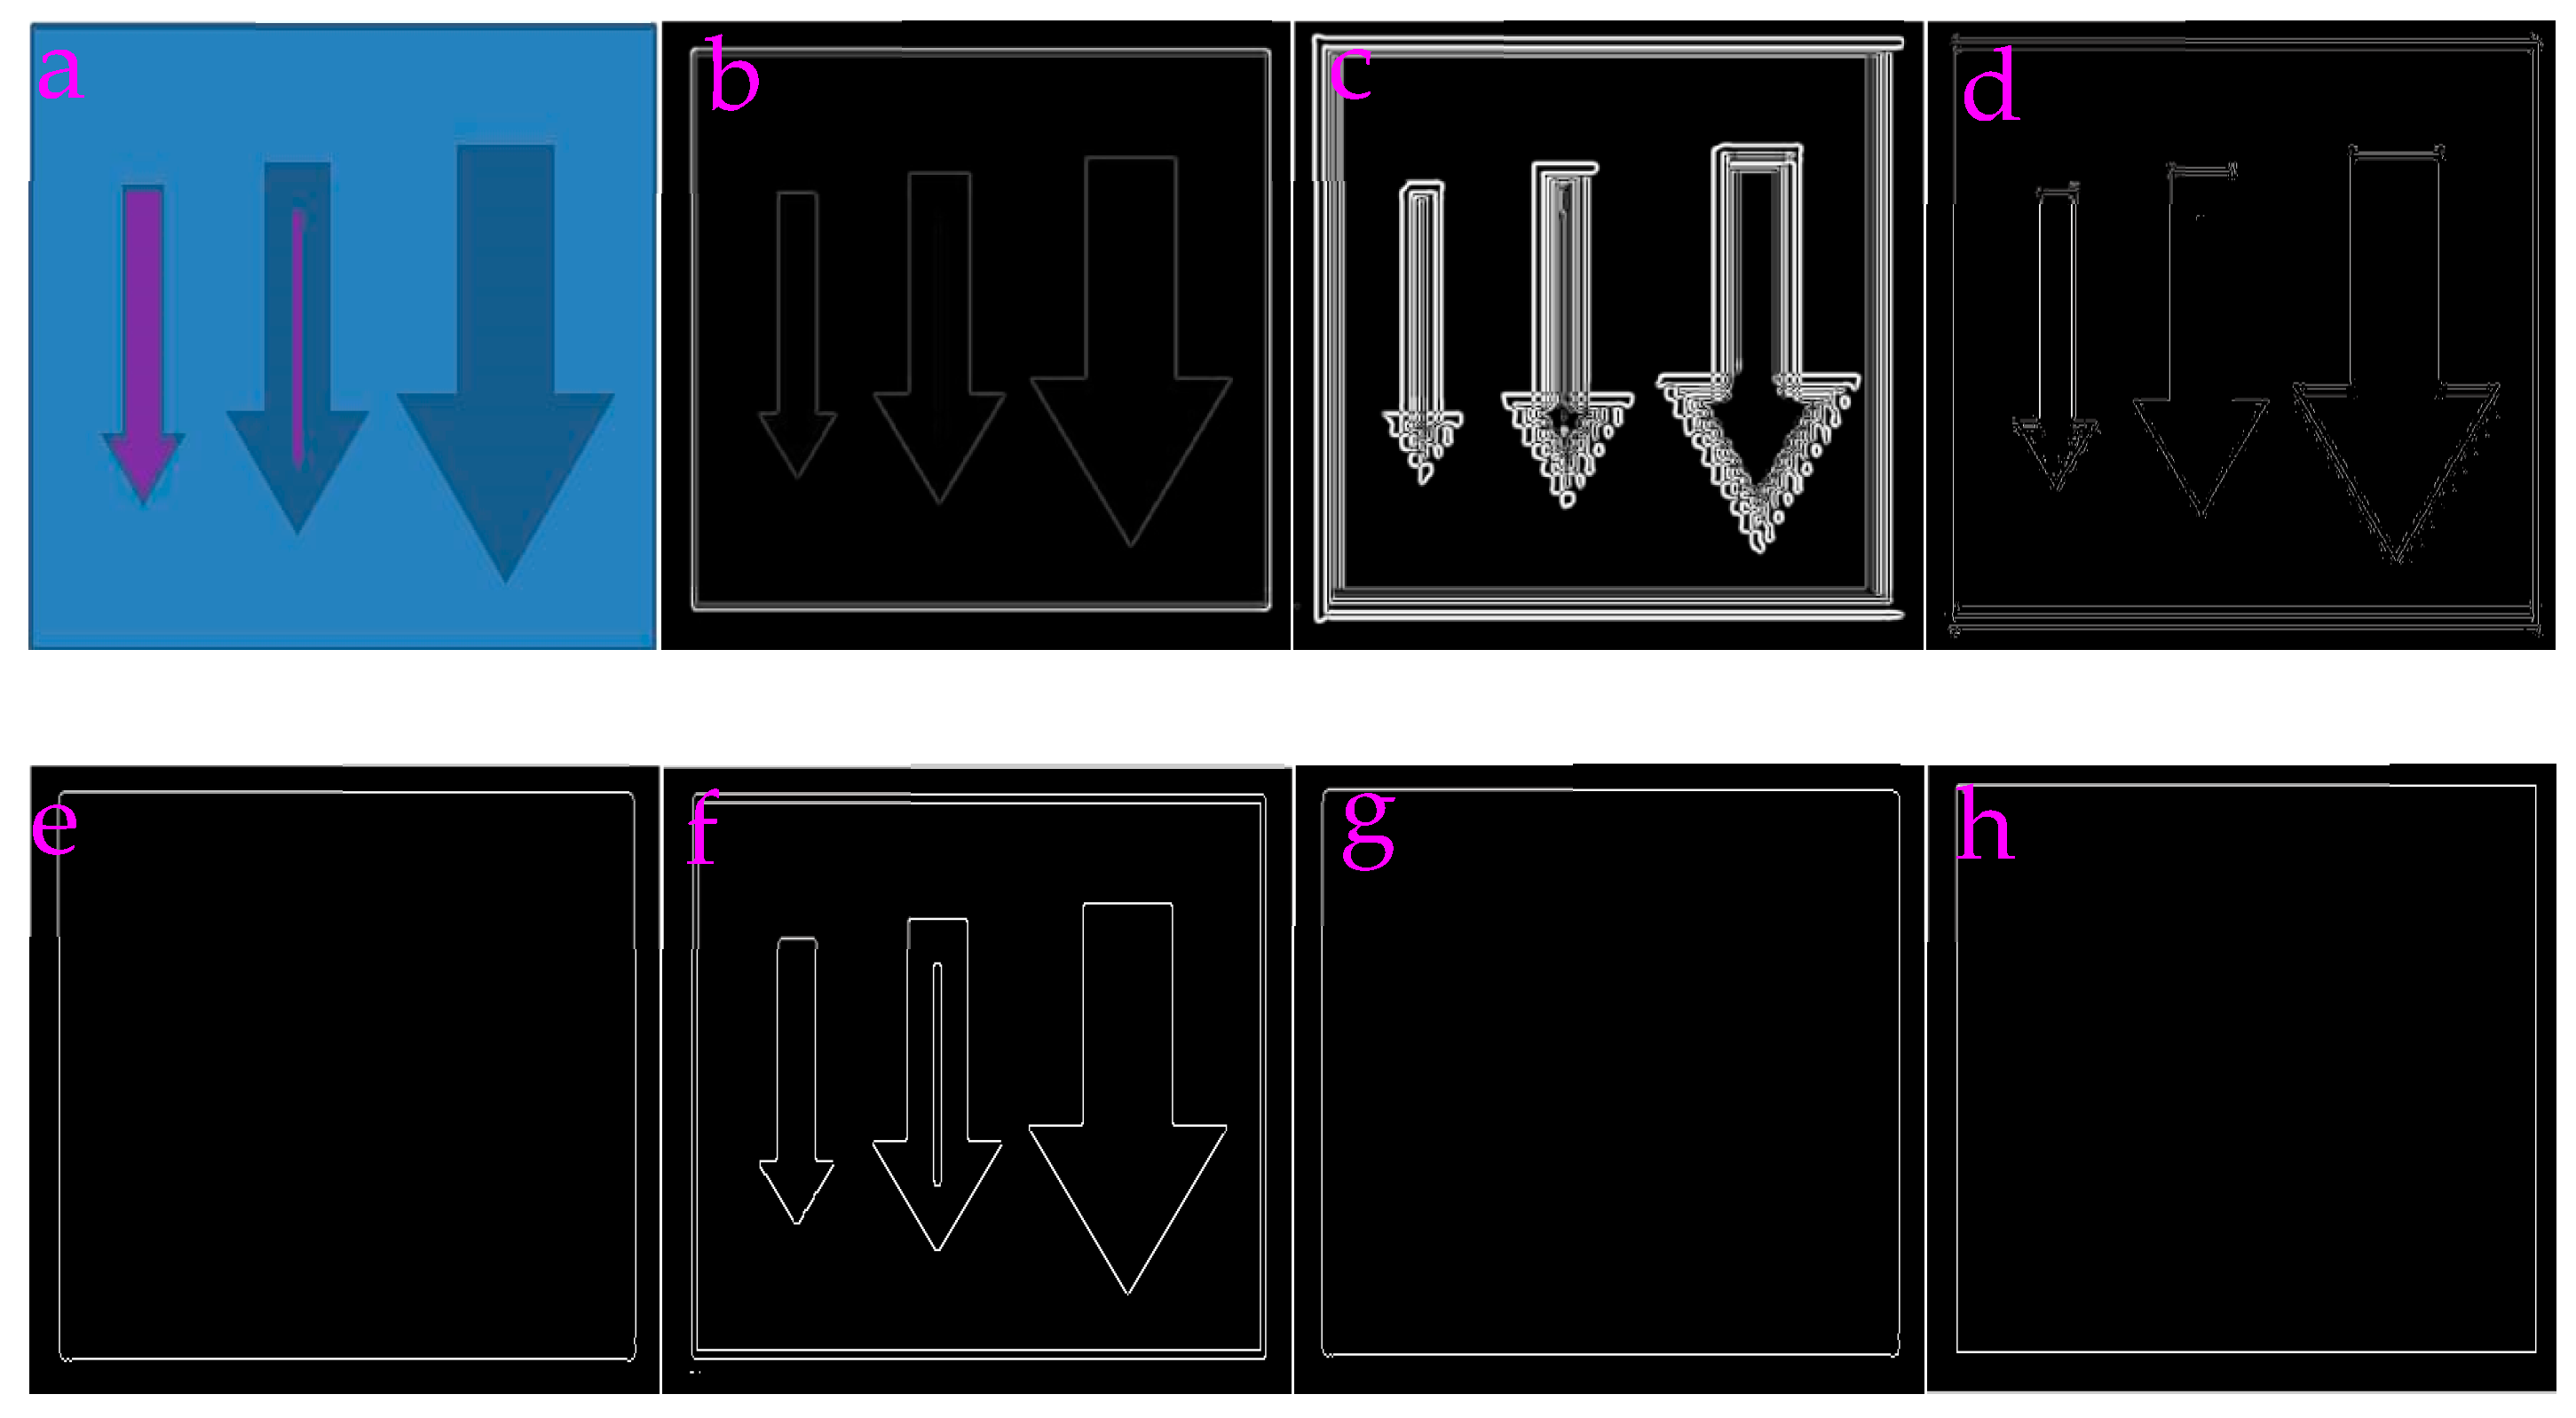
Figure 23a is an image called Shape. We used our filters, the Prewitt operator, Log operator, Canny operator, Sobel operator, and Roberts operator to detect the image, respectively. The results are shown in Figure 23b–h. From the profiles obtained by the Atanh filter and Canny operator, the detected edge contours are quite clear. The profiles obtained from the Sech filter and Log operator are not clear, where some stacked frameworks can appear. In contrast, almost no contours can be observed with the Roberts, Sobel, and Prewitt operators. It can be shown that our filters outperform the Prewitt operator, Sobel operator, and Roberts operator in terms of detecting the edge.

3.7. Application for Detecting the Array

Figure 24a is an image called Shape2. Similarly, these filters and four operators were applied to detect the image Shape2, respectively. As is shown in Figure 24b–h, the images processed by the Atanh filter and Canny operator both display clear contours. The image processed by the Sech filter shows stacked features. The image processed by the Log operator shows a missing section. Almost no contours can be observed with the Prewitt operator, Sobel operator, and Roberts operator. This can show that our filters outperform the Prewitt operator, the Sobel operator, and the Roberts operator in terms of detecting an array.

4. Discussion

In this section, the main features and advantages of the filters will be discussed. The limitation of the filters and future work will be addressed.

4.1. Features of Our Filters

The main contribution of our work is providing filters that can be used for multiple tasks. They can be for profile extraction from the images obtained from the near infrared camera, the underwater environment, and the low-light condition. They can also be used for the image fusion and the edge detection.
Figure 25 shows the flowchart of the filters. The process was conducted from a wavelet transform from the very beginning. A combination of several functions was used to selectively reduce the coefficients in certain frequency domains. Convolution calculation was followed to introduce an enhanced intensity of the coefficients. This would lead to the final output image.
Five images were used as inputs. This amount of data is sufficient. These filters are good for enhancing the images obtained from the weak-light condition. However, these filters have the following limitations. Firstly, images generated through our algorithms are in black and white. The input-colored images were unable to be reconstructed with the exact colors from the originals. Secondly, it is necessary to optimize the parameters of the filters in the processing of diverse images. Given that our algorithms contain various parameters, the task of optimization can be challenging for those unfamiliar with these frameworks.
Our filters outperform the Prewitt operator, the Sobel operator, and the Roberts operator in regard of edge/array detection. Our filters are comparable to the matched filter in terms of the low-light image enhancement. Our filters outperform the Sobel operator in regard of profile extraction of the underwater images. Our filters are comparable to the Canny operator in terms of profile extraction of the near infrared images. Our filters outperform the Roberts operator, the Log operator, the Sobel operator, and the Prewitt operator in terms of profile extraction of the near infrared images.
The method used by our filters is different from wavelet or wavelet package analysis. Generally, wavelet or wavelet package analysis can be used to keep the low-frequency components and dump the high-frequency components. Therefore, the wavelet or wavelet package analysis can be used to delete the noise signals in the images. However, wavelet or wavelet package analysis is difficult to use for extracting the profiles from the images acquired from the underwater condition, low-light environment, and the near infrared camera. Figure 26 and Figure 27 show those images that were processed by the wavelet and wavelet package analysis. It can be seen that no profiles were extracted. It may be possible that the active frequency components that contain the major profiles in the underwater condition, low-light environment, and the near infrared camera are barely to be extracted through the wavelet or wavelet package analysis.
Statistics of input and processed figures are shown in Table S31 (see Supplementary Materials), which includes standard deviation, median absolute deviation, mean absolute deviation, L1 norm, L2 norm, and max norm. It can be seen the value of standard deviation, median absolute deviation, mean absolute deviation, L1 norm, and L2 norm is different for the input and output images. This clearly indicates the impact of the filters.

4.2. Potential Directions

Running most of the network or net-based filters need huge memory, CPU array, computing power, and graphics card resources. These filters can be run via a personal computer (DELL OptiPlex 7070 Desptop, Dell, Round Rock, TX, USA), which may not require large computing resources. The functions involved in these filters are simple. These filters contain operations such as convolutions and loops, which are simple. The typical processing time for an image is 0.9–1.5 s (see Table 16). Our filters may provide an option for running programming of the image enhancement with litter computer resources.
Object classification remains an important task in computer vision. It can be proposed using the combination of our filters with the deep learning approach. This can be used for image classification solutions. In this context, these filters can perform the basic job, such as enhancement for low-light images. Furthermore, deep learning can be seamlessly applied to achieve the final task of the object classification. This is a promising application of our filters.
Tap water was used to simulate an underwater environment. This is just a facile simulation to the underwater environment. This is not a precise simulation to the real underwater environment. The real underwater environment may be complex, where turbulence, organic materials, rocks, sea animals, and water grass can be contained. In future study, an underwater camera may be used to obtain underwater images from local lakes or territorial waters. Those explorations may be useful for knowing the competence of our filters for processing the underwater environment.
In these filters, arctanh and sech functions were employed to show the filtering impact for the images acquired from the low-light illumination, the underwater environment, and the near infrared camera. However, this does not mean some other functions are not workable. The claim that only the arctanh and sech functions are effective is arbitrary. It can be considered that filtering impact is the combinational effect of the arctanh and sech functions, the wavelet transform, and convolution calculation.
One aspect of our future works is focused on the combination of advanced filters, including adaptive filters, watershed-based filters, and wavelet-based filters [43]. Another aspect of our future works would be using advanced contrast agents to improve the image quality from the very beginning, involving the use of nanoparticles, small molecules, and the technique of near infrared emission [44,45,46,47,48,49,50].
The restoration of weak-light, near infrared, and underwater images is still a very difficult task in computer vision and image processing. Images with detailed features are important for many remote sensing tasks, including near infrared target detection and remote control of marine vehicles. People constantly seek methods to solve those tough issues of light scattering, light absorption, and insufficient illumination. These factors lead to a major decline in image contrast and color distortion. It can be expected that in any optical imaging systems, the images captured are impacted by forward-scattering, backscattering, and reflected light components. It is generally believed that forward-scattering can result in light blurring. It can be possible that backscattering generates image-contrast reduction and leads to the loss of edges and features. The attenuation rates of light can be dependent on different wavelengths. Therefore, novel restoration methods are expected to increase the contrast of images, reduce phase shifts in the images, and enhance features, greatly enhancing the visual quality of the images. An advanced processing method including dark channel prior [51], multi-scale Retinex [52], and multi-scale Retinex with Color Restoration [53] would be a good option to address this issue and a good future direction for us to explore. The method mentioned above is devoted mostly to post-processing frameworks, and not to the active correction method [54,55,56,57,58,59], which would be another direction of our future endeavor.
The filters operate only in grayscale, require manual parameter tuning, and occasionally introduce halo artifacts. However, these filters can be used in limited computer resources. No GPUs like NVIDIA A100, NVIDIA RTX A6000, NVIDIA RTX 4090, NVIDIA GeForce RTX 4090 Ti, AMD Radeon RX 7900 XT, Intel Xe HPG 2, NVIDIA GeForce RTX 3060, AMD Radeon RX 6600 XT, NVIDIA A40, and Tesla V100 are required. The filters we have designed demonstrate the characteristics of a versatile filter.

5. Conclusions

Two non-learning and engineering systems were introduced using the simple functions. They can be used to extract the key profiles from the images acquired from the near infrared camera and the underwater environment. They can also be used to enhance the images acquired from the low-light conditions. The output images show clear features. Furthermore, it also performs well in image fusion, edge detection, and the array detection. The measurement by entropy was used to evaluate the performance of the filters. The rising of the measurement by entropy can be found by increasing the scale of the filters. When processing the near infrared images, the values of running time, the memory usage, SNR, and PSNR are generally smaller in the operators of Canny, Roberts, Log, Sobel, and Prewitt than those in the Atanh filter and Sech filter. When processing the underwater images, the values of running time, the memory usage, SNR, and PSNR are generally smaller in the Sobel operator than those in the Atanh filter and Sech filter. When processing the low-light images, it can be seen that the Atanh filter obtains the highest values of the running time and the memory usage compared to the filter based on the Retinex model, the Sech filter, and the matched filter.
In our future research, much attention will be focused on to how to process and generate the colored images using these filters. One possible direction would be to better suppress the noise and bring the considerable brightness simultaneously.

Supplementary Materials

The following supporting information can be downloaded at https://www.mdpi.com/article/10.3390/app152011289/s1; Figure S1: Performance of Atanh filter for processing the image with respect to the various value of delta. (a) An input image named as Leaf1, and its filtered versions (b) when delta is equal to [0, 0, 1], (c) when delta is equal to [0, 0, 100], and (d) when delta is equal to [0, 0, 1000]; Figure S2: Performance of Atanh filter for processing the image with respect to the various value of delta.(a) An input image named as Leaf2 and its filtered versions (b) when delta is equal to [0, 0, 1], (c) when delta is equal to [0, 0, 100], (d) when delta is equal to [0, 0, 1000]; Figure S3: Performance of Atanh filter for processing the image with respect to the various value of delta. (a) An input image named as Leaf3, and its filtered versions (b) when delta is equal to [0, 0, 1], (c) when delta is equal to [0, 0, 100], and (d) when delta is equal to [0, 0, 1000]; Figure S4: Performance of Atanh filter for processing the image with respect to the various value of delta. (a) An input image named as Leaf4, and its filtered versions (b) when delta is equal to [0, 0, 1], (c) when delta is equal to [0, 0, 100], and (d) when delta is equal to [0, 0, 1000]; Figure S5: Performance of Atanh filter for processing the image with respect to the various value of delta. (a) An input image named as Leaf5, and its fitlered versions (b) when delta is equal to [0, 0, 1], (c) when delta is equal to [0, 0, 100], and (d) when delta is equal to [0, 0, 1000]; Figure S6: Performance of Sech filter for processing the image with respect to the various value of delta1. Leaf1 was used as an input image, and its filtered versions (a) when delta1 is equal to [0, 0, 1], (b) when delta1 is equal to [0, 0, 100], and (c) when delta1 is equal to [0, 0, 1000]; Figure S7: Performance of Sech filter for processing the image with respect to the various value of delta1. Leaf2 was used as an input image, and its filtered versions (a) when delta1 is equal to [0, 0, 1], (b) when delta1 is equal to [0, 0, 100], and (c) when delta1 is equal to [0, 0, 1000]; Figure S8: Performance of Sech filter for processing the image with respect to the various value of delta1. Leaf3 was used as an input image, and its filtered versions (a) when delta1 is equal to [0, 0, 1], (b) when delta1 is equal to [0, 0, 100], and (c) when delta1 is equal to [0, 0, 1000]; Figure S9: Performance of Sech filter for processing the image with respect to the various value of delta1. Leaf4 was used as an input image, and its filtered versions (a) when delta1 is equal to [0, 0, 1], (b) when delta1 is equal to [0, 0, 100], and (c)when delta1 is equal to [0, 0, 1000]; Figure S10: Performance of Sech filter for processing the image with respect to the various value of delta1. Leaf5 was used as an input image, and its filtered versions (a) when delta1 is equal to [0, 0, 1], (b) when delta1 is equal to [0, 0, 100], and (c) when delta1 is equal to [0, 0, 1000]; Figure S11: Performance of Atanh filter for processing the image with respect to the various value of h. Leaf1 was used as an input image, and its filtered versions (a) when h is equal to [0.2, 0.2, 0.2, 0.2], (b) when h is equal to [0.6, 0.6, 0.6, 0.6], and (c) when h is equal to [1.2, 1.2, 1.2, 1.2]; Figure S12: Performance of Atanh filter for processing the image with respect to the various value of h. Leaf2 was used as an input image, and its filtered versions (a) when h is equal to [0.2, 0.2, 0.2, 0.2], (b) when h is equal to [0.6, 0.6, 0.6, 0.6], and (c) when h is equal to [1.2, 1.2, 1.2, 1.2]; Figure S13: Performance of Atanh filter for processing the image with respect to the various value of h. Leaf3 was used as an input image, and its filtered versions (a) when h is equal to [0.2, 0.2, 0.2, 0.2], (b) when h is equal to [0.6, 0.6, 0.6, 0.6], and (c) when h is equal to [1.2, 1.2, 1.2, 1.2]; Figure S14: Performance of Atanh filter for processing the image with respect to the various value of h. Leaf4 was used as an input image, and its filtered versions (a) when h is equal to [0.2, 0.2, 0.2, 0.2], (b) when h is equal to [0.6, 0.6, 0.6, 0.6], and (c) when h is equal to [1.2, 1.2, 1.2, 1.2]; Figure S15: Performance of Atanh filter for processing the image with respect to the various value of h. Leaf5 was used as an input image, and its filtered versions (a) when h is equal to [0.2, 0.2, 0.2, 0.2], (b) when h is equal to [0.6, 0.6, 0.6, 0.6], and (c) when h is equal to [1.2, 1.2, 1.2, 1.2]; Figure S16: Performance of Sech filter for processing the image with respect to the various value of h1. Leaf1 was used as an input image, and its filtered versions (a) when h1 is equal to [0.2, 0.2, 0.2, 0.2], (b) when h1 is equal to [0.6, 0.6, 0.6, 0.6], and (c) when h1 is equal to [1.2, 1.2, 1.2, 1.2]; Figure S17: Performance of Sech filter for processing the image with respect to the various value of h1. Leaf2 was used as an input image, and its filtered versions (a) when h1 is equal to [0.2, 0.2, 0.2, 0.2], (b) when h1 is equal to [0.6, 0.6, 0.6, 0.6], and (c) when h1 is equal to [1.2, 1.2, 1.2, 1.2]; Figure S18: Performance of Sech filter for processing the image with respect to the various value of h1. Leaf3 was used as an input image, and its filtered versions (a) when h1 is equal to [0.2, 0.2, 0.2, 0.2], (b) when h1 = [0.6, 0.6, 0.6, 0.6]; (c) h1 = [1.2, 1.2, 1.2, 1.2]; Figure S19: Performance of Sech filter for processing the image with respect to the various value of h1. Leaf4 was used an input image named as Leaf4. (a) h1 = [0.2, 0.2, 0.2, 0.2]; (b) h1 = [0.6, 0.6, 0.6, 0.6]; (c) h1 = [1.2, 1.2, 1.2, 1.2]; Figure S20: Performance of Sech filter for processing the image with respect to the various value of h1. Leaf5 was used as an input image. (a) h1 = [0.2, 0.2, 0.2, 0.2]; (b) h1 = [0.6, 0.6, 0.6, 0.6]; (c) h1 = [1.2, 1.2, 1.2, 1.2]; Figure S21: Performance of Atanh filter for processing the image with respect to the various value of n. Leaf1 was used as an input image. (a) n = 2; (b) n = 4; (c) n = 6; Figure S22: Performance of Atanh filter for processing the image with respect to the various value of n. Leaf2 was used as an input image. (a) n = 2; (b) n = 4; (c) n = 6; Figure S23: Performance of Atanh filter for processing the image with respect to the various value of n. Leaf3 was used as an input image. (a) n = 2; (b) n = 4; (c) n = 6; Figure S24: Performance of the Atanh filter for processing the image with respect to the various value of n. Leaf4 was used as an input image. (a) n = 2; (b) n = 4; (c) n = 6; Figure S25: Performance of the Atanh filter for processing the image with respect to the various value of n. Leaf5 was used as an input image. (a) n = 2; (b) n = 4; (c) n = 6; Figure S26: Performance of the Sech filter for processing the image with respect to the various value of m. Leaf1 was used as an input image. (a) m = 20; (b) m = 40; (c) m = 60; Figure S27: Performance of the Sech filter for processing the image with respect to the various value of m. Leaf2 was used as an input image. (a) m = 20; (b) m = 40; (c) m = 60; Figure S28: Performance of the Sech filter for processing the image with respect to the various value of m. Leaf3 was used as an input image. (a) m = 20; (b) m = 40; (c) m = 60; Figure S29: Performance of the Sech filter for processing the image with respect to the various value of m. Leaf4 was used as an input image. (a) m = 20; (b) m = 40; (c) m = 60; Figure S30: Performance of the Sech filter for processing the image with respect to the various value of m. Leaf4 was used as an input image. (a) m = 20; (b) m = 40; (c) m = 60; Table S1: Evaluation of Atanh filter when delta is changed for the image Leaf1; Table S2: Evaluation of Atanh filter when delta is changed for the image Leaf2; Table S3: Evaluation of Atanh filter when delta is changed for the image Leaf3; Table S4: Evaluation of Atanh filter when delta is changed for the image Leaf4; Table S5: Evaluation of Atanh filter when delta is changed for the image Leaf5; Table S6: Evaluation of Sech filter when delta is changed for the image Leaf1; Table S7: Evaluation of Sech filter when delta is changed for the image Leaf2; Table S8: Evaluation of Sech filter when delta is changed for the image Leaf3; Table S9: Evaluation of Sech filter when delta is changed for the image Leaf4; Table S10: Evaluation of Sech filter when delta is changed for the image Leaf5; Table S11: Evaluation of Atanh filter when h is changed for the image Leaf1; Table S12: Evaluation of Atanh filter when h is changed for the image Leaf2; Table S13: Evaluation of Atanh filter when h is changed for the image Leaf3; Table S14: Evaluation of Atanh filter when h is changed for the image Leaf4; Table S15: Evaluation of Atanh filter when h is changed for the image Leaf5; Table S16: Evaluation of Sech filter when h is changed for the image Leaf1; Table S17: Evaluation of Sech filter when h is changed for the image Leaf2; Table S18: Evaluation of Sech filter when h is changed for the image Leaf3; Table S19: Evaluation of Sech filter when h is changed for the image Leaf4; Table S20: Evaluation of Sech filter when h is changed for the image Leaf5; Table S21: Evaluation of Atanh filter when n is changed for the image Leaf1; Table S22: Evaluation of Atanh filter when n is changed for the image Leaf2; Table S23: Evaluation of Atanh filter when n is changed for the image Leaf3; Table S24: Evaluation of Atanh filter when n is changed for the image Leaf4; Table S25: Evaluation of Atanh filter when n is changed for the image Leaf5; Table S26: Evaluation of Sech filter when m is changed for the image Leaf1; Table S27: Evaluation of Sech filter when m is changed for the image Leaf2; Table S28: Evaluation of Sech filter when m is changed for the image Leaf3; Table S29: Evaluation of Sech filter when m is changed for the image Leaf4; Table S30: Evaluation of Sech filter when n is changed for the image Leaf5; Table S31: Statistics of input and processed figures.

Author Contributions

Conceptualization, T.S., J.X., Z.L. and Y.W.; investigation, T.S., Z.L. and Y.W.; writing—original draft preparation, J.X. and Y.W.; writing—review and editing, J.X., Z.L. and Y.W. All authors have read and agreed to the published version of the manuscript.

Funding

This work is funded by China NSF (No. 32171402) and Key Tech. R&D Program of Jiangsu Province (No. BE2019002).

Institutional Review Board Statement

Not applicable.

Informed Consent Statement

Not applicable.

Data Availability Statement

The original contributions presented in this study are included in the article. Further inquiries can be directed to the corresponding authors.

Acknowledgments

The authors would like to thank the Nanjing Normal University for providing the instrument of imaging.

Conflicts of Interest

The authors declare no conflicts of interest.

References

  1. Dong, C.; Zheng, Y.; Long-Iyer, K.; Wright, E.C.; Li, Y.; Tian, L. Fluorescence Imaging of Neural Activity, Neurochemical Dynamics, and Drug-Specific Receptor Conformation with Genetically Encoded Sensors. Annu. Rev. Neurosci. 2022, 45, 273–294. [Google Scholar] [CrossRef]
  2. Wang, Q.; Li, X.; Qian, B.; Hu, K.; Liu, B. Fluorescence imaging in the surgical management of liver cancers: Current status and future perspectives. Asian J. Surg. 2022, 45, 1375–1382. [Google Scholar] [CrossRef]
  3. Jiang, L.; Liu, T.; Wang, X.; Li, J.; Zhao, H. Real-time near-infrared fluorescence imaging mediated by blue dye in breast cancer patients. J. Surg. Oncol. 2020, 121, 964–966. [Google Scholar] [CrossRef]
  4. Marsden, M.; Weaver, S.S.; Marcu, L.; Campbell, M.J. Intraoperative Mapping of Parathyroid Glands Using Fluorescence Lifetime Imaging. J. Surg. Res. 2021, 265, 42–48. [Google Scholar] [CrossRef]
  5. Huh, W.K.; Johnson, J.L.; Elliott, E.; Boone, J.D.; Leath, C.A., 3rd; Kovar, J.L.; Kim, K.H. Fluorescence Imaging of the Ureter in Minimally Invasive Pelvic Surgery. J. Minim. Invasive Gynecol. 2021, 28, 332–341.e14. [Google Scholar] [CrossRef]
  6. Paraboschi, I.; De Coppi, P.; Stoyanov, D.; Anderson, J.; Giuliani, S. Fluorescence imaging in pediatric surgery: State-of-the-art and future perspectives. J. Pediatr. Surg. 2021, 56, 655–662. [Google Scholar] [CrossRef] [PubMed]
  7. Lauwerends, L.J.; van Driel, P.B.A.A.; Baatenburg, d.J.R.J.; Hardillo, J.A.U.; Koljenovic, S.; Puppels, G.; Mezzanotte, L.; Lowik, C.W.G.M.; Rosenthal, E.L.; Vahrmeijer, A.L.; et al. Real-time fluorescence imaging in intraoperative decision making for cancer surgery. Lancet Oncol. 2021, 22, e186–e195. [Google Scholar] [CrossRef] [PubMed]
  8. Zhang, Z.; He, K.; Chi, C.; Hu, Z.; Tian, J. Intraoperative fluorescence molecular imaging accelerates the coming of precision surgery in China. Eur. J. Nucl. Med. Mol. Imaging 2022, 49, 2531–2543. [Google Scholar] [CrossRef] [PubMed]
  9. de Wit, J.G.; Vonk, J.; Voskuil, F.J.; de Visscher, S.A.H.J.; Schepman, K.P.; Hooghiemstra, W.T.R.; Linssen, M.D.; Elias, S.G.; Halmos, G.B.; Plaat, B.E.C.; et al. EGFR-targeted fluorescence molecular imaging for intraoperative margin assessment in oral cancer patients: A phase II trial. Nat. Commun. 2023, 14, 4952. [Google Scholar] [CrossRef]
  10. Hao, H.; Wang, X.; Qin, Y.; Ma, Z.; Yan, P.; Liu, C.; Chen, G.; Yang, X. Ex vivo near-infrared targeted imaging of human bladder carcinoma by ICG-anti-CD47. Front. Oncol. 2023, 13, 1083553. [Google Scholar] [CrossRef]
  11. Sun, Y.; Zhong, X.; Dennis, A.M. Minimizing near-infrared autofluorescence in preclinical imaging with diet and wavelength selection. J. Biomed. Opt. 2023, 28, 094805. [Google Scholar] [CrossRef] [PubMed]
  12. George, M.B.; Lew, B.; Blair, S.; Zhu, Z.; Liang, Z.; Srivastava, I.; Chang, A.; Choi, H.; Kim, K.; Nie, S.; et al. Bioinspired color-near infrared endoscopic imaging system for molecular guided cancer surgery. J. Biomed. Opt. 2023, 28, 056002. [Google Scholar] [CrossRef]
  13. Okusanya, O.T.; Holt, D.; Heitjan, D.; Deshpande, C.; Venegas, O.; Jiang, J.; Judy, R.; DeJesus, E.; Madajewski, B.; Oh, K.; et al. Intraoperative near-infrared imaging can identify pulmonary nodules. Ann. Thorac. Surg. 2014, 98, 1223–1230. [Google Scholar] [CrossRef]
  14. Keating, J.J.; Runge, J.J.; Singhal, S.; Nims, S.; Venegas, O.; Durham, A.C.; Swain, G.; Nie, S.; Low, P.S.; Holt, D.E. Intraoperative near-infrared fluorescence imaging targeting folate receptors identifies lung cancer in a large-animal model. Cancer 2017, 123, 1051–1060. [Google Scholar] [CrossRef]
  15. Cheng, S.; Jin, Z.; Wu, X.; Liang, J. Transmission map and background light guided enhancement of unpaired underwater image. Neurocomputing 2025, 621, 129270. [Google Scholar] [CrossRef]
  16. Fu, C.; Liu, R.; Fan, X.; Chen, P.; Fu, H.; Yuan, W.; Zhu, M.; Luo, Z. Rethinking general underwater object detection: Datasets, Challenges, and solutions. Neurocomputing 2023, 517, 243–256. [Google Scholar] [CrossRef]
  17. Saleh, A.; Sheaves, M.; Jerry, D.; Azghadi, M.R. Adaptive deep learning framework for robust unsupervised underwater image enhancement. Expert Sys. Appl. 2025, 268, 126314. [Google Scholar] [CrossRef]
  18. Ye, B.; Jin, S.; Li, B.; Yan, S.; Zhang, D. Dual Histogram Equalization Algorithm Based on Adaptive Image Correction. Appl. Sci. 2023, 13, 10649. [Google Scholar] [CrossRef]
  19. Zarie, M.; Parsayan, A.; Hajghassem, H. Image contrast enhancement using triple clipped dynamic histogram equalization based on standard deviation. IET Image Process. 2019, 13, 1081–1089. [Google Scholar] [CrossRef]
  20. Rao, B.S. Dynamic Histogram Equalization for contrast enhancement for digital images. Appl. Softw. Comput. 2020, 89, 106114. [Google Scholar] [CrossRef]
  21. Paul, A.; Sutradhar, T.; Bhattacharya, P.; Maity, S.P. Infrared images enhancement using fuzzy dissimilarity histogram equalization. Optik 2021, 247, 167887. [Google Scholar] [CrossRef]
  22. Sun, Y.; Zhao, Z.; Jiang, D.; Tong, X.; Tao, B.; Jiang, G.; Kong, J.; Yun, J.; Liu, Y.; Liu, X.; et al. Low-Illumination Image Enhancement Algorithm Based on Improved Multi-Scale Retinex and ABC Algorithm Optimization. Front. Bioeng. Biotechnol. 2022, 10, 865820. [Google Scholar] [CrossRef]
  23. Liu, D.; Chang, F.; Zhang, H.; Liu, L. Level set method with Retinex-corrected saliency embedded for image segmentation. IET Image Process. 2021, 15, 1530–1541. [Google Scholar] [CrossRef]
  24. Wen, C.; Nie, T.; Li, M.; Wang, X.; Huang, L. Image Restoration via Low-Illumination to Normal-Illumination Networks Based on Retinex Theory. Sensors 2023, 23, 8442. [Google Scholar] [CrossRef] [PubMed]
  25. Chao, K.; Song, W.; Shao, S.; Liu, D.; Liu, X.; Zhao, X. CUI-Net: A correcting uneven illumination net for low-light image enhancement. Sci. Rep. 2023, 13, 12894. [Google Scholar] [CrossRef] [PubMed]
  26. Liang, X.; Chen, X.; Ren, K.; Miao, X.; Chen, Z.; Jin, Y. Low-light image enhancement via adaptive frequency decomposition network. Sci. Rep. 2023, 13, 14107. [Google Scholar] [CrossRef] [PubMed]
  27. Chen, Y.; Wen, C.; Liu, W.; He, W. A depth iterative illumination estimation network for low-light image enhancement based on retinex theory. Sci. Rep. 2023, 13, 19709. [Google Scholar] [CrossRef]
  28. Latke, V.; Narawade, V. Detection of dental periapical lesions using retinex based image enhancement and lightweight deep learning model. Image Vis. Comput. 2024, 146, 105016. [Google Scholar] [CrossRef]
  29. Liu, C.; Wang, Z.; Birch, P.; Wang, X. Efficient Retinex-based framework for low-light image enhancement without additional networks. IEEE Trans. Circuits Syst. Video Technol. 2025, 35, 4896–4909. [Google Scholar] [CrossRef]
  30. Liu, R.; Ma, L.; Zhang, J.; Fan, X.; Luo, Z. Retinex-inspired unrolling with cooperative prior architecture search for low-light image enhancement. In Proceedings of the 2021 IEEE/CVF Conference on Computer Vision and Pattern Recognition (CVPR), Nashville, TN, USA, 20–25 June 2021. [Google Scholar]
  31. Liu, J. Retinex-based Lightweight Network for Low Light Image Enhancement. In Proceedings of the 2024 IEEE 6th International Conference on Power, Intelligent Computing and Systems (ICPICS), Shenyang, China, 26–28 July 2024; pp. 109–115. [Google Scholar]
  32. Lin, Y.H.; Yu, C.M.; Wu, C.Y. Towards the Design and Implementation of an Image-Based Navigation System of an Autonomous Underwater Vehicle Combining a Color Recognition Technique and a Fuzzy Logic Controller. Sensors 2021, 21, 4053. [Google Scholar] [CrossRef]
  33. Tang, Y.; Qiu, J.; Gao, M. Fuzzy Medical Computer Vision Image Restoration and Visual Application. Comput. Math. Methods Med. 2022, 2022, 6454550. [Google Scholar] [CrossRef]
  34. Yang, Y.; Wu, J.; Huang, S.; Fang, Y.; Lin, P.; Que, Y. Multimodal Medical Image Fusion Based on Fuzzy Discrimination with Structural Patch Decomposition. IEEE J. Biomed. Health Inform. 2019, 23, 1647–1660. [Google Scholar] [CrossRef] [PubMed]
  35. Alphonse, A.S.; Benifa, J.V.B.; Muaad, A.Y.; Chola, C.; Heyat, M.B.B.; Murshed, B.A.H.; Samee, N.A.; Alabdulhafith, M.; Al-antari, M.A. A Hybrid Stacked Restricted Boltzmann Machine with Sobel Directional Patterns for Melanoma Prediction in Colored Skin Images. Diagnostics 2023, 13, 1104. [Google Scholar] [CrossRef]
  36. Sharifrazi, D.; Alizadehsani, R.; Roshanzamir, M.; Joloudari, J.H.; Shoeibi, A.; Jafari, M.; Hussain, S.; Sani, Z.A.; Hasanzadeh, F.; Khozeimeh, F.; et al. Fusion of convolution neural network, support vector machine and Sobel filter for accurate detection of COVID-19 patients using X-ray images. Biomed. Signal Process. Control. 2021, 68, 102622. [Google Scholar] [CrossRef] [PubMed]
  37. Hou, X.; Ma, Y. SAR minimum entropy autofocusing based on Prewitt operator. PLoS ONE 2023, 18, e0276051. [Google Scholar] [CrossRef] [PubMed]
  38. Liu, J.; Yan, S.; Lu, N.; Yang, D.; Lv, H.; Wang, S.; Zhu, X.; Zhao, Y.; Wang, Y.; Ma, Z.; et al. Automated retinal boundary segmentation of optical coherence tomography images using an improved Canny operator. Sci. Rep. 2022, 12, 1412. [Google Scholar] [CrossRef]
  39. Haq, I.; Anwar, S.; Shah, K.; Khan, M.T.; Sah, S.A. Fuzzy Logic Based Edge Detection in Smooth and Noisy Clinical Images. PLoS ONE 2015, 10, e0138712. [Google Scholar] [CrossRef]
  40. Jia, M.; Xu, J.; Yang, R.; Li, Z.; Zhang, L.; Wu, Y. Three filters for the enhancement of the images acquired from fluorescence microscope and weak-light-sources and the image compression. Heliyon 2023, 9, e20191. [Google Scholar] [CrossRef]
  41. Chaudhuri, S.; Chatterjee, S.; Katz, N.; Nelson, M.; Goldbaum, M. Detection of blood vessels in retinal images using two-dimensional matched filters. IEEE Trans. Med. Imaging 1989, 8, 263–269. [Google Scholar] [CrossRef]
  42. Sun, Y.; Jin, Y.; Chen, X.; Xu, Y.; Yan, X.; Liu, Z. Unsupervised detail and color restorer for Retinex-based low-light image enhancement. Eng. Appl. Artif. Intell. 2025, 153, 110867. [Google Scholar] [CrossRef]
  43. Huang, Y.; Yang, R.; Geng, X.; Li, Z.; Wu, Y. Two filters for acquiring the profiles from images obtained from weak-light background, fluorescence microscope, transmission electron microscope, and near-infrared camera. Sensors 2023, 23, 6207. [Google Scholar] [CrossRef]
  44. Okusanya, O.T.; DeJesus, E.M.; Jiang, J.X.; Judy, R.P.; Venegas, O.G.; Deshpande, C.G.; Heitjan, D.F.; Nie, S.; Low, P.S.; Singhal, S. Intraoperative molecular imaging can identify lung adenocarcinomas during pulmonary resection. J. Thorac. Cardiovasc. Surg. 2015, 150, 28–35. [Google Scholar] [CrossRef]
  45. Predina, J.D.; Okusanya, O.; Newton, A.D.; Low, P.; Singhal, S. Standardization and Optimization of Intraoperative Molecular Imaging for Identifying Primary Pulmonary Adenocarcinomas. Mol. Imaging Biol. 2018, 20, 131–138. [Google Scholar] [CrossRef] [PubMed]
  46. Newton, A.D.; Predina, J.D.; Frenzel-Sulyok, L.G.; Low, P.S.; Singhal, S.; Roses, R.E. Intraoperative Molecular Imaging Utilizing a Folate Receptor-Targeted Near-Infrared Probe Can Identify Macroscopic Gastric Adenocarcinomas. Mol. Imaging Biol. 2021, 23, 11–17. [Google Scholar] [CrossRef]
  47. Li, Z.; Li, Y.; Lin, Y.; Alam, M.Z.; Wu, Y. Synthesizing Ag+: MgS, Ag+: Nb2S5, Sm3+: Y2S3, Sm3+: Er2S3, and Sm3+: ZrS2 Compound Nanoparticles for Multicolor Fluorescence Imaging of Biotissues. ACS Omega 2020, 5, 32868–32876. [Google Scholar] [CrossRef] [PubMed]
  48. Wu, Y.; Ou, P.; Fronczek, F.R.; Song, J.; Lin, Y.; Wen, H.-M.; Xu, J. Simultaneous Enhancement of Near-Infrared Emission and Dye Photodegradation in a Racemic Aspartic Acid Compound via MetalIon Modification. ACS Omega 2019, 4, 19136–19144. [Google Scholar] [CrossRef] [PubMed]
  49. Wu, Y.; Lin, Y.; Xu, J. Synthesis of Ag-Ho, Ag-Sm, Ag-Zn, Ag-Cu, Ag-Cs, Ag-Zr, Ag-Er, Ag-Y and Ag-Co metal organic nanoparticles for UV-Vis-NIR wide-range bio-tissue imaging. Photochem. Photobiol. Sci. 2019, 18, 1081–1091. [Google Scholar] [CrossRef] [PubMed]
  50. Wu, Y.; Ou, P.; Song, J.; Zhang, L.; Lin, Y.; Song, P.; Xu, J. Synthesis of praseodymium-and molybdenum- sulfide nanoparticles for dye-photodegradation and near-infrared deep-tissue imaging. Mater. Res. Express 2020, 7, 036203. [Google Scholar] [CrossRef]
  51. Fang, Z.; Wu, Q.; Huang, D.; Guan, D. An Improved DCP-Based Image Defogging Algorithm Combined with Adaptive Fusion Strategy. Math. Probl. Eng. 2021, 2021, 1436255. [Google Scholar] [CrossRef]
  52. Li, D.; Zhou, J.; Wang, S.; Zhang, D.; Zhang, W.; Alwadai, R.; Alenezi, F.; Tiwari, P.; Shi, T. Adaptive weighted multiscale retinex for underwater image enhancement. Eng. Appl. Artif. Intell. 2023, 123, 106457. [Google Scholar] [CrossRef]
  53. Zhang, W.; Dong, L.; Xu, W. Retinex-inspired color correction and detail preserved fusion for underwater image enhancement. Comput. Electron. Agric. 2022, 192, 106585. [Google Scholar] [CrossRef]
  54. Zhang, X.; Stramski, D.; Reynolds, R.A.; Blocker, E.R. Light scattering by pure water and seawater: The depolarization ratio and its variation with salinity. Appl. Opt. 2019, 58, 991–1004. [Google Scholar] [CrossRef] [PubMed]
  55. Galaktionov, I.; Nikitin, A.; Sheldakova, J.; Toporovsky, V.; Kudryashov, A. Focusing of a laser beam passed through a moderately scattering medium using phase-only spatial light modulator. Photonics 2022, 9, 296. [Google Scholar] [CrossRef]
  56. Hu, L.; Zhang, X.; Xiong, Y.; Gray, D.J.; He, M.-X. Variability of relationship between the volume scattering function at 180° and the backscattering coefficient for aquatic particles. Appl. Opt. 2020, 59, C31–C34. [Google Scholar] [CrossRef] [PubMed]
  57. Zhang, X.; Hu, L.; Xiong, Y.; Huot, Y.; Gray, D. Experimental Estimates of Optical Backscattering Associated With Submicron Particles in Clear Oceanic Waters. Geophys. Res. Lett. 2020, 47, e2020GL087100. [Google Scholar] [CrossRef]
  58. Zhao, Y.; Poulin, C.; Mckee, D.; Hu, L.; Agagliate, J.; Yang, P.; Zhang, X. A closure study of ocean inherent optical properties using flow cytometry measurements. J. Quant. Spectrosc. Radiat. Transf. 2020, 241, 106730. [Google Scholar] [CrossRef]
  59. Hu, L.; Zhang, X.; Xiong, Y.; He, M.-X. Calibration of the LISST-VSF to derive the volume scattering functions in clear waters. Opt. Express 2019, 27, A1188–A1206. [Google Scholar] [CrossRef]
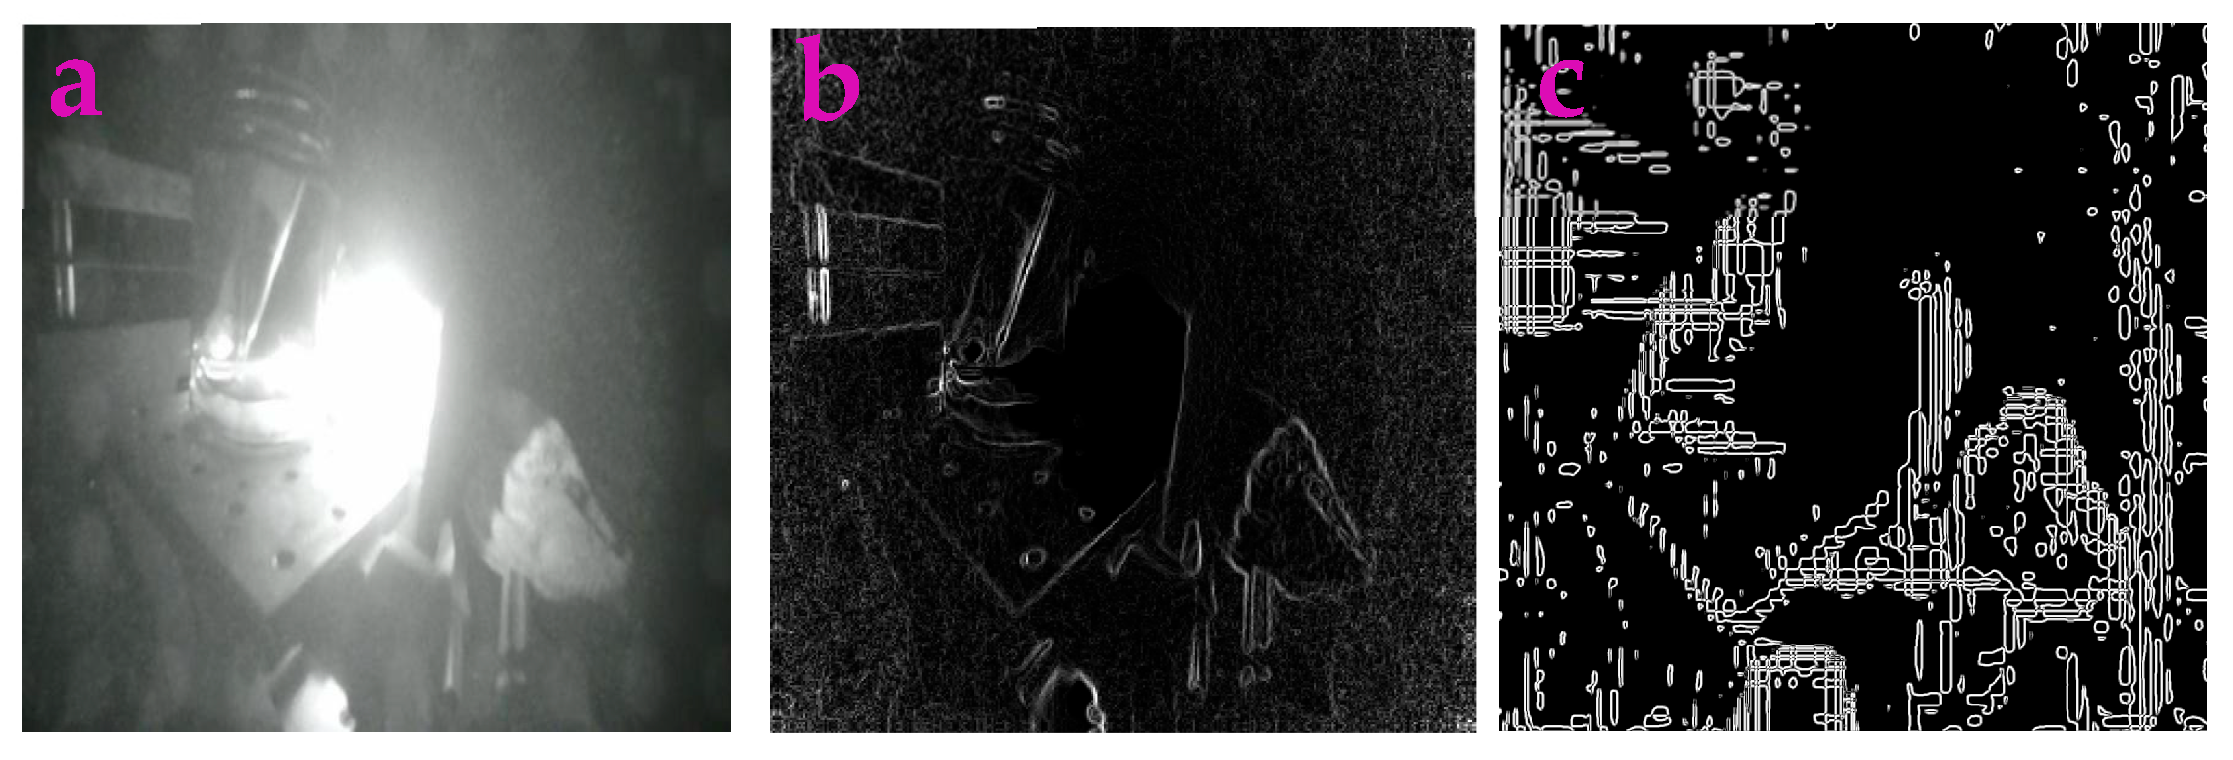
Figure 1. An image acquired from the near infrared camera was used for processing. (a) An image named Bottle was acquired from the near infrared camera. (b) The Atanh filter was applied to process the image Bottle. (c) The Sech filter was applied to process the image Bottle.
Applsci 15 11289 g001
Figure 2. Several traditional operators were used to process the image Bottle. (a) Canny operator. (b) Roberts operator. (c) Log operator. (d) Sobel operator. (e) Prewitt operator.
Applsci 15 11289 g002
Figure 3. An image acquired from the near infrared camera was used for processing. (a) An image named Nir34 was acquired from the near infrared camera. (b) The Atanh filter was applied to process the image Nir34. (c) The Sech filter was applied to process the image Nir34.
Applsci 15 11289 g003
Figure 4. Several traditional operators were used to processed the image Nir34. (a) Canny operator. (b) Roberts operator. (c) Log operator. (d) Sobel operator. (e) Prewitt operator.
Applsci 15 11289 g004
Figure 5. An image acquired from the near infrared camera was used for processing. (a) An image named Nir35 was acquired from a near infrared camera. (b) The Atanh filter is applied to process the image Nir35. (c) The Sech filter was applied to process the image Nir35.
Applsci 15 11289 g005
Figure 6. Several traditional operators were used to process the image Nir35. (a) Canny operator. (b) Roberts operator. (c) Log operator. (d) Sobel operator. (e) Prewitt operator.
Applsci 15 11289 g006
Figure 7. An image acquired from the near infrared camera was processed by two filters. (a) A sample image Nir36, and its filtered versions by the (b) Atanh filter (c) and Sech filter.
Applsci 15 11289 g007
Figure 8. The sample image Nir36 was processed by the (a) Canny operator, (b) Roberts operator, (c) Log operator, (d) Sobel operator, and (e) Prewitt operator.
Applsci 15 11289 g008
Figure 9. An image acquired from the near infrared camera was processed by two filters. (a) A sample image Nir37, and its filtered versions by the (b) Atanh filter (c) and Sech filter.
Applsci 15 11289 g009
Figure 10. The sample image Nir37 was used by the (a) Canny operator, (b) Roberts operator, (c) Log operator, (d) Sobel operator, and (e) Prewitt operator.
Applsci 15 11289 g010
Figure 11. Five sample images acquired from underwater environment were used for processing. (a) Water26. (b) Water27. (c) Water30. (d) Water32. (e) Water38.
Applsci 15 11289 g011
Figure 12. The output of underwater images processed by the Atanh filter. (a) Water26. (b) Water27. (c) Water30. (d) Water32. (e) Water38.
Applsci 15 11289 g012
Figure 13. The output of underwater images processed by the Sech filter. (a) Water26. (b) Water27. (c) Water30. (d) Water32. (e) Water38.
Applsci 15 11289 g013
Figure 14. The output of underwater images processed by the Sobel operator. (a) Water26 processed. (b) Water27 processed. (c) Water30 processed. (d) Water32 processed. (e) Water38 processed.
Applsci 15 11289 g014
Figure 15. Weak-light image processing was compared using various filters. (a) A weak-light image Baggage, and its filtered versions processed by the (b) Atanh filter, (c) Sech filter, (d) a matched filter, and (e) a filter based on Retinex theory.
Applsci 15 11289 g015
Figure 16. Weak-light image processing was compared using various filters. (a) A weak-light image Weak97, and its filtered versions processed by the (b) Atanh filter, (c) Sech filter, (d) a matched filter, and (e) a filter based on Retinex theory.
Applsci 15 11289 g016
Figure 17. Weak-light image processing was compared by using various filters. (a) A weak-light image Weak43 and its filtered versions processed by the (b) Atanh filter, (c) Sech filter, (d) a matched filter, and (e) a filter based on Retinex theory.
Applsci 15 11289 g017
Figure 18. Weak-light image processing was compared by using various filters. (a) A weak-light image Weak79, and its filtered versions processed by the (b) Atanh filter, (c) Sech filter, (d) a matched filter, and (e) a filter based on Retinex theory.
Applsci 15 11289 g018
Figure 19. Weak-light image processing was compared by using various filters. (a) A weak-light sample image Weak81 and its filter versions processed by the (b) Atanh filter, (c) Sech filter, (d) a matched filter, (e) and a filter based on Retinex theory.
Applsci 15 11289 g019
Figure 20. Two images were used for image fusion. (a) A sample image called Stone. (b) Another sample image called Wintersweet.
Applsci 15 11289 g020
Figure 21. Image fusion using the Atanh filter with different values of n. It can show a different fusion impact when n is varied: (a) n = 2; (b) n = 6; (c) n = 8; (d) n = 12.
Applsci 15 11289 g021
Figure 22. Image fusion was completed using the Sech filter with different values of m. It can show a different fusion impact when m is varied: (a) m = 2; (b) m = 22. (c) m = 42. (d) m = 62.
Applsci 15 11289 g022
Figure 23. Detecting the edge. (a) A sample image, Shape, and its filtered versions processed by (b) the Atanh filter, (c) Sech filter, (d) Log operator, (e) Prewitt operator, (f) Canny operator, (g) Sobel operator, and (h) Roberts operator.
Applsci 15 11289 g023
Figure 24. An image that contained an array was detected. (a) A sample image called Shape2 and its filtered versions processed by the (b) Atanh filter, (c) Sech filter, (d) Log operator, (e) Prewitt operator, (f) Canny operator, (g) Sobel operator, and (h) Roberts operator.
Applsci 15 11289 g024
Figure 25. Flowchart of the filters.
Applsci 15 11289 g025
Figure 26. As a comparative study, the images were processed by wavelet analysis. Their outputting profiles were shown when using various sample images. (a) Baggage processed. (b) Weak97 processed. (c) Weak43 processed. (d) Weak79 processed. (e) Weak81 processed. (f) Bottle processed. (g) Nir34 processed. (h) Nir35 processed. (i) Nir36 processed. (j) Nir37 processed. (k) Water26 processed. (l) Water27 processed. (m) Water30 processed. (n) Water32 processed. (o) Water38 processed.
Applsci 15 11289 g026
Figure 27. As a comparative study, the images were processed by wavelet package analysis. Their outputting profiles were shown when using various input images: (a) Baggage. (b) Weak97. (c) Weak43. (d) Weak79. (e) Weak81. (f) Bottle. (g) Nir34. (h) Nir35. (i) Nir36. (j) Nir37. (k) Water26. (l) Water27. (m) Water30. (n) Water32. (o) Water38.
Applsci 15 11289 g027
Table 1. Evaluation of the filters and the operators for the image Bottle.
Filters/OperatorsMERunning TimeMemory Usage SNRPSNRNMSE
Atanh65.46370.996 s728.9 MB0.314024.37940.9302
Sech11.41791.009 s602.3 MB0.778424.84380.8359
Canny00.199 s520.3 MB024.06541
Roberts00.172 s510.3 MB024.06541
Log00.253 s510.4 MB024.06541
Sobel00.135 s487.1 MB024.06541
Prewitt00.143 s503.6 MB024.06541
Table 2. Evaluation of the filters and the operators for the image Nir34.
Filters/OperatorsMERunning TimeMemory UsageSNRPSNRNMSE
Atanh9.92361.097 s785.4 MB2.920928.83810.5104
Sech32.09961.049 s643.0 MB3.051128.96820.4953
Canny00.178 s515.5 MB0.001925.91910.9996
Roberts00.135 s516.2 MB6.7269 × 10−525.91731
Log00.149 s515.9 MB0.009425.92660.9978
Sobel00.140 s516.5 MB5.4751 × 10−525.91721
Prewitt00.134 s540.3 MB5.1612 × 10−525.91721
Table 3. Evaluation of the filters and the operators for the image Nir35.
Filters/OperatorsMERunning TimeMemory UsageSNRPSNRNMSE
Atanh9.29011.128 s781.6 MB1.00626.92320.7932
Sech13.40651.019 s652.4 MB0.405924.47130.9108
Canny00.171 s529.1 MB024.06541
Roberts00.132 s540.4 MB024.06541
Log00.163 s537.9 MB024.06541
Sobel00.139 s523.1 MB024.06541
Prewitt00.135 s527.6 MB024.06541
Table 4. Evaluation of the filters and the operators for the image Nir36.
Filters/OperatorsMERunning TimeMemory UsageSNRPSNRNMSE
Atanh9.78941.104 s612.1 MB0.034924.10030.9920
Sech18.40001.120 s484.2 MB1.438025.50340.7181
Canny00.169 s370.8 MB024.06541
Roberts00.132 s365.1 MB024.06541
Log00.139 s374.8 MB024.06541
Sobel00.138 s376.8 MB024.06541
Prewitt00.134 s387.9 MB024.06541
Table 5. Evaluation of the filters and the operators for the image Nir37.
Filters/OperatorsMERunning TimeMemory UsageSNRPSNRNMSE
Atanh9.78941.121 s658.9 MB0.042724.10810.9902
Sech18.40001.046 s525.1 MB0.971725.03710.7998
Canny00.160 s397.7 MB024.06541
Roberts00.130 s397.6 MB4.2977 × 10−724.06541
Log00.139 s397.4 MB024.06541
Sobel00.152 s397.2 MB024.06541
Prewitt00.138 s396.9 MB4.2977 × 10−724.06541
Table 6. Evaluation of the processing of underwater images via the Atanh filter.
ParametersWater26Water27Water30Water32Water38
ME15.98863.31473.119719.53367.8664
Running time4.229 s1.918 s2.163 s2.006 s1.697 s
Memory usage771.7 MB771.8 MB771.9 MB772.2 MB772.7 MB
SNR0.22710.05840.08780.12030.9862
PSNR24.292524.123824.153324.185725.0570
NMSE0.94900.98660.98000.97270.7969
Table 7. Evaluation of the processing of underwater images via the Sech filter.
ParameterWater26Water27Water30Water32Water38
ME6.58043.41545.21776.16866.5603
Running time1.291 s1.282 s1.178 s1.138 s1.192 s
Memory usage533.2 MB532.9 MB533.7 MB533.8 MB529.0 MB
SNR0.97150.46980.72340.89790.9384
PSNR25.036924.535224.78924.963325.0092
NMSE0.79960.89750.84660.81320.8057
Table 8. Evaluation of the processing of underwater images via the Sobel operator.
ParametersWater26Water27Water30Water32Water38
ME00000
Running Time0.9 s0.809 s0.852 s0.836 s0.619 s
Memory usage418.8 MB406.6 MB406.8 MB406.9 MB387.9 MB
SNR00006.1607 × 10−5
PSNR24.065424.065424.065524.065424.0709
NMSE11111
Table 9. Evaluation of the filters for the image Baggage.
FiltersMERunning TimeMemory UsageSNRPSNRNMSE
Atanh65.37931.004 s539.6 MB3.100631.57500.4897
Sech17.48310.994 s461.7 MB1.632830.10710.6866
matched 00.271 s356.3 MB7.887636.36190.1626
Retinex2.45100.321 s362.8 MB0.482228.94750.8949
Table 10. Evaluation of the filters for the image Weak97.
FiltersMERunning TimeMemory Usage SNRPSNRNMSE
Atanh11.69511.050 s585.1 MB9.254139.80310.1187
Sech18.27410.759 s494.9 MB3.488234.03730.4479
matched 00.338 s372.8 MB10.438540.98750.0904
Retinex5.94030.455 s366.3 MB48.787779.33681.3220 × 10−5
Table 11. Evaluation of the filters for the image Weak43.
FiltersMERunning TimeMemory UsageSNRPSNRNMSE
Atanh15.06680.970 s574.4 MB11.44652.90.0717
Sech15.72410.787 s496.4 MB4.484545.93860.3561
matched 00.224 s365.0 MB19.988061.44210.0100
Retinex14.35340.240 s364.3 MB23.753165.20710.0042
Table 12. Evaluation of the filters for the image Weak79.
FiltersMERunning TimeMemory UsageSNRPSNRNMSE
Atanh17.36301.182 s580.9 MB8.1247 46.78100.1540
Sech25.79160.770 s494.8 MB6.421745.07810.2279
matched 00.285 s367.8 MB10.174748.83100.0961
Retinex4.43290.394 s364.3 MB54.169192.82553.8290 × 10−6
Table 13. Evaluation of the filters for the image Weak81.
FiltersMERunning TimeMemory UsageSNRPSNRNMSE
Atanh14.82501.021 s571.5 MB10.666653.16070.0858
Sech10.0528 0.771 s495.4 MB3.710346.20440.4256
matched 00.242 s365.1 MB18.641861.13590.0137
Retinex4.88910.249 s363.0 MB37.563980.05801.7523 × 10−4
Table 14. Evaluation of the performance of image fusion for the Atanh filter.
Parametersm = 2m = 22m = 42m = 62
NMSE0.02620.02530.01450.0098
SNR15.811915.965518.377820.1049
PSNR39.877340.030942.443244.1703
Table 15. Evaluation of the performance of image fusion for the Sech filter.
Parametersn = 2n = 6n = 8n = 12
NMSE0.00700.00280.00230.0179
SNR21.518825.595226.380617.4633
PSNR45.584249.660650.446041.5287
Table 16. Typical running time of the filters for the images.
ImagesAtanhSech
Leaf11.440 s1.109 s
Leaf21.300 s1.109 s
Leaf31.333 s1.102 s
Leaf41.286 s1.101 s
Leaf51.316 s1.092 s
Water261.268 s1.092 s
Water271.254 s1.123 s
Water301.310 s1.200 s
Water321.269 s1.103 s
Water380.982 s1.022 s
Shape20.969 s1.001 s
Disclaimer/Publisher’s Note: The statements, opinions and data contained in all publications are solely those of the individual author(s) and contributor(s) and not of MDPI and/or the editor(s). MDPI and/or the editor(s) disclaim responsibility for any injury to people or property resulting from any ideas, methods, instructions or products referred to in the content.