Article

Evaluation of the Differences Between Home and Away Matches Depending on GPS Data from a Senior Professional Football Team in the Turkish Super League

by
Betul Coskun
1,* and
Mustafa Cebel Torun
2
1
Faculty of Sport Sciences, Erciyes University, 38039 Talas, Türkiye
2
Institute of Health Sciences, Erciyes University, 38039 Talas, Türkiye
*
Author to whom correspondence should be addressed.
Appl. Sci. 2025, 15(20), 11275; https://doi.org/10.3390/app152011275
Submission received: 29 August 2025 / Revised: 7 October 2025 / Accepted: 13 October 2025 / Published: 21 October 2025
(This article belongs to the Special Issue Advanced Studies in Ball Sports Performance)

Abstract

This study aimed to define performance characteristics of elite male football players in the Turkish Super League in 2024–2025 according to playing positions, evaluate advantages/disadvantages, and reveal the differences between home and away matches. GPS data were selected from those who played at least 1 match out of the 12 matches (eight home + four away) for at least 80 min. While 13 players had at least one match with a minimum of 80 min of data for both home and away games, 5 players had it only for either home or away games. The distance covered by wingers at a speed of 20–25 km/h was greater than center backs. Distance covered by wingers at a speed higher than 25 km/h was greater than that covered by center backs, central midfielders, and strikers. We found no home advantage (41.7%) or away disadvantage (28.6%). However, the variables of distance for 20–25 km/h and >25 km/h were higher in away matches than in home matches. A distance of >25 km/h and acceleration distance have a moderate to strong relationship with assist and goal numbers, respectively (p < 0.05). Our results confirmed that different physical demands were required for playing positions and showed that high-speed running and sprint performance variables differed by match location.

1. Introduction

Coaches need to have a thorough understanding of the required physical activity levels and performance needs in competitions to organize effective training regimens for athletes [1]. Global positioning system (GPS) measurement technology has been widely used recently to obtain complete knowledge of various performance parameters during training and competitions, by supplying data such as total distance, high-speed running and low-speed running distance, and number of sprints [1,2].
High-intensity team sports like football have a complex nature requiring strength, power, agility, and well-developed speed, as well as technical skills and decision-making. Therefore, it is crucial for coaches to understand the performance elements and workloads of a real match and to program training sessions that mimic the demands of the game [3]. Tracking the players in football allows the training load to be monitored and helps decide if athletes comply with the implemented training program, making player tracking data crucial for analyzing performance, particularly in football [4]. However, solely determining the overall physical demands of football matches is not sufficient to design effective training programs.
Since the physical profiles also vary across playing positions [5], it would be more accurate to assess the physical demands of a match based on playing positions. Specifically, high-speed running and sprinting distances are highly important factors for a successful performance, and high-speed running was found to be affected by player positions [6]. In fact, it is reported that there are performance differences not only according to playing positions but also according to playing positions by match locations: home and away fields. For instance, it was found that strikers performed more high-speed running at home matches than away [6]. Also, in the same study, while center midfielders and attacking midfielders were found to have the highest high-metabolic-load distance at their home field, wide backs and center backs had some of the lowest high-metabolic-load distances [6]. In another study, all players were found to have higher acceleration efforts at home than in away matches [7]. In professional football players, playing position and match location are reported to influence the number of high-intensity efforts even more than the quality of the opponent [7].
While many studies have been conducted solely on differences in player positions [4,8,9,10,11,12] or game locations [2,13,14,15,16,17,18], our study is one of the few that evaluate both [5,6,7].
In football, a home advantage, which can potentially arise due to factors such as referee bias, less travel fatigue, fan support, familiarity with local conditions, specific (e.g., defensive) tactics, and psychological factors such as believing in a home advantage, has always been accepted as an essential element in deciding the result of a match [19]. Home advantage refers to the tendency for a team to perform better in their home games than in away games [20]. Football is one of the sports where this advantage has been most extensively studied [20], and some studies found it had the highest home advantage effect among major team sports [19].
Many studies have evaluated this home advantage or away disadvantage based on the number of goals or the match statistics of the various football teams [21,22,23], but other factors, which can be related to technical and tactical performance elements, should be included in the evaluation [15,24]. Therefore, we evaluated home advantage/away disadvantage by considering both the number of goals scored in our team’s matches and the performance variables derived from GPS data of those same matches. Additionally, while numerous studies conducted on football leagues or teams in various countries are available [5,6,13,25,26,27], it is still necessary to examine Turkish football from all these aspects.
This study aimed to define the physical performance characteristics of the elite male football players based on GPS data from the matches in the Turkish Super League in the 2024–2025 season according to playing positions, to evaluate home advantage and away disadvantage, to determine the performance differences between the home and away matches, and to examine the relationship of the performance variables of the GPS data to match outcomes.

2. Materials and Methods

2.1. Participants

This study used GPS data and match results from the senior team players (n = 19) of a professional men’s football team competing in the Turkish Football Federation’s Super League for the 2024–2025 season. These 19 volunteer individuals were selected from the ones who had not suffered a serious injury or surgery during the season, and who allowed their match data to be used for the academic purposes of our research. All data were acquired from the results of 8 home and 4 away matches played between 2 November 2024 and 8 March 2025. All matches were one match played against each different opponent, meaning no opponent was played twice by our team during this period. Data were selected from those who played at least 1 match out of these 12 matches for at least 80 min. One player was not included in the analysis, since he did not complete 80 min in at least one game. Of the remaining 18 players, 13 had at least one match with at least 80 min of data recorded at both home and away games, and 5 players had at least one match with at least 80 min recorded, either only at a home game or an away game. For those who had ≥80 min of GPS record in more than one match, the average of their matches was used in the analyses. Playing position comparisons were applied to data from 18 people and home and away comparisons from 13 people (Figure 1). Ethics committee approval was received for this study from the Erciyes University Health Sciences Research Ethics Committee with decision number 2025/353, dated 9 July 2025.

2.2. Study Design

This is a retrospective study evaluating the performance characteristics derived from GPS data of a football team playing in Turkish Super League football matches in 2024–2025. The data used in the study are competition data, which the athletic performance coach routinely records during matches as part of the performance analysis. Written informed consent was obtained from all participants after they were informed about the purpose of the study, data collection procedures, and that the data would be anonymized.
GPS data was collected with a Catapult Vector X7 GPS, Melbourne, Australia. The data was digitized and recorded using Catapult OpenField Software (Operator Console Version 3.13.0). GPS devices were placed on the interscapular area of the athletes, on their vests, and activated five minutes before and deactivated immediately after the matches. Among the variables derived from the GPS device, total time (min), total distance (m), high-speed running distance (m) (distance for 20–25 km/h), sprint distance (m) (distance for >25 km/h), acceleration distance (m), deceleration distance (m), total player load (total workload over a match, which represents the total of accelerations in all axes of the tri-axis accelerometer while in motion and includes forward acceleration, sideways acceleration, and upward acceleration in its formula) [28], and total distance for high metabolic power (m) (distance at an energy cost exceeding 25.5 W/kg, which is equal to the energy while running at a constant velocity of 5.5 m/s) [29] were used in the analysis of this study.
In addition, we evaluated the home advantage and away disadvantage based on the number of goals. Home advantage and away disadvantage have been calculated in some studies by a ratio of the total number of goals. For instance, home advantage is estimated by calculating the ratio of the total number of goals scored by a team in its home matches to the overall number of goals (including the opponents’ goals) in that home field. A value greater than 50% means that the team has a home advantage. The away disadvantage is estimated by calculating the ratio of the total number of goals conceded in its away matches to the overall number of goals (including the opponents’ goals) in all away matches. A value greater than 50% indicates that the team has an away disadvantage [22,30].

2.3. Statistical Analysis

Performance characteristics derived from GPS results obtained from the matches were presented with descriptive statistics through mean and standard deviation, according to playing positions. By checking the normal distribution assumption with the Shapiro–Wilk test, the performance differences between the home and away games were analyzed with a paired samples t-test and/or the Wilcoxon signed-rank test. A two-way mixed ANOVA (location × position) (location: home and away fields) (playing positions: winger, center back, central midfielder, and fullback) was used to examine whether playing positions differed in performance between home and away matches (applied to the data of 13 players who played in both locations). The performance difference according to playing positions based on the total number of participants (n = 18) was determined by one-way ANOVA. The correlations between the variables were examined using Pearson and Spearman correlation analysis, based on the assumption of a normal distribution. The correlations were evaluated by the classification as follows: negligible (r < 0.1), small (r > 0.1 to 0.3), moderate (r > 0.3 to 0.4), strong (r > 0.5 to 0.7), very strong (r > 0.7 to 0.9), nearly perfect (r > 0.9), and perfect (r = 1.0) [31]. The significance level was considered <0.05. All statistical analyses were performed using SPSS 30 (SPSS Inc., Chicago, IL, USA).

3. Results

3.1. Results for Playing Position Differences

The mean age of the 18 players whose GPS records were analyzed to compare position differences was 29.6 ± 4.2 years. The age of 13 of those players whose data were used to analyze the differences between home and away, was 30.9 ± 2.7 years. To show the differences in performance characteristics between the playing positions, ANOVA results are given in Table 1.
Evaluating the multiple comparison tests, the distance covered by wingers at a speed of 20–25 km/h was significantly greater than that covered by the center backs (p = 0.014). The distance covered by wingers at a speed higher than 25 km/h was also significantly greater than that covered by the center backs (p = 0.003), central midfielders (p = 0.016), and strikers (p = 0.05). As for the deceleration distance, fullbacks showed significantly higher results than center backs (p = 0.008). No significant difference was observed after Bonferroni correction in total distance for high metabolic power (p > 0.05).

3.2. Results for Match Location Differences

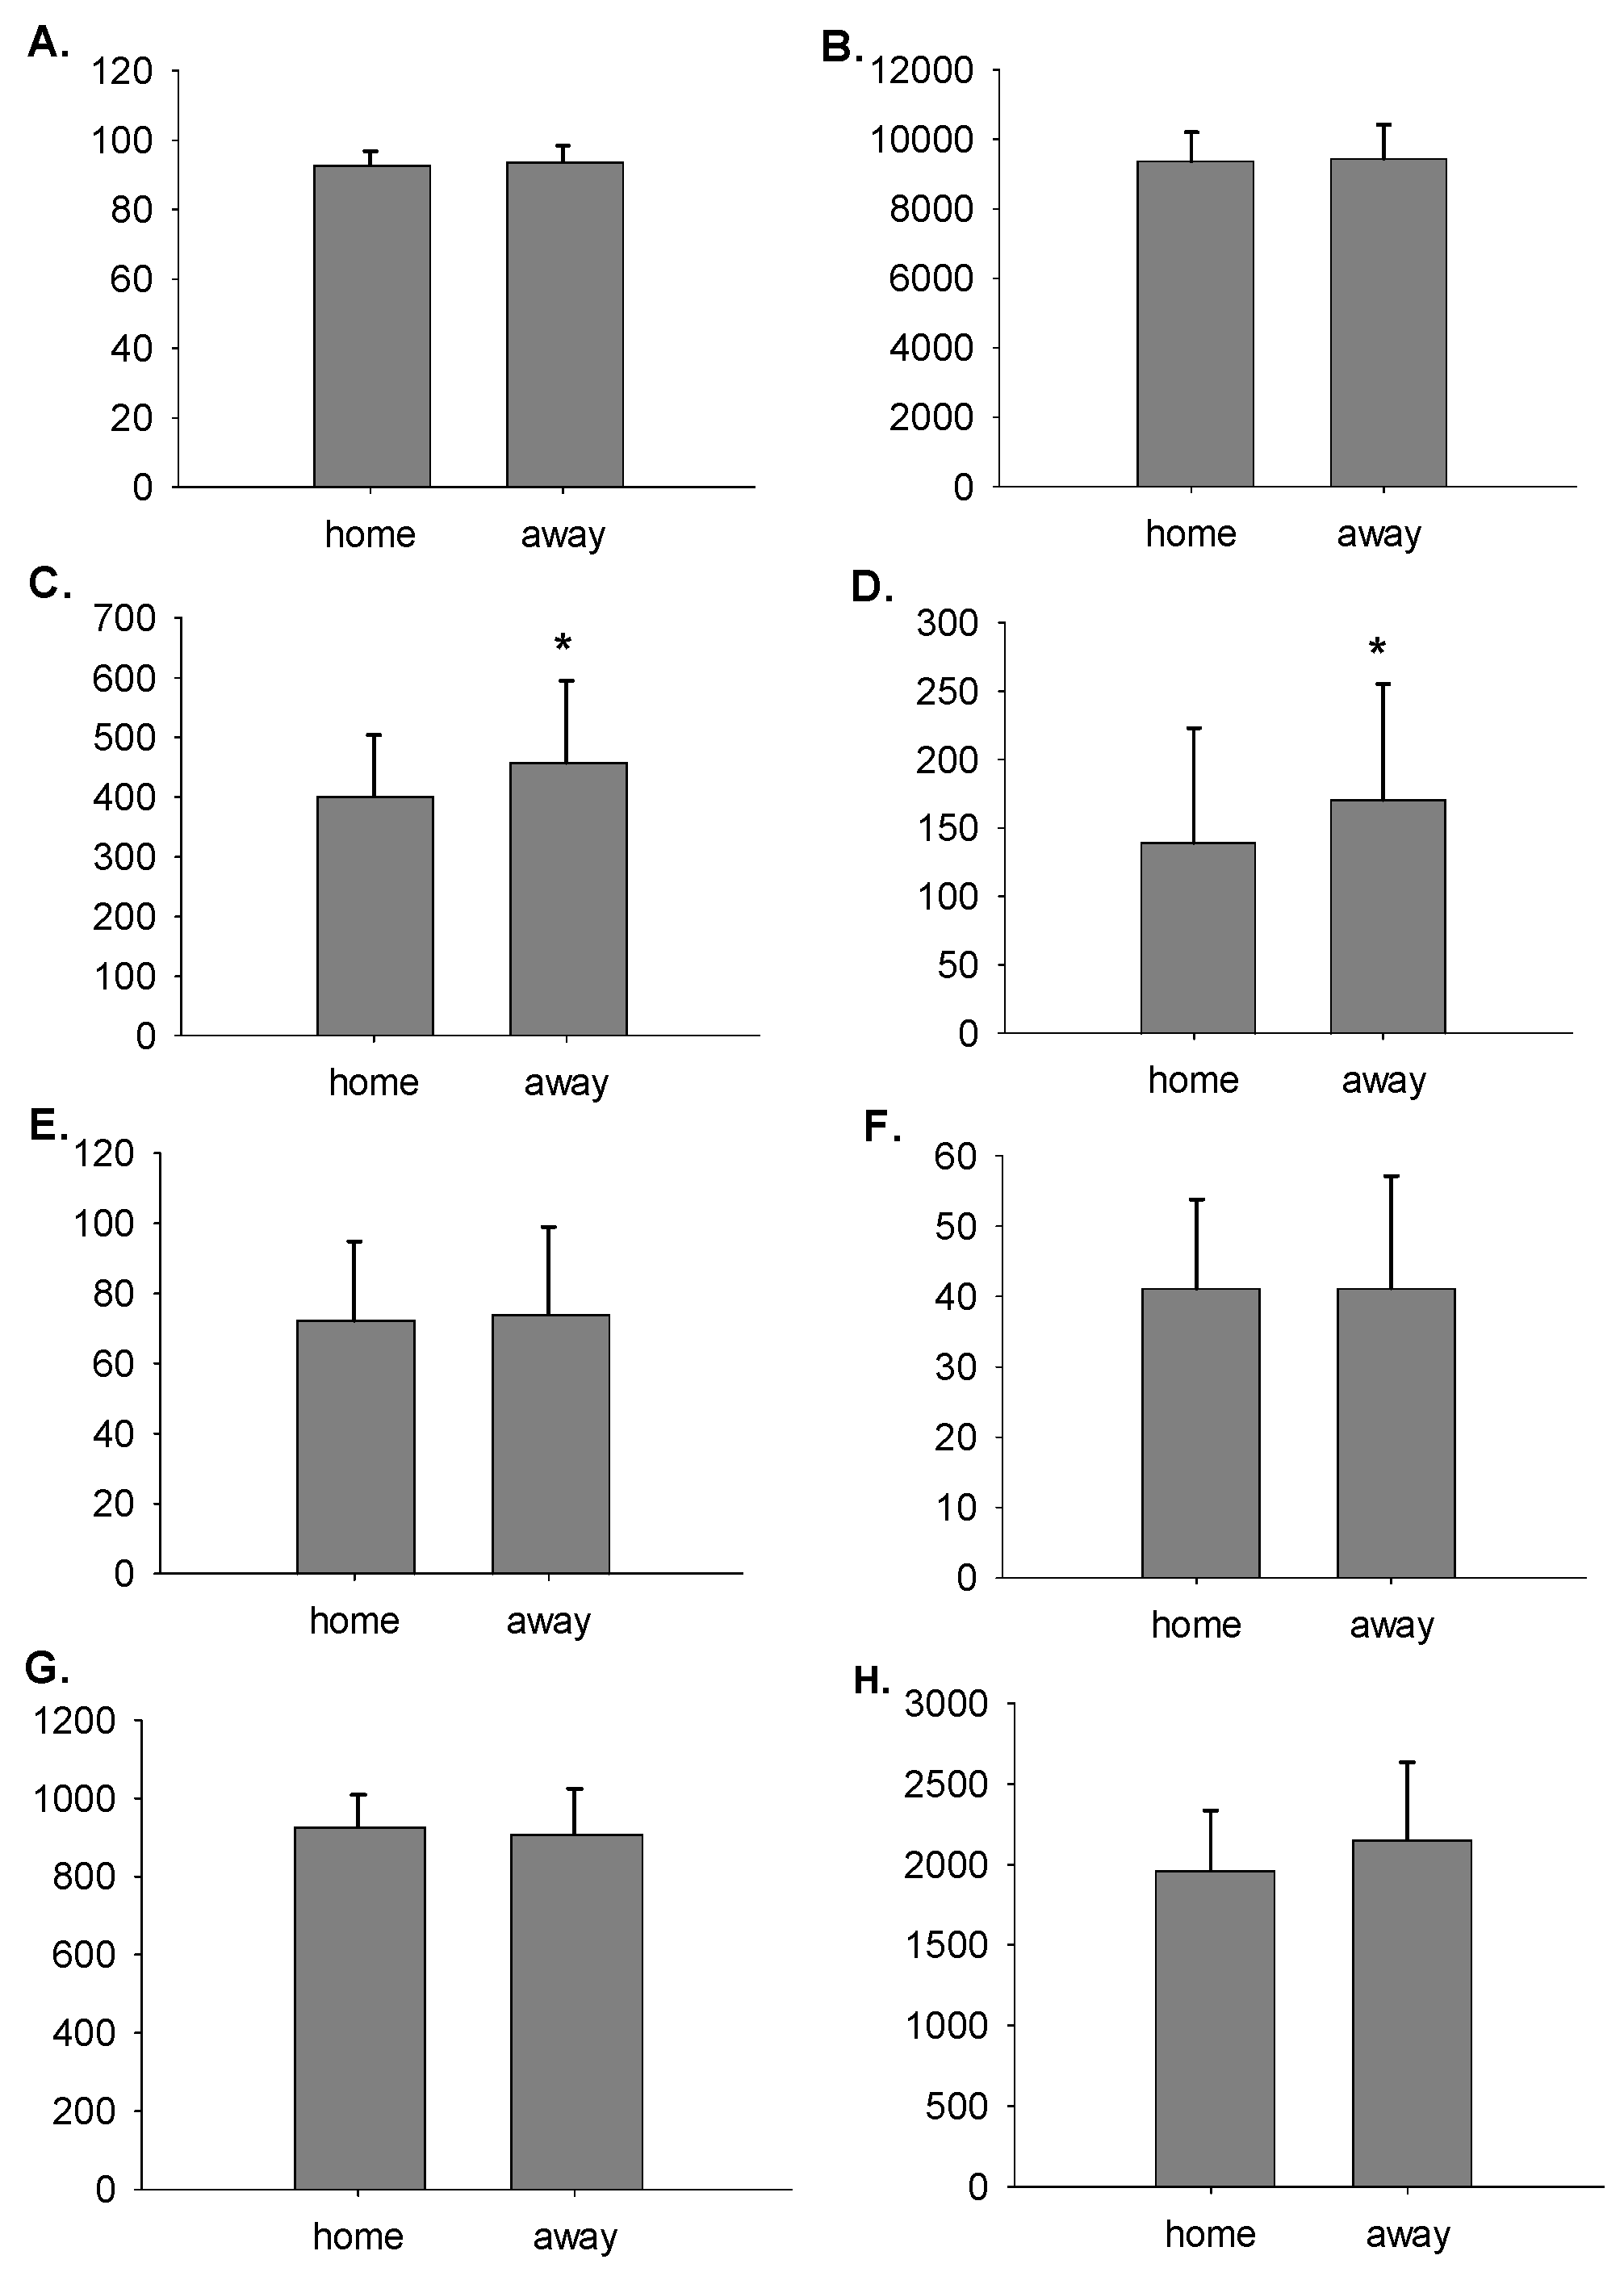
Our home advantage value was calculated as 41.7%, and the away disadvantage value was calculated as 28.6%, both of which were below 50%. On the other hand, as a result of the paired samples t-test and the Wilcoxon signed-rank test, performance differences between home and away are shown in Figure 2. Only the variables of the distance (m) for 20–25 km/h (p = 0.04) and the distance (m) for > 25 km/h (p = 0.05) were significantly higher in away matches than in home matches (Figure 2).
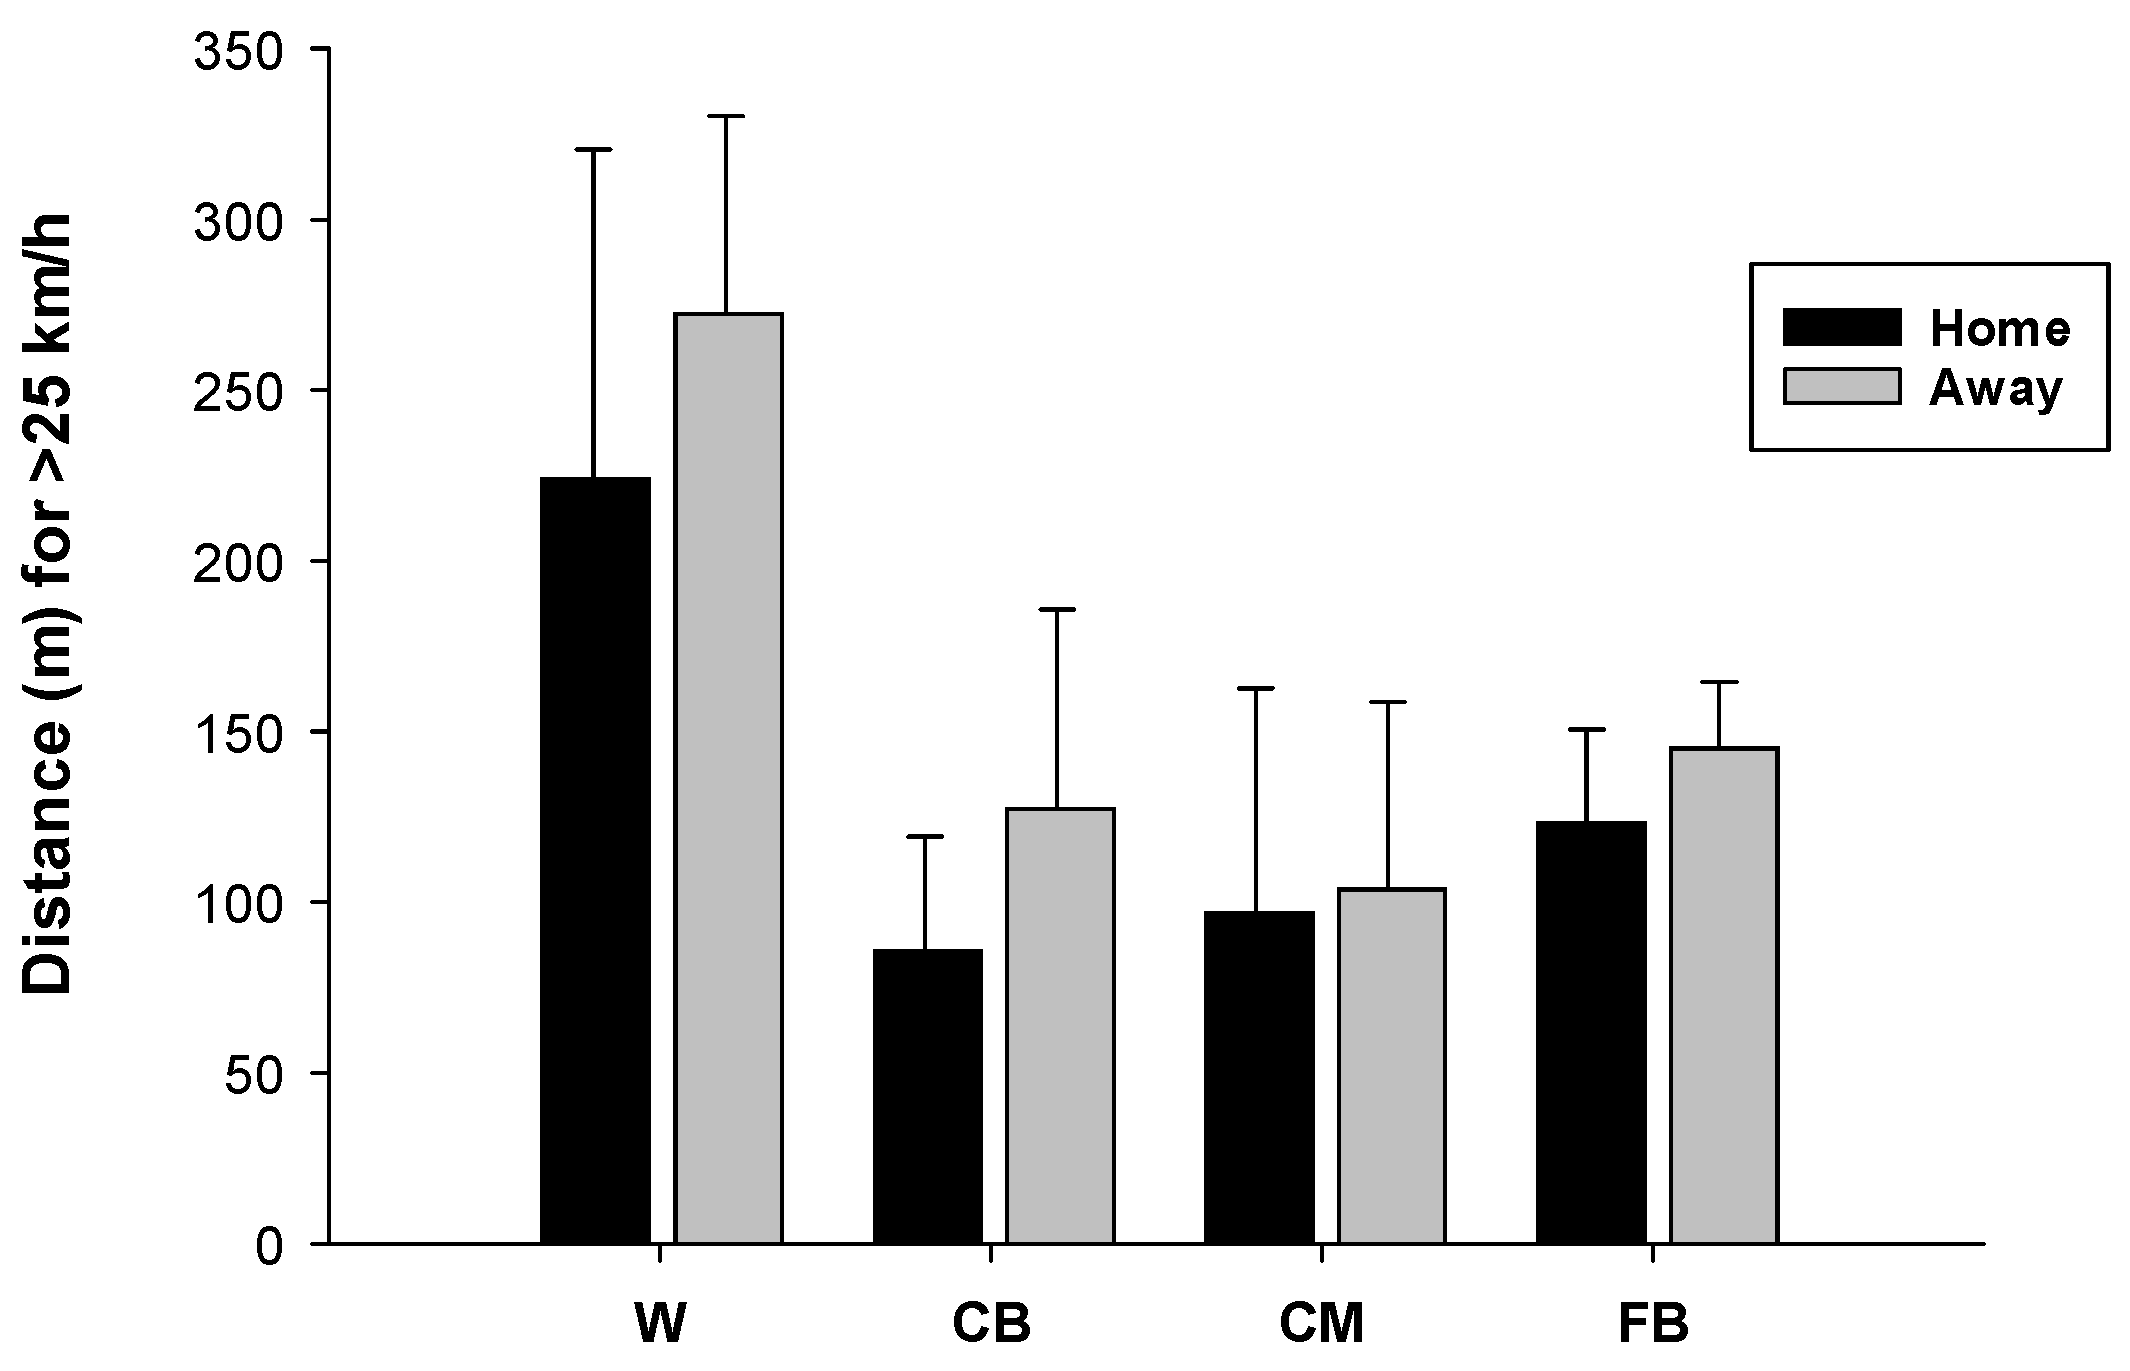
According to the mixed-ANOVA results, no significant result was found for variables except for the sprint distance (distance for >25 km/h). For the sprint distance variable, only the playing position’s main effect was found to be significant (p = 0.013, partial η2 = 0.68), but according to the results of pairwise comparisons with the Bonferroni correction, no significant difference was found between home and away match results for any playing position (p > 0.05) (Figure 3).

3.3. Results for Correlations

Correlations among GPS variables and the relationship with match outcomes are presented in Table 2. The variables of distance for >25 km/h (m) and acceleration distance have a moderate-to-strong relationship with assist and goal numbers, respectively (p < 0.05).

4. Discussion

This study was conducted to firstly define the physical performance characteristics of the GPS results from the matches in which male elite football players in the Turkish Super League played in the 2024–2025 season, according to playing positions; secondly, to evaluate home advantage and away disadvantage and to determine the performance differences between the home and away matches; and lastly, to examine the relationship of the performance variables of the GPS data to match outcomes. Among the results of these objectives, the most remarkable finding was the one regarding away matches. We did not observe a home advantage or an away disadvantage based on the ratio of goals scored in the matches, but we found distance covered at speeds of 20–25 km/h and >25 km/h in the away matches significantly higher than in the home matches.
For the first aim of this study, we found that wingers were the ones who covered the most distance in terms of total distance and even the distance at speeds of 20–25 km/h and above 25 km/h, and the center backs were the ones who covered the least distance. Although there was no statistically significant difference between playing positions in acceleration distance, wingers represented the highest value after strikers. For deceleration distance, wingers had the most nonsignificant but highest value, while fullbacks had the second-highest deceleration distance, which was significantly higher than center backs. Although statistically insignificant, those with the highest total player load were central midfielders, followed by wingers. In terms of the total distance for high metabolic power, the highest value belonged to fullbacks, followed by wingers. Though we did not observe any performance difference for playing position between home and away, our findings confirmed that performance characteristics differ for playing positions regardless of match location, contrary to the results related to location in the study of Barrera, Sarmento [32] and Miguel, Oliveira [33]. However, overall, the literature is in line with our results for performance differences for playing positions [9,32,34].
Similarly to our study, Borghi, Colombo [9] noted that wingers covered the longest distance at very high speeds. Open attackers were found to have the highest high- and very-high-speed distances, and also found to be the fastest players with center forwards in the study of Barrera, Sarmento [32]. Morgans, Radnor [34] also found that attacking midfielders had more distance when sprinting and high-speed running than others. These results support our findings for wingers and strikers of our study. Our findings, especially regarding center backs, are also consistent with different study results. While Morgans, Radnor [34] noted that center backs had lower high-speed running distances than other playing positions, Barrera, Sarmento [32] and Borghi, Colombo [9] reported that they had the lowest total distance. Regarding deceleration, Morgans, Radnor [34] found, similarly to us, that full backs performed more decelerations than center backs.
According to our second set of results, which focused on the difference between home and away matches, no difference was found in terms of total time and total distance, but the distance covered at speeds of 20–25 km/h and >25 km/h in the away matches was found to be significantly higher than in the home matches. Although not statistically significant, the total distance for high metabolic power was found to be higher in the away matches compared to the home matches, while total player load was found to be higher in the home matches compared to the away matches.
While previous studies have mentioned the existence of home advantage or away disadvantage by making evaluations of various football teams [15,21,22,23], we found no advantage or disadvantage when we evaluated the match scores (goal counts) of an individual team in the league, which we were able to include in our current study. However, since potential factors related to technical and tactical performance elements were suggested for inclusion in the evaluation [15,24], when we examined the GPS data, we observed that sprint performance elements were higher in away games, which is the most impressive finding in our study. In our evaluation based on the number of goals, we found no home advantage (41.7%, which is less than 50%), as well as no away disadvantage (28.6%, which is less than 50%); on the contrary, we found that significantly more speed runs were made when away than at home. On the other hand, Del Coso, Brito de Souza [35] emphasized the number of wins at away matches as the most evident reason for the performance difference between the first (winner) and second-place teams, in their study conducted on the Spanish National Football Championship. Though this result supports the importance of away performances, it is difficult to make an assessment based solely on match wins for our study, because we have a very limited amount of game data, with eight home matches (three were wins) and four away matches (none were wins).
A previous study reported that away performance is the primary factor determining league rankings and suggested that the away disadvantage should be reduced to increase rankings [22]. The findings of our study support this suggestion. Our away disadvantage rate was below 50%, and our correlation results indicated that distance covered by running at speeds above 25 km/h and acceleration distance had a moderate-to-strong positive correlation with the number of assists and goals, respectively. We found that distances covered at speeds of 20–25 km/h and above were higher in away matches than in home matches. Therefore, increasing the distance covered at speeds, especially above 25 km/h, may decrease the away disadvantage. Although most of the studies in the literature have opposite results to our findings, because they found results in favor of home matches [2,13,24], the study of Nobari, Fani [17] supported our findings, and showed higher values for high-speed running in away matches than at home.
A study investigating football players supported the relationship of high-intensity activity with the outcome of the match, but it also concluded that playing at home showed more high-intensity activity than playing away [13]. Similarly, Carlos-Vivas, Franco-García [2] showed a positive and direct relationship between high-intensity GPS variables and team success, but the researchers also found higher high-intensity performance results at home matches compared to away matches. We also found a positive moderate-to-strong correlation between high-intensity GPS variables and match outcomes (assists and goals); however, we observed significantly higher distances for high-speed running and sprint running when playing away compared to playing at home. One of the reasons for this diversity in the study results may be the difference in game tactics when playing home and away [14].
It is known that coaches have higher expectations during home matches, using more offensive tactics and setting more challenging targets [36]. Home matches are regarded as more offensive [24,37,38], while away matches are considered more defensive [24,38]. However, Lago-Peñas and Lago-Ballesteros [15] emphasized that both the location and the quality of the team influence the performance in games and stated that superior teams and weaker teams may not exhibit the same level of home advantage. Gómez, Mitrotasios [39] also reported that the influence of the match location (home or away field) on playing styles differs according to the quality of the teams. On the other hand, another critical factor is the opponent. For instance, Lago [16] reported that match location (home/away field) does not affect a team’s possession, but that match location and opponent quality have an interaction. Gollan, Bellenger, and Norton [40] concluded that opposition quality influences playing style more than match location. For example, teams playing against a stronger opponent, even at home, are more likely to present a defensive playing style [40]. This conclusion may support our study results, as the opponent’s strength appears to have been more influential than the match location. While we lost at home against teams ranked in the top three, we lost away to teams much further down the league ranking. Also, we must have preferred to be more controlling against the top three teams we lost to [39], as we had a higher ball possession rate. Our ball possession percentage was higher than the opponent’s (53.3% vs. 46.7%) only in our home losses against these top three teams. However, overall, our possession percentage was lower than our opponents both at home (48.1% vs. 51.9%) and away (45.3% vs. 54.7%). It has been noted that match location, whether home or away, has no impact on a team’s possession rate; however, there is an interaction between opponent quality and match location [16]. On the other hand, Lago and Martín [41]’s study, which reports that teams have more possession when losing, may support our home possession result, but not our away result. At this point, another factor besides ball possession may be underlying the performance differences between home and away matches.
One of the potential factors may be the divisions of the league. Four of the eight home matches (three were wins) in our study were played in the second half of the league. The other four were first division matches, and three of them ended in losses. As for away matches, the majority (three of four) were played in the first division of the league. Home wins in the second division of the league suggested that the differences between home and away matches may be due to seasonal effects, as it was noted that athletes’ performances enhanced throughout the season and may have even increased towards the end [42]. On the contrary, Chmura, Konefał [43] found a significant decrease in the high-speed running distance at the end of the season. Because repeated or consecutive high-intensity workouts cause fatigue [43,44], high-speed running efforts may have been greater in away matches in our study, as the majority of away matches were played in the first half of the league, before potential fatigue. As for home matches, the league’s strongest team opponents in the first half and potential fatigue in the second half of the league may have prevented or reduced high-intensity efforts. Joo [44] found that short-term detraining (one week) enhanced speed endurance performance in well-trained football players. Therefore, break times or days between matches should be considered to assess the home advantage [15,44].
Having wins only at home (two draws, three wins, and three losses) in our study may suggest that we had a partial home advantage, since a home advantage may have occurred based on lack of travel fatigue, potential positive effects of a home audience or fan, familiarity with local conditions, and psychological factors such as believing in a home advantage [15,19]. However, the lack of a home advantage, in percentage terms, could be due to having strong opponents at home matches and the high number of goals we conceded. It is challenging to discuss the lack of wins when playing away because of the low number of matches. To propose all the potential reasons mentioned above, we need to base them on more match data. The low number of home and away matches, especially away games, is a serious limitation when interpreting our results.
Our results related to match location that were different from the existing literature may be attributed to differences in team quality, opponent quality, divisions of the league, or playing formation, rather than solely due to match location. Regarding our team’s quality, although we were a senior, professional, and experienced team, we played against one opponent from both home and away who was below us in the league rankings, but in the other 10 matches, all opponents were above us. Regarding other factors, we did not have data on match formations, and we used GPS data that was derived from different matches played against various opponent teams, rather than against the same opponent team at both home and away fields, to compare differences based on match location. A lack of data on playing formations, the diversity of opponent teams, and a limited number of match results were the main limitations of this study. For future research, we suggest comparing the data from the matches against the same opposing team, both home and away, evaluating the differences in terms of playing formation and between the divisions of the league, and including more performance variables and data related to more potential factors and from more matches.

5. Conclusions

In conclusion, our results confirm that different physical demands were required for playing positions in a senior male professional football team in the Super Turkish League in the 2024–2025 season, regardless of match location. As for the GPS variables, high-speed running distance and sprint distance were greater on the away field. The number of assists had a significant positive correlation with only sprint distance, and the number of goals had a significant positive correlation with only acceleration distance among the performance variables, which were moderate-to-strong. Our team did not show a home advantage or an away disadvantage with the ratio of the goal numbers from the matches. Overall, training regimens to improve the distance of sprint and acceleration efforts, and those organized according to the needs of the playing positions, may be recommended to increase the success of the match outcome. High-intensity activity and the distance of acceleration efforts may be trained more, especially in unfamiliar environments and under challenging conditions, to benefit in away games.

Author Contributions

Conceptualization, B.C. and M.C.T.; methodology, B.C. and M.C.T.; software, M.C.T.; validation, M.C.T.; formal analysis, B.C.; investigation, B.C. and M.C.T.; resources, M.C.T.; data curation, M.C.T.; writing—original draft preparation, B.C.; writing—review and editing, B.C. and M.C.T.; visualization, B.C.; supervision, B.C.; project administration, B.C. and M.C.T.; funding acquisition, B.C. and M.C.T. All authors have read and agreed to the published version of the manuscript.

Funding

This research received no external funding.

Institutional Review Board Statement

Ethics committee approval was received for this study from the Erciyes University Health Sciences Research Ethics Committee with decision number 2025/353 dated 9 July 2025.

Informed Consent Statement

Informed consent was obtained from all subjects involved in the study.

Data Availability Statement

The data that support the findings of this study are available from the corresponding author upon reasonable request.

Acknowledgments

We would like to thank the football club, coaches, and players for their participation. Grammarly and QuillBot were used for language editing in this study.

Conflicts of Interest

The authors declare no conflicts of interest.

References

  1. Bieryla, K.A.; Cook, J.; Snyder, R.C. Comparative Analysis of Activity Profiles in Division I Female Field Hockey Athletes: Before and after Game Time Modifications. Appl. Sci. 2024, 14, 6674. [Google Scholar] [CrossRef]
  2. Carlos-Vivas, J.; Franco-García, J.M.; Mendoza-Muñoz, D.M.; Gómez-Pomares, S.; Pérez-Gómez, J. High-Intensity GPS-Derived Parameters in Semi-Professional Soccer: Home vs. Away Roles of the Team and Their Relationship with the Match’s Final Score. Sensors 2024, 24, 4891. [Google Scholar] [CrossRef] [PubMed]
  3. Farrow, D.; Pyne, D.; Gabbett, T. Skill and physiological demands of open and closed training drills in Australian football. Int. J. Sports Sci. Coach. 2008, 3, 489–499. [Google Scholar] [CrossRef]
  4. De Silva, V.; Caine, M.; Skinner, J.; Dogan, S.; Kondoz, A.; Peter, T.; Axtell, E.; Birnie, M.; Smith, B. Player tracking data analytics as a tool for physical performance management in football: A case study from Chelsea football club academy. Sports 2018, 6, 130. [Google Scholar] [CrossRef]
  5. Beato, M.; Youngs, A.; Costin, A.J. The Analysis of Physical Performance During Official Competitions in Professional English Football: Do Positions, Game Locations, and Results Influence Players’ Game Demands? J. Strength Cond. Res. 2024, 38, e226–e234. [Google Scholar] [CrossRef]
  6. Chaize, C.; Allen, M.; Beato, M. Physical Performance Is Affected by Players’ Position, Game Location, and Substitutions During Official Competitions in Professional Championship English Football. J. Strength Cond. Res. 2022, 10, 1519. [Google Scholar] [CrossRef]
  7. Morgans, R.; Kweon, D.; Ryan, B.; Ju, W.; Zmijewski, P.; Oliveira, R.; Olthof, S. Playing position and match location affect the number of high-intensity efforts more than the quality of the opposition in elite football players. Biol. Sport 2024, 41, 29–37. [Google Scholar] [CrossRef]
  8. Abbott, W.; Brickley, G.; Smeeton, N.J. Physical demands of playing position within English Premier League academy soccer. J. Hum. Sport Exerc. 2018, 13, 285–295. [Google Scholar] [CrossRef]
  9. Borghi, S.; Colombo, D.; La Torre, A.; Banfi, G.; Bonato, M.; Vitale, J.A. Differences in GPS variables according to playing formations and playing positions in U19 male soccer players. Res. Sports Med. 2021, 29, 225–239. [Google Scholar] [CrossRef]
  10. Kaldaras, V.; Michailidis, Y.; Gissis, I.; Metaxas, T.I. The running performance of amateur football players in matches with a 1-4-3-3 formation in relation to their playing position and the 15-min time periods. Appl. Sci. 2024, 14, 7036. [Google Scholar] [CrossRef]
  11. Mallo, J.; Mena, E.; Nevado, F.; Paredes, V. Physical demands of top-class soccer friendly matches in relation to a playing position using global positioning system technology. J. Hum. Kinet. 2015, 47, 179. [Google Scholar] [CrossRef]
  12. Nuttouch, W.; Hemarachatanon, P.; Huntula, S. Analysis of Positional Differences in the Thai National Football Team Players’ Performance Using Global Positioning System Tracking. Phys. Educ. Theory Methodol. 2023, 23, 373–379. [Google Scholar] [CrossRef]
  13. Aquino, R.; Martins, G.H.M.; Vieira, L.H.P.; Menezes, R.P. Influence of match location, quality of opponents, and match status on movement patterns in Brazilian professional football players. J. Strength Cond. Res. 2017, 31, 2155–2161. [Google Scholar] [CrossRef]
  14. Diana, B.; Zurloni, V.; Elia, M.; Cavalera, C.M.; Jonsson, G.K.; Anguera, M.T. How game location affects soccer performance: T-pattern analysis of attack actions in home and away matches. Front. Psychol. 2017, 8, 1415. [Google Scholar] [CrossRef]
  15. Lago-Peñas, C.; Lago-Ballesteros, J. Game location and team quality effects on performance profiles in professional soccer. J. Sports Sci. Med. 2011, 10, 465. [Google Scholar] [PubMed]
  16. Lago, C. The influence of match location, quality of opposition, and match status on possession strategies in professional association football. J. Sports Sci. 2009, 27, 1463–1469. [Google Scholar] [CrossRef] [PubMed]
  17. Nobari, H.; Fani, M.; Mainer-Pardos, E.; Oliveira, R. Comparison of GPS derived variables based on home versus away matches in the Asian professional soccer team. Proc. Inst. Mech. Eng. Part P J. Sports Eng. Technol. 2025, 239, 163–169. [Google Scholar] [CrossRef]
  18. Taylor, J.B.; Mellalieu, S.D.; James, N.; Shearer, D.A. The influence of match location, quality of opposition, and match status on technical performance in professional association football. J. Sports Sci. 2008, 26, 885–895. [Google Scholar] [CrossRef]
  19. Pollard, R. Home advantage in soccer: A retrospective analysis. J. Sports Sci. 1986, 4, 237–248. [Google Scholar] [CrossRef]
  20. Gómez-Ruano, M.A.; Pollard, R.; Lago-Peñas, C. Home Advantage in Sport; Routledge: New York, NY, USA, 2021. [Google Scholar]
  21. Fullagar, H.H.; Delaney, J.; Duffield, R.; Murray, A. Factors influencing home advantage in American collegiate football. Sci. Med. Footb. 2019, 3, 163–168. [Google Scholar] [CrossRef]
  22. Kuvvetli, Ü. An Investigation on Home Advantage and Away Disadvantage of Teams in the TFF 1. League. Spormetre J. Phys. Educ. Sport Sci. 2023, 21, 78–90. [Google Scholar] [CrossRef]
  23. Leite, W.S. Home advantage: Comparison between the major European football leagues. Athens J. Sports 2017, 4, 65–74. [Google Scholar] [CrossRef]
  24. Tucker, W.; Mellalieu, D.S.; James, N.; Taylor, B.J. Game location effects in professional soccer: A case study. Int. J. Perform. Anal. Sport 2005, 5, 23–35. [Google Scholar] [CrossRef]
  25. Bauer, A.M.; Young, W.; Fahrner, B.; Harvey, J. GPS variables most related to match performance in an elite Australian football team. Int. J. Perform. Anal. Sport 2015, 15, 187–202. [Google Scholar] [CrossRef]
  26. Brewer, C.; Dawson, B.; Heasman, J.; Stewart, G.; Cormack, S. Movement pattern comparisons in elite (AFL) and sub-elite (WAFL) Australian football games using GPS. J. Sci. Med. Sport 2010, 13, 618–623. [Google Scholar] [CrossRef] [PubMed]
  27. Teixeira, J.E.; Leal, M.; Ferraz, R.; Ribeiro, J.; Cachada, J.M.; Barbosa, T.M.; Monteiro, A.M.; Forte, P. Effects of match location, quality of opposition and match outcome on match running performance in a Portuguese professional football team. Entropy 2021, 23, 973. [Google Scholar] [CrossRef]
  28. Catapult. What Is Player Load? Available online: https://core.catapultsports.com/hc/en-us/articles/7209578939151-What-is-Player-Load (accessed on 29 September 2025).
  29. Catapult. Post-Activity Parameters. Available online: https://core.catapultsports.com/hc/en-us/articles/7209919599375-Post-Activity-Parameters (accessed on 29 September 2025).
  30. Goumas, C. Modelling home advantage in sport: A new approach. Int. J. Perform. Anal. Sport 2013, 13, 428–439. [Google Scholar] [CrossRef]
  31. Stone, M.H.; Moir, G.; Glaister, M.; Sanders, R. How Much Strength Is Necessary? Phys. Ther. Sport 2002, 3, 88–96. [Google Scholar] [CrossRef]
  32. Barrera, J.; Sarmento, H.; Clemente, F.M.; Field, A.; Figueiredo, A.J. The effect of contextual variables on match performance across different playing positions in professional Portuguese soccer players. Int. J. Environ. Res. Public Health 2021, 18, 5175. [Google Scholar] [CrossRef]
  33. Miguel, M.; Oliveira, R.; Brito, J.P.; Loureiro, N.; García-Rubio, J.; Ibáñez, S.J. External match load in amateur soccer: The influence of match location and championship phase. Healthcare 2022, 10, 594. [Google Scholar] [CrossRef]
  34. Morgans, R.; Radnor, J.; Fonseca, J.; Rhodes, D.; Ryan, B.; King, M.; Zmijewski, P.; Oliveira, R. Comparison of running and accelerometry variables based on match outcome, match location and quality of opponent in elite professional soccer players. A five-season study. Biol. Sport 2025, 42, 67–79. [Google Scholar] [CrossRef]
  35. Del Coso, J.; Brito de Souza, D.; López-Del Campo, R.; Blanco-Pita, H.; Resta, R. The football championship is won when playing away: Difference in match statistics between the winner and the second-place team in LaLiga. Int. J. Perform. Anal. Sport 2020, 20, 879–891. [Google Scholar] [CrossRef]
  36. Staufenbiel, K.; Lobinger, B.; Strauss, B. Home advantage in soccer–A matter of expectations, goal setting and tactical decisions of coaches? J. Sports Sci. 2015, 33, 1932–1941. [Google Scholar] [CrossRef] [PubMed]
  37. Chacón-Fernández, E.; Brunsó-Costal, G.; Duarte, A.; Sánchez-Oro, J.; Alonso-Pérez-Chao, E. Home advantage in football: Exploring its effect on individual performance. Appl. Sci. 2025, 15, 2242. [Google Scholar] [CrossRef]
  38. Seçkin, A. Home Advantage in Association Football: Evidence from Turkish Super League. In Proceedings of the EcoMod Conference, Honk Kong, China, 28–30 June 2006; Available online: https://ecomod.net/sites/default/files/document-conference/ecomod2006/1596.pdf (accessed on 26 August 2025).
  39. Gómez, M.-Á.; Mitrotasios, M.; Armatas, V.; Lago-Peñas, C. Analysis of playing styles according to team quality and match location in Greek professional soccer. Int. J. Perform. Anal. Sport 2018, 18, 986–997. [Google Scholar] [CrossRef]
  40. Gollan, S.; Bellenger, C.; Norton, K. Contextual factors impact styles of play in the English premier league. J. Sports Sci. Med. 2020, 19, 78. [Google Scholar] [PubMed]
  41. Lago, C.; Martín, R. Determinants of possession of the ball in soccer. J. Sports Sci. 2007, 25, 969–974. [Google Scholar] [CrossRef]
  42. Mohr, M.; Krustrup, P.; Bangsbo, J. Match performance of high-standard soccer players with special reference to development of fatigue. J. Sports Sci. 2003, 21, 519–528. [Google Scholar] [CrossRef]
  43. Chmura, P.; Konefał, M.; Wong, D.P.; Figueiredo, A.J.; Kowalczuk, E.; Rokita, A.; Chmura, J.; Andrzejewski, M. Players’ physical performance decreased after two-thirds of the season: Results of 3 consecutive seasons in the German first Bundesliga. Int. J. Environ. Res. Public Health 2019, 16, 2044. [Google Scholar] [CrossRef]
  44. Joo, C.H. The effects of short-term detraining on exercise performance in soccer players. J. Exerc. Rehabil. 2016, 12, 54. [Google Scholar] [CrossRef]
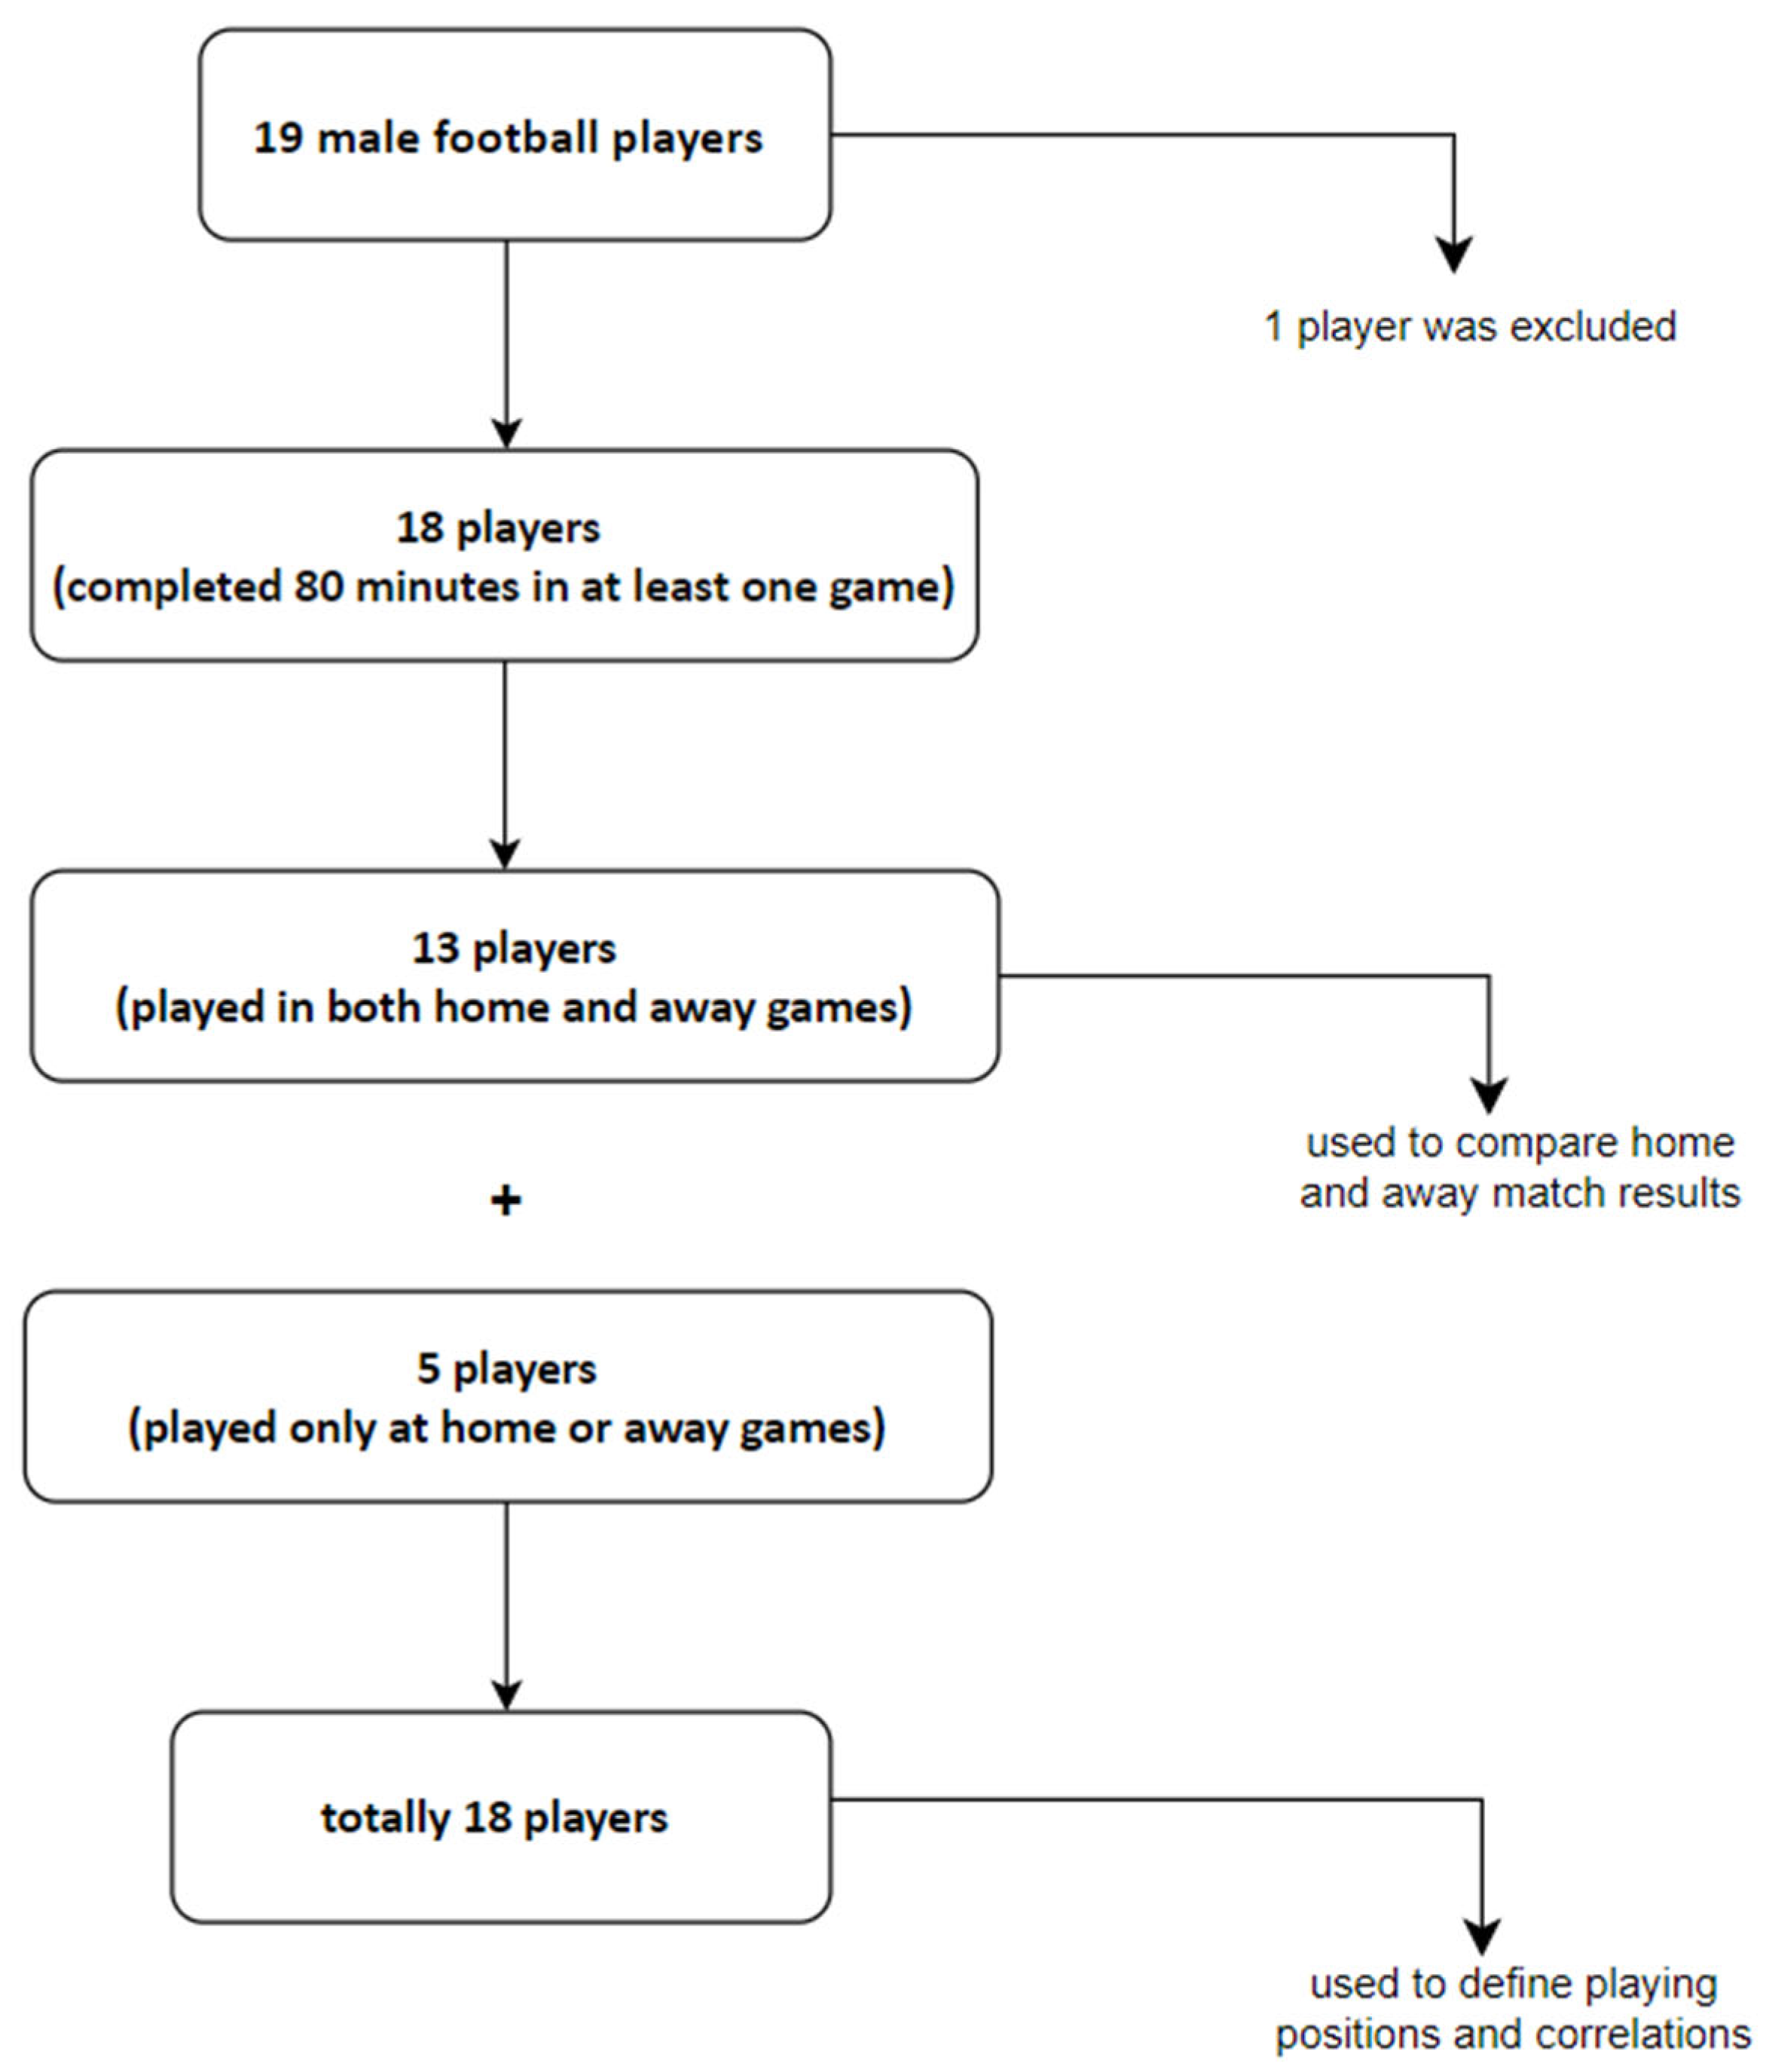
Figure 1. Sample size for analyses.
Applsci 15 11275 g001
Figure 2. Performance differences based on GPS variables between home and away matches (n = 13). * Significant difference between home and away (p < 0.05). (A) Total time (min), (B) total distance (m), (C) distance (m) for 20–25 km/h, (D) distance (m) for >25 km/h, (E) acceleration distance (m), (F) deceleration distance (m), (G) total player load, (H) total distance for high metabolic power (m).
Applsci 15 11275 g002
Figure 3. Performance differences in playing positions between home and away matches. W: winger, CB: center back, CM: central midfielder, FB: full back.
Applsci 15 11275 g003
Table 1. Performance characteristics based on GPS results by playing positions (n = 18).
GPS variablesPlayer PositionNM ± SD%95 CIp
Total time (min)Winger491.3 ± 5.482.799.80.184
Center Back596.4 ± 1.794.398.5
Central Midfielder490.5 ± 3.784.696.4
Full Back395.3 ± 1.591.599.1
Striker294.0 ± 7.130.5157.5
Total distance (m)Winger49579.0 ± 775.38345.310,812.70.408
Center Back58867.2 ± 284.78513.79220.7
Central Midfielder49448.0 ± 435.38755.410,140.6
Full Back39554.3 ± 1012.37039.512,069.1
Striker29148.0 ± 127.38004.410,291.6
High-speed running distance (m)Winger4516.8 ± 94.3366.7666.80.016
Center Back5268.6 ± 58.4 *196.0341.2
Central Midfielder4456.0 ± 85.2320.4591.6
Full Back3458.3 ± 122.3154.4762.3
Striker2479.5 ± 166.2−1013.51972.5
Sprint distance (m)Winger4248.3 ± 68.3139.5357.00.004
Center Back579.4 ± 51.3 *15.7143.1
Central Midfielder4108.5 ± 49.4 *29.9187.1
Full Back3134.0 ± 4.6122.6145.4
Striker2107.0 ± 60.8 *−439.4653.4
Acceleration distance (m)Winger488.3 ± 26.146.7129.80.217
Center Back557.8 ± 25.825.889.8
Central Midfielder462.8 ± 15.238.686.9
Full Back375.0 ± 14.140.0110.0
Striker291.5 ± 20.5−92.7275.7
Deceleration distance (m)Winger450.0 ± 15.225.974.10.011
Center Back524.0 ± 7.8 #14.333.7
Central Midfielder439.0 ± 7.227.650.4
Full Back347.7 ± 2.142.552.8
Striker237.5 ± 9.2−45.1120.1
Total player loadWinger4913.1 ± 25.5872.5953.70.530
Center Back5857.7 ± 95.5739.2976.2
Central Midfielder4940.3 ± 94.0790.71089.8
Full Back3909.0 ± 49.8785.31032.7
Striker2871.0 ± 24.0655.01087.0
Total distance for high metabolic power (m)Winger42206.9 ± 336.21671.82741.90.026
Center Back51612.9 ± 61.61536.41689.3
Central Midfielder42203.5 ± 269.11775.32631.7
Full Back32208.3 ± 411.61185.83230.8
Striker21912.0 ± 322.4−985.04809.0
* Significantly different from winger (p < 0.05). # Significantly different from full back (p < 0.05). Significant results were shown in bold.
Table 2. Correlations among the GPS variables and assist and goal numbers (n = 18).
1.2.3.4.5.6.7.8.9.10.
1. Total assist (count)r1
p
2. Total goal (count)r−0.0901
p0.724
3. Total time (min)r−0.323−0.0431
p0.1910.866
4. Total distance (m)r0.3810.1090.1181
p0.1190.6680.641
5. Distance for 20–25 km/h (m)r0.4520.267−0.4200.6251
p0.0600.2840.0830.006
6. Distance for >25 km/h (m)r0.4750.386−0.2290.4200.5801
p0.0460.1130.3610.0830.012
7. Acceleration distance (m)r0.1220.573−0.1570.2390.6560.6681
p0.6310.0130.5340.3400.0030.002
8. Deceleration distance (m)r0.1430.121−0.1640.5240.8100.6500.7141
p0.5700.6320.5140.025<0.0010.003<0.001
9. Total player loadr0.463−0.177−0.3250.6380.6140.3320.0560.3901
p0.0530.4830.1890.0040.0070.1780.8250.110
10. Distance for high metabolic power (m)r0.4000.0340.0080.3210.4460.2890.5990.596−0.2681
p0.1000.8930.9760.1940.0640.2440.0090.0090.283
Significant difference was presented in bold (p < 0.05).
Disclaimer/Publisher’s Note: The statements, opinions and data contained in all publications are solely those of the individual author(s) and contributor(s) and not of MDPI and/or the editor(s). MDPI and/or the editor(s) disclaim responsibility for any injury to people or property resulting from any ideas, methods, instructions or products referred to in the content.