Abstract
In order to study the impact on the shock effect when a high-speed train passes over a concrete-filled steel tube (CFST) tied-arch bridge, a dynamic load test was carried out in the background of the Qinjiang River Bridge in Qinzhou, Guangxi Province, to test the bridge displacements, accelerations, and dynamic stresses. The bridge finite element model was coupled with a CRH2 train model developed in SIMPACK to perform ANSYS–SIMPACK co-simulation of vehicle–bridge interactions. Model reliability was verified by comparing simulated results with field measurements under matched operating conditions. On this basis, a parametric study was conducted for single-line operation with a mainline spacing of 4.2–5.4 m (0.4 m increments) and train speeds of 80–270 km/h (10 km/h increments), yielding 80 working conditions to evaluate hanger impact responses. The results indicate that the ANSYS–SIMPACK co-simulation provides reliable predictions. Compared with long hangers, short hangers exhibit larger stress impact coefficients. As train speed increases, the hanger impact effect shows a wavelike increasing trend. When the speed approaches 180–200 km/h, the excitation nears the bridge’s dominant natural frequency, and impact effects on bridge components peak, identifying a critical speed range that is more prone to inducing vehicle–bridge resonance; the impact coefficient of the shock effect on both sides of the train is different: the coefficient on the far side of the bridge is about 2 times of that on the near side of the bridge, so when the impact coefficient is regulated, the unevenness of the impact of the shock effect on both sides can be taken into account. Single-line operation can introduce a lateral load bias on the train, and the distance of the train from the center line is positively correlated with the impact size of the shock effect, with the stress impact coefficient of the shock effect on both sides of the bridge and span deflection increasing as the spacing of the main line increases.
1. Introduction
The concrete-filled steel tubular (CFST) tied-arch bridge demonstrates superior load-bearing capacity, exceptional seismic resistance, and outstanding durability compared to conventional steel and concrete arch bridges, making it widely adopted in modern bridge engineering [1,2,3,4,5,6,7]. With the increasing service life of bridges and escalating operational conditions (elevated train speed and axle load), vehicle–bridge coupled vibration has emerged as a critical research focus. As primary load transfer components, hangers in tied-arch bridges experience significant dynamic impact loads under coupled vibrations, whose response characteristics directly govern structural safety and train operation stability [8,9,10,11]. Therefore, systematic investigation of the impact mechanism on bridge component responses and train safety under such conditions holds substantial engineering significance.
Huang et al. [12] conducted numerical simulations on seven medium-rise CFST tied-arch bridges (span range: 20–100 m) to quantify the influence of span length, rise-to-span ratio, and running speed on mid-span impact effects. Yang’s research team [13] employed a seven-degree-of-freedom vehicle model to analyze bridge dynamic responses from two perspectives: pavement irregularity excitation and eccentric loading effects. Lin et al. [14,15] developed a coupled vehicle–bridge simulation system using ANSYS (2021R1) and UM software (10.X), investigating deflection impact coefficients of key components (tie beams, hangers, arch ribs) across 1500 operational scenarios involving speed variations, load changes, and track irregularities. Zhu’s group [16,17] pioneered a pseudo-excitation method-based stochastic vibration model for vehicle–track–bridge systems, establishing quantitative relationships between operational parameters (speed, track quality) and suspender stress impacts in heavy-haul rail applications. Malm et al. [18] integrated monitoring data with finite element models to demonstrate non-uniform stress distributions among suspender elements using Palmgren–Miners damage theory. Yang et al. [19] proposed a hybrid DSM-MSM modeling framework, achieving multi-scale simulation of track–bridge systems with independent modeling of rail networks and bridge structures for comprehensive safety assessment. Gou et al. [20] developed a 15-DOF train model to evaluate dynamic performance and ride comfort under varied operational conditions.
Despite the valuable contributions of the aforementioned studies to understanding dynamic responses and impact effects [21,22,23,24,25] under vehicle–bridge interaction, several gaps remain. First, a systematic and quantitative investigation of the asymmetric dynamic response and impact comparison between the two sides of hangers under coupled vibrations is lacking. Second, the mechanism by which track-center spacing (or track layout) and deck transverse configuration induce a “narrow-bridge effect” and thereby influence the hanger stress impact factor and impact responses of other members is not yet well clarified. Third, most existing work is predominantly numerical, with limited evidence chains based on full-scale dynamic load tests for direct validation of key indicators such as the hanger stress impact factor; as a result, model credibility and the generalizability of conclusions warrant further strengthening. Against this backdrop, this study conducts field dynamic loading experiments on the Qinjiang Double-Track Bridge (128 m) and develops a time-varying vehicle–bridge coupled vibration system via co-simulation that integrates the multibody dynamics software SIMPACK (2021X) with the finite element software ANSYS (2021 R2). Using the experimental data, we validate the coupled model and then employ it to investigate, across 80 operating scenarios with varying train speeds and track-center spacings, the governing patterns of the hanger stress impact factor and the impact responses of other members. Distinct from purely numerical studies, this work emphasizes multi-dimensional, indicator-level validation of the coupled model against measurements, including identification and comparison of frequencies and dominant mode shapes; alignment of member-level stress time histories, peaks, and phases (with particular attention to hangers); and consistency checks of key metrics such as the hanger stress impact factor and the acceleration responses of the tie girder and arch rib. Following measurement-based validation, we carry out a parametric study to systematically examine, under combinations of train speed and track-center spacing (80 scenarios in total), the differences and evolution of the hanger stress impact factor between the two sides, and to elucidate the mechanism by which the narrow-bridge effect induced by track-center spacing influences the impact responses of the tie girder, hangers, and arch rib. Collectively, the above efforts not only fill the research gaps concerning two-sided hanger impact comparison and the effect of track-center spacing but also enhance the reliability and engineering applicability of the conclusions through model validation supported by full-scale bridge testing.
2. Case Study: Bridge Description and Experimental Configuration
2.1. Bridge Description
The Qinjing River Double-Track Grand Bridge on the Yongbei Line represents a key control project of the Yongbei Railway, located between Qinbei and Qinnan Districts in Qinzhou City, Guangxi, and spanning the Qinjing River, as illustrated in Figure 1. The main bridge is an underslung concrete-filled steel tube tied-arch bridge, designed in accordance with China Railway Class I standards, with a design speed of 250 km/h and a double-track configuration featuring a track spacing of 4.6 m. The total length of the tie girder is 131.6 m, with a calculated span of 128 m and a rise-to-span ratio (f/L) of 1/5. The rise of the arch rib in the plane is 25.6 m, and the arch axis adopts a catenary form. The bridge has an overall width of 17.8 m, with hangers spaced at 8 m intervals along the longitudinal axis. The arch ribs utilize a dumbbell-shaped cross-section, while the tie girder is a single-box, three-chamber box section. There are two arch ribs, equipped with one set of M-shaped braces, four sets of K-shaped braces, and fourteen pairs of PES.ECW (FD) low-stress hangers. The arch pipes are filled with C55 micro-expansive concrete, and Q345qD steel is used for the arch rib steel pipes, transverse braces, and anchorage system plates, while Q235 steel is adopted for the deck system.
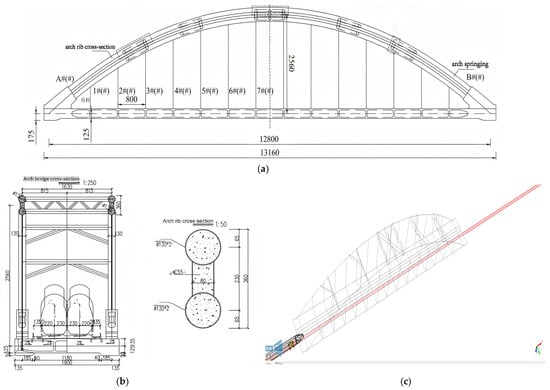
Figure 1.
Complete layout of the Qinjiang river bridge. (a) Qinjiang river double-lane bridge elevation (unit: cm); (b) Qinjiang river arch bridge cross-section (unit: cm); (c) track model diagram.
2.2. Overview of Testing Equipment
Bridge dynamic load testing equipment is an essential tool for evaluating the dynamic response and safety performance of bridge structures. It is typically deployed at critical locations to enable real-time monitoring and recording of structural responses under vehicle-induced excitation. The main bridge is equipped with LQZ(E)-I spherical steel bearings with a rated capacity of 40,000 kN. The support configuration is identical for both spans, comprising one fixed bearing, one free (sliding) bearing, one longitudinal sliding bearing, and one transverse sliding bearing per span. In this study, a JM3872G unit (in velocity mode) in conjunction with a Model 941 velocity transducer was used to instrument measurement points across the bridge; more than 20 min of ambient random excitation data, including traffic-induced excitations, were collected and converted to impulse response representations to identify the bridge’s natural frequencies, damping ratios, mode shapes, and dynamic deflection. In addition, by installing a JM3872G sensor (in acceleration mode) and a JM3839G system at midspan, the midspan acceleration and dynamic strain during train passages were acquired in real time. Data were collected between 04:00 and 21:00. The layout of the equipment and sensor locations is shown in Figure 2. Sensor placement was determined based on preliminary structural dynamic analysis to locate weak regions, supplemented by prior quality inspections. Measurements were conducted by connecting the sensors to their corresponding acquisition systems on a computer to stream and record data in real time. All data were processed using a 20 Hz low-pass filter. The key sensor and system specifications are as follows:
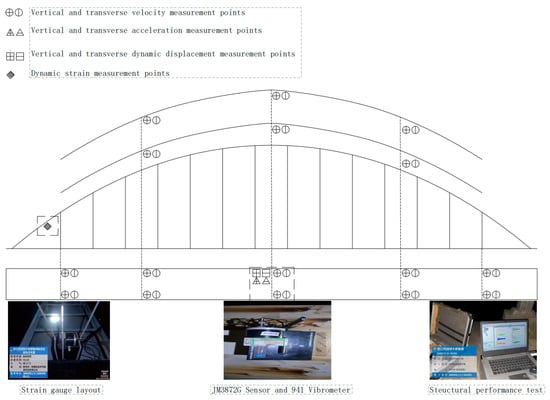
Figure 2.
Schematic diagram of test equipment and measurement point layout.
- (1)
- JM3839G: 4 measurement points per unit; a sampling frequency of 1 kHz per channel; and a measurement error of ±0.2% FS ± 1 με.
- (2)
- JM3872G: 2 channels (one built-in velocity pickup and one external voltage channel); a maximum sampling rate of 1024 Hz per channel with multiple selectable ranges; and an accuracy of ±3%.
2.3. Flexible Railway Track Model
In the vehicle–bridge coupled vibration system, the rail plays a pivotal role. The wheelsets apply loads directly to the railhead, and the rail transmits the wheel–rail forces to the track support and subsequently to the bridge at their interfaces, thereby imposing the vehicular loads on the bridge. Conversely, the bridge’s forced vibration induced by the passing train is transmitted back through the rail to the train, influencing the running safety and ride quality of high-speed trains. Thus, the rail functions as the intermediary medium in the bidirectional interaction between the bridge and the vehicle. To more faithfully represent the bridge track, a rigid track auto-generated within SIMPACK is not used. Instead, a flexible CHN60 rail model is constructed in the finite element software ANSYS. The time histories of wheel–rail interaction forces are extracted by releasing the degrees of freedom of the railhead nodes, while the boundary constraints from the bridge to the rail are realized by releasing the degrees of freedom of the rail base (foot) nodes. The rail model is shown in Figure 3, and its technical parameters are listed in Table 1. After establishing the rail and bridge models, they are imported into the multibody dynamics software SIMPACK to build the vehicle–bridge coupled vibration system, within which the train, track, and bridge interact.
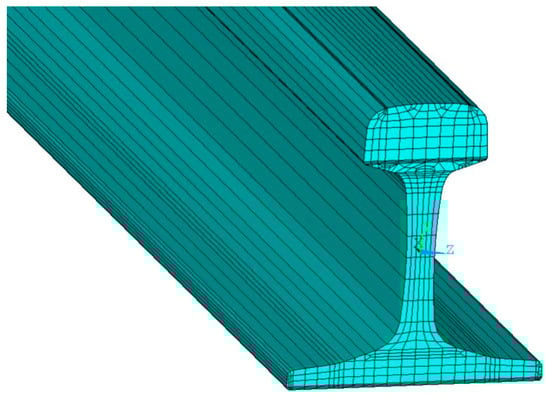
Figure 3.
Single-railway-track model.

Table 1.
Geometric and material properties of the CRH2 rail.
3. Model Validation
3.1. Bridge Model Validation
The free vibration characteristics of bridges refer to the intrinsic ability of the structure to oscillate at its natural frequencies and mode shapes under external excitations, and are jointly influenced by geometric configuration, material properties, support conditions, and the overall stiffness and damping of the system. Therefore, conducting modal analysis to identify the structural configuration, material parameters, and natural frequencies and mode shapes can be used to validate the accuracy and reliability of the structural design and the finite element model. In this study, a finite element model of the bridge was established in ANSYS. The arch ribs (the cross-section adopts a dumbbell-shaped concrete-filled steel tube (CFST) configuration with a sectional depth of 3.6 m and is aligned along the contour lines), transverse braces (the structure is a truss composed of hollow steel tubes, in which the upper and lower chords are braced using steel tubes with an outer diameter of 500 mm and a wall thickness of 12 mm), crossbeams, and tie girders (configured as an integral box girder, employing a single-cell, three-chamber prestressed concrete box section) were modeled using BEAM188 elements; the hangers (a total of 14 pairs of hangers are provided, each consisting of a single parallel wire strand comprising 163 wires 7 mm in diameter) were modeled using LINK180 elements; and the upper and lower transverse braces were constrained via MPC184 elements. The steel–concrete composite sections were represented by an equivalent model comprising a central concrete girder flanked by two I-shaped steel girders, in accordance with the composite section equivalence principle [26]. The ANSYS model of the Qinjiang Bridge is shown in Figure 4 and comprises 1317 nodes and 1514 elements, thereby enabling an efficient and accurate numerical representation of the bridge structure. In bridge dynamics, energy within the low-order frequency range is highly concentrated, broadly influential, and sensitive; vehicle-induced vibrations are typically dominated by these low-order modes [27]. A modal analysis of the Qinjiang Double-Line Bridge was performed using the Lanczos method and compared against field measurements. As shown in Table 2 and Figure 5, the simulated natural frequencies and mode shapes agree well with the experimental data, with frequency deviations within 5%, demonstrating the high fidelity and credibility of the established finite element model.
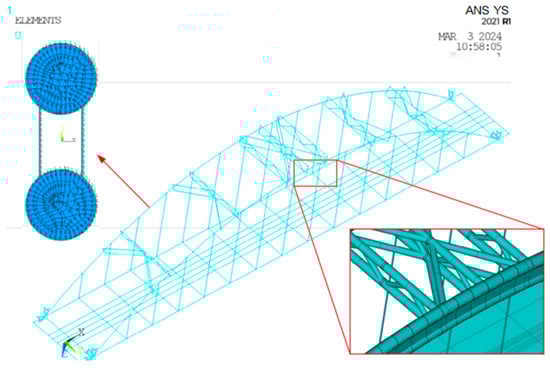
Figure 4.
Numerical model of the Qinjiang river bridge.
Table 2.
Bridge frequency and vibration type.
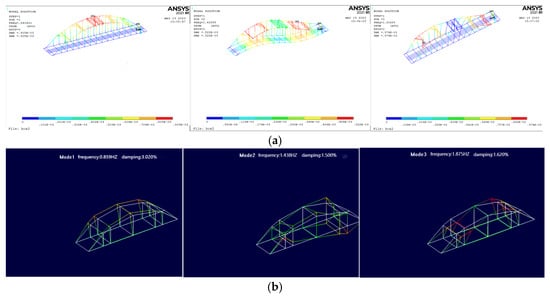
Figure 5.
Frequency and vibration type comparison chart. (a) Simulation calculation value; (b) measured value.
3.2. Vehicle-Bridge Coupled Vibration Model Validation
Based on the principles of train dynamics models [28,29], this study develops an 8-car CRH2 high-speed train dynamic model (T + 2M + 2T + 2M + T configuration) using the wheel–rail coupling module in the SIMPACK multibody dynamics platform. Each vehicle subsystem integrates one carbody, two bolsterless bogies, and four wheelset units, with seven rigid bodies interconnected via revolute and prismatic joints to reproduce six fundamental motion modes: longitudinal translation, lateral translation, vertical translation, roll, pitch, and yaw, resulting in 42 generalized coordinates. The model parameters comply with the Technical Code for Dynamic Testing of Railway Vehicles (GB/T 25358-2019), and nonlinear differential equations are solved through the Newmark-beta integration scheme. A 10 s transient simulation followed by frequency-domain analysis validates the model convergence. The results demonstrate that the peak wheel–rail contact forces meet the UIC 513 preload force limits, while the root-mean-square vertical residual acceleration achieves 1.72 × 10⁻⁶ m/s2. The Vehicle dynamic model is shown in Figure 6.
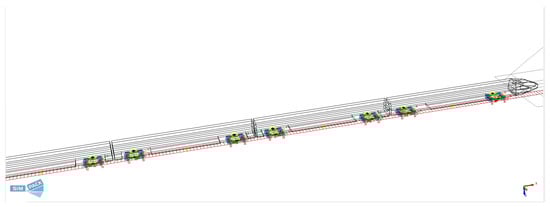
Figure 6.
Vehicle dynamic model.
This study employs a multi-physics coupling approach to develop a vehicle–bridge interaction model. The bridge and rail system was initially modeled in ANSYS, generating geometric (.cdb), mass–stiffness matrix (.sub), and modal analysis (.rst) files. Through the FRMBS interface in SIMPACK, these components were integrated to form a flexible multi-body dynamics model, producing bridge flexible body files (.fbi) constrained by finite elements (denote functional modeling elements in FEA/MBD software (2021) that apply or transmit forces and moments between entities and implement constraints or coupling) between rail and vehicle subsystems. The track adopts the CHN60 rail profile. Train loads are not applied directly to the bridge; instead, they are transmitted via wheel–rail contact through the track. Wheel–rail forces first act on the rail nodes and are subsequently transferred through the rail–sleeper supports to the tie girder and the arch–tie system, thereby producing the global bridge response. The tangential and normal contact forces are computed using Kalker’s nonlinear simplified theory and Hertz’s nonlinear elastic contact theory, respectively [30]. Track irregularities are simulated using the U.S. fifth-grade spectrum, which shows good compatibility with Chinese mainline conditions [31]. The coupled train–track–bridge vibration system is thus established. After coupling, the wheel–rail forces are extracted and applied in ANSYS to obtain the stress time histories of individual bridge components. A workflow of the coupled system is shown in Figure 4. To represent eccentric loading under single-line operation, eccentricity is parameterized by the train’s lateral position relative to the bridge centerline within the SIMPACK–ANSYS framework. Let the deck centerline be y = 0, and the double-track centerlines be y = ±s/2, where s denotes the track spacing. For single-line scenarios, the train position is set to yt = ±st/2.
Flow chart of coupled vibration system establishment is shown in Figure 7. This study validates the vehicle–bridge coupled vibration model through comparative analysis of field measurement data and numerical simulations under single-track operational conditions. A high-speed train with an eight-car formation traveling at 152 km/h was selected as the dynamic excitation source. Figure 8 presents the time history comparison of mid-span vertical displacement, acceleration, and dynamic stress responses. Figure 8a demonstrates good compatibility between measured (1.933 mm) and simulated (1.895 mm) deflections, with a mean absolute error (MAE) of 1.96%. Figure 8b exhibits velocity profiles where the root-mean-square error (RMSE) between simulated (0.356 m/s2) and measured (0.344 m/s2) accelerations reaches 3.49%. Figure 8c displays filtered dynamic stress time histories, showing an 8.91% relative error between simulated (0.225 MPa) and measured (0.247 MPa) peak stress values. The validation confirms the model’s capability to accurately replicate real-world operating conditions and its suitability for extended analysis under complex service scenarios.
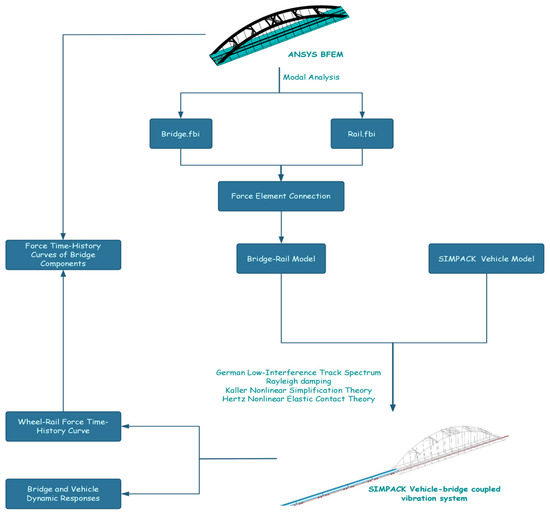
Figure 7.
Flow chart of coupled vibration system establishment.
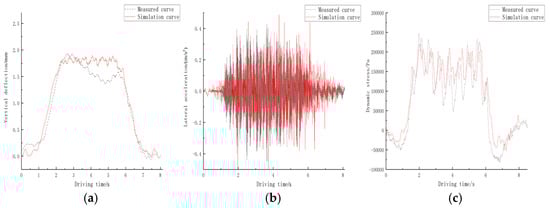
Figure 8.
Comparison of actual measurement and simulation results (152 km/h). (a) mid−span deflection; (b) mid−span vertical acceleration; (c) mid−span dynamic stress.
4. Bridge Dynamic Response
This study employs the dynamic amplification factor [32,33] (Equation (1)) to quantify stress enhancement under transient loading conditions. Dynamic stress time histories were derived from transient simulations of eight-car trains passing bridges at 152 km/h, while static benchmarks were established through quasi-static tests simulating 0.5 m/s low-velocity traversals. Figure 6 compares stress responses of the 1# hanger under dynamic (152 km/h) and quasi-static (0.5 m/s) conditions, with time axes normalized to equivalent 152 km/h travel durations. Results indicate a 2.3-fold increase in peak dynamic stress relative to static responses, validating the proposed impact effect evaluation methodology. As defined in Equation (1),
In Equation, σdmax represents the mean peak stress under dynamic loading scenarios, while σjmax denotes the maximum principal stress value of the structural member under quasi-static loading conditions. Figure 9 shows the stress time-history curve of Hanger 1#.
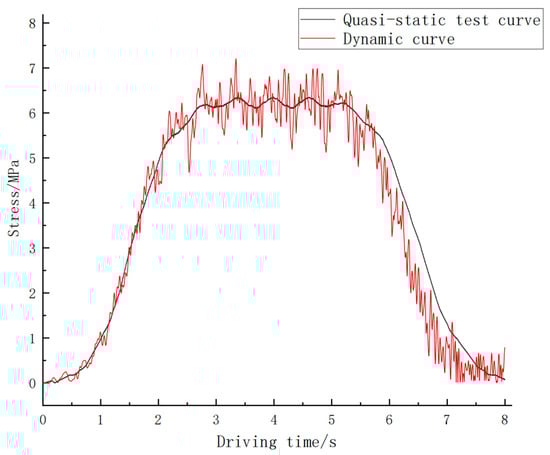
Figure 9.
Hangar #1 shock effect stress–time course curve.
Based on the defined dynamic amplification factor, Figure 10 illustrates the variation patterns of stress impact coefficients among different hangers under train speeds ranging from 90 to 270 km/h (incremental steps of 30 km/h). Symbolic notation specifies that “#” denotes the near-side hanger, while “##” denotes the far-side hanger. The results demonstrate that shorter hangers exhibit significantly higher impact coefficients compared to central longer hangers, with symmetrical characteristics observed between bridge entry and exit sides. Specifically, the impact coefficients of hangers #1–#7 manifest mirror-image distributions relative to the bridge’s longitudinal axis. Based on these findings, this study systematically investigates the influence of operational speed and mainline spacing on the impact coefficients of hangers #1–#7 through parametric modeling, establishing a generalized correlation framework for bridge–hanger dynamic interaction analysis.
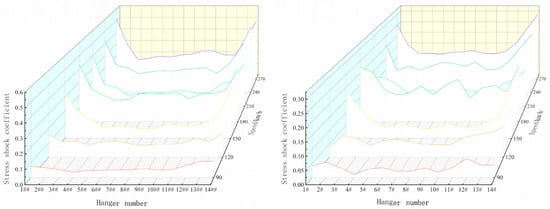
Figure 10.
Change curve of impact coefficient between each shock effect.
4.1. Driving Speed
Vehicle speed serves as a critical parameter influencing bridge impact factors, with significant implications for the force distribution in suspender cables and arch springers of tied-arch bridges under high-speed train operation. Figure 11 presents the impact factors measured at the arch springers and suspender cables across 20 operational scenarios (80–270 km/h in 10 km/h increments) for single-track trains on 4.6 m centerline spacing routes. Through systematic analysis of critical speeds within distinct velocity intervals, this study identifies components exhibiting high impact sensitivity through comparative evaluation of force responses, as detailed in Table 3.
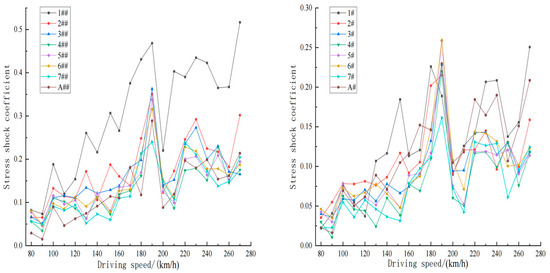
Figure 11.
Impact coefficient of shock effect and arch foot with velocity change curve.
Table 3.
Shock effect of sensitive components at critical velocities.
As illustrated in Figure 11, the dynamic response of short hangers near the arch springing exhibits heightened sensitivity. With increasing train speed, the impact coefficients of various primary components generally display an upward trend; however, this increase is not monotonic but instead characterized by a wavelike progression. Distinct critical speeds associated with pronounced dynamic responses are observed across different speed intervals, with short hangers showing particularly strong and sharp peak values. Furthermore, a critical speed at which the impact effect intensifies is evident for the concrete-filled steel tube tied-arch bridge analyzed in this study, with a threshold value of approximately 190 km/h. Within the speed range of 160 to 240 km/h, the stress impact coefficients are especially prominent.
During single-track train operation, the bridge is subjected to eccentric loading, resulting in uneven distribution of the train’s total weight and speed, which further causes non-uniform vibration and stress among the structural components. Table 4 and Figure 11 present a comparative analysis of the stress impact coefficients for key components on both sides of the bridge. The study reveals that the impact coefficient of the hangers on the far side relative to the approaching train is approximately twice that of those on the near side, whereas the differences at the arch springings are comparatively minor. Specifically, when the train speed is 152 km/h, the impact coefficients for hangers 1# and 1## reach 0.185 and 0.307, respectively—both exceeding the limits specified in the “Code for Design of Steel Structures of Railway Bridges” [22]. These findings indicate that short hangers exhibit higher dynamic amplification and stress sensitivity under the combined effects of eccentric loading and high-speed operation, posing risks of fatigue accumulation and premature failure at locally weak details. The pronounced asymmetry of the impact factor indicates that the lateral load path and three-dimensional coupling effects cannot be neglected; a symmetric simplification would underestimate adverse conditions on the far-side members. The exceedance of impact factor limits for short hangers and the asymmetric responses on both sides not only reveal key vulnerabilities under eccentric loading but also inform design decisions, assessment methods, and maintenance management for long-span tied-arch bridges. Specifications should explicitly account for asymmetric impact effects on hangers—either through extrapolation beyond current provisions or by refining the relevant clauses—and establish dedicated dynamic verification and monitoring strategies for short hangers, thereby enhancing safety redundancy and service reliability at operating speeds.
Table 4.
CRH2 train key parameters.
4.2. Track Gauge
A parametric study was conducted to systematically investigate the influence of train eccentric loading on suspender cable stress impact coefficients across 80 operational scenarios (centerline spacing: 4.2–5.4 m in 0.4 m increments; train speed: 80–270 km/h in 10 km/h increments). The analysis focused on quantifying the influence patterns of lateral load distribution asymmetry on critical structural components. Stress impact coefficients for hangers 1#, 4#, 7#, 1##, 4##, and 7## were extracted and compared, as illustrated in Figure 12.
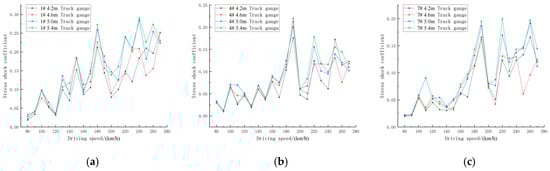
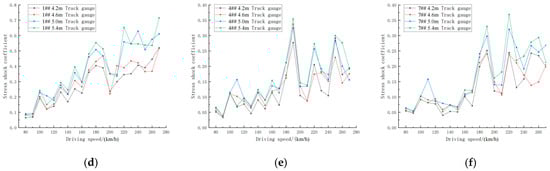
Figure 12.
Impact coefficient of shock effect and arch foot with velocity change curve. (a) Suspender #1, (b) Suspender #4, (c) Suspender #7, (d) Suspender #1, (e) Suspender #4, and (f) Suspender #7.
As demonstrated in Figure 12, there exists a positive correlation between the distance of the train from the bridge’s center line and the magnitude of the impact on the hangers; increasing track spacing leads to higher stress impact coefficients for hangers on both sides of the bridge. This effect becomes especially pronounced when the track spacing exceeds that of normal operation. Moreover, when train speeds surpass 140 km/h, the dynamic impact due to eccentric loading intensifies, with short hangers exhibiting particularly marked increases in stress impact—highlighting the greater non-uniformity in suspender forces under high-speed operational conditions.
Figure 13 illustrates the influence of eccentric train loading on mid-span deflection of the bridge under the given operating conditions. The results indicate that as the track spacing increases, the mid-span deflection on the near side of the train rises, while that on the far side decreases, attributed to bridge inclination induced by eccentric loading. In general, the deflection increases with train speed, and when the time-dependent excitation forces acting on the bridge at a train speed within the range of 180–200 km/h enter a resonance region with the bridge’s natural frequency, the mid-span deflection escalates rapidly, producing the most significant impact response. At track spacings of 4.2 m, 4.6 m, 5.0 m, and 5.4 m (with 0.4 m increments), the differences in mid-span deflection between the two sides at the critical speed are 0.771 mm, 0.839 mm, 0.904 mm, and 0.99 mm, respectively.
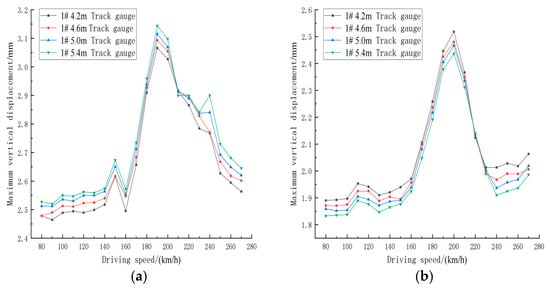
Figure 13.
Impact coefficient of shock effect and arch foot with velocity change curve. (a) Mid-span on the near (train) side; (b) mid-span on the far (train) side.
5. Conclusions
- (1)
- The reliability of dynamic response calculations for bridges was rigorously validated through integrated numerical–experimental verification. A vehicle–bridge coupled vibration system established via ANSYS-SIMPACK co-simulation demonstrates high accuracy in predicting structural dynamics. Based on field dynamic load testing and numerical validation, the ANSYS–SIMPACK co-simulation model for train–bridge coupled vibrations reliably reproduces the key dynamic responses of the in-service bridge under train loading—namely, midspan deflection, vertical acceleration, and dynamic stress—with relative errors kept within engineeringly acceptable limits. This workflow provides a reusable simulation paradigm for dynamic performance evaluation, parameter sensitivity analysis, and design verification of similar concrete-filled steel tube tied-arch bridges.
- (2)
- Stress impact coefficients of suspender cables in tied arch bridges exhibit wave-like incremental patterns with increasing train speed, accompanied by distinct critical velocity thresholds where impact effects intensify. The hanger stress impact factor exhibits an undulating upward trend with increasing train speed, and a critical speed range with pronounced dynamic amplification is observed. For the bridge type and parameters considered herein, the range of 180–200 km/h approaches the bridge’s low-order natural frequencies, within which the stress impact factors of the hangers and arch springings attain their peaks; the midspan deflection impact is simultaneously amplified, posing a potential risk of train–bridge resonance. This phenomenon, in a general sense, reflects a velocity-mode proximity-driven mechanism of dynamic amplification and is of reference value for long-span arch bridges more broadly.
- (3)
- This study shows that for the 128 m concrete-filled steel tube tied-arch bridge, when a CRH2 train travels at approximately 180–200 km/h, the dominant excitation from the vehicle–track–bridge interaction approaches the bridge’s low-order natural frequencies, creating a condition of velocity-mode proximity. Under this condition, the stress impact factors of hangers and arch springings peak, and the midspan deflection impact is simultaneously amplified; limited structural damping cannot fully suppress this effect, implying a risk of train–bridge resonance. The response is more pronounced in short and far-side hangers, reflecting the combined influence of eccentric loading and local stiffness disparities. These findings inform dynamic assessment and design verification for the present bridge type and provide guidance on speed planning, vibration mitigation, and operational safety for similar long-span arch bridges.
- (4)
- Limitations and future work: The findings are based on a 128 m CFST tied-arch bridge with a CRH2 train under specific track spectra and operational conditions, thus limited by bridge/train parameters, track spectra, and damping assumptions. Future work should: assess various track irregularity levels/spectra on velocity-mode proximity and impact factors; extend to multiple train types/formations and operational scenarios (crossing, braking/traction); perform sensitivity and scaling studies on span, rise-to-span ratio, and hanger layout/stiffness to build parametric design maps; and calibrate damping/boundary conditions with long-term SHM and multi-bridge tests, refining asymmetric impact factor provisions.
Author Contributions
Conceptualization, Y.P. and H.G.; methodology, H.G.; software, Z.T.; validation, H.G. and Z.T.; formal analysis, H.G.; investigation, N.Z.; resources, B.W.; data curation, H.G.; writing—original draft preparation, H.G.; writing—review and editing, H.G.; visualization, H.G.; supervision, H.G.; project administration, H.G.; funding acquisition, H.G. All authors have read and agreed to the published version of the manuscript.
Funding
This research received no external funding.
Institutional Review Board Statement
Not applicable.
Informed Consent Statement
Informed consent was obtained from all subjects involved in the study.
Data Availability Statement
The data presented in this study are available through email upon request to the corresponding author.
Conflicts of Interest
Authors Zhiyuan Tang, Ning Zhou and Bin Wang were employed by the company Changsha High-Speed Railway Engineering Section of China Railway Guangzhou Group Co., Ltd. The remaining authors declare that the research was conducted in the absence of any commercial or financial relationships that could be construed as a potential conflict of interest.
References
- Zhao, L.; Wang, Q.; Wang, G. Vehicle-bridge coupling vibration analysis of long-span arch bridge under the action of traffic flow. J. Railw. Sci. Eng. 2022, 19, 1004–1013. [Google Scholar]
- Yao, D.; Deng, N. Vehicle-bridge coupling vibration analysis of long-span concrete-filled steel tubular arch bridge. J. Railw. Sci. Eng. 2022, 19, 3693–3704. [Google Scholar]
- Qin, S.; Feng, J.; Tang, J.; Huo, X.J. Experimental study on dynamic characteristics of long-span railway continuous rigid frame-CFST arch bridge. J. Railw. Sci. Eng. 2021, 18, 3247–3256. [Google Scholar]
- Chen, L.; Shao, C.; Tang, H.; Wang, W.; Lu, H. Design of a 420 m Span Network Hanger Tied Arch Bridge for Jinan Qilu Yellow River Bridge. Bridge Constr. 2022, 52, 113–120. [Google Scholar]
- Wang, Q.; Wang, C.; He, Y.; Wu, F.Y.; Li, Y.F. Research on Static Performance of Through-Type Dumbbell-Shaped Concrete-Filled Steel Tube Tied Arch Bridge. J. Shenyang Jianzhu Univ. Nat. Sci. Ed. 2022, 38, 496–503. [Google Scholar]
- Yang, Y.; Shen, Q. Static and Dynamic Load Tests and Structural Performance Study on the Continuous Steel Truss Girder Flexible Arch Composite Bridge of the Rongjiang Grand Bridge on the Xiamen-Shenzhen Railway. J. Railw. Sci. Eng. 2014, 11, 19–25. [Google Scholar]
- Liu, J.; Chen, B.; Li, C.; Zhang, M.J.; Mou, T.; Tabatabai, H. Recent application of and research on concrete arch bridges in China. Struct. Eng. Int. 2022, 33, 394–398. [Google Scholar] [CrossRef]
- Shao, Y.; Sun, Z.; Chen, Y. Analysis of the impact effect of the suspender system in a half-through concrete filled steel tubular arch bridge. Appl. Mech. Mater. 2014, 477, 705–709. [Google Scholar] [CrossRef]
- Barton, S.C.; Vermaas, G.W.; Duby, P.F.; West, A.C.; Betti, R. Accelerated corrosion and embrittlement of high-strength bridge wire. J. Mater. Civ. Eng. 2000, 12, 33–38. [Google Scholar] [CrossRef]
- Li, Y.; Xiang, H.; Zang, Y.; Qiang, S.Z. Study on wind-vehicle-bridge coupling vibration during the process of two vehicles passing each other. China Civ. Eng. J. 2011, 44, 73–78. [Google Scholar]
- Shen, H.; Chen, X.; Lu, K.; Huang, H. A New Vehicle-Bridge Coupling Analysis Method Based on Model Polycondensation. Ksce J. Civ. Eng. 2021, 25, 245–255. [Google Scholar] [CrossRef]
- Huang, D. Dynamic and impact behavior of half-through arch bridges. J. Bridge Eng. 2005, 10, 133–141. [Google Scholar] [CrossRef]
- Yang, J.; Li, J.; Shen, J. Numerical investigation of concrete-filled steel tubular tied-arch bridge under travelling vehicles. J. Beijing Univ. Technol. 2012, 38, 847–853. [Google Scholar]
- Lin, P.; Hou, S.; Wang, Y. Impact coefficients of continuous rigid-arch combination bridges for high-speed railroads. China Railw. Sci. 2023, 44, 73–80. [Google Scholar]
- Lin, P.; Wang, Y. Impact factor calculation of railway concrete-filled steel tubular tied-arch bridges based on vehicle-bridge coupling vibration analysis. Vib. Shock 2021, 40, 115–120. [Google Scholar]
- Zhu, Z.; Wang, L.; Gong, W.; Yu, Z.W.; Cai, C.B. Comparative analysis of several types of vertical wheel/rail relationship and construction of an improved iteration model for train−track−bridge system. J. Cent. South Univ. (Nat. Sci. Ed.) 2017, 48, 1585–1593. [Google Scholar]
- Zhu, Z.; Zhao, T.; Wang, L.; Xu, H.Q.; Yu, Z.W. Study on stress impact coefficient of heavy-duty railroad arch bridge shock effect based on random vibration model. J. Vib. Eng. 2017, 30, 955–964. [Google Scholar]
- Malm, R.; Andersson, A. Field testing and simulation of dynamic properties of a tied arch railway bridge. Eng. Struct. 2006, 28, 143–152. [Google Scholar] [CrossRef]
- Yang, S.C.; Hwang, S.H. Train-track-bridge interaction by coupling direct stiffness method and mode superposition method. J. Bridge Eng. 2016, 21, 04016058. [Google Scholar] [CrossRef]
- Gou, H.; Zhou, W.; Yang, C.; Bao, Y.; Pu, Q. Dynamic response of a long-span concrete-filled steel tube tied arch bridge and the riding comfort of monorail trains. Appl. Sci. 2018, 8, 650. [Google Scholar] [CrossRef]
- Matsuura, A. A study of dynamic behavior of bridge girder for high speed railway. Proc. Jpn. Soc. Civ. Eng. 1976, 1976, 35–47. [Google Scholar] [CrossRef] [PubMed]
- Chu, K.-H.; Garg, V.K.; Bhatti, M.H. Impact in truss bridge due to freight trains. J. Eng. Mech. 1985, 111, 159–174. [Google Scholar] [CrossRef]
- Han, Z.; Zhao, B.; Li, Y. Dynamic Response Analysis of Long-Span Bridges under Moving Loads Considering the Impact Coefficient. Buildings 2023, 13, 2389. [Google Scholar] [CrossRef]
- Cao, H.; Li, Y.; Wu, K.; Qian, X.; Zheng, Q. Analysis of Vehicle-Bridge Coupling Vibration and Impact Coefficient on Long-Span Beam Bridge. Appl. Sci. 2024, 14, 2021. [Google Scholar] [CrossRef]
- Luo, H.; Zhong, Y.; Ren, W. The Train-Bridge Coupled Vibration Analysis of a Long Railway Bridge Considering Vehicle-Bridge Interaction. Appl. Sci. 2022, 12, 11838. [Google Scholar] [CrossRef]
- Yang, C.; Li, Q.; Feng, W.; Liu, Q.M. Static properties comparison of steel-concrete composite beams being equivalent as stiffness. Sichuan Constr. Sci. Res. 2012, 38, 37–39. [Google Scholar]
- Yu, Z.; Liu, H. Vibration performance and comfort evaluation of Xunjiang cable-stayed bridges under combined action of wind-vehicle-pedestrian loadings. J. Railw. Sci. Eng. 2023, 20, 1425–1432. [Google Scholar]
- Cui, S.; Liu, P.; Cao, Y.; Su, J.; Zhu, B. Simulation study on multiline vehicle-bridge coupled vibration. J. Southwest Jiaotong Univ. 2017, 52, 835–843. [Google Scholar]
- Zhu, W.; Qi, T.; Jia, L. Dynamic performance analysis of vehicle-bridge system for a cable-stayed bridge with steel truss girder based on SIMPACK. Railw. Stand. Des. 2014, 58, 89–94. [Google Scholar]
- Yan, W.; Fischer, F.D. Applicability of the Hertz contact theory to rail-wheel contact problems. Arch. Appl. Mech. 2000, 70, 255–268. [Google Scholar] [CrossRef]
- Chen, G.; Zhai, W.; Zuo, H. Comparing track irregularities PSD of Chinese main lines with foreign typical lines by numerical simulation computation. J. Railw. 2001, 23, 82–87. [Google Scholar]
- TB10002.2-2005; Ministry of Railways of the People’s Republic of China. Code for the Design of Railroad Bridge Steel Structures. China Railway Publishing House: Beijing, China, 2005.
- Guo, F.; Cai, H.; Li, H. Impact coefficient analysis on long-span beam bridge. J. Vibroeng. 2021, 23, 436–448. [Google Scholar] [CrossRef]
Disclaimer/Publisher’s Note: The statements, opinions and data contained in all publications are solely those of the individual author(s) and contributor(s) and not of MDPI and/or the editor(s). MDPI and/or the editor(s) disclaim responsibility for any injury to people or property resulting from any ideas, methods, instructions or products referred to in the content. |
© 2025 by the authors. Licensee MDPI, Basel, Switzerland. This article is an open access article distributed under the terms and conditions of the Creative Commons Attribution (CC BY) license (https://creativecommons.org/licenses/by/4.0/).