Article

The Effect of Implant Thread’s Pitch on Primary Stability: An In Vitro Polyurethane Study with Under-Preparation and Low-Speed Drilling

1
Department of Biomedical, Surgical and Dental Sciences, University of Milan, 20122 Milan, Italy
2
Fondazione IRCCS Ca’Granda Ospedale Maggiore Policlinico, 20122 Milan, Italy
3
Department of Medical, Oral and Biotechnological Sciences, “G. d’Annunzio” University of Chieti-Pescara, 66100 Chieti, Italy
4
School of Dentistry, Saint Camillus International University for Health Sciences (Unicamillus), 00131 Rome, Italy
5
Independent Researcher, 31020 San Vendemiano, Italy
*
Author to whom correspondence should be addressed.
Appl. Sci. 2025, 15(20), 11245; https://doi.org/10.3390/app152011245 (registering DOI)
Submission received: 5 August 2025 / Revised: 7 October 2025 / Accepted: 16 October 2025 / Published: 20 October 2025

Abstract

Background: The morphology of implant threads plays a crucial role in achieving primary stability, which is essential for successful osseointegration and immediate loading of dental implants. This study aimed to evaluate how different implant thread pitches and an under-preparation drilling technique impact primary stability using an in vitro model. Methods: The study was conducted on low-density polyurethane bone models with and without cortical layers. The following three different implant thread profiles were tested: CYROTH 0.40 (0.40 mm), CYROTH 0.45 (0.45 mm), and CYROTH T (0.35 mm). Two different drilling procedures were utilized, with diameters of 3.4 mm and 3.7 mm, at a low rotational speed of 30 rpm. Primary stability was assessed by measuring insertion torque (IT), removal torque (RT), and resonance frequency analysis (RFA). Results: The low rotational speed of 30 rpm was found to be effective for achieving favorable fixation parameters in all scenarios. The 0.45 mm thread consistently exhibited higher implant stability quotient (ISQ) values (from two to six points higher) compared to the 0.40 mm and standard 0.35 mm threads, while also requiring lower IT. The highest ISQ values were recorded in the 20 pounds per cubic foot (PCF) block with a cortical layer using the 0.45 mm thread and a 3.4 mm drill. The under-preparation using the 3.4 mm drill resulted in higher IT and RT values than the 3.7 mm drill. Conclusions: This study demonstrated that implant thread pitch and drilling technique are critical factors influencing primary stability. Utilizing a wider thread pitch (0.45 mm) along with an under-preparation drilling protocol can significantly improve implant stability, even in low-density bone, without the need for excessive IT. These findings suggest that selecting the appropriate implant macrogeometry and surgical technique can optimize the primary stability of dental implants.

1. Introduction

The morphology of implant threads significantly influences the primary stability of dental implants. Primary stability refers to the mechanical fixation of the implant at the time of placement and is essential for successful osseointegration and the possibility of immediate loading [1]. Firstly, the depth of the threads plays a crucial role, as greater thread depth typically increases the bone–implant contact (BIC) surface and the compression of the bone [2,3]. Implants with deeper coils generally achieve higher primary stability, particularly in low-density bone types (D3, D4), as they provide better engagement with the surrounding bone [4]. However, excessive thread depth can lead to stress and bone resorption if the forces exerted are too high [5]. Regarding the pitch of the thread, which is the distance between adjacent coils, a smaller pitch increases the contact surface and can enhance primary stability by engaging more bone in the coils [6]. Conversely, a larger pitch may reduce insertion torque (IT), which could compromise initial engagement, especially in less dense bones [5]. Additionally, the shape of the coils, such as V-shaped, square, buttress, and reverse buttress, affects stress distribution at the bone–implant interface and the resistance to extraction [5]. V-shaped coils are common and strike a balance between shear and compression forces, while square coils are effective at distributing stress and reducing shear, making them stable, especially in dense bone [7]. Buttress coils are designed to withstand axial forces, providing robust resistance to both push-in and pull-out forces. In contrast, reverse buttress coils are beneficial for compacting bone in the apical direction [7]. Overall, the choice of coil shape should consider factors such as bone density and the specific surgical strategy employed.
When it comes to the number of turns in multi-threading, implants can have single, double, or triple turns [8]. Implants designed with double or triple coils allow for faster insertion and can increase primary stability compared to those with single coils, as they provide a greater contact surface and better engagement with the bone [9]. However, if the helix angle is too steep in these designs, it may negatively affect their ability to support axial loads. The helix angle, also known as the lead angle, determines the angle at which the coil advances along the implant body. A reduced helix angle, which is typically associated with a smaller pitch and deeper coils, tends to enhance primary stability [9].
When considering implant diameter and taper, it is important to note that while they are not directly related to spiral morphology, they do interact with the design of the spiral to influence primary stability [10]. In particular, conical implants with coils that widen toward the coronal end can provide greater bone compression, leading to improved primary stability, especially in low-density bone. This effect is often referred to as “bone condensation” [11]. The morphology of the coils also plays a role in stability by increasing the contact surface area. Deeper, shorter-pitch coils enhance the surface area in contact with the bone, maximizing initial mechanical friction [9]. Moreover, the design of the threads can promote bone compression during insertion, increasing the density of peri-implant bone and improving mechanical engagement, which is particularly beneficial in soft bone [12]. A well-designed coil morphology allows for a more even distribution of stress along the bone–implant interface, minimizing stress concentrations that could lead to bone resorption and excessive micromotion. Primary stability is characterized by minimal micromotion, typically less than 50–150 μm, [13]. An optimized thread design helps minimize micromovement, which is crucial for bone healing and osseointegration. In summary, the morphology of the threads is a key factor in the macrogometry of the implant. Clinicians can modulate this through their choice of implant to optimize primary stability based on the quality and quantity of the patient’s bone and the surgical technique used [9]. Ensuring adequate primary stability is critical to prevent early implant failure and facilitate accelerated or immediate loading protocols. The aim of the present investigation was to evaluate how different implant thread pitches and an under-preparation drilling technique impact primary stability using polyurethane blocks with different densities and presence of a cortical layer.

2. Materials and Methods

2.1. Study Design

The test involved a total of ten samples for each condition, specifically low-density polyurethane bone with and without cortical layers (SawBones H, Pacific Research Laboratories Inc., Vashon, WA, USA). The groups were allocated based on bone density: (i) 10 pounds per cubic foot (PCF) with 1 mm cortical layer (30 PCF), (ii) 10 PCF without a cortical layer, (iii) 20 PCF with a 1 mm cortical layer (30 PCF), and (iv) 20 PCF without a cortical layer.
A total of three implant thread profiles were tested: (i) CYROTH 0.40 (0.40 mm), (ii) CYROTH 0.45 (0.45 mm), and (iii) CYROTH T (0.35 mm) (AoN Implants Srl, Grisignano di Zocco, Vicenza, Italy). The site’s sample size was considered for a total of 240 units.
The drilling technique for primary osseous healing (ROP) [14,15,16] was performed at a low rotational speed of 30 rpm, using two different drill diameters of 3.4 mm and 3.7 mm. CYROTH 0.40 and 0.45 fixtures shared the same dimensions, measuring 4 mm in diameter and 10 mm in length. CYROTH T fixtures were 4 mm in diameter and 8 mm in length. Each CYROTH implant featured a tapered profile and a smooth thread design. The apical portion was rounded, and the threads were V-shaped. Surface grooves extended from the apex to two-thirds of the length of the implant, and the surface treatment consisted of double acid-etching. The implant–abutment connection utilized a Cone Morse connection (Figure 1 and Figure 2).

2.2. Drilling Procedure

In this investigation, two different drilling procedures were tested. The procedures included ROP using a 3.4 mm drill (R3.4) and ROP using a 3.7 mm drill (R3.7). The technique rationale was to decrease the time of the procedure while increasing patient comfort and tolerance. The drills operated at low rotational speeds without irrigation, allowing for maximum control during the osteotomy.

2.3. Insertion Torque (IT) and Removal Torque (RT) Assessment

All positioned fixtures were evaluated for IT during the insertion process. The tensile and removal torque (RT) were measured through a dynamometric analysis. Both measurements were taken using an OMEGA digital dynamometer (Arthur-Sauvé, St-Eustache, QC, Canada), which was connected to the implant insertion driver according to the implant system protocol.

2.4. Resonance Frequency Analysis (RFA)

The resonance frequency analysis (RFA) (Osstell, Columbia, MD, USA) is an electromechanical device that assesses implant resonance. This device can eliminate non-compliant pulses, providing reliable and reproducible measurements of implant micro-mobility. The device is able to eliminate the non-compliant pulse, offering a reproducible assessment of the implant micro-movement. For this purpose, the smartpeg no. 78 was used according to the producer’s indications. A total of 2 measurements for each site with an angle of 90° between them were recorded and calculated.

2.5. Statistical Analysis

The sample size calculation has been considered using an ANOVA F test through GPower software (version 3.1.9.6, Franz Faul, University of Stuttgart): effect size 0.32; alfa error 0.05; 1-beta error: 0.80. A total of 240 sites has been considered (10 units for each group).
Data analysis and elaboration were conducted using GraphPad Prism 9 (San Diego, CA, USA). Descriptive statistics were calculated to determine the mean, median, standard deviation, and 95% confidence intervals for all variables. Inferential statistics were performed using the D’Agostino & Pearson normality test and Levene’s test for homogeneity variances. The Kruskal–Wallis followed by Dunn’s post hoc test was employed to assess the level of significance for all study variables under the testing conditions. A significance level of p < 0.05 was considered statistically significant.

3. Results

3.1. IT Values

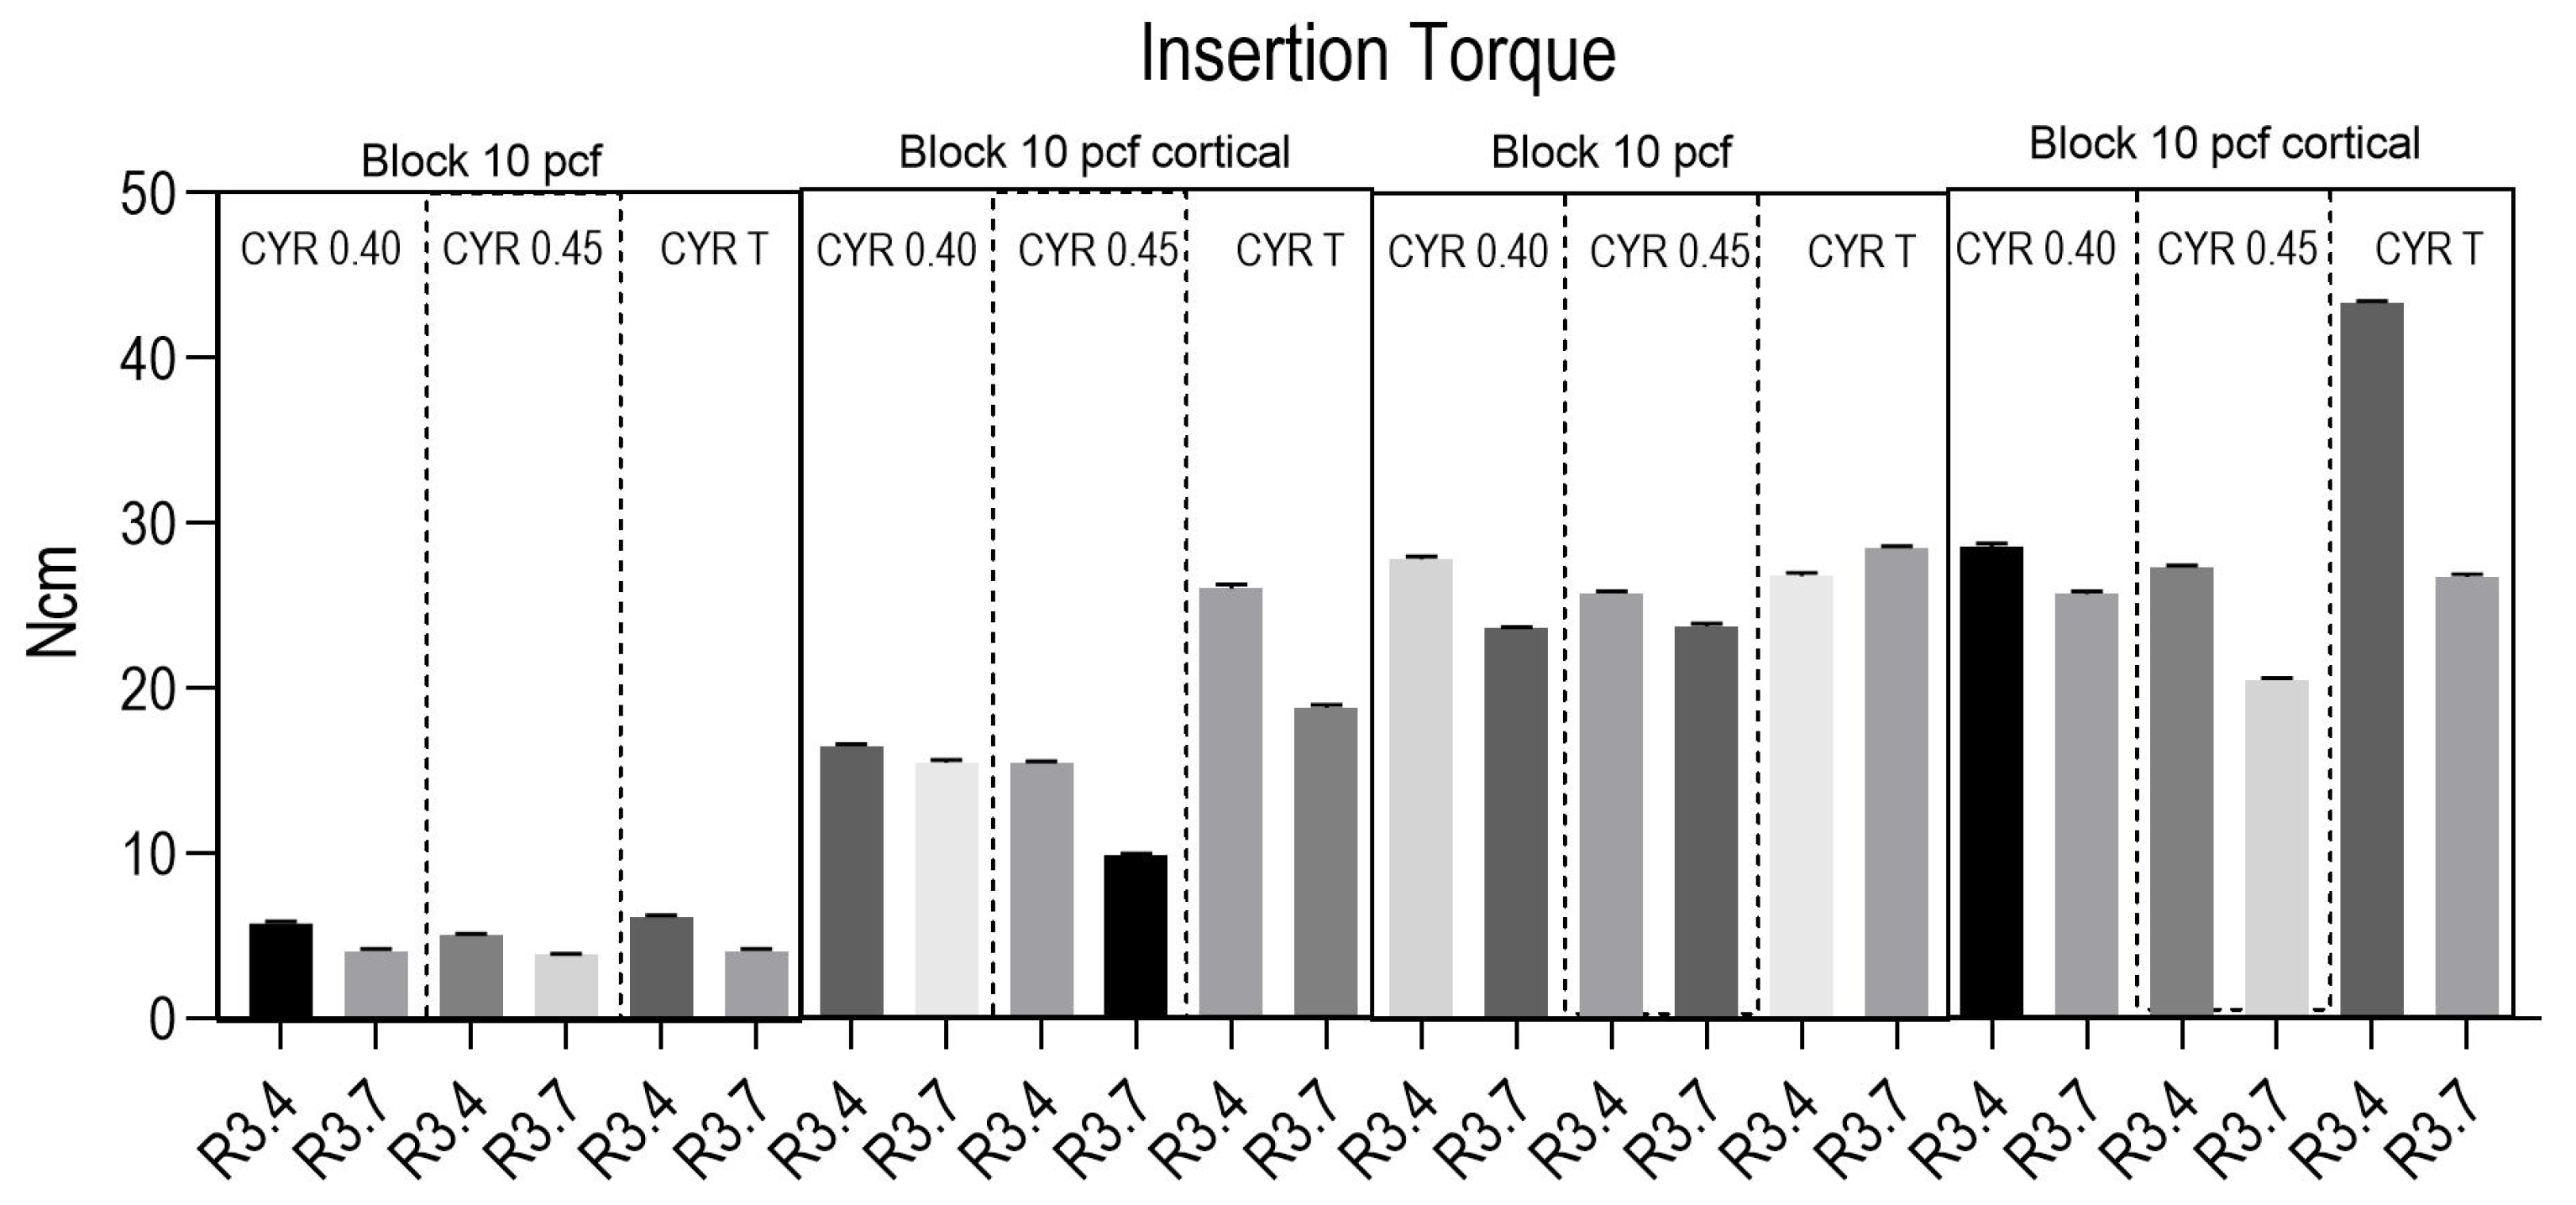
For the ‘10 PCF’ group, the CYROTH 0.40 subgroup with R3.4 had a mean of 5.72 Ncm, a median of 5.7 Ncm, and a standard deviation of 0.155. The 95% confidence interval for the mean ranged from 5.61 to 5.83. In the same group, the CYROTH 0.45 subgroup with R3.7 had a mean of 3.86 Ncm, a median of 3.9 Ncm, and a standard deviation of 0.05.
Moving to the ‘10 PCF CORTICAL’ group, the CYROTH T subgroup with R3.4 had a mean of 6.09 Ncm and a standard deviation of 0.12. The ‘20 PCF’ group showed significantly higher mean values. For CYROTH 0.45 with R3.4, the mean was 25.8 Ncm, with a standard deviation of 0.279. The CYROTH 0.40 subgroup with R3.7 had a mean of 15.3 Ncm and a standard deviation of 0.16.
Lastly, the ‘20 PCF CORTICAL’ group presented some of the highest values. For the CYROTH T subgroup with R3.4, the mean was 28.6 Ncm, with a standard deviation of 0.212; the median for this subgroup was also 28.6 Ncm. Additionally, the CYROTH T subgroup with R3.7 had a mean of 26.7 Ncm, a median of 26.8 Ncm, and a standard deviation of 0.177. The 95% confidence interval for the mean of this subgroup ranged from 26.6 to 26.9 (Figure 3 and Table 1).

3.2. RT Values

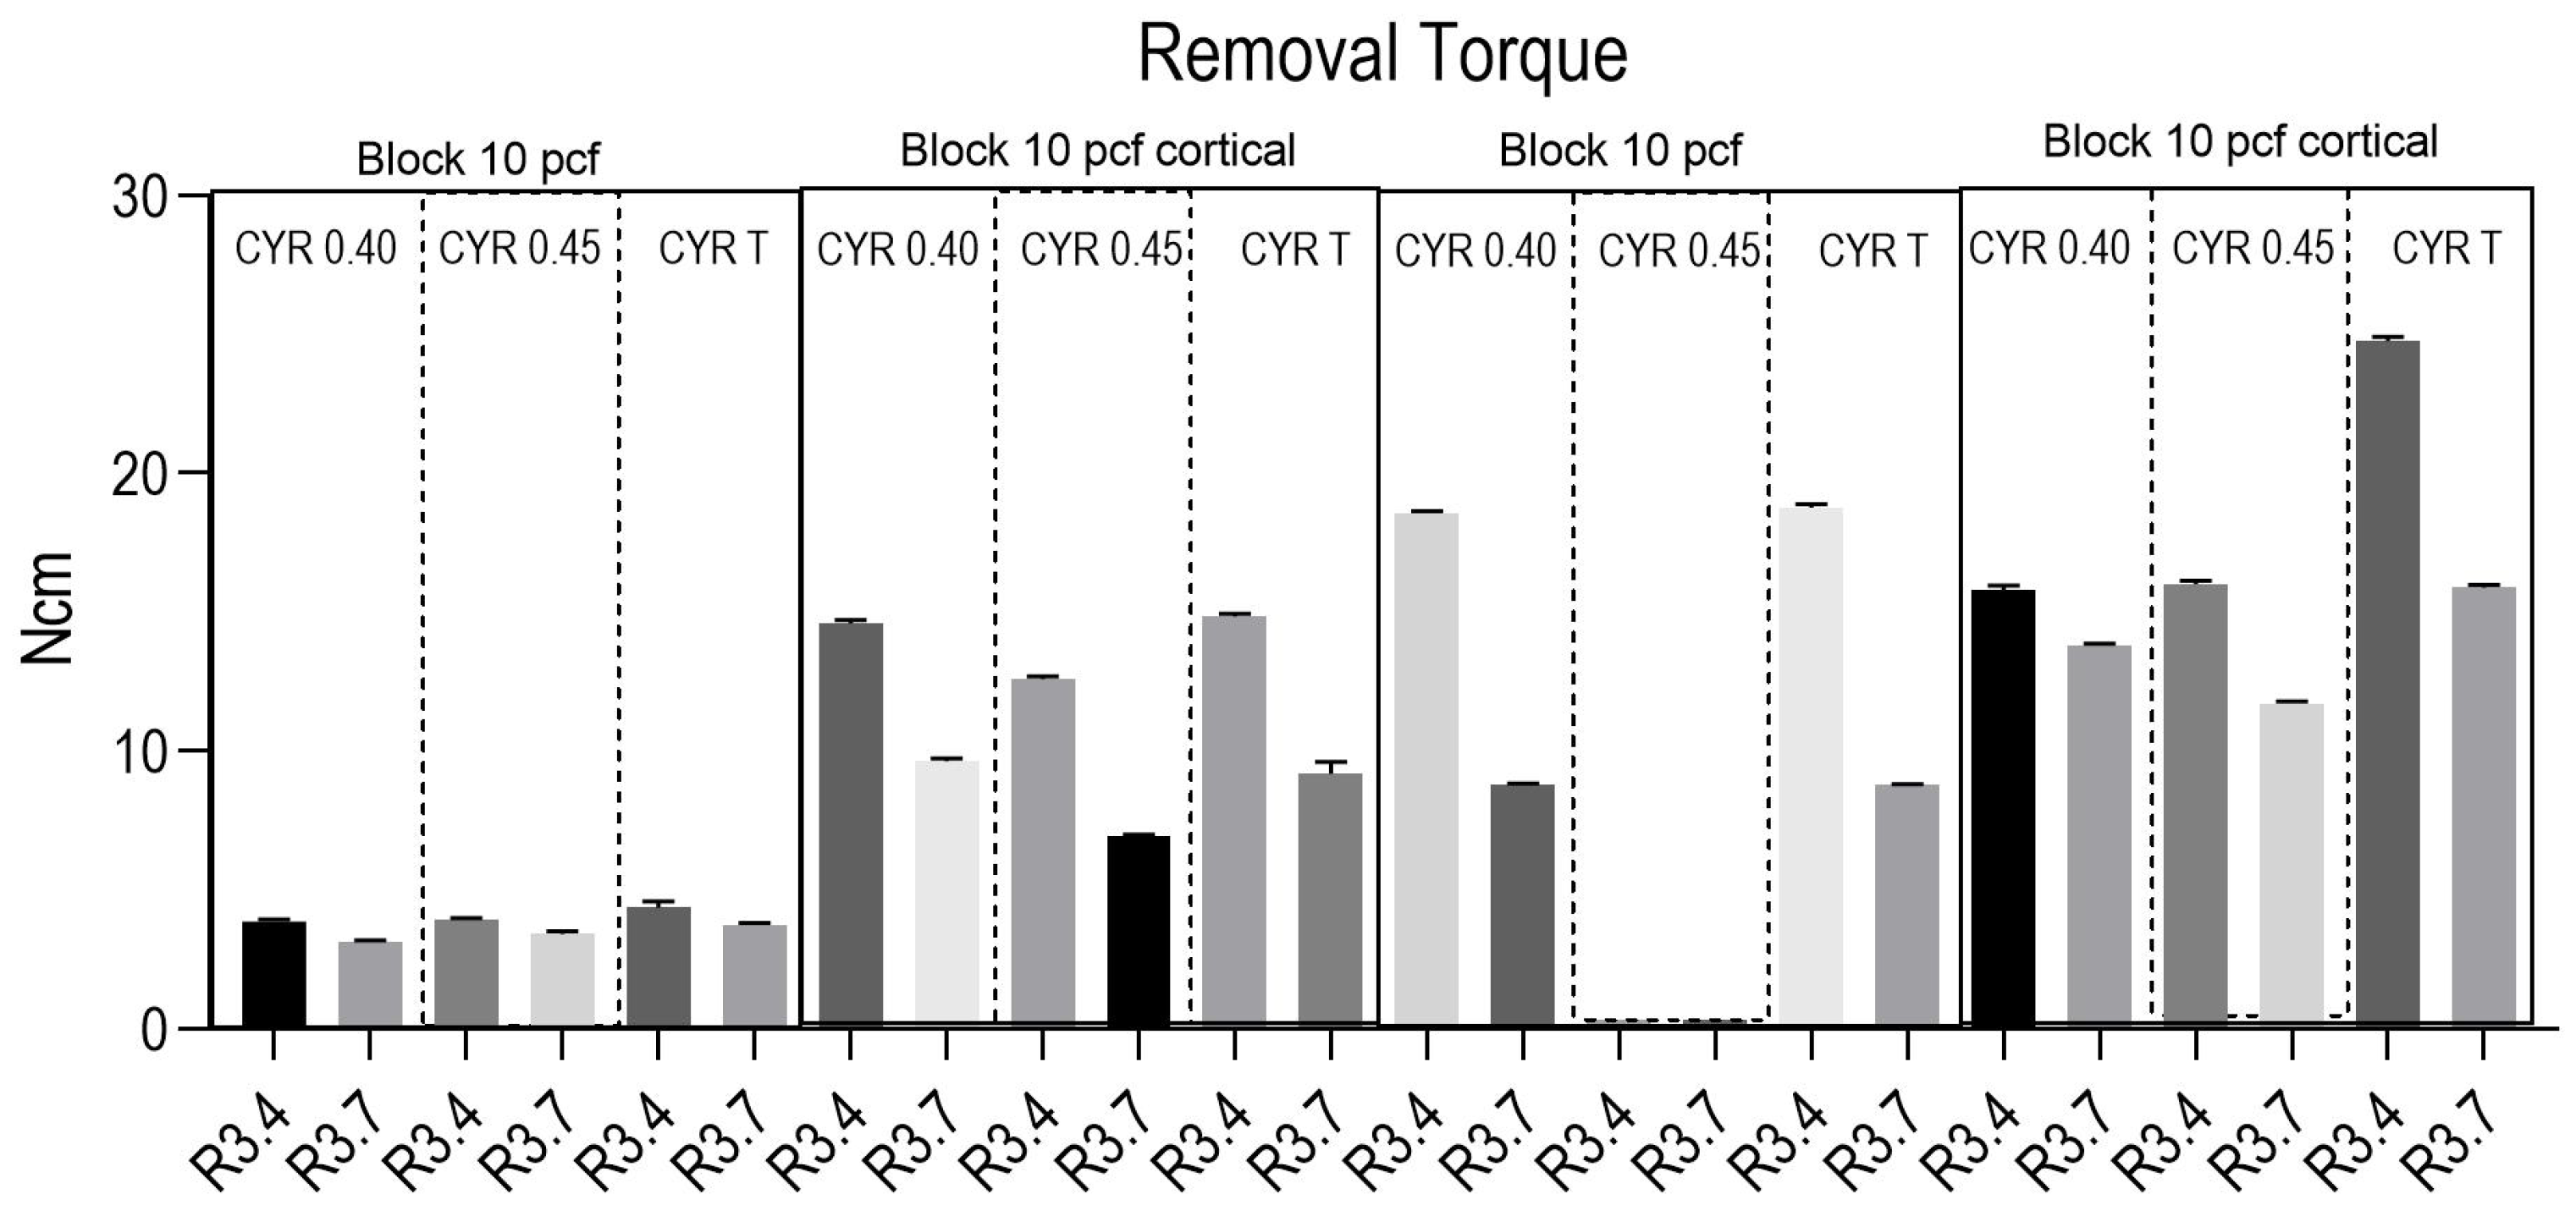
Table 2 provides a descriptive statistical summary for four main groups: ‘10 PCF’, ‘10 PCF CORTICAL’, ‘20 PCF’, and ‘20 PCF CORTICAL’. Each group is further divided into subgroups based on CYROTH values (0.40, 0.45, and T) and R values (3.4 and 3.7). The statistics include the mean, median, standard deviation, and the 95% confidence intervals for the mean.
Notably, the descriptive statistics for the ‘10 PCF’, ‘20 PCF’, and ‘20 PCF CORTICAL’ groups are identical. For instance, in the CYROTH 0.40 subgroup with R3.4, the mean is 3.87 Ncm, the median is 3.90 Ncm, and the standard deviation is 0.0675 across all three groups. The 95% confidence interval for the mean ranged from 3.82 to 3.92. A similar pattern was observed in the CYROTH T subgroup with R3.4, with a mean of 3.94 Ncm, a median of 3.90 Ncm, and a standard deviation of 0.0516. In contrast, the ‘10 PCF CORTICAL’ group showed different statistical values for nearly all subgroups. For the CYROTH 0.40 subgroup with R3.4, the mean was 14.6 Ncm, the median was 14.6 Ncm, and the standard deviation was 0.120. The 95% confidence interval for this mean was 14.5–14.7. Additionally, for the CYROTH 0.45 subgroup with R3.4, the mean was 12.6 Ncm, the median was 12.6 Ncm, and the standard deviation was 0.0816. Another significant difference was evident in the CYROTH 0.40 subgroup with R3.7, which had a mean of 9.63 Ncm, a median of 9.60 Ncm, and a standard deviation of 0.116 (Figure 4).

3.3. RFA Values

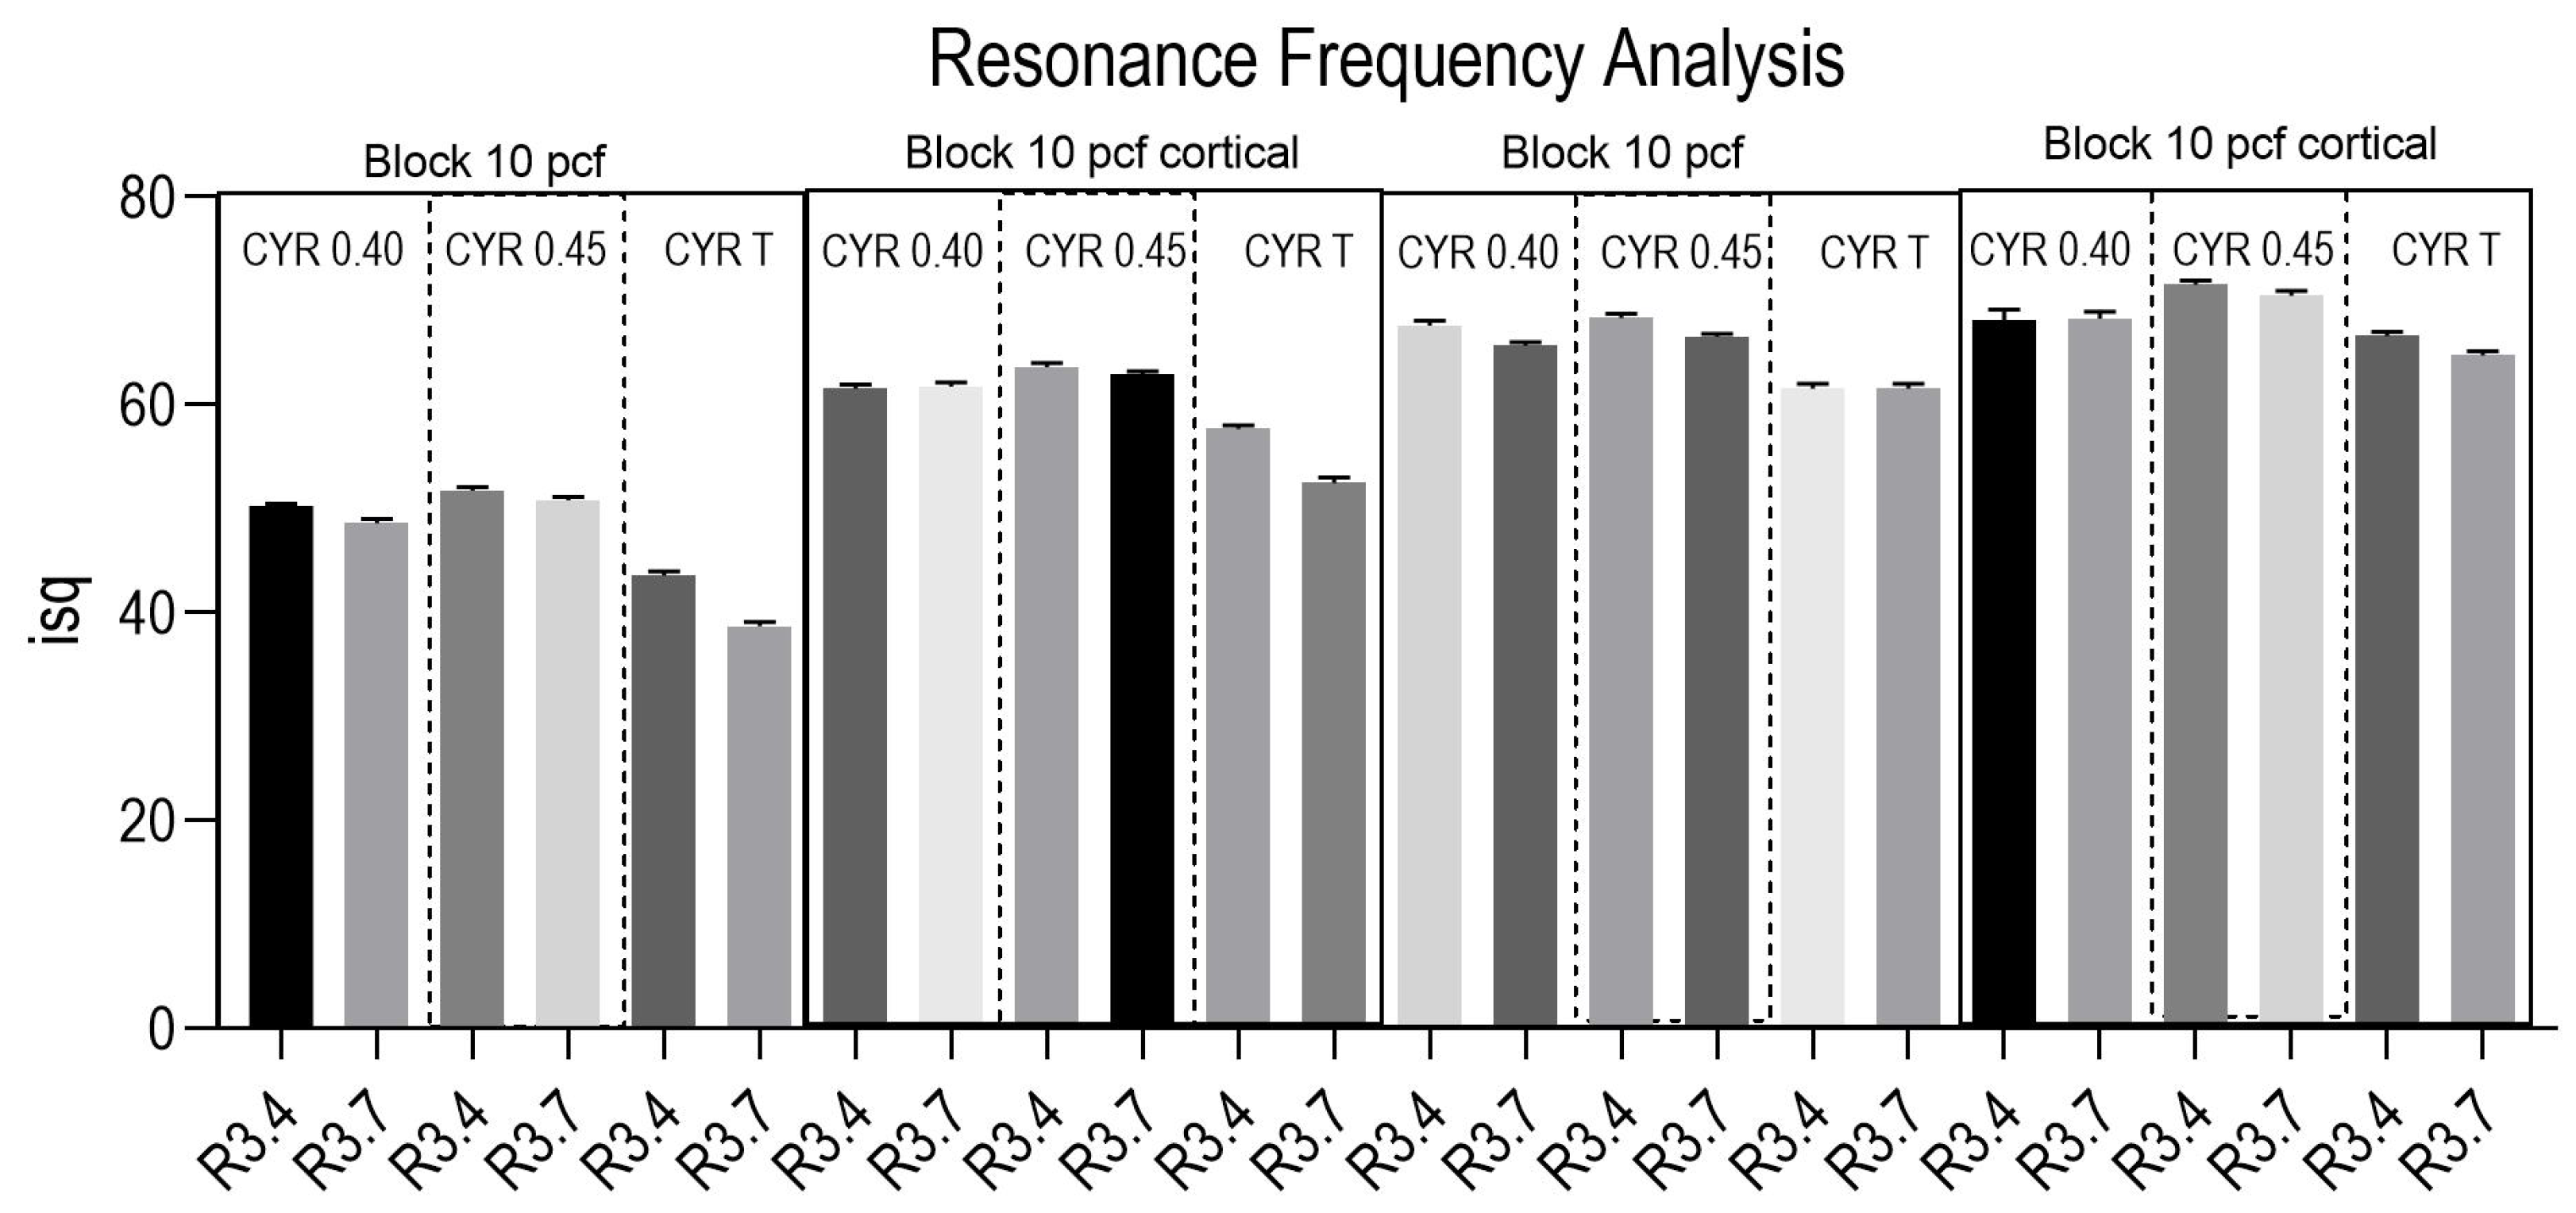
Table 3 includes descriptive statistics for various groups defined by PCF values, cortical status, CYROTH values, and R values. The data illustrate a clear trend of increasing mean and median values as the PCF increases and among different CORTICAL groups. The lowest observed mean value is 38.7 implant stability quotient (ISQ), found in the 10 PCF/CYROTH 0.45/R3.7 group, while the highest mean value is 71.5 ISQ, associated with the 20 PCF CORTICAL/CYROTH T/R3.4 group. For instance, the mean for the 10 PCF/CYROTH 0.40/R3.4 group is 50.2 ISQ, while for the 20 PCF/CYROTH 0.40/R3.4 group, it is 67.6 ISQ.
The data dispersion, measured by the standard deviation, was generally very low, with most values being less than 1. The standard deviation ranged from a minimum of 0.258 to a maximum of 0.994, indicating that the data was tightly clustered around the mean for all subgroups. This was further validated by the percentiles, which showed close proximity; for the 10 PCF/CYROTH 0.40/R3.4 group, the 25th percentile was 50.0, the median was 50.0 ISQ, and the 75th percentile was 50.5. Consequently, the 95% confidence intervals for the mean were very narrow; for instance, the interval for a mean of 50.2 was 50.0–50.4. This narrow range emphasized the precision of the estimates and the low variability in the data (Figure 5).

3.4. Pairwise Comparison

The 30 rpm speed appeared suitable for achieving optimal fixation parameters in all scenarios. The 0.45 mm thread significantly reduced the IT compared to both the 0.40 mm thread and the standard 0.35 mm pitch. However, it also markedly increased the ISQ values, reaching a maximum of 72/72 in the 20 PCF + CORTICAL consistency with the 3.4 mm milling, which is six points higher than the standard. Across all other consistencies, the ISQ values for the 0.45 mm thread were higher by 2 to 6 points (p < 0.05). In the 10 PCF consistency block, results similar to those in the 20 PCF block were observed, albeit with lower proportional values. The maximum IT was recorded in the 20 PCF block with the cortical layer, yielding the best result with the standard 0.35 mm thread and a 3.4 mm drill (43.1 Ncm). The lowest IT in the 20 PCF + CORTICAL block was found with the 0.45 mm thread and a 3.7 mm drill (20.6 Ncm). Generally, the lowest IT values occurred in the 10 PCF block without cortical bone when using a 3.7 mm drill with the 0.45 mm thread (3.8 Ncm) (p < 0.05). A progressive increase in IT is typically noted, starting from the 10 PCF block without cortical bone using the 3.4 mm drill (in comparison to the 3.7 mm drill). This trend continued with improvements in the 10 PCF + CORTICAL block using the 3.4 mm drill. It then rose again in the 20 PCF block and reached its maximum levels in the 20 PCF + CORTICAL block, as previously mentioned. The IT was consistently greater for the same thread or polyurethane consistency with the 3.4 mm drilling, indicating the importance of appropriate site preparation.
Additionally, the RT was proportionally lower when transitioning from 3.4 mm drilling to 3.7 mm drilling. The highest RT values were observed for the 20 PCF consistency with cortical bone for the standard 0.35 mm thread using the 3.4 mm drill (24.5 Ncm, p < 0.05). Conversely, the lowest values were recorded for the 10 PCF block with the 0.40 mm and 0.45 mm threads (3–3.2 Ncm) using the 3.7 mm drill. In the 10 PCF block without cortical bone, the values were significantly lower compared to those with cortical bone and were relatively poor (3–4.5 Ncm, p < 0.05). Overall, a progressive increase in RT was noted when moving from the 10 PCF block without cortical bone to the one with cortical bone, for both for the 3.4 mm and, to a slightly lesser extent, the 3.7 mm drilling. The RT values increased with the 20 PCF consistency without cortical bone and reached their maximum with the 20 PCF consistency with cortical bone (24.5 Ncm, p < 0.05). The RT results were consistently lower with the 3.7 mm drill compared to the 3.4 mm drill, regardless of the consistency.
Regarding RFA, the maximum ISQ values were achieved in the 20 PCF block with cortical (p < 0.05). The best ISQ value was obtained with the 0.45 mm thread, reaching a score of 72/72 when using the 3.4 mm drill. The lowest score was from the 10 PCF block without cortical bone for the standard 0.35 mm thread using the 3.7 mm drill (38/38, p < 0.05). Generally, the ISQ values measured were lower for 3.7 mm drilling compared to 3.4 mm across all polyurethane consistencies. The values showed a progressively increasing trend from the standard thread to the 0.40 mm and 0.45 mm threads (p < 0.05). Consistently, the 0.45 mm thread achieved higher values than the others under the same drilling diameter (p < 0.05). There was a noted progressive increase in ISQ, starting from the lowest value in the 10 PCF block without cortical bone using the 3.7 mm drill (p < 0.05), which slightly improved with the 3.4 mm drill. This trend continued with an increase in polyurethane consistency (20 PCF) without cortical bone, eventually reaching the maximum values in the 20 PCF consistency with cortical bone (72/72 for the 0.45 mm thread, p < 0.05). The standard 0.35 mm thread consistently yielded lower results under every condition of consistency and drilling diameter (p < 0.05).

4. Discussion

The tapered-cylindrical macro-geometric design of all tested implants contributes to their stabilization. The progressive insertion into the polyurethane allows for maximum IT and ISQ values to be reached near the implant platform. Variations in thread protrusion alter the biomechanical characteristics, highlighting a poor correlation between the trends of IT and ISQ.
Specifically, the standard 0.35 mm threads caused a significant increase in IT, while the 0.40 mm and, in particular, the 0.45 mm threads promoted an increase in ISQ. These two parameters often show an inverse proportional relationship. The 0.45 mm thread pitch appeared to optimize ISQ at the expense of IT (which remains high in high-density polyurethanes). Conversely, the traditional 0.35 mm thread pitch seemed to favor IT at the expense of ISQ. This data suggests that thread protrusion is a key factor in achieving one effect or the other. The 0.45 mm threads, by reducing the core diameter and increasing the protrusion, decreased the bulk and compression of the core within the polyurethane, thus lowering the IT. Simultaneously, the increased surface area of the thread in contact with the polyurethane elevates the ISQ. Conversely, the traditional 0.35 mm thread pitch, with a larger core diameter, increased friction and compression of the implant core on the polyurethane, thereby raising the IT. However, this deforms the polyurethane and hinders proper interaction between the threads and the material, leading to lower stability and a decrease in ISQ. In the 10 PCF blocks without cortical bone, the low density of the polyurethane resulted in reduced IT values for all threads. The use of the 3.7 mm drill further negatively impacted the values of all parameters. In general, the absence of cortical bone causes a decrease in IT, RT, and ISQ, underscoring the importance of at least 1 mm of cortical bone for improving these values. This observation confirms that substrate consistency is a critical factor and is consistent with the results of previous studies. A limitation of this study is the difference in length between the implant groups, with the standard Cyroth T fixtures measuring compared to the length of the Cyroth 0.40 and 0.45 implants. This dimensional discrepancy may introduce a confounding variable, as implant surface area is directly proportional to length, potentially affecting the overall measured primary stability values (IT, RT, and ISQ)
Under-preparation of the site (0.3 mm with a 3.7 mm drill and 0.6 mm with a 3.4 mm drill) significantly influences the parameters studied. Specifically, the 0.3 mm under-preparation highlights the importance of thread protrusion (0.35 mm–0.40 mm–0.45 mm) for stabilization and anchorage. With a 0.6 mm under-preparation (from the 3.4 mm drill), the stabilization provided by the wider core (thread with 0.35 mm protrusion) becomes more important, leading to an increase in IT but a reduction in ISQ. The rotation speed of 30 rpm also proved to be a crucial parameter. Maintaining a low speed prevents the hole from becoming oval and optimizes the implant–polyurethane contact. This approach, combined with a single drilling pass, was chosen based on previous studies that demonstrated superior results with fewer drilling passes and lower revolutions. Clinically, this is highly relevant for immediate loading procedures, as better initial implant stability is fundamental for prosthetic rehabilitation. A significant clinical finding is that the 0.45 mm threads maintain high ISQ values (above 50) in all conditions, unlike the other threads that can reach insufficient values (38–39) in low-density bone conditions (10 PCF without cortical bone). The absence of cooling fluids in the in vitro tests might have influenced the parameters due to the lack of site cleansing and irrigation during drilling. However, careful cleaning of the sites to remove debris mitigated this effect, following the principles of the ROP technique to maximize implant-to-polyurethane contact with minimal interference from debris at the interface.
In vitro tests on polyurethane blocks are a fundamental and widely used tool in dental implantology research [17,18]. These blocks, made from standardized composite materials, come in various densities that accurately mimic the different bone qualities (D1, D2, D3, D4) a surgeon might encounter in clinical practice [17,18]. The use of this “artificial bone” offers a controlled and repeatable testing environment, eliminating the complex biological and anatomical variables that characterize human bone tissue [19]. Thanks to this standardization, researchers can conduct reliable comparative studies to evaluate the effectiveness of different implant designs and surgical protocols [20]. The parameters measured in these tests are crucial for understanding the implant’s primary stability, which is its initial resistance to micromovement immediately after insertion [21].
Studies conducted on these models have highlighted the critical importance of implant macrogeometry and the drilling protocol [22]. It has been shown, for example, that a slight under-preparation of the implant site—using a drill with a slightly smaller diameter than the implant—can significantly increase the IT and ISQ, thereby improving initial stability [19]. In summary, tests on polyurethane blocks offer a robust scientific method for validating innovation in the field of dental implants, providing objective data that guides both the research and development of new products and the clinical decisions of professionals [23]. The morphology of implant threads plays a crucial and direct role in determining the primary stability of a dental implant, which is its initial resistance to micromovement immediately after insertion [24]. This parameter is fundamental for the long-term success of osseointegration. Primary stability is the result of the mechanical interaction between the implant surface and the surrounding bone, and the thread design is the element that most influences this interaction [25]. The design of a thread can vary in several aspects, each of which contributes specifically to stability: thread depth and width, pitch and geometry. Deeper and wider threads tend to increase the implant’s contact surface with the bone. This is particularly advantageous in cases of low-density bone (type D3 and D4) [6,26], where the sponginess of the bone does not offer a strong grip. Aggressive threads in these conditions act like an anchor, improving mechanical retention and reducing the risk of early failure. Conversely, in dense bone (types D1 and D2), less aggressive threads are preferable to avoid excessive bone compression that could lead to resorption [27]. The pitch, which is the distance between threads, influences the amount of bone compacted during insertion [6,26]. A wider pitch is often associated with better cutting ability and increased stability in poor-quality bone [28]. In contrast, a reduced pitch may be more suitable for dense bone, ensuring a more uniform distribution of forces. The profile can be aggressive or non-aggressive [6,26]. Threads with an aggressive profile are ideal for less compact bone and for post-extraction procedures, where the available bone is limited. These designs allow the implant to “self-tap” its way, improving anchorage. Instead, less aggressive profiles are more suitable for dense cortical bone, where their main function is to ensure an optimal bone–implant interface without generating excessive stress [6,26].
The main clinical relevance of this study is that in conditions of poor bone density, it is advisable to use an implant with a greater thread protrusion (0.45 mm) to maximize the surface contact and ensure stability. To manage excessive IT, which should always be avoided, it is preferable to adjust the under-preparation of the site rather than the thread protrusion. In practice, it is more advantageous to always use a protruding thread like the 0.45 mm and adjust the under-preparation at low speeds, rather than reducing thread protrusion and risking excessive compression and a detrimental increase in IT.

5. Conclusions

This study demonstrated that implant thread pitch and drilling technique are critical factors influencing primary stability. Specifically, a more aggressive under-preparation drill consistently resulted in higher Insertion Torque (IT), Removal Torque (RT), and Implant Stability Quotient (ISQ) values across all bone densities when compared to standard drill. Utilizing a wider thread pitch (0.45 mm) along with an under-preparation drilling protocol can significantly improve implant stability, even in low-density bone, without the need for excessive IT. These findings suggest that selecting the appropriate implant macrogeometry and surgical technique can optimize the primary stability of dental implants.

Author Contributions

Conceptualization, A.P.; methodology, A.P., L.C. and M.T.; software, M.T.; validation, A.P.; formal analysis, A.P. and M.T.; investigation, A.P., N.D.P., T.R., L.C. and M.T.; writing—original draft preparation, A.P., M.T. and L.C.; writing—review and editing, A.P., M.T. and L.C. All authors have read and agreed to the published version of the manuscript.

Funding

This research received no external funding.

Institutional Review Board Statement

Not applicable.

Informed Consent Statement

Not applicable.

Data Availability Statement

All experimental data to support the findings of this study are available upon request to the corresponding author.

Conflicts of Interest

The authors declare no conflicts of interest.

References

  1. Anitua, E.; Alkhraisat, M.H.; Piñas, L.; Orive, G. Efficacy of Biologically Guided Implant Site Preparation to Obtain Adequate Primary Implant Stability. Ann. Anat. Anat. Anz. 2015, 199, 9–15. [Google Scholar] [CrossRef]
  2. Abbou, M. Primary Stability and Osseointegration: Preliminary Clinical Results with a Tapered Diminishing-Thread Implant. Pract. Proced. Aesthetic Dent. 2003, 15, 161–168, quiz 170. [Google Scholar]
  3. Nevins, M.; Nevins, M.L.; Schupbach, P.; Fiorellini, J.; Lin, Z.; Kim, D.M. The Impact of Bone Compression on Bone-to-Implant Contact of an Osseointegrated Implant: A Canine Study. Int. J. Periodontics Restor. Dent. 2012, 32, 637–645. [Google Scholar]
  4. Barberá-Millán, J.; Larrazábal-Morón, C.; Enciso-Ripoll, J.-J.; Pérez-Pevida, E.; Chávarri-Prado, D.; Gómez-Adrián, M.-D. Evaluation of the Primary Stability in Dental Implants Placed in Low Density Bone with a New Drilling Technique, Osseodensification: An in Vitro Study. Med. Oral Patol. Oral Y Cir. Bucal 2021, 26, e361–e367. [Google Scholar] [CrossRef]
  5. Abuhussein, H.; Pagni, G.; Rebaudi, A.; Wang, H.-L. The Effect of Thread Pattern upon Implant Osseointegration. Clin. Oral. Implant. Res. 2010, 21, 129–136. [Google Scholar] [CrossRef] [PubMed]
  6. Benalcázar-Jalkh, E.B.; Nayak, V.V.; Gory, C.; Marquez-Guzman, A.; Bergamo, E.T.; Tovar, N.; Coelho, P.G.; Bonfante, E.A.; Witek, L. Impact of Implant Thread Design on Insertion Torque and Osseointegration: A Preclinical Model. Med. Oral Patol. Oral Y Cirugía Bucal 2023, 28, e48–e55. [Google Scholar] [CrossRef] [PubMed]
  7. Chang, J.Z.-C.; Chen, Y.-J.; Tung, Y.-Y.; Chiang, Y.-Y.; Lai, E.H.-H.; Chen, W.-P.; Lin, C.-P. Effects of Thread Depth, Taper Shape, and Taper Length on the Mechanical Properties of Mini-Implants. Am. J. Orthod. Dentofac. Orthop. 2012, 141, 279–288. [Google Scholar] [CrossRef]
  8. Comuzzi, L.; Tumedei, M.; De Angelis, F.; Lorusso, F.; Piattelli, A.; Iezzi, G. Influence of the Dental Implant Macrogeometry and Threads Design on Primary Stability: An in Vitro Simulation on Artificial Bone Blocks. Comput. Methods Biomech. Biomed. Eng. 2021, 24, 1242–1250. [Google Scholar] [CrossRef] [PubMed]
  9. Amid, R.; Raoofi, S.; Kadkhodazadeh, M.; Movahhedi, M.R.; Khademi, M. Effect of Microthread Design of Dental Implants on Stress and Strain Patterns: A Three-Dimensional Finite Element Analysis. Biomed. Tech./Biomed. Eng. 2013, 58, 457–467. [Google Scholar] [CrossRef]
  10. Bilhan, H.; Geckili, O.; Mumcu, E.; Bozdag, E.; Sünbüloğlu, E.; Kutay, O. Influence of Surgical Technique, Implant Shape and Diameter on the Primary Stability in Cancellous Bone. J. Oral Rehabil. 2010, 37, 900–907. [Google Scholar] [CrossRef]
  11. Irinakis, T.; Wiebe, C. Initial Torque Stability of a New Bone Condensing Dental Implant. A Cohort Study of 140 Consecutively Placed Implants. J. Oral Implant. 2009, 35, 277–282. [Google Scholar] [CrossRef]
  12. Bolind, P.K.; Johansson, C.B.; Becker, W.; Langer, L.; Sevetz, E.B.; Albrektsson, T.O. A Descriptive Study on Retrieved Non-threaded and Threaded Implant Designs. Clin. Oral Implant. Res. 2005, 16, 447–455. [Google Scholar] [CrossRef]
  13. Trisi, P.; Berardini, M.; Falco, A.; Podaliri Vulpiani, M. Validation of Value of Actual Micromotion as a Direct Measure of Implant Micromobility after Healing (Secondary Implant Stability). An in Vivo Histologic and Biomechanical Study. Clin. Oral Implant. Res. 2016, 27, 1423–1430. [Google Scholar] [CrossRef]
  14. Willenegger, H.; Perren, S.M.; Schenk, R. Primary and Secondary Healing of Bone Fractures. Der Chir. Z. Fur Alle Geb. Der Oper. Medizen 1971, 42, 241–252. [Google Scholar]
  15. Schenk, R.K. Histology of Primary Bone Healing. Fortschritte Der Kiefer-Und Gesichts-Chir. 1975, 19, 8–12. [Google Scholar]
  16. Schenk, R.K.; Willenegger, H.R. Histology of Primary Bone Healing: Modifications and Limits of Recovery of Gaps in Relation to Extent of the Defect (Author’s Transl). Unfallheilkunde 1977, 80, 155–160. [Google Scholar] [PubMed]
  17. Comuzzi, L.; Tumedei, M.; Piattelli, A.; Iezzi, G. Short vs. Standard Length Cone Morse Connection Implants: An In Vitro Pilot Study in Low Density Polyurethane Foam. Symmetry 2019, 11, 1349. [Google Scholar] [CrossRef]
  18. Comuzzi, L.; Tumedei, M.; Romasco, T.; Petrini, M.; Afrashtehfar, K.I.; Inchingolo, F.; Piattelli, A.; Di Pietro, N. Insertion Torque, Removal Torque, and Resonance Frequency Analysis Values of Ultrashort, Short, and Standard Dental Implants: An in Vitro Study on Polyurethane Foam Sheets. J. Funct. Biomater. 2022, 14, 10. [Google Scholar] [CrossRef]
  19. Di Stefano, D.A.; Arosio, P.; Gastaldi, G.; Gherlone, E. The Insertion Torque-Depth Curve Integral as a Measure of Implant Primary Stability: An in Vitro Study on Polyurethane Foam Blocks. J. Prosthet. Dent. 2018, 120, 706–714. [Google Scholar] [CrossRef]
  20. ASTM F1839-08; Standard Specification for Rigid Polyurethane Foam for Use as a Standard Material for Testing Orthopedic Devices and Instruments. ASTM: West Conshohcken, PA, USA, 2021.
  21. Attanasio, F.; Antonelli, A.; Brancaccio, Y.; Averta, F.; Figliuzzi, M.M.; Fortunato, L.; Giudice, A. Primary Stability of Three Different Osteotomy Techniques in Medullary Bone: An in Vitro Study. Dent. J. 2020, 8, 21. [Google Scholar] [CrossRef]
  22. Cavallaro, J.; Greenstein, B.; Greenstein, G. Clinical Methodologies for Achieving Primary Dental Implant Stability: The Effects of Alveolar Bone Density. J. Am. Dent. Assoc. (1939) 2009, 140, 1366–1372. [Google Scholar] [CrossRef] [PubMed]
  23. Di Stefano, D.A.; Arosio, P. Correlation Between Bone Density and Instantaneous Torque at Implant Site Preparation: A Validation on Polyurethane Foam Blocks of a Device Assessing Density of Jawbones. Int. J. Oral Maxillofac. Implant. 2016, 31, e128–e135. [Google Scholar] [CrossRef]
  24. Schrotenboer, J.; Tsao, Y.-P.; Kinariwala, V.; Wang, H.-L. Effect of Microthreads and Platform Switching on Crestal Bone Stress Levels: A Finite Element Analysis. J. Periodontol. 2008, 79, 2166–2172. [Google Scholar] [CrossRef]
  25. Al-Sabbagh, M.; Eldomiaty, W.; Khabbaz, Y. Can Osseointegration Be Achieved Without Primary Stability? Dent. Clin. N. Am. 2019, 63, 461–473. [Google Scholar] [CrossRef]
  26. de Carvalho Formiga, M.; Gehrke, A.F.; de Bortoli, J.P.; Gehrke, S.A. Can the Design of the Instruments Used for Undersized Osteotomies Influence the Initial Stability of Implants Installed in Low-Density Bone? An in Vitro Pilot Study. PLoS ONE 2021, 16, e0257985. [Google Scholar] [CrossRef]
  27. Danza, M.; Quaranta, A.; Carinci, F.; Paracchini, L.; Pompa, G.; Vozza, I. Biomechanical evaluation of dental implants in D1 and D4 bone by Finite Element Analysis. Minerva Stomatol. 2010, 59, 305–313. [Google Scholar]
  28. Almasoud, N.N.; Tanneru, N.; Marei, H.F. Alveolar Bone Density and Its Clinical Implication in the Placement of Dental Implants and Orthodontic Mini-Implants. Saudi Med. J. 2016, 37, 684–689. [Google Scholar] [CrossRef] [PubMed]
Figure 1. Summary of the study design and the various testing conditions applied to the three groups of implants threads.
Applsci 15 11245 g001
Figure 2. Implants positioned in different consistencies of polyurethane blocks.
Applsci 15 11245 g002
Figure 3. Chart summary of insertion torque (IT) measured across various polyurethane conditions. All implants were tested using two preparation techniques.
Applsci 15 11245 g003
Figure 4. Chart summary of the removal torque (RT) measured across various polyurethane conditions. All implants were tested using two preparation techniques.
Applsci 15 11245 g004
Figure 5. Chart summary of resonance frequency analysis (RAF) measured in various polyurethane conditions. All implants were tested using two preparation techniques.
Applsci 15 11245 g005
Table 1. Summary of the descriptive statistics regarding the insertion torque (IT) of the entire study group. CI: confidence interval.
10 PCF10 PCF CORTICAL20 PCF20 PCF CORTICAL
CYROTH 0.40CYROTH 0.45CYROTH TCYROTH 0.40CYROTH 0.45CYROTH TCYROTH 0.40CYROTH 0.45CYROTH TCYROTH 0.40CYROTH 0.45CYROTH T
R3.4R3.7R3.4R3.7R3.4R3.7R3.4R3.7R3.4R3.7R3.4R3.7R3.4R3.7R3.4R3.7R3.4R3.7R3.4R3.7R3.4R3.7R3.4R3.7
25% Percentile5.583.94.93.85.983.9816.415.315.49.825.818.727.723.525.623.626.628.428.425.527.220.443.226.6
Median5.74.0553.96.14.116.515.515.59.92618.827.923.625.823.826.828.528.625.827.420.543.326.8
75% Percentile5.94.25.13.96.24.216.615.615.61026.3192823.725.823.82728.628.825.827.420.643.426.9
Mean5.724.055.013.866.094.0816.515.515.59.912618.827.823.625.723.726.828.528.625.727.320.543.326.7
Std. Deviation0.1550.1270.080.050.120.120.130.160.120.090.2790.160.160.080.130.160.210.130.2120.1630.1060.1160.1490.177
Std. Error of the Mean0.040.040.020.020.030.030.040.050.040.030.090.050.050.030.040.050.0680.040.060.050.030.030.04710.0559
Lower 95% CI of the mean5.613.964.953.8263.9916.415.415.49.8525.818.727.723.525.623.626.628.428.425.627.320.443.226.6
Upper 95% CI of the mean5.834.145.073.96.184.1716.615.615.59.9726.218.927.923.725.823.826.928.628.725.827.420.643.426.9
Table 2. Summary of the descriptive statistics regarding the removal torque (RT) of the entire study group.
10 PCF10 PCF CORTICAL20 PCF20 PCF CORTICAL
CYROTH 0.40CYROTH 0.45CYROTH TCYROTH 0.40CYROTH 0.45CYROTH TCYROTH 0.40CYROTH 0.45CYROTH TCYROTH 0.40CYROTH 0.45CYROTH T
R3.4R3.7R3.4R3.7R3.4R3.7R3.4R3.7R3.4R3.7R3.4R3.7R3.4R3.7R3.4R3.7R3.4R3.7R3.4R3.7R3.4R3.7R3.4R3.7
25% Percentile3.803.003.903.384.303.6814.59.5012.53.803.003.903.384.303.6814.59.5012.53.803.003.903.384.303.68
Median3.903.103.903.454.453.8014.69.6012.63.903.103.903.454.453.8014.69.6012.63.903.103.903.454.453.80
75% Percentile3.903.204.003.504.503.8014.79.7312.73.903.204.003.504.503.8014.79.7312.73.903.204.003.504.503.80
Mean3.873.113.943.424.363.7414.69.6312.63.873.113.943.424.363.7414.69.6312.63.873.113.943.424.363.74
Std. Deviation0.06750.08760.05160.1030.2220.08430.1200.1160.08160.06750.08760.05160.1030.2220.08430.1200.1160.08160.06750.08760.05160.1030.2220.0843
Std. Error of the Mean0.02130.02770.01630.03270.07020.02670.03790.03670.02580.02130.02770.01630.03270.07020.02670.03790.03670.02580.02130.02770.01630.03270.07020.0267
Lower 95% CI of the mean3.823.053.903.354.203.6814.59.5512.53.823.053.903.354.203.6814.59.5512.53.823.053.903.354.203.68
Upper 95% CI of the mean3.923.173.983.494.523.8014.79.7112.73.923.173.983.494.523.8014.79.7112.73.923.173.983.494.523.80
Table 3. Summary of the descriptive statistics regarding the resonance frequency analysis (RFA) across the entire study group.
10 PCF10 PCF CORTICAL20 PCF20 PCF CORTICAL
CYROTH 0.40CYROTH 0.45CYROTH TCYROTH 0.40CYROTH 0.45CYROTH TCYROTH 0.40CYROTH 0.45CYROTH TCYROTH 0.40CYROTH 0.45CYROTH T
R3.4R3.7R3.4R3.7R3.4R3.7R3.4R3.7R3.4R3.7R3.4R3.7R3.4R3.7R3.4R3.7R3.4R3.7R3.4R3.7R3.4R3.7R3.4R3.7
25% Percentile50.048.051.550.543.038.461.061.463.062.557.452.067.065.568.066.561.061.067.367.971.070.066.064.4
Median50.048.551.851.043.538.861.562.063.563.057.552.367.865.568.066.561.561.568.368.571.570.566.565.0
75% Percentile50.549.052.051.044.039.062.062.064.063.058.053.068.066.068.666.562.062.069.068.672.071.067.065.0
Mean50.248.651.750.843.538.761.561.763.662.857.652.567.665.768.366.561.561.568.168.371.570.566.664.7
Std. Deviation0.2580.4380.3500.3540.4080.4120.4080.4220.4380.3500.3940.4970.4970.3370.4220.2360.4710.4710.9940.6350.4080.4380.4380.422
Std. Error of Mean0.08160.1380.1110.1120.1290.1300.1290.1330.1380.1110.1250.1570.1570.1070.1330.07450.1490.1490.3140.2010.1290.1380.1380.133
Lower 95% CI of mean50.048.251.450.543.238.461.261.463.262.557.352.167.265.468.066.361.261.267.467.871.270.166.264.4
Upper 95% CI of mean50.448.952.051.043.838.961.862.063.963.157.952.867.965.968.666.761.861.868.868.771.870.866.965.0
Disclaimer/Publisher’s Note: The statements, opinions and data contained in all publications are solely those of the individual author(s) and contributor(s) and not of MDPI and/or the editor(s). MDPI and/or the editor(s) disclaim responsibility for any injury to people or property resulting from any ideas, methods, instructions or products referred to in the content.